Abstract
Lightweight, layered wood-based panels are gaining attention due to favorable mechanical and physical properties. This study examined numerical modeling as a method to predict the strength of innovative three-layer sandwich panels with thermoplastic cores containing wood particles as the filler. Two core geometries (F and S) and two material formulations (60% HDPE + 40% sawdust, and 40% HDPE + 60% sawdust) were tested. The panels were produced without additional adhesives; bonding with high-density fiberboard (HDF) facings was achieved through the thermoplastic properties of the core. Mechanical properties such as bending strength (MOR), modulus of elasticity (MOE), and compressive strength perpendicular to the surface were measured. Results showed that both core geometry and material composition significantly influenced structural performance. Panels with the F profile showed better bending strength and stiffness (MOR—13.2 N/mm2, MOE—2017 N/mm2), while the S profile had higher compressive strength (0.62 N/mm2). Numerical simulations using SolidWorks Simulation confirmed the experimental data, with stress and displacement distributions matching laboratory results. These findings demonstrate the potential of thermoplastically formed cores for creating lightweight, recyclable wood-based composites with tailored mechanical properties.
1. Introduction
Structural, wood-based layered composites represent a dynamically developing type of construction materials. Due to their advantages—such as low weight, high stiffness, good strength, and insulation properties—they are used in many fields, including building construction, aviation, boatbuilding, door joinery, and furniture production [1,2].
Wood-based layered composites are generally composed of a core layer (referred to as the core) covered on both sides with veneer layers, wood-based materials (such as hardboard, HDF, plywood, thin particleboard, or WPC panels), or non-wood materials [3,4,5,6,7,8,9,10,11].
Depending on the material used in the core layer, structural layered composites also include solid blockboard panels filled with cork, balsa wood, poplar wood, porous fiberboard, or other low-density materials, including non-wood alternatives [12,13,14,15,16,17,18,19].
In the case of hollow (cellular) blockboard panels, the core layer is made of elements arranged with spaces in between, leaving empty cavities. The shape of these cavities can vary and is usually tailored to specific applications. These layers may take the form of profiled continuous structures [20,21,22,23,24,25,26] or discontinuous lattice structures [27,28,29].
Currently, the most commonly used core material in cellular panels is paper filler with a characteristic structure known as “honeycomb” [21]. Besides this solution, there are many other types of fillers available on the market, which allow for the production of cellular panels with targeted properties:
- DendroLight® (Ventspils, Latvija)—a panel with a core layer made of prefabricated and glued strips of pine, spruce, or aspen wood. The core preparation process reduces its weight by 40% while minimizing internal stresses [30].
- Aerowood® (St. Marienkirchen an der Polsenz, Austria)—a panel with a core layer made of circumferentially peeled veneer in a wavy form. Approximately 1.4 m3 of Aerowood core can be produced from 1 m3 of veneer [31].
- Lisocore® (Bad Aibling, Germany)—a panel with a core composed of a pressed, double-curved, three-dimensional structure glued into specially milled face layers [32].
- CONBOU (Weimar, Germany)—ConBou Produkt Design und Entwicklung Wasilij Grod—a panel with a core layer made from fragments of lignified bamboo shoots [33].
- TermHex (Halle, Germany)—the core of this cellular panel is made of thermoplastic materials (e.g., polypropylene, polyethylene terephthalate, polyvinyl chloride, acrylonitrile-butadiene-styrene copolymer, polystyrene, polycarbonate, polymethyl methacrylate, polyamide, polyphenylene sulfide, etc.) in a honeycomb structure composed of hexagonal cells of varying height depending on panel thickness. The outer layers of the panel are made of thermoplastics or wood-based materials, aluminum, or steel [34].
The main advantage of cellular panels is the reduction in weight without significantly compromising strength, stiffness, or dimensional stability. These panels also offer structure-specific benefits such as sound and energy absorption, mechanical damping, and recyclability [35]. The density of such panels can be lower than 150 kg/m3. This is due to the fact that the core—the main component of the panel, which can occupy 70%–80% of its volume (depending on panel thickness)—is made from a spatial structure. In the case of paper with a honeycomb structure, the strength of the core element can be increased by using higher grammage paper or reducing the cell size.
A significant limitation in the use of cellular panels in furniture and door joinery is the need for dedicated furniture fittings. Otherwise, the panels must be reinforced internally with frames or inserts to accommodate standard hardware and edge banding. A practical solution in this regard may be the production of custom-designed cores with strictly defined shapes and targeted properties. Both the cores and entire composites can be produced using 3D printing technologies [29,36,37]. Numerical simulations can be used to optimize the shape of the cores [29,36]. The usefulness of computer modeling in research related to cellular panels has also been confirmed by other researchers [38,39].
One limitation of using 3D printing is the requirement for appropriate infrastructure, as well as the constraints on panel size that can be produced. Another approach to manufacturing spatially variable core shapes involves forming composite boards made of wood and plastic (WPC; wood–plastic composite). Their shaping can be individually tailored to the intended application of the component. In this context, it should be noted that until now, core layers of cellular boards manufactured on the basis of thermoplastic composites were available in foamed or geometric structures [34,40].
This study aims to investigate the impacts of thermoplastic content and core shape on the quality of connections with the face layer and the mechanical properties of the composite. This will allow us to assess the possibility of preparing cores with individual shapes adapted to specific requirements of the final products. So far, the possibilities of such activities are limited. These shapes can be initially verified in terms of suitability for a specific application using the finite element method.
2. Materials and Methods
High-density polyethylene (HDPE) (Hostalen GD 7255, Basell Orlen Polyolefins Sp. z o.o., Płock, Poland) was used for the production of the composite panel cores. Industrial softwood sawdust obtained from a sawmill was used as the filler. The sawdust was dried to a moisture content of 5%, then mechanically ground and sieved to obtain particles passing through a 0.49 mm mesh (above 35 mesh). No additional additives commonly used in WPC (e.g., compatibilizers) were applied in the production of the composites.
The panels were produced in two stages:
- 1.
- Production of granulate with the appropriate formulation:
- Variant I: 60% HDPE, 40% sawdust
- Variant II: 40% HDPE, 60% sawdust
The granulate was produced using a Leistritz extruder (Leistritz Extrusionstechnik GmbH, Nürnberg, Germany), with the temperatures in the extruder sections ranging from 170 °C to 180 °C. A continuous strand of composite was obtained and then shredded using a hammer mill.
- 2.
- Production of panels with nominal dimensions of 300 mm × 300 mm × 2.5 mm:
Panels were manufactured using a flat pressing method in a mold, with a single-platen press at a temperature of 200 °C and a maximum unit pressing pressure of 1.25 MPa. The pressure was gradually increased from 0 to 1.25 MPa as the material softened during the pressing process. Pressing time was 6 min, followed by cooling in the mold for an additional 6 min.
The composite panel formulations and the two-stage method for their production have been presented and discussed in previous publications [41,42]. After production, the panels were conditioned for 7 days under laboratory conditions (20 ± 2 °C, 65 ± 5% relative humidity).
To convert the flat panel elements into a three-dimensional structure, a thermoforming process was used.
The panels were heated in a stream of air at 200 °C on a mesh with 2 mm × 2 mm openings. The airflow rate was adjusted so that the panel was suspended above the mesh. The heating time was 5 min. During heating, the panels softened without visible damage and were, subsequently, formed using wooden molds placed in a single-platen press. The pressing pressure was adjusted so that, upon closing the press, the distance between the flat elements of the mold (the die and punch) in the vertical arrangement was 2.5 mm. The pressing (cooling) time in the mold was 5 min.
As a result of thermoforming, two profile types were produced: Profile F (Figure 1) and Profile S (Figure 2).
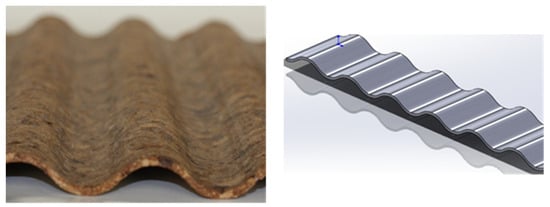
Figure 1.
Profiled element—Profile F.
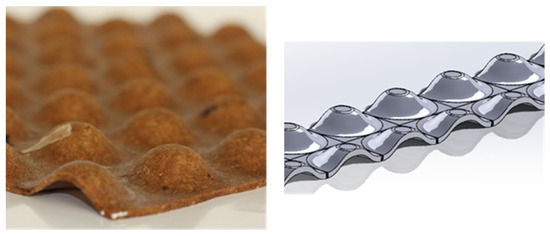
Figure 2.
Profiled element—Profile S.
The thermoformed profiles (Figure 3) served as the core of three-layer cellular panels. The outer layers of the cellular panel were made of HDF boards with a nominal thickness of 2.5 mm. The panels were produced without the use of additional adhesives; the thermoplastic contained in the core acted as the bonding agent.
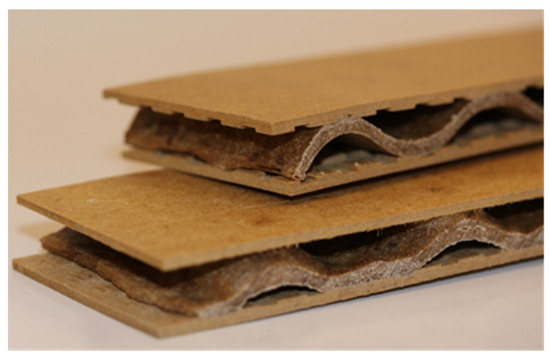
Figure 3.
Three-layer cellular panel with a core layer in the form of Profile F (top) and Profile S (bottom).
To improve the contact surface between the thermoformed profiles and the HDF boards, a grid of grooves was created on one surface of each profile (the one facing the interior of the cellular panel). The grooves were 5 mm wide and 1 mm deep, with a spacing of 10 mm between them.
The panel pressing process followed the procedure below:
- A complete assembly was pressed simultaneously, consisting of two HDF face layers, a core in the form of a thermoformed profiled element (Profile F or Profile S), and two technological aluminum sheets.
- The press was closed so that the upper platen of the press touched the top outer surface of the aluminum sheet without applying pressure.
- Over time, the inner thermoplastic layer heated up via conduction, and the thickness of the assembly gradually decreased.
- The displacement of the press platen was compensated so that it maintained continuous contact with the technological sheets. This was continued until the nominal thickness of the wood-based panel (the cellular panel) was reached, i.e., when the technological sheets rested on the spacer strips.
- Heating was continued for an additional 5 min to relieve potential internal stresses in the panel and ensure thorough heating of the entire thermoplastic core.
- After heating, the entire assembly, along with the spacer strips, was cooled in a cold press to room temperature (approx. 20 °C).
As a result, a permanent bond between the profiled core elements and the HDF boards was achieved for the following cellular panel variants:
- I_F: Variant I (60% HDPE + 40% sawdust)—Profile F
- I_S: Variant I (60% HDPE + 40% sawdust)—Profile S
- II_S: Variant II (40% HDPE + 60% sawdust)—Profile S
In the case of Variant II_F (40% HDPE + 60% sawdust—Profile F), the connection between the profiled element and the HDF boards was not permanent and failed after removal from the press. Factors contributing to this behavior may include:
- Elastic “spring-back” deformation of the profiled elements;
- Localized thickness reduction due to deformation during molding.
The following properties were tested for the manufactured three-layer cellular panels:
- Density, in accordance with EN 323:1999 [43];
- Modulus of Rupture (MOR) and Modulus of Elasticity (MOE) in static bending, in accordance with EN 310:1994 [44]. Mechanical tests were performed using a custom-made universal testing machine built by the Research & Development Center for Wood-Based Panels Sp. z o.o. in Czarna Woda, Poland;
- Compressive strength perpendicular to the panel surfaces.
Ten specimens were used for each panel variant to conduct the tests listed above. Statistical analysis of the results was carried out using Statistica, version 13 (TIBCO Software Inc., Palo Alto, CA, USA). Analysis of variance (ANOVA) was applied (α = 0.05) to determine statistically significant differences between the factors. Mean values were compared using Tukey’s test at a significance level of α = 0.05.
In the next stage, a numerical analysis of the laboratory-produced cellular panel variants was performed. The analysis was conducted using SolidWorks Simulation 2020 (Dassault Systèmes SolidWorks Corporation, Waltham, MA, USA).
As part of the analysis, two CAD model variants of three-layer composites were prepared. Each model consisted of the following:
- A flat HDF board, forming the outer layers of the composite, with a nominal thickness of 2.5 mm,
- A thermoformed panel made from wood and plastic particles, forming the core layer of the composite, with a nominal thickness of 7.0 mm, produced in two spatial geometries of the core layer (Figure 3 and Figure 4).
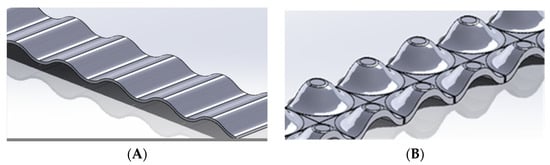 Figure 4. Diagram of the profiled element, (A)—Profile F, (B)—Profile S.
The layers were interconnected through local contact between the materials at their points of contact. The physical and mechanical data for the individual composite layers were taken from previously conducted laboratory tests, which included determining the basic physical and mechanical parameters of the HDF panel and the thermoformed panel, as well as from the material database. The main material parameters were set as follows:
- Elastic modulus (E) = 5.3 GPa for the HDF panel, 1.9 GPa for the thermoformed core layer,
- Poisson’s ratio (µ) = 0.3,
- Shear modulus (G) = 5.0 MPa,
- Mass density (ρ) = 890 kg/m3 for the HDF panel, 1025 kg/m3 for the thermoformed core layer,
- Yield strength (σ) = 57.6 MPa for the HDF panel, 24.4 MPa for the thermoformed core layer.
The laminated composite was simplified as an isotropic material following the methods described by Dounar [45,46] and Peng [47]. Corresponding calculations were performed using Hooke’s law to evaluate the effect of internal structural changes on stress. The model prepared for the numerical analysis referred to the actual static scheme used to determine the bending strength and modulus of elasticity in bending of wood-based materials [44]. To replicate the experimental setup of the three-point bending test, appropriate boundary conditions were implemented in the finite element model. The beam specimen was simply supported at two points near its ends. One support was modeled as a roller, restricting vertical displacement while allowing horizontal movement, whereas the second support was defined as pinned, restraining both vertical and horizontal displacements to prevent rigid body motion. Rotational degrees of freedom were left unrestrained at both supports to accurately simulate realistic support behavior. A vertical load was applied at the mid-span of the beam to replicate the action of the loading nose used in the experimental test. This scheme (Figure 5) included three-point bending, where a concentrated load of 350 N was applied axially at the midpoint of the sample. The sample width was 50 mm, length 340 mm, and height 12 mm. Frictionless contact was assumed between the beam and the supports, in order to simplify the simulation and reflect the minimal friction observed during the physical testing.
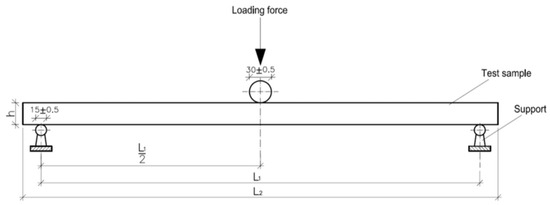
Figure 5.
Model prepared for numerical analysis, where h—total height of the three-layer composite, 12 mm; L1—span between supports, equal to 20 h (240 mm); L2—total length of the sample, 340 mm.
A high-quality mesh was used for the numerical analysis (Figure 6). Details regarding the mesh quality are presented in Table 1.
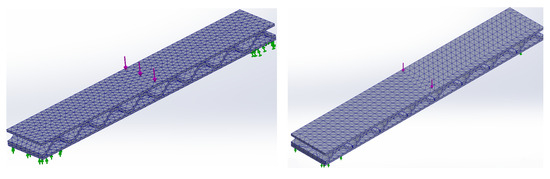
Figure 6.
Solid mesh created for the model in variants F and S.

Table 1.
Mesh properties created for the numerical analysis.
3. Results
The properties of the tested honeycomb panels are presented in Table 2. The manufactured panels exhibited a density range of 435–459 kg/m3 for the filling with profile S and 484 kg/m3 for the filling with profile F. It is worth noting that the panels had a relatively high content of voids (over 60% of the core layer volume), and the obtained density values resulted from the density of the materials used (HDF panels—approximately 900 kg/m3 and composite panels—approximately 1100 kg/m3). It is important to highlight that both the shape of the filling profile (S and F) and the composition of the core (I and II) significantly influenced the density values in a statistically significant way, leading to different homogeneous groups (Table 2). However, it is also worth emphasizing that the differences in board densities (435–484 kg/m3) recorded in industrial conditions do not play such a large practical role.
Table 2.
Properties of Layered Cellular Panels.
The highest values of bending strength (MOR) and modulus of elasticity in bending (MOE) were obtained for the honeycomb panels with an internal layer in the shape of profile F. In the case of honeycomb panels with an internal layer in the shape of profile S, the MOR values were approximately 13% lower, and the MOE values were approximately 7% lower. This is likely due to the larger and more uniform contact surface between the internal layer (thermoplastic shape)—profile F, and the outer layers (HDF boards) compared to the internal layer—profile S. In the case of variant F, the connections between the core layer and the outer layers span the entire width of the panel (“ridge lines”) (Figure 7). On the other hand, in variant S, the connections between the core layer and the outer layers are point-like (Figure 8). It should be noted, however, that while the differences for MOR are statistically significant (different homogeneous groups, Table 2), the differences for MOE are statistically insignificant (the same homogeneous groups, Table 2). It is also worth noting that the formulation of the core layer (thermoplastic content) had a much greater influence on the MOR and MOE of the honeycomb panels, with this effect exceeding 85% (Table 3). Regarding the obtained MOR and MOE values, it is also important to mention that, in both cases (I_S and I_F), the strength values of the honeycomb panels are comparable to those of particleboard used in furniture production, while the material density is reduced by more than 20%. Furniture particleboards (type P2) of comparable thickness should be characterized by strength parameter values not lower than: MOR = 11 N/mm2 and MOE = 1800 N/mm2 [48,49]. For comparison, it is also worth pointing out that Słonina et al. [50], when examining wood-based honeycomb panels, regardless of the cell geometry, obtained lower strength parameters (MOR and MOE).
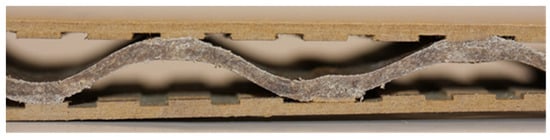
Figure 7.
Honeycomb panel with F-profile core.
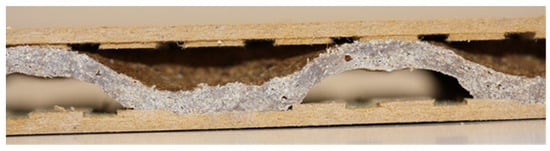
Figure 8.
Honeycomb panel with S-profile core.
Table 3.
Analysis of variance for honeycomb panels regarding the significance of the composite core composition (thermoplastic and wood particle content)—variants I_S and II_S.
In the case of compressive strength, the honeycomb panels with an S-profile core exhibited more favorable parameters compared to the panels with an F-profile core (the strength values were over 37% higher). Also, in this case, the observed differences were statistically significant (different homogeneous groups, Table 2). This is likely due to the more complex structure of the shaping element (more embossments formed in the 3D covering), which translates into an increase in its resistance to compressive forces. This is further supported by the high percentage impact (84.9%) of the profile shape on compressive strength (Table 4).
Table 4.
Analysis of variance for honeycomb panels regarding the significance of the profile shape of the composite core layer—variants I_S and I_F.
An analysis of the obtained results indicates that the ability to form a durable bond between the composite core and HDF face layers depends significantly on the thermoplastic content. Reducing the thermoplastic content from 60% to 40% resulted in a decrease in mechanical properties: the MOR (Modulus of Rupture) dropped by approximately 70%, and the MOE (Modulus of Elasticity) by about 50%. This effect was less pronounced in terms of compressive strength, where a decrease of around 25% was recorded.
The decrease in the strength parameters of the produced cellular boards results both from the lower content of the potential binder—thermoplastic and from the differences in the strength parameters used for thermoforming the composite boards (for example, the MOR values for boards from variant I are 24.4 N/mm2 and for boards from variant II—16.8 N/mm2).
Table 5 presents the results of the numerical stress analysis conducted for the different variants of the cellular boards. The minimum and maximum stress values were typically observed in the area around the applied load at the midpoint of the sample. Figure 9 additionally shows a map of reduced von Mises stresses from the numerical simulation under a 350 N load.
Table 5.
Numerical analysis results of stress distribution in honeycomb panels.
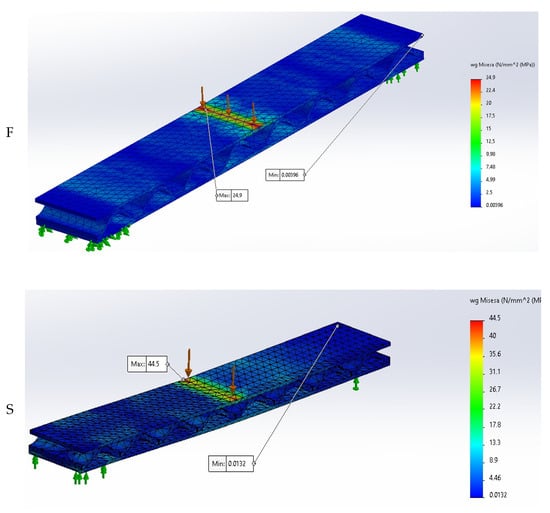
Figure 9.
Map of von Mises reduced stress (numerical simulation for 350 N load); F, S—core layer profile.
In general, it can be stated that higher stress concentrations occur in the cellular boards with a core made from the S-profile composite. This results in faster failure at the interface between the face layers and the core, leading to lower MOR and MOE values in the tested samples, which was confirmed by the experimental results.
Table 6 presents the results of the numerical analysis of displacements conducted for the different variants of the cellular panels. In general, it was found that the cellular panels with a core made from the S-profile composite exhibited greater displacement values, particularly in the Y and Z directions. Only in the X direction did the cellular panel with the F-profile core show higher displacement values. Overall, the higher displacement values should also be associated with the faster failure of the connections between the face layer and the core.
Table 6.
Results of Numerical Analysis of Displacement for Cellular Panel Variants.
The displacement results summarized in Table 6 show significant differences between the F and S profiles, particularly in the Y-direction, which corresponds to the main bending deformation under load. The S profile exhibited a maximum displacement of 2.46 mm in the Y-direction, while the F profile showed only 0.679 mm in the same direction—indicating that the S profile experienced over 3.6 times greater deflection. This highlights a substantially higher stiffness of the F profile under bending conditions. In terms of practical significance, lower displacement (as observed in the F profile) translates to improved load-bearing capacity, better serviceability performance, and reduced risk of excessive deflections or cracking under sustained or cyclic loading. Conversely, the S profile, with its larger displacement values, may be more prone to flexural deformation under operational loads. However, this could also indicate a higher deformation capacity or ductility, which may be advantageous in applications where energy absorption or flexibility is needed (e.g., impact loading or seismic design). These differences in displacement behavior provide valuable insight into the structural suitability of each profile type. The F profile may be preferred in situations requiring rigid, stable panels, while the S profile might be considered where controlled flexibility is acceptable or beneficial.
Table 7 presents the relative error in estimating individual strength properties based on the numerical analysis results. The values of the maximum bending strength obtained from the FEM numerical simulation were similar to the experimental results, with an estimation error of the load-bearing capacity below around 15%. The relative error in the estimation of Young’s modulus was significantly lower, amounting to less than 5% for the S profile and 2% for the F profile. The relative error in the estimation of compressive strength was less than 25% for the F profile and 7% for the S profile. In future studies, more attention will be given to the assumptions adopted in the numerical analyses in order to achieve greater agreement between the results and to reduce the error in the estimation of strength properties.
Table 7.
Comparison of experimental and numerical data.
The locations of the highest stress concentrations identified in the FEM analysis correspond closely to the zones where damage initiation and failure were observed in the physical specimens. For both the S and F profiles, failure tended to occur near regions of high compression stress, such as the joint between the ridge lines of the inner and outer layer, and load application area, as shown in Figure 9. This correlation indicates that the numerical model not only predicts the global response of the material but also provides valuable insight into local failure mechanisms. The agreement between simulated and experimental failure zones supports the accuracy and predictive capability of the numerical approach.
4. Conclusions
It is possible to manufacture three-layer honeycomb panels in which the core layer is made from a thermoformed composite board. The conducted research has shown the following:
- ⮚
- The effectiveness of bonding thermoplastic profiles with the facings of honeycomb panels depends on the thermoplastic content—increasing the thermoplastic content improves the quality of the joints.
- ⮚
- The mechanical properties of honeycomb panels are significantly influenced by the shape of the core layer and the resulting contact area between the core and the outer facings. Among the tested panel variants, higher bending strength (MOR) and modulus of elasticity (MOE) were obtained for the panel with F-profile core compared to the one with an S-profile core. In contrast, under compressive loading, the panel with the S-profile core exhibited higher compressive strength (MOR).
- ⮚
- The shape of the profiled elements can be selected according to their intended application, which may lead to the development of custom honeycomb panels based on these core profiles. The selection of three-dimensional shapes can be preceded by finite element method (FEM) analysis.
Further research is planned to analyze other variants of the middle layer shapes, taking into account other types of thermoplastics used to produce WPC and the formulation of these composites. An additional direction for future research could involve the development of empirical equations to characterize the relationship between technological parameters and the mechanical performance of sandwich panels. Such modeling would require a more comprehensive parametric study, incorporating systematic variation in key manufacturing factors such as core geometry, adhesive type, processing pressure, and curing time.
Author Contributions
Conceptualization, P.B., I.B. and R.A.; methodology, P.B.; software, I.B., R.A. and K.S.; validation, I.B.; formal analysis, P.B. and I.B.; investigation, P.B., I.B., K.S. and R.A.; resources, P.B.; data curation, I.B.; writing—original draft preparation, P.B. and I.B.; writing—review and editing, I.B. and R.A.; visualization, P.B., I.B. and K.S.; supervision, P.B. All authors have read and agreed to the published version of the manuscript.
Funding
The presented research was financed under the “Strategic research and development program: environment, agriculture, and forestry” (BIOSTRATEG, Grant No. BIOSTRATEG3/344303/14/NCBR/2018). The funding institution was the National Centre for Research and Development.
Data Availability Statement
Not applicable.
Conflicts of Interest
The authors declare no conflicts of interest.
References
- Costanza, G.; Solaiyappan, D.; Tata, M.E. Properties, Applications and Recent Developments of Cellular Solid Materials: A Review. Materials 2023, 16, 7076. [Google Scholar] [CrossRef] [PubMed]
- Benedetti, M.; du Plessis, A.; Ritchie, R.O.; Dallago, M.; Razavi, N.; Berto, F. Architected Cellular Materials: A Review on Their Mechanical Properties towards Fatigue-Tolerant Design and Fabrication. Mater. Sci. Eng. R Rep. 2021, 144, 100606. [Google Scholar] [CrossRef]
- Hao, X.; Zhou, H.; Xie, Y.; Mu, H.; Wang, Q. Sandwich-Structured Wood Flour/HDPE Composite Panels: Reinforcement Using a Linear Low-Density Polyethylene Core Layer. Constr. Build. Mater. 2018, 164, 489–496. [Google Scholar] [CrossRef]
- Yazdani Sarvestani, H.; Akbarzadeh, A.H.; Mirbolghasemi, A.; Hermenean, K. 3D Printed Meta-Sandwich Structures: Failure Mechanism, Energy Absorption and Multi-Hit Capability. Mater. Des. 2018, 160, 179–193. [Google Scholar] [CrossRef]
- Zhu, D.; Shi, H.; Fang, H.; Liu, W.; Qi, Y.; Bai, Y. Fiber Reinforced Composites Sandwich Panels with Web Reinforced Wood Core for Building Floor Applications. Compos. B Eng. 2018, 150, 196–211. [Google Scholar] [CrossRef]
- Susainathan, J.; Eyma, F.; De Luycker, E.; Cantarel, A.; Bouvet, C.; Castanie, B. Experimental Investigation of Compression and Compression after Impact of Wood-Based Sandwich Structures. Compos. Struct. 2019, 220, 236–249. [Google Scholar] [CrossRef]
- Fatima, N.S.; Dhaliwal, G.S.; Newaz, G. Influence of Interfacial Adhesive on Impact and Post-Impact Behaviors of CFRP/End-Grain Balsawood Sandwich Composites. Compos. B Eng. 2021, 212, 108718. [Google Scholar] [CrossRef]
- Benzidane, M.A.; Benzidane, R.; Hamamousse, K.; Adjal, Y.; Sereir, Z.; Poilâne, C. Valorization of Date Palm Wastes as Sandwich Panels Using Short Rachis Fibers in Skin and Petiole “wood” as Core. Ind. Crops Prod. 2022, 177, 114436. [Google Scholar] [CrossRef]
- Basha, M.; Wagih, A.; Melaibari, A.; Lubineau, G.; Abdraboh, A.M.; Eltaher, M.A. Impact and Post-Impact Response of Lightweight CFRP/Wood Sandwich Composites. Compos. Struct. 2022, 279, 114766. [Google Scholar] [CrossRef]
- Rane, H.S.; Bagga, S.K. An Investigation and Comparison of Tensile Strength in Fiber Sandwiched Wood Composite (FSWC) Materials Subjected to Axial Loading. Mater. Today Proc. 2022, 51, 715–719. [Google Scholar] [CrossRef]
- Selvaraj, R.; Maneengam, A.; Sathiyamoorthy, M. Characterization of Mechanical and Dynamic Properties of Natural Fiber Reinforced Laminated Composite Multiple-Core Sandwich Plates. Compos. Struct. 2022, 284, 115141. [Google Scholar] [CrossRef]
- Borysiuk, P.; Dziurka, D.; Jabłoński, M.; Zbieć, M. Application of Waste Corrugated Cardboard as an Internal Layer of Blockboard. Ann. Wars. Agric. Univ. For. Wood Technol. 2005, 56, 60–64. [Google Scholar]
- Borysiuk, P.; Dziurka, D.; Jabłoński, M.; Zado, A.; Zbieć, M. Layered Insulation Boards. Ann. Wars. Agric. Univ. For. Wood Technol. 2006, 58, 79–82. [Google Scholar]
- Atas, C.; Sevim, C. On the Impact Response of Sandwich Composites with Cores of Balsa Wood and PVC Foam. Compos. Struct. 2010, 93, 40–48. [Google Scholar] [CrossRef]
- Osei-Antwi, M.; de Castro, J.; Vassilopoulos, A.P.; Keller, T. Shear Mechanical Characterization of Balsa Wood as Core Material of Composite Sandwich Panels. Constr. Build. Mater. 2013, 41, 231–238. [Google Scholar] [CrossRef]
- Demircioğlu, T.K.; Balıkoğlu, F.; İnal, O.; Arslan, N.; Ay, İ.; Ataş, A. Experimental Investigation on Low-Velocity Impact Response of Wood Skinned Sandwich Composites with Different Core Configurations. Mater. Today Commun. 2018, 17, 31–39. [Google Scholar] [CrossRef]
- Bunzel, F.; Wisner, G.; Stammen, E.; Dilger, K. Structural Sandwich Composites out of Wood Foam Core and Textile Reinforced Concrete Sheets for Versatile and Sustainable Use in the Building Industry. Mater. Today Proc. 2020, 31, S296–S302. [Google Scholar] [CrossRef]
- Arif, M.; Mehtab, S.; Misra, A.; Zaidi, M.G.H. Physical Behavior of Sandwich Composite Structures Derived through Bonding of Poplar Wood Plies with Clay/Epoxy Adhesives. Mater. Today Proc. 2021, 47, 4210–4213. [Google Scholar] [CrossRef]
- Navin Kumar, B.; Vijayarangam, J.; Vasudevan, A.; Pandiyarajan, R.; Balaji, G.; Karunagaran, N.; Sathish, T.; Nanthakumar, P. Design and Fabrication of Bamboo Composites Sandwich Panels for Flooring. Mater. Today Proc. 2021, 46, 4313–4321. [Google Scholar] [CrossRef]
- Netravali, A.N.; Chabba, S. Composites Get Greener. Mater. Today 2003, 6, 22–29. [Google Scholar] [CrossRef]
- Chen, Z.; Yan, N.; Deng, J.; Smith, G. Flexural Creep Behavior of Sandwich Panels Containing Kraft Paper Honeycomb Core and Wood Composite Skins. Mater. Sci. Eng. A 2011, 528, 5621–5626. [Google Scholar] [CrossRef]
- Mohammadabadi, M.; Yadama, V.; Smith, L. An Analytical Model for Wood Composite Sandwich Beams with a Biaxial Corrugated Core under Bending. Compos. Struct. 2019, 228, 111316. [Google Scholar] [CrossRef]
- Mohammadabadi, M.; Yadama, V. Influence of a Biaxially Corrugated Core Geometry on Flexural Stiffness of Wood-Strand Composite Sandwich Panels. Mater. Today Commun. 2020, 23, 100931. [Google Scholar] [CrossRef]
- Zhu, X.; Zheng, J.; Xiong, C.; Yin, J.; Deng, H.; Zou, Y.; Song, S. Compression Responses of Composite Corrugated Sandwich Square Tube: Experimental and Numerical Investigation. Thin-Walled Struct. 2021, 169, 108440. [Google Scholar] [CrossRef]
- Sala, B.; Gabrion, X.; Jeannin, T.; Trivaudey, F.; Guicheret-Retel, V.; Scarpa, F.; Placet, V. Effect of Hygrothermal Ageing on the Shear Creep Behaviour of Eco-Friendly Sandwich Cores. Compos. B Eng. 2022, 231, 109572. [Google Scholar] [CrossRef]
- Wei, X.; Wu, Q.; Gao, Y.; Yang, Q.; Xiong, J. Composite Honeycomb Sandwich Columns under In-Plane Compression: Optimal Geometrical Design and Three-Dimensional Failure Mechanism Maps. Eur. J. Mech. A/Solids 2022, 91, 104415. [Google Scholar] [CrossRef]
- Wang, X.; Shi, X.; Meng, Q.; Hu, Y.; Wang, L. Bending Behaviors of Three Grid Sandwich Structures with Wood Facing and Jute Fabrics/Epoxy Composites Cores. Compos. Struct. 2020, 252, 112666. [Google Scholar] [CrossRef]
- Zheng, T.; Li, S.; Wang, G.; Hu, Y.; Zhao, C. Mechanical and Energy Absorption Properties of the Composite XX-Type Lattice Sandwich Structure. Eur. J. Mech. A/Solids 2022, 91, 104410. [Google Scholar] [CrossRef]
- Smardzewski, J.; Wojciechowski, K.W.; Poźniak, A. Auxetic Lattice Truss Cores Fabricated of LayWood. BioResources 2018, 13, 8823–8838. [Google Scholar] [CrossRef]
- DendroLight. Available online: http://www.dendrolight-nederland.nl (accessed on 1 April 2025).
- Aerowood. Available online: https://schweitzer-austria.com/de/produkte/aerowood (accessed on 1 April 2025).
- Lisocore. Available online: http://piwik.lightweight-solutions.de/lisocore/ (accessed on 1 April 2025).
- CONBOU. Available online: https://materialdistrict.com/material/conbou-bamboo (accessed on 1 April 2025).
- TermHex. Available online: https://thermhex.com (accessed on 1 April 2025).
- Pradhan, S.; Mohammadabadi, M.; Seale, D. Quantifying the Effect of Profile Design on Flexural Stiffness in Cellular Cross-Laminated Timber: A Numerical Exploration and Experimental Verification. Mater. Struct./Mater. Constr. 2024, 57, 164. [Google Scholar] [CrossRef]
- Auriga, R.; Borysiuk, P.; Baran, R. Zastosowanie Technologii Druku 3D Oraz Modelowania Komputerowego w Projektowaniu Spersonalizowanych Wypełnień Płyt Komórkowych [The Use of 3D Printing Technology and Computer Modeling in the Design of Sandwich Board Personalized Fillings]. Biul. Inf. Ośrodka Badaw.-Rozw. Przemysłu Płyt Drewnopochodnych Czarnej Wodzie 2020, 3–4, 155–166. [Google Scholar] [CrossRef]
- Bharath, H.S.; Bonthu, D.; Gururaja, S.; Prabhakar, P.; Doddamani, M. Flexural Response of 3D Printed Sandwich Composite. Compos. Struct. 2021, 263, 113732. [Google Scholar] [CrossRef]
- Smardzewski, J.; Jasińska, D. Mathematical Models and Experimental Data for HDF Based Sandwich Panels with Dual Corrugated Lightweight Core. Holzforschung 2017, 71, 265–273. [Google Scholar] [CrossRef]
- Zarna, C.; Chinga-Carrasco, G.; Echtermeyer, A.T. Bending Properties and Numerical Modelling of Cellular Panels Manufactured from Wood Fibre/PLA Biocomposite by 3D Printing. Compos. Part A Appl. Sci. Manuf. 2023, 165, 107368. [Google Scholar] [CrossRef]
- Dogan, A. Low-Velocity Impact, Bending, and Compression Response of Carbon Fiber/Epoxy-Based Sandwich Composites with Different Types of Core Materials. J. Sandw. Struct. Mater. 2021, 23, 1956–1971. [Google Scholar] [CrossRef]
- Borysiuk, P.; Boruszewski, P.; Auriga, R.; Danecki, L.; Auriga, A.; Rybak, K.; Nowacka, M. Influence of a Bark-Filler on the Properties of PLA Biocomposites. J. Mater. Sci. 2021, 56, 9196–9208. [Google Scholar] [CrossRef]
- Borysiuk, P.; Auriga, R.; Wilkowski, J.; Auriga, A.; Trociński, A.; Seng Hua, L. A Study on the Susceptibility of PLA Biocomposites to Drilling. Forests 2022, 13, 1950. [Google Scholar] [CrossRef]
- EN 323; Wood-Based Panels—Determination of Density. European Committee for Standarization: Brussels, Belgium, 1999.
- EN 310; Wood-Based Panels—Determination of Modulus of Elasticity in Bending and of Bending Strength. European Committee for Standarization: Brussels, Belgium, 1994.
- Dounar, S.; Iakimovitch, A.; Jakubowski, A. Finite Element Analysis of the Dynamically Created Portal in the Huge Machine Tool of “Travelling Column” Type. Zesz. Nauk. Akad. Morskiej Szczecinie 2021, 65, 29–37. [Google Scholar] [CrossRef]
- Dounar, S.; Iakimovitch, A.; Mishchanka, K.; Jakubowski, A.; Chybowski, L. FEA Simulation of the Biomechanical Structure Overload in the University Campus Planting. Appl. Bionics Biomech. 2020, 2020. [Google Scholar] [CrossRef]
- Peng, Y.S.; Cheng, B.Y.; Liu, T.C. Mechanical Properties and Optimization Strategies of Tree Fork Structures. Plants 2025, 14, 167. [Google Scholar] [CrossRef]
- Niemz, P. Physik Des Holzes Und Holzwerkstoffe; DRW-Verlag: Leinfelden-Echterdingen, Germany, 2003. [Google Scholar]
- EN 312; Particleboards—Specyfications. European Committee for Standarization: Brussels, Belgium, 2011.
- Słonina, M.; Dziurka, D.; Molińska-Glura, M.; Smardzewski, J. Influence of Impregnation with Modified Starch of a Paper Core on Bending of Wood-Based Honeycomb Panels in Changing Climatic Conditions. Materials 2022, 15, 395. [Google Scholar] [CrossRef] [PubMed]
Disclaimer/Publisher’s Note: The statements, opinions and data contained in all publications are solely those of the individual author(s) and contributor(s) and not of MDPI and/or the editor(s). MDPI and/or the editor(s) disclaim responsibility for any injury to people or property resulting from any ideas, methods, instructions or products referred to in the content. |
© 2025 by the authors. Licensee MDPI, Basel, Switzerland. This article is an open access article distributed under the terms and conditions of the Creative Commons Attribution (CC BY) license (https://creativecommons.org/licenses/by/4.0/).