Article

Fuels Treatments and Tending Reduce Simulated Wildfire Impacts in Sequoia sempervirens Under Single-Tree and Group Selection

by
Jade D. Wilder
,
Keith A. Shuttle
,
Jeffrey M. Kane
and
John-Pascal Berrill
*
Department of Forestry, Fire, and Rangeland Management, California Polytechnic State University, Humboldt, 1 Harpst St., Arcata, CA 95521, USA
*
Author to whom correspondence should be addressed.
Forests 2025, 16(6), 1000; https://doi.org/10.3390/f16061000
Submission received: 1 May 2025 / Revised: 31 May 2025 / Accepted: 8 June 2025 / Published: 13 June 2025
(This article belongs to the Section Natural Hazards and Risk Management)

Abstract

Selection forestry sustains timber production and stand structural complexity via partial harvesting. However, regeneration initiated by harvesting may function as fuel ladders, providing pathways for fire to reach the forest canopy. We sought potential mitigation approaches by simulating stand growth and potential wildfire behavior over a century in stands dominated by coast redwood (Sequoia sempervirens (Lamb. ex. D. Don) Endl.) on California’s north coast. We used the fire and fuels extension to the forest vegetation simulator (FFE-FVS) to compare group selection (GS) to single-tree selection silviculture with either low-density (LD) or high-density (HD) retention on a 20-year harvest return interval. These three approaches were paired with six options involving vegetation management (i.e., hardwood control or pre-commercial thinning (PCT)) with and without fuels treatments (i.e., prescribed fire or pile burning), or no subsequent vegetation or fuel treatment applied after GS, HD, or LD silviculture. Fuel treatment involving prescribed fire reduced hazardous fuel loading but lowered stand density and hence productivity. Hardwood control followed by prescribed fire mitigated potential wildfire behavior and promoted dominance of merchantable conifers. PCT of small young trees regenerating after selection harvests, followed by piling and burning of these cut trees, sustained timber production while reducing potential wildfire behavior by approximately 40% relative to selection silviculture without vegetation/fuel management, which exhibited the worst potential wildfire behavior.

1. Introduction

Continuous cover forestry approaches such as selection silviculture are designed to provide a steady supply of wood products by partially harvesting some but not all trees [1]. Partial harvesting is a disturbance event that tends to promote stand structural complexity by initiating new age classes of trees. Stands with different tree ages and sizes have greater structural complexity, which may be desirable when combining timber production with other stewardship objectives [1].
Complex stand structures can provide a variety of ecosystem services, such as habitat protection [2,3], ecosystem disturbance resistance and resilience [4,5,6,7], and water conservation [4]. Structural complexity can be positively associated with decreased tree mortality during prolonged periods of drought [8]. However, natural regeneration arising from partial harvesting in multi-aged stands contributes to fuel ladders that can carry fire up into the forest canopy.
High-frequency low-severity wildfires used to be prevalent in the western United States, and these disturbances are likely to have promoted structural complexity. However, a century of fire exclusion and intensive logging practices have led to decreased forest structural complexity [9] and larger, more destructive wildfires as opposed to high-frequency low-severity fire [10]. Global climate change is also responsible for altering fire behavior and fire effects. More recently, a warmer and drier climate in the western United States [11] is contributing to drier fuel conditions and extended fire seasons [12,13]. Collectively, these conditions are likely to be contributing to an uncharacteristic increase in high-severity fire [14,15,16,17].
Coast redwood (Sequoia sempervirens (Lamb. ex. D. Don) Endl.) forests have historically experienced frequent low-severity fire [18,19]. Stand-replacing wildfire was infrequent [20]. At the center of redwood’s range, Mendocino County historically had a median surface fire frequency of 6–25 years [21], thought to be predominantly human ignited [22]. Frequent low-severity wildfires consume surface fuels, thin stands, and can raise canopy base height (CBH), lessening the potential impact of future fires [23]. The loss of regular low-severity fire may have favored shade-tolerant sprouting hardwood species such as tanoak (Notholithocarpus densiflorus [Hook. & Arn.]) over conifers that require disturbances to regenerate [24]. Tanoak also regenerates prolifically via stump sprouts after harvesting, potentially creating a fuel ladder problem, while rapidly occupying growing space and competing with merchantable conifers [25]. Vegetation or fuel management, such as via pre-commercial thinning (PCT), prescribed burning, or herbicide treatment, have the potential to alter fuel loading and fuel stratum continuity but may also directly or indirectly influence fire behavior by rearranging fuels, inflating fuel-bed depth, affecting wind speed, or promoting unwanted resprouting from cut stumps [26]. Cutting or herbicide treatment of hardwoods can shift species composition to favor more fire-resistant species, such as coast redwood and coast Douglas-fir (Pseudotsuga menziesii var. menziesii (Mirb.) Franco), over species that are more susceptible to fire with lower commercial value, such as tanoak [27].
The crown fire susceptibility of complex stands with multiple canopy layers suggests that vegetation/fuel management may become an essential step when practicing multi-aged silviculture in the western United States [23]. At present, there is little guidance on how multi-aged silviculture can be modified to mitigate crown fire hazard. Surface fire behavior is largely influenced by fuel-bed characteristics, topography, fuel moisture content (FMC), and wind speed [28]. In addition to surface fuels, ladder fuels also play an important role in crown fire propagation [29]. Forest management practices that reduce surface and ladder fuels and increase CBH typically reduce the likelihood of torching, i.e., passive crown fire [30]. Canopy bulk density (CBD) also affects wildland fire behavior when stands with high CBD allow fire spread from tree crown to tree crown (i.e., crowning or active crown fire). Thus, active forest management has the potential to limit torching, crowning, and associated fire-caused tree mortality [31]. Mitigating fire effects is especially challenging under selection silviculture, where it is essential to periodically regenerate new age classes of trees (i.e., potential fuel ladders) while maintaining stand density at the elevated levels required for economically sustainable timber production.
Our research goal was to identify approaches to multi-aged selection silviculture that would lessen the potential for destructive crown fire. We sought to identify combinations of treatments that would limit fire behavior and effects during wildfire conditions in coast redwood forests in northwestern California. Therefore, our specific research objective was to find prescriptions that lessened the potential for stand replacing wildfires while also sustaining high levels of timber production. Specifically, we wanted to identify a combination of selection harvest and vegetation/fuel management in coast redwood forests that (1) attenuated wildfire behavior in terms of surface flame lengths, torching, and crowning; (2) reduced wildfire effects in terms of basal area mortality; and (3) produced the most harvest volume over 100 years. Results from this research will inform forest managers about potential effective management scenarios that can reduce impacts from wildfires, while also supporting timber production goals, an area of substantial importance given the rapid increase in wildfire activity in the region.

2. Materials and Methods

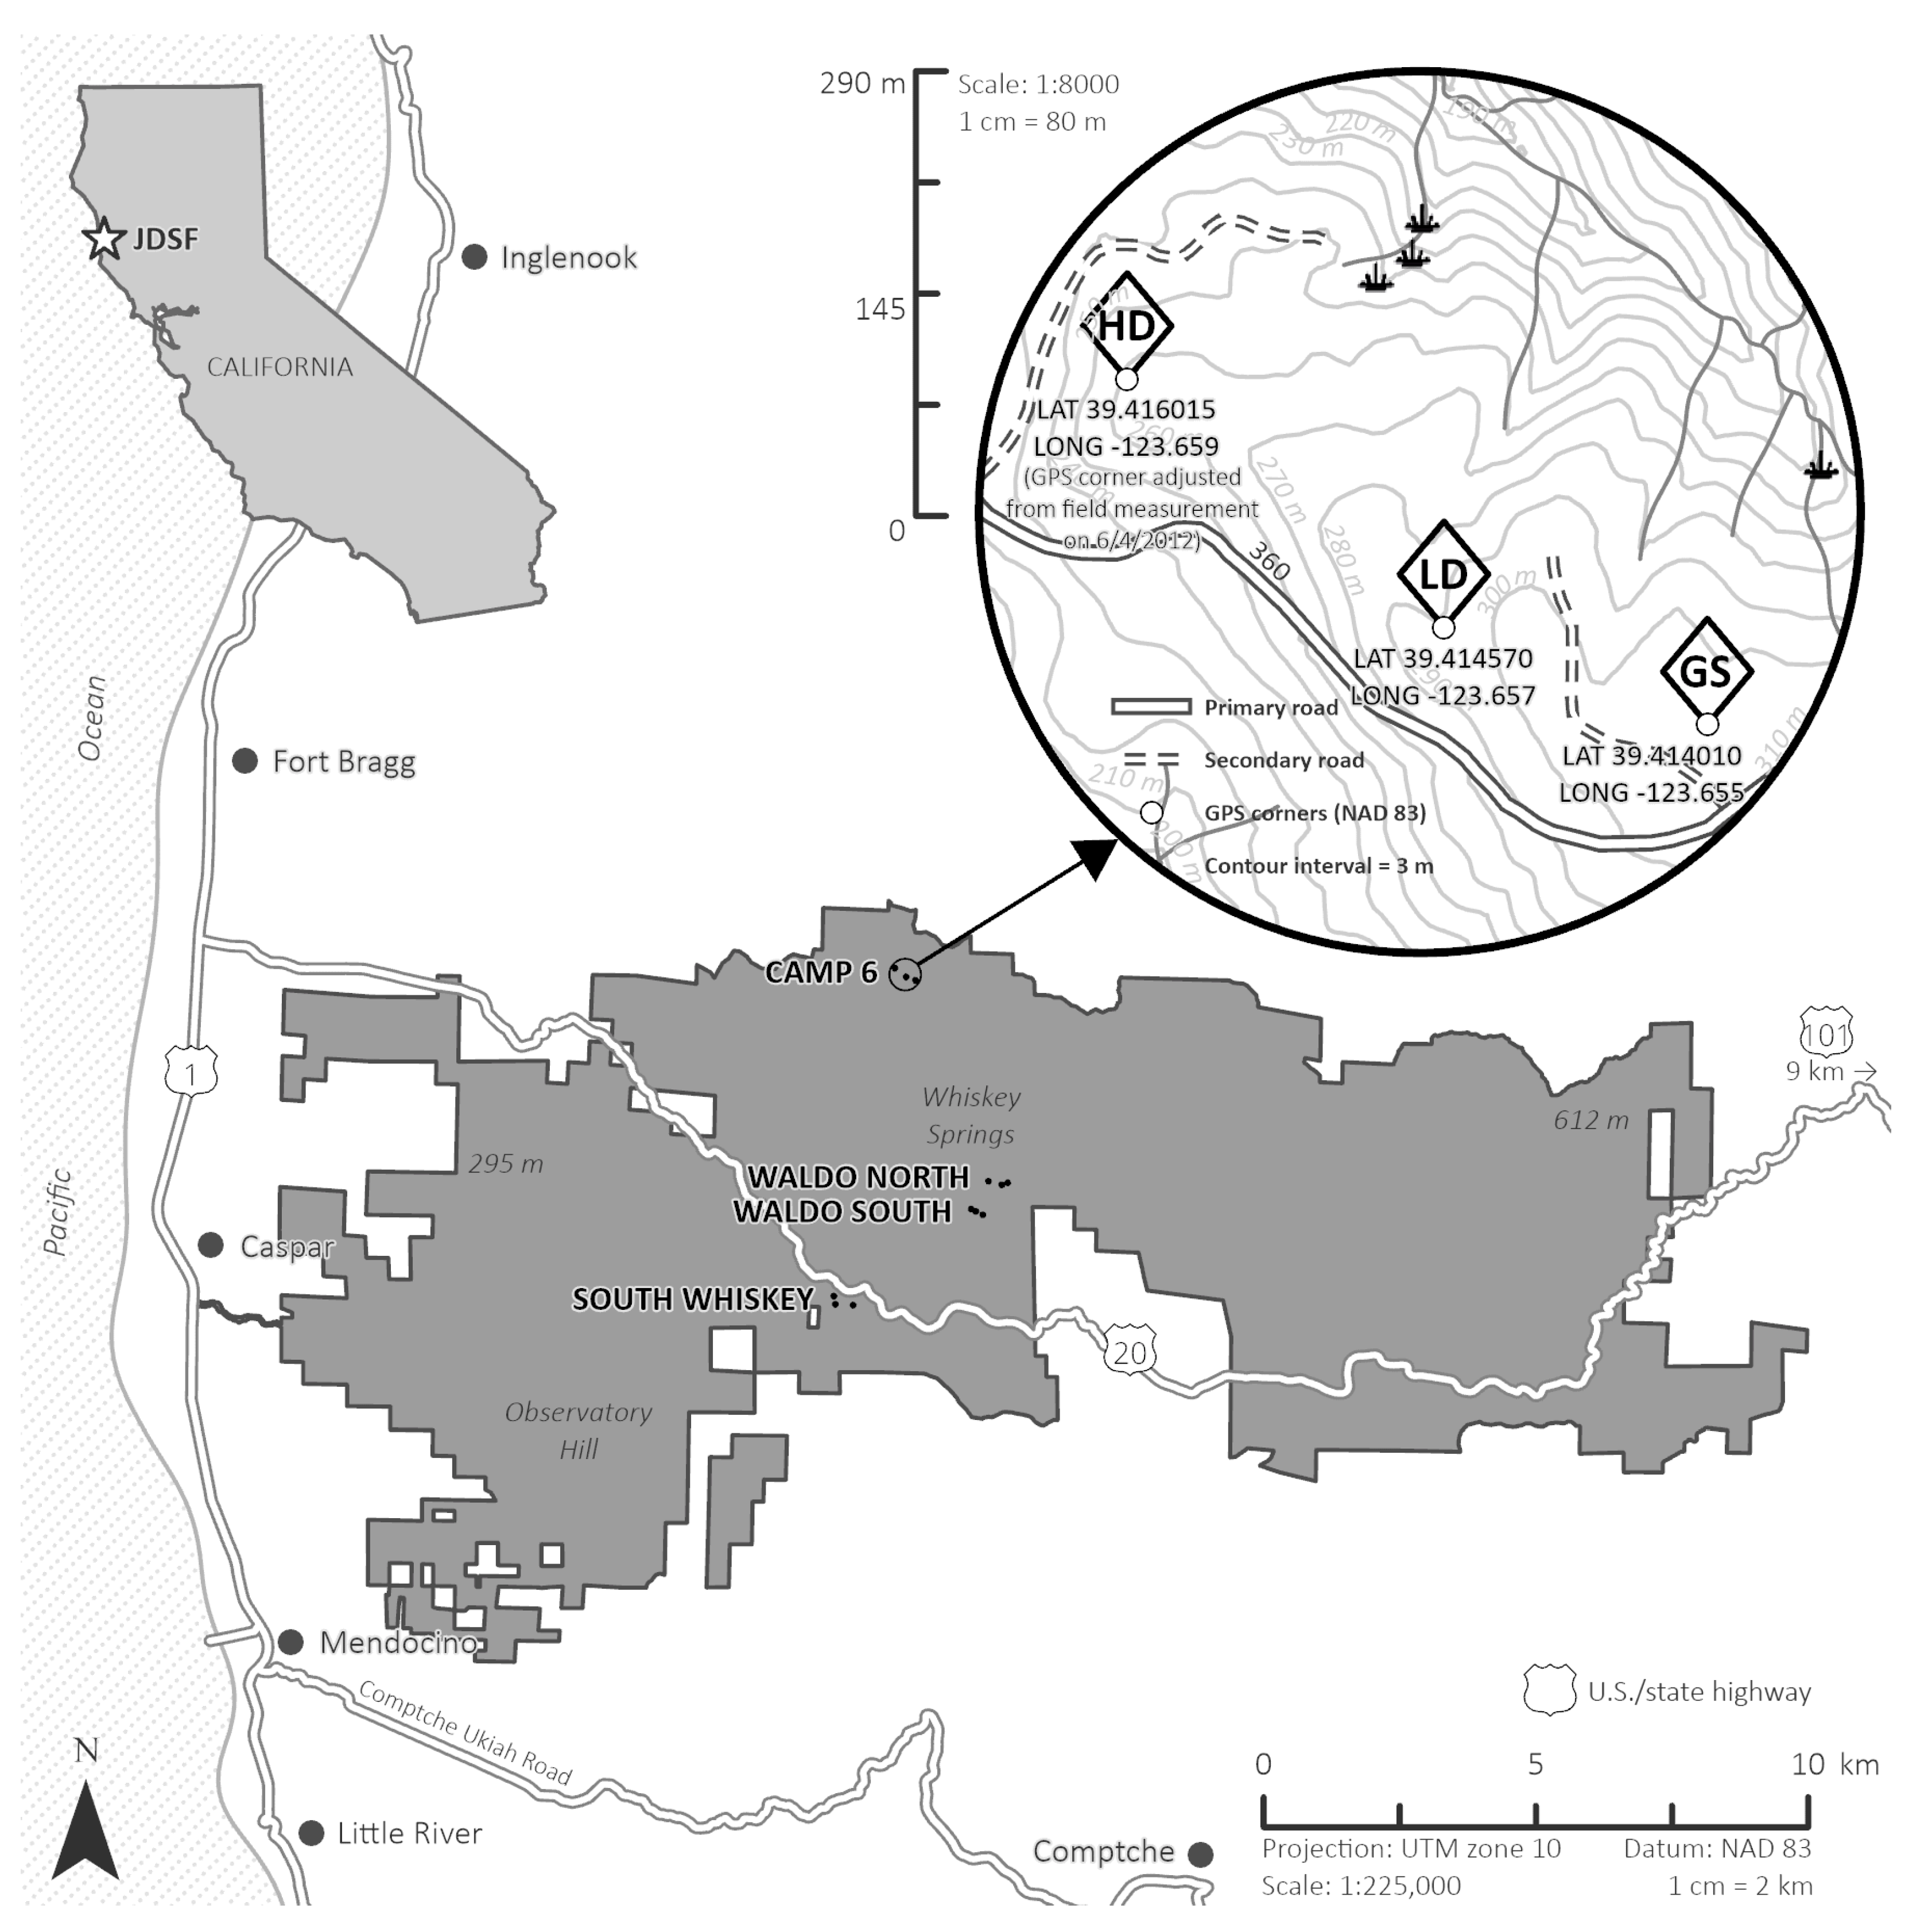
2.1. Site Description

Our study was conducted on Jackson Demonstration State Forest (JDSF), located in Mendocino County, on California’s north coast. JDSF spans 20,000 ha, which stretches nearly 30 km west–east from coastal Fort Bragg towards inland Willits. This forest is situated in the center of the natural range of coast redwood, which features a Mediterranean climate with cool wet winters and warm dry summers. Annual precipitation averages about 1000 mm on the coastal side of JDSF and 1300 mm on the eastern side. Topography varies greatly, from gentle ridges to steep slopes and gullies with seasonally dry or permanent creeks. The forest was logged between the 1860s and 1930s, leaving few residual old-growth trees outnumbered by trees that regenerated after logging and subsequent disturbances. Harvesting of commercial conifers has inadvertently released hardwood trees, seedlings, and stump sprouts, which have come to outnumber conifers in some areas. By 1947, the California Department of Forestry and Fire Protection (CAL FIRE) took ownership of what is now JDSF and began implementing an assortment of silvicultural prescriptions designed to allow for future research and demonstration. Our study sites were dominated by 80- to 100-year-old coast redwood, interspersed with Douglas-fir and tanoak, along with occasional grand fir (Abies grandis (Douglas ex D. Don) Lindl.), western hemlock (Tsuga heterophylla (Raf.) Sarg.), red alder (Alnus rubra Bong.), and Pacific madrone (Arbutus menziesii Pursh).

2.2. Experimental Design

Our initial stand structure and composition data were generated from a previously implemented randomized complete block design experiment that included three examples of selection silviculture replicated at four sites (Figure 1). Three types of commercial selection harvests were initiated: group selection (GS), single-tree selection with high-density retention (HD), and single-tree selection with low-density retention (LD). Each prescription was implemented over at least 2 ha at each site. GS replicates received a complete overstory removal in a 1-ha circle while the surrounding matrix underwent commercial thinning of 33% of basal area; the extent of the thinned area was approximately 50 m or one tree height from the edges of the GS opening. In the HD and LD blocks, prescribed retention was defined by relative densities (RDs) in terms of the ratio of actual stand density index (SDI) to maximum SDI × 100. HD areas were harvested to 21% RD, and LD areas were harvested to 13% RD. We assumed that these residual stand densities would reach upper limits of 50% and 30% RD, respectively, within about 20 years, at which time single-tree selection harvest would once again be implemented [32]. Prior multi-aged redwood simulations indicated that maintaining RD below 50% in HD stands favored stand volume production without excessive loss of individual tree growth, while maintaining RD below 30% in LD stands favored individual tree growth with modest sacrifice in stand volume production [32].
The objective of retention was to ensure that species composition remained approximately constant over time under each harvest prescription: 70%–75% coast redwood, 20%–25% Douglas-fir, and 0%–5% tanoak. Harvesting began in the autumn of 2011 and was completed by 2012. Harvest slash and advance regeneration were cut, lopped, and scattered [25].

2.3. Data Collection

After all harvests were complete, large square 0.2-ha (45 × 45 m) plots were installed within each GS, HD, and LD selection harvest area at each site (n = 12 plots; Figure 1). In 2014 and again in 2017, residual trees in each plot were measured for DBH (diameter at breast height; 1.37 m), height, and live crown base height. These trees were all >10 cm DBH. The two repeat measurements allowed us to calculate increments for individual tree DBH and height.
In 2022, regenerating trees > 1.37 m in height were tallied by 2.5-cm DBH size class within each plot in four separate 4-m radius inner plots systematically placed 10 m inside each plot corner (towards the plot center). Fuel data were also gathered along 10-m transects using the FIREMON protocol (fire effects monitoring and inventory system) [33]. Two transects terminated at each inner plot, running parallel to plot edges, where fine woody debris (FWD) count and coarse woody debris (CWD) diameter plus decay class were quantified; FWD and CWD were separated into four size classes, in which each fuel size class was counted for a specified length: FWD: 2–4 m; CWD: 10 m. In two 1-m radius sampling circles located at the 1-m and 5-m mark along each transect, combined duff and litter depth was measured at a representative location and litter percent estimated to separate duff and litter in fuel loading calculations. Fuel loading was also calculated for FWD (<7.62 cm diameter) and CWD (>7.62 cm diameter) (Judson Fisher, unpublished data).
Since the regeneration and fuel data were collected in 2022, we used the DBH and height increments to grow residual tree data forward in time from 2017 to 2022. In the spring of 2025, we cored 12 dominant coast redwood trees per plot for breast-height age and used the polymorphic KP1 model [34] to estimate average site index for each site.

2.4. Data Analysis

We simulated stand growth and yield, and potential wildfire behavior and effects, using the NC variant of the forest vegetation simulator (FVS) [35] and the FVS fire and fuels extension (FFE-FVS) [36,37]. This involved using field data to initialize the growth and yield model, simulating growth and periodic commercial harvests plus various other treatments, and modeling fire behavior and fire effects at 5-year model time steps over 100 years (2022–2122).
In addition to uploading tree size data and redwood site index estimates, we also included increment data for DBH and height, which FVS uses to calibrate tree growth projections. Beginning in 2022, we simulated future harvest entries by specifying residual SDI. To calculate post-harvest SDI from prescribed RD for retention, we assumed a maximum SDI of 2223 stems/ha for mixed stands dominated by coast redwood [38]. Twenty years after the group selection openings were initially harvested in 2012, we simulated commercial thinning (thin-from-below) at 20-year intervals in GS openings to retain 30% RD. In HD and LD, we harvested every 20 years according to the original RD retention levels (21% and 13%, respectively); we utilized a single-tree selection BDq (basal area diameter q ratio) approach [39], in which we defined maximum DBH of 91 cm to fit sawmills in the region and applied a diameter class width of 10 cm and q-factor of 1.2 (i.e., 1.2 times more stems/ha in a diameter class relative to the next larger class), which limits the number of smaller trees [1,32]. Harvests were designed to maintain consistent species composition. The FVS model predicts stump sprout regeneration from cut stumps but does not predict seedling regeneration. Therefore, after each HD or LD harvest, we initiated natural seedling regeneration within FVS to supplement modeled stump sprout regeneration of resprouting species (e.g., coast redwood and tanoak) with 370 stems/ha of Douglas-fir and 60 stems/ha of grand fir seedlings based on observed regeneration densities from our field data. Analysis of these data indicated that regeneration densities did not vary among HD and LD treatments (Judson Fisher, unpublished data). Conversely, we assumed that natural seedling regeneration would be absent in GS openings after commercial thinning due to the higher RD, which is expected to suppress regeneration [40].
GS, HD, and LD were paired with one of six vegetation/fuel management treatments (veg/fuels-trtmt): no veg/fuels-trtmt; hardwood (HW) control; prescribed (Rx) burn; HW control + Rx burn; PCT; and PCT + pile burn (Figure 2); in total, we performed 18 simulations. In HW control simulations, tanoak was the only species specified for removal; we assumed a mortality rate of 100%. In the Rx burn treatments we used 70th percentile weather data and allowed FFE to estimate mortality; we used the default setting for stand area burned (70%), assumed a FFE predefined moisture content of ‘dry’ for all fuels (i.e., 1- and 10-h = 8%; 100-h = 10%; 1000-h = 15%; duff 50%; live woody = 110% [37]), and simulated the burns in autumn. HW control + Rx burn used the same parameters as HW control applied alone and Rx burn applied alone. For the PCT treatments, we simulated a thin-from-below, in which 0–13 cm DBH trees were cut, with 30% retention in terms of stems/ha and leaving whole trees where they were cut. For PCT + pile burn, PCT treatments were followed by pile burning 70% of the surface fuels (including the cut stems), and we assumed 5% mortality among trees ≤ 8 cm.
For every simulation of each type of silviculture at each site, the FFE-FVS PotFire keyword gave potential wildfire behavior and effects under severe burn conditions for every 5-year model time step using 98th percentile (severe) temperature (26 °C), wind speed (15 kph), and fuel moisture percent by size class (1-h = 3%; 10-h = 6%; 100-h = 14%; 1000-h = 16%; duff 16%; live woody = 70%). Weather conditions were calculated through FireFamilyPlus 5 [41] with McQuires RAWS data from 2000–2022.

2.5. Fire Model Linkages

FFE-FVS comprises various wildfire behavior prediction models with static input variables (e.g., percentile weather data, slope, aspect) and dynamic variables (e.g., interdependent stand conditions and fuel models by treatment over time). Standard fuel models [42] used for our simulations were initialized by FFE-FVS, based on our 2022 field measurements of surface fuels for each site. Across the 100-year simulation period, fuel model assignment for each simulation was permitted to change based on surface fuel changes from treatments and stand development over time. Surface flame length was calculated with Rothermel’s model [43], which is a function of slope, fuel characteristics, mid-flame wind speed, and user-specified fuel moisture levels. Our simulations utilized 6-m wind speeds that were adjusted to midflame wind speeds based on stand structural characteristics (i.e., canopy cover), for each management treatment [44].
FFE-FVS uses information from surface fuels and overall stand structure to predict crown fire potential. Two crown fire hazard indices were calculated: torching and crowning index [31]. Torching index is the 6-m wind speed in kilometers per hour (kph) required for a surface fire to ignite the crown layer (i.e., passive crown fire). Torching index is a function of surface fuels, FMC, foliar moisture content, CBH, slope, and wind resistance from the canopy. As surface fire behavior increases (e.g., higher fuel loading, drier FMC, steeper slopes, decreased CBH), it takes less wind for a surface fire to initiate torching. Crowning index is the 6-m wind speed required to transfer a crowning fire from passive to active (it is assumed torching is occurring prior to crowning). Crowning index is a function of CBD, slope, and FMC. As CBD increases, active crowning can occur at lower wind speeds. Since both torching and crowning index are a function of FMC, these conditions must be specified for the algorithms to operate.
Finally, first-order fire effects were estimated in terms of basal area mortality percent by predicting and summarizing probabilities of individual tree mortality under severe fire weather. Basal area mortality is a function of species, diameter, and flame length [45].

3. Results

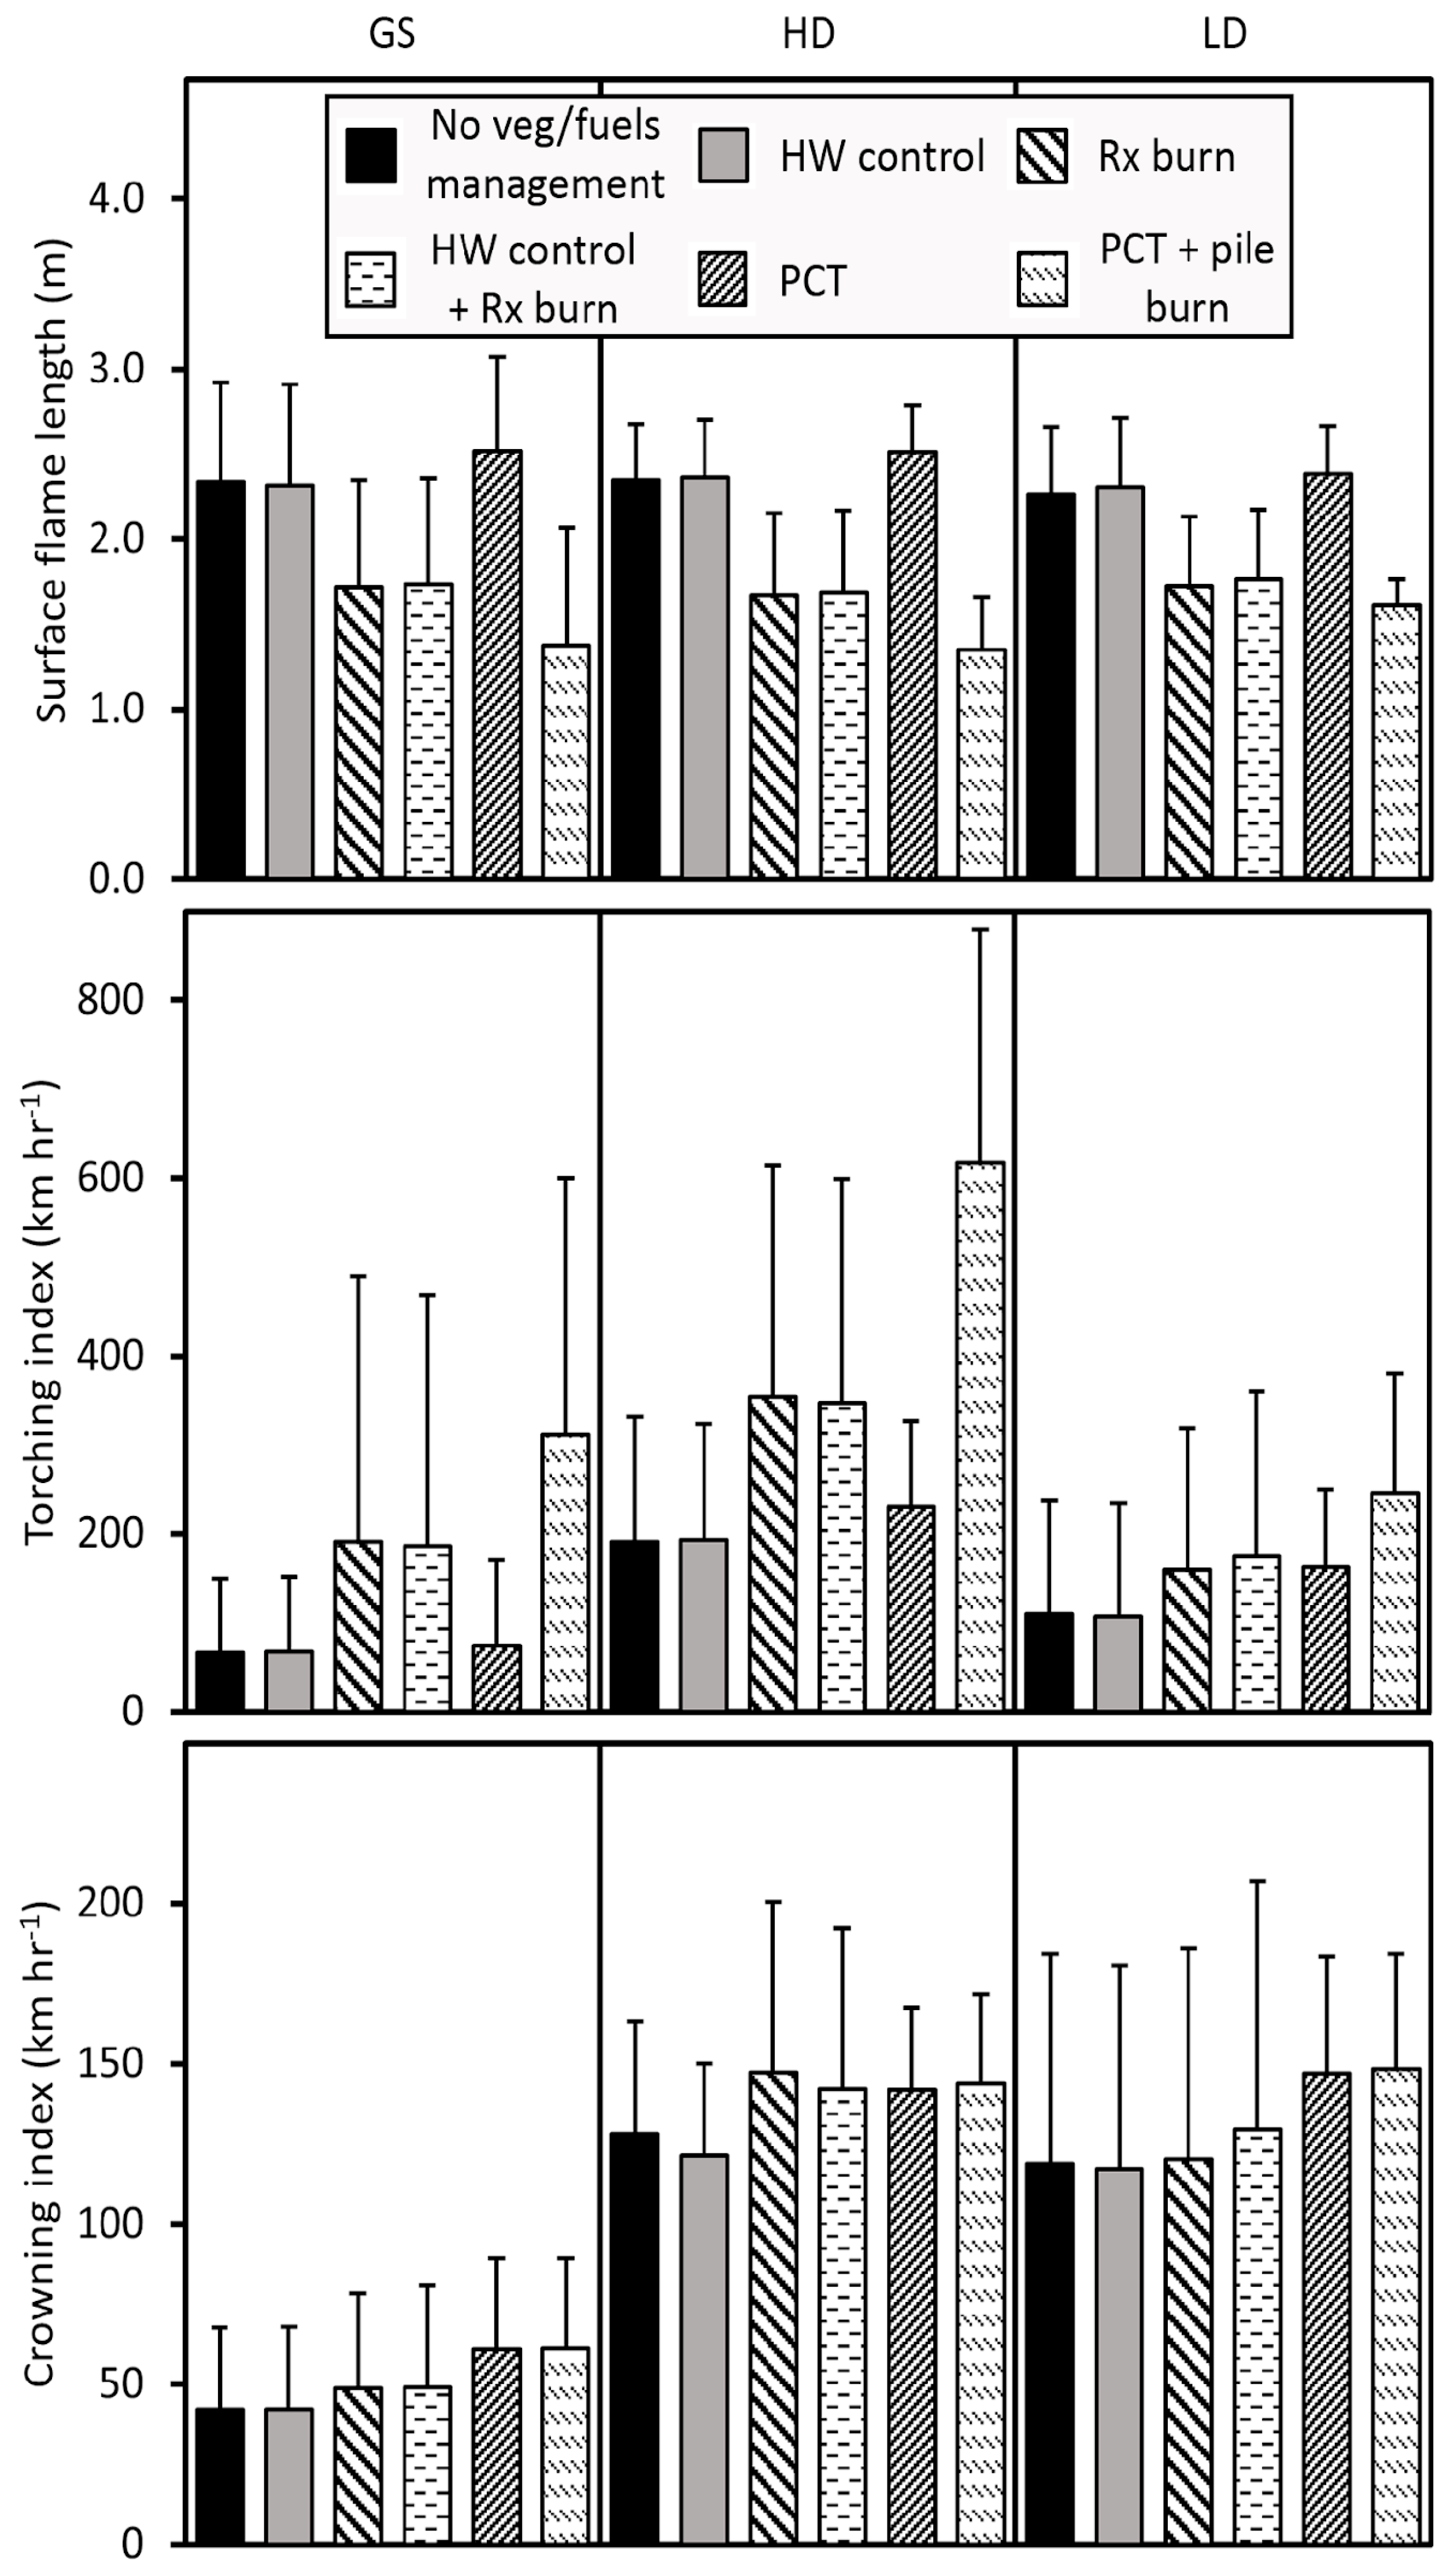
3.1. Wildfire Behavior

Vegetation/fuels treatments involving burning greatly reduced fuel loading without much impact on CBH or CBD (Table 1). Average potential surface fire behavior under extreme fire weather conditions did not meaningfully vary among GS, HD, or LD but were strongly influenced by veg/fuels-trtmt (Figure 3). Management including fire (i.e., Rx burn, pile burn) greatly reduced predicted surface flame lengths across all three harvest prescriptions. PCT + pile burn consistently had the lowest surface flame lengths. In contrast, treatments without burning (i.e., HW control, PCT alone) did not show substantive reductions in surface flame lengths relative to harvest prescriptions with no veg/fuels-trtmt. However, HW control + Rx burn showed substantially lower surface flame lengths than HW control alone, highlighting the role of prescribed fire in understory management. Rx burn had slightly lower surface flame lengths than HW control + Rx burn regardless of harvest prescription.
Torching index was predicted to vary widely across harvest prescription and veg/fuels-trtmt (Figure 3). Differences in torching index among GS, HD, and LD largely followed differences in CBH (Table 1). GS was consistently more susceptible to torching (i.e., lowest torching index) than LD in treatments without burning. HD was least susceptible to torching (i.e., highest torching index), particularly when paired with PCT + pile burn. Similar to surface flame lengths, HW control did not improve torching index over no veg/fuels-trtmt. HD and LD with PCT showed relatively higher torching index relative to HD and LD without veg/fuels-trtmt, while GS with PCT showed no improvement. Rx burn alone and HW control + Rx burn had similar torching indices that were both better than no veg/fuels-trtmt.
Crowning index differed markedly among GS, HD, and LD but ranked similarly among every veg/fuels-trtmt (Figure 3). HD and LD had nearly three-fold reduction in crowning potential (i.e., higher crowning index) than GS, which aligned with CBD estimates, where HD and LD had 49% to 66% lower CBD than GS (Table 1). Overall, GS remained the most susceptible to crowning potential, regardless of veg/fuels-trtmt.

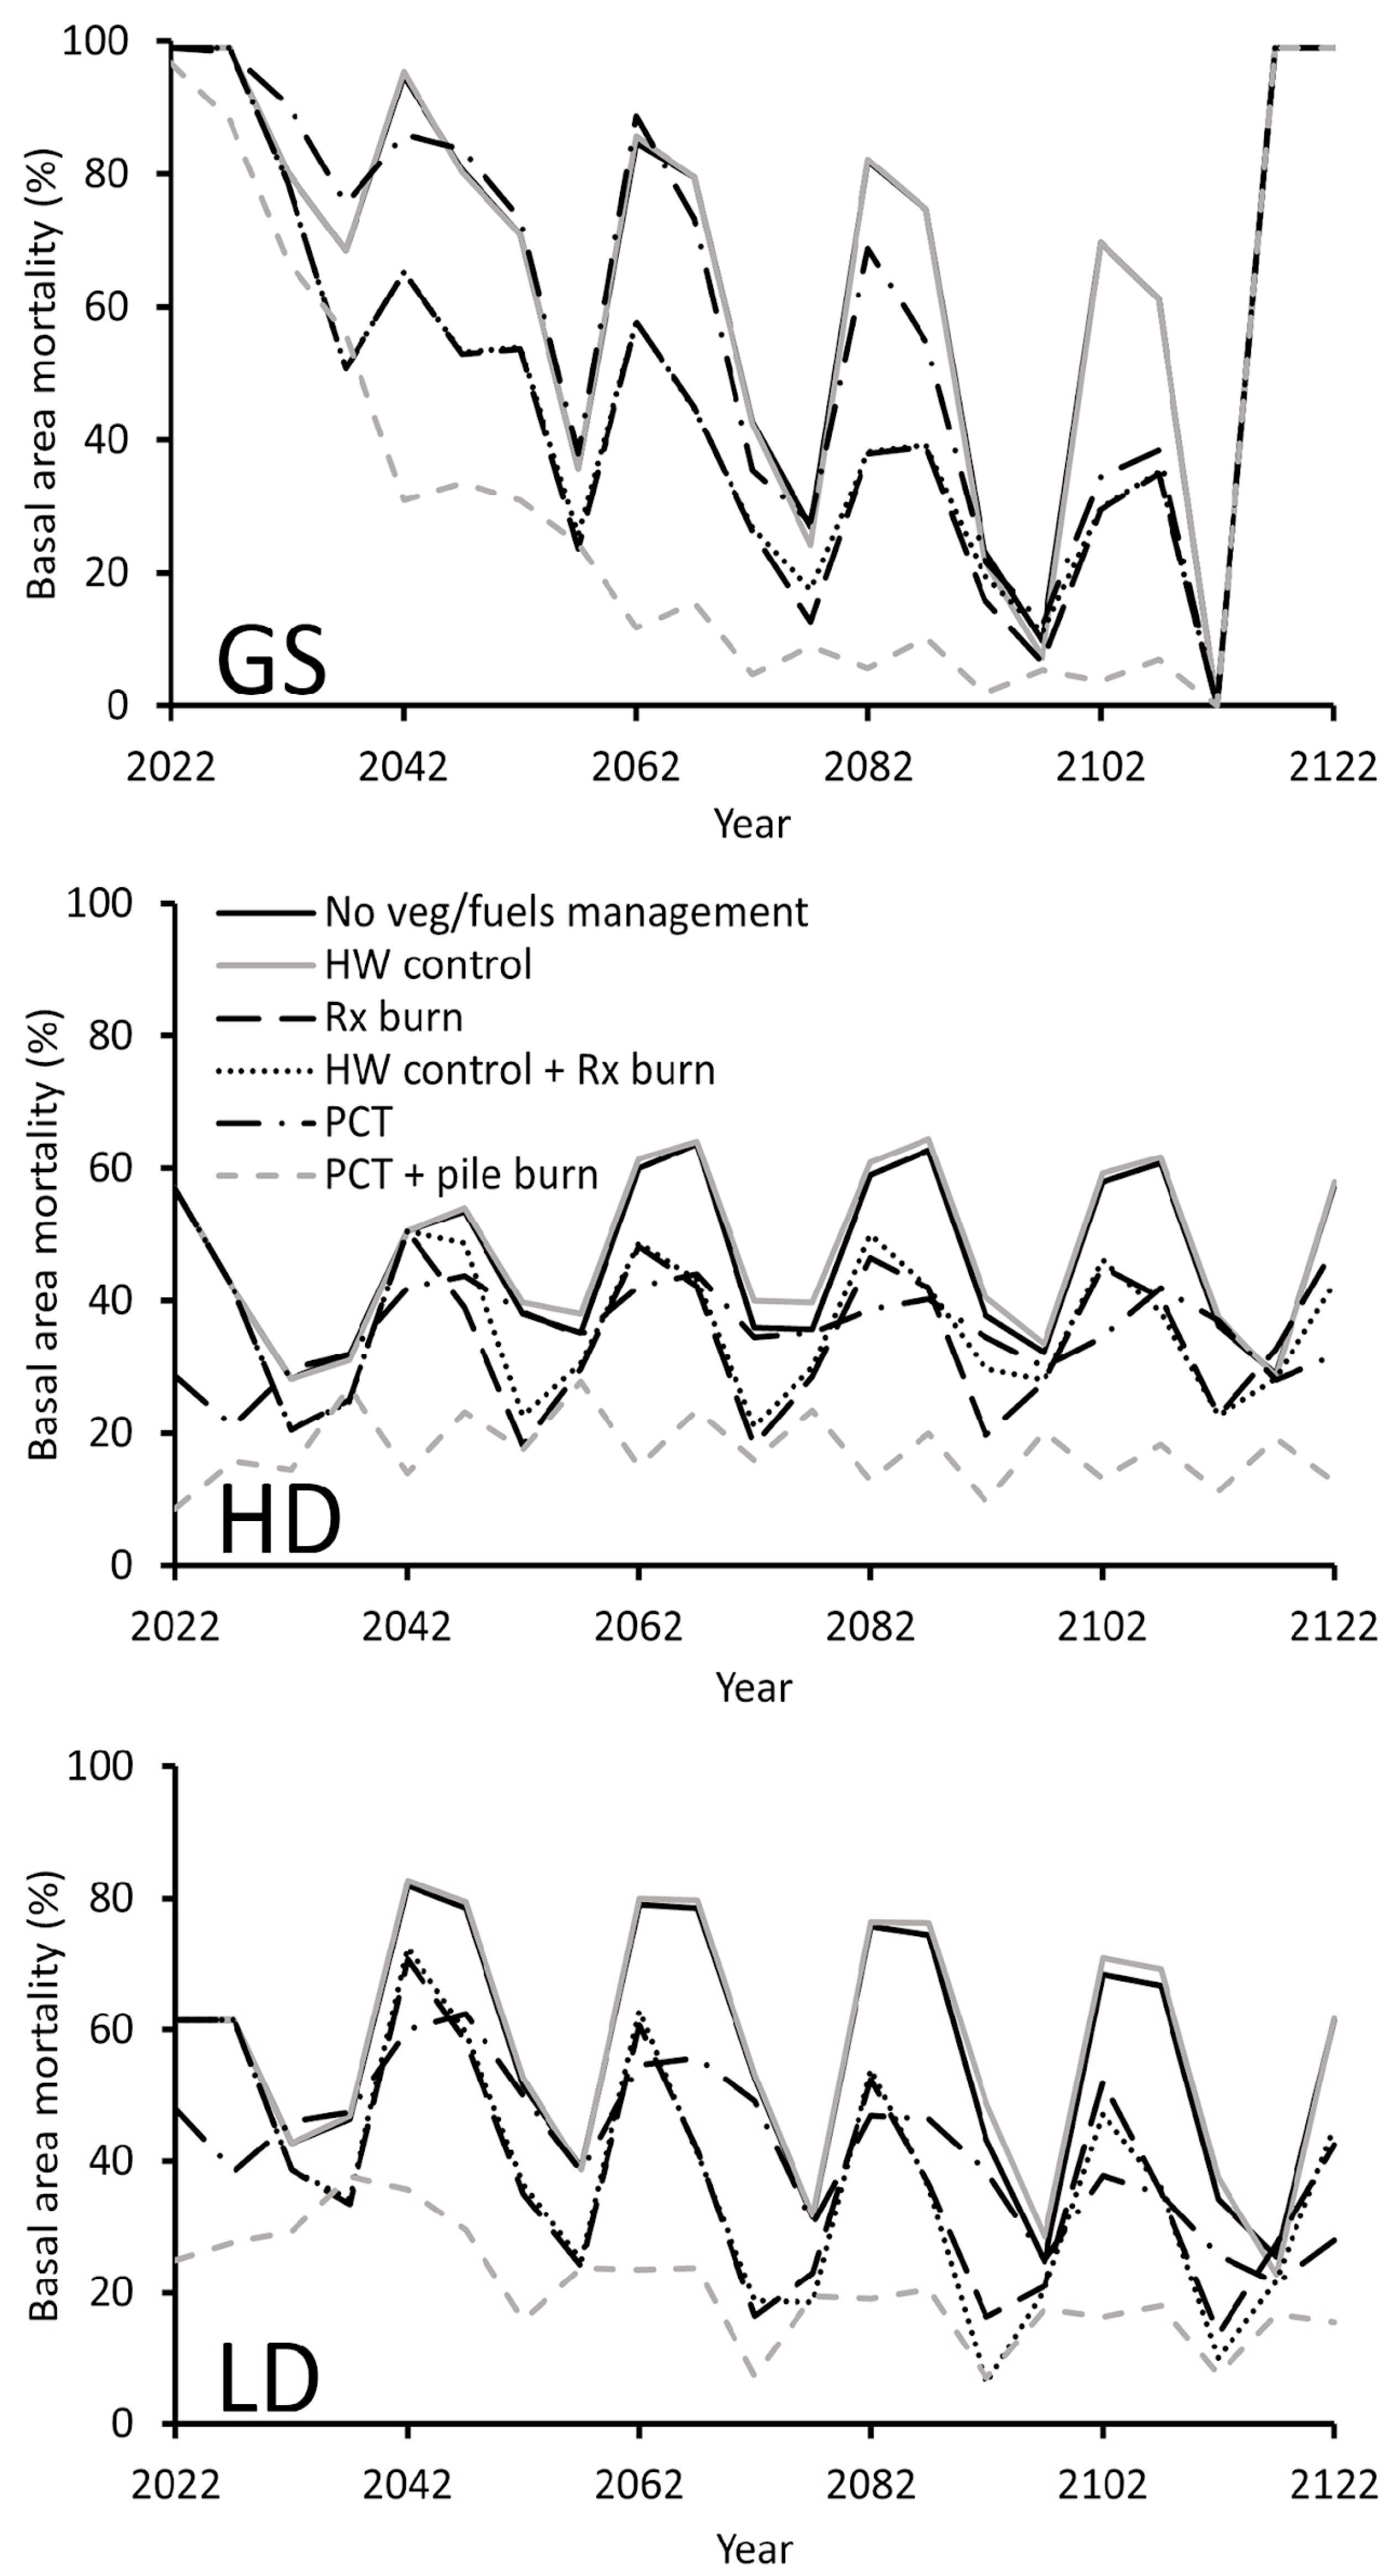
3.2. Tree Mortality from Potential Wildfire

Potential post-fire tree mortality patterns varied across GS, HD, and LD and veg/fuels-trtmt (Figure 4). GS initially had the highest potential post-fire mortality over the years immediately after the initial regeneration harvest in 2012 and the next regeneration harvest 100 years later in 2112. Then GS began exhibiting progressively lower mortality over time between regeneration harvests as successive commercial thinning treatments every 20 years promoted DBH growth and fire resistance. HD and LD generally had lower potential post-fire mortality than GS with fluctuations largely attributed to harvest entries (i.e., every 20 years). However, potential post-fire tree mortality was strongly influenced by the veg/fuels-trtmt simulated. Across GS, HD, and LD, PCT + pile burn resulted in substantially lower potential post-fire tree mortality and tended to be less subject to change associated with 20-year harvest cycles, with the lowest values observed in HD (mean = 17%, SD = 5%). Both HW control and no veg/fuels-trtmt consistently had higher potential post-fire morality across all three harvest prescriptions. PCT resulted in relatively lower mortality rates in HD and LD (e.g., LD with PCT: 42%; LD without PCT: 56%). Likewise, Rx burn alone and HW control + Rx burn had relatively similar levels of predicted post-fire mortality over the 100-year simulation period.

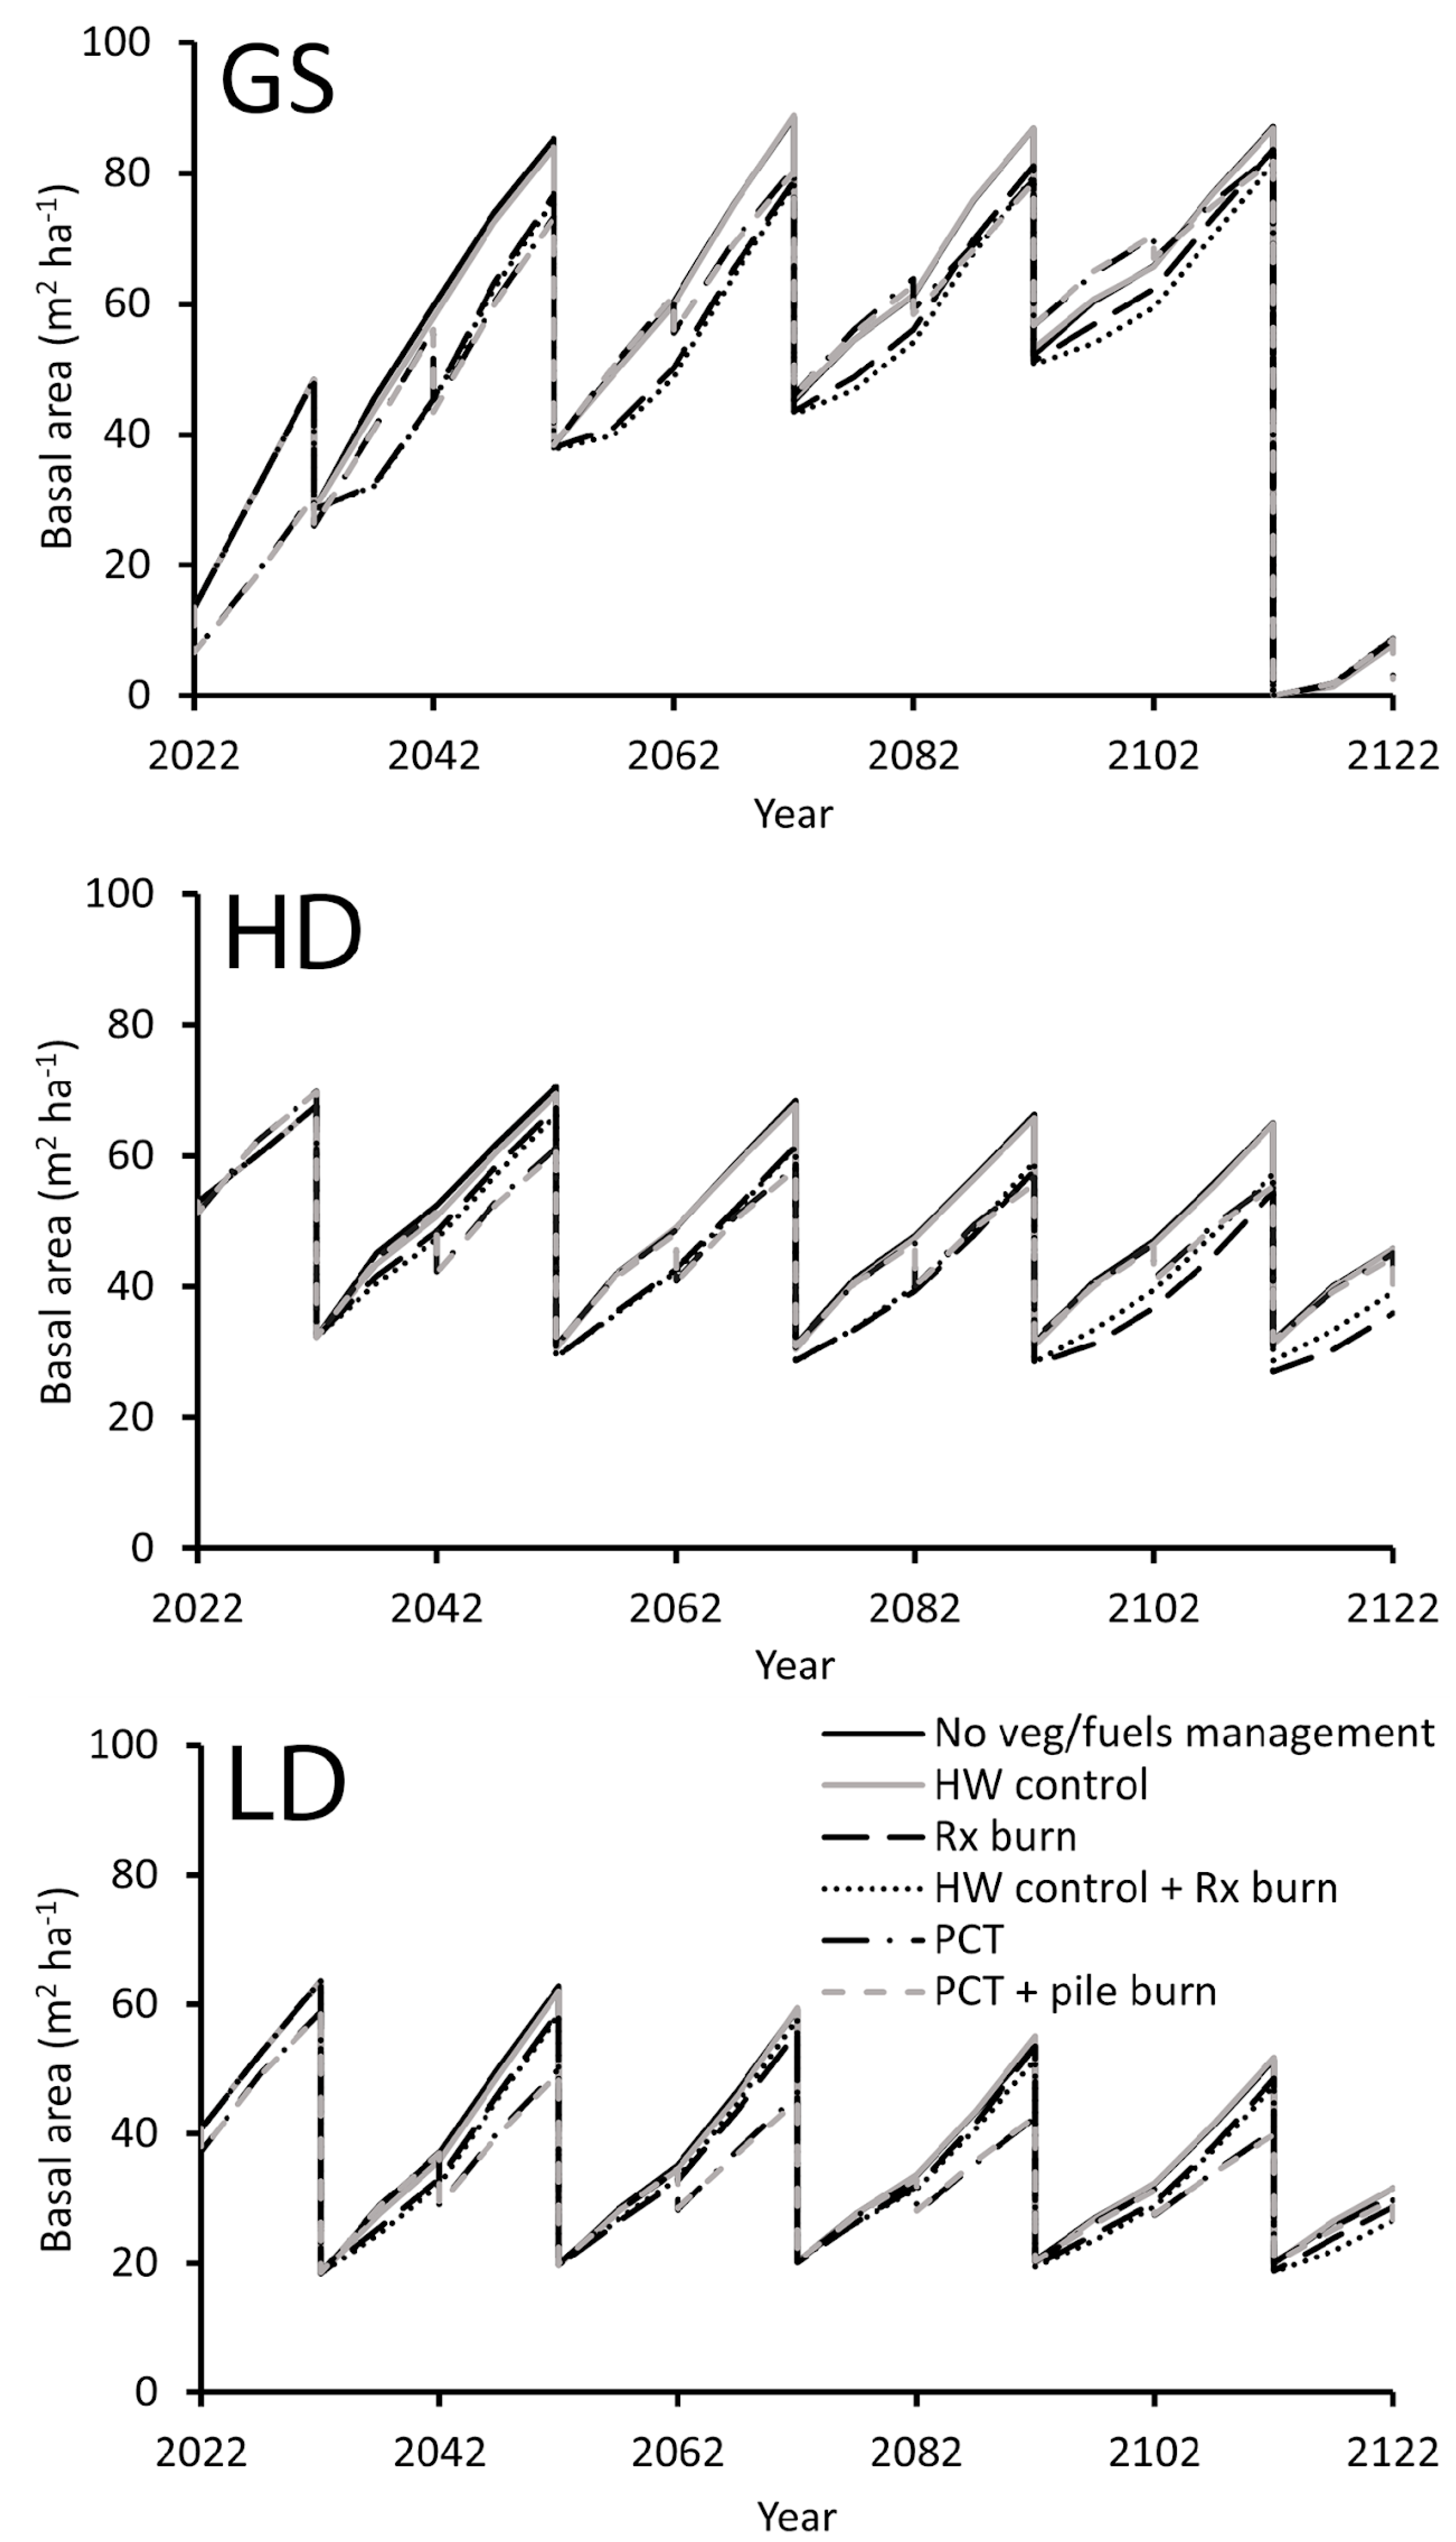
3.3. Growth and Yield

In the early years after the GS harvest that created 1-ha openings, stand basal area was substantially lower due to zero retention in the openings, but the stands soon recovered to carry the highest basal area over time because of the highest level of RD retention at each subsequent harvest entry (commercial thinning to 30% RD; Figure 5). Post-harvest SDI was 667 after GS commercial thinning, 467 after HD harvesting, and 289 after LD harvesting. In terms of basal area, HW control consistently exhibited the same trend as no veg/fuels-trtmt across all harvest prescriptions, with both treatments yielding the highest average basal area over the 100-year simulation. On average, the lowest basal area was predicted for GS with HW control + Rx burn (mean = 45.4 m2 ha−1), HD with Rx burn (43.9 m2 ha−1), and LD with PCT + pile burn (32.9 m2 ha−1). GS had the highest variability in basal area over time, and HD the lowest (SD for GS: 25.0; HD: 10.9; LD: 11.7). On average, HD produced the most harvest volume over 100 years (Table 2); GS had similar results but showed slightly lower harvest volume; LD had the lowest. Across GS, HD, and LD, PCT alone and PCT + pile burn showed slightly higher total harvest volume than no veg/fuel-trtmt.

4. Discussion

To our knowledge, the influence of various fuel/vegetation management options on wildfire risk in multi-aged coast redwood stands has not been previously quantified. Prior studies simply modeled growth and yield in the absence of wildfire or catastrophic disturbance [46]. Multi-aged management offers a solution to managers seeking complexity of forest structure without sacrificing growth and yield [1]. However, the risk and potential damage from wildfires should be considered. Our study identifies multi-aged silviculture approaches with the potential to sustain timber production, while mitigating potential impacts of wildfire.
Our objective of decreasing surface and crown fire potential was met in more aggressive treatments that included a burning component (i.e., Rx burn, HW control + Rx burn, PCT + pile burn). PCT as stand-alone treatment consistently resulted in increased potential fire behavior due to the accumulation of surface fuels that require treatment (e.g., pile and burn). Rx burning reduced wildfire behavior potential, relative to less aggressive management (e.g., no veg/fuels-trtmt, HW control) and paired well with HW control to reduce potential fire damage and promote conifer dominance. However, we found that our simulations with Rx burn were less effective at mitigating wildfire than PCT + pile burn, likely due to the combined benefit of thinning to reduce canopy fuels and consumption of surface fuels through pile burning. Although Rx burn showed the highest fuel loading reduction, surface flame lengths and therefore crown fire potential were most improved after PCT + pile burn, in part due to more favorable changes in CBH and CBD [23].
Our predictions of harvest volume for GS, HD, and LD demonstrate the influence of stand density management, and the influence of each veg/fuels-trtmt, on timber production. GS and HD produced more harvest volume over the course of our 100-year simulation, relative to LD. This finding is consistent with expectations for stands managed at higher RD as reported in other redwood studies [47,48]. Our simulations demonstrated that forest managers have various management options that sustain high levels of stand growth and yield, including PCT with and without pile burn and HW control. Low levels of tree mortality associated with our Rx burn treatments reduced RD and stand growth; these results are consistent with previous research highlighting structural changes following prescribed burning treatments [48].
Each veg/fuels-trtmt option has unique practical and cost considerations. Prolific natural regeneration and rapid growth of young trees in this forest type [32] makes PCT laborious and costly; any further treatment of cut trees such as lopping adds cost, especially when cutting larger trees into smaller pieces, with further effort and cost of manually building burn piles. Permitting and burning of piles requires less planning, permitting, and staffing than prescribed burning. However, prescribed burning alone (i.e., without prior PCT or other treatments to prepare fuels for burning) is likely less costly than PCT with or without subsequent fuels treatments. Despite being the costliest option evaluated here, PCT + pile burn best balances timber production and reduction of potential wildfire behavior. To reduce cost, one could treat less area by restricting implementation to strategic locations such as roadside corridors or property boundaries [49]. It may also be desirable for landowners to PCT progressively as time or budget allow, whereas prescribed burning operations involve economies of scale due to fixed costs of planning, permitting, and minimum staffing levels. The cheapest alternative with some wildfire mitigation benefits is HW control, which shifts species composition in favor of merchantable conifer species and enhances residual conifer tree growth [40,50].
Growth models for coast redwood were only recently added to the FVS system. We noticed that FVS was predicting more rapid tree and stand growth than an alternate model, FORSEE, which is suspected of underpredicting multi-aged stand growth and yield [46]. Another study found FVS to overpredict carbon growth, specifically with the greatest over-prediction reported in the NC variant [51]. Authors have also found FFE-FVS to overpredict fire effects (e.g., fuel consumption, tree mortality) in redwood forests following prescribed fire [52]. Therefore, we recommend validation of the NC variant used in our study with independent growth and yield data for mixed forests on the north coast of California, and validation of FFE-FVS with data on fire behavior and fire effects in these structurally complex mixed stands. We also recommend collecting more data on natural regeneration after selection harvests and commercial thinning to test our assumptions about regeneration after harvesting with and without different combinations of veg/fuels-trtmt. Research is also needed into thinning and burning of hazardous fuels under different climate, topographic, and stand conditions and how these factors interact to alter fuel consumption and residual tree survival.

5. Conclusions

In summary, our simulation study showed that vegetation/fuel management has the potential to mitigate wildfire impacts in multi-aged coast redwood stands and throughout the western US, where destructive wildfires are becoming larger and more frequent [9,53]. Implementing the most effective option for vegetation/fuel management gave greater improvements than any difference between GS, HD, and LD approaches to multi-aged forest management. We interpret this finding as providing forest managers with flexibility to adopt a variety of silvicultural regeneration methods and levels of retention across space and time, provided that attention is paid to vegetation/fuel management at intermediate stages between commercial harvests.

Author Contributions

Conceptualization, J.D.W., K.A.S. and J.-P.B.; methodology, J.D.W., K.A.S., J.-P.B. and J.M.K.; modeling, J.D.W.; writing—original draft preparation, K.A.S. and J.D.W.; writing—review and editing, K.A.S., J.D.W., J.-P.B. and J.M.K.; visualization, J.D.W.; supervision, J.M.K. and J.-P.B.; project administration, funding acquisition, J.-P.B. All authors have read and agreed to the published version of the manuscript.

Funding

Funding for this project was provided by the California Department of Forestry and Fire Protection’s Forest Health Program grant number 8GG20810 as part of the California Climate Investments Program.

Data Availability Statement

The data presented in this study are available on request from the corresponding author.

Acknowledgments

We acknowledge and greatly appreciate ongoing support from CAL FIRE Jackson Demonstration State Forest staff. Jud Fisher provided valuable advice and support with fuel loading and conifer regeneration data. We appreciate the dedicated efforts of our student field assistants: Alan Cooper, Jud Fisher, Destiny Rivera, Aidan Jack Murphy, Ian Blundell, Hanna Upton, and Ally Medina.

Conflicts of Interest

The authors declare no conflicts of interest. The funders had no role in the design of the study; in the collection, analyses, or interpretation of data; in the writing of the manuscript; or in the decision to publish the results.

References

  1. O’Hara, K.L. Multiaged Silviculture: Managing for Complex Forest Stand Structures; Oxford University Press: Oxford, UK, 2014. [Google Scholar]
  2. McCarthy, M.A.; Lindenmayer, D.B. Multi-aged mountain ash forest, wildlife conservation and timber harvesting. For. Ecol. Manag. 1998, 104, 43–56. [Google Scholar] [CrossRef]
  3. Savilaakso, S.; Johansson, A.; Häkkilä, M.; Uusitalo, A.; Sandgren, T.; Mönkkönen, M.; Puttonen, P. What are the effects of even-aged and uneven-aged forest management on boreal forest biodiversity in Fennoscandia and European Russia? A systematic review. Environ. Evid. 2021, 10, 1–38. [Google Scholar] [CrossRef]
  4. Spiecker, H. Silvicultural management in maintaining biodiversity and resistance of forests in Europe—Temperate zone. J. Environ. Manag. 2003, 67, 55–65. [Google Scholar] [CrossRef]
  5. Drever, C.R.; Peterson, G.; Messier, C.; Bergeron, Y.; Flannigan, M. Can forest management based on natural disturbances maintain ecological resilience? Can. J. For. Res. 2006, 36, 2285–2299. [Google Scholar] [CrossRef]
  6. O’Hara, K.L. Multiaged forest stands for protection forests: Concepts and applications. For. Snow Landsc. Res. 2006, 80, 45–55. [Google Scholar]
  7. O’Hara, K.L.; Ramage, B.S. Silviculture in an uncertain world: Utilizing multi-aged management systems to integrate disturbance. Forestry 2013, 86, 401–410. [Google Scholar] [CrossRef]
  8. Ma, Q.; Su, Y.; Niu, C.; Ma, Q.; Hu, T.; Luo, X.; Tai, X.; Qiu, T.; Zhang, Y.; Bales, R.C.; et al. Tree mortality during long-term droughts is lower in structurally complex forest stands. Nat. Commun. 2023, 14, 7467. [Google Scholar] [CrossRef]
  9. Hagmann, R.K.; Hessburg, P.F.; Prichard, S.J.; Povak, N.A.; Brown, P.M.; Fulé, P.Z.; Kerns, B.K.; Lavoie, M.; Landres, P.B.; Long, J.W.; et al. Evidence for widespread changes in the structure, composition, and fire regimes of western North American forests. Ecol. Appl. 2021, 31, e02431. [Google Scholar] [CrossRef]
  10. Steel, Z.L.; Safford, H.D.; Viers, J.H. The fire frequency–severity relationship and the legacy of fire suppression in California forests. Ecosphere 2015, 6, 1–23. [Google Scholar] [CrossRef]
  11. IPCC. Contribution of Working Groups I, II and III to the Sixth Assessment Report of the Intergovernmental Panel on Climate Change. In Climate Change 2023: Synthesis Report; Lee, H., Romero, J., Eds.; IPCC: Geneva, Switzerland, 2023; pp. 35–115. [Google Scholar]
  12. Abatzoglou, J.T.; Williams, A.P. Impact of anthropogenic climate change on wildfire across Western US forests. Proc. Natl. Acad. Sci. USA 2016, 113, 11770–11775. [Google Scholar] [CrossRef]
  13. Westerling, A.L. Increasing western US forest wildfire activity: Sensitivity to changes in the timing of spring. Philos. Trans. R. Soc. B 2016, 371, 20150178. [Google Scholar] [CrossRef] [PubMed]
  14. Stephens, S.L. Forest fire causes and extent on United States Forest Service lands. Int. J. Wildland Fire 2005, 14, 213–222. [Google Scholar] [CrossRef]
  15. Miller, J.D.; Safford, H.D.; Crimmins, M.; Thode, A.E. Quantitative evidence for increasing forest fire severity in the Sierra Nevada and southern Cascade Mountains, California and Nevada, USA. Ecosystems 2009, 12, 16–32. [Google Scholar] [CrossRef]
  16. Fettig, C.J.; Reid, M.L.; Bentz, B.J.; Sevanto, S.; Spittlehouse, D.L.; Wang, T. Changing climates, changing forests: A western North American perspective. J. For. 2013, 111, 214–228. [Google Scholar] [CrossRef]
  17. Parks, S.A.; Abatzoglou, J.T. Warmer and drier fire seasons contribute to increases in area burned at high severity in western US forests from 1985 to 2017. Geophys. Res. Lett. 2020, 47, e2020GL089858. [Google Scholar] [CrossRef]
  18. Brown, P.M.; Swetnam, T.W. A cross-dated fire history from coast redwood near Redwood National Park, California. Can. J. For. Res. 1994, 24, 21–31. [Google Scholar] [CrossRef]
  19. Varner, J.M.; Jules, E.S. The Enigmatic Fire Regime of Coast Redwood Forests and Why It Matters; USDA Gen. Tech. Rep. PSW-GTR-258: Albany, CA, USA, 2017; pp. 15–18. [Google Scholar]
  20. Jacobs, D.F.; Cole, D.W.; McBride, J.R. Fire history and perpetuation of natural coast redwood ecosystems. J. For. 1985, 83, 494–497. [Google Scholar] [CrossRef]
  21. Brown, P.M.; Baxter, W.T. Fire history in coast redwood forests of the Mendocino Coast, California. Fire Ecol. 2003, 9, 2–16. [Google Scholar]
  22. Lorimer, C.G.; Porter, D.J.; Madej, M.A.; Stuart, J.D.; Veirs, S.D., Jr.; Norman, S.P.; O’Hara, K.L.; Libby, W.J. Presettlement and modern disturbance regimes in coast redwood forests: Implications for the conservation of old-growth stands. For. Ecol. Manag. 2009, 258, 1038–1054. [Google Scholar] [CrossRef]
  23. Agee, J.K.; Skinner, C.N. Basic principles of forest fuel reduction treatments. For. Ecol. Manag. 2005, 211, 83–96. [Google Scholar] [CrossRef]
  24. Noss, R.F. The Redwood Forest; Island Press: Washington, DC, USA, 2000. [Google Scholar]
  25. Muma, R.; Webb, L.W.; Zald, H.S.J.; Boston, K.; Dagley, C.M.; Berrill, J.-P. Dynamics of stump sprout regeneration after transformation to multiaged management in coast redwood forests. For. Ecol. Manag. 2022, 515, 120236. [Google Scholar] [CrossRef]
  26. Keyes, C.R.; Varner, J.M. Pitfalls in the Silvicultural Treatment of Canopy Fuels. Fire Manag. Today 2006, 66, 46–50. [Google Scholar]
  27. Sugihara, N.G. (Ed.) Fire in California’s Ecosystems; University of California Press: Berkeley, CA, USA, 2006. [Google Scholar] [CrossRef]
  28. Baines, P.G. Physical mechanisms for the propagation of surface fires. Math. Comput. Model. 1990, 13, 83–94. [Google Scholar] [CrossRef]
  29. Keane, R.E. Wildland Fuel Fundamentals and Applications; Springer International Publishing: Cham, Switzerland, 2015. [Google Scholar] [CrossRef]
  30. Martinson, E.J.; Omi, P.N. Performance of fuel treatments subjected to wildfires. In Proceedings of the Fire, Fuel Treatments, and Ecological Restoration Conference, Fort Collins, CO, USA, 16–18 April 2002. [Google Scholar]
  31. Scott, J.H.; Reinhardt, E.D. Assessing Crown Fire Potential by Linking Models of Surface and Crown Fire Behavior; RMRS-RP-29; USDA Forest Service, Rocky Mountain Research Station: Fort Collins, CO, USA, 2001; 59p. [Google Scholar]
  32. Berrill, J.P.; O’Hara, K.L. Simulating multiaged coast redwood stand development: Interactions between regeneration, structure, and productivity. West. J. Appl. For. 2009, 24, 24–32. [Google Scholar] [CrossRef]
  33. Caratti, J.; Duncan, C.; Keane, E.; Key, C.; Benson, C.; Sutherland, S.; Gangi, J. FIREMON: Fire Effects Monitoring and Inventory System; USDA Gen. Tech. Rep. RMRS-GTR-164-CD; U.S. Department of Agriculture, Forest Service, Rocky Mountain Research Statio: Fort Collins, CO, USA, 2006; 15p.
  34. Krumland, B.; Eng, H. Site Index Systems For Major Young-Growth Forest and Woodland Species in North California; Calif. For. Report No.4; California Department of Forestry & Fire Protection: Monterey, CA, USA, 2005; pp. 1–220. [Google Scholar]
  35. FVS Staff. Klamath Mountains (NC) Variant Overview—Forest Vegetation Simulator; Revised 3 April 2023; USDA Internal Rep.: Fort Collins, CO, USA, 2008; 65p. [Google Scholar]
  36. Crookston, N.L. Climate-FVS Version 2: Content, Users Guide, Applications, and Behavior. In USDA Forest Service—General Technical Report RMRS-GTR; Department of Agriculture, Forest Service, Rocky Mountain Research Station: Fort Collins, CO, USA, 2014; pp. 1–38. [Google Scholar]
  37. Rebain, S.A.; Reinhardt, E.; Crookston, N.L.; Beukema, S.J.; Kurz, W.A.; Greenough, J.A.; Robinson, D.C.E.; Lutes, D.C. The Fire and Fuels Extension to the Forest Vegetation Simulator: Updated Model Documentation (Internal Report); U.S. Department of Agriculture, Forest Service, Forest Management Service Center: Lancaster, CA, USA, 2022. [Google Scholar]
  38. Ritchie, M.W.; Berrill, J.-P. Precommercial thinning in California forests. In Reforestation Practices for Conifers in California; Stewart, W., Ed.; Forest Vegetation Management Conference: Redding, CA, USA, 2020; Chapter 10. [Google Scholar]
  39. O’Hara, K.L.; Gersonde, R.F. Stocking control concepts in uneven-aged silviculture. Forestry 2004, 77, 131–143. [Google Scholar] [CrossRef]
  40. Berrill, J.-P.; Webb, L.A.; DeYoung, K.L.; Dagley, C.M.; Bodle, C.G.; Simpson, S.M. Development of redwood regeneration after conifer partial harvest and hardwood management. For. Sci. 2020, 67, 72–82. [Google Scholar] [CrossRef]
  41. Heinsch, F.A.; Andrews, P.L. BehavePlus Fire Modeling System, Version 5.0: Design and Features; General Technical Report; RMRS-GTR-249; USDA, Forest Service Rocky Mountain Research Station: Fort Collins, CO, USA, 2010. [Google Scholar]
  42. Anderson, H.E. Aids to Determining Fuel Models for Estimating Fire Behavior; General Technical Report INT-GTR-122; U.S. Department of Agriculture, Forest Service, Intermountain Forest and Range Experiment Station: Rocky Mountain Research Station: Ogden, UT, USA, 1982. [Google Scholar]
  43. Rothermel, R.C. A Mathematical Model for Predicting Fire Spread in Wildland Fuels; Research Paper INT-115; USDA Forest Service, Intermountain Forest and Range Experiment Station: Ogden, UT, USA, 1972. [Google Scholar]
  44. Andrews, P.L. Modeling Wind Adjustment Factor and Midflame Wind Speed for Rothermel’s Surface Fire Spread Model; General Technical Report; RMRS-GTR-266; USDA Forest Service, Rocky Mountain Research Station: Fort Collins, CO, USA, 2012; pp. 1–39. [Google Scholar]
  45. Reinhardt, E.D.; Keane, R.E.; Brown, J.K. First Order Fire Effects Model: FOFEM 4.0 User’s Guide INT-GTR-344 US Department of Agriculture; Forest Service, Intermountain Research Station: Ogden, UT, USA, 1997. [Google Scholar]
  46. Berrill, J.P.; Han, H.S. Carbon, harvest yields, and residues from restoration in a mixed forest on California’s coast range. For. Sci. 2017, 63, 128–135. [Google Scholar] [CrossRef]
  47. Oliver, W.W.; Lindquist, J.L.; Strothmann, R.O. Young-growth redwood stands respond well to various thinning intensities. West. J. Appl. For. 1994, 9, 106–112. [Google Scholar] [CrossRef]
  48. van Mantgem, P.J.; Stephenson, N.L.; Knapp, E.; Battles, J.; Keeley, J.E. Long-term effects of prescribed fire on mixed conifer forest structure in the Sierra Nevada, California. For. Ecol. Manag. 2011, 261, 989–994. [Google Scholar] [CrossRef]
  49. Ager, A.A.; Finney, M.A.; Kerns, B.K.; Maffei, H. Modeling wildfire risk to northern spotted owl (Strix occidentalis caurina) habitat in Central Oregon, USA. For. Ecol. Manag. 2007, 246, 45–56. [Google Scholar] [CrossRef]
  50. Berrill, J.-P.; Howe, R.A. Multiaged redwood responds well to partial harvest and herbicide treatments. Can. J. For. Res. 2019, 49, 1425–1433. [Google Scholar] [CrossRef]
  51. Herbert, C.; Fried, J.S.; Butsic, V. Validation of Forest Vegetation Simulator model finds overprediction of carbon growth in California. Forests 2023, 14, 604. [Google Scholar] [CrossRef]
  52. Katuna, T.A.; Collins, B.M.; Stephens, S.L. Prescribed fires effects on actual and modeled fuel loads and forest structure in southern coast redwood (Sequoia sempervirens) forests. Fire Ecol. 2024, 20, 100. [Google Scholar] [CrossRef]
  53. Prichard, S.J.; Hessburg, P.F.; Hagmann, R.K.; Povak, N.A.; Dobrowski, S.Z.; Hurteau, M.D.; Kane, V.R.; Keane, R.E.; Kobziar, L.N.; Kolden, C.A.; et al. Adapting western North American forests to climate change and wildfires: 10 common questions. Ecol. Appl. 2021, 31, e02433. [Google Scholar] [CrossRef]
Figure 1. Location of plots in different selection silviculture treatment areas within the four replicate sites on Jackson Demonstration State Forest (JDSF): Camp 6, Waldo North, Waldo South, and South Whiskey.
Forests 16 01000 g001
Figure 2. FFE-FVS keywords for harvest prescriptions (GS, HD, and LD) and either: no veg/fuels-trtmt (1); HW control (1 + 2); Rx burn (1 + 3); HW control + Rx burn (1 + 2 + 3); PCT (1 + 4); or PCT + pile burn (1 + 4 + 5). * = FFE keywords that were used at every 5-year model time step for every scenario. ** = GS only; *** = HD/LD only. Arrows give order of operations for keywords applied in same year.
Forests 16 01000 g002
Figure 3. Average potential wildfire parameters under 98th percentile (severe) weather conditions over 100-year simulation. Error bars show variation over time in terms of standard deviation among 5-year model time steps.
Forests 16 01000 g003
Figure 4. Predicted post-fire tree mortality (% based on basal area) for three harvest prescriptions (GS, HD, and LD) and six vegetation/fuel management treatments under 98th percentile (severe) fire weather conditions. Note: similar values cause lines to overlap in GS for no veg/fuel management and HW control.
Forests 16 01000 g004
Figure 5. Stand basal area over a 100-year simulation for group selection (GS), single-tree selection with high-density retention (HD), and low-density retention (LD) with and without vegetation/fuel management.
Forests 16 01000 g005
Table 1. 100-year summary of fuel loading and canopy parameters.
SilvicultureFuel Loading
(tons ha−1)
Canopy Characteristics
Harvest PrescriptionVegetation/Fuel ManagementLitterFWDCWDLive HerbsLive ShrubsTotal SurfaceCBH
(m)
CBD
(kg m−3)
GSnone6.142.845.40.540.98126.56.01.19
HW control5.842.245.90.541.00125.86.01.20
Rx burn3.714.230.40.540.9660.16.41.07
HW control + Rx burn3.614.231.50.540.9561.36.11.08
PCT5.946.950.60.541.17136.06.80.69
PCT + pile burn5.721.111.70.541.1765.57.10.68
HDnone7.843.648.60.550.79142.213.50.38
HW control7.243.252.00.550.81144.513.50.39
Rx burn4.913.830.80.550.7164.713.80.37
HW control + Rx burn4.813.531.60.550.7465.013.90.37
PCT6.748.654.50.540.81151.617.00.26
PCT + pile burn6.520.911.40.540.8173.717.30.25
LDnone6.240.232.00.591.20113.510.30.61
HW control6.040.435.00.591.23116.510.40.61
Rx burn3.711.618.40.591.2046.69.80.62
HW control + Rx burn3.511.620.10.591.2448.211.30.61
PCT5.142.537.00.611.52119.613.20.28
PCT + pile burn4.818.18.20.611.5460.513.50.27
Note: All values are means from every 5-year model time step (2022–2122). FWD = fine woody debris (<1000-h); CWD = coarse woody debris (≥1000-h); CBH = canopy base height; CBD = canopy bulk density.
Table 2. Volume summary of 100-year simulation.
Harvest PrescriptionVegetation/Fuel Management100-Year Harvest Volume (m3 ha−1)Standing Volume at Year 100 (m3 ha−1)
GSnone5221-
HW control5270-
Rx burn4201-
HW control + Rx burn3960-
PCT5309-
PCT + pile burn5299-
HDnone51462051
HW control51481897
Rx burn46891420
HW control + Rx burn46461536
PCT52652033
PCT + pile burn52132076
LDnone40011162
HW control39791152
Rx burn3687992
HW control + Rx burn3604965
PCT40161172
PCT + pile burn40941149
Note: Harvest volume = sum of volume harvested (≥20 cm DBH) at every entry from 2022–2122; standing volume = total volume of live trees (≥20 cm DBH) before any 2122 management.
Disclaimer/Publisher’s Note: The statements, opinions and data contained in all publications are solely those of the individual author(s) and contributor(s) and not of MDPI and/or the editor(s). MDPI and/or the editor(s) disclaim responsibility for any injury to people or property resulting from any ideas, methods, instructions or products referred to in the content.

