Article

Stem Profile Estimation of Pinus densiflora in Korea Using Machine Learning Models: Towards Precision Forestry

1
Division of Forest Management Research, National Institute of Forest Science, Seoul 02455, Republic of Korea
2
Forestland Policy Research Center, Korea Forest Conservation Association, Daejeon 35262, Republic of Korea
*
Authors to whom correspondence should be addressed.
Forests 2025, 16(5), 840; https://doi.org/10.3390/f16050840
Submission received: 24 April 2025 / Revised: 12 May 2025 / Accepted: 16 May 2025 / Published: 19 May 2025
(This article belongs to the Section Forest Inventory, Modeling and Remote Sensing)

Abstract

:
The stem taper function is essential in predicting diameter outside bark (DOB) variations along the tree height, contributing to volume estimation, harvest planning, and precision forestry. Traditional taper models, such as the Kozak function, offer interpretability but often fail to capture nonlinear growth dynamics and regional variability, particularly in the upper stem segments. This study aimed to evaluate and compare the prediction accuracy of conventional and machine learning-based taper models using Pinus densiflora, a representative conifer species in Korea. Field data from two ecologically distinct regions (Gangwon and Central Korea) were used to build and test four models: the Kozak taper function, random forest, extreme gradient boosting, and an artificial neural network (ANN). Model performance was assessed using the RMSE, R2, and MAE, along with stem profile visualizations for representative trees. The results showed that the ANN consistently achieved the highest prediction accuracy across both regions, particularly at an upper crown zone relative height (RH) > 0.8, while maintaining smooth and stable taper curves. In contrast, the Kozak model tended to underestimate the diameter of the upper stem. This study demonstrates that machine learning models, particularly ANNs, can effectively enhance the taper prediction precision and serve as practical tools for data-driven forest management and the implementation of precision forestry in Korea.

1. Introduction

The stem taper curve is a mathematical function that estimates the diameter changes along the stem from the diameter at breast height (DBH) to total height (TH). It serves as a fundamental tool in forest measurement and decision-making and supports tasks such as tree volume estimation, harvesting planning, yield prediction, and carbon stock assessment [1,2]. Recently, taper curves have become increasingly important as a foundational technology for the implementation of precision forestry through the construction of high-resolution digital forest inventories. In particular, taper-based volume estimation plays a crucial role in calculating national forest statistics in South Korea through the National Forest Inventory, making it a practically significant component.
Various equations have been developed to estimate the stem volume. Early models typically adopted simple exponential or linear forms, which can be insufficient to capture structural differences across stem sections, such as the base, middle, and upper portions. To address these limitations, a range of advanced models have been proposed, including the segmented taper equation introduced by Max and Burkhart [3], which divides the stem into neiloid, paraboloid, and conic sections [4,5]. Although the DBH and TH are relatively easy to measure and estimate, the shape of a tree stem is influenced by the complex interplay among factors such as the species, soil type, altitude, climate, and forest management practices. The variability introduced by these factors makes establishing a universal model challenging [6,7,8,9].
Classical taper functions, particularly Kozak’s (1988) variable exponent model, have been widely adopted in Korea [5]. These models are based on the empirical validation of specific species and regions, making them practical tools for operational forestry [10,11,12,13]. However, traditional models have inherent limitations in their fixed functional forms, which make it difficult to fully account for nonlinear growth responses among species, site-specific conditions, and diverse stem architectures [14,15,16,17,18]. This is particularly evident in the upper portions of the stem (RH > 0.8), where data collection is more challenging and the variability in growth characteristics is high, often leading to decreased prediction accuracy.
To overcome these limitations, recent international studies have explored machine learning-based regression models, such as random forest (RF), extreme gradient boosting (XGBoost), and artificial neural networks (ANNs), to enhance the precision of taper curve estimation [15,19,20,21,22,23]. Recent studies have also demonstrated the potential of deep learning and fuzzy inference systems in modeling forest dynamics under complex ecological conditions. For example, Habeeb and Mustafa [24] applied ensemble deep learning to predict forest cover changes under climate scenarios, and Abdullah [25] proposed probabilistic fuzzy frameworks for decision modeling in uncertain environments. These approaches highlight the growing trend of integrating flexible modeling strategies into forestry applications. Machine learning models such as artificial neural networks (ANNs) and extreme gradient boosting (XGBoost) have been widely applied beyond taper modeling, particularly in the estimation of forest biophysical variables such as the aboveground biomass and canopy structure. For example, Luo [26] successfully integrated multiple ML models, including XGBoost, to enhance the biomass prediction accuracy in subtropical forests, while Li [27] employed interpretable ML techniques to estimate the aboveground biomass in bamboo-dominated ecosystems. These applications support the adaptability and generalizability of ANNs and XGBoost in diverse forestry contexts.
These models have gained attention as promising alternatives because of their ability to learn complex nonlinear relationships from multidimensional input variables and generate more flexible taper curves [28,29,30,31]. However, in Korea, the application of machine learning to taper modeling remains extremely limited, and empirical studies reflecting species characteristics and regional growth environments remain scarce [16,17].
To address this research gap, the present study evaluated and compared the predictive performance of a traditional tapered model and machine learning-based regression models for Pinus densiflora, the most widely distributed coniferous species in Korea. This study utilized data from two distinct regions, Gangwon and Central Korea, to assess the regional adaptability and precision of each model. This research contributes to the literature by integrating emerging modeling technologies into the Korean context of forest measurement, and it is expected to serve as a foundational reference in advancing digital forest management and the national forest information system.

2. Materials and Methods

2.1. Sample Description

This study used field data collected from P. densiflora trees distributed across South Korea. Sampled trees were selected using a stratified random sampling method based on DBH classes to ensure nationwide representativeness (Figure 1).
In Korea, P. densiflora exhibits distinct growth characteristics depending on the regional geographic and climatic conditions. Operationally, this species is categorized into two provenance types: the Gangwon and central regions [32,33]. The Gangwon provenance includes trees grown in the high-altitude regions of Gangwon Province and northern North Gyeongsang Province (e.g., Yeongyang, Uljin, Bonghwa, and Yeongju) [33]. These trees experience cool, wet climates, which leads to slow growth, straight stems, and superior wood quality. Consequently, they have been traditionally used as high-grade timber. In contrast, the central provenance includes trees found in Gyeonggi, Chungcheong, and the southern inland regions of North Gyeongsang Province. Compared with trees from Gangwon, these trees generally grow in warmer, drier climates and have faster growth rates, thus making them well suited for general sawn timber and ornamental use owing to their high productivity.
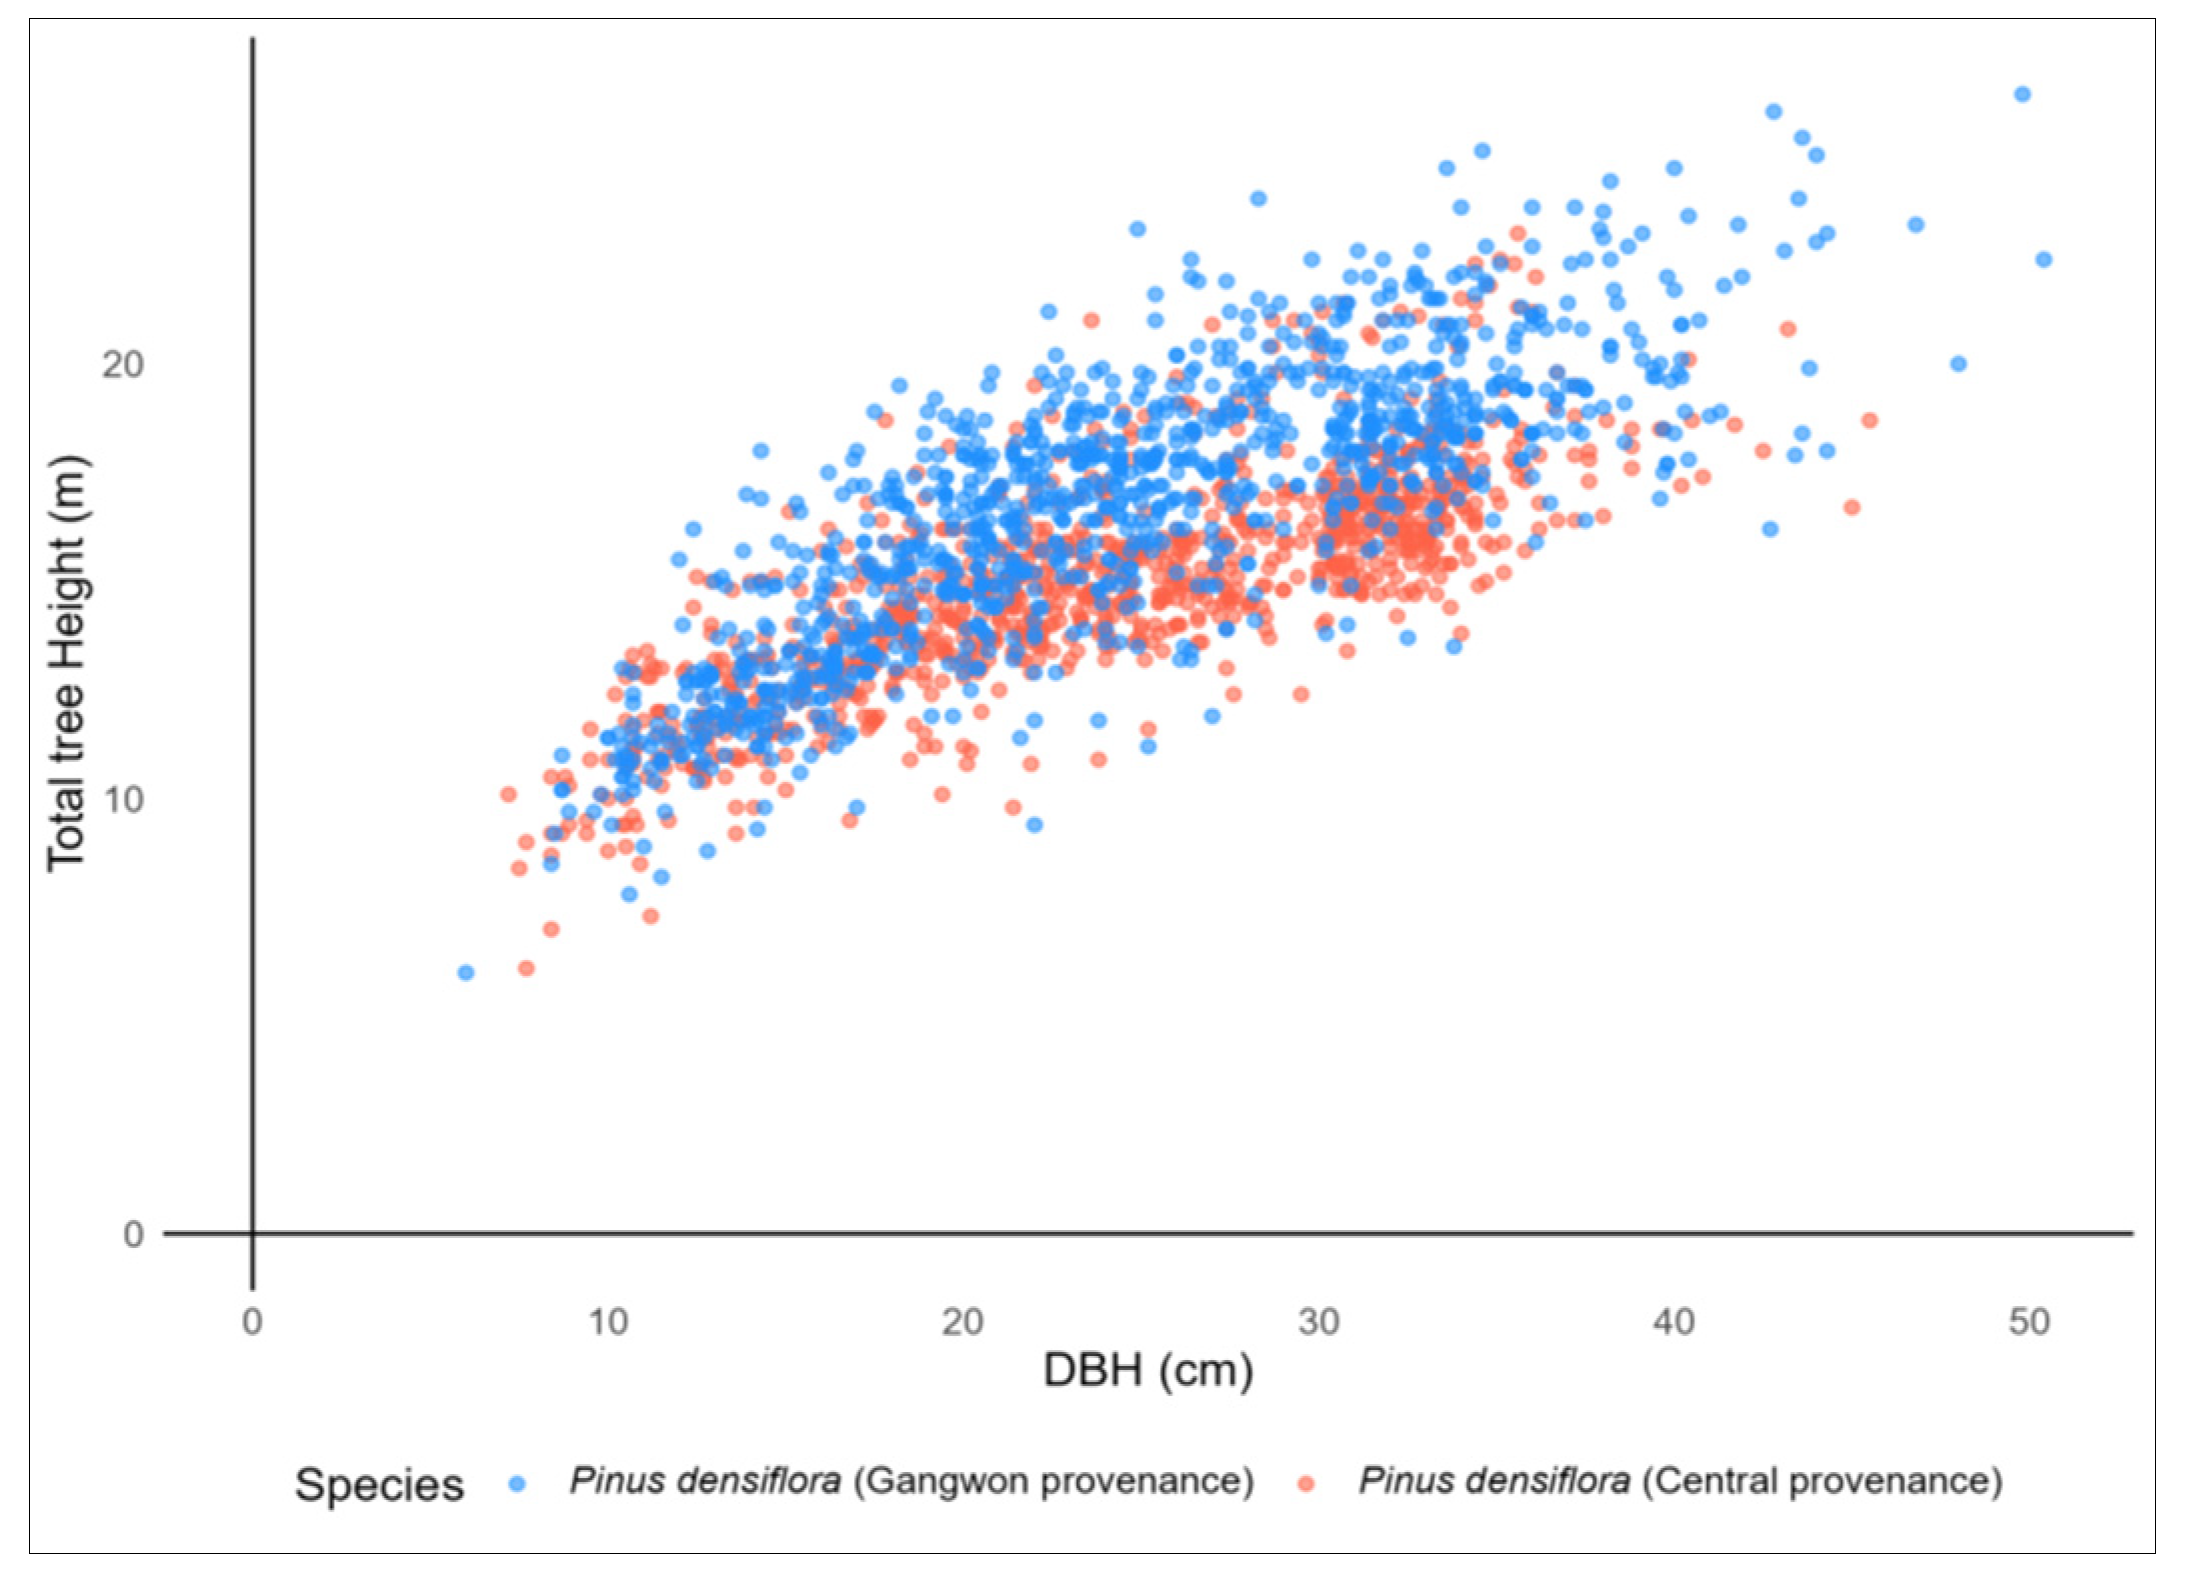
A total of 2197 trees were sampled—1155 individuals from the Gangwon provenance and 1042 from the central provenance. The stem from each tree was measured after harvest. The total tree height (TH) was recorded from the ground to the highest point of the crown using a measuring tape; the stem diameters were measured with a diameter tape at stump height (0.2 m), breast height (1.2 m), and at 2 m intervals along the stem. In cases where 2 m intervals were not feasible near the top, measurements were taken at 1 m intervals. Descriptive statistics for both provenances are presented in Table 1 and Figure 2.

2.2. Variable Exponent-Based Model

In advanced forestry countries such as the United States and Canada, stem taper-based estimation techniques are widely used to estimate the tree volume, without the need for felling. In Korea, volume tables have been developed for 13 major tree species [5,33], and, among the various available models, the variable exponent taper equation developed by Kozak (1988) [5] has been recognized as one of the most suitable for taper curve estimation [13,14]. Accordingly, this model was adopted in the present study to estimate the stem taper of Pinus densiflora (Table 2).
In this study, the diameter outside the bark (DOB) was measured, as opposed to the diameter inside the bark (DIB), which Kozak’s original model was developed to predict. Although this deviates from the model’s original assumptions, previous studies have shown that the DOB and DIB generally exhibit a linear relationship, allowing the Kozak taper model to be reasonably applied for DOB prediction [34,35]. To maintain consistency with the current national forest inventory practices in South Korea, the DOB was used across all models. Previous studies [36,37] have demonstrated strong linear relationships between the DOB and DIB in conifer species, supporting the use of DOB-based taper modeling—particularly when bark thickness adjustment is impractical under field conditions. This approach also ensured a fair and objective comparison between the traditional Kozak taper function and machine learning models under consistent input configurations.
Unlike the previous common method of sectional integration [3], the Kozak model directly integrates the taper curve, providing higher explanatory power and enabling accurate estimation with fewer inflection points. Moreover, its flexibility in adjusting the diameters at the merchantable top and butt ends renders it highly practical for the estimation of merchantable volumes [38].
The variable exponent taper model allows the stem to be characterized into distinct sections—neiloid, paraboloid, and conic—and dynamically captures their transitions along the stem height. Compared with simple or segmented equations, this model offers superior continuity and predictive accuracy in representing the stem shape [39]. However, it is also statistically complex and presents certain challenges in rearranging stem height data according to the given diameters and in the interpretation process.

2.3. Machine Learning-Based Models

In addition to the traditional taper model, this study developed predictive models for stem diameter estimation using machine learning techniques. Three algorithms were employed, RF, XGBoost, and an ANN, all of which are well suited for the modeling of complex nonlinear relationships [19,20,21].
The input variables used to train the models included the stem height from the ground (H), DBH, TH, and relative height (RH = H/TH). The target variable was the stem diameter (D) at the corresponding height. These variables were selected to match those used in the Kozak taper function, allowing for a fair comparison of traditional and machine learning models under equivalent input conditions. Although additional variables such as the stand age or crown ratio may improve the prediction accuracy, they were excluded to maintain consistency with the current national modeling practices.
RF performs individual predictions using an ensemble of decision trees and outputs the averaged result. It also provides insights into the importance of the variables. XGBoost is a boosting technique that iteratively improves the model performance by correcting errors from previous rounds, and it includes regularization mechanisms that help to mitigate overfitting. The RF model was implemented using the randomForest package with 500 trees (ntree = 500) and the default settings for mtry. For the XGBoost model, the xgboost package was used with 200 boosting rounds (nrounds = 200) and the squared error loss function (objective = “reg:squarederror”), while other parameters were left at their default values. These hyperparameters were selected based on preliminary testing and reflect commonly used settings in forestry applications. The ANN model was implemented using the nnet package in R with a single hidden layer comprising 10 neurons. The hidden layer used the logistic (sigmoid) activation function, while the output layer was set to be linear (linout = TRUE) to suit the regression task. All input variables were standardized using z-score normalization based on the training dataset. The model was trained via backpropagation with a maximum of 2000 iterations and a weight decay parameter of 0.01 to prevent overfitting. These hyperparameters were selected based on preliminary testing for convergence and stability.
All models were trained and evaluated by splitting the dataset into training (70%), validation (15%), and test (15%) subsets. The predictive performance was assessed using three metrics: the root mean square error (RMSE), mean absolute error (MAE), and coefficient of determination (R2).

2.4. Performance Evaluation of Prediction Models

To compare the performance of the machine learning-based models with that of the traditional taper model, each provenance-specific dataset was divided into training (70%), validation (15%), and test (15%) subsets. The evaluation focused on three metrics: the root mean square error (RMSE), mean absolute error (MAE), and coefficient of determination (R2) (Table 3). To ensure statistical independence across the subsets, the split was conducted at the individual tree level using unique tree IDs, such that all records from a given tree were assigned to only one subset. A fixed random seed was used to ensure reproducibility, and cross-verification confirmed that no tree ID was duplicated across the training, validation, or test sets.
The RMSE represents the square root of the mean of the squared differences between the predicted and observed values. It shares the same unit as the target variable and is sensitive to large errors, making it useful in identifying major deviations. The MAE, which is the mean of the absolute differences between the predicted and observed values, is less affected by outliers and provides an intuitive measure of the average prediction accuracy. The R2 indicates the proportion of variance in the observed data as explained by the model. Values closer to 1 suggest stronger explanatory power, and values above 0.7 are generally considered acceptable in forest modeling applications [6,9,14,15,40].
Each model was trained independently for each provenance, and the performance metrics were calculated using predictions from the test datasets. These metrics were then compared across the models to assess their relative performance.
While these statistical indicators provide a useful overview of the model accuracy, they do not reveal potential biases, such as systematic over- or underestimation across diameter ranges. To address this, residual plots were generated to visualize the distribution of residuals across the relative heights or predicted diameters. This enabled an additional analysis of model bias and estimation distortion.
All machine learning models were developed and evaluated using the R statistical software (version 4.3.2). The model was implemented using the randomForest (RF), xgboost (XGBoost), and nnet (ANN) packages. The caret package was used for model training and validation, and ggplot2 was used for visualization.

2.5. Stem Taper Estimation and Visualization

Stem taper curves were reconstructed based on the diameter predictions (D) at various stem heights (H) generated by the models. For each individual tree, stem heights were assigned at regular intervals—from 0.2 m aboveground to the TH—typically at 2 m intervals, with 1 m intervals applied near the treetop. The diameter at each height was predicted using the corresponding model.
The input variables for both the traditional and machine learning models were standardized to include the DBH, TH, H, and relative height (RH = H/TH). Using the predicted diameters, taper curves were constructed by ordering the values according to the stem height and connecting them sequentially, thereby visualizing the taper profile of each tree.
To facilitate model comparison, representative trees were selected and used to visualize the average or typical taper curves by provenance. These curves were used to illustrate the differences in the stem form predictions among the models.

3. Results and Discussion

3.1. Variable Exponent-Based Model Validation

The stem taper parameters of P. densiflora in the Gangwon and central provenances were estimated using the variable exponent model developed by Kozak (1988) [5]. The regression analysis based on Kozak’s model yielded high coefficients of determination (R2) for the Gangwon and central provenances (0.9874 and 0.9885, respectively), indicating a strong model fit (Table 4). The root mean square errors (RMSE) were 1.1013 and 1.0391 cm, respectively, suggesting satisfactory prediction accuracy.
In Kozak’s model, a fixed inflection point (P) must be defined to account for the curve transition along the stem. In this study, the inflection point was set to 0.3, and the model parameters were estimated accordingly. The inflection point typically represents the transition zone where the stem form shifts from a neiloid to a paraboloid shape and is generally determined based on the distribution of diameters along the stem.
The inflection point selected in this study aligns with the findings of previous research conducted in Korea. For example, inflection points of 0.25 and 0.22 were reported for Quercus acuta in Wando and Jeju, respectively, and 0.20 and 0.22 for Cryptomeria japonica in Jeju and the Seogwipo Experimental Forest, respectively [7,15,38,40,41,42]. It is also noted that the inflection points may vary by region within the same species. Other studies have reported similar inflection points for Pinus (0.25), Picea (0.3), and Populus (0.2) [17] species. Therefore, the value used in this study is consistent with the ranges reported in the literature and is considered a reliable reference for the representation of stable stem form transitions.
The predicted DOB using Kozak’s (1988) [5] taper equation for P. densiflora in both the Gangwon and central provenances was similar to that of the observed values (Figure 3). Most data points were densely distributed around the 1:1 reference line, indicating high overall prediction accuracy. In addition, 95% prediction intervals are visualized in Figure 3 to provide a graphical representation of the model’s uncertainty. Similarly to previous studies, the Kozak (1988) [5] model in this study yielded high R2 values exceeding 0.98, particularly for coniferous species with relatively uniform bole shapes. Valverde [43] also reported high goodness of fit (Adj-R2 = 0.986) for Kozak-type taper equations when applied to genetically improved Eucalyptus under contrasting irrigation regimes, suggesting that a high R2 is not necessarily indicative of overfitting but can reflect the model’s ability to capture stem shape regularity under certain species or management conditions.
The residuals were symmetrically distributed around zero across the full range of RH. The differences between the predicted and observed values were minimal for lower stem sections (RH < 0.2). However, in the upper crown zone (RH > 0.8), the model tended to slightly overestimate the stem diameters, with this pattern being more pronounced in the central provenance.
This overestimation may be attributed to variations in the crown growth characteristics, measurement uncertainties, or inherent limitations in the generalizability of the taper equation. To improve the prediction reliability in the upper stem region, future studies may consider incorporating crown zone correction factors or additional parameters that account for regional or structural variability.

3.2. Comparison of Machine Learning Models’ Performance

The performance evaluation of the machine learning-based stem diameter prediction models is presented in Table 5. Across both the central and Gangwon provenances, the ANN consistently demonstrated the best predictive performance, achieving the lowest values for both the RMSE and MAE. In the central region, the ANN model achieved RMSE, R2, and MAE values of 1.616 cm, 0.974, and 1.147 cm, respectively (Table 5). Similarly, in the Gangwon region, the ANN showed the highest accuracy, with an RMSE, R, and MAE of 1.584 cm, 0.976, and 1.125 cm, respectively. These results suggest that the ANN model effectively captures the complex nonlinear structure of the stem profiles owing to its superior function approximation capabilities.
In contrast, the RF and XGBoost models showed comparable performance and maintained high levels of explanatory power in both regions, with R2 values exceeding 0.96. When comparing the prediction performance between the two regions for the same model, the Gangwon provenance generally exhibited lower RMSE and MAE values than the central provenance (Table 5). This may be due to the more homogeneous growth conditions and lower variability in stem form in the Gangwon region, which may have facilitated more effective model training and prediction.
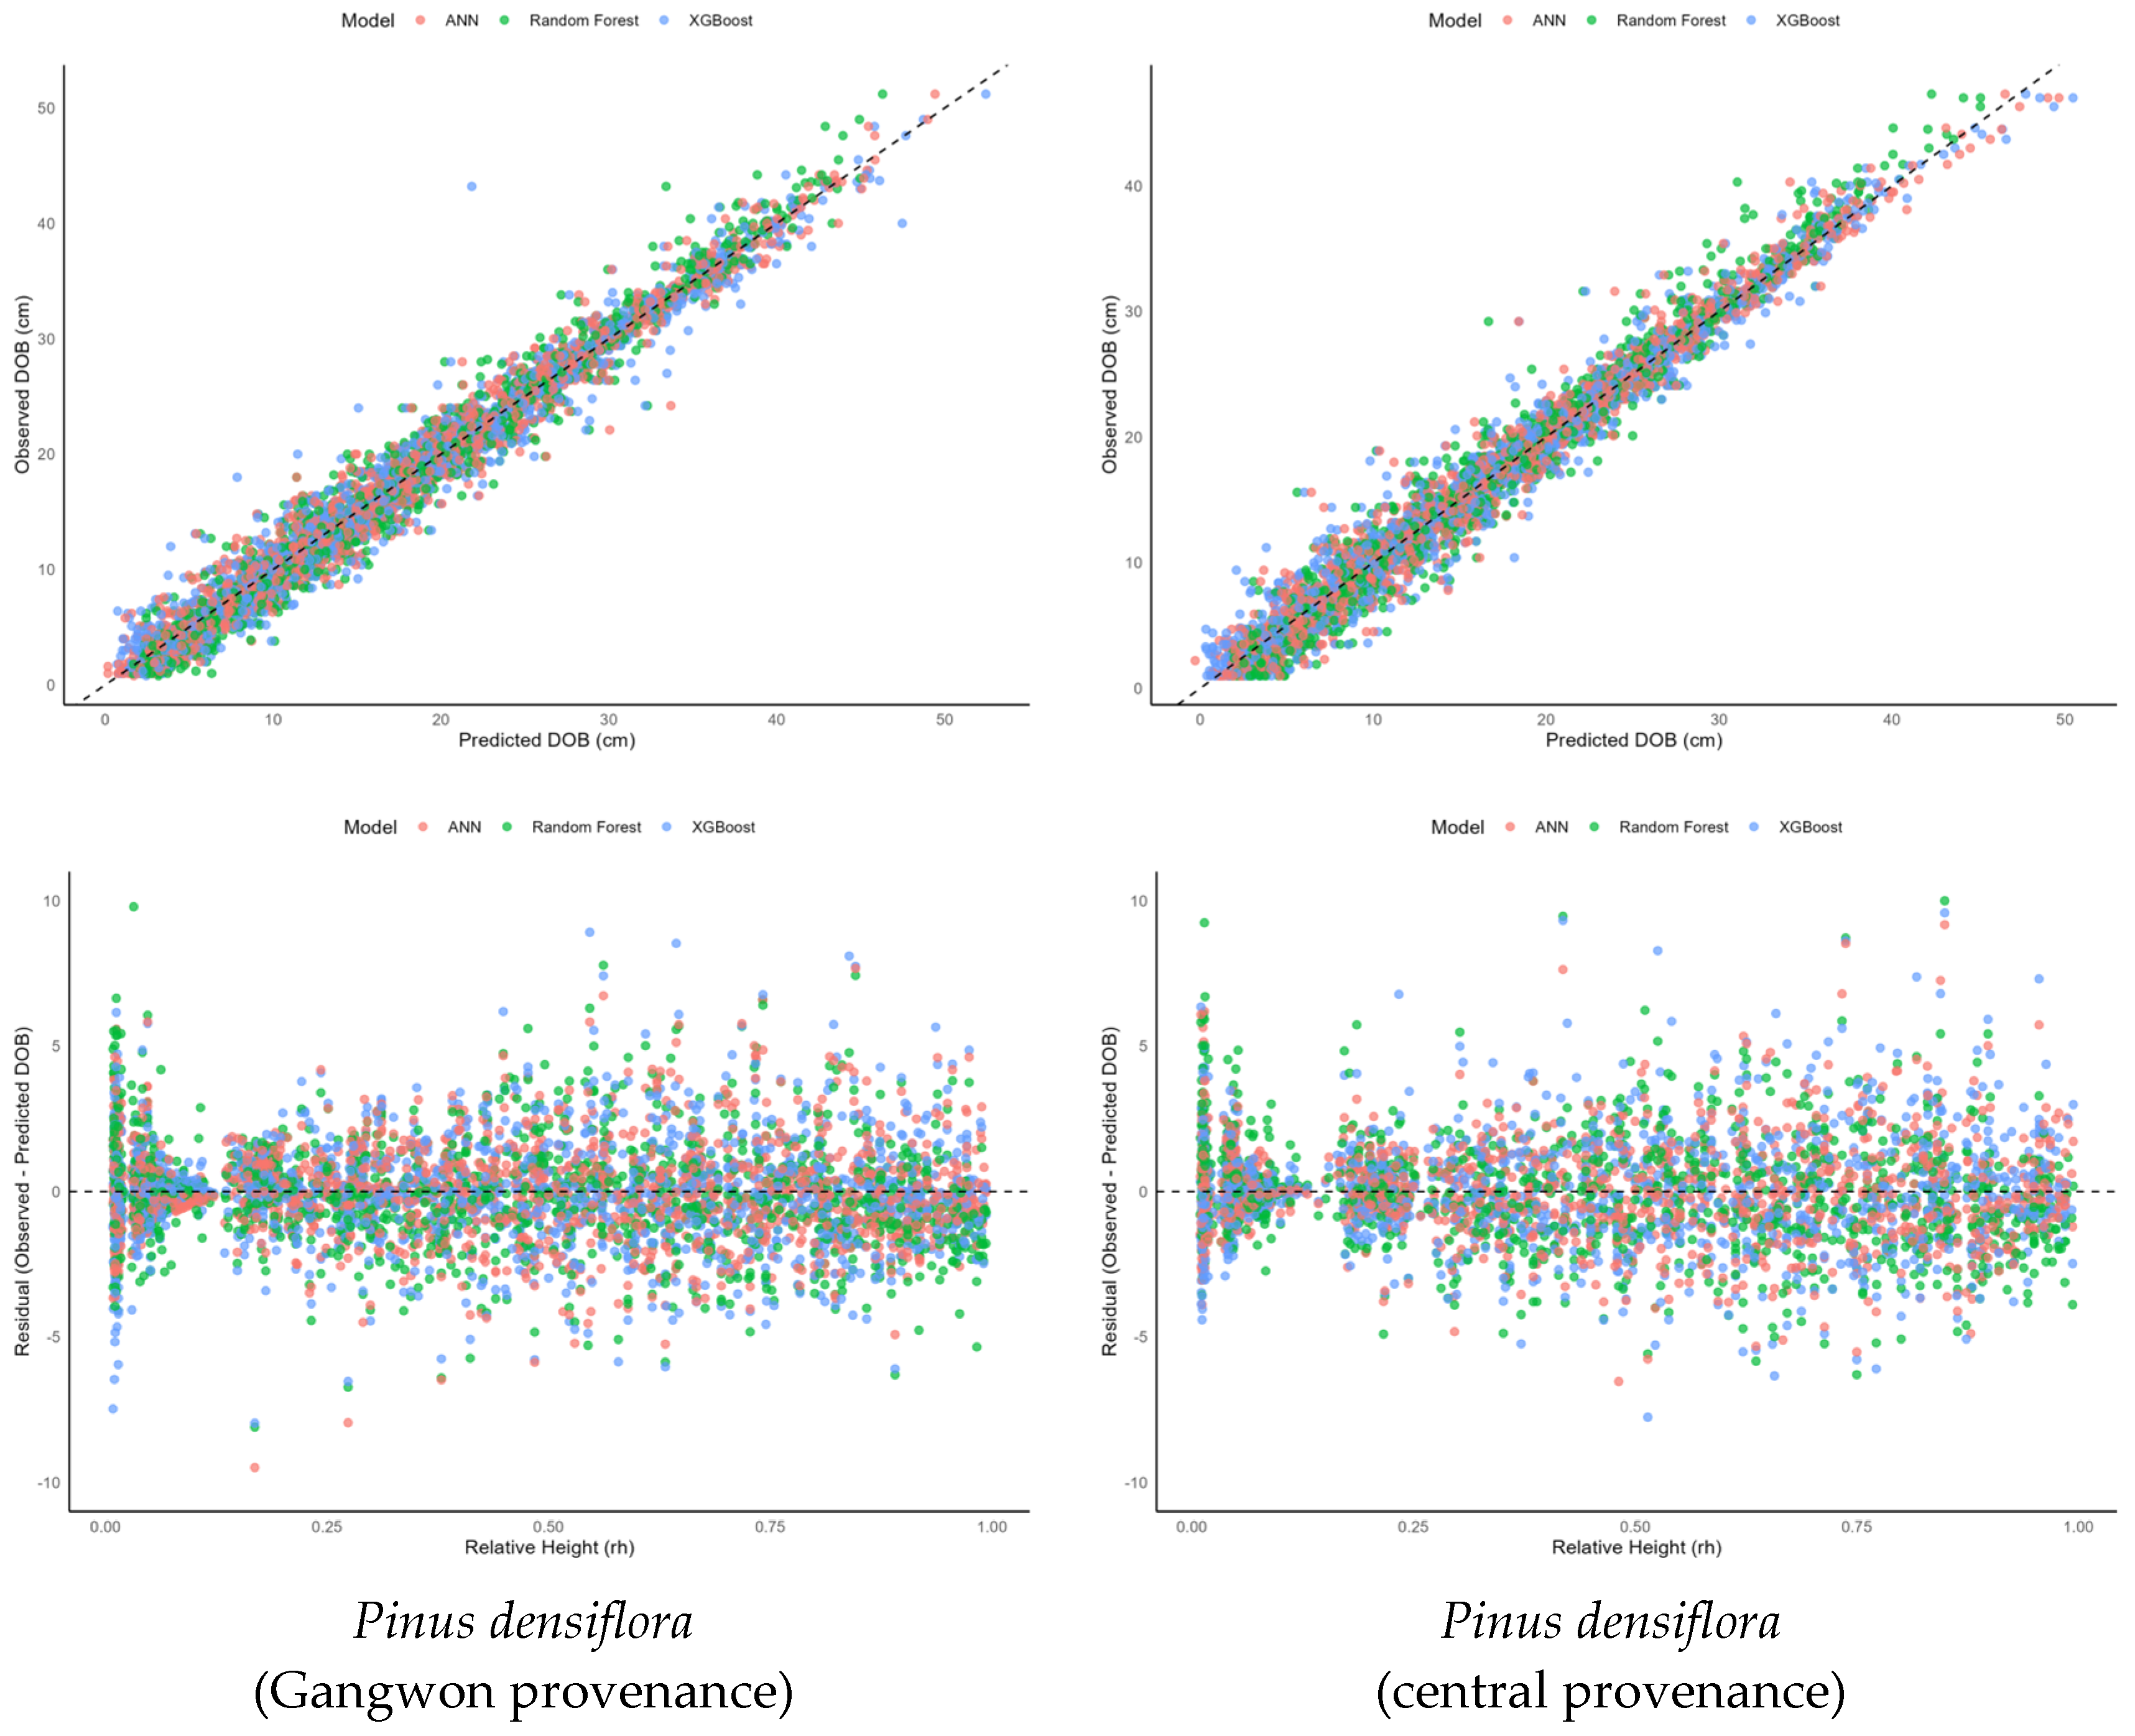
To visually assess the predictive performance of the machine learning models, the observed and predicted diameters, as well as the residual distributions by provenance, were compared (Figure 4). The scatter plots in the upper panels illustrate the relationship between the observed and predicted DOBs. All three models showed data points closely aligned along the 1:1 reference line (y = x), indicating high predictive precision. Notably, the ANN model exhibited the tightest clustering and minimal dispersion around the diagonal line for both the Gangwon and central provenances, visually corroborating its superior numerical performance.
The lower panels display the residuals plotted against the RH, allowing the evaluation of the prediction stability along the stem profile. For all models, the residuals were relatively evenly distributed around zero across the entire RH range, with no substantial bias detected in the upper stem zone (RH > 0.8). In particular, the ANN model demonstrated the most stable residual distribution in the upper stem region, suggesting that its use of RH as an input variable, in combination with its nonlinear learning structure, effectively captured variations in the upper crown morphology.
Previous studies have reported difficulties in accurately modeling the upper stem. For example, Sharma and Zhang [44] and Sharma [45] improved lower stem predictions using nonlinear regression and mixed-effects models yet continued to observe over- or underestimation in the upper crown region. In contrast, the ANN model in this study maintained stable prediction accuracy even beyond RH = 0.8, highlighting its capacity to learn and represent complex taper patterns through nonlinear modeling. Similar findings have been reported previously. For example, a study on Nothofagus spp. in Chile demonstrated that an ANN outperformed traditional taper equations, achieving lower RMSE values and higher predictive accuracy across the full stem profile [46]. Consistent with that study, the present results confirm that the ANN effectively captures the variability in the upper crown taper and provides robust predictions, even in structurally complex regions of the stem. To assess whether the observed performance differences among the models were statistically significant, we conducted pairwise comparisons of the absolute prediction errors using the Wilcoxon signed-rank test. The results showed that the ANN model significantly outperformed both RF and XGBoost in both the Gangwon and central regions (p < 0.05), whereas the difference between RF and XGBoost was not statistically significant in either region. These findings reinforce the reliability of the ANN model’s superior performance. A summary of the test statistics is presented in Table 6.

3.3. Visualization and Interpretation of Stem Taper Curves

To evaluate the predicted stem taper curves, representative trees were selected from each provenance based on the DBH classes: small, medium, and large. The predicted taper curves generated by the Kozak model and the three machine learning models, visualized as functions of the RH, are presented in Figure 5.
All models exhibited a typical tapered pattern, in which the stem diameter gradually decreased with increasing relative heights. In the lower and middle portions of the stem (RH ≤ 0.8), the differences between the models were relatively small. However, in the upper stem zone (RH > 0.8), the variations in the slopes of the predicted curves became more pronounced, revealing differences in predictive stability across the models.
The ANN model produced smooth and continuous taper curves throughout the stem. Notably, it maintained a stable tapered form in the upper crown region without a sharp decrease in diameter. For small-diameter trees, the ANN also tended to slightly underpredict the diameters compared to the other models. The RF model showed similar predictions to the ANN in the lower stem (RH < 0.5) but more irregular patterns or steeper tapering in the upper regions. In the medium and large DBH classes, the RF predictions resembled those of the Kozak model. XGBoost showed overall trends similar to those of RF but tended to slightly overpredict the diameters in medium and large trees compared to the ANN. Although XGBoost maintained a relatively smooth taper in the upper stems, abrupt changes in the slope were observed in some segments.
By contrast, the Kozak model produced relatively monotonic taper curves and showed a clear trend of diameter underestimation in the upper stem. This was particularly evident in large-diameter trees, where the predictions increasingly underestimated the diameter as the relative height increased, resulting in the reduced accuracy and continuity of the taper curve (Figure 5).
In terms of the regional comparison, trees from Gangwon provenance exhibited more uniform taper patterns across all models, forming consistent and gentle curves. Conversely, the central provenance showed greater variability among individual trees, particularly in the small DBH class, where discrepancies among the models were more pronounced. This likely reflects differences in site conditions and DBH–height structural heterogeneity between the two regions.
These results suggest that the ANN model provided the most stable and continuous taper curves across the entire stem profile. Its robustness in the upper stem, which is traditionally a challenging zone for taper estimation, demonstrates its potential as a practical tool in precision forestry. However, while the Kozak model is useful for general stem form estimation owing to its functional simplicity, its predictive capacity is limited to the upper crown and irregular stem structures. Although this study demonstrated high predictive performance for Pinus densiflora in Korea, the applicability of the models to other species or regions may be limited. This is because the input variables were restricted to stem form attributes such as the DBH, TH, and RH, without accounting for species-specific traits, climate conditions, soil characteristics, or the stand density. Therefore, care should be taken in extrapolating these results to different forest types, and further studies are needed to validate the model’s transferability across diverse ecological conditions.
These findings are consistent with those of previous studies. For example, a study on Crimean pine compared the Max–Burkhart taper equation with an ANN and found that the ANN yielded lower prediction errors [23]. This study highlights the advantages of ANNs in approximating nonlinear functions and adapting to complex stem forms. Similarly, the present study demonstrates that ANNs effectively address the limitations of traditional taper equations, particularly in the upper stem region. In addition, a recent study applying XGBoost to P. nigra in Europe reported that XGBoost achieved the lowest prediction error based on Furnival’s index, outperforming both RF and ANNs [22]. Although the ANN was the top-performing model in the present study, XGBoost also showed high explanatory power and comparable performance to RF. These results imply that the relative performance of the models may vary depending on the species and stem structure, suggesting the need for further comparative studies under diverse ecological conditions.
Overall, this comparison confirms that machine learning-based stem taper estimation is a powerful alternative to traditional models. Notably, the ANN maintained stable predictive accuracy even in the upper stem region, where the diameter variability was high and predictions were inherently difficult. The fact that high precision was achieved using a simple set of input variables (DBH, TH, and RH) highlights its practical utility in real-world forest management applications. Despite these strengths, the upper stem zone (RH > 0.8) remains a challenging area for all models due to structural irregularity within the crown zone and the limited number of explanatory variables. Prior studies have addressed this issue by incorporating crown-related attributes into taper models. For instance, Sharma and Zhang [44] introduced crown length-based correction terms into variable-exponent taper equations, resulting in an improved fit in the upper stem region. Although such modifications were beyond the scope of the current study, they offer a promising direction in terms of enhancing the model’s robustness and accuracy in crown-dominated stem sections.

4. Conclusions

This study compared a traditional stem taper equation (Kozak, 1988) [5] with machine learning-based regression models, namely RF, XGBoost, and an ANN, to improve the accuracy of stem profile estimation for P. densiflora. The predictive performance of the models was evaluated separately for the Gangwon and central provenances, which reflect regional differences in the growing conditions in Korea. Model comparisons were conducted based on statistical metrics (RMSE, R2, and MAE) and graphical analyses of the stem taper curves.
Among the machine learning models, the ANN demonstrated the highest predictive accuracy and exhibited stable taper curves, particularly in the upper stem sections (RH >0.8). This result suggests that the nonlinear learning structure of the ANN effectively captured complex variation patterns in the stem diameter. In contrast, the Kozak model, although advantageous in its traditional functional form, tended to underestimate the diameters of the upper stem regions owing to excessive tapering.
Regionally, the Gangwon provenance showed more uniform stem forms and lower variability in model predictions than the central provenance. These differences can be attributed to the distinct growing environments and inter-tree variability.
By incorporating machine learning techniques into stem taper modeling, this study demonstrates improvements in the diameter estimation accuracy, which may serve as a technical foundation for more advanced forestry applications such as volume estimation and digital inventories.
Rather than proposing immediate operational implementation, the aim of this study was to provide a methodological benchmark aimed at improving individual tree volume predictions through data-driven taper estimation. Accurate taper modeling is a critical step towards implementing precision forestry practices in measurement and management.
Future research should focus on improving the model generalizability and applicability by diversifying the target species, incorporating additional input variables (e.g., LiDAR metrics and crown width), and integrating time-series data for dynamic growth prediction. Furthermore, to enhance the model robustness across diverse forestry contexts, external validation and transferability testing should be conducted in future studies. This is especially important when applying the models to different species or structurally heterogeneous environments. Deep learning-based approaches have shown strong adaptability in such contexts, particularly in semi-arid regions, as in Habeeb and Mustafa [24], which supports the broader applicability of the present findings. In particular, terrestrial laser scanning (TLS) offers a promising non-destructive method of capturing detailed stem profiles and may further enhance the operational scalability of machine learning-based taper modeling.

Author Contributions

Conceptualization, C.K. and M.L.; methodology, C.K.; software, C.K. and M.L.; validation, C.K. and J.K.; formal analysis, C.K.; investigation, C.K.; resources, C.K. and H.W.; data curation, C.K. and M.L.; writing—original draft preparation, C.K.; writing—review and editing, C.K. and Y.S.; visualization, C.K.; supervision, J.K.; project administration, C.K.; funding acquisition, C.K. All authors have read and agreed to the published version of the manuscript.

Funding

This research was funded by the National Institute of Forest Science, grant number FM0300-2024-01-2025.

Data Availability Statement

The original contributions presented in this study are included in the article. Further inquiries can be directed to the corresponding authors.

Conflicts of Interest

The authors declare no conflicts of interest.

Abbreviations

The following abbreviations are used in this manuscript:
RFRandom Forest
XGBoosteXtreme Gradient Boosting
ANNArtificial Neural Network

References

  1. Kang, J.T.; Son, Y.-M.; Kim, S.W.; Park, H.; Hwang, J.S. Development of Local Stem Volume Table for Larix kaempferi Using Kozak’s Stem Taper Model. J. Agric. Life Sci. 2014, 48, 119–131. [Google Scholar] [CrossRef]
  2. Tewari, V.P.; Kumar, V.S.K. Construction and Validation of Tree Volume Functions for Dalbergia sissoo Grown under Irrigated Conditions in the Hot Desert of India. J. Trop. For. Sci. 2001, 13, 503–511. [Google Scholar]
  3. Max, T.A.; Burkhart, H.E. Segmented polynomial regression applied to taper equations. For. Sci. 1976, 22, 283–289. [Google Scholar] [CrossRef]
  4. Hjelm, B. Taper and Volume Equations for Poplar Trees Growing on Farmland in Sweden. Licentiate Thesis, Swedish University of Agricultural Sciences, Uppsala, Sweden, 2011. [Google Scholar]
  5. Kozak, A. A variable-exponent taper equation. Can. J. For. Res. 1988, 18, 1363–1368. [Google Scholar] [CrossRef]
  6. Kang, J.T.; Son, Y.M.; Kim, S.W.; Lee, S.; Park, H. Development of Local Stem Volume Table for Pinus densiflora S. et Z. Using Tree Stem Taper Model. Korean J. Agric. For. Meteorol. (KJAFM) 2014, 16, 327–335. [Google Scholar] [CrossRef]
  7. Kang, J.T.; Moon, H.S.; Son, Y.M.; An, K.W. An Estimation on the Stem Volume of Cryptomeria japonica in Jeju Using Kozak’s Stem Taper Model. J. Korean Islands (TJOKI) 2015, 27, 145–160. [Google Scholar]
  8. Kang, J.T.; Son, Y.M.; Kim, H.; Park, H. Developing Optimal Site Prediction Model for Evergreen Broad-Leaved Trees, Machilus thunbergii in Warm Temperate Zone of the Korean Peninsula. J. Agric. Life Sci. 2014, 48, 39–54. [Google Scholar] [CrossRef]
  9. Son, Y.M.; Kang, J.T.; Jeon, J.H.; Ko, C. The Estimation of Stem Volume for Pinus thunbergii by Coast Using Kozak’s Stem Taper Model in Korea. J. Korean Islands (TJOKI) 2017, 29, 225–244. [Google Scholar] [CrossRef]
  10. Shin, J.H.; Han, H.; Kim, Y.H.; Yim, J.S.; Chang, Y.S. Uncertainty in Estimating Forest Growing Stock from Volume Estimation of a Standing Tree by Stem Volume Table and the Resulting Bias in Carbon Stock Estimation: A Case Study in Hongcheon-Gun, Republic of Korea. J. Clim. Change Res. 2022, 13, 355–364. [Google Scholar] [CrossRef]
  11. Kang, J.T.; Ko, C. The Development of a Stem Taper Equation and a Stem Table for Standing Trees of Chamaecyparis obtusa on Jeju Island and in the Southern Regions of South Korea. J. Korean Islands (TJOKI) 2020, 32, 221–233. [Google Scholar] [CrossRef]
  12. Lee, S.H.; Ko, C.; Shin, J.H.; Kang, J.T. Estimation of Stem Taper for Quercus acutissima Using Machine Learning Techniques. J. Agric. Life Sci. 2020, 54, 29–37. [Google Scholar] [CrossRef]
  13. Ko, C.; Lee, S.H.; Lee, S.J.; Kim, D.G.; Kang, J.T. Development of a Stem Taper Equation and a Stem Table for Cryptomeria japonica Stands in South Korea. J. Korean Soc. For. Sci. 2020, 109, 461–467. [Google Scholar] [CrossRef]
  14. Ko, C.; Moon, G.H.; Yim, J.S.; Lee, S.; Kim, D.G.; Kang, J.T. Estimation and Comparison of Stem Volume for Larix kaempferi in South Korea Using the Stem Volume Model. J. Korean Soc. For. Sci. 2019, 108, 592–599. [Google Scholar] [CrossRef]
  15. Son, Y.M.; Jeon, J.H.; Pyo, J.K.; Kim, K.N.; Kim, S.W.; Lee, K.H. Development of Stem Volume Table for Robinia pseudoacacia Using Kozak’s Stem Profile Model. J. Agric. Life Sci. 2012, 46, 43–49. [Google Scholar]
  16. Son, Y.M.; Kim, S.W.; Lee, S.; Kim, J.S. Estimation of Stand Yield and Carbon Stock for Robinia pseudoacacia Stands in Korea. J. Korean Soc. For. Sci. 2014, 103, 264–269. [Google Scholar] [CrossRef]
  17. Son, Y.M.; Kim, H.; Lee, H.Y.; Kim, C.M.; Kim, C.S.; Kim, J.W.; Joo, R.W.; Lee, K.H. Taper Equations and Stem Volume Table of Eucalyptus pellita and Acacia mangium Plantations in Indonesia. J. Korean Soc. For. Sci. 2009, 98, 633–638. [Google Scholar]
  18. Son, Y.M.; Lee, K.H.; Pyo, J.K. Development of Biomass Allometric Equations for Pinus densiflora in Central Region and Quercus variabilis. J. Agric. Life Sci. 2011, 45, 65–72. [Google Scholar]
  19. Breiman, L. Random Forests. Mach. Learn. 2001, 45, 5–32. [Google Scholar] [CrossRef]
  20. Chen, T.; Guestrin, C. XGBoost: A Scalable Tree Boosting System. In Proceedings of the 22nd ACM SIGKDD International Conference on Knowledge Discovery and Data Mining, San Francisco, CA, USA, 13–17 August 2016; pp. 785–794. [Google Scholar] [CrossRef]
  21. Hornik, K.; Stinchcombe, M.; White, H. Multilayer Feedforward Networks Are Universal Approximators. Neural Netw. 1989, 2, 359–366. [Google Scholar] [CrossRef]
  22. Diamantopoulou, M.J.; Georgakis, A. Improving European Black Pine Stem Volume Prediction Using Machine Learning Models with Easily Accessible Field Measurements. Forests 2024, 15, 2251. [Google Scholar] [CrossRef]
  23. Sahin, A. Analyzing Regression Models and Multi-Layer Artificial Neural Network Models for Estimating Taper and Tree Volume in Crimean Pine Forests. iForest 2024, 17, 36–44. [Google Scholar] [CrossRef]
  24. Habeeb, H.N.; Mustafa, Y.T. Deep Learning-Based Prediction of Forest Cover Change in Duhok, Iraq: Past and Future. Forestist 2025, 75, 1–13. [Google Scholar] [CrossRef]
  25. Abosuliman, S.S.; Rahman, I.U.; Abdullah, S.; Qadir, A. Selection of third-party logistics in supply chain finance under probabilistic complex hesitant fuzzy sets and distance measures. Heliyon 2024, 10, e36544. [Google Scholar] [CrossRef] [PubMed]
  26. Luo, M.; Anees, S.A.; Huang, Q.; Qin, X.; Qin, Z.; Fan, J.; Han, G.; Zhang, L.; Shafri, H.Z.M. Improving Forest Above-Ground Biomass Estimation by Integrating Individual Machine Learning Models. Forests 2024, 15, 975. [Google Scholar] [CrossRef]
  27. Li, R.; Weiskittel, A.R. Estimating and predicting bark thickness for seven conifer species in the Acadian Region of North America using a mixed-effects modeling approach. Eur. J. For. Res. 2011, 130, 219–233. [Google Scholar] [CrossRef]
  28. Özçelik, R.; Diamantopoulou, M.J.; Trincado, G. Evaluation of potential modeling approaches for Scots pine stem diameter prediction in north-eastern Turkey. Comput. Electron. Agric. 2019, 162, 773–782. [Google Scholar] [CrossRef]
  29. Shen, J.; Hu, Z.; Sharma, R.P.; Wang, G.; Meng, X.; Wang, M.; Wang, Q.; Fu, L. Modeling height–diameter relationship for poplar plantations using combined-optimization multiple hidden layer back propagation neural network. Forests 2020, 11, 442. [Google Scholar] [CrossRef]
  30. Scrinzi, G.; Marzullo, L.; Galvagni, D. Development of a neural network model to update forest distribution data for managed alpine stands. Ecol. Model. 2007, 206, 331–346. [Google Scholar] [CrossRef]
  31. Socha, J.; Netzel, P.; Cywicka, D. Stem taper approximation by artificial neural network and a regression set models. Forests 2020, 11, 79. [Google Scholar] [CrossRef]
  32. Korea Forest Research Institute. Economic Tree Species 1: Pinus densiflora; Research Report on Korea Forest Research Institute; Korea Forest Research Institute: Seoul, Republic of Korea, 2012. [Google Scholar]
  33. National Institute of Forest Science (NIFoS). Stem Volume and Biomass, Yield Table; NIFoS: Seoul, Republic of Korea, 2023. [Google Scholar]
  34. Li, R.; Weiskittel, A.; Dick, A.R.; Kershaw, J.A., Jr.; Seymour, R.S. Regional Stem Taper Equations for Eleven Conifer Species in the Acadian Region of North America: Development and Assessment. North. J. Appl. For. 2012, 29, 5–14. [Google Scholar] [CrossRef]
  35. Shin, J.H.; Han, H.; Ko, C.; Kang, J.T.; Kim, Y.H. Applying Nonlinear Mixed-Effects Models to Taper Equations: A Case Study of Pinus densiflora in Gangwon Province, Republic of Korea. J. Korean Soc. For. Sci. 2022, 111, 136–149. [Google Scholar] [CrossRef]
  36. Alo, A.A.; Ogana, F.N. Equations for estimating bark thickness of Gmelina arborea trees in Omo Forest Reserve, Nigeria. J. Agric. Environ. 2018, 14, 153–165. [Google Scholar]
  37. Li, X.; Du, H.; Mao, F.; Xu, Y.; Huang, Z.; Xuan, J.; Zhou, Y.; Hu, M. Estimation aboveground biomass in subtropical bamboo forests based on an interpretable machine learning framework. Environ. Model. Softw. 2024, 178, 106071. [Google Scholar] [CrossRef]
  38. Czaplewski, R.L.; Brown, A.S.; Guenther, D.G. Estimating Merchantable Tree Volume in Oregon and Washington Using Stem Profile Models; PNW-RN-459; US Department of Agriculture, Forest Service: Fort Collins, CO, USA, 1989; pp. 1–15. [Google Scholar]
  39. Jiang, F.; Kutia, M.; Sarkissian, A.J.; Lin, H.; Long, J.; Sun, H.; Wang, G. Estimating the Growing Stem Volume of Coniferous Plantations Based on Random Forest Using an Optimized Variable Selection Method. Sensors 2020, 20, 7248. [Google Scholar] [CrossRef] [PubMed]
  40. Lee, K.H. A Taper and Volume Prediction System for Pinus densiflora in Kangwon Province, Korea. Korea For. Inst. J. For. Sci. 1999, 62, 155–166. [Google Scholar]
  41. Seo, Y.O. Allometric Equations, Stem Density and Biomass Expansion Factors for Cryptomeria japonica in Mount Halla, Jeju Island, Korea. J. Ecol. Environ. 2014, 37, 177–184. [Google Scholar]
  42. Son, Y.M.; Lee, K.H.; Kim, R.H. Estimation of Forest Biomass in Korea. J. Korean Soc. For. Sci. 2007, 96, 477–482. [Google Scholar] [CrossRef]
  43. Valverde, J.C.; Rubilar, R.; Medina, A.; Mardones, O.; Emhart, V.; Bozo, D.; Espinoza, Y.; Campoe, O. Taper and individual tree volume equations of Eucalyptus varieties under contrasting irrigation regimes. N. Z. J. For. Sci. 2022, 52, 15. [Google Scholar] [CrossRef]
  44. Sharma, M.; Zhang, S.Y. Variable-Exponent Taper Equations for Jack Pine, Black Spruce, and Balsam Fir in Eastern Canada. For. Ecol. Manag. 2004, 198, 39–53. [Google Scholar] [CrossRef]
  45. Sharma, M.; Parton, J. Modeling Stand Density Effects on Taper for Jack Pine and Black Spruce Plantations Using Dimensional Analysis. For. Sci. 2009, 55, 268–282. [Google Scholar] [CrossRef]
  46. Sandoval, S.; Acuña, E. Stem Taper Estimation Using Artificial Neural Networks for Nothofagus Trees in Natural Forest. Forests 2022, 13, 2143. [Google Scholar] [CrossRef]
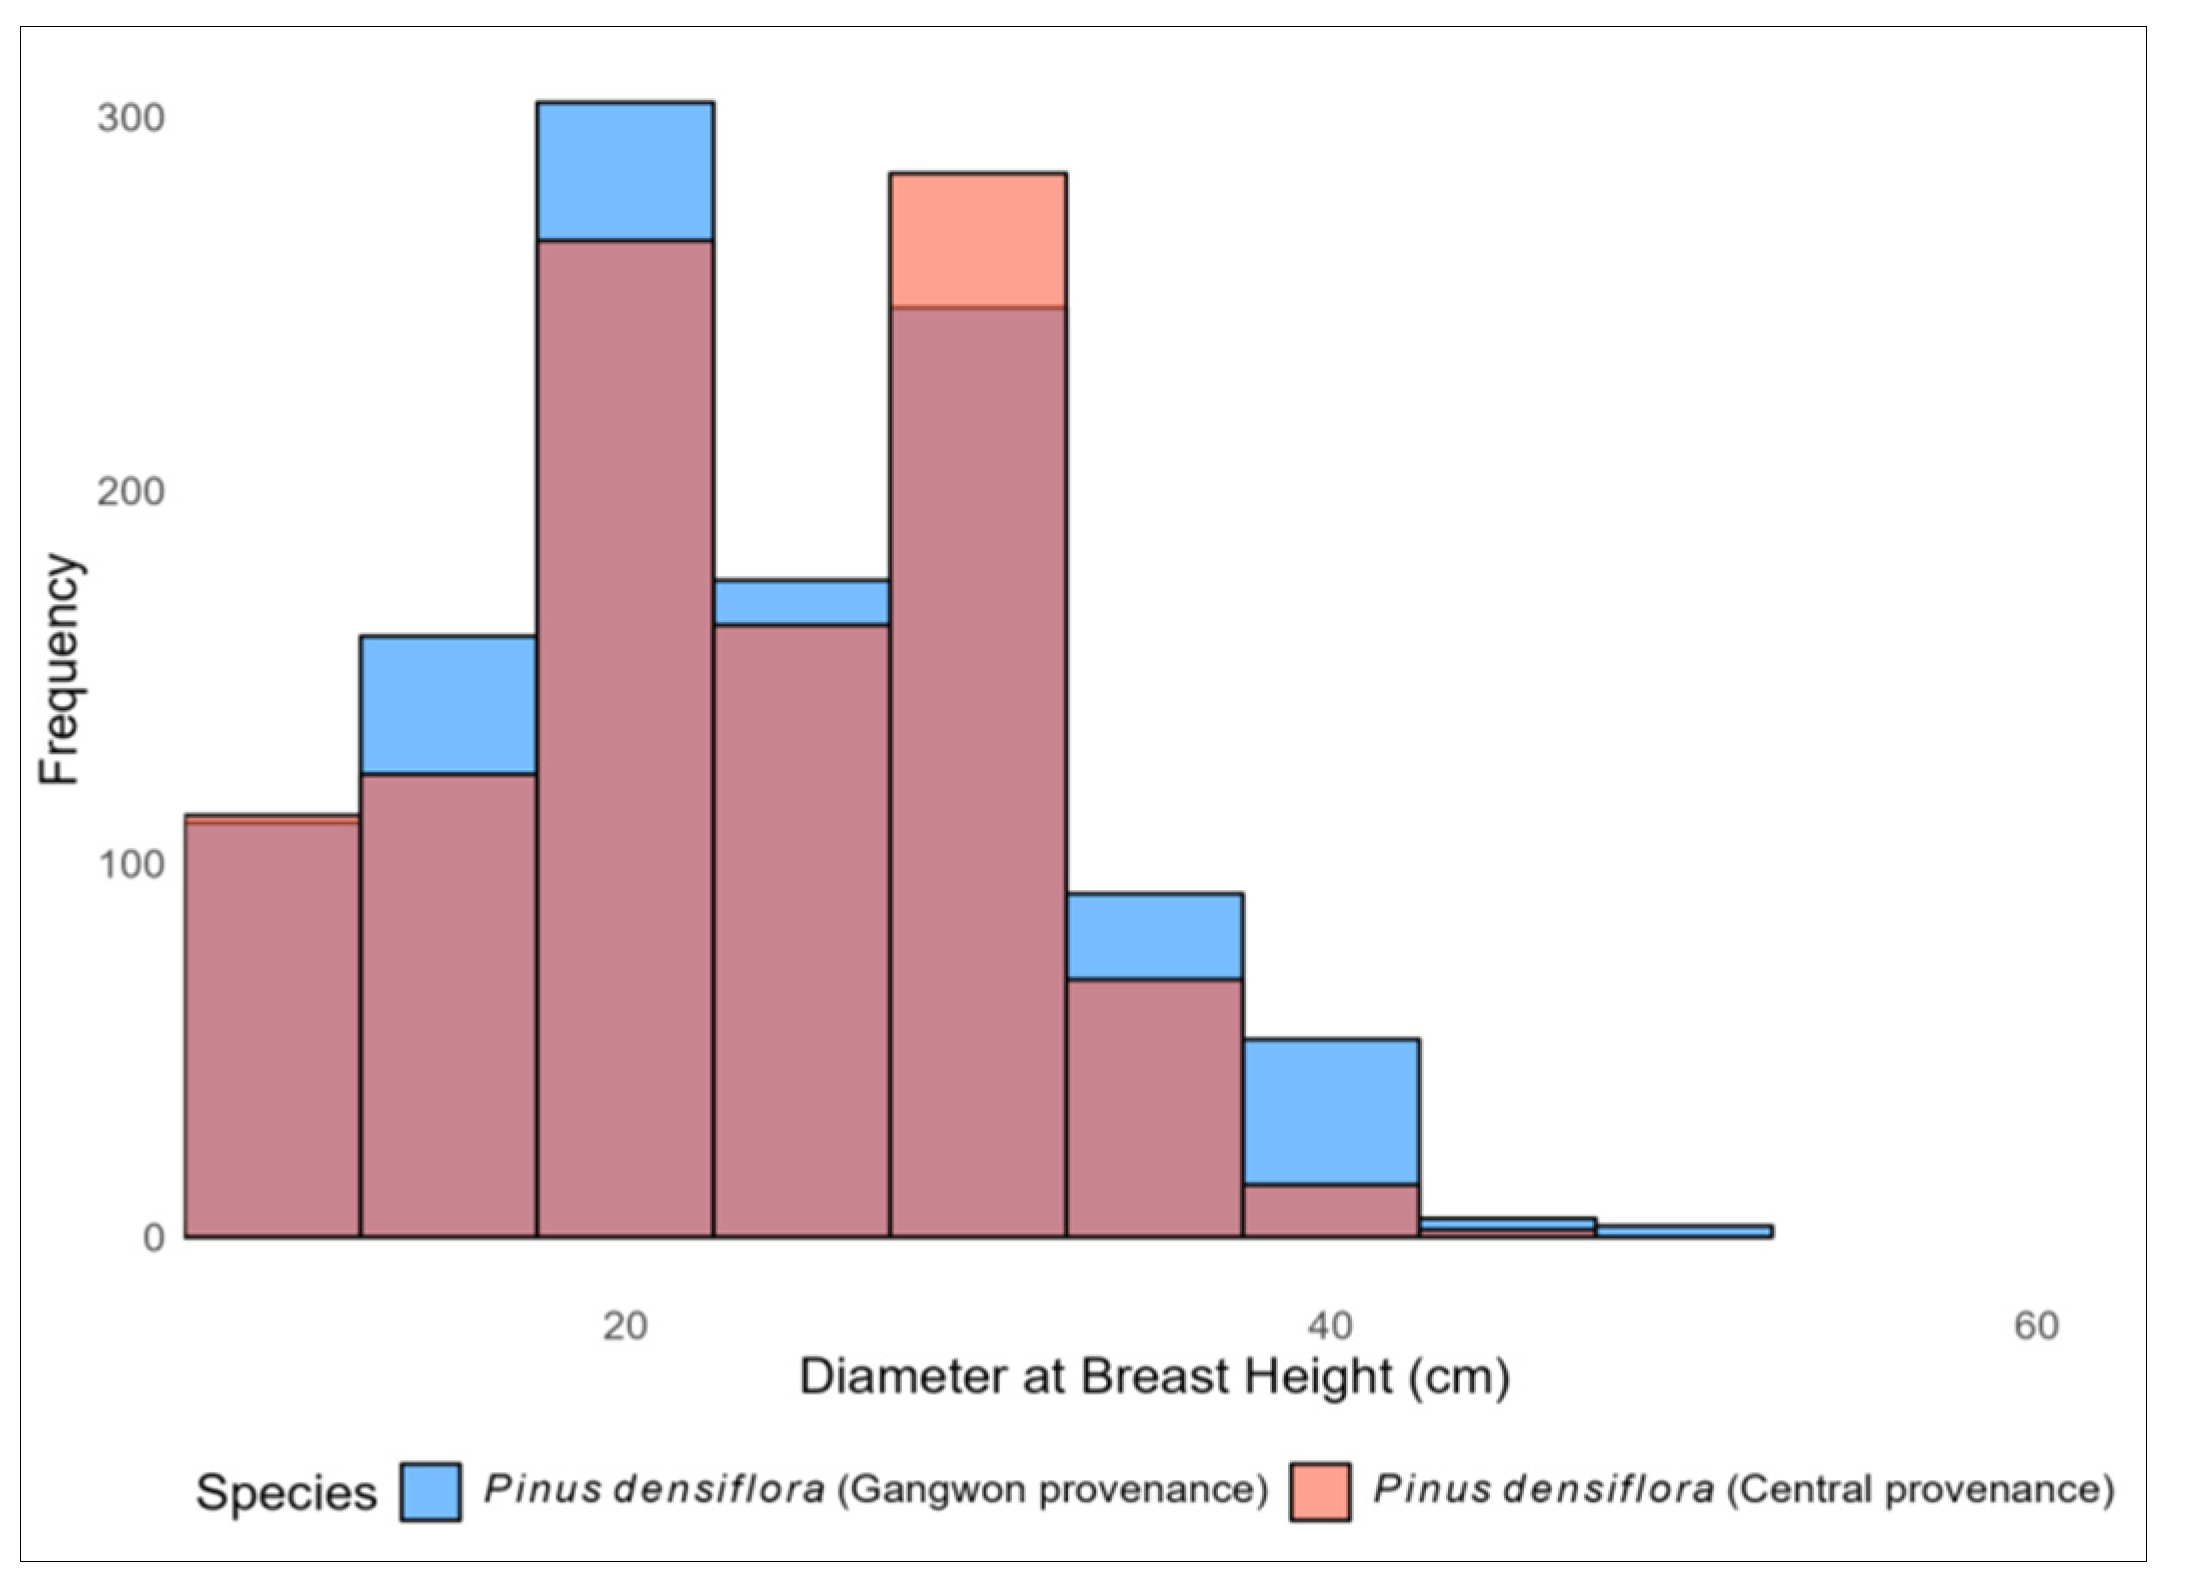
Figure 1. DBH distribution for P. densiflora by provenance.
Forests 16 00840 g001
Figure 2. Relationship between DBH and total tree height (TH) by provenance.
Forests 16 00840 g002
Figure 3. Comparison of observed and predicted diameters and residuals of Kozak’s taper model by provenance.
Forests 16 00840 g003
Figure 4. Observed vs. predicted diameters and residuals of ML models (RF, XGB, ANN) by provenance.
Forests 16 00840 g004
Figure 5. Comparison of taper curves by DBH class using Kozak and ML models.
Forests 16 00840 g005
Table 1. Descriptive statistics of the sample trees used for model development by provenance.
SpeciesNDBH (cm)TH (m)
MeanSDMin_MaxMeanSDMinMax
Pinus densiflora (central provenance)1042257.437.245.515.032.446.123
Pinus densiflora (Gangwon provenance)115525.68.02650.416.703.15626.2
Table 2. Kozak (1988) [5] stem taper equation used for model comparison in this study.
ModelTaper Equation
Kozak (1988) [5] d = a 1 D B H 2 a a 3 D B H X b 1 Z 2 + b 2 l n Z + 0.001 + b 3 Z + b 4 e Z + b 5 ( D B H H )
where Z = relative height (= h H )
X = 1 h H 1 p (p = inflection point)
ai, bi = parameters
d = diameter (estimated) when h/H
Table 3. Accuracy assessment formulas used to evaluate both Kozak’s taper model and machine learning models.
StatisticCalculation Formula
Root mean square error (RMSE) i = 1 n ( y i y i ^ ) 2 n
Mean absolute error (MAE) 1 n i = 1 n | y i y i ^ |
Coefficient of determination (R2) 1 ( y i y ^ i ) 2 ( y i y i ¯ ) 2
Here, y i , y i ^ , y ¯ = the observed, estimated, and mean of the observed values, respectively, and n = the number of sample trees.
Table 4. Estimated parameters and model fit statistics of Kozak’s taper model for Pinus densiflora.
ParameterPinus densiflora
(Gangwon Provenance)
Pinus densiflora
(Central Provenance)
a11.07421.0046
a20.89680.9217
a31.00131.0009
b1−0.0123−0.1732
b2−0.1073−0.0876
b30.47140.4003
b40.12320.2271
b5−0.0220−0.0408
p0.30.3
R20.98740.9885
RMSE1.10131.0391
Table 5. Performance metrics of machine learning models for stem profile estimation of Pinus densiflora.
SpeciesModelRMSE (cm)R2MAE (cm)
Pinus densiflora
(central provenance)
Random Forest1.8240.9681.304
XGBoost1.8510.9661.318
ANN1.6160.9741.147
Pinus densiflora
(Gangwon provenance)
Random Forest1.7320.9721.240
XGBoost1.8030.9691.225
ANN1.5840.9761.125
Table 6. Results of Wilcoxon signed-rank tests comparing absolute prediction errors between machine learning models (ANN, RF, XGBoost) across two provenances (Gangwon and central). Statistically significant differences (α = 0.05) are highlighted. Confidence intervals indicate the range of differences in the absolute error between model pairs.
SpeciesComparisonTest Modelp-ValueSignificance
(α = 0.05)
Pinus densiflora
(central provenance)
ANN vs. RFWilcoxon signed-rank0.0005Significant
ANN vs. XGBoost0.0147Significant
RF vs. XGBoost0.959Not Significant
Pinus densiflora
(Gangwon provenance)
ANN vs. RF0.0000Significant
ANN vs. XGBoost0.0000Significant
RF vs. XGBoost0.597Not Significant
Disclaimer/Publisher’s Note: The statements, opinions and data contained in all publications are solely those of the individual author(s) and contributor(s) and not of MDPI and/or the editor(s). MDPI and/or the editor(s) disclaim responsibility for any injury to people or property resulting from any ideas, methods, instructions or products referred to in the content.