Article

Changes in Plant Nitrogen Uptake Strategies Following Vegetation Recovery in Karst Regions

1
Key Laboratory of Karst Dynamics, MNR & GZAR / International Research Center on Karst under the Auspices of UNESCO / Institute of Karst Geology, Chinese Academy of Geological Sciences (CAGS), Guilin 541004, China
2
Pingguo Guangxi, Karst Ecosystem, National Observation and Research Station, Pingguo 531406, China
3
School of Breeding and Multiplication (Sanya Institute of Breeding and Multiplication), Hainan University, Sanya 572025, China
*
Author to whom correspondence should be addressed.
Forests 2025, 16(5), 839; https://doi.org/10.3390/f16050839
Submission received: 8 April 2025 / Revised: 16 May 2025 / Accepted: 16 May 2025 / Published: 18 May 2025
(This article belongs to the Section Forest Ecology and Management)

Abstract

Understanding plant nitrogen (N) uptake strategies during vegetation recovery is essential for restoring and rehabilitating degraded ecosystems. However, there are few studies on plant N uptake strategies in karst regions. In this study, space-for-time substitution was used to investigate the dynamic changes in plant N uptake strategies during vegetation restoration. Grassland, shrub–grassland, shrubland, and woodland naturally recovering in karst ecosystems were chosen as the research objects. The dominant species at each stage were investigated. Dominant plant N uptake rates were measured using the 15N labeling technique, and plant root functional traits and available soil N were determined. Our results showed that soil inorganic N content and composition varied significantly with vegetation recovery. In early vegetation recovery stages, the soil inorganic N content was low and dominated by ammonium (NH4+), while in the late stages, soil inorganic N content increased, and nitrate (NO3) became the dominant form. In early vegetation recovery stages, dominant plants preferentially absorbed NH4+, contributing to 90.3%–98.5% of the total N uptake. With vegetation recovery, plants increased the NO3 uptake ratio from 1.48%–9.42% to 30.1%–42.6%. Additionally, the root functional traits of dominant plants changed significantly during vegetation recovery. With vegetation recovery, specific root lengths and specific root areas decreased, while root N content and plant N uptake rates increased. In summary, plants developed N uptake strategies coordinated with soil N supply by modifying root functional traits following vegetation recovery in karst regions.

1. Introduction

Nitrogen (N) is a key nutrient that restricts plant growth in terrestrial ecosystems [1,2]. Besides small-molecule organic N, plants primarily utilize soil nitrate (NO3) and ammonium (NH4+) [3,4,5]. Soil N availability affects plant growth and improvements in ecological function [6,7]. Approximately 57% of plant growth worldwide is limited in N content [8], which is attributed to lower overall soil N availability [6,9,10]. Moreover, if the soil-supplied N form does not match the plant’s preferred N form, plant growth may be limited, even if soil N availability is high [11,12,13]. Investigating plant N uptake strategies is the basis for an in-depth understanding of plant growth, community assembly, and succession [14,15,16], and it has become a hot topic in the current ecological plant restoration literature.
To better adapt to the environment, plants have developed different N uptake strategies, depending on the available soil N forms [17,18,19]. For example, Picea asperata and Abies faxoniana preferred NO3 uptake in China’s coniferous forest [20]. Larix kaempferi preferred NH4+ uptake in Japan’s coniferous forest [21]. On the Tibetan Plateau, the N uptake preference of Picea abies changed from NH4+ to NO3 with increasing forest age [22]. In addition, when the available soil N composition and content vary greatly, plants will adjust root functional traits to adapt to the soil environment. Research has shown that plants develop finer roots under low-N conditions [23], which improves the plant’s ability to absorb available N. Plants can also improve their N utilization capacity by extending their specific root length and area [24,25]. The 15N labeling technique can be used to quantify the plant’s ability to absorb different N sources (NH4+, NO3, amino acids, etc.), thus clarifying plant N uptake preference [26]. Although studies on plant N uptake strategies advanced the understanding of N cycling, most have been conducted in non-karst areas.
Karst landscapes cover about 15% of the Earth’s surface [27,28,29] and are known for their rich species diversity and significant carbon sink potential [30,31,32]. Due to unique geological conditions and human disturbance, the karst ecosystem is delicate, with ecological and environmental issues, including biodiversity loss, severe soil erosion, and exposed rocks, resulting in large-scale “rocky desertification” [33,34,35]. Vegetation recovery is one of the most effective ways to control “rocky desertification”, but slow plant growth poses an issue to this process [6,27]. According to the literature, inadequate soil N supply is an important restriction of plant growth during early vegetation recovery phases in karst areas [36,37]. However, how plant N uptake strategies change during vegetation recovery is still unclear. Soils developed from carbonate rocks are characterized by high calcium content and pH in karst regions [7,27,38]. Calcium can be combined with soil organic matter, promoting its accumulation [39,40], while higher pH increases the activity of nitrifying microorganisms [41]. These factors affect soil N availability, potentially leading to the development of unique N uptake strategies in karst regions. Soil N availability is low in early vegetation recovery phases in karst regions [6]. In this habitat, surface vegetation is dominated by herbs and low shrubs, and plants may develop larger specific root lengths and areas to increase the capture of available N [25,42]. With vegetation recovery, shrubland and woodland are gradually forming, and litter input can increase soil organic matter accumulation, improving soil quality and environment, thereby leading to increased soil N availability [6,43]. Under higher pH background conditions, soil inorganic N content is high in later vegetation recovery stages in karst regions and may primarily present itself in NO3 [37]. Therefore, plants may develop different N uptake strategies to meet their growth requirements under conditions where soil inorganic N content and composition vary significantly in different vegetation recovery stages. We hypothesized that plants develop different N uptake strategies with vegetation recovery due to soil N availability and form changes in karst regions.
Space-for-time substitution was used to study plant N uptake strategies during vegetation recovery in karst regions for hypothesis verification. Grassland, shrub–grassland, shrubland, and woodland with natural recovery in karst regions were selected. Community composition and dominant species in different vegetation recovery stages were investigated using the survey plot method. This study aimed to clarify the changes in plant N uptake strategies and their driving factors during vegetation recovery by determining the plant root functional traits, available soil N content, and N uptake rates of dominant species in different vegetation recovery stages.

2. Materials and Methods

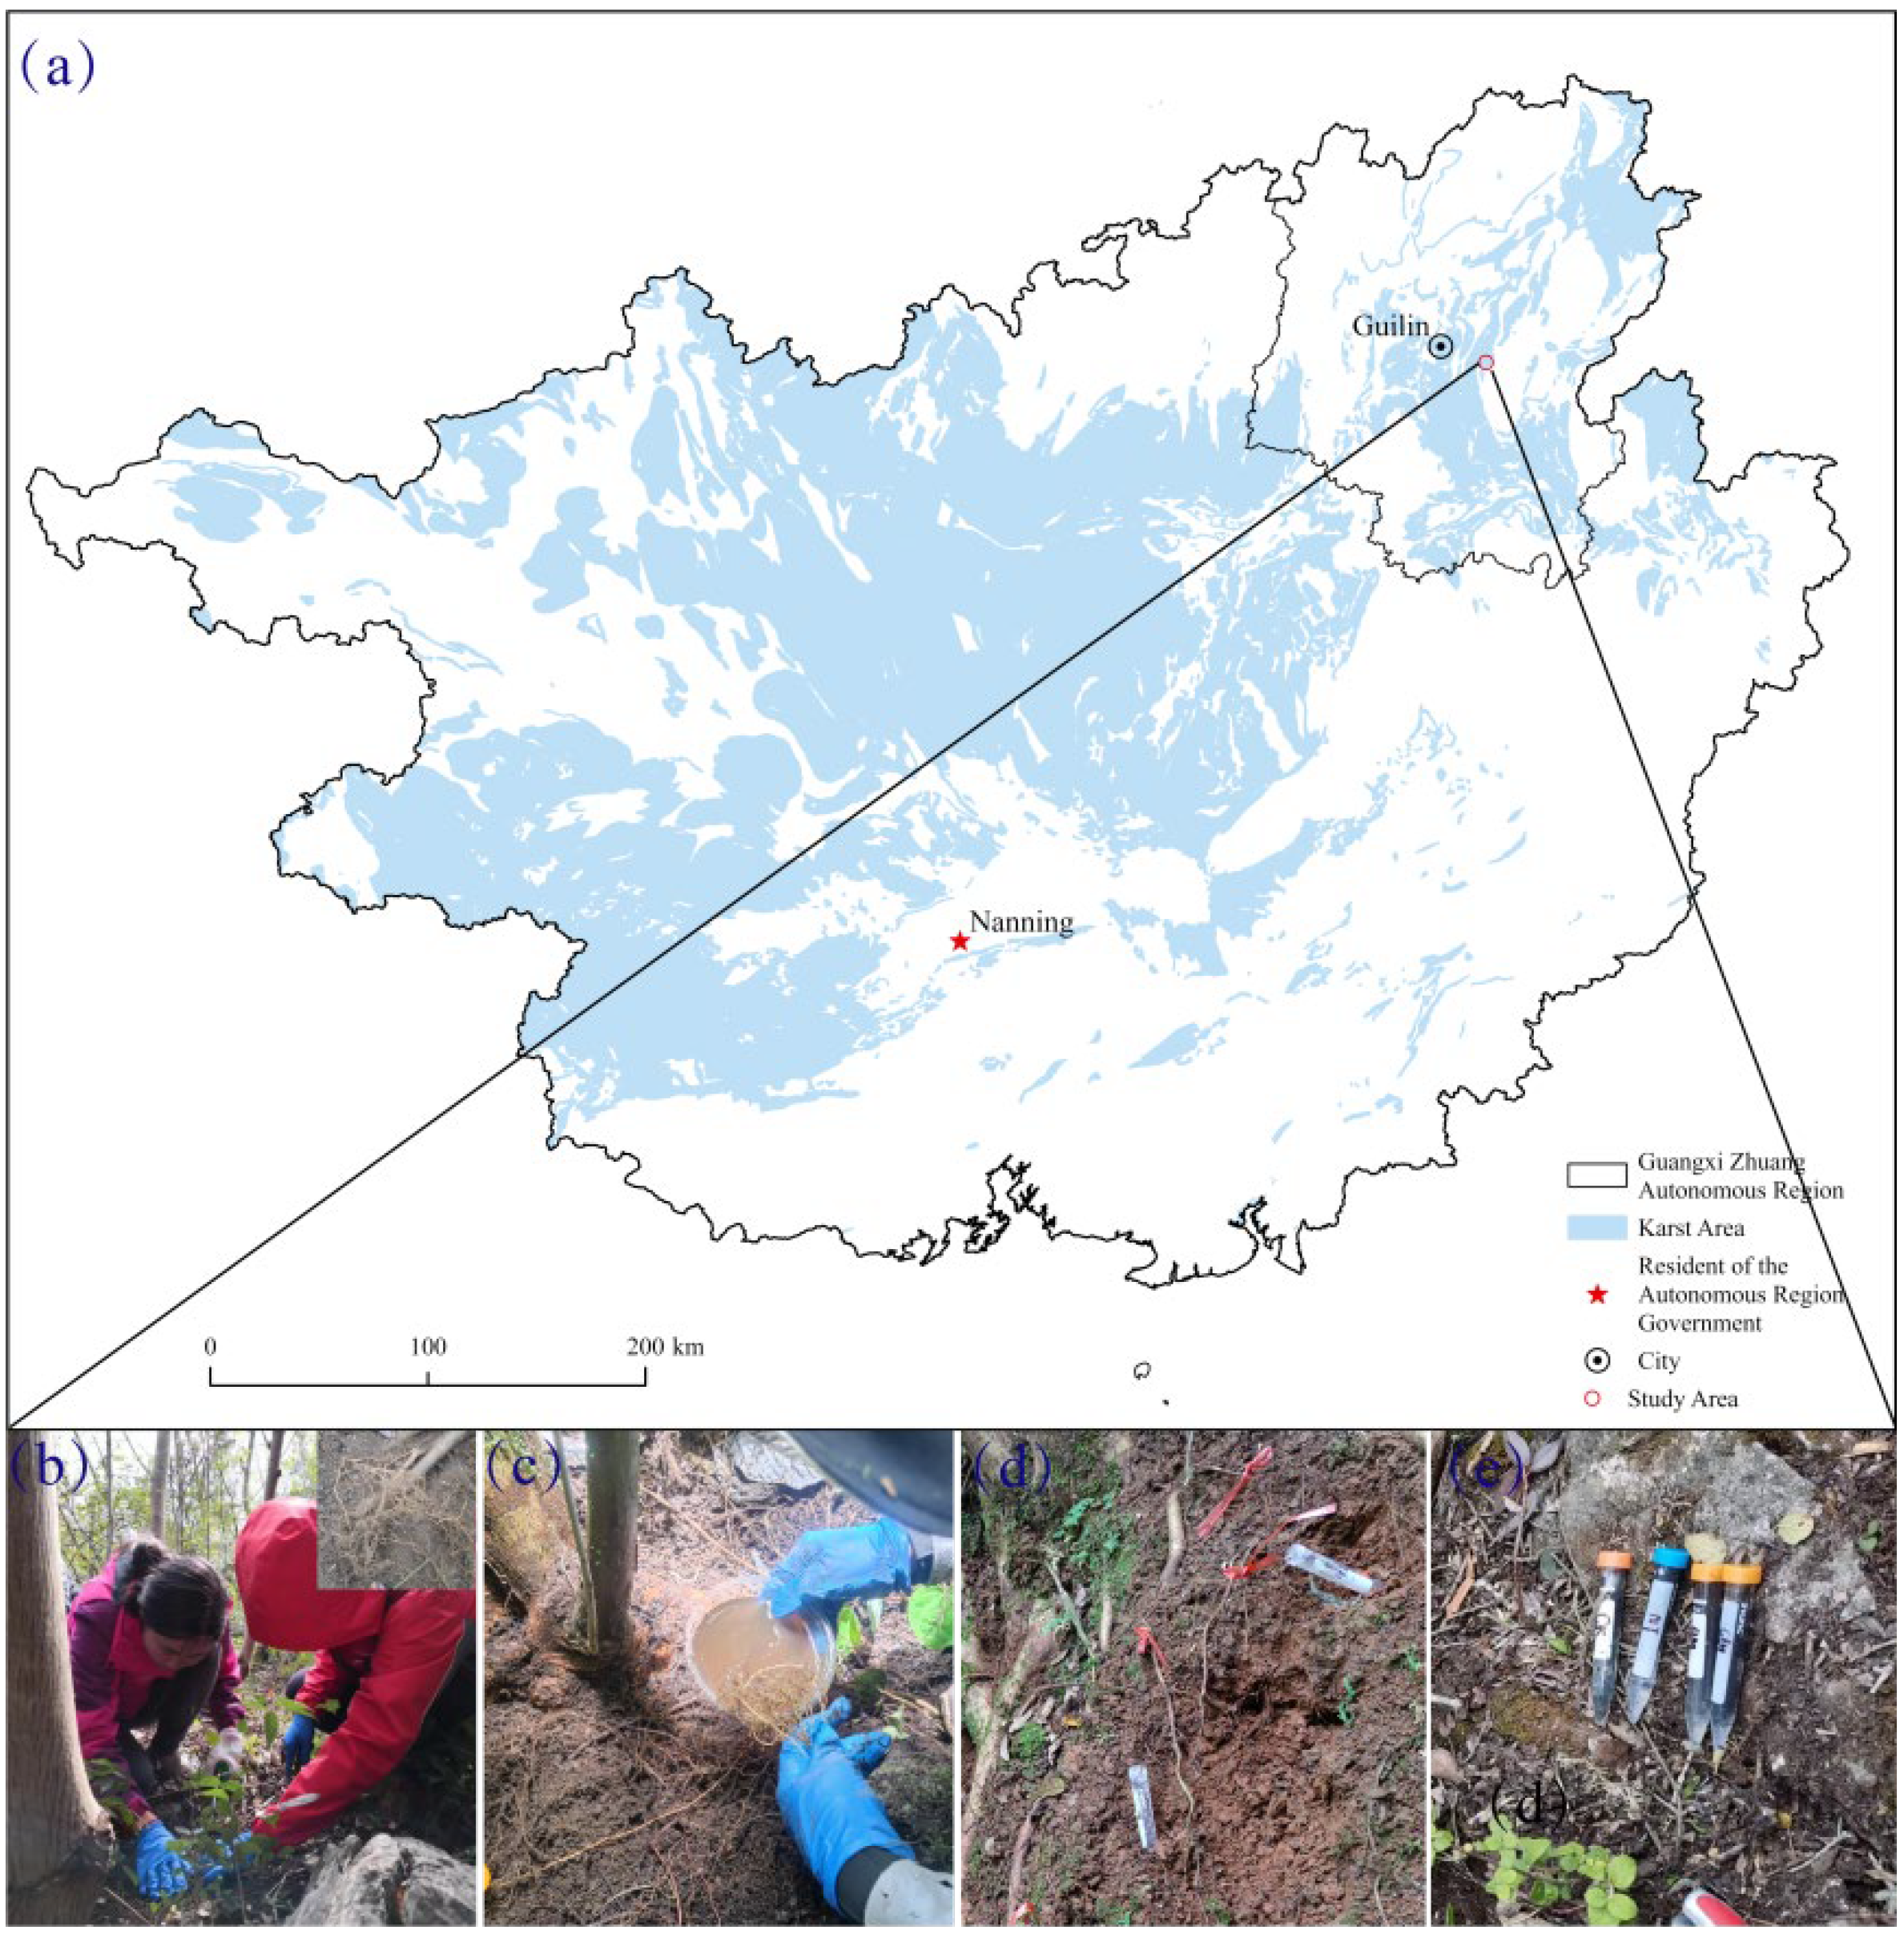
2.1. Site Description

The study area was located in Guilin, Guangxi Zhuang Autonomous Region, China (110°31′–110°54′ E, 25°12′–25°21′ N) (Figure 1), with an altitude of 259–381 m. The area experiences a mid-subtropical monsoon climate, with an average annual temperature of roughly 19.6 °C. There is abundant rainfall, with distinct wet and dry seasons: March to August is the rainy season, and September to the following February is the dry season. The average annual precipitation, sunshine time, and annual frost-free period are about 1712 mm, 1615 h, and 256–349 days, respectively. The region has a typical peak-cluster depression landform, and the IUSS Working Group WRB has designated the studied soil as calcareous Alfisol. Additionally, humans have cut down large areas of natural vegetation and planted crops on steep slopes and in rock crevices throughout time. The regions have undergone long periods of agricultural cultivation, resulting in significant soil erosion and rocky desertification. Over time, areas where rocky desertification became too severe for farming were gradually abandoned. After decades of natural recovery, different vegetation recovery stages have emerged.
Four typical recovery stages, i.e., grassland, shrub–grassland, shrubland, and woodland, were selected for study based on the field survey results (Table 1). Grassland vegetation was relatively homogeneous. In the shrub–grassland stage, the presence of herbaceous plant species increased significantly, while some lianas and low shrubs appeared, forming a diverse vegetation community. In the shrubland stage, shrubs became the dominant layer, with a significant increase in vegetation depression. In the woodland stage, tall trees became the dominant vegetation layer, forming an obvious canopy layer. Under the tree layer, there were also shrubs and herbs, and the overall surface vegetation coverage was higher, with a more complex and diversified vegetation structure. Four representative sample plots were set up in each recovery stage for the vegetation survey, with spacing between sample plots greater than 300 m. The results showed the following dominant species: Miscanthus floridulus in the grassland; Bauhinia championii, Alchornea trewioides, Miscanthus floridulus, and Selaginella moellendorffii in the shrub–grassland; Loropetalum chinense, Bauhinia championii, Carex capilliformis, and Paederia foetida in the shrubland; and Cyclobalanopsis glauca, Mallotus philippinensis, Murraya paniculata, Trachelospermum jasminoides, and Carex sendaica in the woodland.

2.2. Field Hydroponic Experimental Design

According to the importance values of the plant community diversity survey, 1–3 dominant plants were selected as the study species in each recovery stage, listed as follows: Miscanthus floridulus in the grassland; Bauhinia championii, Alchornea trewioides, and Miscanthus floridulus in the shrub–grassland; Loropetalum chinense and Bauhinia championii in the shrubland; and Cyclobalanopsis glauca and Mallotus philippinensis in the woodland. There were 5 replicates for each species, so a total of 40 plants needed to be marked.
This study concentrated on the plant uptake of NH4+, NO3, and organic N, with glycine used as a model marker for organic N [44]. Three 15N-labeled solutions (15NH4NO3 + C2H5NO2, NH415NO3 + C2H5NO2, and NH4NO3 + C2H515NO2) and one unlabeled solution (NH4NO3 + C2H5NO2) were prepared. The 15N atom% of 15NH4NO3 and NH415NO3 was 10%, while the 15N atom% of C2H515NO2 was 99%. The N contents of NH4+, NO3, and glycine in each treatment were all 150 μmol N L−1. Additionally, 10 mg L−1 ampicillin was added to each treatment to reduce microbial activity and prevent amino acid decomposition, along with 0.2 mmol CaCl2 to preserve root function and integrity [45]. The prepared solutions were transferred into 15 mL centrifuge tubes and subsequently labeled.
Five similar-sized plants were chosen randomly for each species. Along the stem base, fine roots under 2 mm in diameter were dug out diagonally in four directions. After gently cleaning with deionized water, the roots were submerged in the appropriate labeling solutions. The length of the labeled fine root was approximately 15 cm. Then, the time that plant roots were placed in the solution was accurately recorded. After 2 h of labeling, the roots were cut at the location of the labeling solution. The fine roots were then carefully washed with deionized water after submerging in the KCl solution (50 mmol L−1) for 3 min. Finally, the fine roots were wiped with clean laboratory paper and then placed in a labeled envelope. After being brought back to the laboratory, the fine roots were stored in a 4 °C refrigerator.

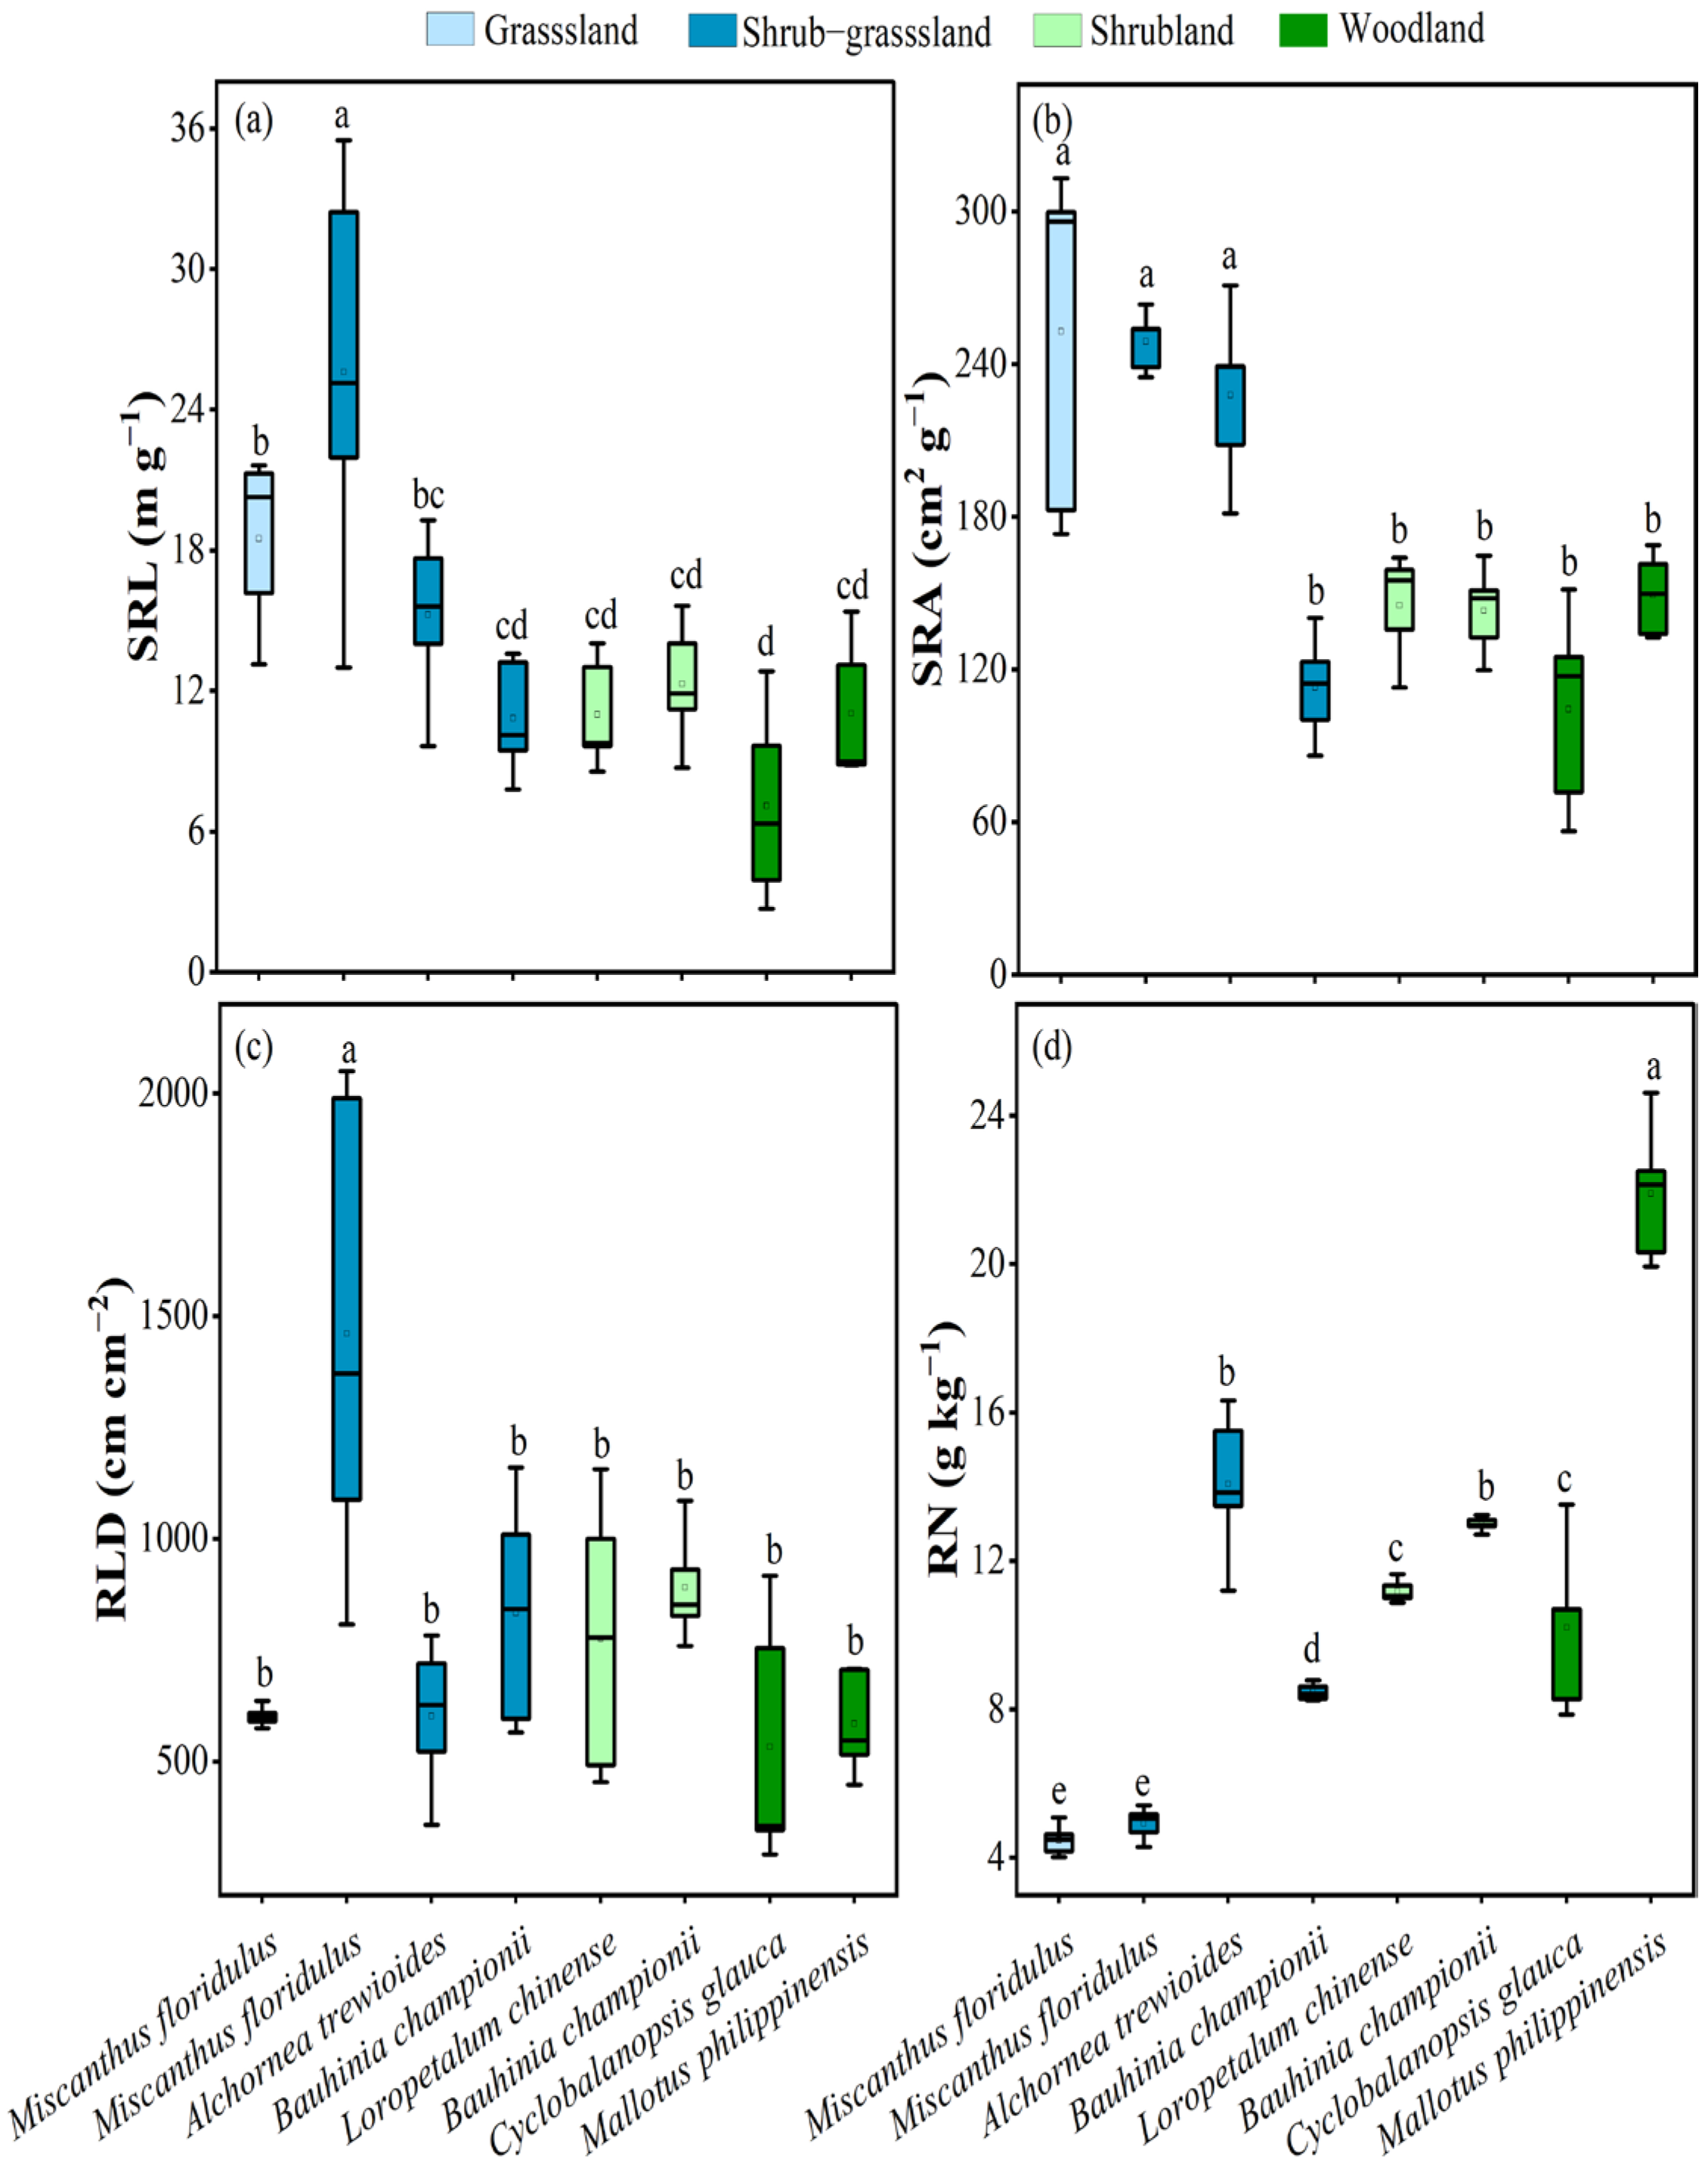
2.3. Plant Root Functional Traits

A root scanner was used to scan the roots, and the data were analyzed with WinRHIZO to obtain root surface area, volume, and length. The scanned roots were returned to their original envelopes and dried to a consistent weight for 48 h at 70 °C in an oven. Dry root weight was determined by the millionth balance. Fine roots were ground to powder with an AM410 Planetary Ball Mill. Root N content (RN) and 15N atom% of fine root samples were determined using a Sercon Integra 2 Elemental Analyzer (Sercon Ltd., Crewe, UK).
The formulas for specific root length (SRL), specific root area (SRA), and root length density (RLD) were calculated as follows:
SRL m   g 1 = L M   ×   100
SRA cm 2   g 1 = S   M
RLD cm   cm 3 = L V
where L, M, S, and V represent root length (cm), dry root weight (g), root surface area (cm2), and root volume (cm3), respectively.

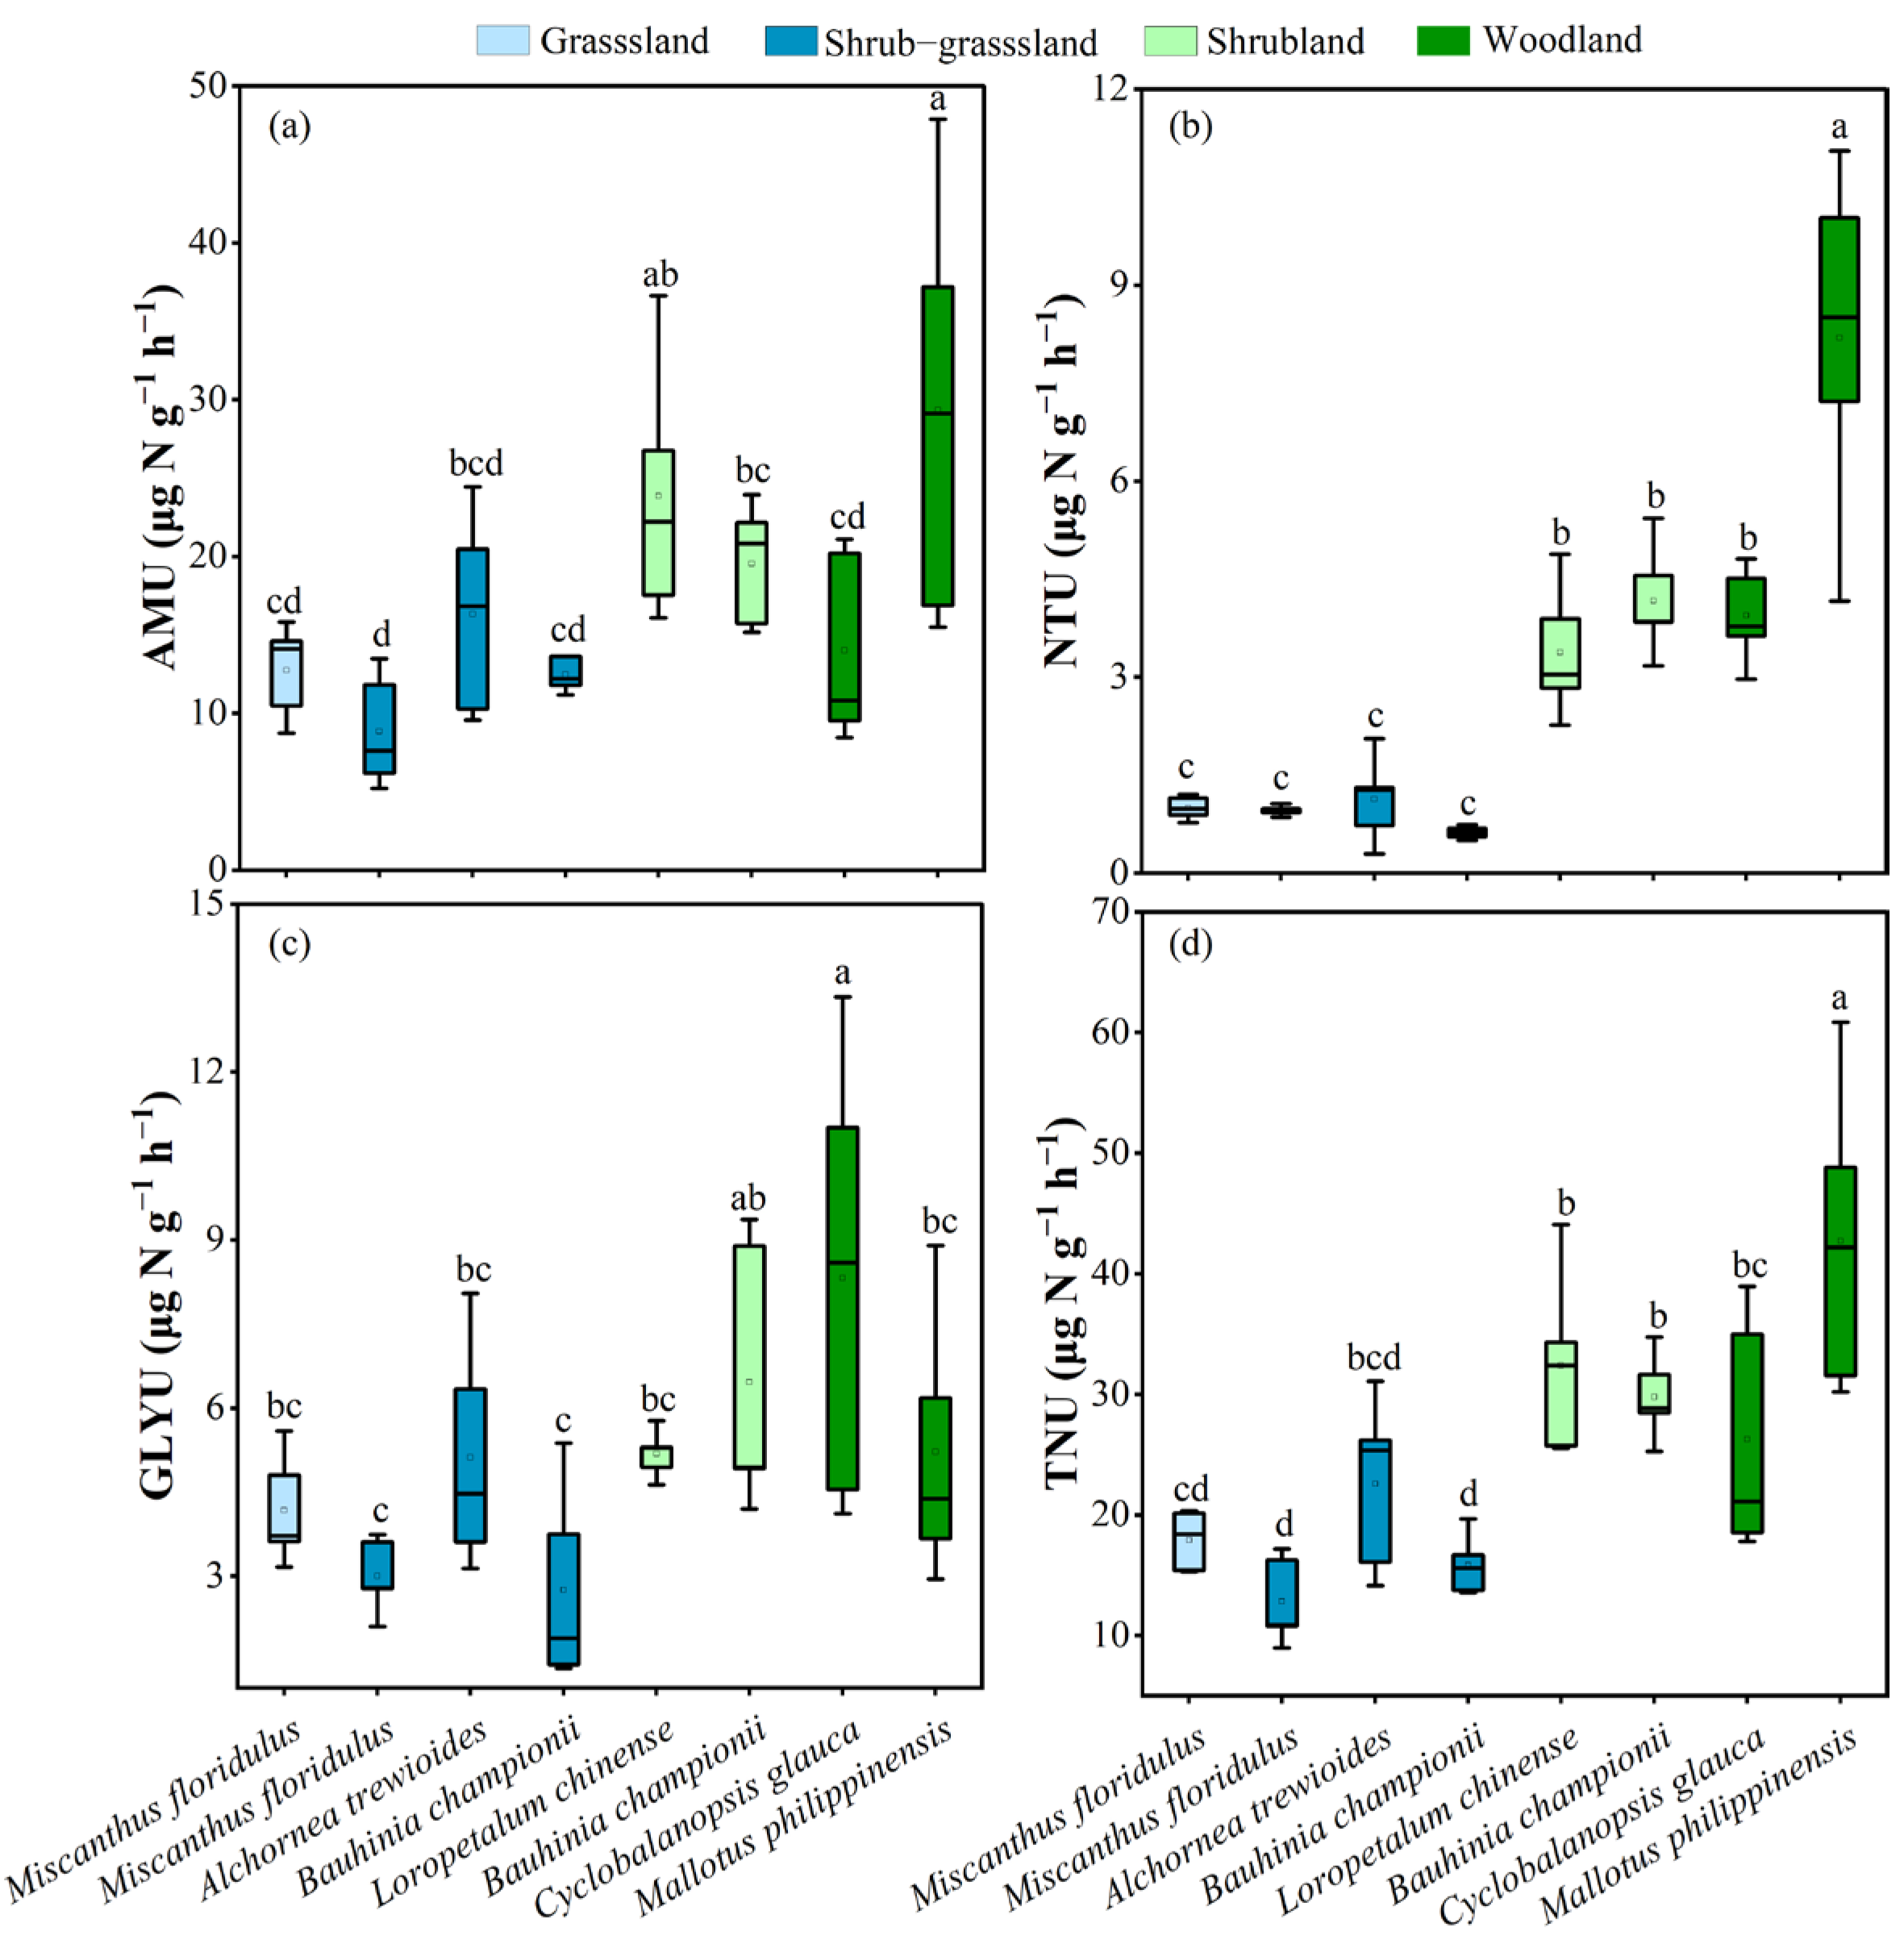
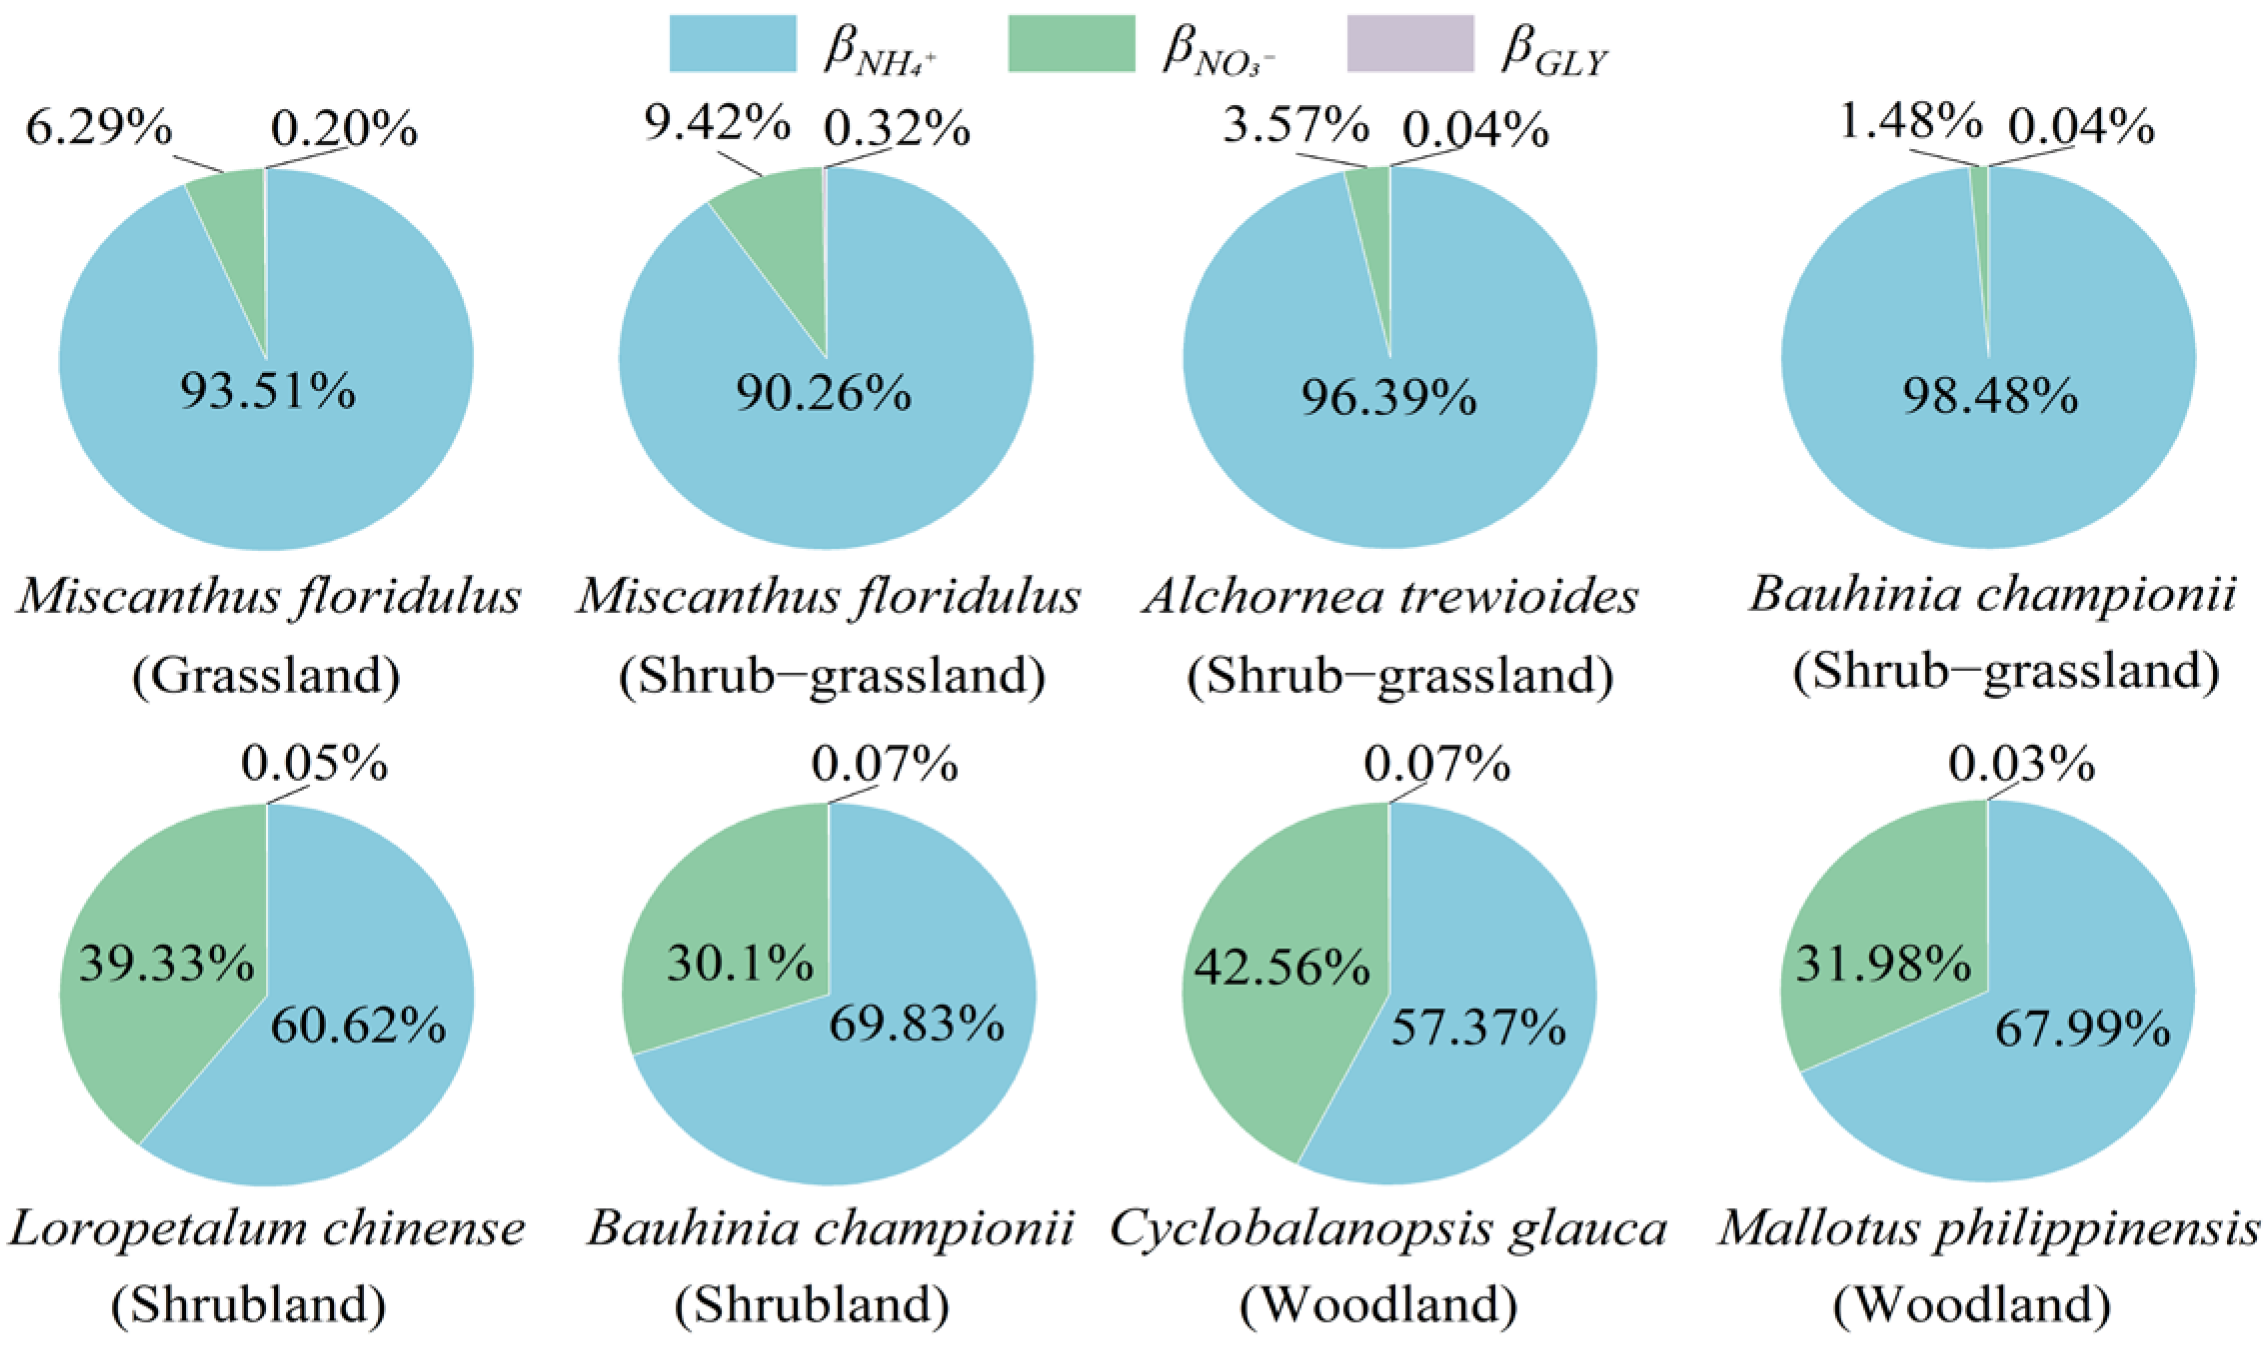
2.4. Plant Nitrogen Uptake Strategies

The plant N uptake rate was calculated by Formula (4) [45]:
NUR = N Root   ×   APE sample T   ×   APE added
where NUR (μg N g−1 h−1), Nroot (μg g−1), T, APEsample, and APEadded represent the plant N uptake rate, root N content, labeling time (h), the difference in atom% 15N between 15N-labeled and unlabeled roots, and atom% 15N of the added markers, respectively.
Considering that there were differences between the actual soil N contents and the experimentally added N contents, the ratio of different N form uptake to total N uptake was corrected according to the actual contents of soil NH4+, NO3, and glycine. Taking NH4+ as an example, we can determine the following formula:
β N H 4 + = ( A M U × C N H 4 + ) / ( A M U × C N H 4 + + N T U × C N O 3 + G L Y U × C G L Y )
where βNH4+, AMU (μg N g−1 h−1), CNH4+ (μg g−1), NTU (μg N g−1 h−1), CNO3 (μg g−1), GLYU (μg N g−1 h−1), and CGly (μg g−1) represent the NH4+-uptake-to-total-N-uptake ratio, NH4+ uptake rate by plants, soil NH4+ content, NO3 uptake rate by plants, soil NO3 content, glycine uptake rate by plants, and soil glycine content, respectively.

2.5. Available Soil Nitrogen

Soils were collected from 0 to 15 cm near the roots of each plant in all four directions and mixed into one sample, yielding a total of forty soil samples. A 2 mm sieve was used to filter soil samples following the removal of the stones, litter, and roots. Then, 50 mL of 0.05 mol L−1 K2SO4 was used to extract fresh soil equal to 10 g of dry soil weight. The extraction solutions were stored in a refrigerator at 4 °C, and the contents of NH4+ and NO3 were determined using a flow analyzer (Skalar, Breda, The Netherlands) [6], while the free amino acid contents were measured via high-performance liquid chromatography(HPLC-MS/MS API3200 Q-TRAP, Foster City, CA, USA) [45].

2.6. Data Statistics and Analysis

The variations in plant N uptake rates, root functional traits, and available soil N contents in different vegetation recovery stages were compared using one-way analysis of variance (ANOVA) and Tukey’s test in SPSS 24.0 (IBM, Chicago, IL, USA). In Origin 2021 (OriginLab Corp., Northampton, MA, USA), a correlation plot was used to examine the relationship between plant N uptake rates and ratios with root functional traits and available soil N contents. The impact of available soil N contents and plant root functional traits on plant N uptake was examined using structural equation modeling (Amos 28.0, IBM, Chicago, IL, USA).

3. Results

3.1. Soil Nitrogen Availability

Available soil N content and composition varied considerably with vegetation recovery (Table 2). Compared with the grassland and shrub–grassland (14.4–26.7 mg kg−1), the average soil inorganic N contents in the shrubland and woodland were significantly higher, ranging from 41.1 to 46.8 mg kg−1. Soil inorganic N was mainly NH4+ (5.83–29.3 mg kg−1) in the grassland and shrub–grassland but dominated by NO3 (26.0–39.2 mg kg−1) in the shrubland and woodland. The soil NH4+/NO3 ratios were greater than one in the grassland and shrub–grassland and less than one in the shrubland and woodland. The total free amino acid and glycine contents in soil were very low in all recovery stages, ranging from 0.27 to 0.81 mg kg−1 and 0.03 to 0.06 mg kg−1, respectively, which were considerably lower than the soil inorganic N content. The soil NH4+ content of Bauhinia championii in the shrub–grassland (19.8 mg kg−1) was remarkably higher than that in the shrubland (12.7 mg kg−1), whereas the soil NO3 content of Bauhinia championii in the shrub–grassland (6.20 mg kg−1) was significantly lower than that in the shrubland (26.0 mg kg−1).

3.2. Root Functional Traits of Dominant Plants

The root functional traits of dominant plants varied significantly during vegetation recovery (Figure 2). Compared to grassland and shrub–grassland (17.2–18.5 m g−1, 197–253 cm2 g−1, and 4.48–9.16 g kg−1, respectively), the average specific root length (SRL) and specific root area (SRA) of dominant plants in the shrubland and woodland decreased to 9.07–11.7 m g−1 and 127–144 cm2 g−1, respectively, whereas the average root N content (RN) of dominant plants increased to 12.1–16.1 g kg−1. Except for Miscanthus floridulus in the shrub–grassland, there were no appreciable variations in the dominating plants’ root length density (RLD) during vegetation recovery. With vegetation recovery, the SRL and RLD of Miscanthus floridulus and the RN of Bauhinia championii significantly increased.

3.3. Nitrogen Uptake Rate and Ratio of Dominant Plants

During vegetation recovery, the N uptake rates of dominant plants varied considerably (Figure 3). Except for Cyclobalanopsis glauca, the NH4+ uptake rates (AMU) of dominant plants in the shrubland and woodland increased from 8.86–16.3 μg N g−1 h−1 to 19.6–29.3 μg N g−1 h−1 compared with those in the grassland and shrub–grassland. Compared to the grassland and shrub–grassland, the N uptake rates of dominant plants in the shrubland and woodland exhibited a significant increase: NO3 uptake rates (NTU) increased from 0.62–1.13 μg N g−1 h−1 to 3.38–8.19 μg N g−1 h−1; glycine uptake rates (GLYU) increased from 2.75–5.12 μg N g−1 h−1 to 5.19–8.32 μg N g−1 h−1; and total N uptake rates (TNU) increased from 12.8–22.6 μg N g−1 h−1 to 26.3–42.7 μg N g−1 h−1. The NH4+ uptake rate of dominant plants was higher than NTU and GLYU. The NO3 uptake rate, GLYU, and TNU of Bauhinia championii significantly increased with vegetation recovery.
The ratios of different N form uptake to total N uptake by dominant plants changed significantly during vegetation recovery (Figure 4). In the grassland and shrub–grassland, the NH4+ uptake ratios (βNH4+) of dominant plants ranged from 90.3% to 98.5%, whereas the NO3 uptake ratios (βNO3) were only 1.48%–9.42%. In the shrubland and woodland, βNH4+decreased to 57.4%–69.8%, while βNO3 increased to 30.1%–42.6%. The ratios of glycine uptake (βGLY) in dominant plants remained low, ranging from 0.03% to 0.32% during vegetation recovery. With vegetation recovery, the βNH4+ of Miscanthus floridulus and Bauhinia championii decreased, while βNO3 increased.

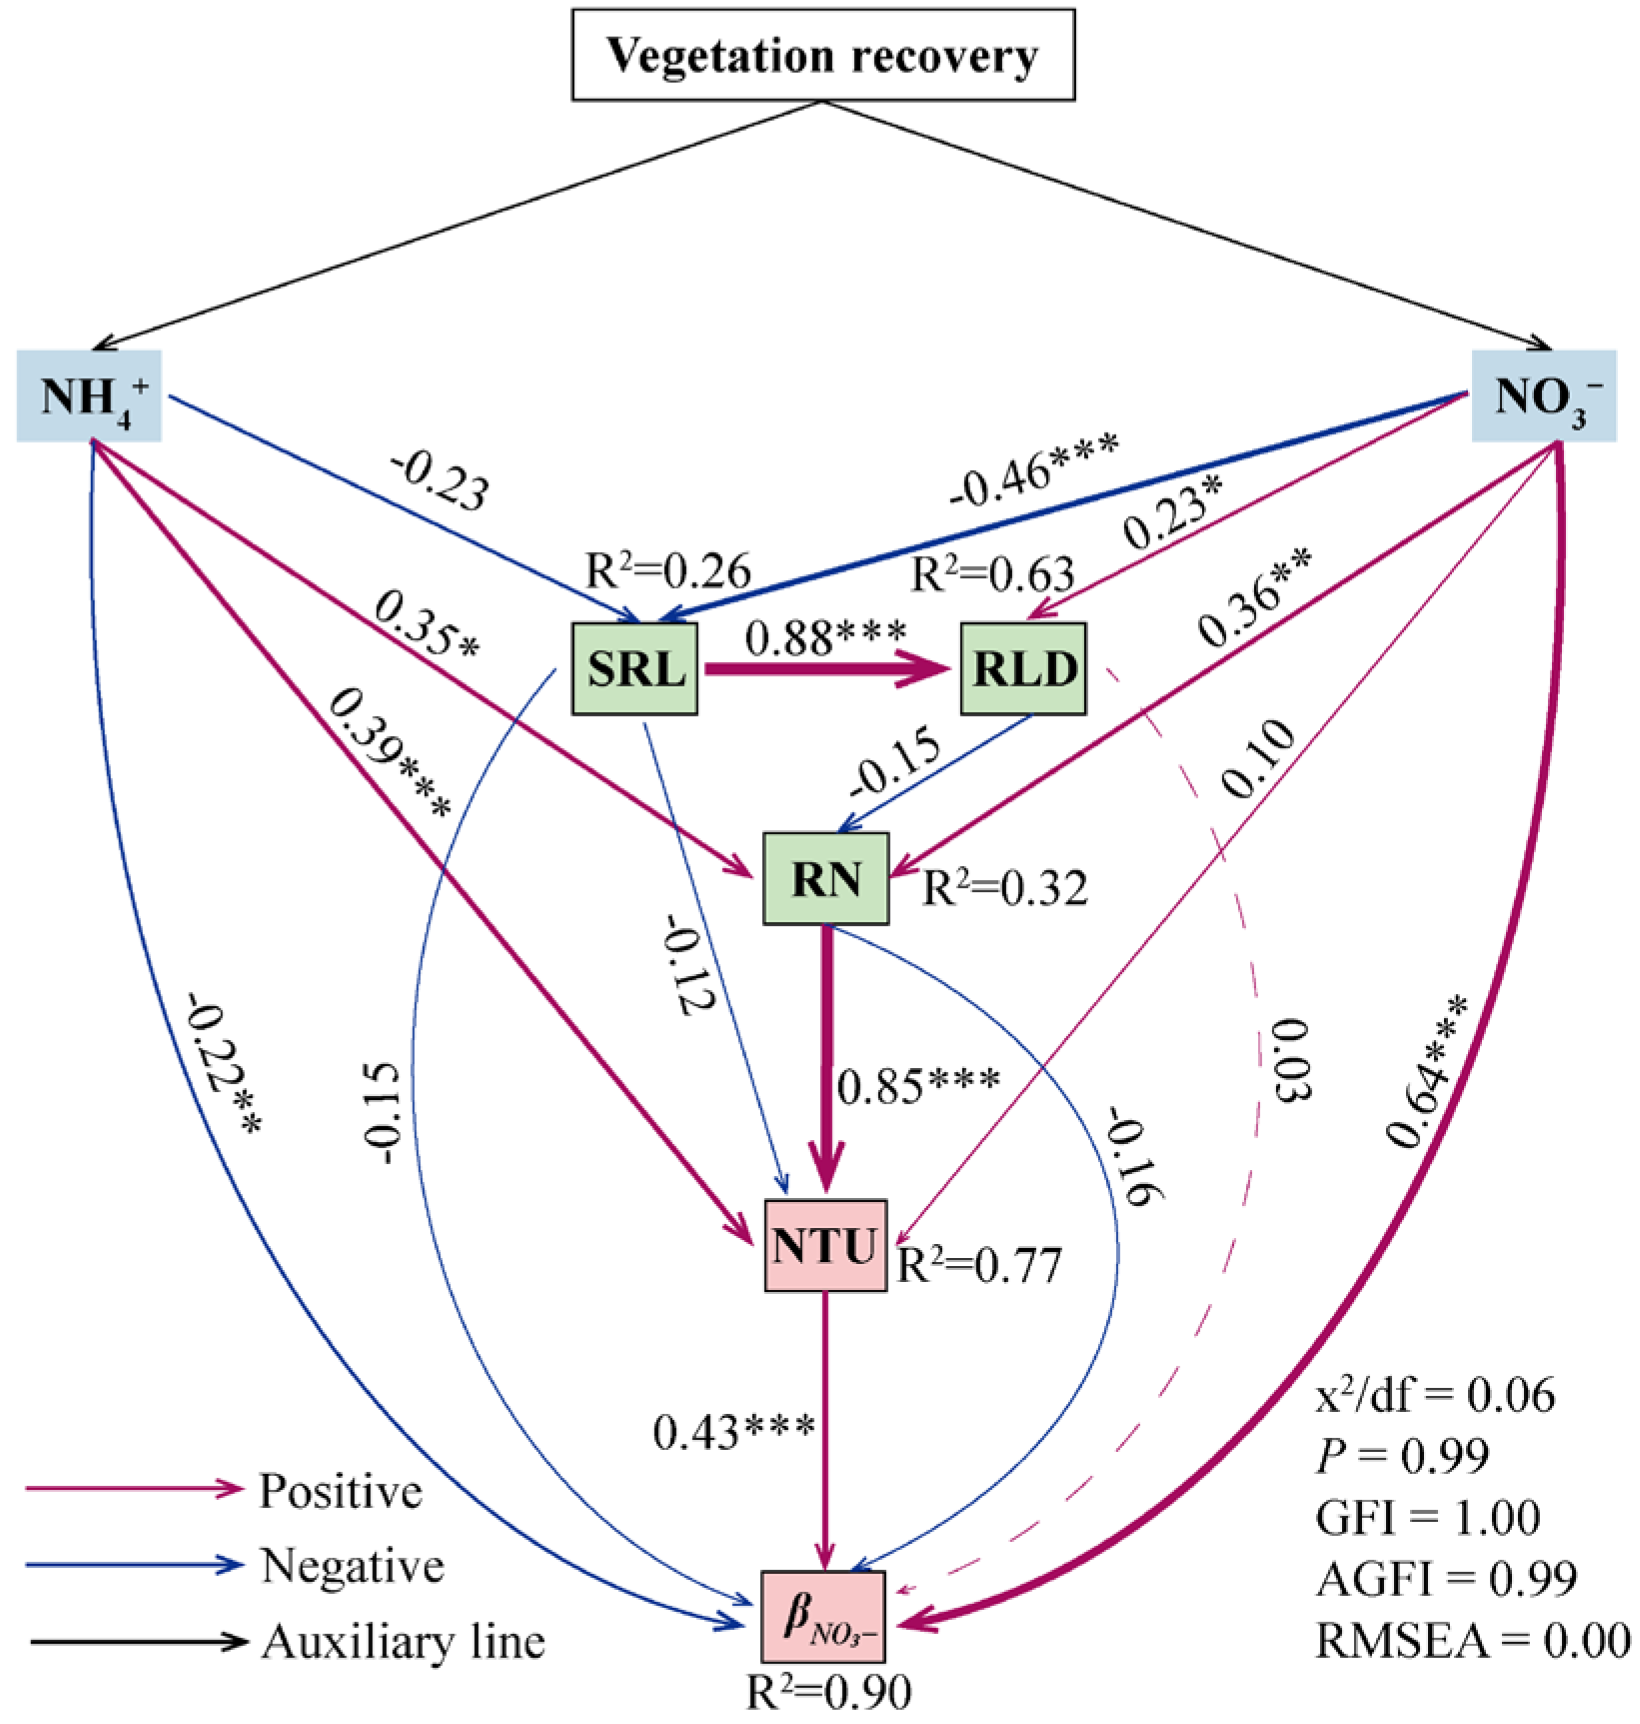
3.4. Drivers of the Nitrogen Uptake Rate and Ratio of Dominant Plants

The NH4+ uptake rate, NTU, and TNU showed strong and positive correlations with the NH4+ content and RN, and significant negative correlations with the NH4+/NO3 ratio (Figure 5). The NO3 uptake rate and TNU were also significantly and negatively correlated with SRL. The NH4+ uptake ratio showed a significant positive correlation with glycine content, as well as the SRL, SRA, and NH4+/NO3 ratio, and significant negative correlations with the NO3 content and RN, whereas βNO3 correlated with the opposite of these indicators. According to the structural equation model analysis, soil inorganic N and NTU directly affected βNO3, while plant root functional traits mainly indirectly affected βNO3 by regulating plant NTU (Figure 6).

4. Discussion

4.1. Plant Nitrogen Uptake Strategies During Vegetation Recovery

The uptake rates of NH4+ (AMU), NO3 (NTU), and glycine (GLYU) in dominant plants in karst regions were 8.86–29.3 μg N g−1 h−1, 0.62–9.18 μg N g−1 h−1, and 2.75–8.32 μg N g−1 h−1, respectively (Figure 3), which were higher than those reported in cold–temperate, temperate, and tropical forests [21,45]. Liu et al. [45] found that plant AMU, NTU, and GLYU ranged from 6.77 to 12.8 μg N g−1 h−1, 0.13 to 2.17 μg N g−1 h−1, and 0.88 to 5.93 μg N g−1 h−1 in tropical and temperate forests, respectively. Additionally, all dominant plants showed significantly higher AMU than NTU and GLYU (Figure 3), and the results were consistent with previous studies in cool–temperate, temperate, subtropical, and tropical forests [21,45,46]. The uptake rates of NH4+, NO3, and glycine in Bauhinia championii significantly increased with vegetation recovery. We also found that compared to the grassland and shrub–grassland (12.8–22.6 μg N g−1 h−1), the TNU of dominant plants significantly increased in the shrubland and woodland (26.3–42.7 μg N g−1 h−1), indicating that dominant plants improved N uptake efficiency during vegetation recovery (Figure 3). Validating the findings of Yi et al. [16], plants in the late recovery stage would acquire available soil N by increasing the physiological uptake efficiency (plant N uptake rate). The glycine-to-total-N-uptake ratio of dominant plants was only 0.03%–0.32%, which was nearly negligible, indicating that dominant plants primarily absorbed soil inorganic N. Li et al. [47] found similar results that the utilization of organic acids by plants was low under high inorganic N levels. With vegetation recovery, the NH4+-to-total-N-uptake ratio (βNH4+) of dominant plants decreased significantly, while the NO3-to-total-N-uptake ratio (βNO3) increased significantly (Figure 4). The opposite was noted in subtropical forests: plants increased βNH4+ and decreased βNO3 with succession [16]. This result suggested that the changes in plant N uptake strategies in karst regions were indeed different from those in non-karst regions with vegetation recovery and helped to enhance the understanding of N cycling in karst regions.
Changes in plant N uptake strategies during vegetation recovery in karst regions might be related to available soil N supply. Studies found that plant N uptake preferences not only had direct positive feedback effects with soil mineralization and nitrification rates [48], but were also closely related to available soil N [49,50,51]. In this study, soil inorganic N content and dominant forms changed significantly with vegetation recovery (Table 2), which might be related to changes in soil N transformation processes. Previous studies had found that soil mineralization and nitrification rates increased significantly with recovery in karst regions [6,7,52]. This might be because soils are usually clay-heavy and have low organic matter content in karst regions in early vegetation recovery phases [6,7]. These conditions hinder soil microbial growth, which may inhibit soil mineralization and nitrification processes [6,7]. In our study, soil inorganic N was low and mainly NH4+ in the grassland and shrub–grassland (Table 2), and plants generally preferred to absorb the dominant N in soil [46,53], resulting in higher βNH4 in dominant plants (Figure 4). Additionally, plants require lower energy consumption to absorb NH4+ than NO3 [20,45], which might also be an important factor for the higher βNH4+ in plants. In later vegetation recovery stages, soil organic matter accumulation improved soil quality and environment, which significantly increased soil mineralization rates [40,41]. Combined with the high pH in karst regions, NH4+ from mineralization could be easily converted to NO3 through nitrification [54,55]. In our study, soil inorganic N was high and dominated by NO3 in the shrubland and woodland (Table 2), and βNO3 in dominant plants increased significantly to obtain more available N (Figure 4). The correlation analysis found that βNH4+ had a strong negative correlation with the NH4+/NO3 ratio and a significant positive correlation with NO3 content, while βNO3 was the opposite (Figure 5), further confirming that the dominant form of soil inorganic N could significantly affect plant N uptake strategies. The research results could provide a reference basis for optimizing the NH4+/NO3 ratio to improve the efficiency of N fertilizer use by regulating the rate of the N transformation process in agricultural management in karst regions.

4.2. Relationship Between Plant Root Functional Traits and Plant Nitrogen Uptake Strategies During Vegetation Recovery

Plants regulate their root traits to obtain N sources for better environmental adaptation [46,56,57]. In this study, βNH4+ in dominant plants was significantly positively correlated with specific root length (SRL) and specific root area (SRA) and significantly negatively correlated with root nitrogen (RN) content, whereas βNO3 in dominant plants was exactly the opposite (Figure 5). These results revealed the important role played by plant root functional traits in N uptake. Previous studies have demonstrated a synergistic link between plant roots’ capacity for exploration and nutrient uptake [16,58]. The available soil N content was low in the grassland and shrub–grassland. To adapt to this environment, plants developed larger SRL and SRA to efficiently obtain resources [59,60]. However, with vegetation recovery, the amount of inorganic N in the soil increased significantly, along with a corresponding increase in plant RN content in the shrubland and woodland. Under these circumstances, plants would explore less soil space and allocate more resources to improve their defenses by developing thicker roots (e.g., decreasing SRL and SRA and increasing tissue density) [61,62,63]. Additionally, plants increased the physiological root uptake rate to correspond to the higher nutrient demand [16]. Dominant plants had smaller SRL and SRA but higher NTU and TNU in the shrubland and woodland than in the grassland and shrub–grassland. These results suggested that plants preferentially acquired N by increasing uptake efficiency in N-rich environments. Notably, NO3 was more mobile in soil and could more easily reach the roots than NH4+ [20,64]. In order to obtain more available N from the soil, dominant plants in the shrubland and woodland increased βNO3, which has a higher content and greater mobility in the soil. Furthermore, the structural equation model showed that soil inorganic N, plant N uptake rate, and plant root functional traits could significantly affect βNO3 (Figure 6). In summary, the study results verified our hypothesis that when soil inorganic N content and composition changed during vegetation recovery, plants would increase βNO3 by altering characteristics, including SRL, SRA, RN, and plant N uptake rate, to adapt to the environment. The response of plant N uptake strategies to plant root functional traits could provide a reference basis for species selection for vegetation restoration in degraded karst ecosystems.

5. Conclusions

With vegetation recovery, the soil inorganic N content significantly increased and changed from NH4+-dominated to NO3-dominated. Plants in late recovery stages had relatively lower SRL and SRA and higher RN than those in early recovery stages (when plants primarily uptake NH4+), which improved NO3 uptake and changed N uptake strategies. Ultimately, this study’s findings enhance our understanding of karst ecosystems’ N cycle and provide a theoretical foundation for agricultural N management and species selection in degraded ecosystems.

Author Contributions

Conceptualization, L.Y., L.M. and T.Z.; methodology, H.Y.; validation, L.Y., S.Y. and L.L.; formal analysis, L.Y.; data curation, L.Y.; writing—original draft preparation, L.Y.; writing—review and editing, D.W. and T.Z.; funding acquisition, T.Z. All authors have read and agreed to the published version of the manuscript.

Funding

This research was supported by the National Key Research and Development Program of China (2023YFD1902801), the Guangxi Science and Technology Planning Project, China (2023GXNSFFA026010), the National Natural Science Foundation of China (42477333, 42177243), CAGS Research Fund (YYWF 2023015), and the Natural Resource Science and Technology Strategic Research Project, China (2023-ZL-03).

Data Availability Statement

Data will be made available upon request.

Conflicts of Interest

The authors declare no conflicts of interest.

References

  1. LeBauer, D.S.; Treseder, K.K. Nitrogen limitation of net primary productivity in terrestrial ecosystems is globally distributed. Ecology 2008, 89, 371–379. [Google Scholar] [CrossRef] [PubMed]
  2. Hu, P.L.; Zhao, Y.; Xiao, D.; Xu, Z.H.; Zhang, W.; Xiao, J.; Wang, K.L. Dynamics of soil nitrogen availability following vegetation restoration along a climatic gradient of a subtropical karst region in China. J. Soil Sediments 2021, 21, 2167–2178. [Google Scholar] [CrossRef]
  3. Schimel, J.P.; Bennett, J. Nitrogen mineralization: Challenges of a changing paradigm. Ecology 2004, 85, 591–602. [Google Scholar] [CrossRef]
  4. Hobbie, E.A.; Högberg, P. Nitrogen isotopes link mycorrhizal fungi and plants to nitrogen dynamics. New Phytol. 2012, 196, 367–382. [Google Scholar] [CrossRef]
  5. Elrys, A.S.; Chen, Z.X.; Wang, J.; Uwiragiye, Y.; Helmy, A.M.; Desoky, E.S.M.; Cheng, Y.; Zhang, J.B.; Cai, Z.C.; Müeller, C. Global patterns of soil gross immobilization of ammonium and nitrate in terrestrial ecosystems. Glob. Change Biol. 2022, 28, 4472–4488. [Google Scholar] [CrossRef]
  6. Liu, L.J.; Zhu, Q.L.; Yang, L.; Elrys, A.S.; Sun, J.F.; Ni, K.; Meng, L.; Zhu, T.B. Afforestation increases soil inorganic N supply capacity and lowers plant N limitation in subtropical karst areas. Geoderma 2024, 443, 116848. [Google Scholar] [CrossRef]
  7. Wen, D.N.; Huang, Y.Y.; Huang, Y.F.; Ding, N.N.; Ni, K.; Wang, H.; Elrys, A.S.; Meng, L.; Zhu, T.B.; Gessert, A.; et al. Karst rocky desertification restoration increases soil inorganic N supply to reduce plant N limitation. Catena 2024, 241, 108012. [Google Scholar] [CrossRef]
  8. Du, E.; Terrer, C.; Pellegrini, A.F.; Ahlström, A.; van Lissa, C.J.; Zhao, X.; Xia, N.; We, X.; Jackson, R.B. Global patterns of terrestrial nitrogen and phosphorus limitation. Nat. Geosci. 2020, 13, 221–226. [Google Scholar] [CrossRef]
  9. Ågren, G.I.; Wetterstedt, J.Å.M.; Billberger, M.F.K. Nutrient limitation on terrestrial plant growth–modeling the interaction between nitrogen and phosphorus. New Phytol. 2012, 194, 953–960. [Google Scholar] [CrossRef]
  10. Lan, J.C.; Hu, N.; Fu, W.L. Soil carbon-nitrogen coupled accumulation following the natural vegetation restoration of abandoned farmlands in a karst rocky desertification region. Ecol. Eng. 2020, 158, 106033. [Google Scholar] [CrossRef]
  11. Moreau, D.; Bardgett, R.D.; Finlay, R.D.; Jones, D.L.; Philippot, L. A plant perspective on nitrogen cycling in the rhizosphere. Funct. Ecol. 2019, 33, 540–552. [Google Scholar] [CrossRef]
  12. Zhang, J.B.; Wang, J.; Müller, C.; Cai, Z.C. Ecological and practical significances of crop species preferential N uptake matching with soil N dynamics. Soil Boil. Biochem. 2016, 103, 63–70. [Google Scholar] [CrossRef]
  13. Zhou, X.L.; Wang, A.; Hobbie, E.A.; Zhu, F.F.; Qu, Y.Y.; Dai, L.M.; Li, D.J.; Liu, X.Y.; Zhu, W.X.; Koba, K.; et al. Mature conifers assimilate nitrate as efficiently as ammonium from soils in four forest plantations. New Phytol. 2021, 229, 3184–3194. [Google Scholar] [CrossRef] [PubMed]
  14. Oldroyd, G.E.D.; Leyser, O. A plant’s diet, surviving in a variable nutrient environment. Science 2020, 368, 45. [Google Scholar] [CrossRef]
  15. Khokon, A.M.; Janz, D.; Polle, A. Ectomycorrhizal diversity, taxon-specific traits and root N uptake in temperate beech forests. New Phytol. 2023, 239, 739–751. [Google Scholar] [CrossRef]
  16. Yi, R.J.; Liu, Q.Y.; Yang, F.T.; Dai, X.Q.; Meng, S.W.; Fu, X.L.; Li, S.G.; Kou, L.; Wang, H.M. Complementary belowground strategies underlie species coexistence in an early successional forest. New Phytol. 2023, 238, 612–623. [Google Scholar] [CrossRef]
  17. Bergmann, J.; Weigelt, A.; Plas, F.V.W.; Laughlin, D.C.; Kuyper, T.W.; Guerrero-Ramirez, N.R.; Valverde-Barrantes, O.J.; Bruelheide, H.; Freschet, G.T.; Iversen, C.M.; et al. The fungal collaboration gradient dominates the root economics space in plants. Sci. Adv. 2020, 6, eaba3756. [Google Scholar] [CrossRef]
  18. Guo, W.J.; Zhang, Z.L.; Liu, Q.; Xiao, J.; Yin, H.J. Seasonal variations in plant nitrogen acquisition in an ectomycorrhizal alpine forest on the eastern Tibetan Plateau, China. Plant Soil 2021, 459, 79–91. [Google Scholar] [CrossRef]
  19. Yan, H.; Freschet, G.T.; Wang, H.; Hogan, J.A.; Li, S.; Valverde-Barrantes, O.J.; Fu, X.L.; Wang, R.L.; Dai, X.Q.; Jiang, L.; et al. Mycorrhizal symbiosis pathway and edaphic fertility frame root economics space among tree species. New Phytol. 2022, 234, 1639–1653. [Google Scholar] [CrossRef]
  20. Xie, L.L.; Hu, X.F.; Li, W.T.; Liu, Q.H.; Yin, C.Y. Plant-plant interactions affect seasonal nitrogen uptake of subalpine conifer seedlings by altering root traits and soil nitrogen availabilities. Physiol. Plantarum. 2024, 176, e14204. [Google Scholar] [CrossRef]
  21. Ito, T.; Tanaka-Oda, A.; Masumoto, T.; Akatsuki, M.; Makita, N. Different relationships of fine root traits with root ammonium and nitrate uptake rates in conifer forests. J. Forestry Res. 2023, 28, 25–32. [Google Scholar] [CrossRef]
  22. Zhang, Z.L.; Li, N.; Xiao, J.; Zhao, C.Z.; Zou, T.T.; Li, D.D.; Liu, Q.; Yin, H.J. Changes in plant nitrogen acquisition strategies during the restoration of spruce plantations on the eastern Tibetan Plateau, China. Soil Boil. Biochem. 2018, 119, 50–58. [Google Scholar] [CrossRef]
  23. Ding, J.X.; Kong, D.L.; Zhang, Z.L.; Cai, Q.; Xiao, J.; Liu, Q.; Yin, H.J. Climate and soil nutrients differentially drive multidimensional fine root traits in ectomycorrhizal-dominated alpine coniferous forests. J. Ecol. 2020, 108, 2544–2556. [Google Scholar] [CrossRef]
  24. White, P.J.; George, T.S.; Gregory, P.J.; Bengough, A.G.; Hallett, P.D.; McKenzie, B.M. Matching roots to their environment. Ann. Bot. 2013, 112, 207–222. [Google Scholar] [CrossRef]
  25. Lynch, J.P. Root phenotypes for improved nutrient capture: An underexploited opportunity for global agriculture. New Phytol. 2019, 223, 548–564. [Google Scholar] [CrossRef]
  26. Liu, M.; Xu, X.L.; Yang, B.; Zhang, N.L.; Ma, Z.Q.; van Dam, N.M.; Bruelheide, H. Niche partitioning in nitrogen uptake among subtropical tree species enhances biomass production. Sci. Total Environ. 2022, 823, 153716. [Google Scholar] [CrossRef]
  27. Wang, K.L.; Zhang, C.H.; Chen, H.S.; Yue, Y.M.; Zhang, W.; Zhang, M.Y.; Qi, X.K.; Fu, Z.Y. Karst landscapes of China: Patterns, ecosystem processes and services. Landsc. Ecol. Eng. 2019, 34, 2743–2763. [Google Scholar] [CrossRef]
  28. Hu, C.P.; Liu, Z.Q.; Xiong, K.N.; Lyu, X.X.; Li, Y.; Zhang, R.K. Temporal and Spatial Variations in Carbon/Nitrogen Output in the Karst Critical Zone and Its Response to the Forest Ecosystem of Karst Desertification Control. Forests 2023, 14, 1121. [Google Scholar] [CrossRef]
  29. Hu, G.; Pang, Q.L.; Hu, C.; Xu, C.H.; Zhang, Z.H.; Zhong, C.F. Beta diversity patterns and determinants among vertical layers of tropical seasonal rainforest in karst peak-cluster depressions. Forests 2024, 15, 365. [Google Scholar] [CrossRef]
  30. Tong, X.W.; Brandt, M.; Yue, Y.M.; Ciais, P.; Rudbeck, J.M.; Penuelas, J.; Wigneron, J.; Xiao, X.M.; Song, X.P.; Horion, S.; et al. Forest management in southern China generates short term extensive carbon sequestration. Nat. Commun. 2020, 11, 1191–1197. [Google Scholar] [CrossRef]
  31. Dobson, A.; Rowe, Z.; Berger, J.; Wholey, P.; Caro, T. Biodiversity loss due to more than climate change. Science 2021, 374, 699–700. [Google Scholar] [CrossRef] [PubMed]
  32. Tan, S.H.; Cao, Y.Q.; Zhang, Z.F.; Zhou, L.W.; Li, X.Q. The Grain for Green Program Promotes Soil Organic Matter Accumulation and Improves Soil Fungal Diversity in the Southwestern Karst Region. Forests 2025, 16, 121. [Google Scholar] [CrossRef]
  33. Ma, T.S.; Deng, X.W.; Chen, L.; Xiang, W.H. The soil properties and their effects on plant diversity in different degrees of rocky desertification. Sci. Total Environ. 2020, 736, 139667. [Google Scholar] [CrossRef] [PubMed]
  34. Peng, X.D.; Dai, Q.H.; Ding, G.J.; Shi, D.M.; Li, C.L. Impact of vegetation restoration on soil properties in near-surface fissures located in karst rocky desertification regions. Soil Till. Res. 2020, 200, 104620. [Google Scholar] [CrossRef]
  35. Xiao, J.; Xiong, K.N. A review of agroforestry ecosystem services and its enlightenment on the ecosystem improvement of rocky desertification control. Sci. Total Environ. 2022, 852, 158538. [Google Scholar] [CrossRef]
  36. Zhang, W.; Zhao, J.; Pan, F.J.; Li, D.J.; Chen, H.S.; Wang, K.L. Changes in nitrogen and phosphorus limitation during secondary succession in a karst region in southwest China. Plant Soil 2015, 391, 77–91. [Google Scholar] [CrossRef]
  37. Song, M.; He, T.G.; Chen, H.; Wang, K.L.; Li, D.J. Dynamics of soil gross nitrogen transformations during post-agricultural succession in a subtropical karst region. Geoderma 2019, 341, 1–9. [Google Scholar] [CrossRef]
  38. Liang, J.H.; Cui, X.D.; Wen, L.Y.; Liu, D.; Yi, C.X.; Huang, K.Z.; Wang, J. Comparison of soil calcium and magnesium fractions transport in classic karst and non-karst region, Guilin. Carsologica Sin. 2022, 41, 220–227. (In Chinese) [Google Scholar]
  39. Rowley, M.C.; Grand, S.; Verrecchia, E.P. Calcium-mediated stabilization of soil organic carbon. Biogeochemistry 2018, 137, 27–49. [Google Scholar] [CrossRef]
  40. Zhu, X.A.; Shen, Y.X.; Yuan, X.; Yuan, C.; Jin, L.Y.; Zhao, Z.M.; Chen, F.J.; Yang, B.; Jiang, X.J.; Liu, W.J. High levels of soil calcium and clay facilitate the recovery and stability of organic carbon: Insights from different land uses in the karst of China. Environ. Sci. Pollut. R. 2024, 31, 34234–34248. [Google Scholar] [CrossRef]
  41. Yang, H.; Zhu, T.B.; Wu, X.; Wu, H.Y.; Tang, W.; Lan, G.Y.; Christoph, M. Effect of sugar orange short-term planting on soil nitrogen conversion process in karst area. Carsologica Sin. 2023, 42, 52–60. (In Chinese) [Google Scholar]
  42. Kramer-Walter, K.R.; Bellingham, P.J.; Millar, T.R.; Smissen, R.D.; Richardson, S.J. Root traits are multidimensional: Specific root length is independent from root tissue density and the plant economic spectrum. J. Ecol. 2016, 104, 1299–1310. [Google Scholar] [CrossRef]
  43. Li, D.J.; Wen, L.; Xiao, K.C.; Song, T.Q.; Wang, K.L. Responses of soil gross nitrogen transformations to three vegetation restoration strategies in a subtropical karst region. Land Degrad. Dev. 2021, 32, 2520–2527. [Google Scholar] [CrossRef]
  44. Lipson, D.A.; Raab, T.K.; Schmidt, S.K.; Monson, R.K. An empirical model of amino acid transformations in an alpine Soil. Soil Boil. Biochem. 2001, 33, 189–198. [Google Scholar] [CrossRef]
  45. Liu, M.; Li, C.C.; Xu, X.L.; Wanek, W.; Jiang, N.; Wang, H.M.; Yang, X.D. Organic and inorganic nitrogen uptake by 21 dominant tree species in temperate and tropical forests. Tree Physiol. 2017, 37, 1515–1526. [Google Scholar] [CrossRef]
  46. Liu, Q.Y.; Wang, H.M.; Xu, X.L. Root nitrogen acquisition strategy of trees and understory species in a subtropical pine plantation in southern China. Eur. J. Forest Res. 2020, 139, 791–804. [Google Scholar] [CrossRef]
  47. Li, C.C.; Li, Q.R.; Qiao, N.; Xu, X.L.; Li, Q.K.; Wang, H.M. Inorganic and organic nitrogen uptake by nine dominant subtropical tree species. iForest 2015, 9, 253. [Google Scholar] [CrossRef]
  48. Yuan, X.Y.; She, W.W.; Guo, Y.P.; Qiao, Y.G.; Liu, L.; Song, C.Y.; Qin, S.G.; Zhang, Y.Q. Linkage between plant nitrogen preference and rhizosphere effects on soil nitrogen transformation reveals a plant resource adaptive strategies in nitrogen-limited soils. Plant Soil 2025. [Google Scholar] [CrossRef]
  49. Püschel, D.; Bitterlich, M.; Rydlová, J.; Bukovská, P.; Sudová, R.; Jansa, J. Benefits in plant N uptake via the mycorrhizal pathway in ample soil moisture persist under severe drought. Soil Boil. Biochem. 2023, 187, 109220. [Google Scholar] [CrossRef]
  50. Guan, M.; Pan, X.C.; Sun, J.K.; Chen, J.X.; Kong, D.L.; Feng, Y.L. Nitrogen acquisition strategy and its effects on invasiveness of a subtropical invasive plant. Front. Plant Sci. 2023, 14, 1243849. [Google Scholar] [CrossRef]
  51. Reuter, R.; Ferlian, O.; Tarkka, M.; Eisenhauer, N.; Pritsch, K.; Simon, J. Tree species rather than type of mycorrhizal association drive inorganic and organic nitrogen acquisition in tree–tree interactions. Tree Physiol. 2021, 41, 2096–2108. [Google Scholar] [CrossRef] [PubMed]
  52. Wu, J.H.; Gong, X.H.; Shu, Y.G. Effects of vegetation restoration in karst areas on soil nitrogen mineralisation. PeerJ 2024, 12, e18582. [Google Scholar] [CrossRef] [PubMed]
  53. Liu, M.; Xu, X.l.; Wanek, W.; Sun, J.; Bardgett, R.D.; Tian, Y.Q.; Cui, X.Y.; Jiang, L.L.; Ma, Z.Q.; Kuzyakov, Y.; et al. Nitrogen availability in soil controls uptake of different nitrogen forms by plants. New Phytol. 2025, 245, 1450–1467. [Google Scholar] [CrossRef]
  54. Elrys, A.S.; Wang, J.; Metwally, M.A.; Cheng, Y.; Zhang, J.B.; Cai, Z.C.; Chang, S.X.; Müller, C. Global gross nitrification rates are dominantly driven by soil carbon-to-nitrogen stoichiometry and total nitrogen. Glob. Change Biol. 2021, 27, 6512–6524. [Google Scholar] [CrossRef]
  55. Li, D.J.; Yang, Y.; Chen, H.; Xiao, K.C.; Song, T.Q.; Wang, K.L. Soil gross nitrogen transformations in typical karst and nonkarst forests, southwest China. J. Geophys. Res. Biogeo. 2017, 122, 2831–2840. [Google Scholar] [CrossRef]
  56. Ren, H.; Gao, G.; Ma, Y.; Li, Z.; Wang, S.; Gu, J. Shift of root nitrogen-acquisition strategy with tree age is mediated by root functional traits along the collaboration gradient of the root economics space. Tree Physiol. 2023, 43, 1341–1353. [Google Scholar] [CrossRef]
  57. Liu, Q.Y.; Chen, Y.X.; Chen, Y.M. Nitrogen acquisition strategy shifts with tree age depending on root functional traits and soil properties in Larix principis-rupprechtii plantations. Front. Plant Sci. 2024, 15, 1358367. [Google Scholar] [CrossRef]
  58. Weemstra, M.; Mommer, L.; Visser, E.J.W.; van Ruijven, J.; Kuyper, T.W.; Mohren, G.M.J.; Sterck, F.J. Towards a multidimensional root trait framework: A tree root review. New Phytol. 2016, 211, 1159–1169. [Google Scholar] [CrossRef]
  59. Ma, Z.Q.; Guo, D.L.; Xu, X.L.; Lu, M.Z.; Bardgett, R.D.; Eissenstat, D.M.; McCormack, M.L.; Hedin, L.O. Evolutionary history resolves global organization of root functional traits. Nature 2018, 555, 94–97. [Google Scholar] [CrossRef]
  60. Lu, B.H.; Qian, J.; Hu, J.; Wang, P.F.; Jin, W.; Tang, S.J.; He, Y.X.; Zhang, C. The role of fine root morphology in nitrogen uptake by riparian plants. Plant Soil 2022, 472, 527–542. [Google Scholar] [CrossRef]
  61. Stefan, W.; Peter, R.; Edwards, P.J. Phenotypic plasticity of grass root anatomy in response to light intensity and nutrient supply. Ann. Bot. 2001, 88, 1071–1078. [Google Scholar]
  62. Ficken, C.D.; Wright, J.P. Nitrogen uptake and biomass resprouting show contrasting relationships with resource acquisitive and conservative plant traits. J. Veg. Sci. 2019, 30, 65–74. [Google Scholar] [CrossRef]
  63. Zhu, H.; Zhao, J.; Gong, L. The morphological and chemical properties of fine roots respond to nitrogen addition in a temperate Schrenk’s spruce (Picea schrenkiana) forest. Sci. Rep. 2021, 11, 3839. [Google Scholar] [CrossRef]
  64. Andrews, M.; Raven, J.A.; Lea, P.J. Do plants need nitrate? The mechanisms by which nitrogen form affects plants. Ann. Appl. Biol. 2013, 163, 174–199. [Google Scholar] [CrossRef]
Figure 1. (a) Location of the study site; (b) dig up the fine roots; (c) wash fine roots; (d) labeling fine roots; (e) harvest labeling fine roots.
Forests 16 00839 g001
Figure 2. (a) SRL, specific root length; (b) SRA, specific root area; (c) RLD, root length density; (d) RN, root N content of dominant plants in different vegetation recovery stages. At the p < 0.05 level, significant changes from different dominant plants are represented by different lowercase letters.
Forests 16 00839 g002
Figure 3. (a) AMU, the NH4+ uptake rate; (b) NTU, the NO3 uptake rate; (c) GLYU, the glycine uptake rate; (d) TNU, the total N uptake rate by dominant plants. At the p < 0.05 level, significant changes from different dominant plants are represented by different lowercase letters.
Forests 16 00839 g003
Figure 4. βNH4+, the NH4+ uptake ratio; βNO3, the NO3 uptake ratio; βGLY, the glycine-to-total-N-uptake ratio of dominant plants. The diagram contains βGLY, but the scale of βGLY is too small to be seen in the diagram.
Forests 16 00839 g004
Figure 5. Relationships between plant N uptake rates and ratios, available soil N, and plant root functional traits during vegetation recovery. GLY, glycine; SRL, specific root length; SRA, specific root area; RLD, root length density; RN, root N content; AMU, the NH4+ uptake rate; NTU, the NO3 uptake rate; GLYU, the glycine uptake rate; TNU, the total N uptake rate; βNH4+, the NH4+ uptake ratio; βNO3, the NO3 uptake ratio; βGLY, the GLY uptake ratio.
Forests 16 00839 g005
Figure 6. The possible impacts of vegetation recovery on available soil N, plant root functional traits, and plant N uptake rates and ratios were described using a structural equation model (SEM). The variables and standard path coefficients are represented by the numbers next to the arrows. Each predictor has the following significance levels: * p < 0.05, ** p < 0.01, and *** p < 0.001. SRL, specific root length; RLD, root length density; RN, root N content; NTU, the NO3 uptake rate of plants; βNO3, the NO3-to-total-N-uptake ratio of plants.
Forests 16 00839 g006
Table 1. Fundamental details of the study sites at different recovery stages.
Recovery StagesLongitude and LatitudeAltitude (m)Slope (°)Soil Depth (cm)Interference Conditions
Grassland110°32′ E
25°12′ N
324–3412–50–30Abandoned, no interference for 3–5 years
Shrub–grassland110°32′ E
25°12′ N
322–3484–80–30Abandoned, no interference for 7–10 years
Shrubland110°53′ E
25°21′ N
321–34312–150–25Abandoned, no interference for 30–35 years
Woodland110°52′ E
25°20′ N
246–30020–250-20Abandoned, no interference for 70–80 years
Table 2. Inorganic and organic nitrogen contents (mean ± SD) in the soil of dominant plants (n = 5) in different vegetation recovery stages.
Dominant
Plants
Recovery
Stages
NH4+
(mg kg−1)
NO3
(mg kg−1)
Glycine
(mg kg−1)
TFAA
(mg kg−1) A
Inorganic N
(mg kg−1)
NH4+/NO3
ratio
Miscanthus floridulusGrassland8.51 ± 5.72 de5.92 ± 2.88 d0.03 ± 0.01 b0.59 ± 0.12 ab14.4 ± 7.62 de1.52 ± 1.04 bc
Miscanthus floridulusShrub–grassland5.83 ± 1.00 e5.71 ± 3.05 d0.06 ± 0.02 a0.81 ± 0.10 a11.5 ± 3.47 e1.31 ± 0.72 cd
Alchornea trewioides29.3 ± 4.43 a13.3 ± 2.92 d0.04 ± 0.02 ab0.56 ± 0.39 abc42.6 ± 3.94 ab2.32 ± 0.85 ba
Bauhiniachampionii19.8 ± 3.91 b6.20 ± 2.70 d0.04 ± 0.01 ab0.44 ± 0.09 bc26.0 ± 6.05 cd3.62 ± 1.24 a
Loropetalum chinenseShrubland8.84 ± 4.12 de34.6 ± 5.27 ab0.03 ± 0.01 b0.27 ± 0.11 c43.4 ± 9.35 ab0.24 ± 0.09 e
Bauhinia championii12.7 ± 5.09 cd26.0 ± 12.1 bc0.03 ± 0.01 b0.27 ± 0.26 c38.8 ± 16.7 bc0.52 ± 0.16 de
Cyclobalanopsis glaucaWoodland15.3 ± 3.44 bc39.2 ± 13.1 a0.03 ± 0.00 b0.31 ± 0.12 bc54.6 ± 15.4 a0.43 ± 0.17 de
Mallotus philippinensis15.0 ± 4.40 bc24.0 ± 8.54 c0.04 ± 0.02 ab0.40 ± 0.20 bc39.0 ± 8.79 bc0.70 ± 0.38 ced
A TFAA, total free amino acid. At the p < 0.05 level, significant changes from different dominant plants are represented by different lowercase letters. Notes: If the mean is not specified in the results, this means that the mean value for each dominant species was analyzed. If the mean is specified, it refers to the overall mean of all of the dominant species in each recovery stage.
Disclaimer/Publisher’s Note: The statements, opinions and data contained in all publications are solely those of the individual author(s) and contributor(s) and not of MDPI and/or the editor(s). MDPI and/or the editor(s) disclaim responsibility for any injury to people or property resulting from any ideas, methods, instructions or products referred to in the content.

