
Enhanced Accuracy in Urban Tree Biomass Estimation: Developing Allometric Equations with Land Use Classifications

 , ,
, ,  , ,
, ,  ,
,  and
and
Abstract
1. Introduction
2. Materials and Methods
2.1. Study Area
2.2. Destructive Measurement
2.3. Non-Destructive Measurement
2.4. Data Analysis
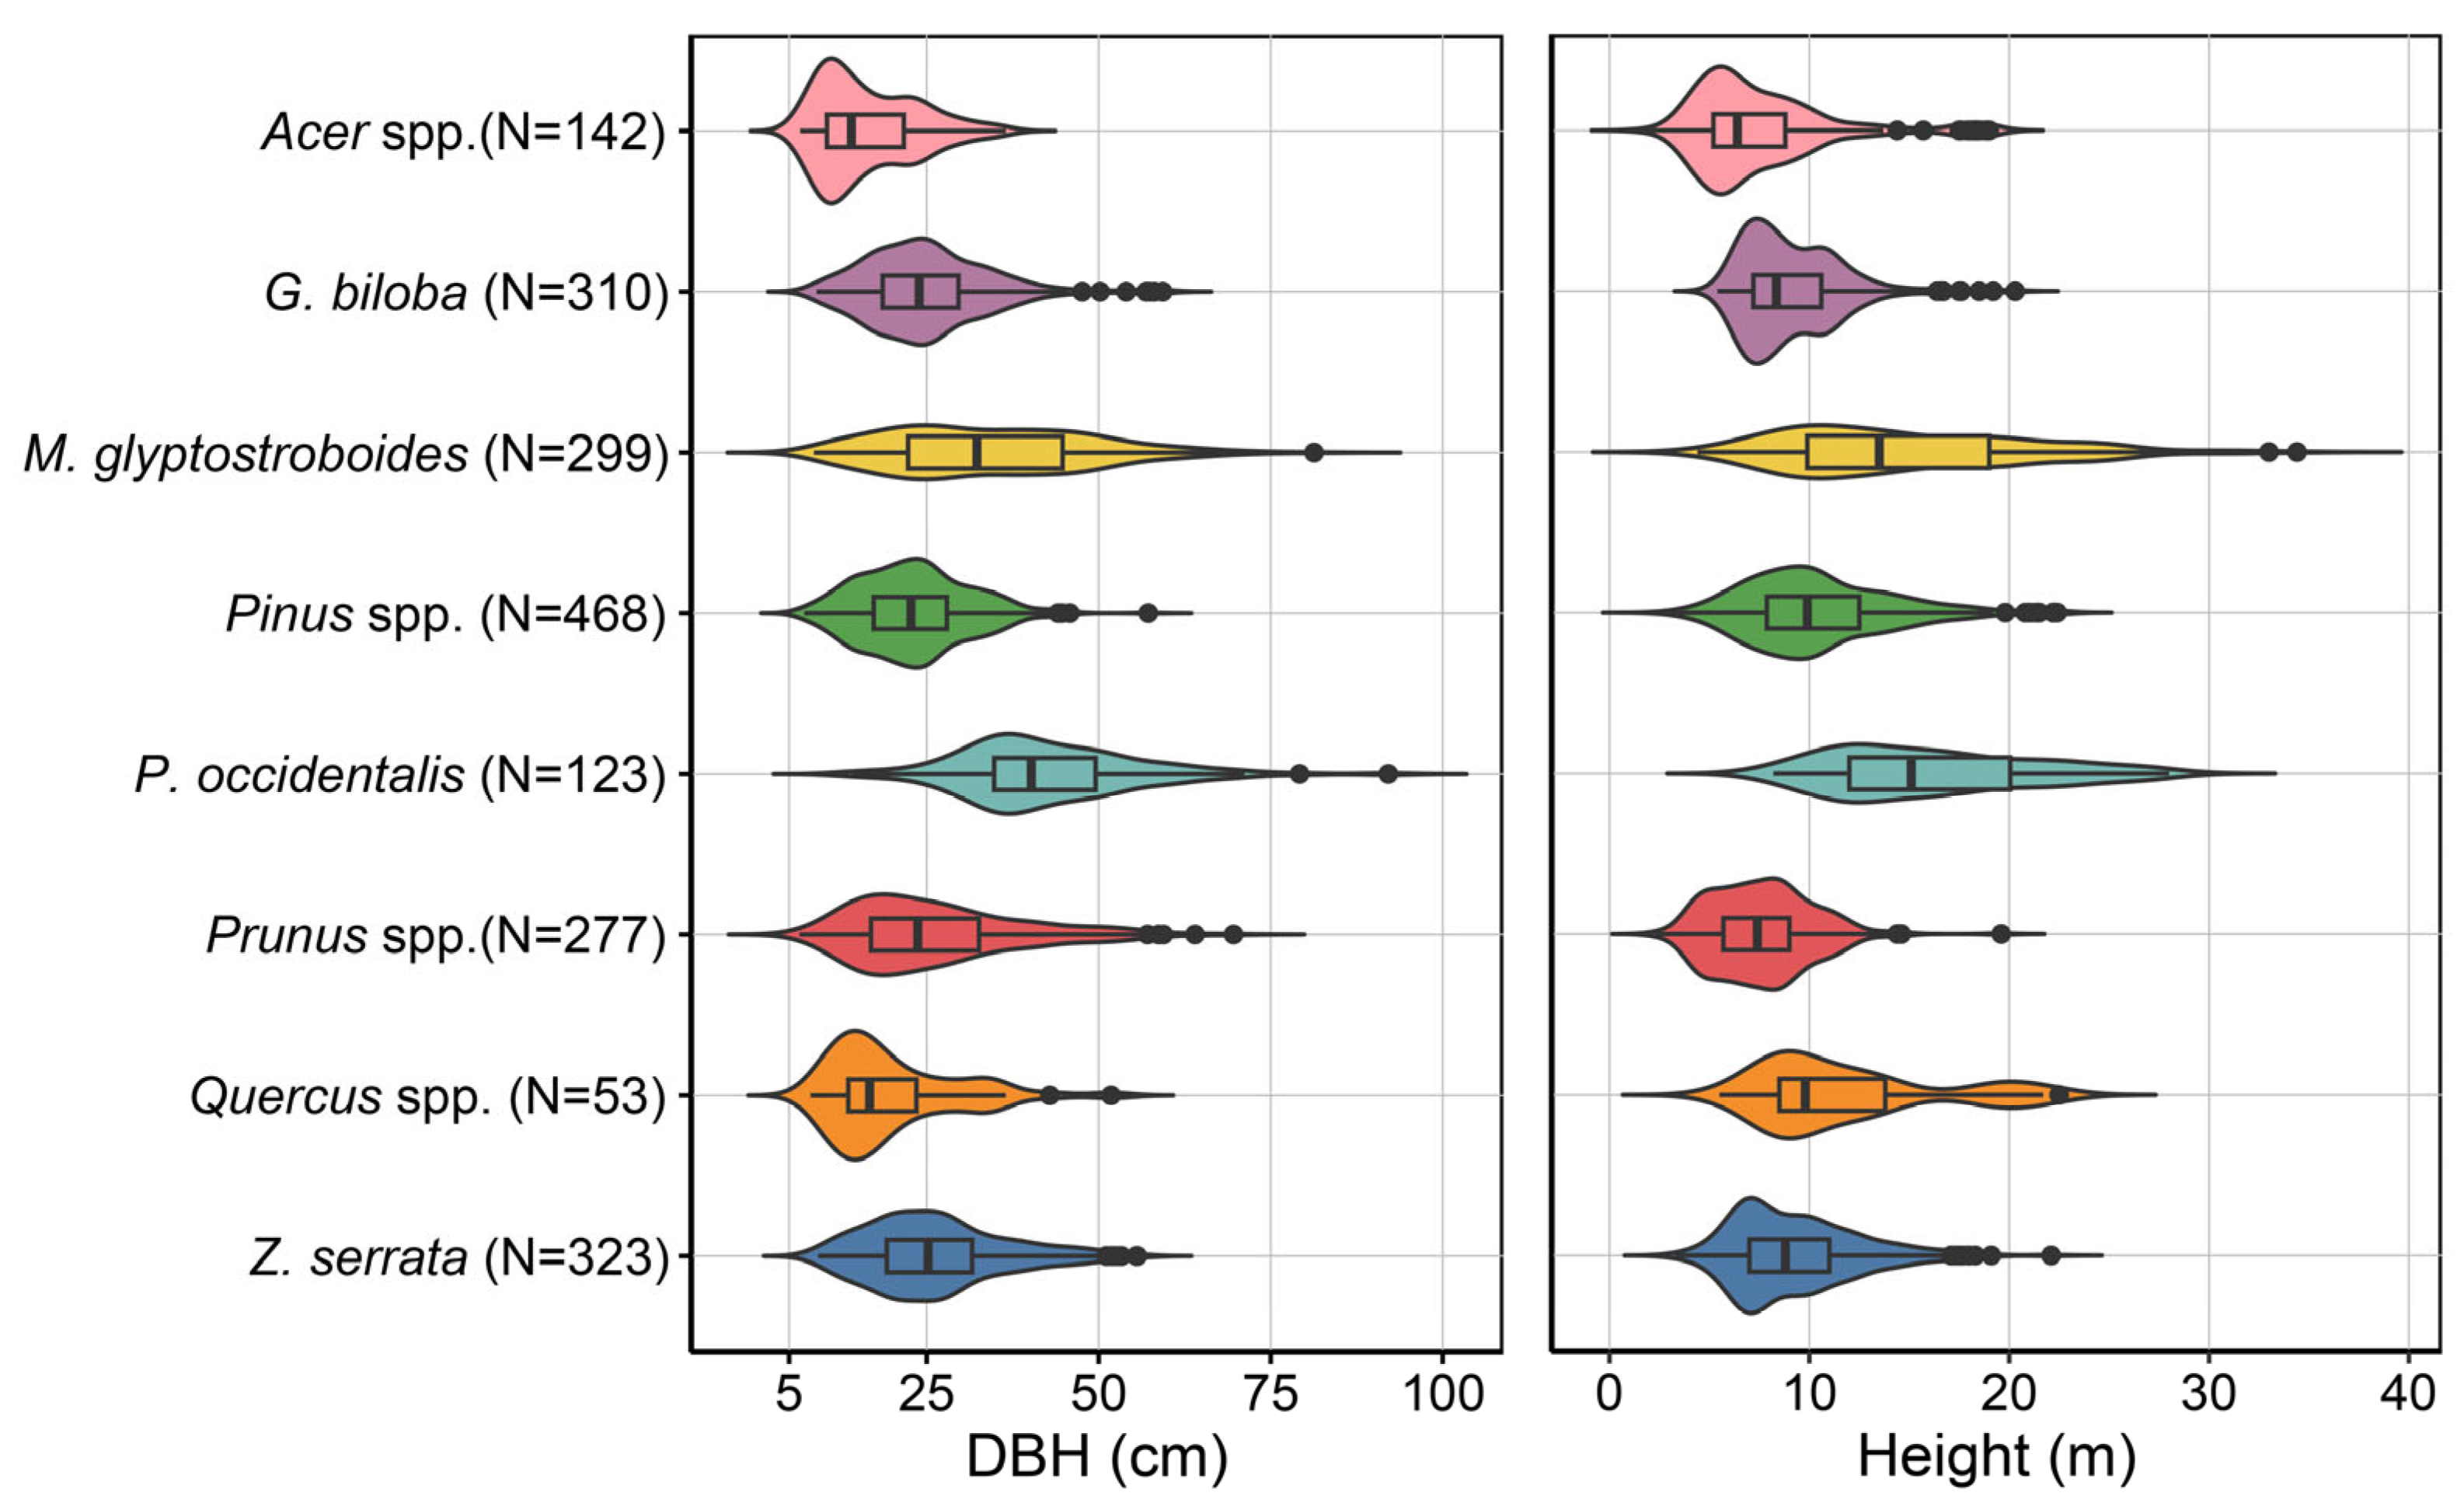
3. Results
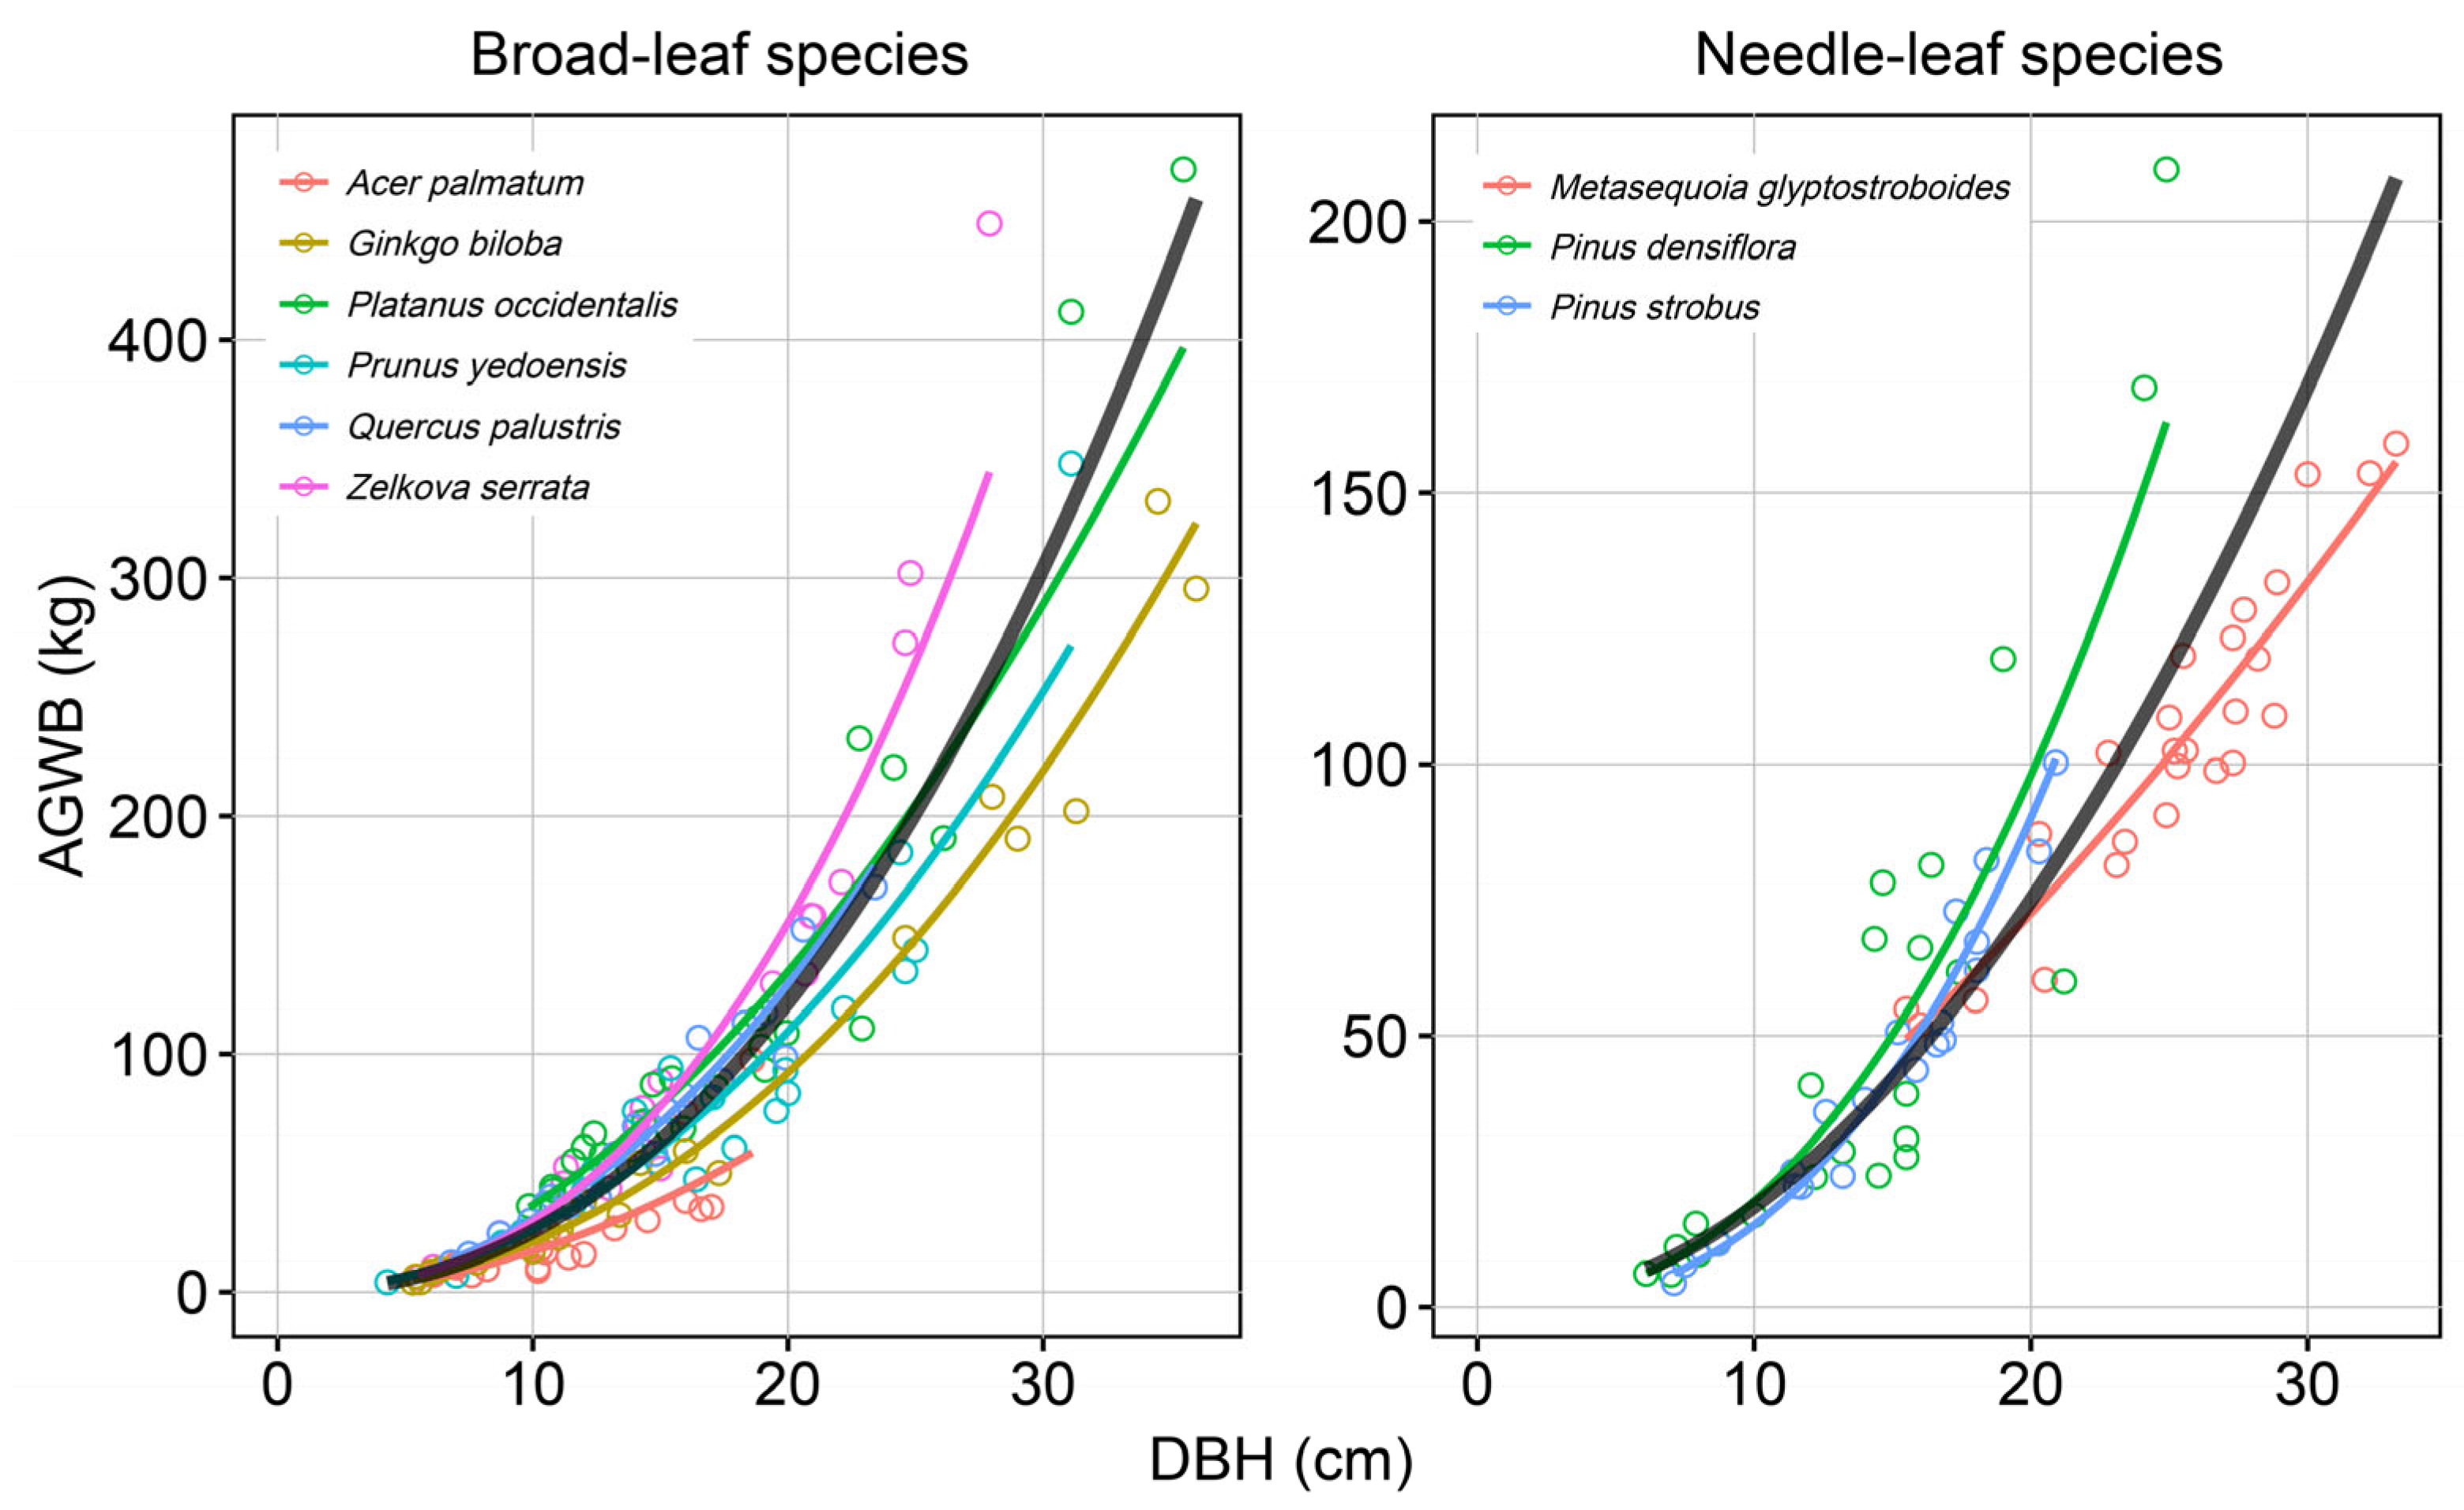
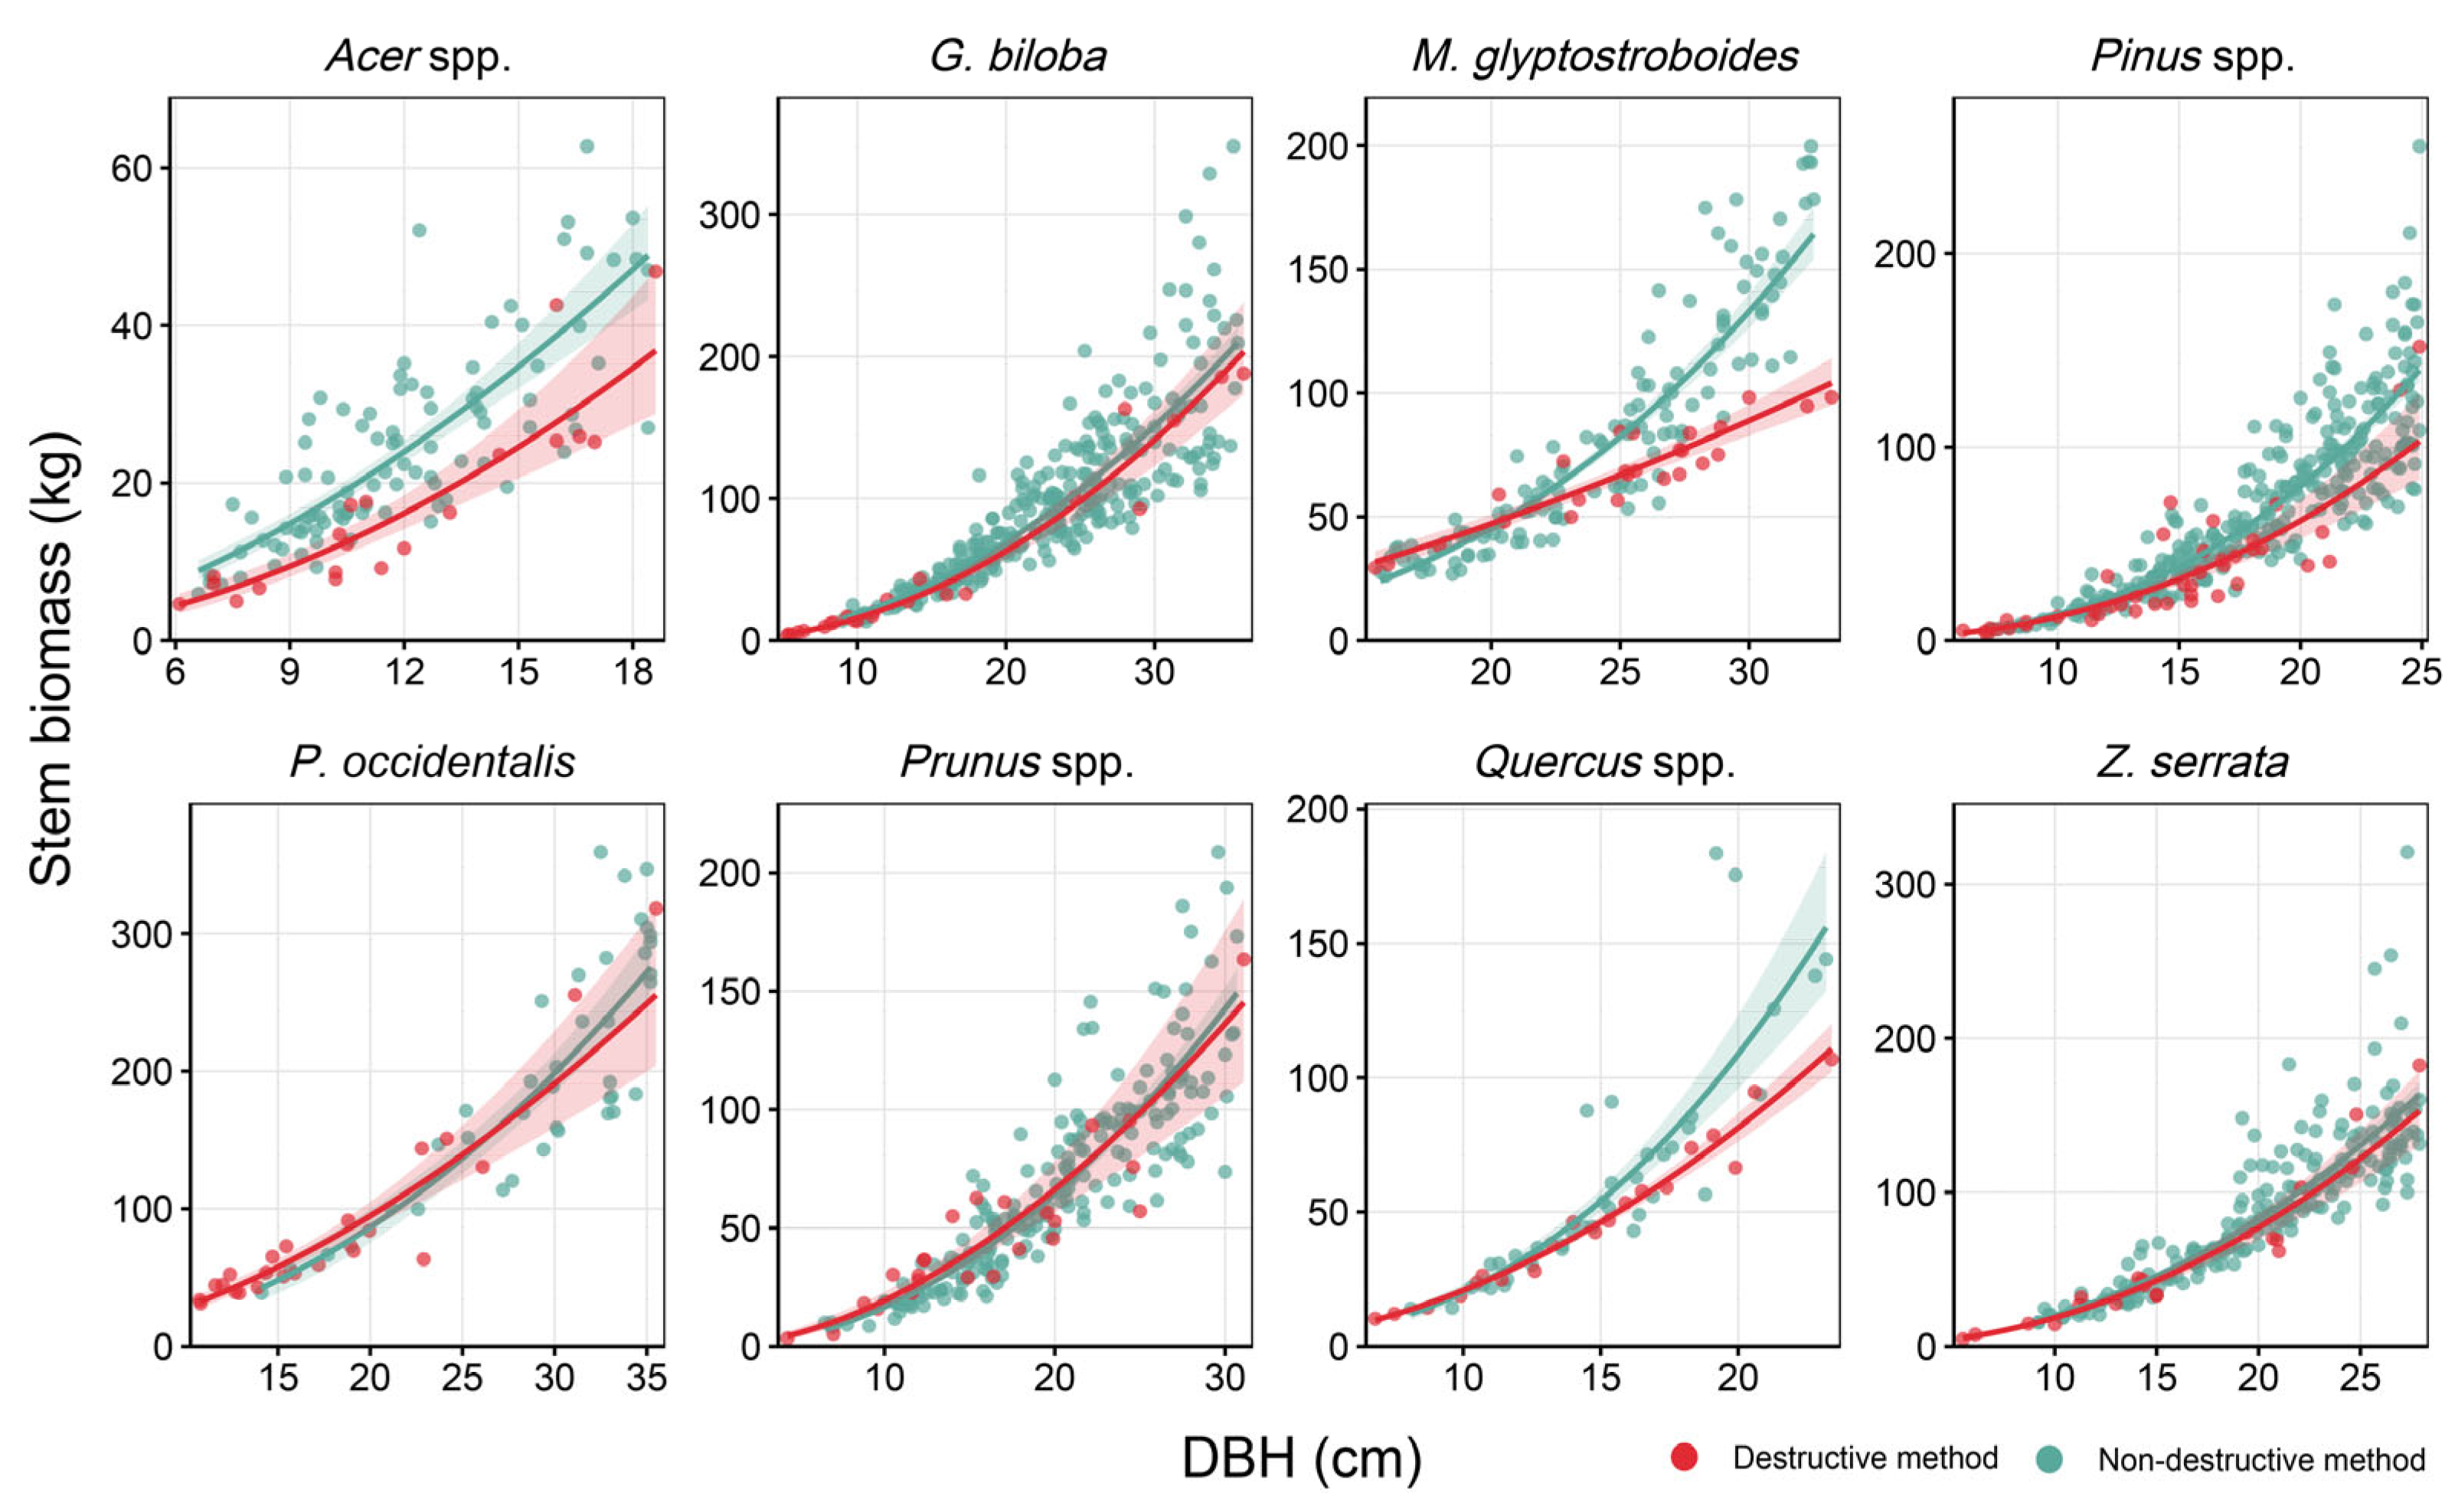
3.1. Destructive Method
3.2. Comparison Between Destructive and Non-Destructive Methods
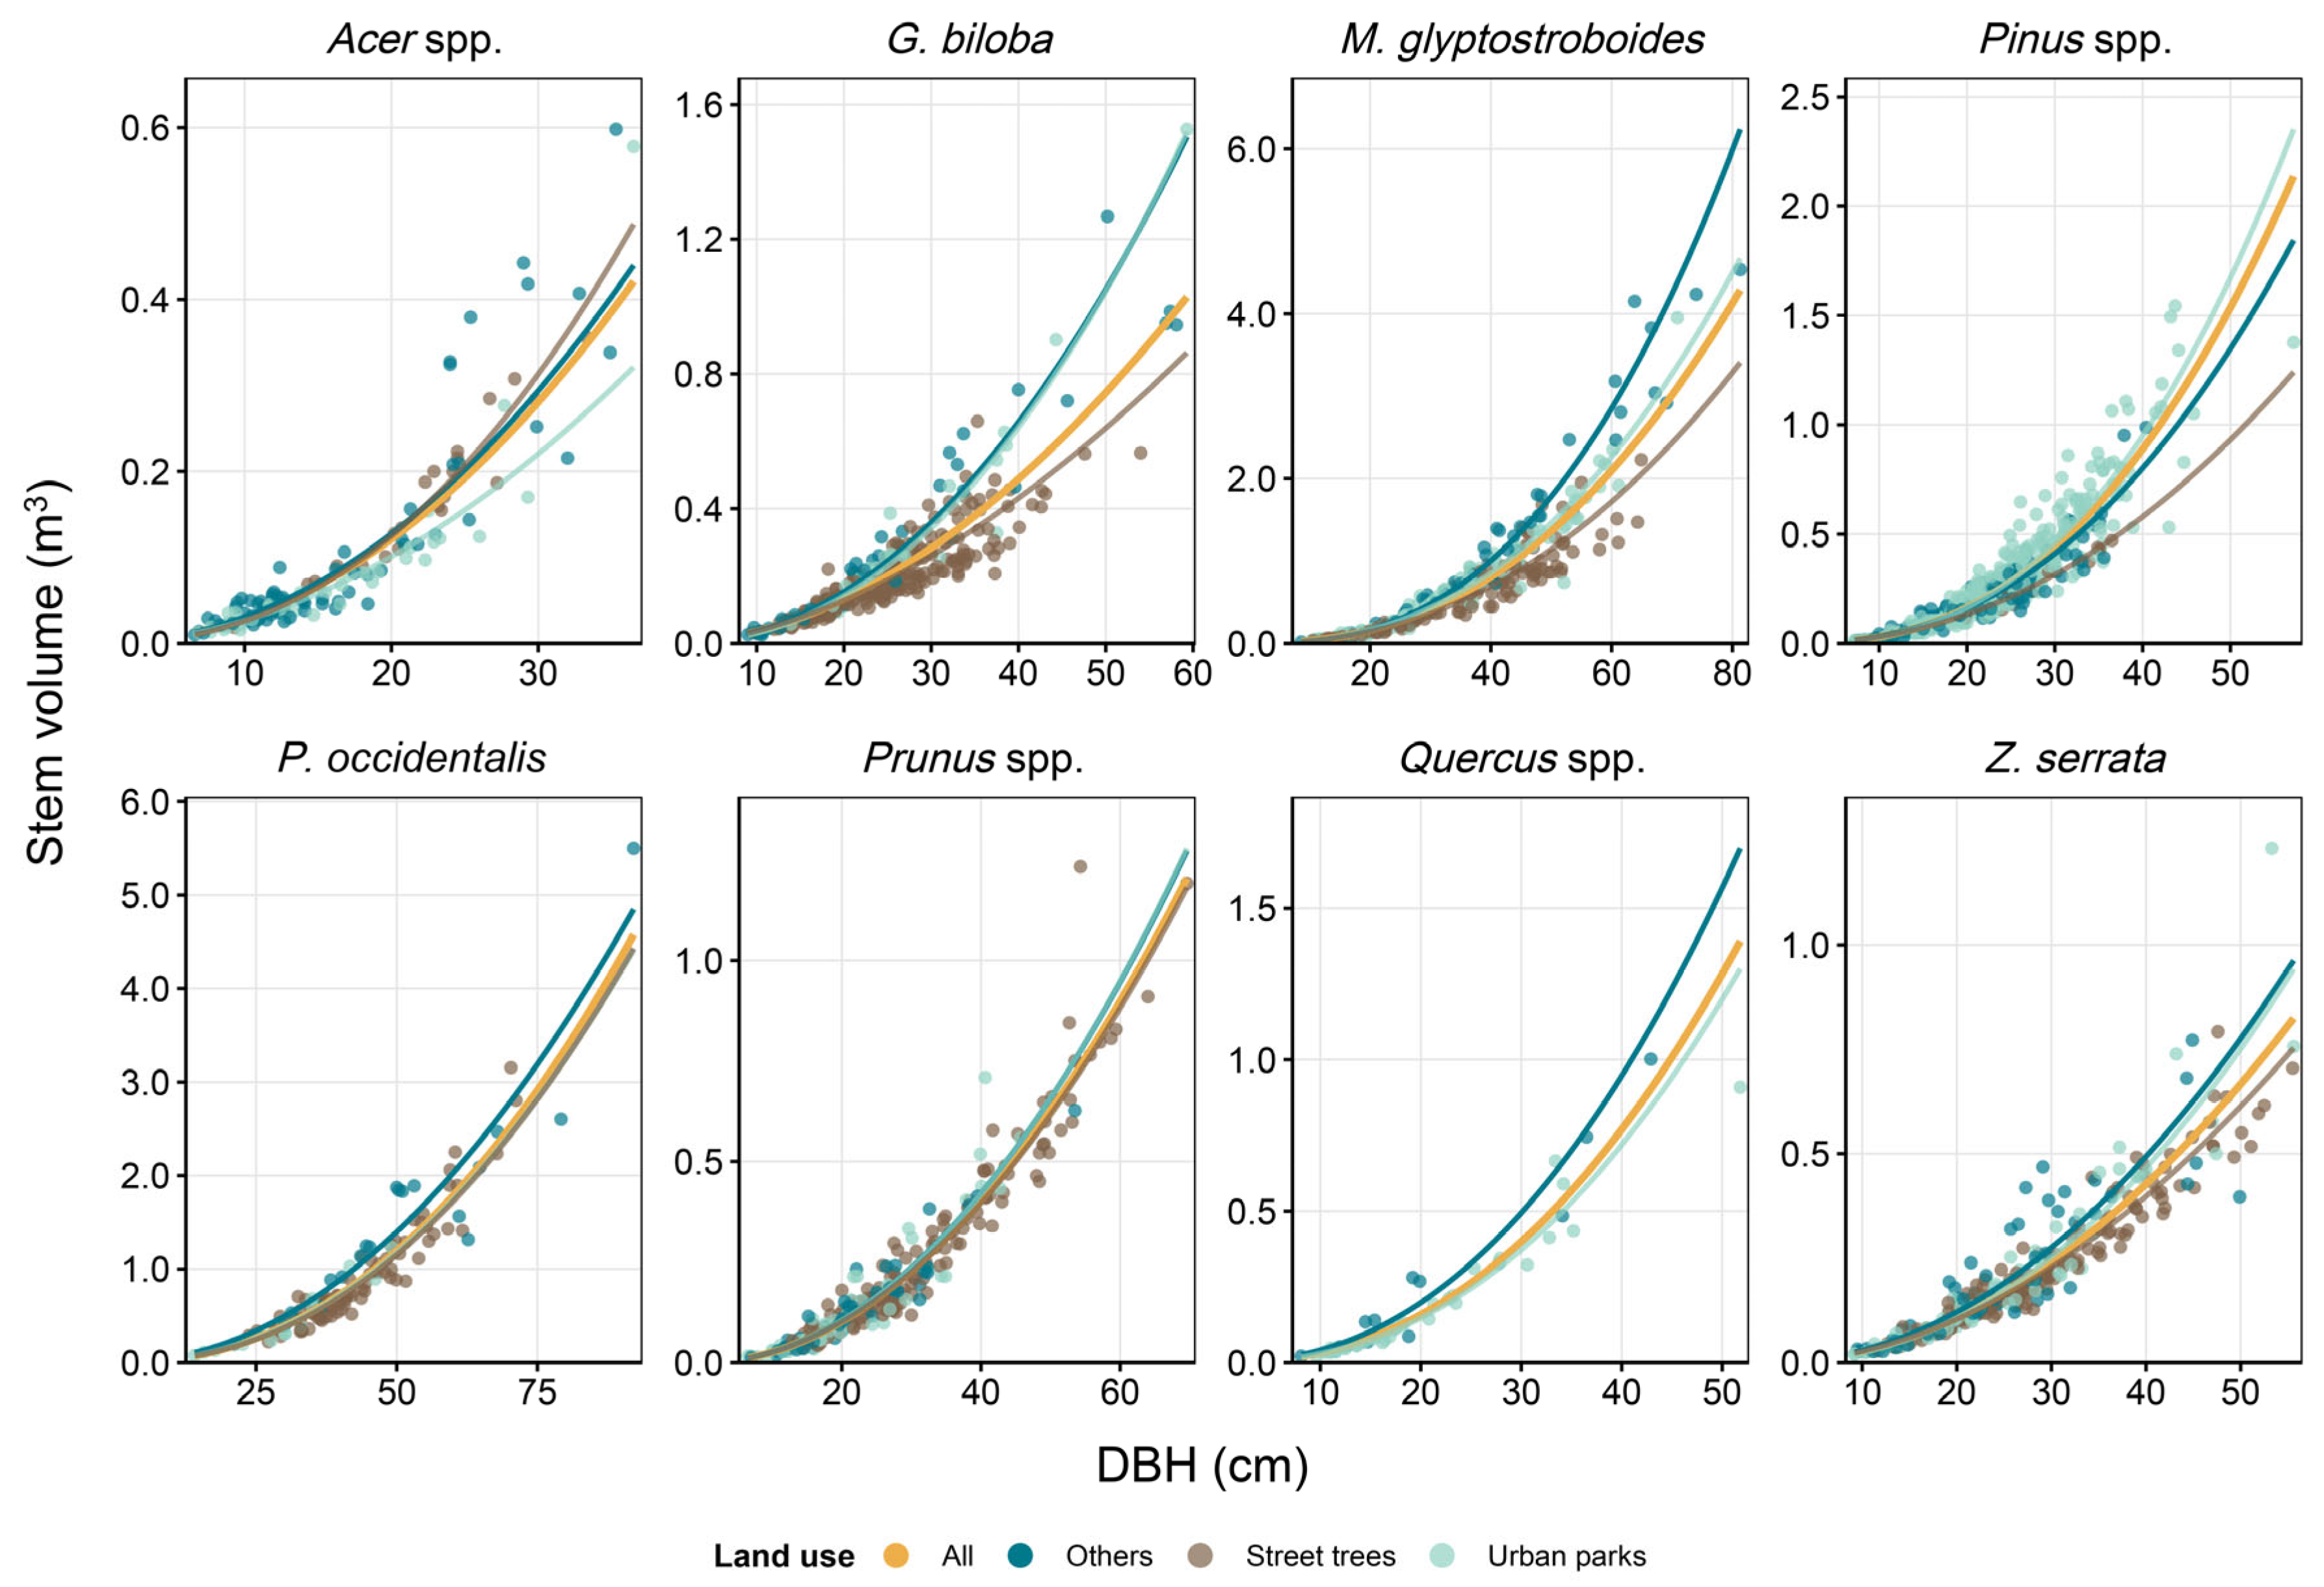
3.3. Allometric Equations Developed by the Non-Destructive Method
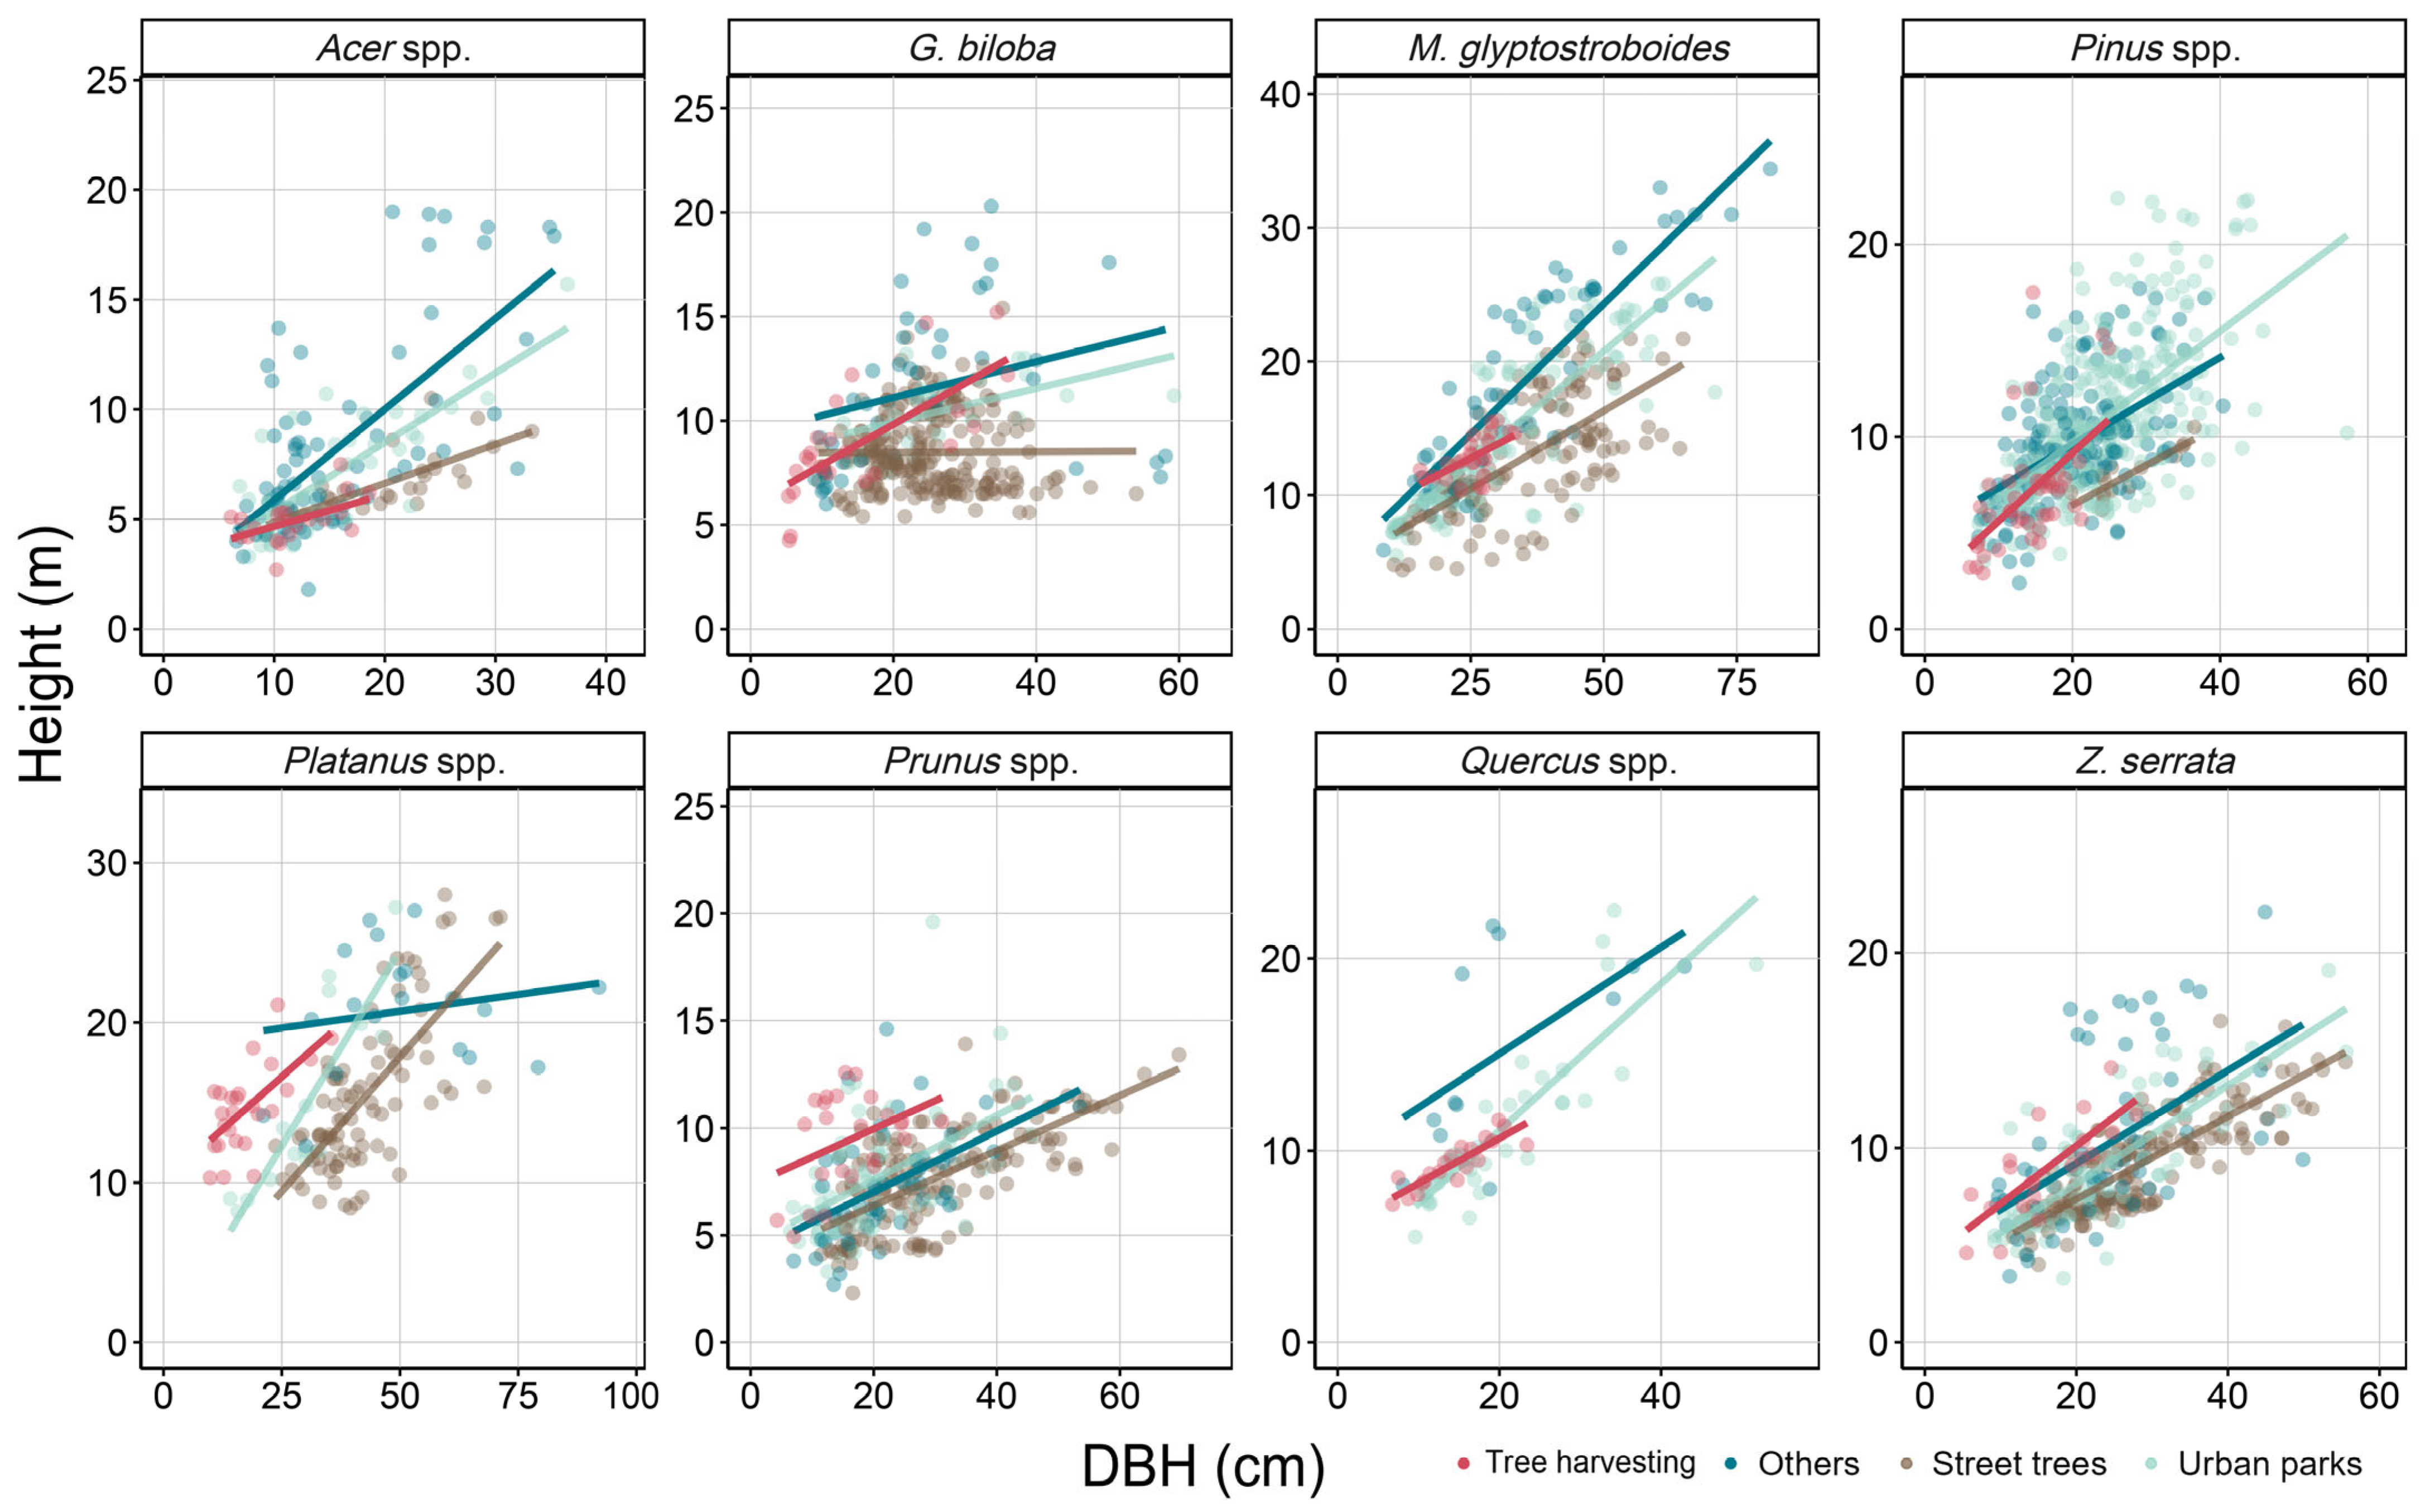
3.4. Accuracy of Allometric Equations by Urban Land Use Categories
4. Discussion
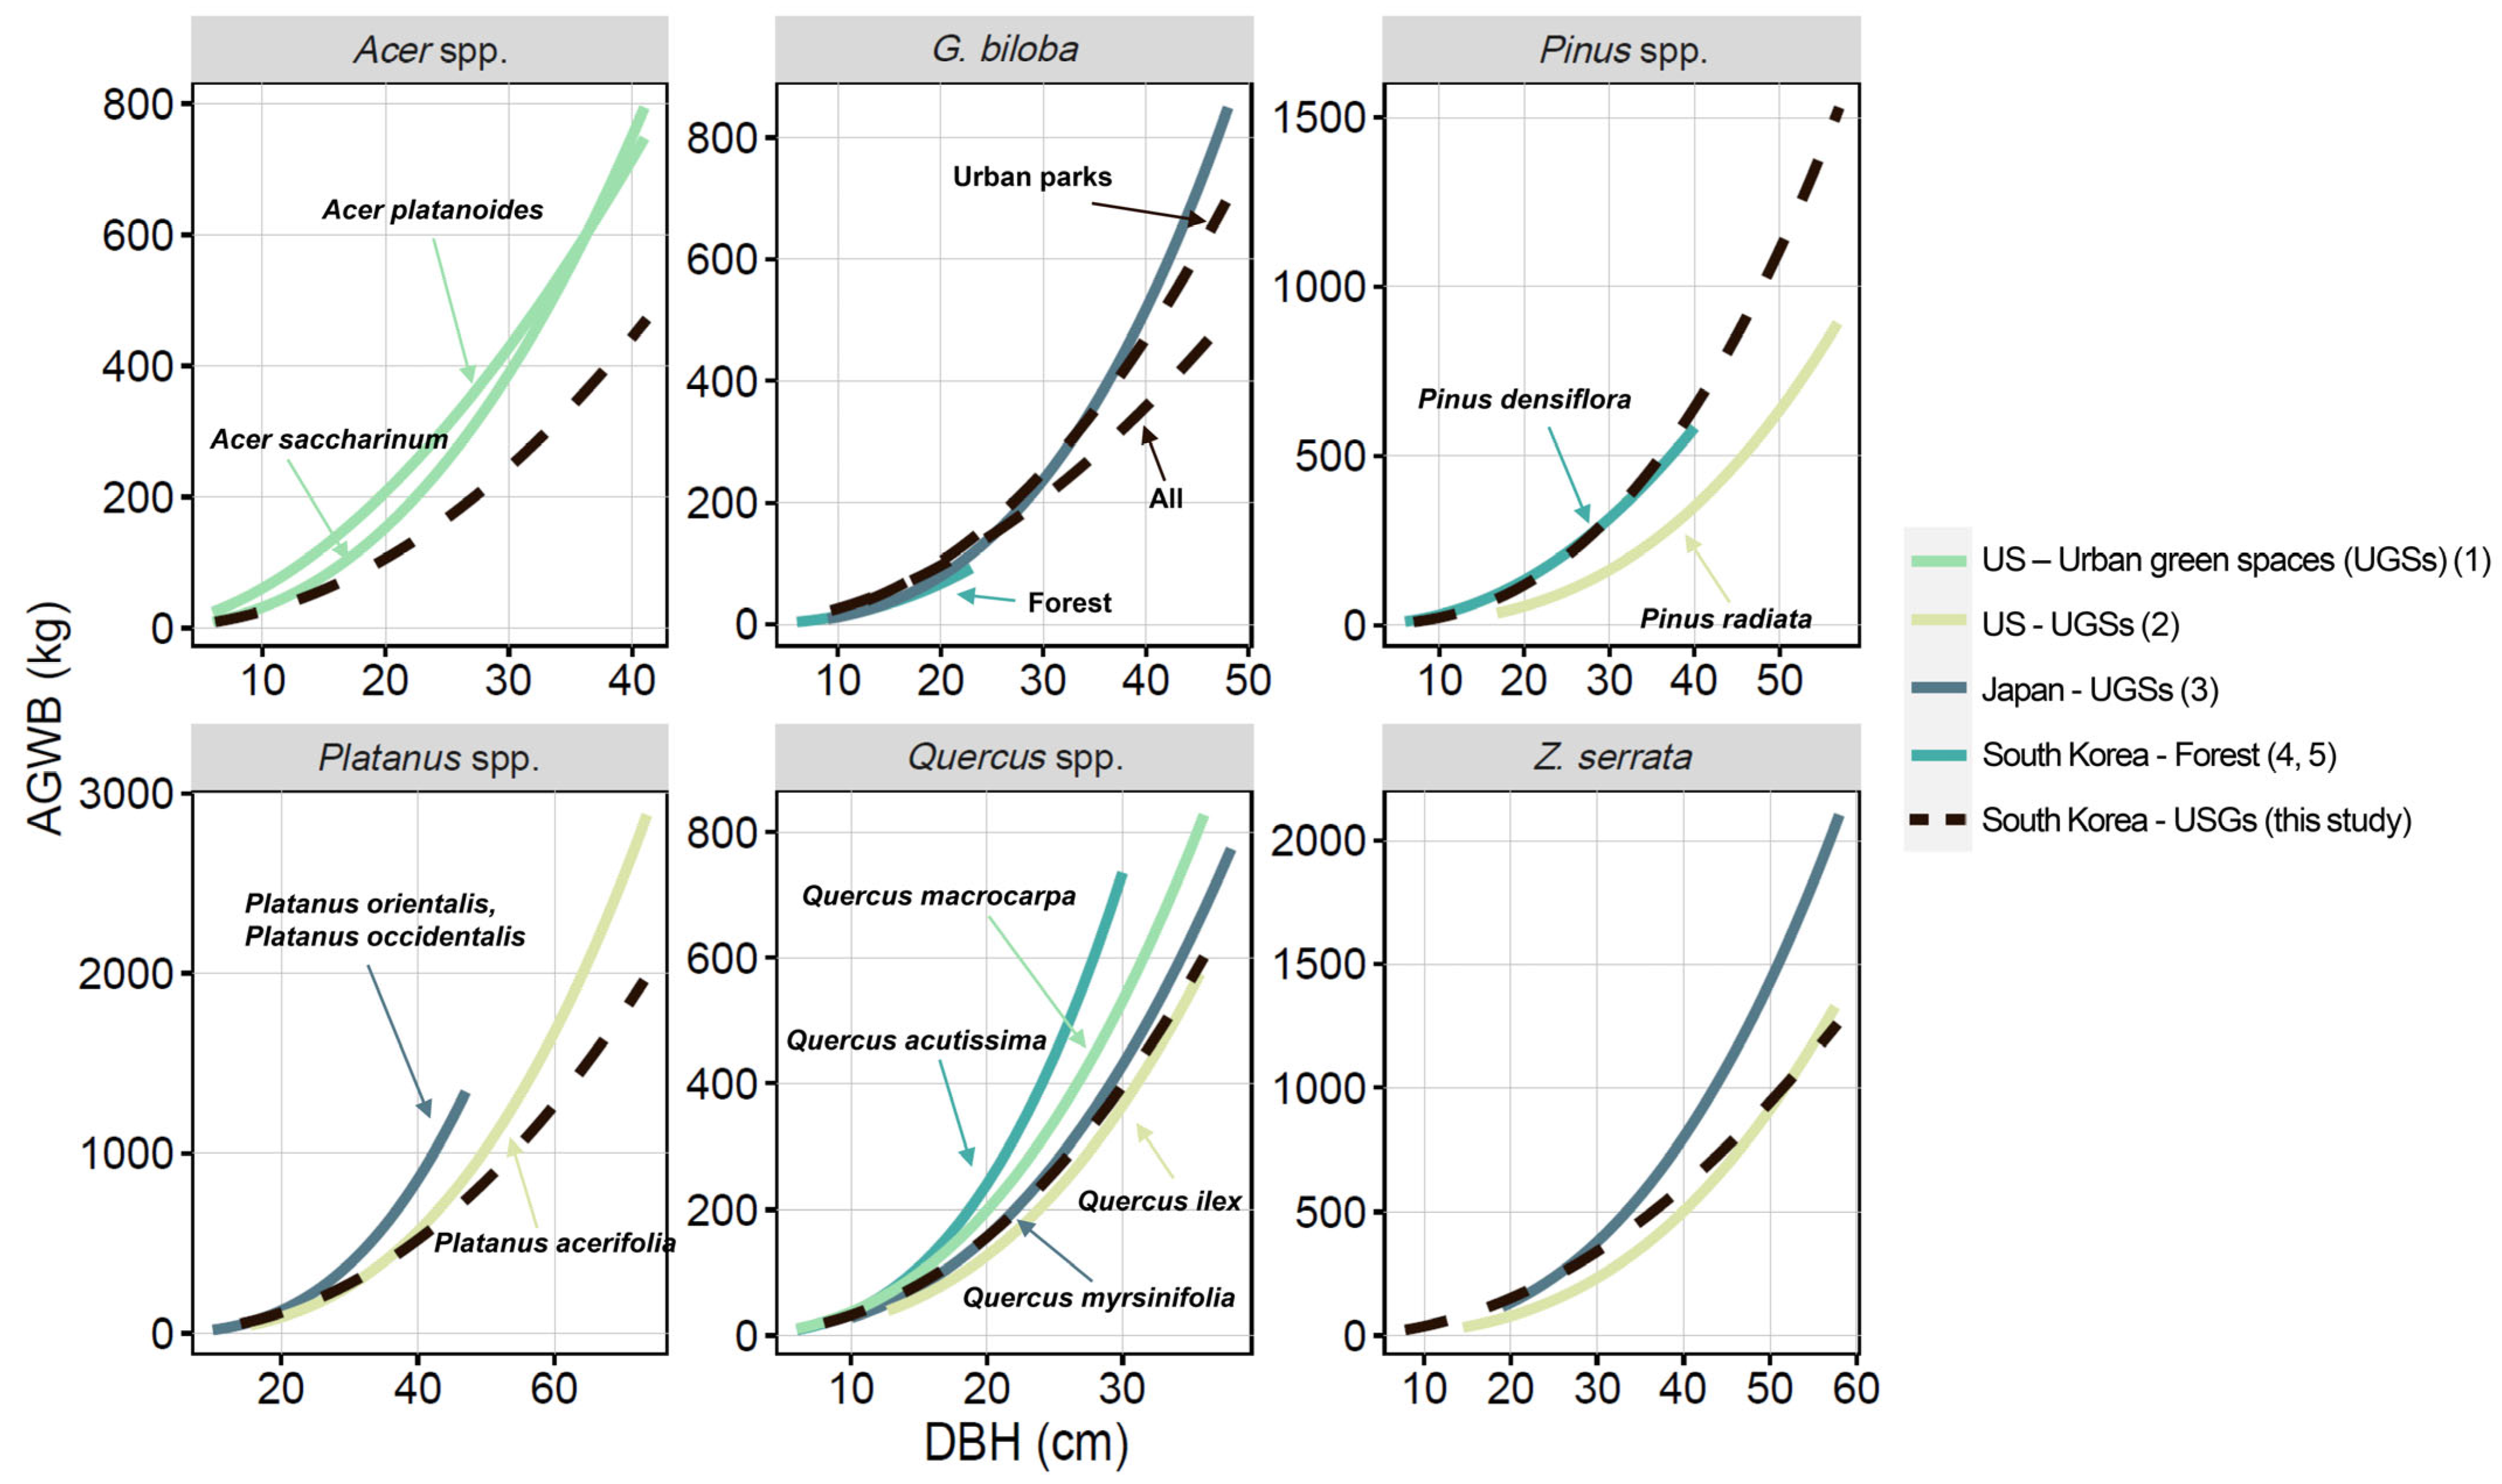
4.1. Variability in Stem Volume Between Urban Land Use Categories
4.2. Improving the Accuracy of Urban Tree Biomass Estimation
4.3. Practical Considerations for Urban Tree Biomass Estimation
4.4. Limitations and Future Research
5. Conclusions
Author Contributions
Funding
Data Availability Statement
Conflicts of Interest
Abbreviations
| AE | Allometric equation |
| AGWB | Above-ground woody biomass |
| BEF | Biomass expansion factor |
| CF | Correction factor |
| DBH | Diameter at breast height |
| UGSs | Urban green spaces |
Appendix A. Materials and Methods
Appendix A.1. Detailed Methodology for Destructive Analysis
Appendix A.2. Detailed Assumptions for Calculating Stem Volumes
- The base segment (0–0.2 m) of the stem was assumed to be cylindrical, and the volume was calculated based on the formula Vstem_bottom = L × A0.2, where A0.2 and L represent the cross-sectional area at 0.2 m and the length of the segment (0.2 m), respectively.
- The tips of the stem were assumed to be conical, and the volumes of these tips were calculated based on the formula Vlast part = L/3 × Atip, where L is the length of the segment, and Atip is the cross-sectional area at the measurement point.
- The intermediate sections between these points were assumed to be a paraboloid frustum, and the volumes of these sections were estimated using the formula Vmiddle = L/2 × (Au + Ab), where L is the length of the section, and Au and Ab are the cross-sectional areas at the upper and lower ends, respectively. For trees with leaning stems, we calculated the section lengths using the leaning angle and height measurements to accurately determine stem volume.
Appendix A.3. Detailed Conversion Processes for Allometric Equations
- Volume to biomass conversion:
- 2.
- Total woody biomass to AGWB conversion:
- 3.
- Combining tree part equations:

| Species | Age (yr) | DBH (cm) | Height (m) | AGB (kg) | N |
|---|---|---|---|---|---|
| Acer palmatum | 16.7 (13–26) | 11.7 (6.1–18.6) | 4.9 (2.7–7.5) | 28.1 (7.5–104.2) | 20 |
| Ginkgo biloba | 19.9 (7–45) | 15.0 (5.3–36) | 8.9 (4.3–15.2) | 78.5 (4.4–351.8) | 24 |
| Metasequoia glyptostroboides | 25.0 (15–48) | 25.2 (15.5–33.2) | 12.8 (10.5–15.6) | 115.5 (55.7–175.6) | 25 |
| Pinus densiflora | 17.0 (10–29) | 14.0 (6.1–24.9) | 7.4 (2.9–17.5) | 57.4 (6.5–221.7) | 23 |
| Platanus occidentalis | 26.0 (16–39) | 17.6 (9.9–35.5) | 14.7 (10.3–21.1) | 134.3 (42.4–523.0) | 25 |
| Pinus strobus | 18.7 (7–29) | 14.6 (7.1–20.9) | 6.8 (4.3–8.7) | 52.0 (5.7–111.9) | 20 |
| Prunus yedoensis | 20.0 (6–29) | 16.0 (4.3–31.1) | 9.4 (4.9–12.6) | 86.7 (4.7–365.9) | 24 |
| Quercus palustris | 12.7 (10–15) | 14.3 (6.8–23.4) | 9.3 (7.2–11.6) | 75.8 (13.2–181.8) | 20 |
| Zelkova serrata | 19.1 (12–27) | 16.0 (5.5–27.9) | 8.9 (4.6–14.1) | 125.6 (7.3–483.5) | 20 |

Appendix B. Results
| Species | Mean | Median | SD | N | Reference |
|---|---|---|---|---|---|
| BEF | |||||
| Acer palmatum | 1.586 | 1.546 | 0.251 | 20 | |
| Ginkgo biloba | 1.489 | 1.414 | 0.240 | 24 | |
| Metasequoia glyptostroboides | 1.703 | 1.688 | 0.157 | 25 | |
| Pinus densiflora | 1.554 | 1.460 | 0.290 | 23 | |
| Platanus occidentalis | 1.561 | 1.529 | 0.172 | 25 | [27] |
| Pinus strobus | 1.943 | 1.906 | 0.510 | 20 | |
| Prunus yedoensis | 1.715 | 1.612 | 0.376 | 24 | |
| Quercus palustris | 1.617 | 1.619 | 0.145 | 20 | |
| Zelkova serrata | 2.007 | 1.850 | 0.444 | 20 | |
| BEF excluding foliage | |||||
| Acer palmatum | 1.476 | 1.436 | 0.219 | 20 | |
| Ginkgo biloba | 1.389 | 1.316 | 0.228 | 24 | |
| Metasequoia glyptostroboides | 1.527 | 1.509 | 0.126 | 25 | |
| Pinus densiflora | 1.395 | 1.358 | 0.218 | 23 | |
| Platanus occidentalis | 1.397 | 1.360 | 0.130 | 25 | |
| Pinus strobus | 1.644 | 1.602 | 0.335 | 20 | |
| Prunus yedoensis | 1.561 | 1.484 | 0.337 | 24 | |
| Quercus palustris | 1.519 | 1.522 | 0.139 | 20 | |
| Zelkova serrata | 1.844 | 1.689 | 0.406 | 20 | |
| Root–shoot ratio | |||||
| Acer palmatum | 0.709 | 0.740 | 0.183 | 19 | |
| Ginkgo biloba | 0.500 | 0.483 | 0.192 | 16 | |
| Metasequoia glyptostroboides | 0.454 | 0.443 | 0.054 | 25 | |
| Pinus densiflora | 0.413 | 0.390 | 0.141 | 23 | |
| Platanus occidentalis | 0.402 | 0.413 | 0.058 | 25 | [27] |
| Pinus strobus | 0.397 | 0.381 | 0.134 | 17 | |
| Prunus yedoensis | 0.395 | 0.419 | 0.130 | 23 | |
| Quercus palustris | 0.332 | 0.300 | 0.088 | 20 | |
| Zelkova serrata | 0.508 | 0.453 | 0.189 | 20 | |
| Stem density | |||||
| Acer palmatum | 0.591 | 0.554 | 0.145 | 20 | |
| Ginkgo biloba | 0.528 | 0.532 | 0.064 | 24 | |
| Metasequoia glyptostroboides | 0.304 | 0.291 | 0.044 | 25 | |
| Pinus densiflora | 0.518 | 0.524 | 0.109 | 19 | |
| Platanus occidentalis | 0.509 | 0.527 | 0.088 | 25 | [27] |
| Pinus strobus | 0.445 | 0.445 | 0.074 | 20 | |
| Prunus yedoensis | 0.626 | 0.593 | 0.098 | 23 | |
| Quercus palustris | 0.654 | 0.673 | 0.102 | 18 | |
| Zelkova serrata | 0.766 | 0.789 | 0.085 | 20 |
| Tree Component (Y) | a | b | RMSE | MAE | R2adj | CF | Reference |
|---|---|---|---|---|---|---|---|
| Acer palmatum | [28] | ||||||
| AGB | 0.182 | 1.973 | 0.364 | 0.306 | 0.735 | 1.076 | |
| AGWB | 0.162 | 1.993 | 0.348 | 0.293 | 0.756 | 1.070 | |
| Stem | 0.146 | 1.879 | 0.261 | 0.226 | 0.831 | 1.039 | |
| Ginkgo biloba | |||||||
| AGB | 0.178 | 2.099 | 0.179 | 0.148 | 0.980 | 1.018 | |
| AGWB | 0.151 | 2.135 | 0.169 | 0.145 | 0.983 | 1.016 | |
| Stem | 0.156 | 1.996 | 0.179 | 0.140 | 0.978 | 1.018 | |
| Metasequoia glyptostroboides | |||||||
| AGB | 0.917 | 1.494 | 0.105 | 0.086 | 0.874 | 1.006 | |
| AGWB | 0.789 | 1.507 | 0.102 | 0.086 | 0.882 | 1.006 | |
| Stem | 0.436 | 1.561 | 0.115 | 0.090 | 0.863 | 1.007 | |
| Pinus densiflora | |||||||
| AGB | 0.102 | 2.299 | 0.340 | 0.292 | 0.869 | 1.065 | |
| AGWB | 0.086 | 2.326 | 0.352 | 0.307 | 0.864 | 1.070 | |
| Stem | 0.068 | 2.290 | 0.381 | 0.323 | 0.839 | 1.083 | |
| Platanus occidentalis | |||||||
| AGB | 0.505 | 1.896 | 0.181 | 0.155 | 0.921 | 1.018 | [27] |
| AGWB | 0.468 | 1.884 | 0.186 | 0.158 | 0.916 | 1.019 | |
| Stem | 0.483 | 1.755 | 0.202 | 0.167 | 0.890 | 1.022 | |
| Pinus strobus | |||||||
| AGB | 0.062 | 2.464 | 0.153 | 0.123 | 0.958 | 1.013 | |
| AGWB | 0.039 | 2.579 | 0.150 | 0.124 | 0.963 | 1.013 | |
| Stem | 0.030 | 2.501 | 0.197 | 0.173 | 0.934 | 1.022 | |
| Prunus yedoensis | |||||||
| AGB | 0.252 | 2.045 | 0.235 | 0.192 | 0.934 | 1.031 | |
| AGWB | 0.220 | 2.061 | 0.248 | 0.208 | 0.928 | 1.034 | |
| Stem | 0.310 | 1.775 | 0.300 | 0.260 | 0.867 | 1.050 | |
| Quercus palustris | |||||||
| AGB | 0.271 | 2.077 | 0.117 | 0.097 | 0.971 | 1.008 | [29] |
| AGWB | 0.251 | 2.081 | 0.121 | 0.100 | 0.969 | 1.008 | |
| Stem | 0.226 | 1.964 | 0.086 | 0.074 | 0.982 | 1.004 | |
| Zelkova serrata | |||||||
| AGB | 0.137 | 2.366 | 0.189 | 0.163 | 0.967 | 1.020 | |
| AGWB | 0.117 | 2.395 | 0.192 | 0.172 | 0.966 | 1.021 | |
| Stem | 0.161 | 2.054 | 0.181 | 0.160 | 0.959 | 1.018 | |
| Broad-leaf species | |||||||
| AGB | 0.148 | 2.248 | 0.343 | 0.269 | 0.895 | 1.061 | |
| AGWB | 0.132 | 2.259 | 0.335 | 0.265 | 0.900 | 1.059 | |
| Stem | 0.144 | 2.072 | 0.331 | 0.268 | 0.886 | 1.057 | |
| Needle-leaf species | |||||||
| AGB | 0.216 | 1.977 | 0.268 | 0.216 | 0.906 | 1.038 | |
| AGWB | 0.172 | 2.015 | 0.278 | 0.219 | 0.903 | 1.041 | |
| Stem | 0.132 | 1.967 | 0.311 | 0.233 | 0.876 | 1.051 | |
| Variable | a | b | c | RMSE | MAE | R2adj | CF | Reference |
|---|---|---|---|---|---|---|---|---|
| Acer palmatum | [28] | |||||||
| AGB | 0.050 | 1.572 | 1.435 | 0.247 | 0.198 | 0.871 | 1.036 | |
| AGWB | 0.047 | 1.609 | 1.372 | 0.236 | 0.194 | 0.881 | 1.033 | |
| Stem | 0.065 | 1.630 | 0.892 | 0.202 | 0.180 | 0.893 | 1.024 | |
| Ginkgo biloba | ||||||||
| AGB | 0.104 | 1.932 | 0.447 | 0.155 | 0.129 | 0.984 | 1.014 | |
| AGWB | 0.091 | 1.977 | 0.423 | 0.146 | 0.120 | 0.986 | 1.012 | |
| Stem | 0.084 | 1.805 | 0.514 | 0.147 | 0.112 | 0.984 | 1.012 | |
| Metasequoia glyptostroboides | ||||||||
| AGB | 0.508 | 1.354 | 0.409 | 0.098 | 0.069 | 0.887 | 1.005 | |
| AGWB | 0.411 | 1.353 | 0.451 | 0.092 | 0.066 | 0.900 | 1.005 | |
| Stem | 0.244 | 1.423 | 0.403 | 0.108 | 0.085 | 0.874 | 1.007 | |
| Pinus densiflora | ||||||||
| AGB | 0.119 | 1.862 | 0.518 | 0.275 | 0.230 | 0.910 | 1.044 | |
| AGWB | 0.102 | 1.839 | 0.576 | 0.272 | 0.228 | 0.915 | 1.043 | |
| Stem | 0.085 | 1.665 | 0.739 | 0.253 | 0.217 | 0.926 | 1.037 | |
| Platanus occidentalis | ||||||||
| AGB | 0.213 | 1.733 | 0.494 | 0.166 | 0.138 | 0.930 | 1.016 | |
| AGWB | 0.176 | 1.699 | 0.561 | 0.168 | 0.138 | 0.929 | 1.016 | |
| Stem | 0.151 | 1.536 | 0.665 | 0.177 | 0.135 | 0.911 | 1.018 | |
| Pinus strobus | ||||||||
| AGB | 0.050 | 2.378 | 0.232 | 0.150 | 0.122 | 0.957 | 1.013 | |
| AGWB | 0.026 | 2.420 | 0.433 | 0.140 | 0.113 | 0.966 | 1.012 | |
| Stem | 0.012 | 2.147 | 0.958 | 0.157 | 0.128 | 0.956 | 1.015 | |
| Prunus yedoensis | ||||||||
| AGB | 0.113 | 1.863 | 0.585 | 0.197 | 0.154 | 0.951 | 1.022 | |
| AGWB | 0.094 | 1.868 | 0.616 | 0.208 | 0.170 | 0.947 | 1.025 | |
| Stem | 0.079 | 1.465 | 0.991 | 0.207 | 0.170 | 0.934 | 1.025 | |
| Quercus palustris | ||||||||
| AGB | 0.253 | 2.060 | 0.051 | 0.117 | 0.097 | 0.970 | 1.008 | |
| AGWB | 0.210 | 2.035 | 0.135 | 0.121 | 0.100 | 0.968 | 1.009 | |
| Stem | 0.159 | 1.874 | 0.264 | 0.085 | 0.070 | 0.982 | 1.004 | |
| Zelkova serrata | ||||||||
| AGB | 0.075 | 1.998 | 0.741 | 0.126 | 0.105 | 0.984 | 1.009 | |
| AGWB | 0.063 | 2.023 | 0.749 | 0.130 | 0.109 | 0.984 | 1.010 | |
| Stem | 0.127 | 1.907 | 0.295 | 0.172 | 0.149 | 0.961 | 1.018 | |
| Broad-leaf species | ||||||||
| AGB | 0.080 | 1.857 | 0.751 | 0.243 | 0.204 | 0.947 | 1.031 | |
| AGWB | 0.074 | 1.884 | 0.721 | 0.243 | 0.207 | 0.947 | 1.031 | |
| Stem | 0.074 | 1.647 | 0.816 | 0.201 | 0.169 | 0.958 | 1.021 | |
| Needle-leaf species | ||||||||
| AGB | 0.233 | 1.743 | 0.276 | 0.257 | 0.212 | 0.912 | 1.035 | |
| AGWB | 0.187 | 1.743 | 0.321 | 0.264 | 0.214 | 0.911 | 1.037 | |
| Stem | 0.149 | 1.565 | 0.474 | 0.283 | 0.220 | 0.896 | 1.043 | |
| Land Use | a | b | c | RMSE | MAE | R2adj | Bias | CF | N |
|---|---|---|---|---|---|---|---|---|---|
| Acer spp. | |||||||||
| All | 0.0002035 | 1.758 | 0.512 | 0.247 | 0.194 | 0.927 | −6.5 | 1.032 | 142 |
| Others | 0.0002469 | 1.575 | 0.660 | 0.234 | 0.178 | 0.932 | −5.9 | 1.029 | 77 |
| Street trees * | 0.0001268 | 2.112 | 0.296 | 0.123 | 0.106 | 0.967 | −1.6 | 1.009 | 25 |
| Urban parks | 0.0002920 | 1.661 | 0.396 | 0.226 | 0.169 | 0.927 | −5.5 | 1.028 | 40 |
| Ginkgo biloba | |||||||||
| All | 0.0001164 | 1.804 | 0.741 | 0.163 | 0.120 | 0.949 | −2.7 | 1.014 | 310 |
| Others | 0.0001166 | 1.914 | 0.599 | 0.154 | 0.115 | 0.981 | −2.5 | 1.013 | 43 |
| Street trees | 0.0001440 | 1.742 | 0.730 | 0.158 | 0.115 | 0.931 | −2.5 | 1.013 | 239 |
| Urban parks | 0.0000556 | 1.968 | 0.842 | 0.182 | 0.135 | 0.942 | −3.5 | 1.019 | 28 |
| Metasequoia glyptostroboides | |||||||||
| All | 0.0001110 | 1.944 | 0.610 | 0.170 | 0.133 | 0.977 | −3.0 | 1.015 | 299 |
| Others | 0.0000691 | 2.127 | 0.570 | 0.108 | 0.087 | 0.992 | −1.2 | 1.006 | 63 |
| Street trees | 0.0001556 | 1.946 | 0.457 | 0.167 | 0.127 | 0.965 | −2.9 | 1.014 | 129 |
| Urban parks | 0.0001091 | 1.995 | 0.559 | 0.172 | 0.136 | 0.980 | −3.1 | 1.015 | 107 |
| Pinus spp. | . | ||||||||
| All | 0.0000725 | 2.073 | 0.657 | 0.186 | 0.144 | 0.960 | −3.5 | 1.018 | 468 |
| Others | 0.0000966 | 2.027 | 0.582 | 0.188 | 0.146 | 0.955 | −3.7 | 1.018 | 157 |
| Street trees * | 0.0001899 | 2.657 | −0.763 | 0.107 | 0.092 | 0.916 | −1.3 | 1.007 | 14 |
| Urban parks | 0.0000626 | 2.104 | 0.683 | 0.182 | 0.139 | 0.961 | −3.3 | 1.017 | 297 |
| Platanus occidentalis | . | ||||||||
| All | 0.0001932 | 1.919 | 0.418 | 0.172 | 0.134 | 0.938 | −3.1 | 1.015 | 123 |
| Others | 0.0000808 | 1.873 | 0.795 | 0.157 | 0.122 | 0.949 | −2.7 | 1.015 | 19 |
| Street trees | 0.0002388 | 1.939 | 0.307 | 0.168 | 0.134 | 0.901 | −2.9 | 1.015 | 89 |
| Urban parks | 0.0003068 | 1.557 | 0.684 | 0.124 | 0.097 | 0.972 | −1.7 | 1.010 | 15 |
| Prunus spp. | . | ||||||||
| All | 0.0001902 | 1.746 | 0.543 | 0.178 | 0.131 | 0.963 | −3.2 | 1.016 | 277 |
| Others | 0.0001951 | 1.700 | 0.605 | 0.194 | 0.142 | 0.945 | −3.9 | 1.020 | 50 |
| Street trees | 0.0002428 | 1.661 | 0.572 | 0.150 | 0.114 | 0.967 | −2.2 | 1.011 | 163 |
| Urban parks | 0.0001501 | 1.777 | 0.589 | 0.209 | 0.169 | 0.951 | −4.6 | 1.023 | 64 |
| Quercus spp. | . | ||||||||
| All | 0.0001091 | 1.833 | 0.711 | 0.159 | 0.131 | 0.973 | −2.6 | 1.014 | 53 |
| Others | 0.0000570 | 1.745 | 1.058 | 0.164 | 0.116 | 0.974 | −3.1 | 1.018 | 12 |
| Urban parks | 0.0001348 | 2.050 | 0.350 | 0.138 | 0.114 | 0.977 | −2.0 | 1.010 | 41 |
| Zelkova serrata | |||||||||
| All | 0.0002235 | 1.667 | 0.561 | 0.165 | 0.126 | 0.957 | −2.7 | 1.014 | 323 |
| Others | 0.0001942 | 1.614 | 0.711 | 0.208 | 0.162 | 0.942 | −4.4 | 1.023 | 62 |
| Street trees | 0.0003059 | 1.626 | 0.476 | 0.141 | 0.109 | 0.955 | −2.0 | 1.010 | 177 |
| Urban parks | 0.0001617 | 1.893 | 0.383 | 0.145 | 0.116 | 0.974 | −2.1 | 1.011 | 84 |
| Broad-leaf species | |||||||||
| All | 0.0001497 | 1.750 | 0.674 | 0.207 | 0.161 | 0.958 | −4.4 | 1.022 | 1228 |
| Others | 0.0001409 | 1.747 | 0.710 | 0.225 | 0.173 | 0.965 | −5.3 | 1.026 | 263 |
| Street trees | 0.0001790 | 1.685 | 0.698 | 0.194 | 0.152 | 0.946 | −3.8 | 1.019 | 693 |
| Urban parks | 0.0001427 | 1.792 | 0.615 | 0.207 | 0.160 | 0.959 | −4.4 | 1.022 | 272 |
| Needle-leaf species | |||||||||
| All | 0.0001053 | 1.979 | 0.605 | 0.189 | 0.148 | 0.970 | −3.6 | 1.018 | 767 |
| Others | 0.0000913 | 2.054 | 0.569 | 0.170 | 0.131 | 0.979 | −3.0 | 1.015 | 220 |
| Street trees | 0.0001588 | 1.952 | 0.441 | 0.165 | 0.127 | 0.965 | −2.8 | 1.014 | 143 |
| Urban parks | 0.0000857 | 2.045 | 0.617 | 0.189 | 0.147 | 0.966 | −3.7 | 1.018 | 404 |
References
- Hardiman, B.S.; Wang, J.A.; Hutyra, L.R.; Gately, C.K.; Getson, J.M.; Friedl, M.A. Accounting for urban biogenic fluxes in regional carbon budgets. Sci. Total Environ. 2017, 592, 366–372. [Google Scholar] [CrossRef]
- Nowak, D.J.; Crane, E.C. Carbon storage and sequestration by urban trees in the USA. Environ. Pollut. 2002, 116, 381–389. [Google Scholar] [CrossRef]
- Vaccari, F.P.; Gioli, B.; Toscano, P.; Perrone, C. Carbon dioxide balance assessment of the city of Florence (Italy), and implications for urban planning. Landsc. Urban Plann. 2013, 120, 138–146. [Google Scholar] [CrossRef]
- IPCC. 2006 IPCC Guidelines for National Greenhouse Gas Inventories, Prepared by the National Greenhouse Gas Inventories Programme; Eggleston, H.S., Buendia, L., Miwa, K., Ngara, T., Tanabe, K., Eds.; IGES: Hayama, Japan, 2006. [Google Scholar]
- Jo, H.K.; Ahn, T.W. Carbon storage and uptake by deciduous tree species for urban landscape. J. Korean Inst. Landsc. Archit. 2012, 40, 160–168. [Google Scholar] [CrossRef]
- Jo, H.K.; Kim, J.Y.; Park, H.M. Carbon storage and uptake by evergreen trees for urban landscape—For Pinus densiflora and Pinus koraiensis. Korean J. Environ.Ecol. 2013, 27, 571–578. [Google Scholar] [CrossRef]
- Jo, H.K.; Kim, J.Y.; Park, H.M. Carbon reduction effects of urban landscape trees and development of quantitative models—For five native species. J. Korean Inst. Landsc. Archit. 2014, 42, 13–21. [Google Scholar] [CrossRef]
- Matsue, M.; Nagahama, Y.; Iizuka, Y.; Murata, M.; Fujiwara, N. Estimation equations for the amount of CO2 fixed by planted trees in cities in Japan. J. Jpn. Soc. Reveg. Technol. 2009, 35, 318–324. [Google Scholar] [CrossRef]
- Jenerette, G.D.; Herrmann, D.L. A global synthesis of reported urban tree carbon production rates and approaches. Front. Ecol. Evol. 2024, 11, 1244418. [Google Scholar] [CrossRef]
- Nowak, D.J. Atmospheric carbon dioxide reduction by Chicago’s urban forest. In Chicago’s Urban Forest Ecosystem: Results of the Chicago Urban Forest Climate Project; US Department of Agriculture, Forest Service: Washington, DC, USA, 1994; pp. 83–94. [Google Scholar]
- Dahle, G.A.; Gallagher, F.J.; Gershensond, D.; Schäfer, K.V.R.; Grabosky, J.C. Allometric and mass relationships of Betula populifolia in a naturally assembled urban brownfield: Implications for carbon modeling. Urban Ecosyst. 2014, 17, 1147–1160. [Google Scholar] [CrossRef]
- Ngo, K.M.; Lum, S. Aboveground biomass estimation of tropical street trees. J. Urban Ecol. 2018, 4, jux020. [Google Scholar] [CrossRef]
- McHale, M.R.; Burke, I.C.; Lefsky, M.A.; Peper, P.J.; McPherson, E.G. Urban forest biomass estimates: Is it important to use allometric relationships developed specifically for urban trees? Urban Ecosyst. 2009, 12, 95–113. [Google Scholar] [CrossRef]
- Forrester, D.I.; Tachauer, I.H.H.; Annighoefer, P.; Barbeito, I.; Pretzsch, H.; Ruiz-Peinado, R.; Stark, H.; Vacchiano, G.; Zlatanov, T.; Chakraborty, T.; et al. Generalized biomass and leaf area allometric equations for European tree species incorporating stand structure, tree age and climate. For. Ecol. Manag. 2017, 396, 160–175. [Google Scholar] [CrossRef]
- Speak, A.F.; Salbitano, F. The impact of pruning and mortality on urban tree canopy volume. Urban For. Urban Green. 2023, 79, 127810. [Google Scholar] [CrossRef]
- Pillsbury, N.H.; Reimer, J.L.; Thompson, R.P. Tree Volume Equations for Fifteen Urban Species in California, 7th ed.; Technical Report; Urban Forest Ecosystem Institute, California Polytechnic State University: San Luis Obispo, CA, USA, 1998. [Google Scholar]
- Lee, S.; Lee, S.; Lee, J.; Son, Y.; Yoon, T.K. Estimating aboveground volume of diverse urban tree species: Developing allometric equations for higher taxonomic levels. Urban For. Urban Green. 2024, 94, 128256. [Google Scholar] [CrossRef]
- Park, J.H.; Baek, S.G.; Kwon, M.Y.; Je, S.M.; Woo, S.Y. Volumetric equation development and carbon storage estimation of urban forest in Daejeon, Korea. For. Sci. Technol. 2018, 14, 97–104. [Google Scholar] [CrossRef]
- Yoon, T.K.; Park, C.-W.; Lee, S.J.; Ko, S.; Kim, K.N.; Son, Y.; Lee, K.H.; Oh, S.; Lee, W.-K.; Son, Y. Allometric equations for estimating the aboveground volume of five common urban street tree species in Daegu, Korea. Urban For. Urban Green. 2013, 12, 344–349. [Google Scholar] [CrossRef]
- Aguilar, F.J.; Nemmaoui, A.; Peñalver, A.; Rivas, J.R.; Aguilar, M.A. Developing allometric equations for teak plantations located in the coastal region of Ecuador from terrestrial laser scanning data. Forests 2019, 10, 1050. [Google Scholar] [CrossRef]
- Bornand, A.; Rehush, N.; Morsdorf, F.; Thürig, E.; Abegg, M. Individual tree volume estimation with terrestrial laser scanning: Evaluating reconstructive and allometric approaches. Agric. For. Meteorol. 2023, 341, 109654. [Google Scholar] [CrossRef]
- Stovall, A.E.L.; Vorster, A.; Anderson, R.; Evangelista, P. Developing nondestructive species-specific tree allometry with terrestrial laser scanning. Methods Ecol. Evol. 2022, 14, 280–290. [Google Scholar] [CrossRef]
- Domec, J.C.; Gartner, B.L. How do water transport and water storage differ in coniferous earlywood and latewood? J. Exp. Bot. 2002, 53, 2369–2379. [Google Scholar] [CrossRef]
- Knapic, S.; Louzada, J.L.; Leal, S.; Pereira, H. Within-tree and between-tree variation of wood density components in cork oak trees in two sites in Portugal. Forestry 2008, 81, 465–473. [Google Scholar] [CrossRef]
- Korea Meteorological Administration (KMA). National Climate Data Service System. Available online: https://data.kma.go.kr/tmeta/stn/selectStnList.do?pgmNo=123 (accessed on 15 August 2024).
- Ha, J.; Baek, G.; Choi, B.; Lee, J.; Son, Y.; Kim, C. Development of allometric equations for carbon storage of Ginkgo biloba Linn., Zelkova serrata (Thunb.) Makino. and Prunus × yedoense Matsum. planted in Jinju-City. J. Clim. Chang. Res. 2022, 13, 135–145. [Google Scholar] [CrossRef]
- Jung, J.Y.; Im, S.; Kim, H.J.; Lee, K.H. Development of carbon emission factors and biomass allometric equations for Metasequoia glyptostroboides and Platanus occidentalis in urban forests. Korean Soc. For. Sci. 2023, 112, 127–135. [Google Scholar] [CrossRef]
- Kim, H.; Baek, G.; Choi, B.; Lee, J.; Lee, J.; Son, Y.; Kim, C. Allometric equations for estimating the carbon storage of Maple trees in an urban settlement Area. J. Korean Soc. For. Sci. 2023, 112, 32–39. [Google Scholar] [CrossRef]
- Yoon, T.K.; Lee, S.; Lee, S.; Lee, J.-M.; Son, Y.; Lee, S. Root biomass allocation and carbon sequestration in urban landscaping tree species in South Korea. Forests 2024, 15, 2104. [Google Scholar] [CrossRef]
- Lee, S.; Lee, S.; Han, Y.; Lee, J.; Son, Y.; Yoon, T.K. Determining the aboveground allometric equations of major street tree species in Wonju, South Korea using the nondestructive stem analysis method. J. Korean Soc. For. Sci. 2022, 111, 502–510. [Google Scholar] [CrossRef]
- Fearnside, P.M. Wood density for estimating forest biomass in Brazilian Amazonia. For. Ecol. Manag. 1997, 90, 59–87. [Google Scholar] [CrossRef]
- Nogueira, E.M.; Fearnside, P.M.; Nelson, B.W. Normalization of wood density in biomass estimates of Amazon forests. For. Ecol. Manag. 2008, 256, 990–996. [Google Scholar] [CrossRef]
- Velasco, E.; Chen, K.W. Carbon storage estimation of tropical urban trees by an improved allometric model for aboveground biomass based on terrestrial laser scanning. Urban For. Urban Green. 2019, 44, 126387. [Google Scholar] [CrossRef]
- Chave, J.; Réjou-Méchain, M.; Búrquez, A.; Chidumayo, E.; Colgan, M.S.; Delitti, W.B.; Duque, A.; Eid, T.; Fearnside, P.M.; Goodman, R.C. Improved allometric models to estimate the aboveground biomass of tropical trees. Glob. Change Biol. 2014, 20, 3177–3190. [Google Scholar] [CrossRef]
- Delcourt, C.J.F.; Veraverbeke, S. Allometric equations and wood density parameters for estimating aboveground and woody debris biomass in Cajander larch (Larix cajanderi) forests of northeast Siberia. Biogeosciences 2022, 19, 4499–4520. [Google Scholar] [CrossRef]
- Sprugel, D.G. Correcting for bias in log-transformed allometric equations. Ecology 1983, 64, 209–210. [Google Scholar] [CrossRef]
- Niklas, K.J. Plant allometry: Is there a grand unifying theory? Biol. Rev. Camb. Philos. Soc. 2004, 79, 871–889. [Google Scholar] [CrossRef] [PubMed]
- Stanton, M.L.; Thiede, D.A. Statistical convenience vs biological insight: Consequences of data transformation for the analysis of fitness variation in heterogeneous environments. New Phytol. 2005, 166, 319–338. [Google Scholar] [CrossRef] [PubMed]
- Lenth, R. Emmeans: Estimated Marginal Means, aka Least-Squares Means. R Package Version 1.10.7-100002. Available online: https://CRAN.R-project.org/package=emmeans (accessed on 1 March 2025).
- Dutcă, I.; Mather, R.; Blujdea, V.N.; Ioraș, F.; Olari, M.; Abrudan, I.V. Site-effects on biomass allometric models for early growth plantations of Norway spruce (Picea abies (L.) Karst.). Biomass Bioenergy 2018, 116, 8–17. [Google Scholar] [CrossRef]
- Weiner, J. Allocation, plasticity and allometry in plants. Perspect. Plant Ecol. Evol. Syst. 2004, 6, 207–215. [Google Scholar] [CrossRef]
- Oliveira, G.M.V.; de Mello, J.M.; de Mello, C.R.; Scolforo, J.R.S.; Miguel, E.P.; Monteiro, T.C. Behavior of wood basic density according to environmental variables. J. For. Res. 2021, 33, 497–505. [Google Scholar] [CrossRef]
- Vizcaíno-Palomar, N.; Ibáñez, I.; González-Martínez, S.C.; Zavala, M.A.; Alía, R. Adaptation and plasticity in aboveground allometry variation of four pine species along environmental gradients. Ecol. Evol. 2016, 6, 7561–7573. [Google Scholar] [CrossRef]
- Hui, L.C.; Jim, C.Y.; Zhang, H. Allometry of urban trees in subtropical Hong Kong and effects of habitat types. Landsc. Ecol. 2020, 35, 1143–1160. [Google Scholar] [CrossRef]
- de-Miguel, S.; Pukkala, T.; Assaf, N.; Shater, Z. Intra-specific differences in allometric equations for aboveground biomass of eastern Mediterranean Pinus brutia. Ann. For. Sci. 2014, 71, 101–112. [Google Scholar] [CrossRef]
- Li, H.; Li, C.; Zha, T.; Liu, J.; Jia, X.; Wang, X.; Chen, W.; He, G. Patterns of biomass allocation in an age-sequence of secondary Pinus bungeana forests in China. For. Chron. 2014, 90, 169–176. [Google Scholar] [CrossRef]
- Vorster, A.G.; Evangelista, P.H.; Stovall, A.E.; Ex, S. Variability and uncertainty in forest biomass estimates from the tree to landscape scale: The role of allometric equations. Carbon Balance Manag. 2020, 15, 8. [Google Scholar] [CrossRef] [PubMed]
- Davies, Z.G.; Edmondson, J.L.; Heinemeyer, A.; Leake, J.R.; Gaston, K.J. Mapping an urban ecosystem service: Quantifying above-ground carbon storage at a city-wide scale. J. Appl. Ecol. 2011, 48, 1125–1134. [Google Scholar] [CrossRef]
- Lv, H.; Wang, W.; He, X.; Xiao, L.; Zhou, W.; Zhang, B. Quantifying tree and soil carbon stocks in a temperate urban forest in Northeast China. Forests 2016, 7, 200. [Google Scholar] [CrossRef]
- Qin, H.; Zhou, W.; Qian, Y.; Zhang, H.; Yao, Y. Estimating aboveground carbon stocks of urban trees by synergizing ICESat-2 LiDAR with GF-2 data. Urban For. Urban Green. 2022, 76, 127728. [Google Scholar] [CrossRef]
- Vonderach, C.; Akontz, A. Learning from forest trees: Improving urban tree biomass functions. Forests 2023, 14, 1473. [Google Scholar] [CrossRef]
- Poorter, H.; Niklas, K.J.; Reich, P.B.; Oleksyn, J.; Poot, P.; Mommer, L. Biomass allocation to leaves, stems and roots: Meta-analyses of interspecific variation and environmental control. New Phytol. 2012, 193, 30–50. [Google Scholar] [CrossRef]
- Aguaron, E.; McPherson, E.G. Comparison of methods for estimating carbon dioxide storage by Sacramento’s urban forest. In Carbon Sequestration in Urban Ecosystems; Springer: Dordrecht, The Netherlands, 2012; pp. 43–71. [Google Scholar]
- Wania, A.; Kühn, I.; Klotz, S. Plant richness patterns in agricultural and urban landscapes in Central Germany—Spatial gradients of species richness. Landsc. Urban Plann. 2006, 75, 97–110. [Google Scholar] [CrossRef]
- Burt, A.; Calders, K.; Cuni-Sanchez, A.; Gómez-Dans, J.; Lewis, P.; Lewis, S.L.; Malhi, Y.; Phillips, O.L.; Disney, M. Assessment of bias in pan-tropical biomass predictions. Front. For. Glob. Chang. 2020, 3, 12. [Google Scholar] [CrossRef]
- McPherson, E.G.; van Doorn, N.S.; Peper, P.J. Urban Tree Database and Allometric Equations; General Technical Report PSW-GTR-253; US Department of Agriculture, Forest Service, Pacific Southwest Research Station: Albany, CA, USA, 2016; 86p. [Google Scholar]
- Rutishauser, E.; Noor’an, F.; Laumonier, Y.; Halperin, J.; Hergoualc’h, K.; Verchot, L. Generic allometric models including height best estimate forest biomass and carbon stocks in Indonesia. For. Ecol. Manag. 2013, 307, 219–225. [Google Scholar] [CrossRef]
- Jo, H.K.; Cho, D.H. Annual CO2 Uptake by Urban Popular Landscape Tree Species. J. Korean Inst. Landsc. Archit. 1998, 26, 38–53. [Google Scholar]
- Demol, M.; Verbeeck, H.; Gielen, B.; Armston, J.; Burt, A.; Disney, M.; Duncanson, L.; Hackenberg, J.; Kükenbrink, D.; Lau, A. Estimating forest above-ground biomass with terrestrial laser scanning: Current status and future directions. Methods Ecol. Evol. 2022, 13, 1628–1639. [Google Scholar] [CrossRef]
- Gonzalez de Tanago, J.; Lau, A.; Bartholomeus, H.; Herold, M.; Avitabile, V.; Raumonen, P.; Martius, C.; Goodman, R.C.; Disney, M.; Manuri, S. Estimation of above-ground biomass of large tropical trees with terrestrial LiDAR. Methods Ecol. Evol. 2018, 9, 223–234. [Google Scholar] [CrossRef]
- de-Miguel, S.; Mehtätalo, L.; Durkaya, A. Developing generalized, calibratable, mixed-effects meta-models for large-scale biomass prediction. Can. J. For. Res. 2014, 44, 648–656. [Google Scholar] [CrossRef]
- Son, Y.; Kim, H.W. Above-ground biomass and nutrient distribution in a 15-year-old ginkgo (Ginkgo biloba) plantation in Central Korea. Bioresour. Technol. 1998, 63, 173–177. [Google Scholar] [CrossRef]
- KFRI (Korea Forest Research Institute). Carbon Emission Factors and Biomass Allometric Equations by Species in Korea; Report No. 11–1400377-000694-01; Korea Forest Research Institute: Seoul, Republic of Korea, 2014. (In Korean) [Google Scholar]

| Land Use | a | b | RMSE | MAE | R2adj | Bias | CF | N | DBH (cm) | |
|---|---|---|---|---|---|---|---|---|---|---|
| Min | Max | |||||||||
| Acer spp. | ||||||||||
| All | 0.0002382 | 2.066 | 0.299 | 0.235 | 0.894 | −9.3 | 1.046 | 142 | 6.6 | 36.5 |
| Others | 0.0002545 | 2.056 | 0.338 | 0.276 | 0.861 | −12.1 | 1.060 | 77 | 6.6 | 35.3 |
| Street trees * | 0.0001432 | 2.258 | 0.129 | 0.111 | 0.965 | −1.8 | 1.009 | 25 | 9.3 | 33.3 |
| Urban parks | 0.0003067 | 1.924 | 0.247 | 0.189 | 0.915 | −6.4 | 1.033 | 40 | 6.9 | 36.5 |
| Ginkgo biloba | ||||||||||
| All | 0.0004404 | 1.892 | 0.245 | 0.200 | 0.884 | −6.2 | 1.031 | 310 | 9.0 | 59.3 |
| Others | 0.0002732 | 2.103 | 0.234 | 0.208 | 0.957 | −5.8 | 1.029 | 43 | 9.0 | 58.1 |
| Street trees | 0.0006379 | 1.760 | 0.220 | 0.181 | 0.866 | −4.9 | 1.025 | 239 | 9.5 | 54.0 |
| Urban parks | 0.0001959 | 2.188 | 0.208 | 0.161 | 0.927 | −4.6 | 1.023 | 28 | 13.0 | 59.3 |
| Metasequoia glyptostroboides | ||||||||||
| All | 0.0001343 | 2.351 | 0.242 | 0.196 | 0.954 | −6.1 | 1.030 | 299 | 8.6 | 81.3 |
| Others | 0.0000739 | 2.576 | 0.159 | 0.128 | 0.984 | −2.6 | 1.013 | 63 | 8.6 | 81.3 |
| Street trees | 0.0001680 | 2.250 | 0.209 | 0.175 | 0.947 | −4.5 | 1.022 | 129 | 10.6 | 64.9 |
| Urban parks | 0.0001270 | 2.385 | 0.208 | 0.159 | 0.972 | −4.6 | 1.022 | 107 | 10.3 | 70.9 |
| Pinus spp. | ||||||||||
| All | 0.0001018 | 2.451 | 0.262 | 0.211 | 0.921 | −7.1 | 1.035 | 468 | 7.2 | 57.2 |
| Others | 0.0001442 | 2.329 | 0.249 | 0.198 | 0.922 | −6.5 | 1.032 | 157 | 7.3 | 40.4 |
| Street trees * | 0.0002246 | 2.127 | 0.123 | 0.103 | 0.898 | −1.7 | 1.009 | 14 | 19.8 | 36.5 |
| Urban parks | 0.0000793 | 2.536 | 0.262 | 0.210 | 0.920 | −7.1 | 1.035 | 297 | 7.2 | 57.2 |
| Platanus occidentalis | ||||||||||
| All | 0.0002143 | 2.200 | 0.199 | 0.163 | 0.918 | −4.1 | 1.020 | 123 | 14.1 | 92.1 |
| Others | 0.0004718 | 2.037 | 0.216 | 0.182 | 0.910 | −5.1 | 1.026 | 19 | 21.1 | 92.1 |
| Street trees | 0.0002016 | 2.207 | 0.181 | 0.149 | 0.888 | −3.4 | 1.017 | 89 | 23.7 | 71.2 |
| Urban parks | 0.0002394 | 2.168 | 0.174 | 0.149 | 0.949 | −3.3 | 1.018 | 15 | 14.1 | 49.1 |
| Prunus spp. | ||||||||||
| All | 0.0002678 | 1.976 | 0.231 | 0.179 | 0.938 | −5.5 | 1.027 | 277 | 6.5 | 69.6 |
| Others | 0.0002560 | 1.998 | 0.260 | 0.202 | 0.904 | −7.1 | 1.036 | 50 | 7.0 | 53.5 |
| Street trees | 0.0002704 | 1.971 | 0.205 | 0.158 | 0.938 | −4.3 | 1.021 | 163 | 11.5 | 69.6 |
| Urban parks | 0.0002448 | 2.009 | 0.267 | 0.213 | 0.921 | −7.5 | 1.038 | 64 | 6.5 | 45.7 |
| Quercus spp. | ||||||||||
| All | 0.0001620 | 2.288 | 0.226 | 0.159 | 0.947 | −5.2 | 1.027 | 53 | 8.1 | 51.8 |
| Others | 0.0002133 | 2.260 | 0.323 | 0.269 | 0.909 | −12.2 | 1.065 | 12 | 8.1 | 42.9 |
| Urban parks | 0.0001515 | 2.292 | 0.147 | 0.118 | 0.975 | −2.2 | 1.011 | 41 | 9.6 | 51.8 |
| Zelkova serrata | ||||||||||
| All | 0.0002645 | 1.997 | 0.210 | 0.158 | 0.931 | −4.4 | 1.022 | 323 | 9.2 | 55.6 |
| Others | 0.0002610 | 2.031 | 0.312 | 0.257 | 0.872 | −10.2 | 1.052 | 62 | 9.5 | 49.9 |
| Street trees | 0.0003098 | 1.937 | 0.161 | 0.124 | 0.942 | −2.6 | 1.013 | 177 | 11.7 | 55.5 |
| Urban parks | 0.0001751 | 2.134 | 0.170 | 0.133 | 0.965 | −2.9 | 1.015 | 84 | 9.2 | 55.6 |
| Broad-leaf species | ||||||||||
| All | 0.0002143 | 2.099 | 0.294 | 0.239 | 0.916 | −8.9 | 1.044 | 1228 | 6.5 | 92.1 |
| Others | 0.0001836 | 2.182 | 0.351 | 0.290 | 0.915 | −13.0 | 1.064 | 263 | 6.6 | 92.1 |
| Street trees | 0.0002255 | 2.073 | 0.270 | 0.222 | 0.896 | −7.5 | 1.037 | 693 | 9.3 | 71.2 |
| Urban parks | 0.0001769 | 2.163 | 0.266 | 0.217 | 0.933 | −7.4 | 1.036 | 272 | 6.5 | 59.3 |
| Needle-leaf species | ||||||||||
| All | 0.0001244 | 2.381 | 0.256 | 0.205 | 0.944 | −6.8 | 1.033 | 767 | 7.2 | 81.3 |
| Others | 0.0000915 | 2.494 | 0.238 | 0.185 | 0.960 | −5.9 | 1.029 | 220 | 7.3 | 81.3 |
| Street trees | 0.0001590 | 2.262 | 0.205 | 0.172 | 0.946 | −4.3 | 1.021 | 143 | 10.6 | 64.9 |
| Urban parks | 0.0000980 | 2.468 | 0.251 | 0.199 | 0.941 | −6.5 | 1.032 | 404 | 7.2 | 70.9 |
| Species | Adjusted Means of Stem Volume (m3) | Interaction | ||
|---|---|---|---|---|
| Urban Land Use Categories | ||||
| Others | Street Trees | Urban Parks | ||
| G. biloba | 0.207 a | 0.164 b | 0.194 a | p < 0.001 |
| M. glyptostroboides | 0.500 a | 0.372 c | 0.447 b | p < 0.001 |
| P. occidentalis | 0.871 a | 0.715 b | 0.734 ab | p > 0.05 |
| Prunus spp. | 0.143 | 0.139 | 0.141 | p > 0.05 |
| Z. serrata | 0.172 a | 0.151 b | 0.161 a | p = 0.019 |
Disclaimer/Publisher’s Note: The statements, opinions and data contained in all publications are solely those of the individual author(s) and contributor(s) and not of MDPI and/or the editor(s). MDPI and/or the editor(s) disclaim responsibility for any injury to people or property resulting from any ideas, methods, instructions or products referred to in the content. |
© 2025 by the authors. Licensee MDPI, Basel, Switzerland. This article is an open access article distributed under the terms and conditions of the Creative Commons Attribution (CC BY) license (https://creativecommons.org/licenses/by/4.0/).
Share and Cite
Lee, J.-M.; Kim, H.-S.; Choi, B.; Jung, J.-Y.; Lee, S.; Jo, H.; Kim, G.; Kwon, S.; Lee, S.-J.; Yoon, T.K.; et al. Enhanced Accuracy in Urban Tree Biomass Estimation: Developing Allometric Equations with Land Use Classifications. Forests 2025, 16, 841. https://doi.org/10.3390/f16050841
Lee J-M, Kim H-S, Choi B, Jung J-Y, Lee S, Jo H, Kim G, Kwon S, Lee S-J, Yoon TK, et al. Enhanced Accuracy in Urban Tree Biomass Estimation: Developing Allometric Equations with Land Use Classifications. Forests. 2025; 16(5):841. https://doi.org/10.3390/f16050841
Chicago/Turabian StyleLee, Jeong-Min, Hyung-Sub Kim, Byeonggil Choi, Jun-Young Jung, Seungmin Lee, Heejae Jo, Gaeun Kim, Sanggeun Kwon, Sang-Jin Lee, Tae Kyung Yoon, and et al. 2025. "Enhanced Accuracy in Urban Tree Biomass Estimation: Developing Allometric Equations with Land Use Classifications" Forests 16, no. 5: 841. https://doi.org/10.3390/f16050841
APA StyleLee, J.-M., Kim, H.-S., Choi, B., Jung, J.-Y., Lee, S., Jo, H., Kim, G., Kwon, S., Lee, S.-J., Yoon, T. K., Kim, C., Lee, K.-H., Lee, W.-K., & Son, Y. (2025). Enhanced Accuracy in Urban Tree Biomass Estimation: Developing Allometric Equations with Land Use Classifications. Forests, 16(5), 841. https://doi.org/10.3390/f16050841