

Aboveground Biomass Models for Common Woody Species of Lowland Forest in Borana Woodland, Southern Ethiopia


Abstract
1. Introduction
2. Materials and Methods
2.1. Site Description
2.2. Data Collection
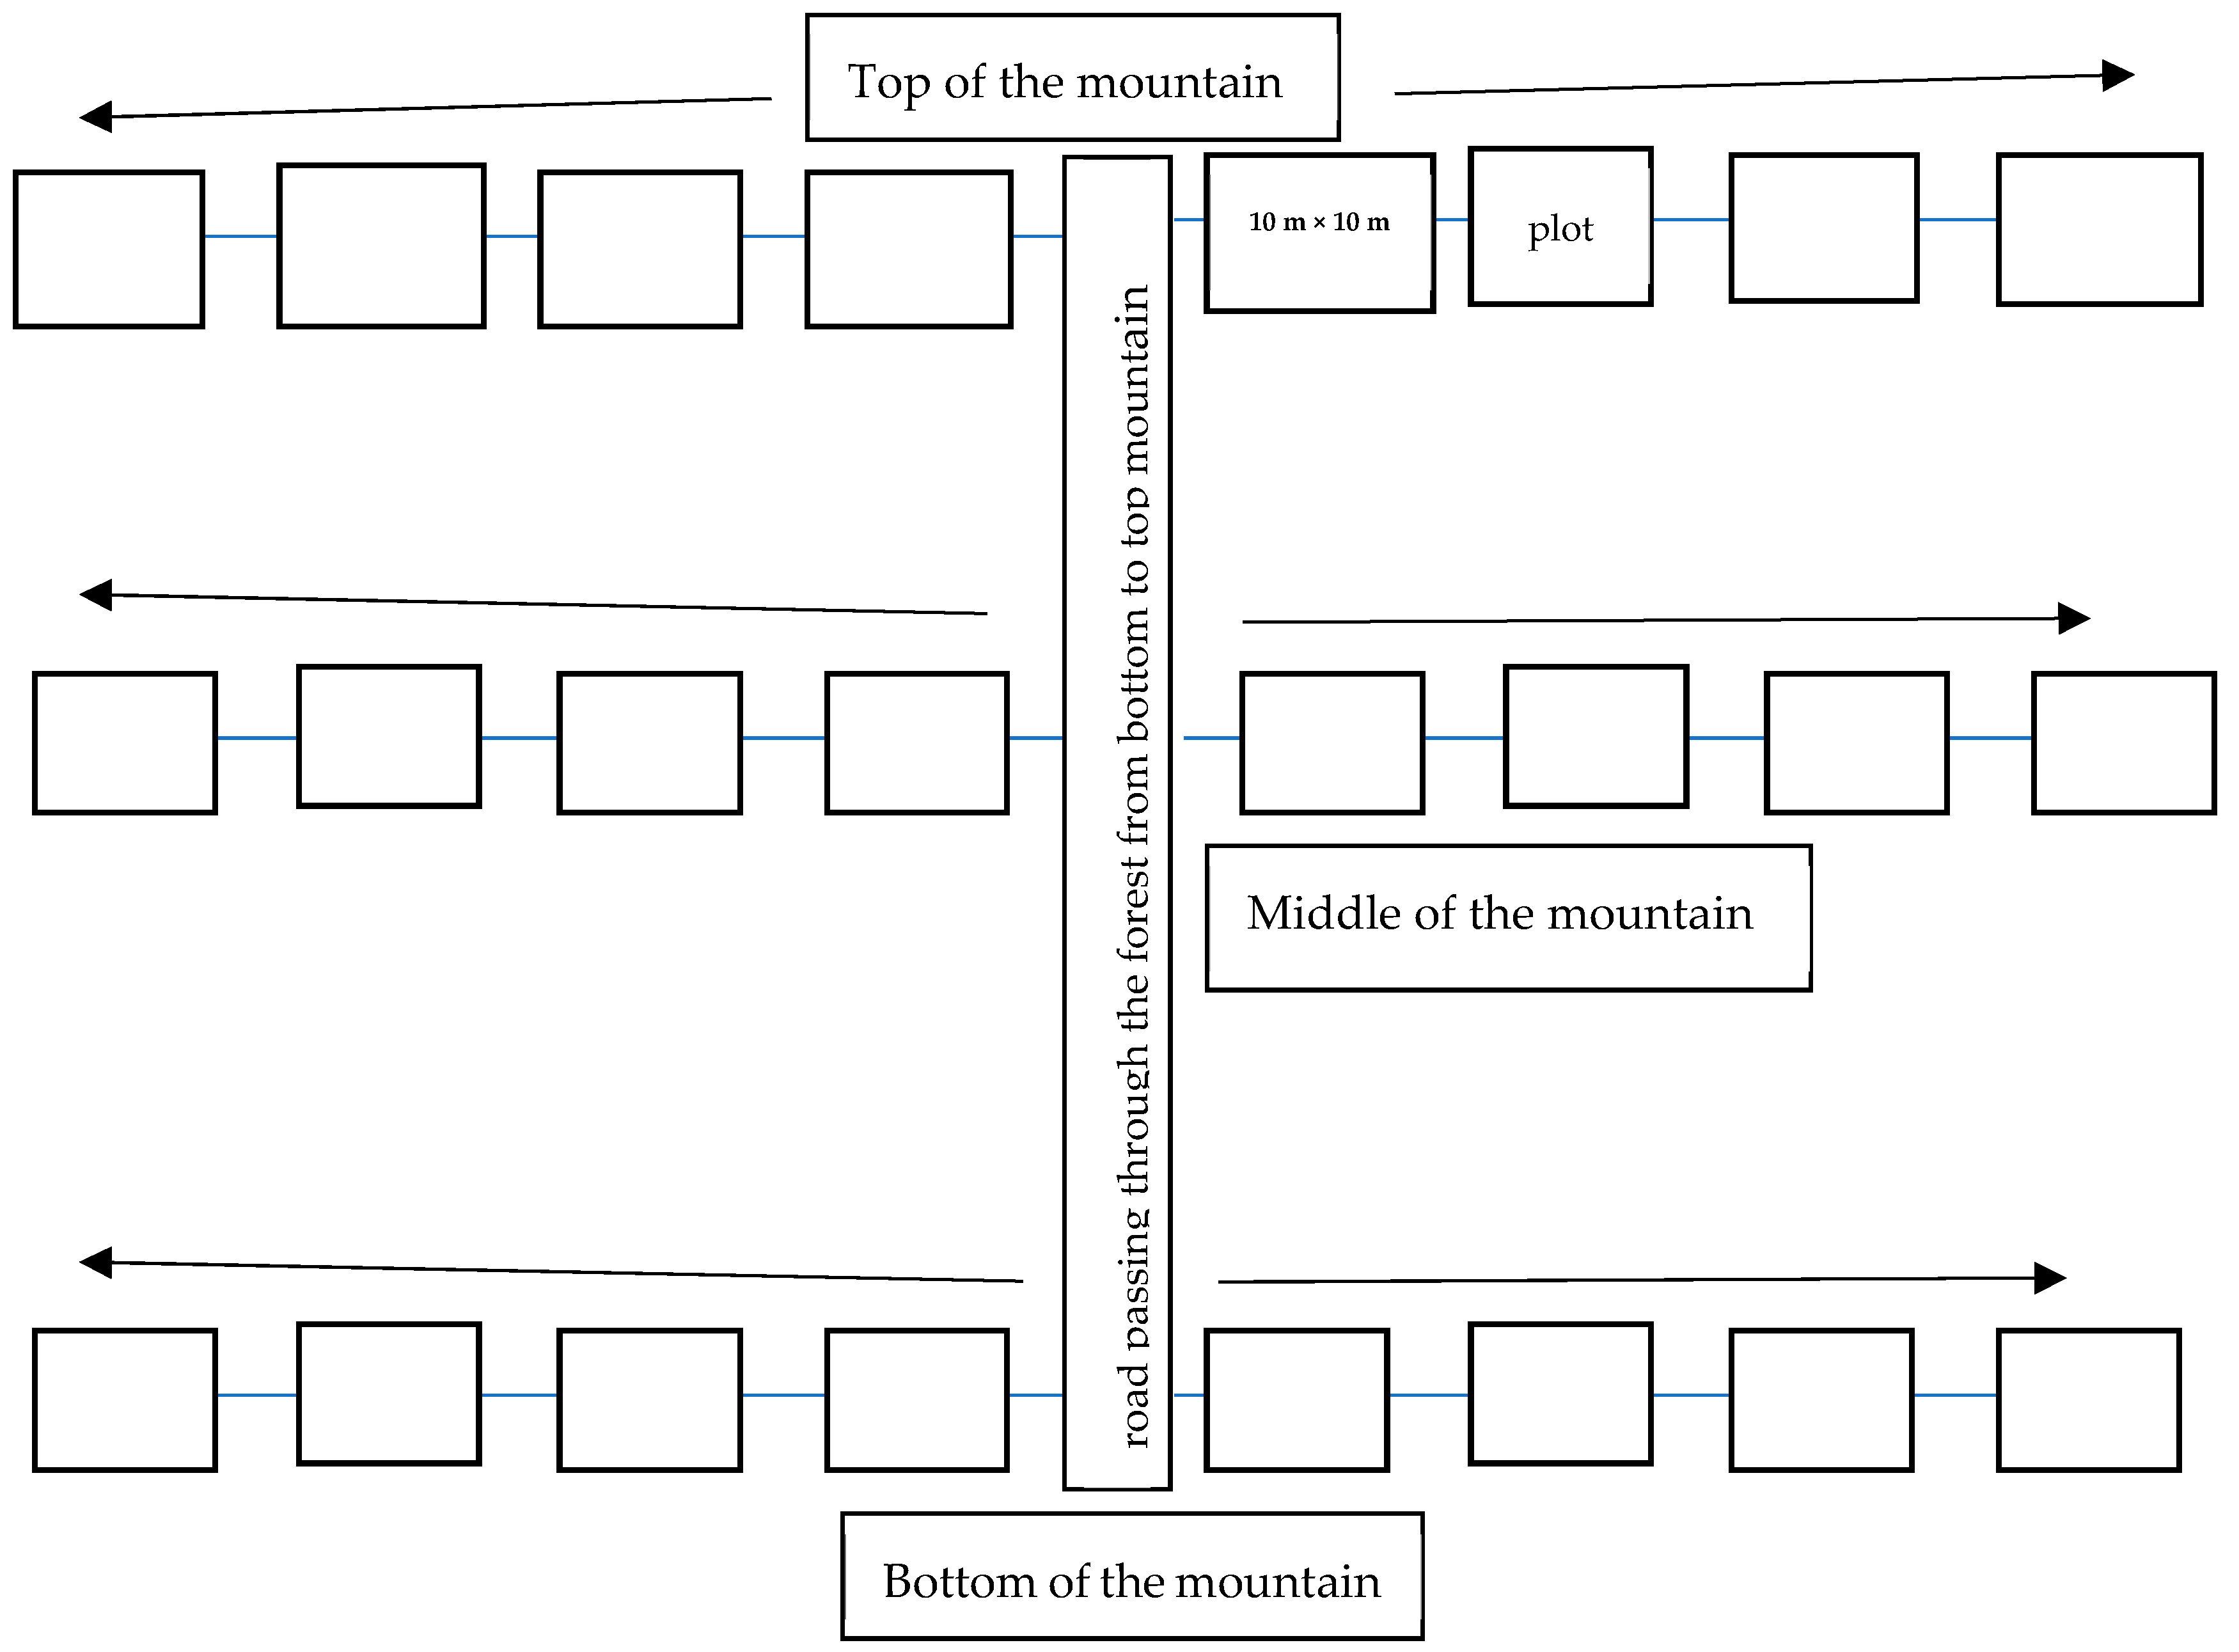
2.2.1. Tree Sampling
2.2.2. Tree Measurements
2.3. Data Analysis
2.3.1. Linearity Test
2.3.2. Allometric Equations Development
3. Results
3.1. Distribution of Biomass Along the Tree Compartments
3.2. Biomass Models
3.3. Predictive Performance of Previously Developed Models
4. Discussion
4.1. Biomass Partition in Tree Components
4.2. Multispecies Biomass Estimation Models
4.3. Species-Specific Biomass Estimation Models
4.4. Performances of Existing Multispecies Models
5. Conclusions
Supplementary Materials
Author Contributions
Funding
Data Availability Statement
Acknowledgments
Conflicts of Interest
Appendix A

| S/N | Scientific Name | Family Name | Number of Trees per ha | Mean dsh | Mean dbh | Total BA per ha | Mean BA per Tree |
|---|---|---|---|---|---|---|---|
| 1 | Juniperus procera Endl. | Cupressaceae | 188 | 41.76 | 34.82 | 27.454 | 0.146 |
| 2 | Pittosporum viridiflorm | Pittosporaceae | 163 | 31.51 | 24.55 | 9.213 | 0.0565 |
| 3 | Euclea divinorum Hiern. | Ebenaceae | 933 | 6.98 | 5.75 | 2.902 | 0.0031 |
| 4 | Teclea nobilis Del. | Rutaceae | 750 | 6.85 | 6.08 | 2.887 | 0.0038 |
| 5 | Olea europaea Subsp. | Oleaceae | 200 | 13.45 | 9.81 | 1.879 | 0.0094 |
| 6 | Oncoba spinosa Forsk. | Flacourtiaceae | 258 | 9.35 | 8.38 | 1.799 | 0.007 |
| 7 | Pappea capensis | Sapindaceae | 129 | 17.80 | 11.29 | 1.594 | 0.0124 |
| 8 | Commiphora africana (A. Rich) Engl. | Burseraceae | 167 | 6.23 | 6.27 | 0.626 | 0.0037 |
| 9 | Vangueria apiculata | Rubiaceae | 104 | 7.00 | 6.42 | 0.386 | 0.0037 |
| 10 | Rytigynia neglecta (Hiern) Robyns | Rubiaceae | 133 | 6.63 | 5.19 | 0.358 | 0.0027 |
| 11 | Hiddi qaalluu | Hiddi qaalluu | 104 | 7.10 | 4.51 | 0.219 | 0.0021 |
| 12 | Maytenus senegalensis (Lam.) Exell | Celastraceae | 100 | 5.11 | 4.09 | 0.156 | 0.0016 |
| 13 | Ruttya fruticosa Lindau | Acanthaceae | 67 | 4.75 | 3.71 | 0.085 | 0.0013 |
| 14 | Commiphora kua (R.Br.ex Royle) Vollesen | Burseraceae | 71 | 4.70 | 3.49 | 0.082 | 0.0012 |
| 15 | Clausena anisata (Willd.) Benth. | Rutaceae | 54 | 3.95 | 3.58 | 0.059 | 0.0011 |
| 16 | Buuxxee | Buuxxee | 21 | 5.26 | 5.66 | 0.055 | 0.0026 |
| 17 | Buddleja polystachya | Scrophulariaceae | 79 | 3.14 | 2.58 | 0.046 | 0.0006 |
| 18 | Acokanthera schimperi (A. DC.) Schweinf | Apocynaceae | 33 | 4.01 | 3.26 | 0.031 | 0.0009 |
| 19 | Secamone punctulata Decne. | Asclepiadaceae | 42 | 3.73 | 2.88 | 0.030 | 0.0007 |
| 20 | Carissa edulis Vahl | Apocynaceae | 29 | 3.63 | 3.01 | 0.023 | 0.0008 |
| Total | 3625 |
| Species | Statistic | dsh (cm) | dbh (cm) | th (m) | cd (m) | ca (m2) | ρ (g/cm3) | Sb | Bb | Tb | Tagb |
|---|---|---|---|---|---|---|---|---|---|---|---|
| Commiphora africana (A. Rich) Engl. | Mean | 6.13 | 6.17 | 3.28 | 1.89 | 3.92 | 0.37 | 2.1 | 3.03 | 1.35 | 6.48 |
| Sd | 2.5 | 2.94 | 1.47 | 1.21 | 4.77 | 0.06 | 1.87 | 3.53 | 1.09 | 6.25 | |
| Min | 2.5 | 2.0 | 1.65 | 0.25 | 0.05 | 0.28 | 0.33 | 0.30 | 0.25 | 0.88 | |
| Max | 11.2 | 13.0 | 6.2 | 4.4 | 15.2 | 0.52 | 6.73 | 16.4 | 3.97 | 26.45 | |
| Euclea divinorum Hiern. | Mean | 7.33 | 6.05 | 4.38 | 2.15 | 5.51 | 0.75 | 4.52 | 5.64 | 1.80 | 11.95 |
| Sd | 2.82 | 2.72 | 1.12 | 1.58 | 8.53 | 0.07 | 1.91 | 2.01 | 0.62 | 4.36 | |
| Min | 2.7 | 1.7 | 2.55 | 0.55 | 0.24 | 0.62 | 1.50 | 1.95 | 0.27 | 3.72 | |
| Max | 15.0 | 14.0 | 6.85 | 6.4 | 32.15 | 0.85 | 8.91 | 11.08 | 2.91 | 22.27 | |
| Olea europaea Subsp. Cuspidata | Mean | 12.25 | 10.68 | 4.72 | 4.06 | 12.73 | 0.97 | 16.17 | 30.28 | 8.63 | 55.38 |
| Sd | 5.78 | 4.63 | 1.64 | 0.87 | 4.59 | 0.16 | 10.95 | 24.8 | 6.36 | 39.62 | |
| Min | 2.5 | 2.3 | 1.14 | 2.35 | 4.34 | 0.71 | 1.65 | 1.52 | 0.76 | 3.92 | |
| Max | 28.5 | 17.0 | 7.2 | 5.2 | 18.85 | 1.24 | 40.14 | 71.08 | 21.17 | 120.89 | |
| Oncoba spinosa Forsk. | Mean | 9.48 | 8.37 | 4.92 | 3.25 | 10.62 | 0.65 | 13.55 | 20.42 | 6.50 | 40.47 |
| Sd | 5.43 | 4.55 | 1.87 | 1.78 | 9.18 | 0.05 | 7.16 | 10.11 | 4.01 | 20.26 | |
| Min | 3.0 | 2.3 | 1.65 | 0.9 | 0.64 | 0.56 | 4.02 | 7.85 | 1.92 | 17.97 | |
| Max | 17.0 | 16.0 | 7.4 | 5.55 | 24.18 | 0.72 | 23.22 | 35.91 | 14.93 | 72.89 | |
| Teclea nobilis Del. | Mean | 8.1 | 7.73 | 5.44 | 2.84 | 7.34 | 0.82 | 10.93 | 15.72 | 7.85 | 34.5 |
| Sd | 3.56 | 4.16 | 1.78 | 1.17 | 5.34 | 0.05 | 5.14 | 8.30 | 3.80 | 16.70 | |
| Min | 2.5 | 2.0 | 2.85 | 0.7 | 0.38 | 0.75 | 3.0 | 5.04 | 1.90 | 9.93 | |
| Max | 15.5 | 15.0 | 8.45 | 5.05 | 20.02 | 0.9 | 21.06 | 32.33 | 15.13 | 68.52 | |
| Aggregate of Five Species | Mean | 8.32 | 7.49 | 4.49 | 2.7 | 7.43 | 0.7 | 8.47 | 13.2 | 4.7 | 26.4 |
| Sd | 4.37 | 4.0 | 1.69 | 1.54 | 7.39 | 0.21 | 7.74 | 14.77 | 4.61 | 26.15 | |
| Min | 2.5 | 1.7 | 1.14 | 0.25 | 0.05 | 0.28 | 0.33 | 0.3 | 0.25 | 0.88 | |
| Max | 28.5 | 17.0 | 8.45 | 6.4 | 32.15 | 1.24 | 40.14 | 71.08 | 21.17 | 120.89 |
| Tagb | Sb | Bb | Tb | |
|---|---|---|---|---|
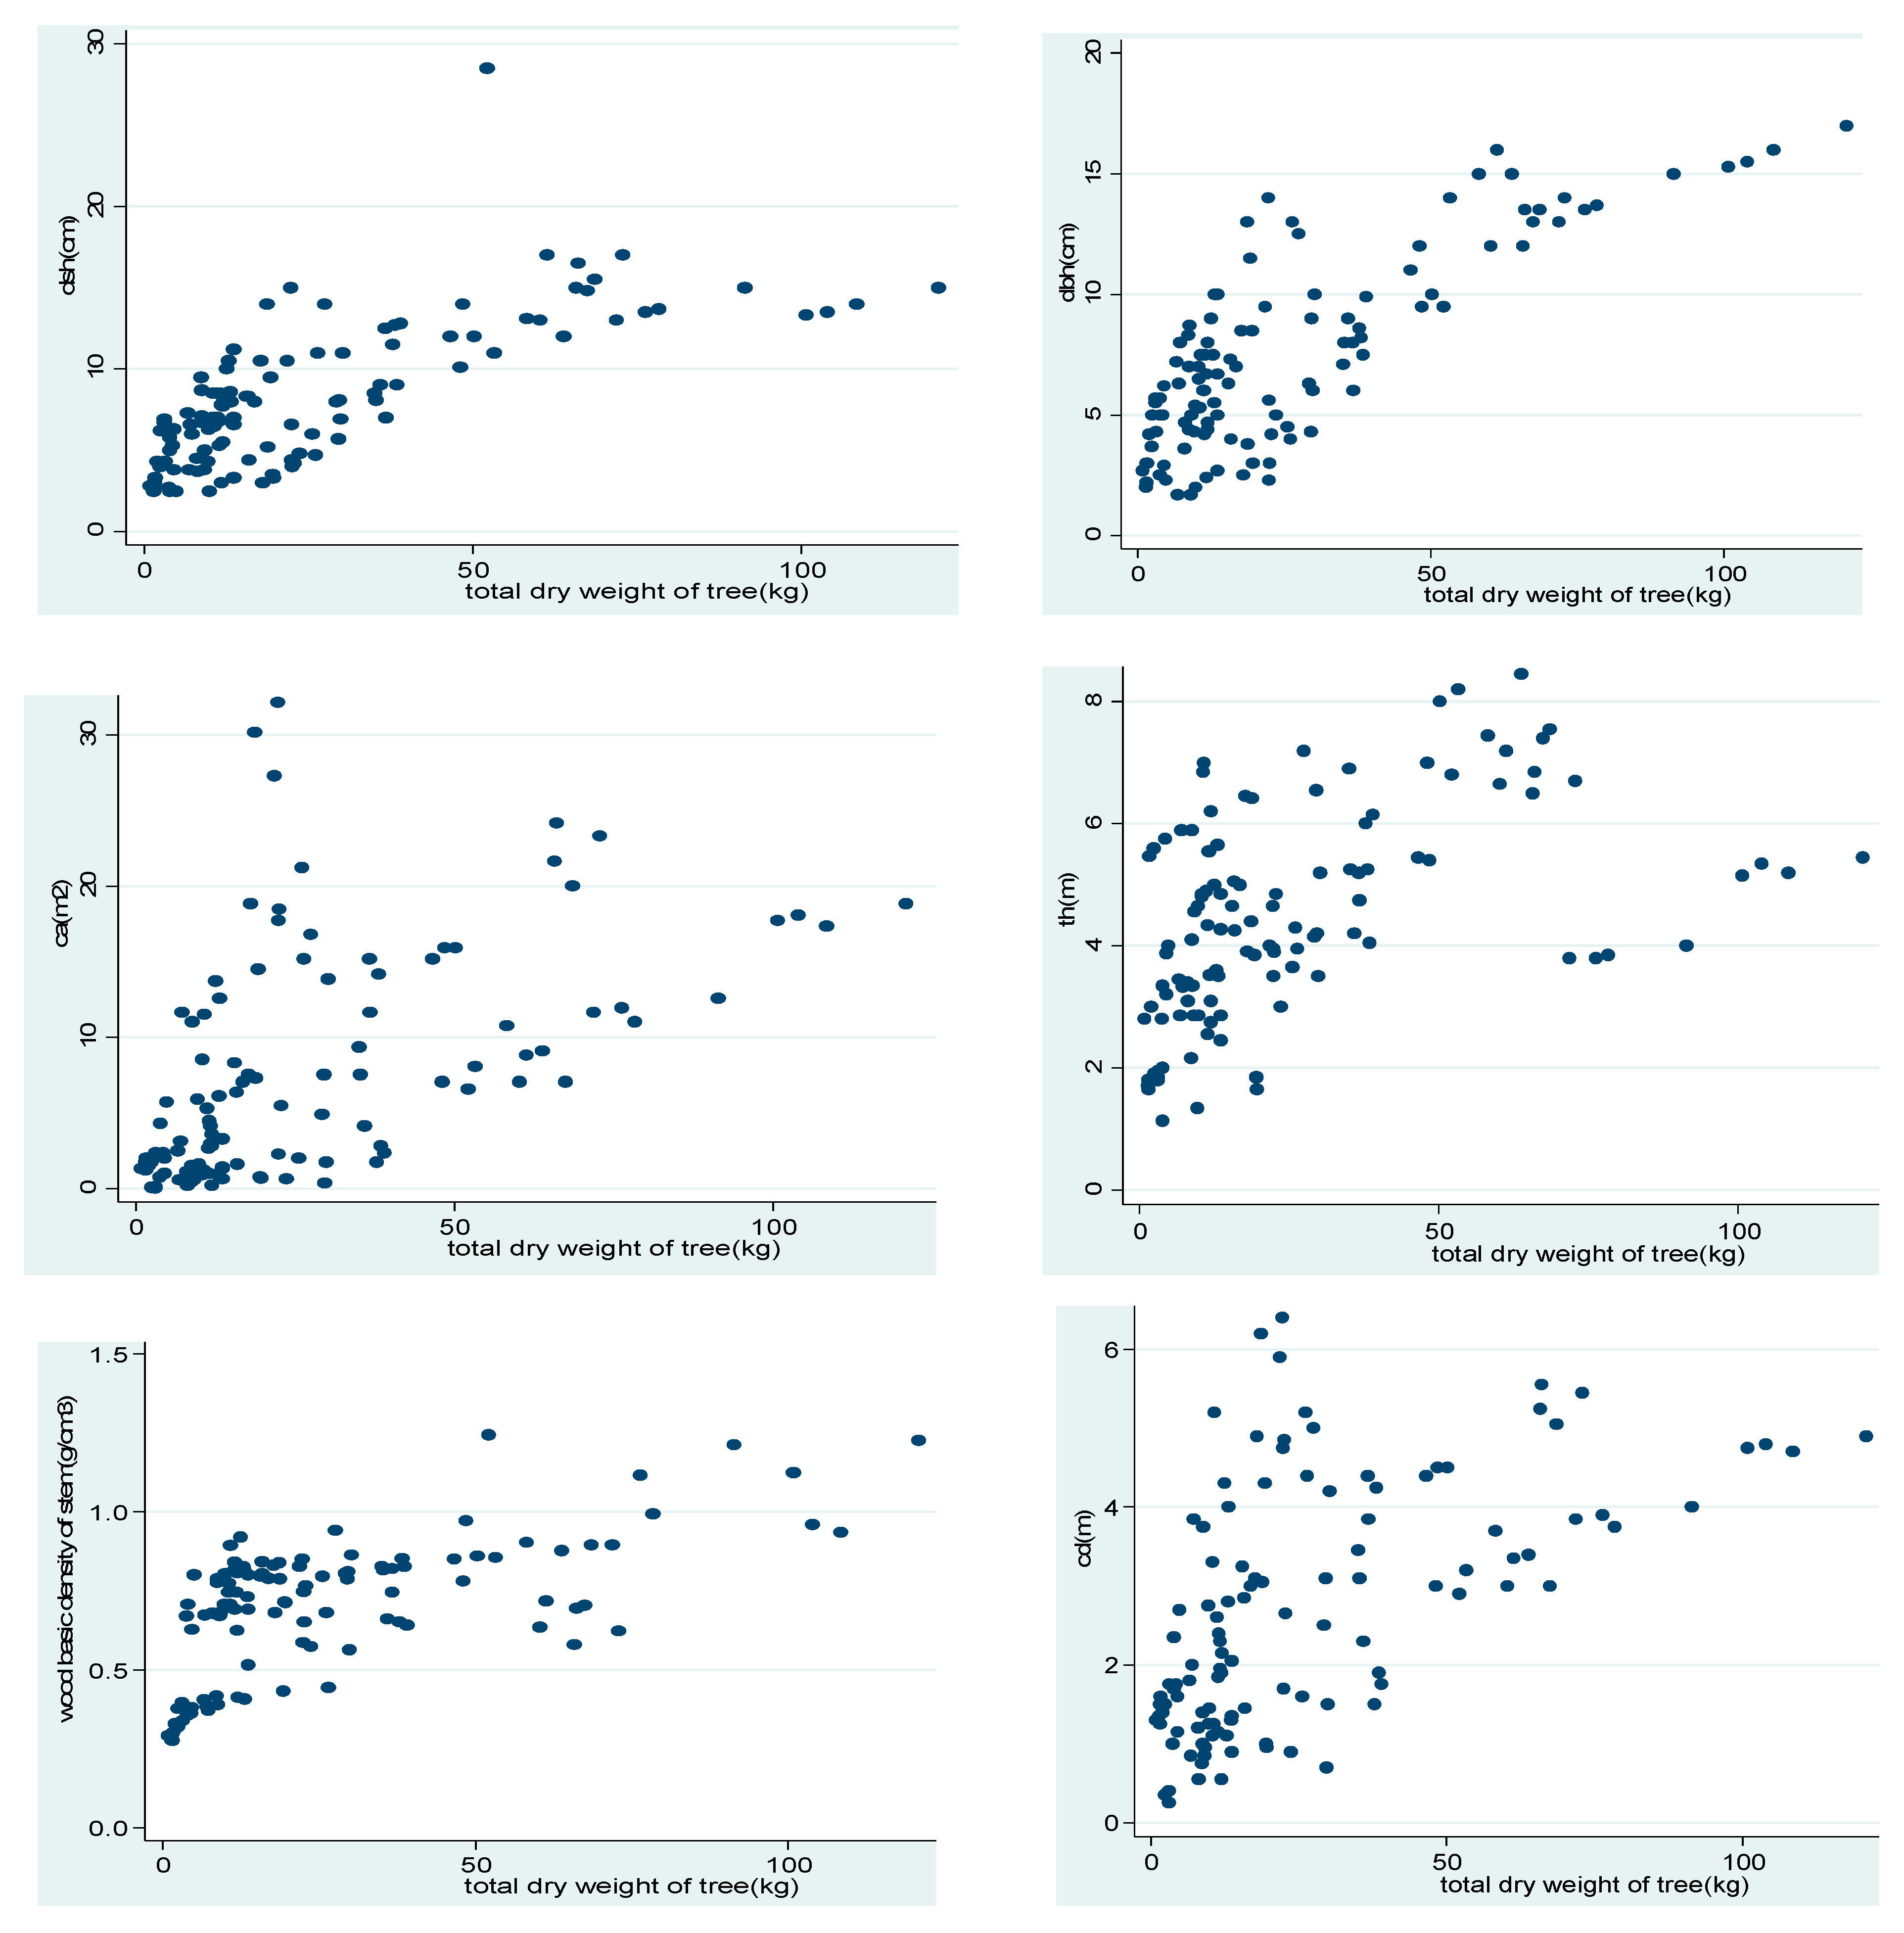
| dsh | 0.7399 * | 0.7419 * | 0.7224 * | 0.634 * |
| dbh | 0.8208 * | 0.8247 * | 0.7938 * | 0.7349 * |
| th | 0.5106 * | 0.532 * | 0.4562 * | 0.5371 * |
| cd | 0.5991 * | 0.5881 * | 0.5565 * | 0.6209 * |
| ca | 0.5607 * | 0.5466 * | 0.5261 * | 0.5731 * |
| wbd | 0.6288 * | 0.623 * | 0.6092 * | 0.5633 * |
| GROUP A | GROUP B |
| MA1: ln(Tagb) = α + β1ln(dbh) MA2: ln(Tagb) = α + β1ln(dbh) + β2ln(th) MA3: ln(Tagb) = α + β1ln(dbh) + β2ln(cd) MA4: ln(Tagb) = α + β1ln(dbh) + β2ln(wbd) MA5: ln(Tagb) = α + β1ln(dbh) + β2ln(th) + β3ln(cd) MA6: ln(Tagb) = α + β1ln(dbh) + β2ln(th) + β3ln(wbd) MA7: ln(Tagb) = α + β1ln(dbh) + β2ln(cd) + β3ln(wbd) MA8: ln(Tagb) = α + β1ln(dbh) + β2ln(th) + β3ln(cd) + β4ln(wbd) | MB1: ln(Sb) = α + β1ln(dbh) MB2: ln(Sb) = α + β1ln(dbh) + β2ln(th) MB3: ln(Sb) = α + β1ln(dbh) + β2ln(cd) MB4: ln(Sb) = α + β1ln(dbh) + β2ln(wbd) MB5: ln(Sb) = α + β1ln(dbh) + β2ln(th) + β3ln(cd) MB6: ln(Sb) = α + β1ln(dbh) + β2ln(th) + β3ln(wbd) MB7: ln(Sb) = α + β1ln(dbh) + β2ln(cd) + β3ln(wbd) MB8: ln(Sb) = α + β1ln(dbh) + β2ln(th) + β3ln(cd) + β4ln(wbd) |
| GROUP C | GROUP D |
| MC1: ln(Bb) = α + β1ln(dbh) MC2: ln(Bb) = α + β1ln(dbh) + β2ln(th) MC3: ln(Bb) = α + β1ln(dbh) + β2ln(cd) MC4: ln(Bb) = α + β1ln(dbh) + β2ln(wbd) MC5: ln(Bb) = α + β1ln(dbh) + β2ln(th) + β3ln(cd) MC6: ln(Bb) = α + β1ln(dbh) + β2ln(th) + β3ln(wbd) MC7: ln(Bb) = α + β1ln(dbh) + β2ln(cd) + β3ln(wbd) MC8: ln(Bb) = α + β1ln(dbh) + β2ln(th) + β3ln(cd) + β4ln(wbd) | MD1: ln(Tb) = α + β1ln(dbh) MD2: ln(Tb) = α + β1ln(dbh) + β2ln(th) MD3: ln(Tb) = α + β1ln(dbh) + β2ln(cd) MD4: ln(Tb) = α + β1ln(dbh) + β2ln(wbd) MD5: ln(Tb) = α + β1ln(dbh) + β2ln(th) + β3ln(cd) MD6: ln(Tb) = α + β1ln(dbh) + β2ln(th) + β3ln(wbd) MD7: ln(Tb) = α + β1ln(dbh) + β2ln(cd) + β3ln(wbd) MD8: ln(Tb) = α + β1ln(dbh) + β2ln(th) + β3ln(cd) + β4ln(wbd) |
References
- Vashum, K.T.; Jayakumar, S. Methods to estimate above-ground biomass and carbon stock in natural forests-a review. J. Ecosyst. Ecography 2012, 2, 1–7. [Google Scholar] [CrossRef]
- Henry, M.; Picard, N.; Trotta, C.; Manlay, R.; Valentini, R.; Bernoux, M.; Saint André, L. Estimating tree biomass of sub-Saharan African forests: A review of available allometric equations. Silva Fenn. 2011, 45, 477–569. [Google Scholar] [CrossRef]
- Mugasha, W.A.; Eid, T.; Bollandsås, O.M.; Malimbwi, R.E.; Chamshama, S.A.O.; Zahabu, E.; Katani, J.Z. Allometric models for prediction of above-and belowground biomass of trees in the miombo woodlands of Tanzania. For. Ecol. Manag. 2013, 310, 87–101. [Google Scholar] [CrossRef]
- Ubuy, M.H.; Eid, T.; Bollandsås, O.M.; Birhane, E. Aboveground biomass models for trees and shrubs of exclosures in the drylands of Tigray, northern Ethiopia. J. Arid Environ. 2018, 156, 9–18. [Google Scholar] [CrossRef]
- Kangas, A.; Maltamo, M. Forest Inventory: Methodology and Applications; Springer Science & Business Media: Berlin/Heidelberg, Germany, 2006; Volume 10. [Google Scholar]
- Wei, X. Biomass estimation: A remote sensing approach. Geogr. Compass 2010, 4, 1635–1647. [Google Scholar] [CrossRef]
- Kumar, L.; Mutanga, O. Remote sensing of above-ground biomass. Remote. Sens. 2017, 9, 935. [Google Scholar] [CrossRef]
- Solomon, N.; Birhane, E.; Tadesse, T.; Treydte, A.C.; Meles, K. Carbon stocks and sequestration potential of dry forests under community management in Tigray, Ethiopia. Ecol. Process. 2017, 6, 20. [Google Scholar] [CrossRef]
- Birhane, E.; Treydte, A.C.; Eshete, A.; Solomon, N.; Hailemariam, M. Can rangelands gain from bush encroachment? Carbon stocks of communal grazing lands invaded by Prosopis juliflora. J. Arid Environ. 2017, 141, 60–67. [Google Scholar] [CrossRef]
- Tetemke, B.A.; Birhane, E.; Rannestad, M.M.; Eid, T. Allometric models for predicting aboveground biomass of trees in the dry afromontane forests of Northern Ethiopia. Forests 2019, 10, 1114. [Google Scholar] [CrossRef]
- Abich, A.; Alemu, A.; Gebremariam, Y.; Mucheye, T.; Gurebiyaw, K.; Kassie, M. Allometric models for predicting aboveground biomass of Combretum-Terminalia woodlands in Amhara, Northwest Ethiopia. Trees For. People 2021, 5, 100122. [Google Scholar] [CrossRef]
- Abich, A.; Mucheye, T.; Tebikew, M.; Gebremariam, Y.; Alemu, A. Species-specific allometric equations for improving aboveground biomass estimates of dry deciduous woodland ecosystems. J. For. Res. 2019, 30, 1619–1632. [Google Scholar] [CrossRef]
- Mulat, A.; Soromessa, T. Species specific allometric model for biomass estimation of Polyscias fulva harms in tumata chirecha agroforestry Gedeo zone of Ethiopia: Implication for sustainable management and climatic change mitigation. J. Energy Technol. Pol. 2016, 6, 12–22. [Google Scholar]
- Hasen-Yusuf, M.; Treydte, A.; Abule, E.; Sauerborn, J. Predicting aboveground biomass of woody encroacher species in semi-arid rangelands, Ethiopia. J. Arid Environ. 2013, 96, 64–72. [Google Scholar] [CrossRef]
- Mulatu, A.; Negash, M.; Asrat, Z. Species-specific allometric models for reducing uncertainty in estimating above ground biomass at Moist Evergreen Afromontane Forest of Ethiopia. Sci. Rep. 2024, 14, 1147. [Google Scholar] [CrossRef]
- Feyisa, K.; Beyene, S.; Angassa, A.; Said, M.Y.; de Leeuw, J.; Abebe, A.; Megersa, B. Effects of enclosure management on carbon sequestration, soil properties and vegetation attributes in East African rangelands. Catena 2017, 159, 9–19. [Google Scholar] [CrossRef]
- Chave, J.; Réjou-Méchain, M.; Búrquez, A.; Chidumayo, E.; Colgan, M.S.; Delitti, W.B.; Duque, A.; Eid, T.; Fearnside, P.M.; Goodman, R.C. Improved allometric models to estimate the aboveground biomass of tropical trees. Glob. Change Biol. 2014, 20, 3177–3190. [Google Scholar] [CrossRef]
- Feyisa, K.; Beyene, S.; Megersa, B.; Said, M.Y.; Angassa, A. Allometric equations for predicting above-ground biomass of selected woody species to estimate carbon in East African rangelands. Agrofor. Syst. 2018, 92, 599–621. [Google Scholar] [CrossRef]
- Temesgen, H.; Affleck, D.; Poudel, K.; Gray, A.; Sessions, J. A review of the challenges and opportunities in estimating above ground forest biomass using tree-level models. Scand. J. For. Res. 2015, 30, 326–335. [Google Scholar] [CrossRef]
- Dida, H. The Impacts of Development Interventions on Customary Institutions of Forest Resource Management among the Borana Oromo of Southern Ethiopia; Addis Ababa University, Department of Social Anthropology: Addis Ababa, Ethiopia, 2010. [Google Scholar]
- Angassa, A. The Dynamics of Savanna Ecosystems and Management in Borana, Southern Ethiopia; Norwegian University of Life Sciences: As, Norway, 2007. [Google Scholar]
- Teka, H.; Madakadze, C.I.; Botai, J.O.; Hassen, A.; Angassa, A.; Mesfin, Y. Evaluation of land use land cover changes using remote sensing Landsat images and pastoralists perceptions on range cover changes in Borana rangelands, Southern Ethiopia. Int. J. Biodivers. Conserv. 2018, 10, 1–11. [Google Scholar]
- Megersa, B.; Markemann, A.; Angassa, A.; Ogutu, J.O.; Piepho, H.-P.; Zaráte, A.V. Impacts of climate change and variability on cattle production in southern Ethiopia: Perceptions and empirical evidence. Agric. Syst. 2014, 130, 23–34. [Google Scholar] [CrossRef]
- Ellenberg, D.; Mueller-Dombois, D. Aims and Methods of Vegetation Ecology; Wiley: New York, NY, USA, 1974; Volume 547. [Google Scholar]
- Asrat, Z.; Taddese, H.; Ørka, H.O.; Gobakken, T.; Burud, I.; Næsset, E. Estimation of forest area and canopy cover based on visual interpretation of satellite images in Ethiopia. Land 2018, 7, 92. [Google Scholar] [CrossRef]
- Bitew, G.; Tesfaye, A. Patterns of woody species diversity along disturbance gradient in Gumdri Abo natural forest, Dangila District, North Western Ethiopia. J. Nat. Sci. Res. 2017, 9, 32–46. [Google Scholar]
- Hussein, A.; Dejene, S.W.; Aschalew, A. Comparison of woody species diversity and population structure along disturbance gradient in babile elephant sanctuary, ethiopia. J. Landsc. Ecol. 2022, 15, 59–79. [Google Scholar] [CrossRef]
- Philip, M.S. Measuring Trees and Forests; CABI Digital Library: Oxfordshire, UK, 1994. [Google Scholar]
- Bettinger, P.; Boston, K.; Siry, J.P.; Grebner, D.L. Forest Management and Planning; Academic press: Cambridge, MA, USA, 2016. [Google Scholar]
- Giday, K.; Eshete, G.; Barklund, P.; Aertsen, W.; Muys, B. Wood biomass functions for Acacia abyssinica trees and shrubs and implications for provision of ecosystem services in a community managed exclosure in Tigray, Ethiopia. J. Arid Environ. 2013, 94, 80–86. [Google Scholar] [CrossRef]
- Gessesse, T.A. Above-and Belowground Carbon Stocks in Semi-Arid Land-Use Systems under Integrated Watershed Management in Gergera Watershed, Ethiopia; Universitäts-und Landesbibliothek Bonn: Bonn, Germany, 2016. [Google Scholar]
- Balima, L.H.; Nacoulma, B.M.I.; Bayen, P.; Dimobe, K.; Kouamé, F.N.G.; Thiombiano, A. Aboveground biomass allometric equations and distribution of carbon stocks of the African oak (Afzelia africana Sm.) in Burkina Faso. J. For. Res. 2020, 31, 1699–1711. [Google Scholar] [CrossRef]
- Mukuralinda, A.; Kuyah, S.; Ruzibiza, M.; Ndoli, A.; Nabahungu, N.L.; Muthuri, C. Allometric equations, wood density and partitioning of aboveground biomass in the arboretum of Ruhande, Rwanda. Trees For. People 2021, 3, 100050. [Google Scholar] [CrossRef]
- Delcourt, C.J.F.; Veraverbeke, S. Allometric equations and wood density parameters for estimating aboveground and woody debris biomass in Cajander larch (Larix cajanderi) forests of northeast Siberia. Biogeosciences 2022, 19, 4499–4520. [Google Scholar] [CrossRef]
- Egeta, D.; Negash, M.; Alebachew, M.; Eshete, A.; Mulugeta, S.; Lemi, T. Species-Specific Allometric Equations, Biomass Expansion Factor, and Wood Density of Native Tree Species in the Dry Afromontane Forest of Ethiopia. Int. J. For. Res. 2023, 2023, 5572048. [Google Scholar] [CrossRef]
- Kebede, B.; Soromessa, T. Allometric equations for aboveground biomass estimation of Olea europaea L. subsp. cuspidata in Mana Angetu Forest. Ecosyst. Health Sustain. 2018, 4, 1–12. [Google Scholar] [CrossRef]
- Njana, M.A.; Meilby, H.; Eid, T.; Zahabu, E.; Malimbwi, R.E. Importance of tree basic density in biomass estimation and associated uncertainties: A case of three mangrove species in Tanzania. Ann. For. Sci. 2016, 73, 1073–1087. [Google Scholar] [CrossRef]
- Akaike, H. A new look at the statistical model identification. IEEE Trans. Autom. Control 1974, 19, 716–723. [Google Scholar] [CrossRef]
- Mokria, M.; Mekuria, W.; Gebrekirstos, A.; Aynekulu, E.; Belay, B.; Gashaw, T.; Bräuning, A. Mixed-species allometric equations and estimation of aboveground biomass and carbon stocks in restoring degraded landscape in northern Ethiopia. Environ. Res. Lett. 2018, 13, 024022. [Google Scholar] [CrossRef]
- Trumper, K.; Ravilious, C.; Dickson, B. Carbon in Drylands: Desertification, Climate Change and Carbon Finance. 2008. Available online: https://citeseerx.ist.psu.edu/document?repid=rep1&type=pdf&doi=cb959da9184a9f4cd60ec6b2b46ccbeca35a927c (accessed on 18 January 2025).
- Goodman, R.C.; Phillips, O.L.; Baker, T.R. The importance of crown dimensions to improve tropical tree biomass estimates. Ecol. Appl. 2014, 24, 680–698. [Google Scholar] [CrossRef] [PubMed]
- Dimobe, K.; Kouakou, J.; Tondoh, J.; Zoungrana, B.; Forkuor, G.; Ouédraogo, K. Predicting the Potential Impact of Climate Change on Carbon Stock in Semi-Arid West African Savannas. Land 2018, 7, 124. [Google Scholar] [CrossRef]
- Henry, M.; Besnard, A.; Asante, W.; Eshun, J.; Adu-Bredu, S.; Valentini, R.; Bernoux, M.; Saint-André, L. Wood density, phytomass variations within and among trees, and allometric equations in a tropical rainforest of Africa. For. Ecol. Manag. 2010, 260, 1375–1388. [Google Scholar] [CrossRef]
- Sebrala, H.; Abich, A.; Negash, M.; Asrat, Z.; Lojka, B. Tree allometric equations for estimating biomass and volume of Ethiopian forests and establishing a database. Trees For. People 2022, 9, 100314. [Google Scholar] [CrossRef]
- Segura, M.; Kanninen, M. Allometric models for tree volume and total aboveground biomass in a tropical humid forest in Costa Rica 1. Biotropica: J. Biol. Conserv. 2005, 37, 2–8. [Google Scholar] [CrossRef]
- Chave, J.r.; Andalo, C.; Brown, S.; Cairns, M.A.; Chambers, J.Q.; Eamus, D.; Fölster, H.; Fromard, F.; Higuchi, N.; Kira, T. Tree allometry and improved estimation of carbon stocks and balance in tropical forests. Oecologia 2005, 145, 87–99. [Google Scholar] [CrossRef]
- Kuyah, S.; Dietz, J.; Muthuri, C.; Jamnadass, R.; Mwangi, P.; Coe, R.; Neufeldt, H. Allometric equations for estimating biomass in agricultural landscapes: II. Belowground biomass. Agric. Ecosyst. Environ. 2012, 158, 225–234. [Google Scholar] [CrossRef]
- Hofstad, O. Review of biomass and volume functions for individual trees and shrubs in Southeast Africa. J. Trop. For. Sci. 2005, 17, 151–162. [Google Scholar]
- Phalla, T.; Ota, T.; Mizoue, N.; Kajisa, T.; Yoshida, S.; Vuthy, M.; Heng, S. The importance of tree height in estimating individual tree biomass while considering errors in measurements and allometric models. AGRIVITA J. Agric. Sci. 2017, 40, 131–140. [Google Scholar] [CrossRef]
- Daba, D.E.; Soromessa, T. The accuracy of species-specific allometric equations for estimating aboveground biomass in tropical moist montane forests: Case study of Albizia grandibracteata and Trichilia dregeana. Carbon Balance Manag. 2019, 14, 1–13. [Google Scholar] [CrossRef] [PubMed]
- Petrea, S.; Radu, G.R.; Braga, C.I.; Cucu, A.B.; Serban, T.; Zaharia, A.; Pepelea, D.; Ienasoiu, G.; Petritan, I.C. The role of wood density variation and biomass allocation in accurate forest carbon stock estimation of European beech (Fagus sylvatica L.) mountain forests. Forests 2024, 15, 404. [Google Scholar] [CrossRef]
- Zhang, L.; Bi, H.; Cheng, P.; Davis, C.J. Modeling spatial variation in tree diameter–height relationships. For. Ecol. Manag. 2004, 189, 317–329. [Google Scholar] [CrossRef]
- Wang, X.; Fang, J.; Tang, Z.; Zhu, B. Climatic control of primary forest structure and DBH–height allometry in Northeast China. For. Ecol. Manag. 2006, 234, 264–274. [Google Scholar] [CrossRef]
- Sawadogo, L.; Savadogo, P.; Tiveau, D.; Dayamba, S.D.; Zida, D.; Nouvellet, Y.; Oden, P.C.; Guinko, S. Allometric prediction of above-ground biomass of eleven woody tree species in the Sudanian savanna-woodland of West Africa. J. For. Res. 2010, 21, 475–481. [Google Scholar] [CrossRef]
- Berner, L.T.; Alexander, H.D.; Loranty, M.M.; Ganzlin, P.; Mack, M.C.; Davydov, S.P.; Goetz, S.J. Biomass allometry for alder, dwarf birch, and willow in boreal forest and tundra ecosystems of far northeastern Siberia and north-central Alaska. For. Ecol. Manag. 2015, 337, 110–118. [Google Scholar] [CrossRef]
- Dimobe, K.; Goetze, D.; Ouédraogo, A.; Mensah, S.; Akpagana, K.; Porembski, S.; Thiombiano, A. Aboveground biomass allometric equations and carbon content of the shea butter tree (Vitellaria paradoxa CF Gaertn., Sapotaceae) components in Sudanian savannas (West Africa). Agrofor. Syst. 2019, 93, 1119–1132. [Google Scholar] [CrossRef]
- Amanuel, W.; Tadesse, C.; Molla, M.; Getinet, D.; Mekonnen, Z. Allometric equation for estimating aboveground biomass of Acacia-Commiphora forest, southern Ethiopia. J. Ecol. Environ. 2024, 48, 196–206. [Google Scholar] [CrossRef]
- Bond-Lamberty, B.; Wang, C.; Gower, S. Aboveground and belowground biomass and sapwood area allometric equations for six boreal tree species of northern Manitoba. Can. J. For. Res. 2002, 32, 1441–1450. [Google Scholar] [CrossRef]
- Gebeyehu, G.; Soromessa, T.; Bekele, T.; Teketay, D. Allometric Equations for Aboveground Biomass Estimations of Four Dry Afromontane Tree Species. 2020. Available online: https://www.researchsquare.com/article/rs-102592/v1 (accessed on 20 February 2025).
- Tesfaye, M.A.; Bravo-Oviedo, A.; Bravo, F.; Ruiz-Peinado, R. Aboveground biomass equations for sustainable production of fuelwood in a native dry tropical afro-montane forest of Ethiopia. Ann. For. Sci. 2016, 73, 411–423. [Google Scholar] [CrossRef]
- Ngomanda, A.; Obiang, N.L.E.; Lebamba, J.; Mavouroulou, Q.M.; Gomat, H.; Mankou, G.S.; Loumeto, J.; Iponga, D.M.; Ditsouga, F.K.; Koumba, R.Z. Site-specific versus pantropical allometric equations: Which option to estimate the biomass of a moist central African forest? For. Ecol. Manag. 2014, 312, 1–9. [Google Scholar] [CrossRef]

| Plant Species | n | Stem Biomass | Branch Biomass | Twig Biomass |
|---|---|---|---|---|
| Commiphora africana (A. Rich) Engl. | 25 | (2.1, 0.3–6.7) | (3, 0.3–16.4) | (1.4, 0.3–4) |
| Euclea divinorum Hiern. | 31 | (4.5, 1.5–8.9) | (5.6, 1.9–11) | (1.8, 0.3–2.9) |
| Olea europaea Subsp. cuspidata | 18 | (16.2, 1.7–40) | (30.3, 1.5–71.1) | (8.6, 0.8–21.2) |
| Oncoba spinosa Forsk. | 17 | (13.6, 4–23.2) | (20.4, 7.8–35.9) | (6.5, 1.9–14.9) |
| Teclea nobilis Del. | 23 | (10.9, 3–21.1) | (15.2, 5–32.3) | (7.9, 1.9–15.1) |
| Model | Model Expression | n | α | β1 | β2 | β3 | CF | adj. R2 | MPE | rBias (%) | AIC |
|---|---|---|---|---|---|---|---|---|---|---|---|
| MA7 | AGB = Exp [α + β1ln(dbh) + β2ln(cd) + β3ln(ρ)] × CF | 114 | 1.703 | 0.790 | 0.300 | 1.560 | 1.136 | 0.78 | −1.01 | 3.82 | 172.0 |
| MB7 | Sb = Exp [α + β1ln(dbh) + β2ln(cd) + β3ln(ρ)] × CF | 114 | 0.663 | 0.764 | 0.294 | 1.548 | 1.111 | 0.81 | −0.38 | 4.47 | 150.6 |
| MC7 | Bb = Exp [α + β1ln(dbh) + β2ln(cd) + β3ln(ρ)] ×CF | 114 | 0.897 | 0.871 | 0.225 | 1.692 | 1.181 | 0.75 | −0.44 | 3.33 | 202.1 |
| MD5 | Tb = Exp [α + β1ln(dbh) + β2ln(cd) + β3ln(ρ)] × CF | 114 | −0.160 | 0.643 | 0.469 | 1.216 | 1.274 | 0.57 | −0.19 | 4.04 | 244.9 |
| Biomass Component | Model Expression |
|---|---|
| Total Aboveground Biomass (AGB) | AGB = Exp [1.703 + 0.790ln(dbh) + 0.300ln(cd) + 1.560ln(ρ)] × 1.136 |
| Stem Biomass (Sb) | Sb = Exp [0.663 + 0.764ln(dbh) + 0.294ln(cd) + 1.548ln(ρ)] × 1.111 |
| Branch Biomass (Bb) | Bb = Exp [0.897 + 0.871ln(dbh) + 0.225ln(cd) + 1.692ln(ρ)] × 1.181 |
| Twig Biomass (Tb) | Tb = Exp [−0.160 + 0.643ln(dbh) + 0.469ln(cd) + 1.216ln(ρ)] × 1.195 |
| Species | Model | Model Expression | α | β1 | β2 | CF | R2adj | MPE | rBias (%) | AIC |
|---|---|---|---|---|---|---|---|---|---|---|
| C. africana | MA3Co | AGB = Exp [α + β1ln(dsh) + β2ln(cd)] × CF | −1.764 | 1.769 | 0.465 | 1.0146 | 0.964 | 0.09 | 1.39 | −14.6 |
| E. divinorum | MA1Eu | AGB = Exp [α + β1ln(dsh)] × CF | 0.785 | 0.847 | — | 1.022 | 0.716 | −0.07 | 0.58 | −6.9 |
| O. europaea | MA1Ol | AGB = Exp [α + β1ln(dbh)] × CF | −0.187 | 1.694 | — | 1.097 | 0.848 | −0.38 | 0.07 | 1.26 |
| O. spinosa | MA2On | AGB = Exp [α + β1ln(dbh) + β2ln(th)] × CF | 1.911 | 0.436 | 0.544 | 1.014 | 0.897 | 0.10 | 0.25 | −0.62 |
| T. nobilis | MA3Te | AGB = Exp [α + β1ln(dbh) + β2ln(cd)] × CF | 1.779 | 0.764 | 0.204 | 1.012 | 0.919 | −0.18 | 0.52 | −18.2 |
| Model Type | Reference | Model Equation | N | Observed Mean | Predicted Mean | MPE | rBias (%) |
|---|---|---|---|---|---|---|---|
| Multispecies | This study (MA7) | AGB = Exp [1.703 + 0.79ln(dbh) + 0.3ln(cd) + 1.56ln(ρ)] × 1.136 | 114 | 26.41 | 27.42 | −1.01 | 3.82 |
| Multispecies | [11] | AGB = Exp [−1.726 + 2.030ln(DBH) + 0.616ln(H) + 0.915ln(ρ)] × 1.029 | 114 | 26.41 | 32.28 | −5.87 | 22.22 |
| Multispecies | [10] | AGB = 0.350 × dbh0.864 × ca0.171 × ρ0.485 | 114 | 26.41 | 23.59 | 2.82 | 10.69 |
| Multispecies | [15] | AGB = Exp (−1.58 + 1.197ln(dbh) + 0.818ln(th) + 0.321ln(ca)) × 1.08 | 114 | 26.41 | 19.05 | 7.35 | 27.84 |
| Multispecies | [4] | AGB = 0.3102 × ds1.51554 × cw0.6453 | 114 | 26.41 | 18.00 | 8.41 | 31.84 |
| Multispecies | [39] | AGB = 0.2451 × (DSH2 × H)0.7038 | 114 | 26.41 | 16.38 | 10.03 | 37.98 |
| Multispecies | [17] | AGB = 0.0673 × (D2 × H × WD)0.976 | 114 | 26.41 | 18.00 | 8.41 | 31.84 |
| Multispecies | [3] | AGB = 0.0763 × DBH2.2046 × H0.4918 | 114 | 26.41 | 20.17 | 6.24 | 23.62 |
Disclaimer/Publisher’s Note: The statements, opinions and data contained in all publications are solely those of the individual author(s) and contributor(s) and not of MDPI and/or the editor(s). MDPI and/or the editor(s) disclaim responsibility for any injury to people or property resulting from any ideas, methods, instructions or products referred to in the content. |
© 2025 by the authors. Licensee MDPI, Basel, Switzerland. This article is an open access article distributed under the terms and conditions of the Creative Commons Attribution (CC BY) license (https://creativecommons.org/licenses/by/4.0/).
Share and Cite
Jilo, D.; Birhane, E.; Tadesse, T.; Ubuy, M.H. Aboveground Biomass Models for Common Woody Species of Lowland Forest in Borana Woodland, Southern Ethiopia. Forests 2025, 16, 823. https://doi.org/10.3390/f16050823
Jilo D, Birhane E, Tadesse T, Ubuy MH. Aboveground Biomass Models for Common Woody Species of Lowland Forest in Borana Woodland, Southern Ethiopia. Forests. 2025; 16(5):823. https://doi.org/10.3390/f16050823
Chicago/Turabian StyleJilo, Dida, Emiru Birhane, Tewodros Tadesse, and Mengesteab Hailu Ubuy. 2025. "Aboveground Biomass Models for Common Woody Species of Lowland Forest in Borana Woodland, Southern Ethiopia" Forests 16, no. 5: 823. https://doi.org/10.3390/f16050823
APA StyleJilo, D., Birhane, E., Tadesse, T., & Ubuy, M. H. (2025). Aboveground Biomass Models for Common Woody Species of Lowland Forest in Borana Woodland, Southern Ethiopia. Forests, 16(5), 823. https://doi.org/10.3390/f16050823