Article

The Hidden Carbon Cost of Forest Fire Management: Quantifying Greenhouse Gas Emissions from Both Vegetation Burning and Social Rescue Activities in Yajiang County, China

1
School of Environmental Science and Engineering, Southwest Jiaotong University, Chengdu 611756, China
2
Faculty of Geosciences and Engineering, Southwest Jiaotong University, Chengdu 611756, China
3
Sichuan Jinmei Environmental Protection Group Co., Ltd., Chengdu 611756, China
*
Author to whom correspondence should be addressed.
Forests 2025, 16(5), 803; https://doi.org/10.3390/f16050803
Submission received: 31 March 2025 / Revised: 23 April 2025 / Accepted: 9 May 2025 / Published: 11 May 2025
(This article belongs to the Special Issue Fire Ecology and Management in Forest—2nd Edition)

Abstract

:
Quantifying greenhouse gas (GHG) emissions from forest fires is essential for climate change mitigation strategies, yet current methodologies predominantly focus on vegetation combustion, neglecting emissions from firefighting operations. This study presents a comprehensive assessment of GHG emissions from a forest fire in Yajiang County, China, by integrating remote sensing data with ground-based measurements to quantify emissions from both vegetation combustion and emergency response activities. Analysis revealed that the fire, which affected 20,688.67 hectares, generated 63,764.59 tons of GHGs—with vegetation combustion accounting for 83.5% (53,266.29 tons) and emergency response activities contributing 16.5% (10,498.30 tons). Moderate-severity fires in evergreen forests yielded the highest emissions, while aerial operations constituted the primary source of emergency-response-related emissions. Significantly, NOx emissions from emergency response activities exceeded those from vegetation combustion. This research advances forest fire management by establishing a holistic accounting framework that incorporates previously unquantified emission sources, thereby providing foundational data for developing environmentally optimized fire social rescue activity protocols.

1. Introduction

The third meeting of the Sixth Assessment Report (AR6) of the Intergovernmental Panel on Climate Change (IPCC) reported the continued growth of global greenhouse gas (GHG) emissions and the adverse consequences of the accelerated rise in global temperatures [1]. Climate change, driven by increasing temperatures, has gradually become a serious threat to the global environment [2]. The interrelationship between forest fires and climate change has grown increasingly evident, as wildfires significantly impact global GHG emissions. Forest fires are a major source of carbon emissions, primarily through the burning of biomass, as well as significant sources of carbon dioxide and methane. Forest fires contribute substantially to natural GHG emissions compared to other natural and anthropogenic sources [3]. Research by Yue and Gao [4] has shown that forest fires account for 37.8% of the total GHG emissions from natural sources and 16.9% of total natural and anthropogenic emissions. As global temperatures continue to rise, large forest fires have become more frequent, as warmer temperatures and prolonged droughts create conditions conducive to more extensive and frequent fires. Forest fires not only release greenhouse gases but also affect air quality, creating a feedback loop that accelerates climate change [5].
Quantifying GHG emissions from forest fires is crucial for predicting air quality and understanding their broader climate impacts [6]. Various methods have been developed to estimate these emissions, initially based on models combining data on burned area, biomass, and combustion factors [7]. Later studies have refined these models by incorporating factors like land cover [8], vegetation characteristics [9], and emission factors [10].
Advances in remote sensing and fire modeling technologies have significantly improved the accuracy and scalability of fire-related carbon emission estimates. Tools like Google Earth Engine (GEE) have enabled more precise assessments of fire events. These platforms have been widely adopted for forest fire monitoring and management, providing a robust framework for emission estimation [11]. Advances in remote sensing technology and many studies have highlighted how GHG emissions from fires affect atmospheric quality, and significant progress has been made in quantifying GHG emissions from vegetation burning, including the Fire Emissions Report [12], and national air quality issues [13]. While these studies have provided valuable insights, the emissions generated during fire social rescue activities, such as those from firefighting equipment, transportation, and evacuation activities, remain underexplored. This portion of GHG emissions is often overlooked, even though they can have a significant impact on total GHG emissions during a fire event.
This study addresses this gap by combining remote sensing tools with ground-based emission modeling to provide a comprehensive assessment of the GHG emissions from vegetation burning and social rescue activities during forest fires in Yajiang County. Our findings contribute to a more comprehensive understanding of the environmental impacts of forest fires and offer critical insights for forest management policies. In particular, these findings highlight the need to integrate social rescue activities into climate change mitigation strategies when developing policies aimed at reducing overall carbon emissions from forest fires. These insights are crucial for enhancing fire prevention and suppression policies and informing adaptation efforts in the context of climate change, especially given the increasing frequency and intensity of extreme fire events worldwide.

2. Materials and Methods

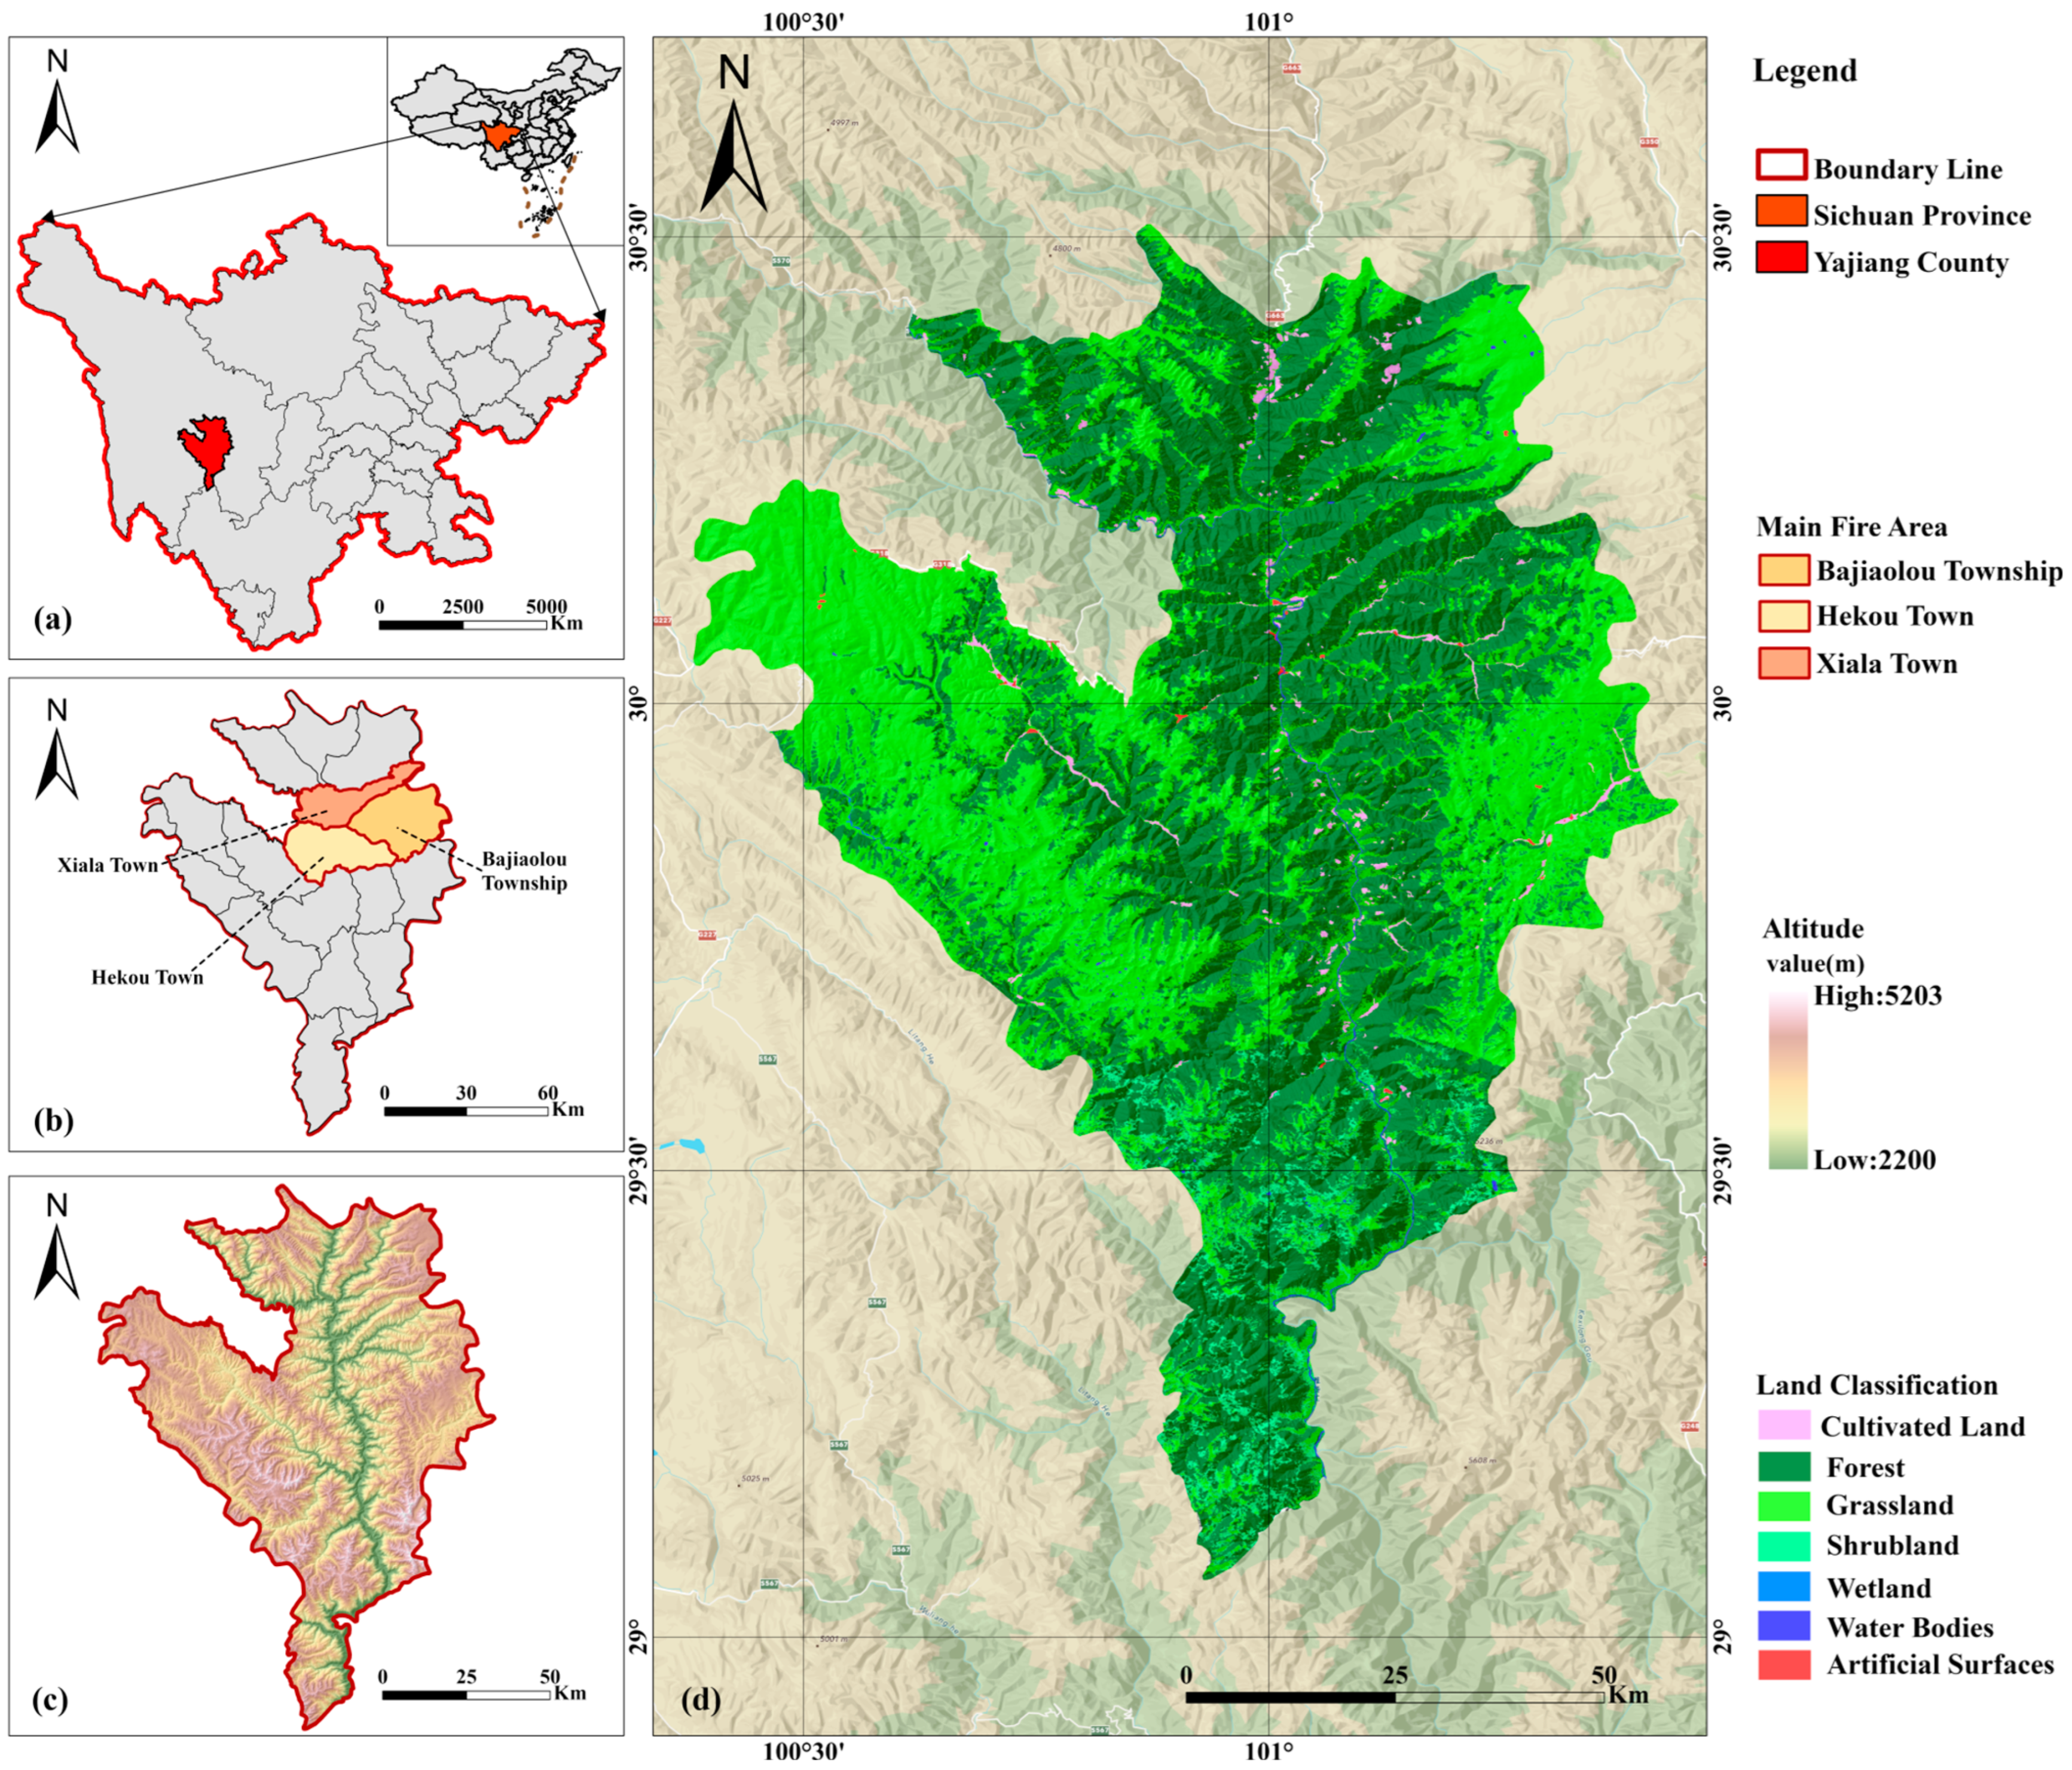
2.1. Research Overview

The Garze Tibetan Autonomous Prefecture, located in southwest China on the southeastern edge of the Qinghai–Tibet Plateau, is characterized by complex topography and a continental monsoon plateau climate (Figure 1a). Yajiang County, situated in the southern part of the prefecture, experiences abundant sunshine, strong radiation, and a dry spring climate. As of 2022, the county’s forest land coverage rate is 57.67%, with a high forest fire risk due to dense vegetation and high surface combustible loads (Figure 1d) [14].
The average altitude of Yajiang County is 3651 m above sea level, contributing to high wind speeds that facilitate rapid fire spread. The topographical and climatic conditions make the area particularly vulnerable to forest fires (Figure 1c) [15]. According to official records, forest fires in Yajiang County have been frequent during the past decade, including 2014, 2015, 2017, 2018, 2021, 2023, and 2024. Forest fires in the region are mainly caused by lightning strikes or spontaneous combustion, and they usually occur in the spring and early summer, when the climate is dry and the wind is strong, favoring the spread of fires. The high frequency of these events highlights the ongoing fire risk in Yajiang County.

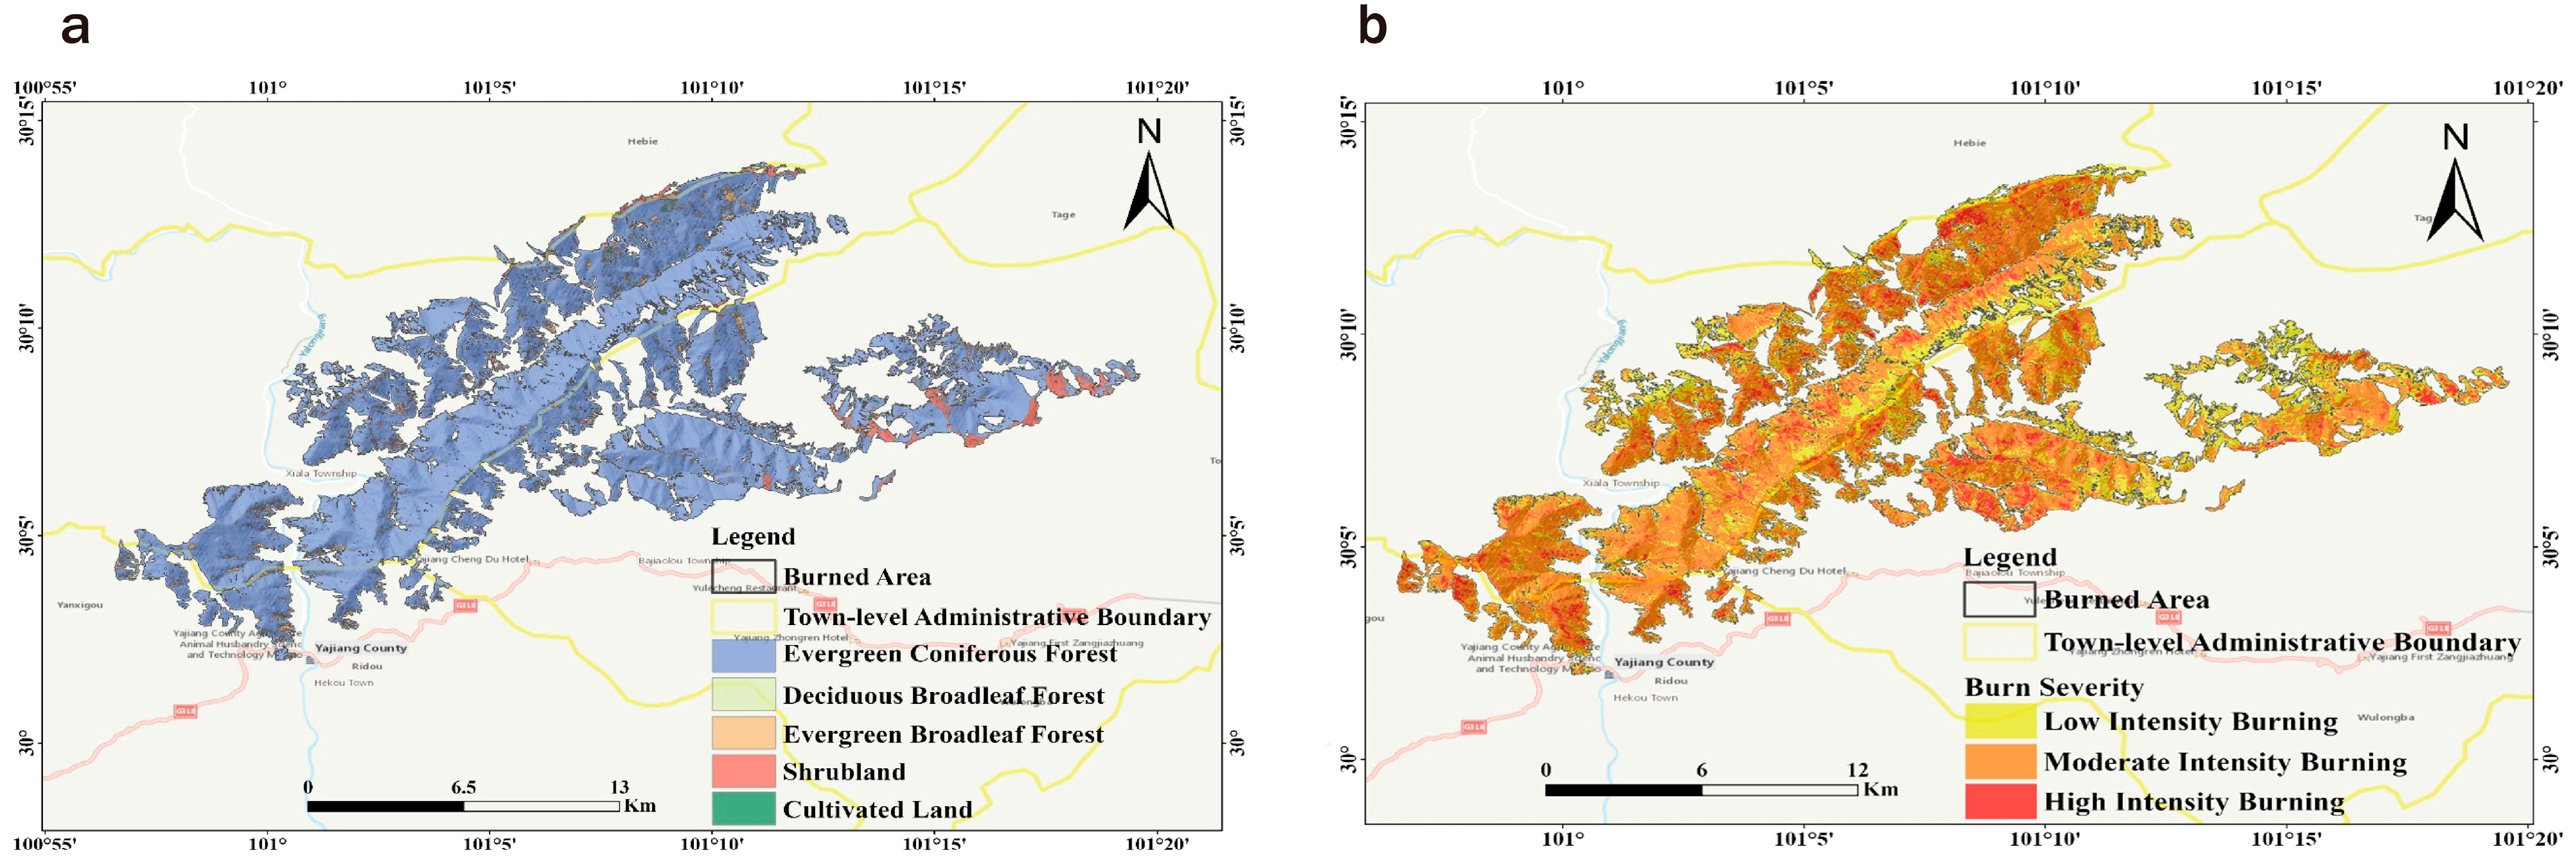
2.1.1. Fire-Burned Area

A forest fire broke out in Yajiang County on 15 March 2024 and spread rapidly due to unpredictable winds. By 17 March, three major fire points had formed, with the fire advancing in multiple directions. The fire was successfully contained by 10:00 p.m. on 28 March 2024, with all fire points extinguished. Remote sensing imagery assessed the burned area at approximately 20,688.67 hectares (Figure S1).
The burned area contained diverse vegetation, including coniferous, broadleaf, and scrub types. Primary trees were Quercus glauca and pine, with rhododendrons and bamboo as main bushes. Quercus glauca trees have weak fire-resistant leaves and bark [16], while pine trees have thin bark and are short and poorly self-pruning [17]. These trees contain flammable resins and oils, contributing to the rapid spread of forest fires and significant vegetation resource loss.

2.1.2. Social Rescue Activities

The forest fire triggered a large-scale rescue operation involving extensive personnel and resources from local and provincial authorities. Data on evacuation and relocation were obtained through official records, field interviews, and media reports.
A total of 5908 individuals from 1360 households were relocated due to the fire. The Yunnan Provincial Forest Fire Department dispatched 750 rescue personnel equipped with wind extinguishers, water pumps, high-pressure water mist systems, and other firefighting equipment, totaling over 26,000 items, as well as 147 transport vehicles. Various detachments of the Sichuan Provincial Forest Fire Department deployed 3187 personnel and 198 vehicles, including 100 sprinkler trucks, 98 fire engines, and 340 water pumps. A total of 133 helicopter flights were deployed for approximately 198 h, consuming 84.81 tons of aviation fuel, covering 28,563 km, and dispersing 1147 t of water. Furthermore, 399 electricity generation personnel, 123 vehicles, and 89 oil generators were dispatched for electricity generation. National and local disaster relief administrations deployed 1500 cotton tents, 6000 folding beds, 6000 quilts, and 6000 mattresses for the relocation of those affected by the disaster.
In addition to the extensive evacuation efforts, fire crews faced significant logistical challenges at the fire extinguishing site. Firefighters employed the Yalong River, located 400 m from the fire, as a water source for firefighting operations. Due to the difficult terrain, traditional excavation equipment could not be used, so fire crews relied on manual tools, such as shovels and fire brooms, to establish isolation zones. Additionally, 78 sprinkler trucks were deployed for humidification to prevent the fire’s spread. Numerous helicopters carried out fire exploration and water-lifting tasks, closely cooperating with ground rescue teams, and they played an irreplaceable and crucial role in extinguishing the Yajiang forest fire.

2.2. Research Methods

2.2.1. GHG Emissions from Vegetation Burning

To estimate the carbon loss and subsequent GHG emissions due to the fire, we used the biomass estimation model developed by Seiler and Crutzen [18]. This model is widely adopted for estimating forest fire biomass consumption.
M = A   ×   B   ×   α   ×   β
where M denotes the biomass consumed by burning, A denotes the area of overfire, B denotes the organic matter per unit area, α denotes the proportion of above-ground biomass to the whole biomass, and β denotes the combustion efficiency.
The carbon loss for specific vegetation types is calculated by considering the biomass consumed during combustion and applying a combustion efficiency factor (β), which accounts for incomplete carbon conversion to gas.
M i = C i ×   M
where Mi denotes the carbon loss of a specific type of vegetation, Ci denotes the carbon content rate of that vegetation type, and M denotes the biomass consumed by burning.
To estimate the emissions of specific greenhouse gases (GHGs), the emission factor method is applied.
E ij = E F i j ×   M i
where Eij denotes the emission of a specific GHG, EFij denotes the emission factor of that GHG, and Mi denotes the carbon loss of that vegetation.
This study integrated satellite imagery with GEE for burned area detection, burn severity classification, and the assessment of above-ground biomass (AGB) and net primary productivity (NPP).
(1)
Acquisition and Processing of Remote Sensing Images
We used satellite remote sensing data to detect burned areas and assess vegetation cover. Sentinel-2A imagery, sourced from the COPERNICUS/S2_SR_HARMONIZED dataset, was processed using the GEE platform. To ensure data availability, three scene images with less than 10% cloud cover from 25 February to 15 March 2024 were selected for pre-disaster analysis, and two scene images with less than 10% cloud cover from 29 March to 21 April 2024 were selected for post-disaster analysis. To improve the spatial resolution and consistency of the data, the 60 m and 20 m resolution bands in the imagery were resampled to a uniform 10 m resolution. Additionally, the 3-band and 10-band scene classification (SCL) data from Sentinel-2A were utilized to mitigate the potential impact of shadows and cirrus clouds on the analysis of the remote sensing images. Finally, remote sensing images from different phases in the same region were processed using the average pixel value method.
(2)
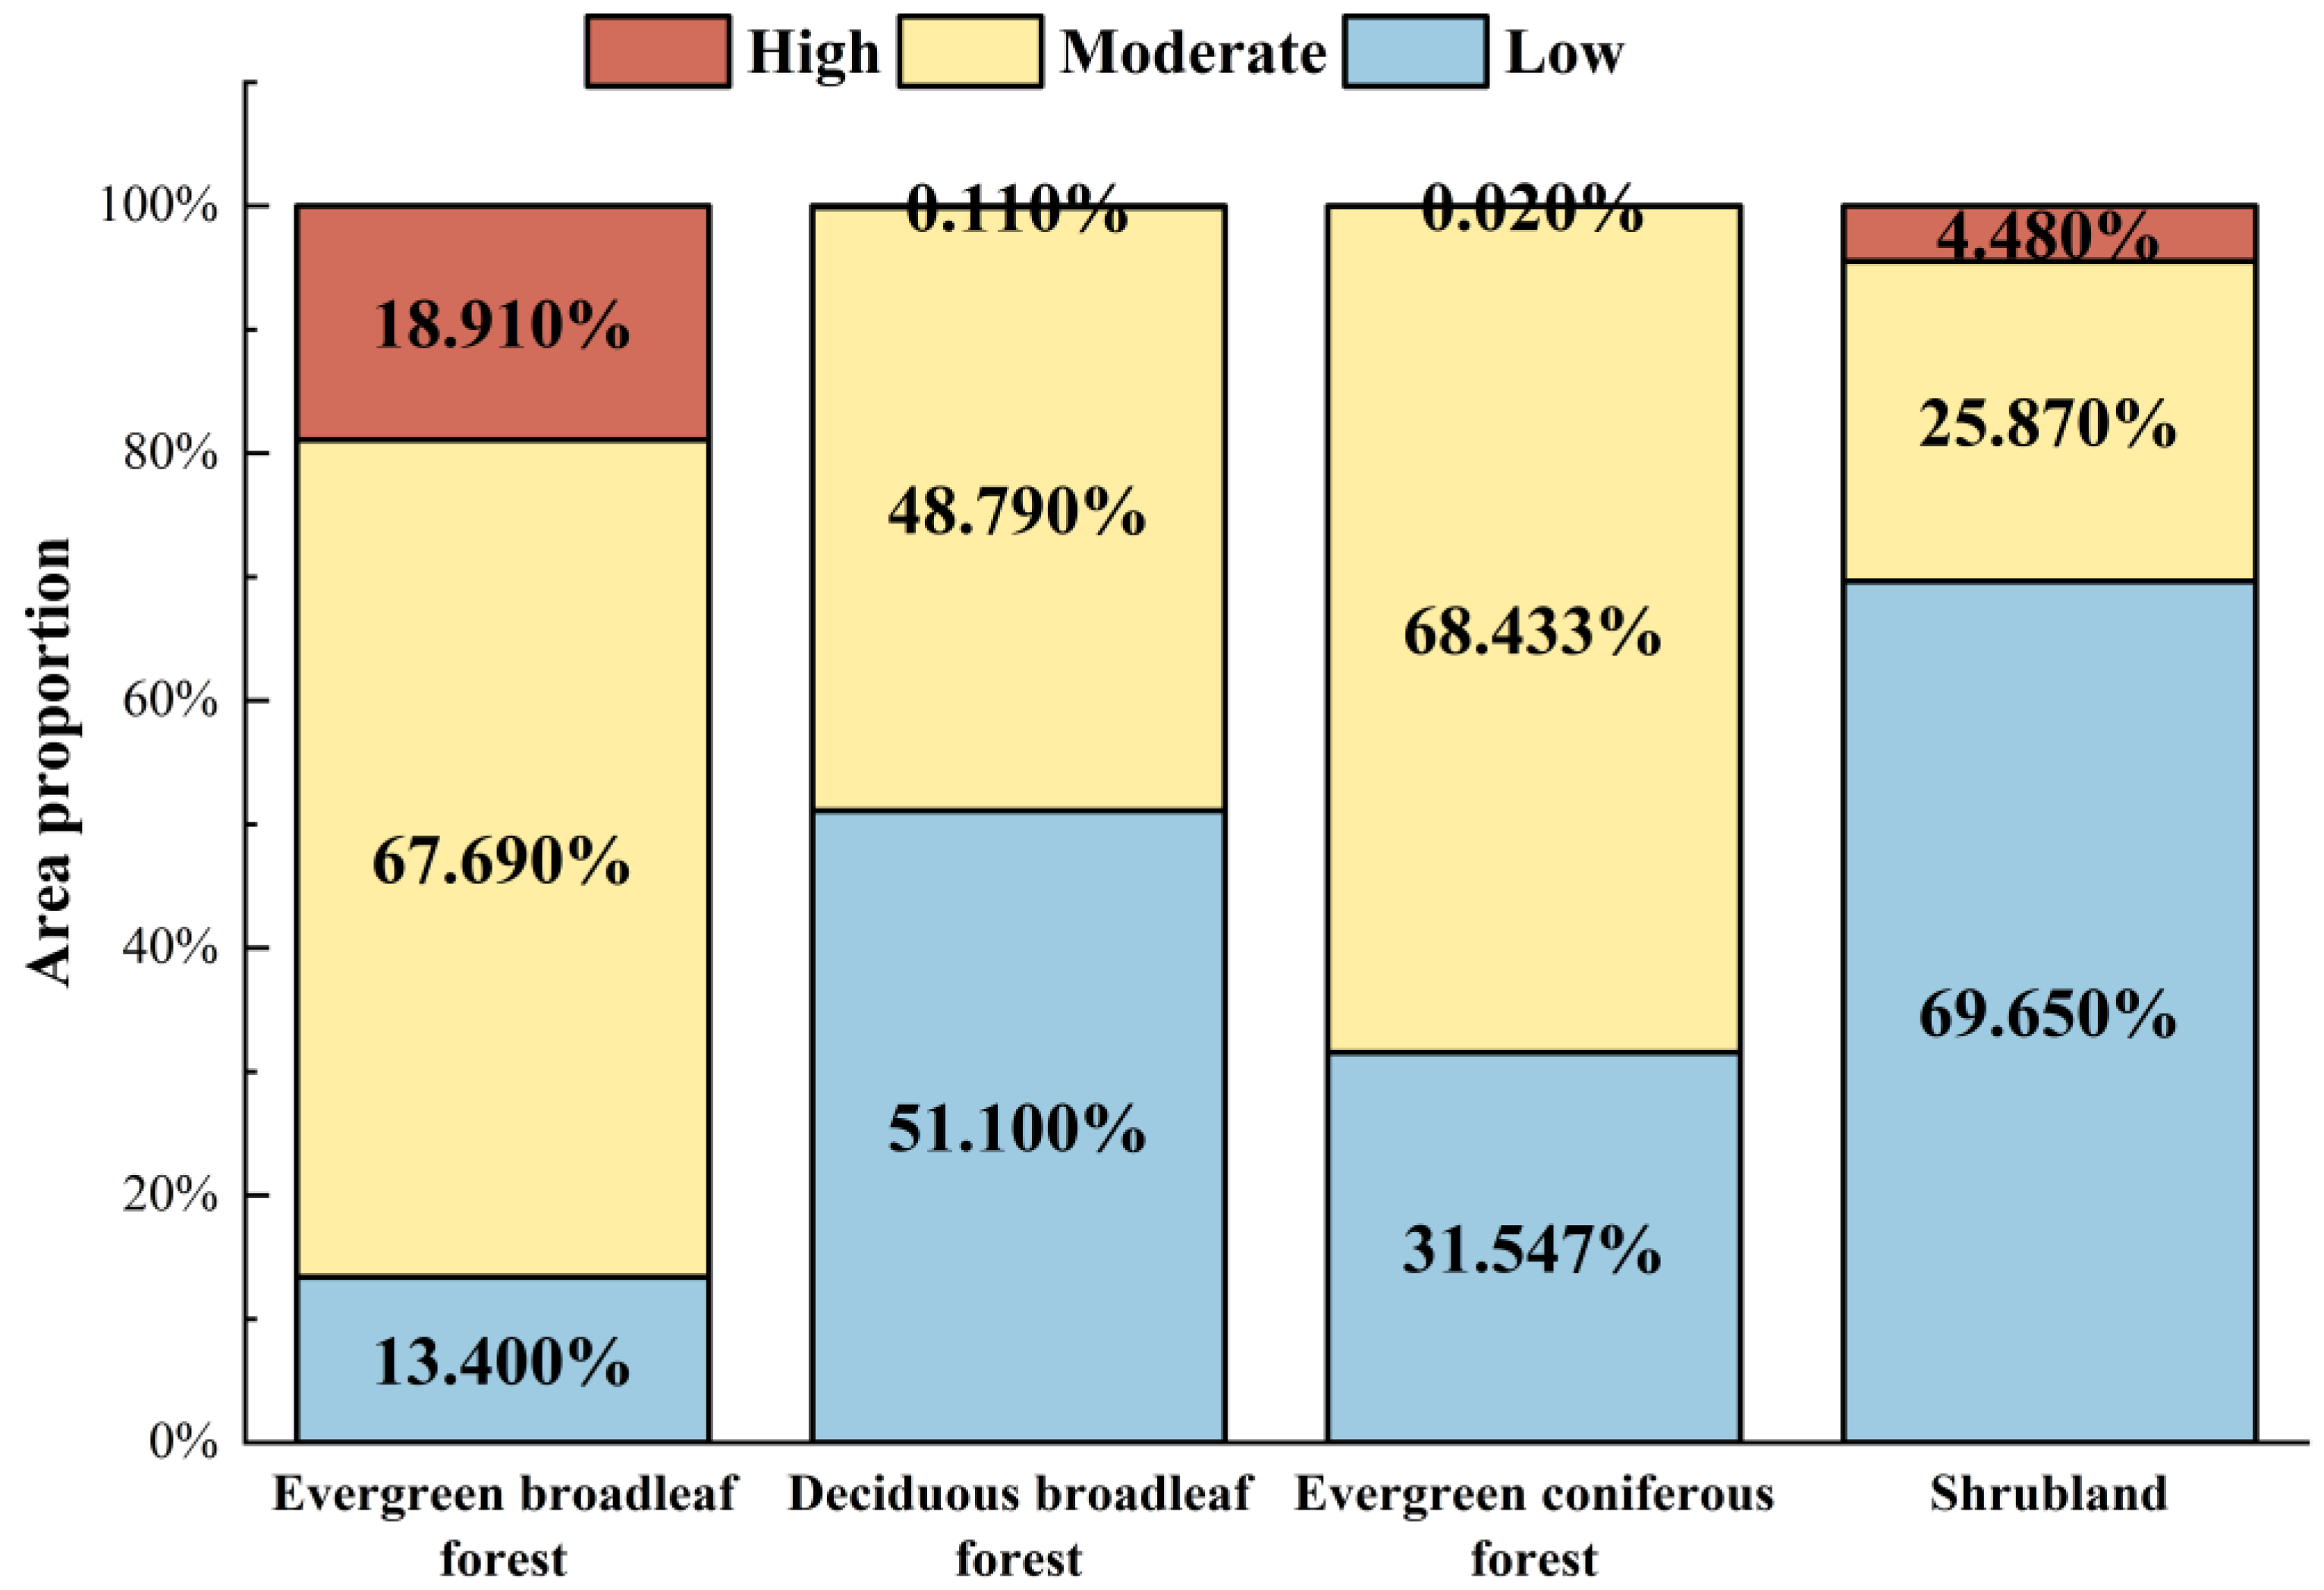
Classification of the Burn Severity and the Land Cover in the Overfire Area
Burn severity classification is a crucial step in quantifying the impact of the forest fire on vegetation. A feature extraction process was conducted on the preprocessed remote sensing images to extract features related to the overfire zone index. The normalized burn ratio (NBR) is a vegetation index constructed using the near-infrared Band-8 (NIR) and the shortwave infrared Band-12 (SWIR). It effectively distinguishes burned areas from other features by analyzing spectral reflectance, which increases in the shortwave infrared bands and decreases in the near-infrared bands [19].
NBR = R 8 R 12 R 8 + R 12
where R8 and R12 are the reflectance of band 8 and band 12, respectively.
The dNBR, which is the difference between pre- and post-fire NBR values, allows us to categorize burn severity and, in turn, estimate the impact on biomass and carbon emissions [20].
dNBR = NBR prefire NBR postfire
Statistically analyzing the gray value of the dNBR difference image indicates a range of values of [−1.36, 1.27] (Figure S2). Burn severity is categorized based on this range, where dNBR values between 0.4 and 0.7 indicate low severity, values between 0.7 and 0.8 indicate moderate severity, and values greater than 0.8 indicate high severity (Figure 2b). The GEE platform was used to access the GLC_FCS30 land cover dataset, which has a resolution of 30 m and includes a detailed classification system comprising 35 land cover types. Our analysis focuses on delineating four primary vegetation types (evergreen broadleaf forest, evergreen coniferous forest, deciduous broadleaf forest, and shrubland), in addition to one land use type (cultivated land) (Figure 2a). Furthermore, we quantified the vegetation areas under different burn severities (Table S1).
(3)
AGB of Different Vegetation Types
To estimate the biomass consumed by the fire, we used data from the 500 m resolution Chinese Vegetation AGB Distribution Atlas provided by Aerospace Hongtu Information Technology Co., Ltd. (Beijing, China). These data, combined with the burn severity classifications, allow us to estimate the amount of above-ground biomass (AGB) affected by the fire and calculate its corresponding carbon emissions. We incorporated these data into the GEE platform to calculate the AGB of the overfired areas based on different vegetation types. Given that biomass consumption varies by vegetation type and burn severity, we categorized AGB values according to these parameters. For example, shrublands in Sichuan exhibit similar AGB patterns to broadleaf forests, and we adjusted the AGB of shrublands accordingly [21]. The AGB results were subsequently categorized based on burn severity (Table S2).
(4)
Calculation of Combustible Load and Carbon Emission
Finally, we calculated the total combustible load in the burned area using data on net primary productivity (NPP) and biomass estimates for different vegetation types. The combustion efficiency of the fire was determined based on burn severity, as outlined in previous studies [22,23] (Table S2). The set values of total biomass and carbon content in this study were summarized based on existing studies (Table 1). The total biomass (TB) is composed of above-ground biomass (AGB) and below-ground biomass (BGB). The model developed by Seiler and Crutzen focuses on the combustion of AGB, as it is the main source of GHG emissions in forest fires. BGB is a smaller proportion of the total biomass compared to AGB, and although it was included in the biomass estimation model for completeness, GHG emissions from BGB were not calculated in this study. The main reason for including BGB in the biomass estimation model was to consider the ratio of AGB to TB consumed by fire, but only AGB emissions were considered in the GHG emission calculation. Because accurately estimating BGB using remote sensing methods is challenging, we used values from Zhang et al. [24] and Liu et al. [25] to estimate BGB. For this study, the TB values for different forest vegetation types and shrublands were referenced from Liu et al. [26]. Additionally, based on the findings of Zhou et al. [27], carbon content was determined for vegetation types.
Using the above parameters, we calculated the surface combustible load for vegetation in the burned area, which serves as a basis for subsequent GHG emission estimates. Five gases—CO2, CO, N2O, NOx, and CH4—were selected for this study, with their respective emission factors sourced from Sun et al. [28] (Table 2).

2.2.2. GHG Emissions from Social Rescue Activities

This study comprehensively analyzes multiple transportation processes, including resident relocation, firefighting force support from Yunnan Province, firefighting water transportation, and the transportation of social rescue materials, to estimate their contributions to transportation-related GHG emissions. These transportation activities are integral to disaster response operations, requiring precise emission estimates for effective environmental impact assessments. To accurately estimate the GHG emissions associated with these diverse transportation activities, this study employs established methods, such as the turnover method and the 100 km energy consumption method, depending on the context of the transportation process [29].
The turnaround method is a method for estimating GHG emissions based on loads and fuel consumption over a specified transportation distance. This method requires knowledge of the transportation distances, fuel types, loads, and emission factors for a given mode of transportation. The turnaround method is applicable where fuel use is directly related to load and transportation distance, such as in the case of vehicles transporting goods or people. The method allows for a refined estimation of emissions based on the specific mode of transportation and its energy consumption.
The 100 km energy consumption method estimates GHG emissions by calculating the fuel consumed per 100 km traveled by transportation. This method involves multiplying the distance traveled by the fuel consumption rate per 100 km and the emission factor for the corresponding fuel type. The method is particularly useful when emissions are associated with vehicles that cover significant distances and have known fuel usage rates, making it ideal for aerial fire social rescue activities and long-distance transportation in disaster response efforts. This approach simplifies emission estimation for transportation where fuel consumption data are available or standardized.
Carbon emission measurement methods from mobile sources can be categorized into two models: “top-down” and “bottom-up” approaches [30]. The “bottom-up” model, which is applied in this study, estimates GHG emissions by multiplying the activity level (e.g., mileage) by the corresponding emission factor for each unit of activity. This model allows for a more granular estimation of emissions based on specific transportation modes and processes. The boundaries of the calculations, including detailed formulas, are outlined below in Table 3.
In this context, S represents the transportation distance for various calculation contents, while P signifies the number of personnel or the weight of goods in different calculations. Mi denotes the proportion of the fuel type, and E signifies the energy consumption per unit passenger (freight) turnover of different transport modes. Additionally, F represents the fuel consumption per hundred kilometers of transport vehicles, and I represents the gas emission factor for different energies, encompassing CO2, CO, CH4, N2O, and NOx.
(1)
Disaster Response Logistics and Method Application
During the disaster response, a comprehensive approach was utilized to calculate the logistics of personnel transfers, the transportation of firefighting forces, and the distribution of social rescue materials. For personnel relocation, we used the turnover method, considering 1360 households comprising 5908 residents, 3187 firefighters, and 399 electricity generation personnel. The transportation of these groups involved support vehicles from the Yunnan Provincial Forest Fire Brigade (147 transport vehicles) and the Sichuan Provincial Electric Power Supply Department (123 transport vehicles). While the specific models and weights of these vehicles are unknown, emissions were estimated using available data, including mileage and fuel consumption over 100 km. The social rescue materials were predominantly transported by trucks, with emissions estimated using the freight turnover method. Based on the People’s Republic of China Civil Affairs Industry Standards and related technical standards, the average weight of each relief tent and each relief folding bed is about 10 kg, the average weight of each relief quilt is 3 kg, and the average weight of each relief mattress is 2 kg.
In a typical large-scale fire rescue, water is typically loaded into firefighting vehicles at the base before deployment. However, subsequent firefighting efforts often require sourcing water from nearby hydrants or natural water bodies. Therefore, only the one-way transportation of firefighting water from the base to the fire site is considered in this phase. The road capacity for water transportation was calculated based on a full load of 100 sprinkler trucks and fire trucks (with an average weight of 12 tons per vehicle). The freight turnover method was used to estimate the GHG emissions for this phase of transportation.
(2)
Estimation of Transportation Distance (Mileage)
The transportation distances for various vehicles and processes were based on statistical data and estimations from different sources. According to the Southern Aviation Ranger General Station of the Ministry of Emergency Management of the People’s Republic of China, the total distance flown by the helicopter fleet was recorded as 28,563 km. However, due to the sudden nature of fire incidents and data limitations, the transportation distance for resident relocation was based on the actual travel distance from Baizi Village to the resettlement site at the Yajiang County Chengguan Primary School. For firefighting personnel, the transportation distance was estimated using the average driving distance from each assistance detachment of the Sichuan Provincial Forest Fire Department to Baizi Village, Yajiang County. The transportation distance for firefighters coming from Yunnan Province was taken as the distance from Kunming City to Baizi Village. In addition, the travel distance for the Sichuan Provincial Electric Power Supply Department and the food and material reserve departments was estimated as the distance from Chengdu City to Baizi Village.
(3)
Fuel Ratio and Energy Consumption Estimation for Transportation Vehicles
In this study, the carbon emissions associated with vehicles used during the forest fire rescue operation were estimated based on two primary fuel types: gasoline and diesel. This consideration is based on statistical data regarding the ratio of motor vehicle fuel types across several cities in the country [31]. According to these data, the fuel distribution for freight vehicles is approximately 20% gasoline and 80% diesel, while the ratio for passenger vehicles is about 30% gasoline and 70% diesel. For the purpose of calculating GHG emissions, we utilized the China Transportation Medium- and Long-Term Energy Conservation Study and referenced the standard coal conversion coefficients [32] to derive the unit energy consumption values for transportation vehicles. These values were used to estimate the energy consumption for each type of transportation mode, as outlined in Tables S4 and S5.
(4)
Determination of Fuel Emission Factors
The environmental emission coefficients (kg/GJ) of the five gases selected in this paper, derived from the 2016 IPCC EFDB database, were used as the reference standard for emission intensity based on comprehensive considerations of the availability and accuracy of the data and the uniformity of the channels for obtaining the parameters (Table 4). The emission factors selected for this study can be converted to fuel consumption (kg), which is then substituted into the previous GHG emission estimation formula to obtain the final total GHG emissions. Additionally, GHG emissions from the fire extinguishing process and the electricity generation process were also calculated using the “bottom-up” model.
(5)
GHG Emissions from the Fire Extinguishing Process and the Electricity Generation Process
This fire is located in a high-altitude mountainous region, with steep slopes ranging from 70° to 80°. These challenging geographical conditions significantly hinder the mobility of firefighting vehicles, confining them to the perimeter. Additionally, quantifying the energy consumption of firefighters and their operations presents considerable difficulties due to the large-scale and rapid movement of the firefighting teams. Given these constraints, the focus of this study shifts away from the on-site transportation of fire trucks and instead emphasizes the primary energy-consuming activities: the operation of sprinkler trucks at the fire’s perimeter and the use of water pumps to extinguish the blaze.
This study assumes that the sprinkler trucks, water pumps, and other necessary firefighting equipment operate continuously from the onset to the conclusion of the fire social rescue activities. Sprinkler trucks predominantly run on diesel fuel, with a fuel consumption rate of 26.5 L per 100 km. This study assumed that these vehicles travel at an average speed of 10 km/h. Regarding the water pumps, it is noted that the commonly used backpack-style forest fire pumps rely on hydraulic firefighting methods. As a result, energy consumption is primarily attributed to the pumps themselves, with a unit fuel consumption rate of 3.8 L per hour, using gasoline as the fuel type. To support the operation of firefighting equipment, the Sichuan Provincial Electric Power Supply Department deployed 89 diesel-powered generators at the site; each of these generators has a power output of 1000 kW and a fuel consumption rate of 32 L per hour.

2.2.3. Data Limitations and Assumptions

In this study, hypothesized values (such as combustion efficiency, water delivery distance, and equipment usage duration) were inferred from the existing literature or estimated based on typical fire social rescue activities due to the lack of direct data. These assumed values were then applied in the emission calculations, while observed values, such as fuel consumption and mileage from firefighting vehicles, were directly measured or derived from available reports, ensuring that the analysis was grounded in both assumed and real-world data where possible.
The functional boundary of the study was defined as tracking emissions associated with direct burning of vegetation as well as direct fire social rescue activities. Due to limited data and the focus of the study on direct fire social rescue activities, indirect emissions from social rescue activities, such as those associated with fuel transportation to helicopters and other logistical operations, are not included in this study. Emissions from the early stages of the supply chain, such as fuel production and refueling stations, are not tracked in this study.
While this study provides a comprehensive assessment of direct emissions from forest fire social rescue activities, it also recognizes the exclusion of indirect emissions, such as fuel transportation and equipment logistics. These indirect emissions, particularly those associated with the transportation of fuel to firefighting vehicles and helicopters, can add significantly to the overall emissions from firefighting operations. Future studies should consider including these upstream emissions in order to conduct more comprehensive environmental impact assessments of fire social rescue activity systems and social rescue activities.

3. Results and Suggestions

3.1. Results

This section presents the results of the GHG emission estimation for the Yajiang County forest fire. The total GHG emissions from the fire event were estimated at 63,764.59 tons, with the majority of emissions resulting from vegetation burning (53,266.29 tons). Emissions from fire social rescue activities, including transportation and firefighting operations, amounted to 10,498.30 tons (Table 5). When emissions are assessed on a per-unit-area basis, Yajiang County’s emissions (about 0.308 kg m−2) are lower than those of the 2003 Southern California fires (about 2.8 kg m−2) and the 2004 Alaskan fires (about 1.5 to 4.6 kg m−2) [33]. Average emissions from fires in northern Canada from 1959 to 1999 were relatively close to those in Yajiang County, which ranged from 0.9 to 2.0 kg m−2 [34].
The lower emissions per unit area in Yajiang County can be attributed to several factors. The area typically burns less efficiently than vegetation dominated by shrubs and dead leaves in Southern California or organic soils in Alaska. At the same time, forest fires in Yajiang County burn a relatively small area compared to other fires, thus limiting emissions per unit area. In addition, fire social rescue activities in the area may have reduced the overall area and intensity of the fires, further limiting total emissions.

3.1.1. Emissions from Vegetation Burning

The GHG emissions from vegetation burning were primarily driven by the combustion of forest biomass, which included evergreen broadleaf forests, evergreen coniferous forests, deciduous broadleaf forests, and shrublands. The breakdown of emissions by vegetation type and fire severity is shown in Figure 3 and Figure 4.
Figure 3 illustrates the proportion of burned area across different fire severities for various vegetation types. In both evergreen broadleaf and evergreen coniferous forests, moderate fire severity led to the largest proportion of burned area, accounting for 67.69% and 68.43%, respectively. In contrast, the proportion of high-severity burning was minimal in both deciduous broadleaf and evergreen coniferous forests, each comprising less than 1%. This may be attributed to the lower NPP of these vegetation types under higher fire severities. Shrublands, on the other hand, predominantly experienced low fire severity, which may be associated with the altitudinal distribution of shrubs and their relatively lower AGB. This variation in fire severity is crucial, as it directly influences the scale of GHG emissions, as illustrated by the specific emissions observed in different vegetation types. Figure 4 shows the GHG emissions for different vegetation types under varying fire severities. For evergreen broadleaf and evergreen coniferous forests, the emissions were significantly higher under moderate fire severity, while shrublands, despite having lower total emissions, exhibited the highest emissions per unit of burned area under low fire severity. This pattern can be attributed to the differing combustion characteristics of these vegetation types, with shrublands exhibiting higher carbon content relative to their lower biomass.

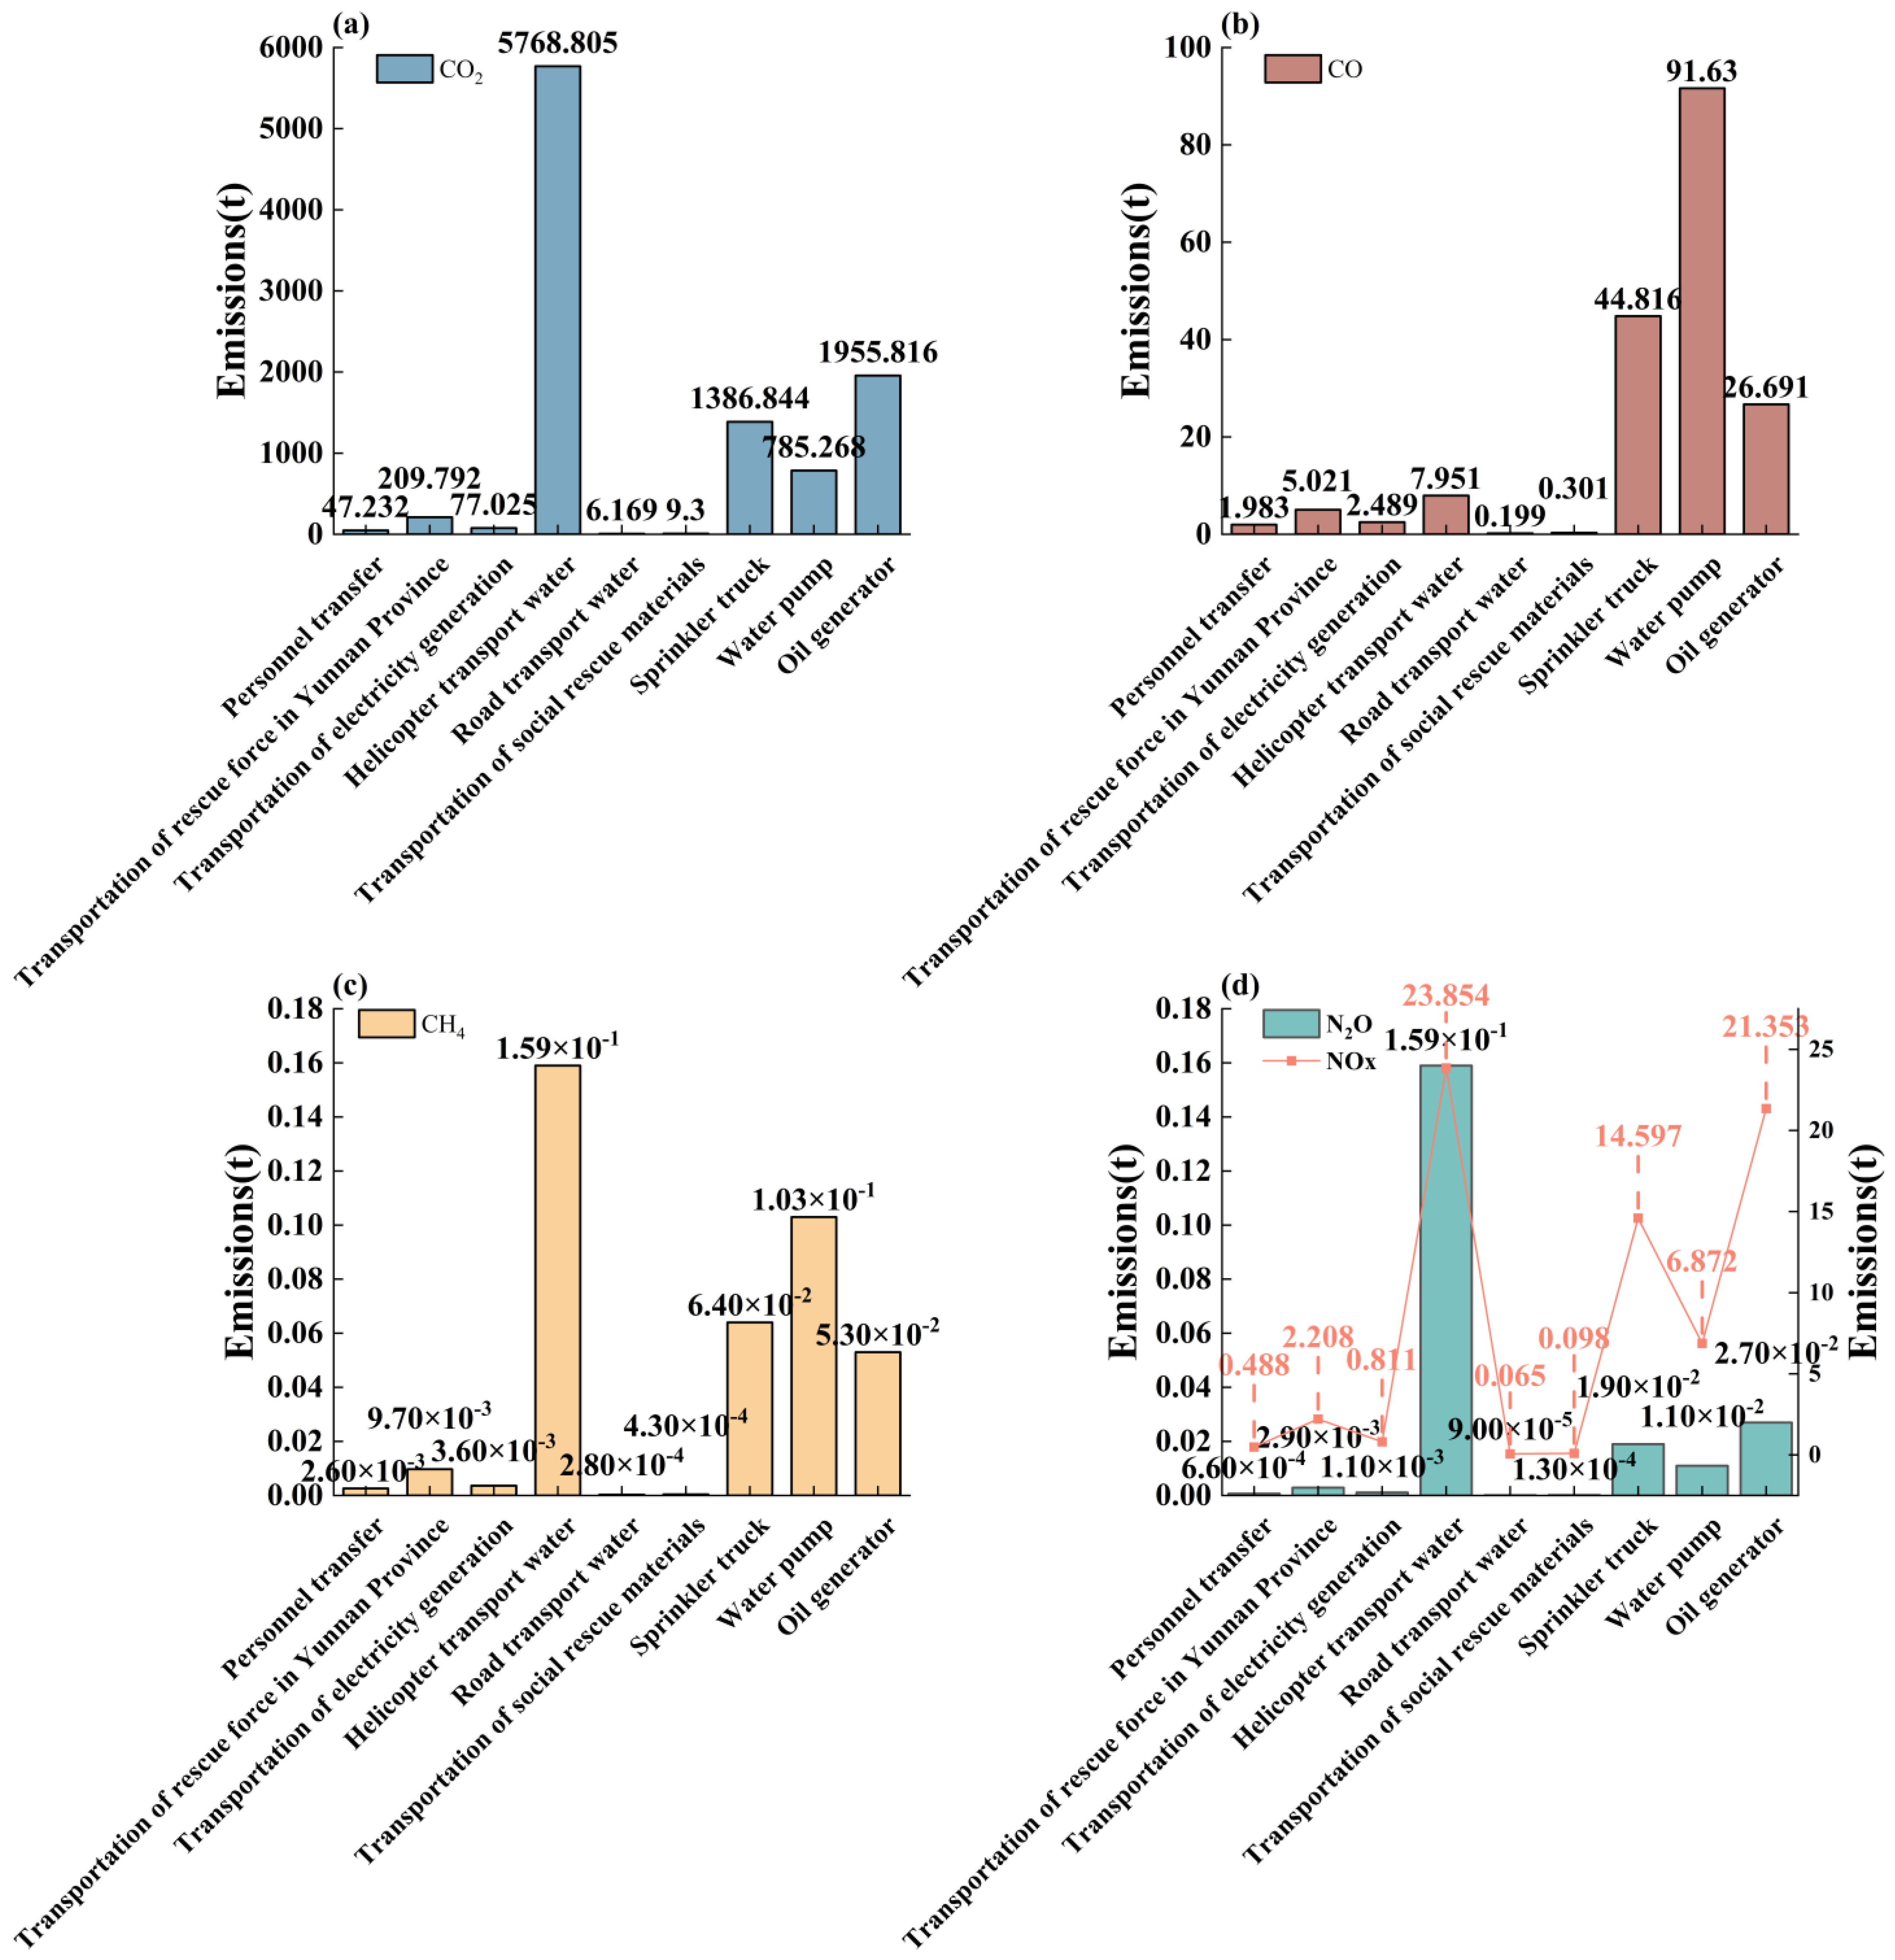
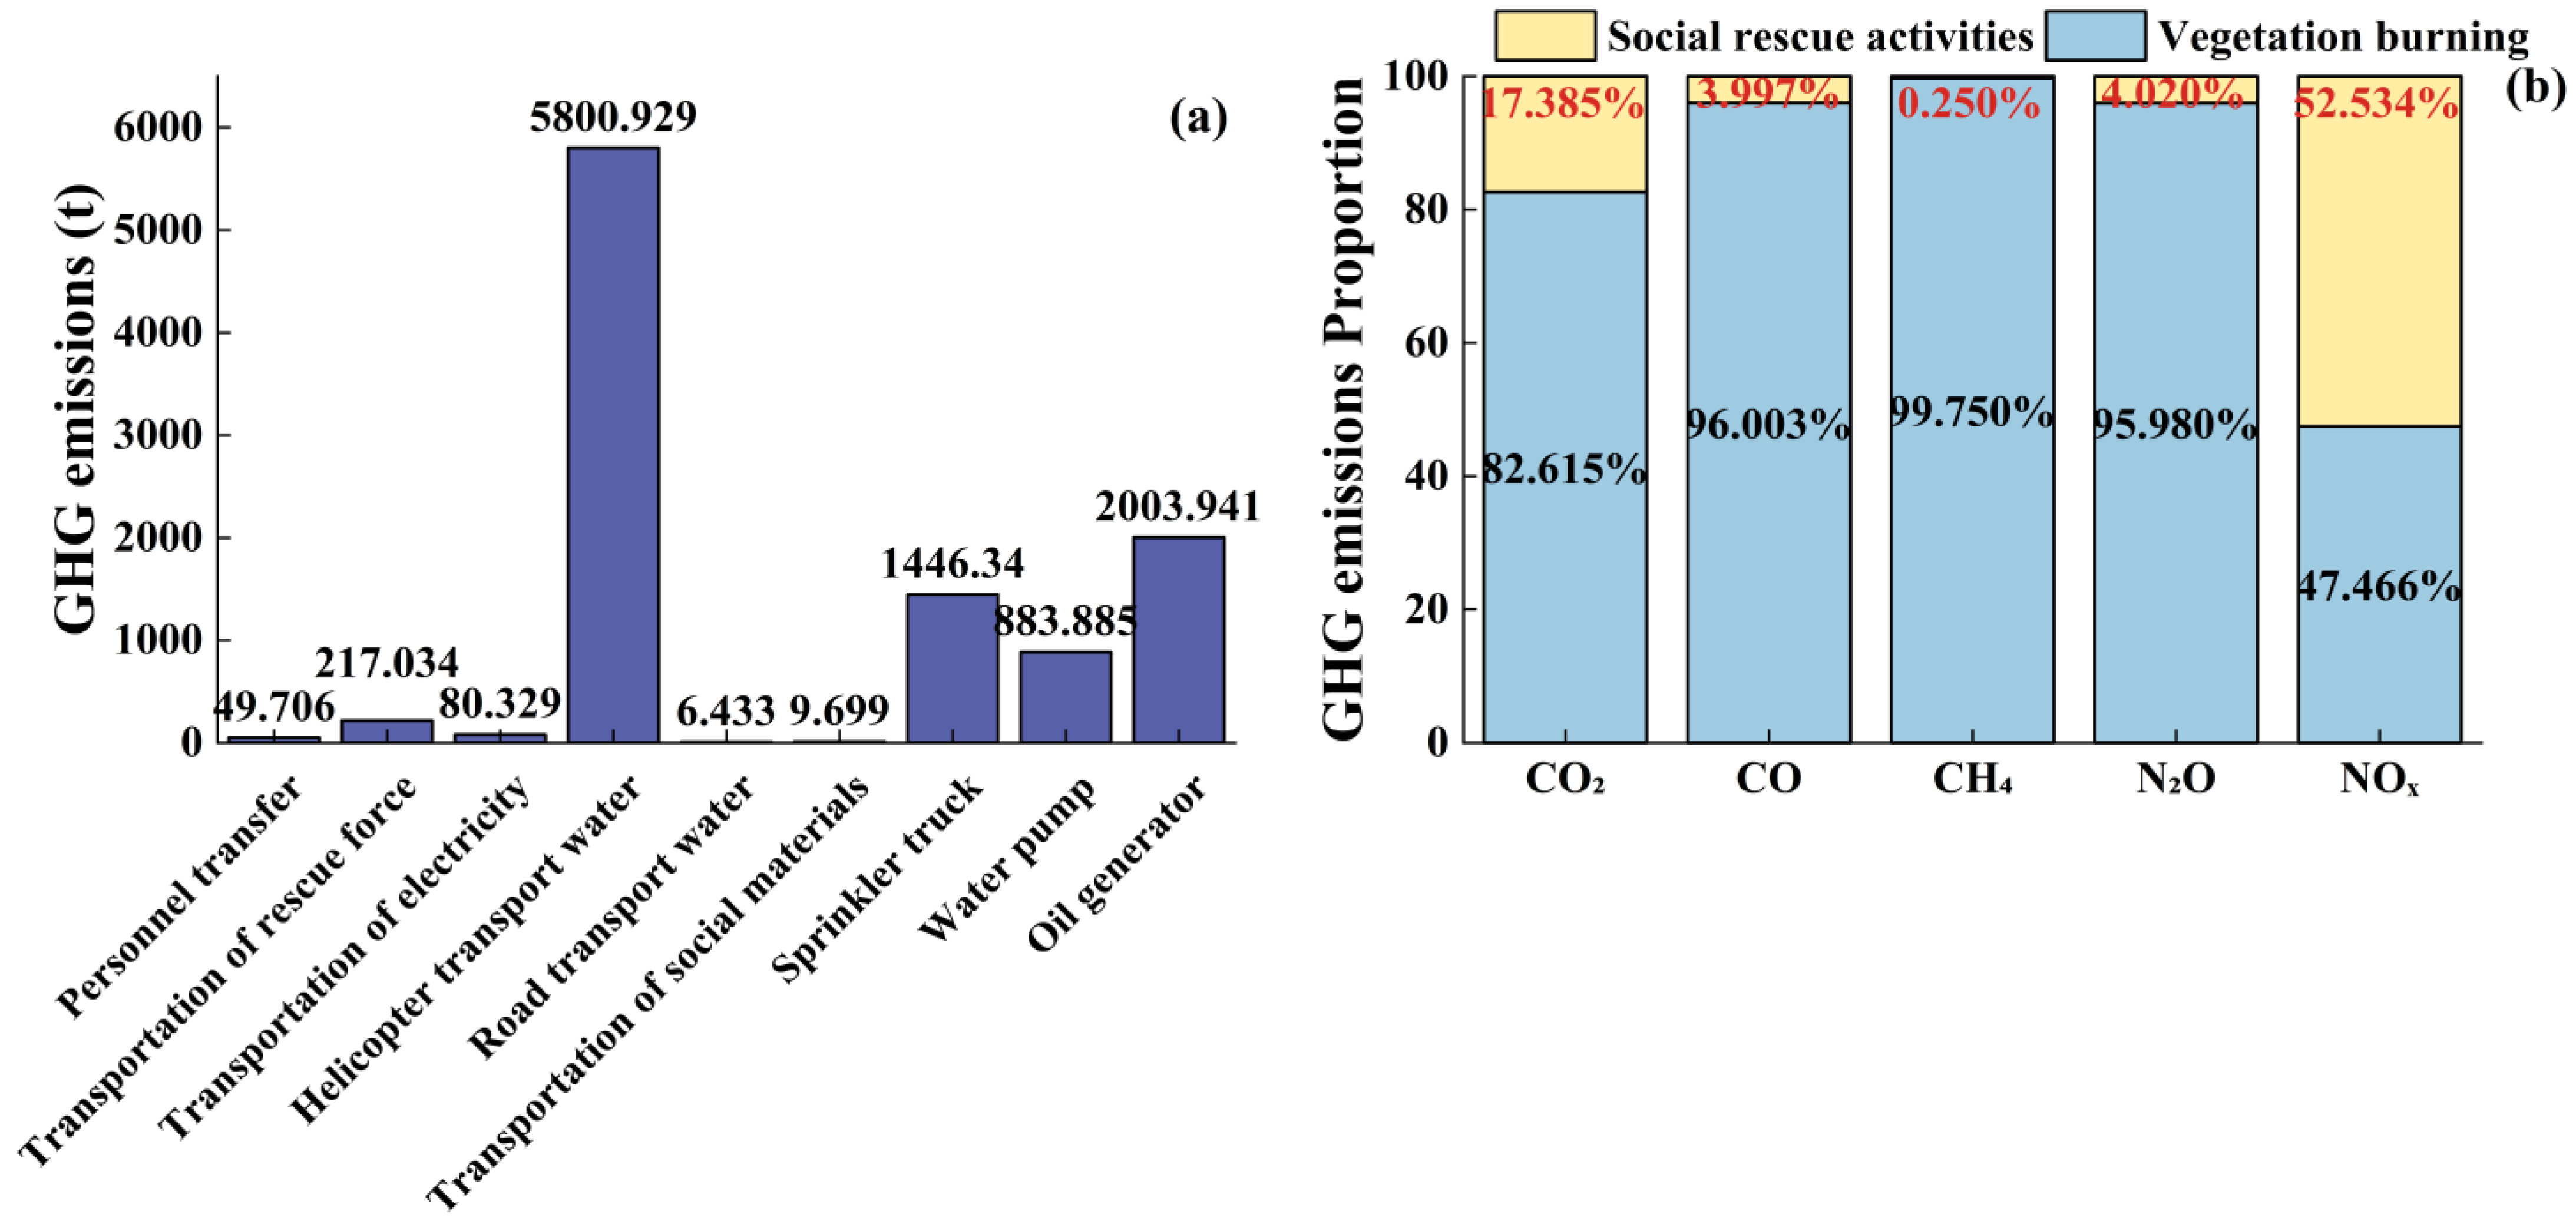
3.1.2. Emissions from Social Rescue Activities

The social rescue activities contributed 10,498.30 tons of GHG emissions. The majority of these emissions were associated with transportation processes, particularly the use of helicopters and vehicles for personnel relocation and firefighting operations. Figure 5 presents the breakdown of GHG emissions by different social rescue processes, showing that helicopter transport alone accounted for 5800.93 tons of CO2 emissions. This underscores the substantial carbon footprint of air-based fire social rescue activity methods, highlighting the need for improved logistical efficiency in future fire management efforts. The predominant GHG emissions were CO2, followed by CO and NOx, while the emissions of CH4 and N2O were comparatively low.
Figure 6a further illustrates the GHG emissions from specific firefighting equipment, including sprinkler trucks, water pumps, and generators. The total emissions from firefighting and power generation activities amounted to 4334.63 tons, with the highest contributions coming from sprinkler trucks (1446.34 tons) and fuel-powered generators (2003.941 tons). These results indicate the importance of evaluating and optimizing the carbon efficiency of firefighting equipment, especially for high-impact fire events in remote areas.
During this fire event, 82.615%, 96.003%, 99.750%, and 95.980% of the emissions of CO2, CO, CH4, and N2O, respectively, originated from vegetation combustion, indicating the predominant role of vegetation burning in the release of GHGs. Notably, the contribution of NOx emissions from social rescue activities marginally exceeded that from vegetation burning, accounting for 52.534% of the total NOx emissions (Figure 6b). The types of GHGs emitted during the fire and fire social rescue activities vary significantly, with CO2 and CO being the most predominant. Understanding this distribution is key to developing targeted strategies for emission reduction. The total CO2 emissions from the fire were 58,936.53 tons, and CO emissions totaled 4530.61 tons. Furthermore, emissions of N2O, NOx, and CH4 were 158.05 tons, 5.50 tons, and 133.91 tons, respectively (Table 5).
The result that NOx emissions from fire social rescue activities exceeded NOx emissions from the fire is surprising but not impossible. It has been shown that while biomass burning is a significant source of NOx emissions during forest fires, anthropogenic NOx emissions are likely underestimated. Hodnebrog et al. [35] showed that NOx emissions from forest fires in Albania in 2007 were likely overestimated and that the large number of NOx values over Ukraine was primarily from anthropogenic sources, with only a slight impact of forest fire emissions during this period. In addition, it has also been shown that NOx emissions from forest fires are subject to large uncertainties and are significantly influenced by the type of fire, vegetation composition, and season [36]. For example, compared to the Eurasian region, evergreen (conifer) species that dominate the boreal region in North America have lower nitrogen content, and fire types are usually canopy fires, resulting in lower NOx emissions [37]. Thus, while emphasizing that emissions from fire social rescue activities are worthy of attention, the results are subject to some uncertainty and bias.

3.1.3. Sources of Error and Uncertainty in GHG Emission Estimates

There are several errors and uncertainties in the GHG emission estimates in this study. The main uncertainties arise from variations in emission factors for biomass burning and fire social rescue activities, which depend on regional conditions, fire intensity, and vegetation type. In addition, data gaps, such as assumptions about equipment use times and fuel consumption rates, introduce further uncertainty. While remotely sensed data are used to estimate the burned area and fire severity, differences between observed and inferred conditions can affect the accuracy of biomass consumption and emission estimates.
Additional uncertainty arises from aerial firefighting operations, where aviation fuel consumption and its NOx emissions are calculated based on standard emission factors for which real-time data are not available. Assumed operating times for firefighting equipment (e.g., sprinklers and pumps) may also vary, leading to potential errors in the final GHG emission estimates. Although a formal sensitivity analysis was not performed in this study, such an analysis would help to quantify the impact of these uncertainties and refine the framework and methodology for GHG emission estimation in future studies.

3.2. Suggestions

While the results highlight the significant contribution of both vegetation burning and fire social rescue activities to overall GHG emissions, there are several opportunities for mitigation. Based on the findings, the following strategies are recommended to reduce emissions in future forest fire management operations.

3.2.1. Optimization of Forest Management

This study found that GHG emissions from burning coniferous and broadleaf forests significantly exceeded those from shrublands, underscoring the need for targeted forest management strategies. In response, several measures can be implemented to reduce fire intensity and GHG emissions.
(1)
Mechanical Thinning
Thinning dense forest areas can reduce fuel loads and lower the overall intensity of fires. By removing excess vegetation, mechanical thinning reduces the likelihood of large, uncontrollable fires and can help decrease emissions by reducing the amount of biomass available for combustion [38].
(2)
Constructing Access Roads
Building access roads in high-altitude, mountainous forests can serve a dual purpose—limiting fire spread and enabling faster access for firefighting teams. This improves the effectiveness of firefighting efforts and reduces the logistical challenges of fire management [39].
(3)
Green Fire Barriers
Green fire barriers, constructed from low-flammability species, are a widely used strategy to limit the spread and reduce the intensity of forest fires. In China, the widespread use of green fire barriers has proven to be an important tool for forest fire risk management, significantly reducing fire-related losses and promoting long-term ecological stability.
A central feature of green fire barriers is the use of fire-resistant tree species, which are specifically selected for their ability to withstand fire and contribute to the structure of the barrier. China’s green fire barrier technology involves the dense planting of broadleaf evergreen species in areas of flammable coniferous forests. This method has proved to be very effective, especially in southern China, and it has been incorporated into national forest management plans. Since its implementation, green fire barriers have played a key role in reducing fire incidents in these areas. The fire situation in China has remained highly stable over the past decade, with the number of fire incidents kept at around 3000 per year. In contrast, some 30 years ago, tens of thousands of fires occurred in China each year. This transformation highlights the success of green fire barriers in preventing the spread of fire and minimizing fire incidents [40].
The fire resistance of trees used for green fire barriers is closely related to canopy structure, leaf density, and the condition of leaves and branches. As noted in the literature, factors like leaf water content, thermophysical properties, and chemical composition play an important role in determining the fire resistance of trees [41]. Leaves of broadleaf evergreen species have been shown to have a high water-holding capacity, with a water content of up to 50% on a fresh weight basis [42]. This moisture-holding capacity, combined with canopy density, helps to maintain a cooler, more humid microclimate within the barrier, which reduces burning and helps to suppress fire spread [43].
The effectiveness of green fire barriers has been demonstrated in field tests and practical applications. For example, the Schima superba barrier successfully prevented the spread of a crown fire, with only minor charring observed at the edge of the barrier [43].

3.2.2. Optimization of Fire Rescue Management

Fire rescue activities also contribute significantly to GHG emissions, particularly transportation and the use of firefighting equipment. The following strategies could reduce emissions from fire management operations.
(1)
Increase Financial Support
Allocating more resources to forest fire management—particularly for local fire teams, the procurement of modern firefighting equipment, and the development of fire-resistant infrastructure—would improve efficiency and reduce reliance on high-emission methods, such as helicopter transport. Investment in training for local fire teams to enhance response times and improve the effectiveness of firefighting efforts could reduce the overall carbon footprint of fire social rescue activities. By reducing the need for external support and minimizing the duration of firefighting operations, emissions could be significantly reduced.
(2)
Strategic Placement of Water Sources
Constructing cisterns at key locations within the forest would reduce the need for long-distance water transport and decrease reliance on fuel-powered water pumps. This not only saves energy but also reduces GHG emissions associated with firefighting operations [44].
(3)
Road Development and Infrastructure Resilience
Developing roads along ridgelines can help control fire spread and facilitate faster access for firefighting teams. Additionally, local governments should focus on strengthening the resilience of power infrastructure, including fire protection measures for existing power sources and backup systems near forested areas [45].
By implementing these strategies, Ganzi can enhance its firefighting capacity while reducing its reliance on external resources and minimizing GHG emissions from fire rescue operations.

4. Conclusions and Perspectives

This study provides a comprehensive estimation of the greenhouse gas (GHG) emissions resulting from a forest fire event in Yajiang County, Ganzi Tibetan Autonomous Prefecture, China. Through the integration of satellite-based imagery and ground data, we estimated that the fire affected approximately 20,688.67 hectares, releasing a total of 63,764.59 tons of GHGs. The majority of emissions (53,266.29 tons) were attributed to vegetation burning, with a significant contribution from fire social rescue activities, which resulted in 10,498.30 tons of GHG emissions. The study also identified a strong correlation between fire severity and emissions, with moderate fire severity leading to the highest emissions in evergreen broadleaf and coniferous forests.
One of the key findings of this research is the substantial role that fire social rescue activities play in contributing to overall GHG emissions. Helicopter transport and fuel-powered firefighting equipment were found to be the largest contributors, with helicopter transport alone accounting for over 5000 tons of CO2 emissions. This highlights an important gap in current fire management practices, where the environmental impact of fire social rescue activities efforts is often underestimated.
To optimize forest fire management and research, we recommend that an assessment of greenhouse gas emissions be incorporated into fire management policies, especially considering emissions from fire social rescue activities. The development of emission standards for fire social rescue activity equipment (especially aviation and ground vehicles) is critical to reducing emissions. Future research should further emphasize the development of real-time data collection methods for fire fuel consumption and combustion efficiency, along with sensitivity analyses to refine emission estimates. In addition, promoting the use of low-emission fuels and improved land management practices can help to reduce the environmental impacts of forest fires and enhance climate change mitigation efforts.
Despite these contributions, there are several limitations to this study. Estimates of GHG emissions were based on certain assumptions due to the inherent uncertainty in emission factors and the complexity of fire social rescue activities, such as pre-fire species distribution and biomass. Additionally, the impact of specific fire social rescue activities strategies on emission reductions was not thoroughly quantified. A detailed comparison of alternative fire social rescue activities, such as helicopter transportation, with traditional methods, such as fire towers, was not possible within the scope of this study.
These limitations underscore the need for improvements in both research methodologies and data collection frameworks. To address these challenges, future research should focus on refining statistical methodologies for sudden forest fire events and developing more advanced remote sensing algorithms for emission inversion. The proposal to perform a detailed analysis of the environmental impacts of fire social rescue activities based on different baseline assumptions, such as fuel consumption, firefighting efficiency, and landscape conditions, represents an important direction for future research. This study encourages further investigations into fire social rescue activity strategies with a focus on carbon emissions and highlights the need for better data collection and methodology refinement to accurately assess the GHG impacts of different firefighting models. Additionally, enhancing the overall framework for forest fire GHG assessments will enable more accurate, robust, and comprehensive emission estimates. These improvements will provide more actionable insights for forest fire management and policy, leading to better strategies for mitigating the environmental impact of forest fires.

Supplementary Materials

The following supporting information can be downloaded at: https://www.mdpi.com/article/10.3390/f16050803/s1, Figure S1: Burning boundaries and overfire areas in the study area; Figure S2: Burning area image. (a) Image before the mountain fire, (b) Image after mountain fire, (c) Differentiated normalized fire index was used to extract burned areas; Table S1: Overfire area of burned areas covered by vegetation types at different burn severity; Table S2: AGB of different vegetation types; Table S3: NPP and combustion efficiency under different fire severity; Table S4: Energy consumption per unit turnover for different modes of transportation and fuel types; Table S5: Average low calorific value and standard coal conversion of different energy types.

Author Contributions

Conceptualization, Z.G.; methodology, Z.Y., Y.W. (Yanjun Wang) and X.G.; software, Z.Y. and Y.W. (Yanjun Wang); validation, Y.W. (Yanjun Wang), Y.W. (Yugang Wang) and D.W.; formal analysis, Z.Y. and Y.W. (Yugang Wang); investigation, X.Z., J.L. and J.M.; resources, Z.G. and X.Z.; data curation, Y.W. (Yugang Wang), J.L. and J.M.; writing—original draft preparation, Z.Y. and Y.W. (Yanjun Wang); writing—review and editing, Z.G. and D.W.; visualization, Y.W. (Yugang Wang); supervision, Z.G.; project administration, Z.G.; funding acquisition, Z.G. All authors have read and agreed to the published version of the manuscript.

Funding

This work was supported by the National Natural Science Foundation of China (No. 22176154, No. U24A20514) and the Science and Technology Bureau of Chengdu: (No. 2024-YF05-00654-SN).

Data Availability Statement

The datasets used and/or analyzed during the current study are available from the corresponding author upon reasonable request.

Conflicts of Interest

Authors Xijin Zhao, Jing Liao and Jian Min were employed by the company Sichuan Jinmei Environmental Protection Group Co., Ltd. The remaining authors declare that the research was conducted in the absence of any commercial or financial relationships that could be construed as a potential conflict of interest.

References

  1. Ayugi, B.O.; Chung, E.-S.; Zhu, H.; Ogega, O.M.; Babousmail, H.; Ongoma, V. Projected changes in extreme climate events over Africa under 1.5 °C, 2.0 °C and 3.0 °C global warming levels based on CMIP6 projections. Atmos. Res. 2023, 292, 106872. [Google Scholar] [CrossRef]
  2. Weckenborg, C.; Graupner, Y.; Spengler, T.S. Prospective assessment of transformation pathways toward low-carbon steelmaking: Evaluating economic and climate impacts in Germany. Resour. Conserv. Recycl. 2024, 203, 107434. [Google Scholar] [CrossRef]
  3. van der Werf, G.R.; Randerson, J.T.; Giglio, L.; Collatz, G.J.; Mu, M.; Kasibhatla, P.S.; Morton, D.C.; DeFries, R.S.; Jin, Y.; van Leeuwen, T.T. Global fire emissions and the contribution of deforestation, savanna, forest, agricultural, and peat fires (1997–2009). Atmos. Chem. Phys. 2010, 10, 11707–11735. [Google Scholar] [CrossRef]
  4. Yue, X.-L.; Gao, Q.-X. Contributions of natural systems and human activity to greenhouse gas emissions. Adv. Clim. Chang. Res. 2018, 9, 243–252. [Google Scholar] [CrossRef]
  5. Randerson, J.T.; Chen, Y.; van der Werf, G.R.; Rogers, B.M.; Morton, D.C. Global burned area and biomass burning emissions from small fires. J. Geophys. Res. Biogeosci. 2012, 117, G04012. [Google Scholar] [CrossRef]
  6. Alcasena, F.; Rodrigues, M.; Gelabert, P.; Ager, A.; Salis, M.; Ameztegui, A.; Cervera, T.; Vega-García, C. Fostering Carbon Credits to Finance Wildfire Risk Reduction Forest Management in Mediterranean Landscapes. Land 2021, 10, 1104. [Google Scholar] [CrossRef]
  7. Penman, J.; Gytarsky, M.; Hiraishi, T.; Krug, T.; Kruger, D.; Pipatti, R.; Buendia, L.; Miwa, K.; Ngara, T.; Tanabe, K. Definitions and Methodological Options to Inventory Emissions from Direct Human-Induced Degradation of Forests and Devegetation of Other Vegetation Types; Institute for Global Environmental Strategies (IGES) for the IPCC: Hayama, Japan, 2003; p. 32. [Google Scholar]
  8. Martins, V.; Miranda, A.I.; Carvalho, A.; Schaap, M.; Borrego, C.; Sa, E. Impact of forest fires on particulate matter and ozone levels during the 2003, 2004 and 2005 fire seasons in Portugal. Sci. Total Environ. 2012, 414, 53–62. [Google Scholar] [CrossRef] [PubMed]
  9. Rosa, I.M.D.; Pereira, J.M.C.; Tarantola, S. Atmospheric emissions from vegetation fires in Portugal (1990–2008): Estimates, uncertainty analysis, and sensitivity analysis. Atmos. Chem. Phys. 2011, 11, 2625–2640. [Google Scholar] [CrossRef]
  10. Fernandes, A.P.; Lopes, D.; Sorte, S.; Monteiro, A.; Gama, C.; Reis, J.; Menezes, I.; Osswald, T.; Borrego, C.; Almeida, M.; et al. Smoke emissions from the extreme wildfire events in central Portugal in October 2017. Int. J. Wildland Fire 2022, 31, 989–1001. [Google Scholar] [CrossRef]
  11. Goparaju, L.; Pillutla, R.C.P.; Venkata, S.B.K. Assessment of forest fire emissions in Uttarakhand State, India, using Open Geospatial data and Google Earth Engine. Environ. Sci Pollut. Res. Int. 2023, 30, 100873–100891. [Google Scholar] [CrossRef]
  12. Volkova, L.; Roxburgh, S.H.; Surawski, N.C.; Meyer, C.P.; Weston, C.J. Improving reporting of national greenhouse gas emissions from forest fires for emission reduction benefits: An example from Australia. Environ. Sci. Policy 2019, 94, 49–62. [Google Scholar] [CrossRef]
  13. Monteiro, A.; Corti, P.; San Miguel-Ayanz, J.; Miranda, A.I.; Borrego, C. The EFFIS forest fire atmospheric emission model: Application to a major fire event in Portugal. Atmos. Environ. 2014, 84, 355–362. [Google Scholar] [CrossRef]
  14. Pimont, F.; Linn, R.R.; Dupuy, J.-L.; Morvan, D. Effects of vegetation description parameters on forest fire behavior with FIRETEC. For. Ecol. Manag. 2006, 234, S120. [Google Scholar] [CrossRef]
  15. Dasdemir, I.; Aydin, F.; Ertugrul, M. Factors Affecting the Behavior of Large Forest Fires in Turkey. Environ. Manag. 2021, 67, 162–175. [Google Scholar] [CrossRef]
  16. Zeng, S.-P.; Liu, F.-L.; Zhao, M.-F.; Ai, Y.; Chen, X.-W. Age-and organ-related variances in fire resistance traits of typical tree species in subtropical China. Ying Yong Sheng Tai Xue Bao J. Appl. Ecol. 2020, 31, 1063–1072. [Google Scholar] [CrossRef]
  17. Stevens, J.T.; Kling, M.M.; Schwilk, D.W.; Varner, J.M.; Kane, J.M.; Gillespie, T. Biogeography of fire regimes in western U.S. conifer forests: A trait-based approach. Glob. Ecol. Biogeogr. 2020, 29, 944–955. [Google Scholar] [CrossRef]
  18. Seiler, W.; Crutzen, P.J. Estimates of gross and net fluxes of carbon between the biosphere and the atmosphere from biomass burning. Clim. Chang. 1980, 2, 207–247. [Google Scholar] [CrossRef]
  19. Navarro, G.; Caballero, I.; Silva, G.; Parra, P.-C.; Vázquez, Á.; Caldeira, R. Evaluation of forest fire on Madeira Island using Sentinel-2A MSI imagery. Int. J. Appl. Earth Obs. Geoinf. 2017, 58, 97–106. [Google Scholar] [CrossRef]
  20. Veraverbeke, S.; Verstraeten, W.W.; Lhermitte, S.; Goossens, R. Evaluating Landsat Thematic Mapper spectral indices for estimating burn severity of the 2007 Peloponnese wildfires in Greece. Int. J. Wildland Fire 2010, 19, 558–569. [Google Scholar] [CrossRef]
  21. Ma, S.; Qiao, Y.-P.; Wang, L.-J.; Zhang, J.-C. Terrain gradient variations in ecosystem services of different vegetation types in mountainous regions: Vegetation resource conservation and sustainable development. For. Ecol. Manag. 2021, 482, 118856. [Google Scholar] [CrossRef]
  22. Fan, D.; Wang, M.; Liang, T.; He, H.; Zeng, Y.; Fu, B. Estimation and trend analysis of carbon emissions from forest fires in mainland China from 2011 to 2021. Ecol. Inform. 2024, 81, 102572. [Google Scholar] [CrossRef]
  23. Xi, Y. Remote Sensing Image Based Forest Fire Carbon in Daxingan Mountains in Recent Ten Years Release Estimate. Master’s Thesis, Northeast Forestry University, Harbin, China, 2020. [Google Scholar] [CrossRef]
  24. Zhang, H.; Song, T.; Wang, K.; Yang, H.; Yue, Y.; Zeng, Z.; Peng, W.; Zeng, F. Influences of stand characteristics and environmental factors on forest biomass and root–shoot allocation in southwest China. Ecol. Eng. 2016, 91, 7–15. [Google Scholar] [CrossRef]
  25. Liu, L.; Yang, H.; Xu, Y.; Guo, Y.; Ni, J. Forest Biomass and Net Primary Productivity in Southwestern China: A Meta-Analysis Focusing on Environmental Driving Factors. Forests 2016, 7, 173. [Google Scholar] [CrossRef]
  26. Liu, M.; Li, D.; Hu, J.; Liu, D.; Ma, Z.; Cheng, X.; Zhao, C.; Liu, Q. Altitudinal pattern of shrub biomass allocation in Southwest China. PLoS ONE 2020, 15, e0240861. [Google Scholar] [CrossRef] [PubMed]
  27. Zhou, X.; Hu, C.; Wang, Z. Distribution of biomass and carbon content in estimation of carbon density for typical forests. Glob. Ecol. Conserv. 2023, 48, e02707. [Google Scholar] [CrossRef]
  28. Sun, Y.; Zhang, Q.; Li, K.; Huo, Y.; Zhang, Y. Trace gas emissions from laboratory combustion of leaves typically consumed in forest fires in Southwest China. Sci. Total Environ. 2022, 846, 157282. [Google Scholar] [CrossRef]
  29. Jiao, J.; Huang, Y.; Liao, C.; Zhao, D. Sustainable development path research on urban transportation based on synergistic and cost-effective analysis: A case of Guangzhou. Sustain. Cities Soc. 2021, 71, 102950. [Google Scholar] [CrossRef]
  30. Zhang, L.; Long, R.; Chen, H.; Geng, J. A review of China’s road traffic carbon emissions. J. Clean. Prod. 2019, 207, 569–581. [Google Scholar] [CrossRef]
  31. Ministry of Ecology and Environment of the People’s Republic of China. China Mobile Source Environmental Management Annual Report; Ministry of Ecology and Environment of the People’s Republic of China: Beijing, China, 2021. [Google Scholar]
  32. Standardization Administration of the People’s Republic of China. General Rules for Calculation of the Comprehensive; Standardization Administration of the People’s Republic of China: Beijing, China, 2020. [Google Scholar]
  33. Clinton, N.E.; Gong, P.; Scott, K. Quantification of pollutants emitted from very large wildland fires in Southern California, USA. Atmos. Environ. 2006, 40, 3686–3695. [Google Scholar] [CrossRef]
  34. French, N.H.; De Groot, W.J.; Jenkins, L.K.; Rogers, B.M.; Alvarado, E.; Amiro, B.; De Jong, B.; Goetz, S.; Hoy, E.; Hyer, E. Model comparisons for estimating carbon emissions from North American wildland fire. J. Geophys. Res. Biogeosci. 2011, 116, G00K05. [Google Scholar] [CrossRef]
  35. Hodnebrog, Ø.; Solberg, S.; Stordal, F.; Svendby, T.M.; Simpson, D.; Gauss, M.; Hilboll, A.; Pfister, G.G.; Turquety, S.; Richter, A.; et al. Impact of forest fires, biogenic emissions and high temperatures on the elevated Eastern Mediterranean ozone levels during the hot summer of 2007. Atmos. Chem. Phys. 2012, 12, 8727–8750. [Google Scholar] [CrossRef]
  36. Castellanos, P.; Boersma, K.F.; van der Werf, G.R. Satellite observations indicate substantial spatiotemporal variability in biomass burning NOx emission factors for South America. Atmos. Chem. Phys. 2014, 14, 3929–3943. [Google Scholar] [CrossRef]
  37. Schreier, S.F.; Richter, A.; Schepaschenko, D.; Shvidenko, A.; Hilboll, A.; Burrows, J.P. Differences in satellite-derived NOx emission factors between Eurasian and North American boreal forest fires. Atmos. Environ. 2015, 121, 55–65. [Google Scholar] [CrossRef]
  38. Stephens, S.L.; Foster, D.E.; Battles, J.J.; Bernal, A.A.; Collins, B.M.; Hedges, R.; Moghaddas, J.J.; Roughton, A.T.; York, R.A. Forest restoration and fuels reduction work: Different pathways for achieving success in the Sierra Nevada. Ecol. Appl. 2024, 34, e2932. [Google Scholar] [CrossRef] [PubMed]
  39. Guo, L.; Wu, Z.; Li, S. The relative impacts of vegetation, topography and weather on landscape patterns of burn severity in subtropical forests of southern China. J. Environ. Manag. 2024, 351, 119733. [Google Scholar] [CrossRef] [PubMed]
  40. Wang, H.-H.; Finney, M.A.; Song, Z.-L.; Wang, Z.-S.; Li, X.-C. Ecological techniques for wildfire mitigation: Two distinct fuelbreak approaches and their fusion. For. Ecol. Manag. 2021, 495, 119376. [Google Scholar] [CrossRef]
  41. Alam, M.A.; Wyse, S.V.; Buckley, H.L.; Perry, G.L.; Sullivan, J.J.; Mason, N.W.; Buxton, R.; Richardson, S.J.; Curran, T.J. Shoot flammability is decoupled from leaf flammability, but controlled by leaf functional traits. J. Ecol. 2020, 108, 641–653. [Google Scholar] [CrossRef]
  42. Wang, H.; Li, D.; Hong, M.; Dou, J. Syntheses, structural characterization and in vitro cytotoxic activity of triorganotin(IV) complexes based on 1,7-dihydroxycarbonyl-1,7-dicarba-closo-dodecaborane ligand. J. Organomet. Chem. 2013, 740, 1–9. [Google Scholar] [CrossRef]
  43. Wang, H.-H. Scientific Basis and Prospects of Biological Fire-prevention-belt Technique. Lin Ye Ke Xue Yan Jiu 2015, 28, 731. [Google Scholar]
  44. Mishra, M.; Guria, R.; Baraj, B.; Nanda, A.P.; Santos, C.A.G.; da Silva, R.M.; Laksono, F.A.T. Spatial analysis and machine learning prediction of forest fire susceptibility: A comprehensive approach for effective management and mitigation. Sci. Total Environ. 2024, 926, 171713. [Google Scholar] [CrossRef]
  45. Moore, D.; Kearney, M.R.; Paltridge, R.; McAlpin, S.; Stow, A. Is fire a threatening process for Liopholis kintorei, a nationally listed threatened skink? Wildl. Res. 2015, 42, 207–216. [Google Scholar] [CrossRef]
Figure 1. (a) Location of Sichuan in China and location of Yajiang county in Sichuan, (b) main fire area of Yajiang county, (c) elevation of Yajiang county, (d) land cover in 2020 of Yajiang county.
Forests 16 00803 g001
Figure 2. (a) The main types of vegetation coverage in the burned area. (b) The distribution of burn severity in the burned area.
Forests 16 00803 g002
Figure 3. The proportion of the area at different fire severities for different vegetation types.
Forests 16 00803 g003
Figure 4. GHG emissions across different vegetation types and fire severities (tons): (a) evergreen broadleaf forest, (b) deciduous broadleaf forest, (c) evergreen coniferous forest, (d) shrubland.
Forests 16 00803 g004
Figure 5. The emissions of different GHGs in social rescue activities. (a) CO2 emissions in social rescue activities, (b) CO emissions in social rescue activities, (c) CH4 emissions in social rescue activities, (d) N2O and NOx emissions in social rescue activities.
Forests 16 00803 g005
Figure 6. (a) The GHG emissions in different social rescue processes. (b) Proportion of different GHG emissions from different processes in this fire.
Forests 16 00803 g006
Table 1. TB and carbon content of different vegetation types.
Vegetation TypeTB (t/hm2)Carbon Content (%)
Evergreen broadleaf forest230.540.4664
Evergreen coniferous forest243.40.5179
Deciduous broadleaf forest212.20.4664
Shrubland25.90.4546
Table 2. Emission factors of different gases.
Gas TypeCO2COCH4N2ONOx
Emission factor1754.27156.715.680.192.29
Table 3. Calculation methods of GHG emissions in different rescue settings.
Transport TypeCalculation ContentCalculation MethodCalculation Formula
Highway passenger transportRelocation of residentsTurnover method Carbon   emissions =
( S   ×   P   ×   M i   ×   E   ×   I )
Rescue personnel transportation
Road freightFirefighting water transportation
Social relief material transportation
Air cargoHelicopter water transportation
Yunnan rescue force transportation100 km energy consumption method Carbon   emissions =   S   ×   F   ×   I
Electricity generation vehicles
Table 4. Environmental emission factors of GHG for different fuel types.
DepartmentEnergy TypesCO2COCH4N2ONOx
HighwayGasoline68.5608.0000.0090.0010.600
Diesel oil73.2751.0000.0020.0010.800
AviationKerosene72.5500.1000.0020.0020.300
Table 5. GHG emission data of forest fires in the whole process.
ProcessTypeEmissions (t)
CO2COCH4N2O NOx
Vegetation burning processEvergreen broadleaf forest1173.069104.7913.7980.1271.531
Evergreen coniferous forest46,620.6314164.649150.9495.04960.858
Deciduous broadleaf forest139.13212.4290.4500.01510.182
Shrubland757.44367.6632.4520.0820.989
Transportation processPersonnel transfer47.2321.9830.00260.000660.488
Transportation of rescue force in Yunnan Province209.7925.0210.00970.00292.208
Transportation of electricity generation77.0252.4890.00360.00110.811
Helicopter transport water5768.8057.9510.1590.15923.854
Road transport water6.1690.1990.000280.000090.065
Transportation of social rescue materials9.3000.3010.000430.000130.098
Fire extinguishing and electricity generation processSprinkler truck1386.84444.8160.0640.01914.597
Water pump785.26891.6300.1030.0116.872
Oil generator1955.81626.6910.0530.02721.353
Total emissions58,936.5264530.614158.0465.495133.906
Disclaimer/Publisher’s Note: The statements, opinions and data contained in all publications are solely those of the individual author(s) and contributor(s) and not of MDPI and/or the editor(s). MDPI and/or the editor(s) disclaim responsibility for any injury to people or property resulting from any ideas, methods, instructions or products referred to in the content.

