Article

How Vegetation Structure Shapes the Soundscape: Acoustic Community Partitioning and Its Implications for Urban Forestry Management

by
Yilin Zhao
1,2,3,
Zhenkai Sun
2,3,
Zitong Bai
2,3,
Jiali Jin
2,3 and
Cheng Wang
2,3,*
1
Research Institute of Biology and Agriculture, Shunde Innovation School, University of Science and Technology Beijing (USTB), Beijing 100083, China
2
Research Institute of Forestry, Chinese Academy of Forestry, Beijing 100091, China
3
Key Laboratory of Tree Breeding and Cultivation, National Forestry and Grassland Administration, Beijing 100091, China
*
Author to whom correspondence should be addressed.
Forests 2025, 16(4), 669; https://doi.org/10.3390/f16040669
Submission received: 13 March 2025 / Revised: 8 April 2025 / Accepted: 10 April 2025 / Published: 11 April 2025
(This article belongs to the Section Urban Forestry)

Abstract

:
Urban green spaces are critical yet understudied areas where anthropogenic and biological sounds interact. This study investigates how vegetation structure mediates the acoustic partitioning of urban soundscapes and informs sustainable forestry management. Through the principal component analysis (PCA) of 1–11 kHz frequency bands, we identified anthropogenic sounds (1–2 kHz) and biological sounds (2–11 kHz). Within bio-acoustic communities, PCA further revealed three positively correlated sub-clusters (2–4 kHz, 5–6 kHz, and 6–11 kHz), suggesting cooperative niche partitioning among avian, amphibian, and insect vocalizations. Linear mixed models highlighted vegetation’s dual role: mature tree stands (explaining 19.9% variance) and complex vertical structures (leaf-height diversity: 12.2%) significantly enhanced biological soundscapes (R2m = 0.43) while suppressing anthropogenic noise through canopy stratification (32.3% variance explained). Based on our findings, we suggest that an acoustic data-driven framework—comprising (1) the preservation of mature stands with multi-layered canopies to enhance bioacoustic resilience, (2) strategic planting of mid-story vegetation to disrupt low-frequency noise propagation, and (3) real-time soundscape monitoring to balance biophony and anthropophony allocation—can contribute to promoting sustainable urban forestry management.

1. Introduction

Worldwide, the relationship between forests and human livelihoods is foundational, as an estimated 350 million people globally rely on forests for their sustenance [1,2]. China has realized remarkable forest restoration [3], reaching 231 million hectares of forest coverage, as reported by the National Greening Commission Office (2023). In Beijing specifically, municipal forest coverage has increased to over 44.8% through urban forest initiatives and the Beijing Plain Area Afforestation Programme (BPAP) [3,4]. Despite significant gains in forest coverage, a systematic evaluation of whether the rapid expansion of urban forests is accompanied by improvements in ecological quality remains lacking. Given the complexity of forest ecosystems, effective monitoring over extensive spatial and temporal scales necessitates substantial time, resources, and expertise, particularly in developing countries [5,6]. Emerging fields such as soundscape ecology provide novel opportunities for monitoring and assessing urban ecosystems. Soundscapes, particularly biophony, offer an unbiased and durable record of ecosystem dynamics, capturing the interactions between species and their environments [7].
Despite the growing recognition of the value of soundscape ecology, the relationship between soundscapes and vegetation structure remains insufficiently explored, particularly in urban settings [8,9]. Vegetation structure, as the primary determinant of habitat complexity, significantly influences the biodiversity and composition of communities within ecosystems. It has long been established that diverse vegetation—both in terms of horizontal and vertical structure—supports higher species richness by providing a range of ecological niches [10,11]. As such, it is reasonable to expect that habitats with greater vegetation complexity will not only support higher biodiversity but also exhibit increased acoustic diversity [8,12,13,14]. The acoustic environment, or soundscape, may serve as a reflection of underlying ecological processes, where biophony—sounds produced by living organisms—can be used as a proxy for biodiversity and ecosystem health.
However, this relationship remains unclear, particularly in urban forests where both biophony and anthropophony are influenced by human activity and environmental heterogeneity. Previous studies on soundscape composition typically rely on the distinction between biophony (2–11 kHz) and anthropophony (1–2 kHz), yet the applicability of these frameworks in urban contexts remains unverified [15,16]. In urban environments, where human-induced noise and the diversity of vegetation types vary greatly, it remains unclear whether the acoustic partitioning observed in more natural habitats holds true. This gap in knowledge underscores the need to explore how soundscapes are shaped by the structural characteristics of vegetation in urban forests, where human activity and ecological complexity intersect [8,17].
This study seeks to address this gap by investigating the acoustic characteristics of Beijing’s urban forest soundscape. Specifically, we aim to examine how different vegetation structures influence the distribution of biophony and anthropophony across frequency ranges (1–2 kHz and 2–11 kHz, respectively). By analyzing these relationships, we aim to contribute new insights into the role of vegetation complexity in shaping soundscapes and establish a scientific foundation for the use of acoustic monitoring in urban forestry management.

2. Materials and Methods

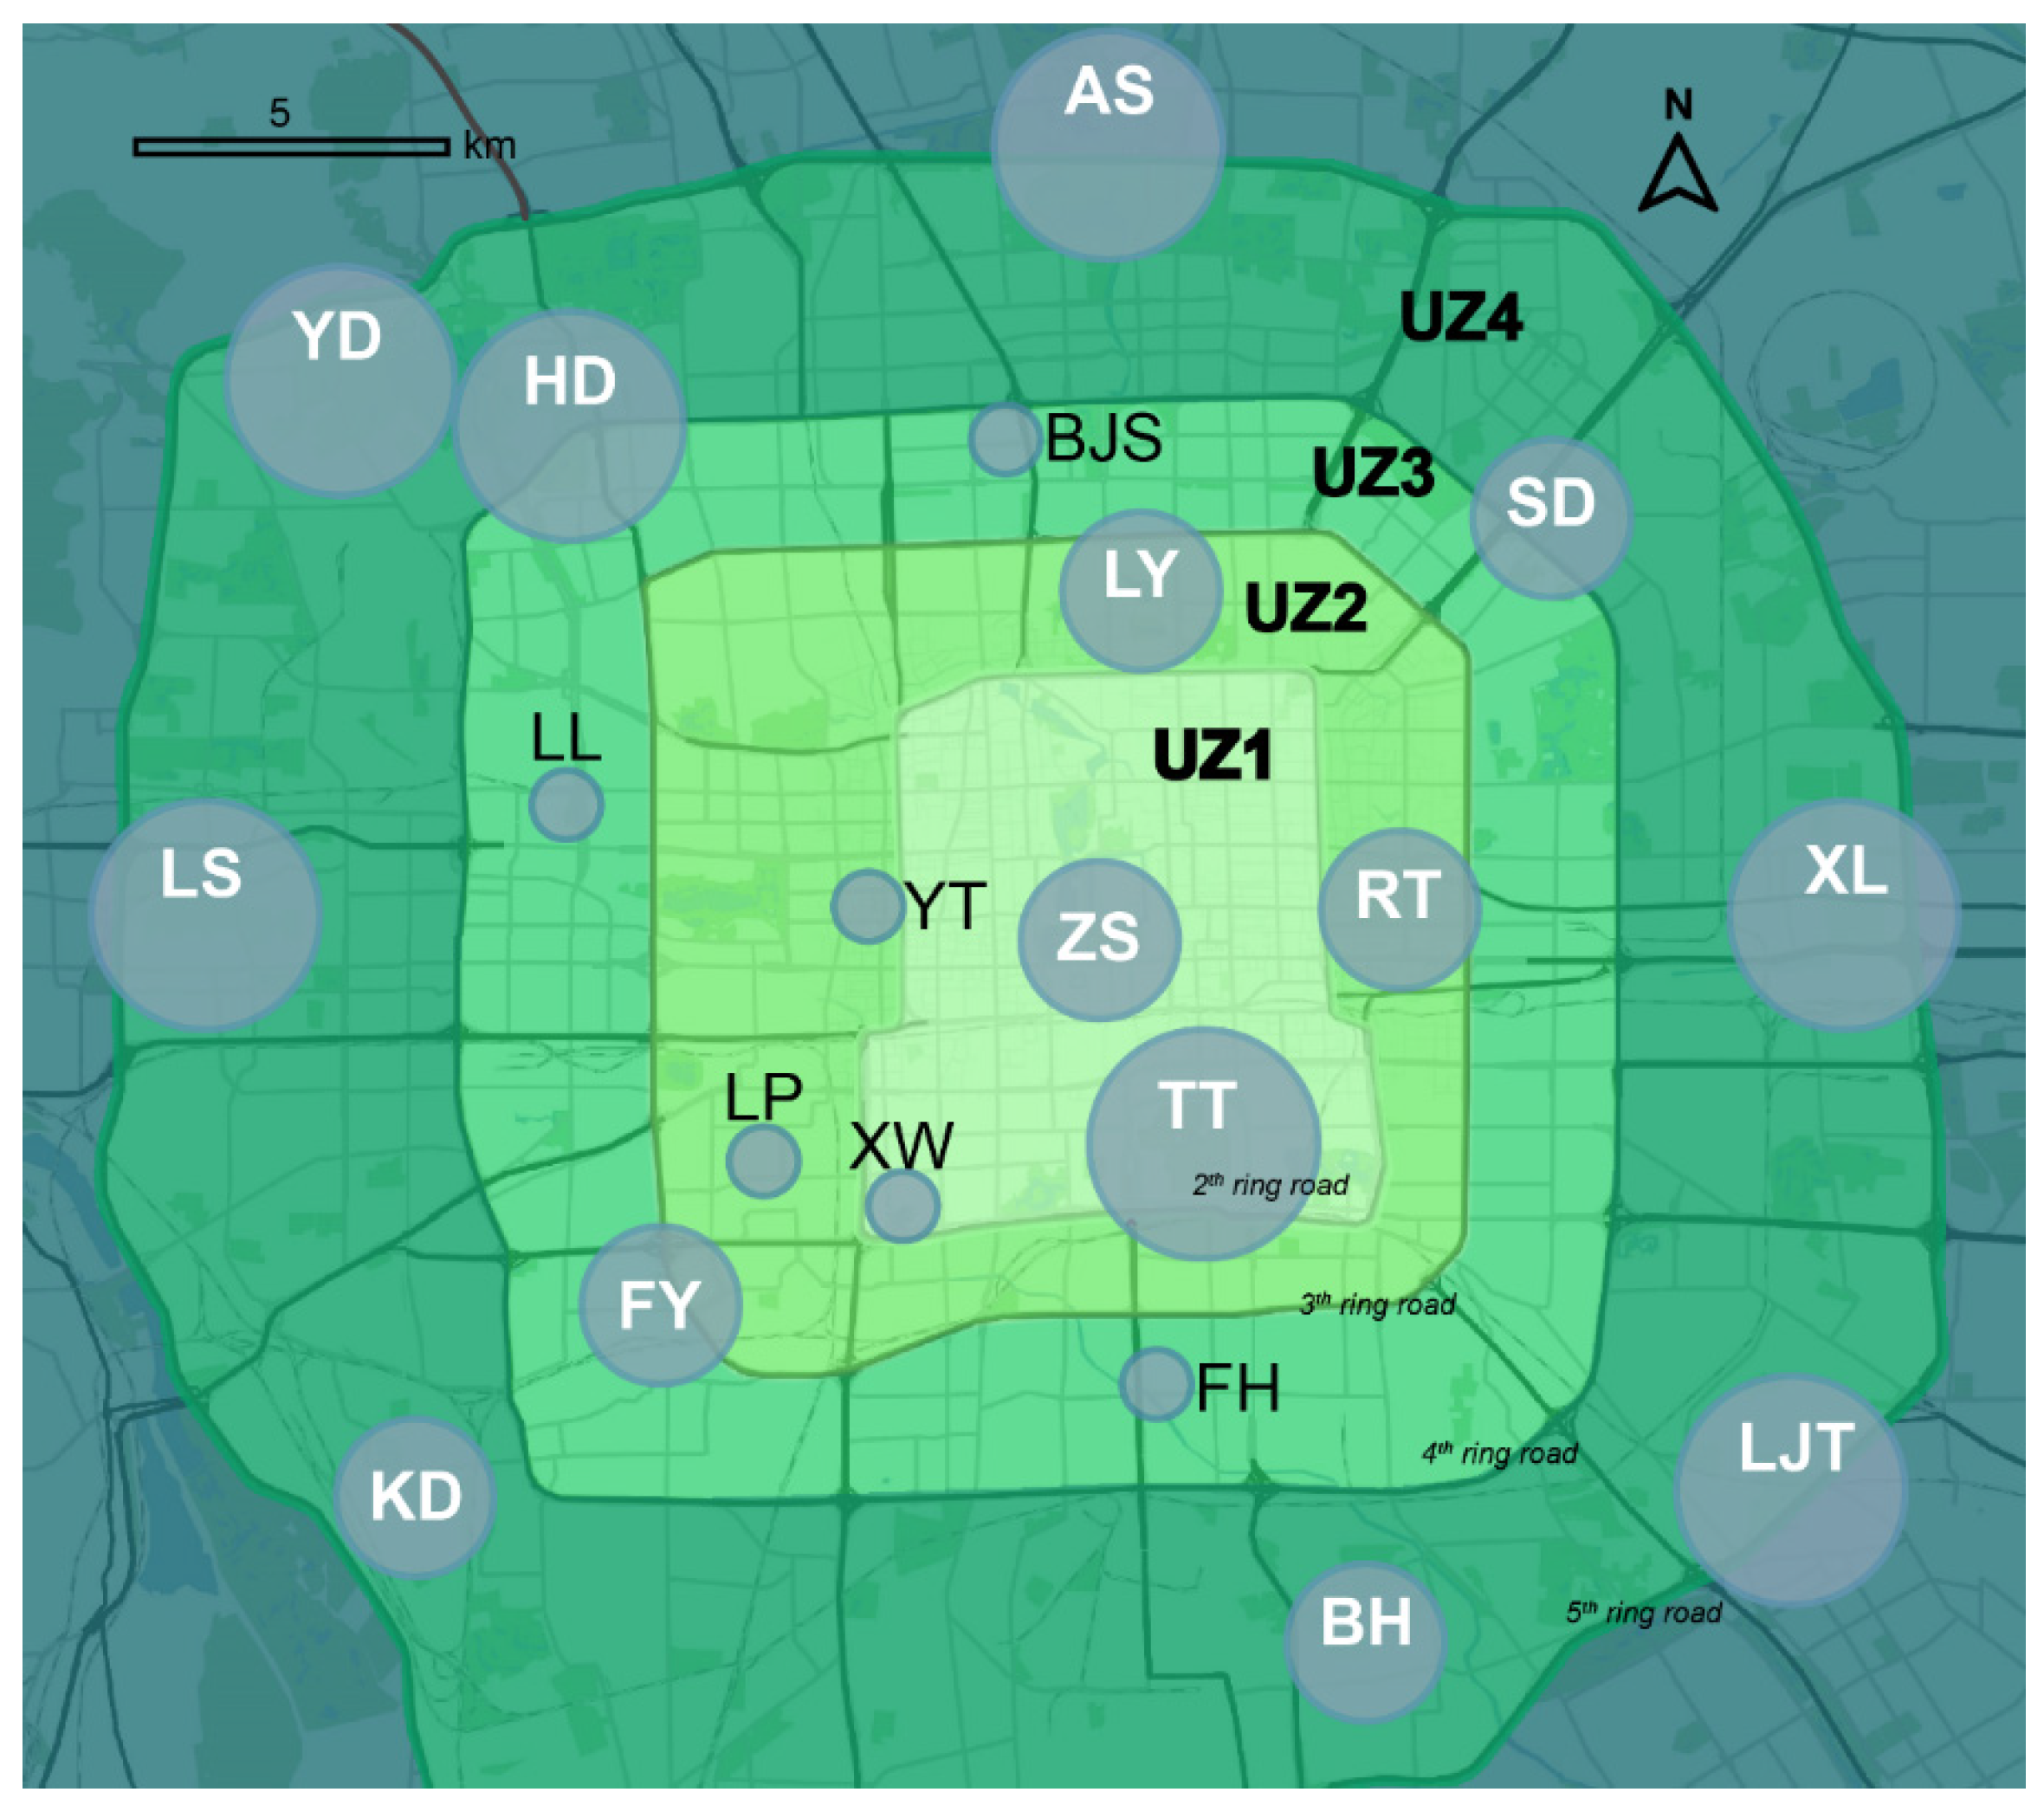
2.1. Field Acoustic Data Collection

Acoustic data collection was conducted across 20 urban forest sites (2.27–680 ha in area) within the municipal boundaries of Beijing, China (115°24′–117°30′ E, 39°38′–41°05′ N; Figure A1). To minimize potential spatial autocorrelations between sampling locations, study sites were strategically selected with a minimum of 1 km inter-site distances. A stratified sampling protocol was implemented, where the number of sampling points per forest patch was proportional to its areal extent [18]. Specifically, forest patches were categorized into three size classes: small (1–10 ha, n = 6) with one sampling point, medium (11–30 ha, n = 8) with three sampling points, and large (>31 ha, n = 6) with five sampling points. The result was a total of 60 sampling locations. Detailed site selection criteria and spatial distribution patterns are described in our previous work [16]. Acoustic sensors were deployed following two fundamental ecological recording principles: (1) Each recorder was positioned at the plant-community center, maintaining ≥50 m distance from forest edges to minimize edge effects on bioacoustic community dynamics; (2) an inter-recorder spacing of ≥200 m was enforced to ensure acoustic independence between sampling points.
Continuous acoustic monitoring was performed during the peak avian breeding season (April–May 2019) using Zoom H5 digital recorders (Zoom Corporation, Tokyo, Japan, Firmware v2.40) equipped with XYH-5X/Y omnidirectional microphones. At each site, quadruplicate 4-day continuous recording sessions were conducted under standardized meteorological conditions (clear skies and wind speed <3 Beaufort). Technical recording parameters included the following: 44.1 kHz sampling rate, 16-bit depth, stereo channel configuration, and WAV format storage. A high-pass filter (cutoff frequency: 220 Hz; roll-off: 6 dB/octave) was applied to eliminate electromagnetic interference [19]. The typical soundscape spectrum, its environment, and the field recording setup are visually shown in Figure 1.
The initial dataset comprised 691,225 min of raw recordings. Systematic subsampling was implemented through Python programming (v3.7) using AudioSegment package functionality, extracting 1 min samples at 15 min intervals. This protocol yielded a curated subset of 46,080 standardized 1 min audio files for subsequent analysis.

2.2. Vegetation Data Collection

Vegetation surveys strictly adhered to standardized census protocols [20]. Vegetation data were collected within 20 × 20 m quadrats centered on acoustic recording points. Beyond species richness, we quantified horizontal and vertical vegetation structure metrics at each site. Ground vegetation characterization involved nested sampling: Four systematically placed 1 × 1 m subquadrats were surveyed within each plot to document herbaceous species composition and associated physiognomic traits. The bare ground percentage (BPER) was calculated as the proportional area exhibiting <10% vegetation cover within quadrats, operationally defined as persistent unvegetated surfaces [16]. All vegetation structural parameters, including dimensional hierarchies and spatial configuration metrics, are comprehensively detailed in Appendix A, Table A1.

2.3. Acoustic Parameters

Soundscape composition reflects frequency-dependent intensity distributions from distinct biophysical sources [21], which are categorized into three primary components: biophony (biological sounds produced by vocal organisms, predominantly within higher frequency bands of 2–11 kHz), anthropophony (human-generated mechanical noise concentrated in lower frequencies of 1–2 kHz), and geophony (abiotic environmental sounds such as wind or hydrological activity). The latter was excluded from the analysis due to the meteorological controls during sampling [22,23].
Power spectral density (PSD) analysis was employed to quantify acoustic intensity distributions across frequency intervals using the soundscape function in the R seewave package (v2.2.0). Raw PSD values underwent min–max normalization (0–1 scale) to standardize spectral profiles for cross-site comparisons. The analytical framework included the calculation of a normalized PSD (nPSD) for each 1 kHz frequency bin spanning 1–11 kHz, and it is defined as follows:
n P S D f = P S D f m i n P S D m a x P S D m i n P S D
where ƒ represents the power spectral density at frequency ƒ, which is normalized to remove amplitude scaling effects. Additionally, three integrative metrics were computed: total soundscape intensity (∑PSD1–11 kHz) as a proxy for overall acoustic activity, anthrophony intensity (∑PSD1–2 kHz) reflecting human disturbance intensity, and biophony intensity (∑PSD2–11 kHz) representing biological vocalization patterns. Frequency interval delineations were based on established bioacoustic thresholds for avian and anthropogenic sound propagation in temperate forests.
To further estimate anthrophony levels in soundscapes, we utilized the Normalized Difference Soundscape Index (NDSI), which is computed as follows:
N D S I = P b i o P a n t h r o P b i o + P a n t h r o
where Pbio and Panthro are the total spectral power in biophony-dominated (2–11 kHz) and anthropophony-dominated (1–2 kHz) frequency ranges, respectively. NDSI values range from −1 to +1, with values approaching +1 indicating biophony dominance and values near −1 signifying anthrophony predominance. NDSI calculations used the soundscape function in the seewave R package followed by normalization to derive values ranging from −1 to +1. Values approaching +1 indicate biophony dominance, whereas values approaching −1 signify anthrophony predominance.

2.4. Statistical Analyses

All statistical procedures were implemented on R (v4.2.1) and Python (v3.9.21) platforms.

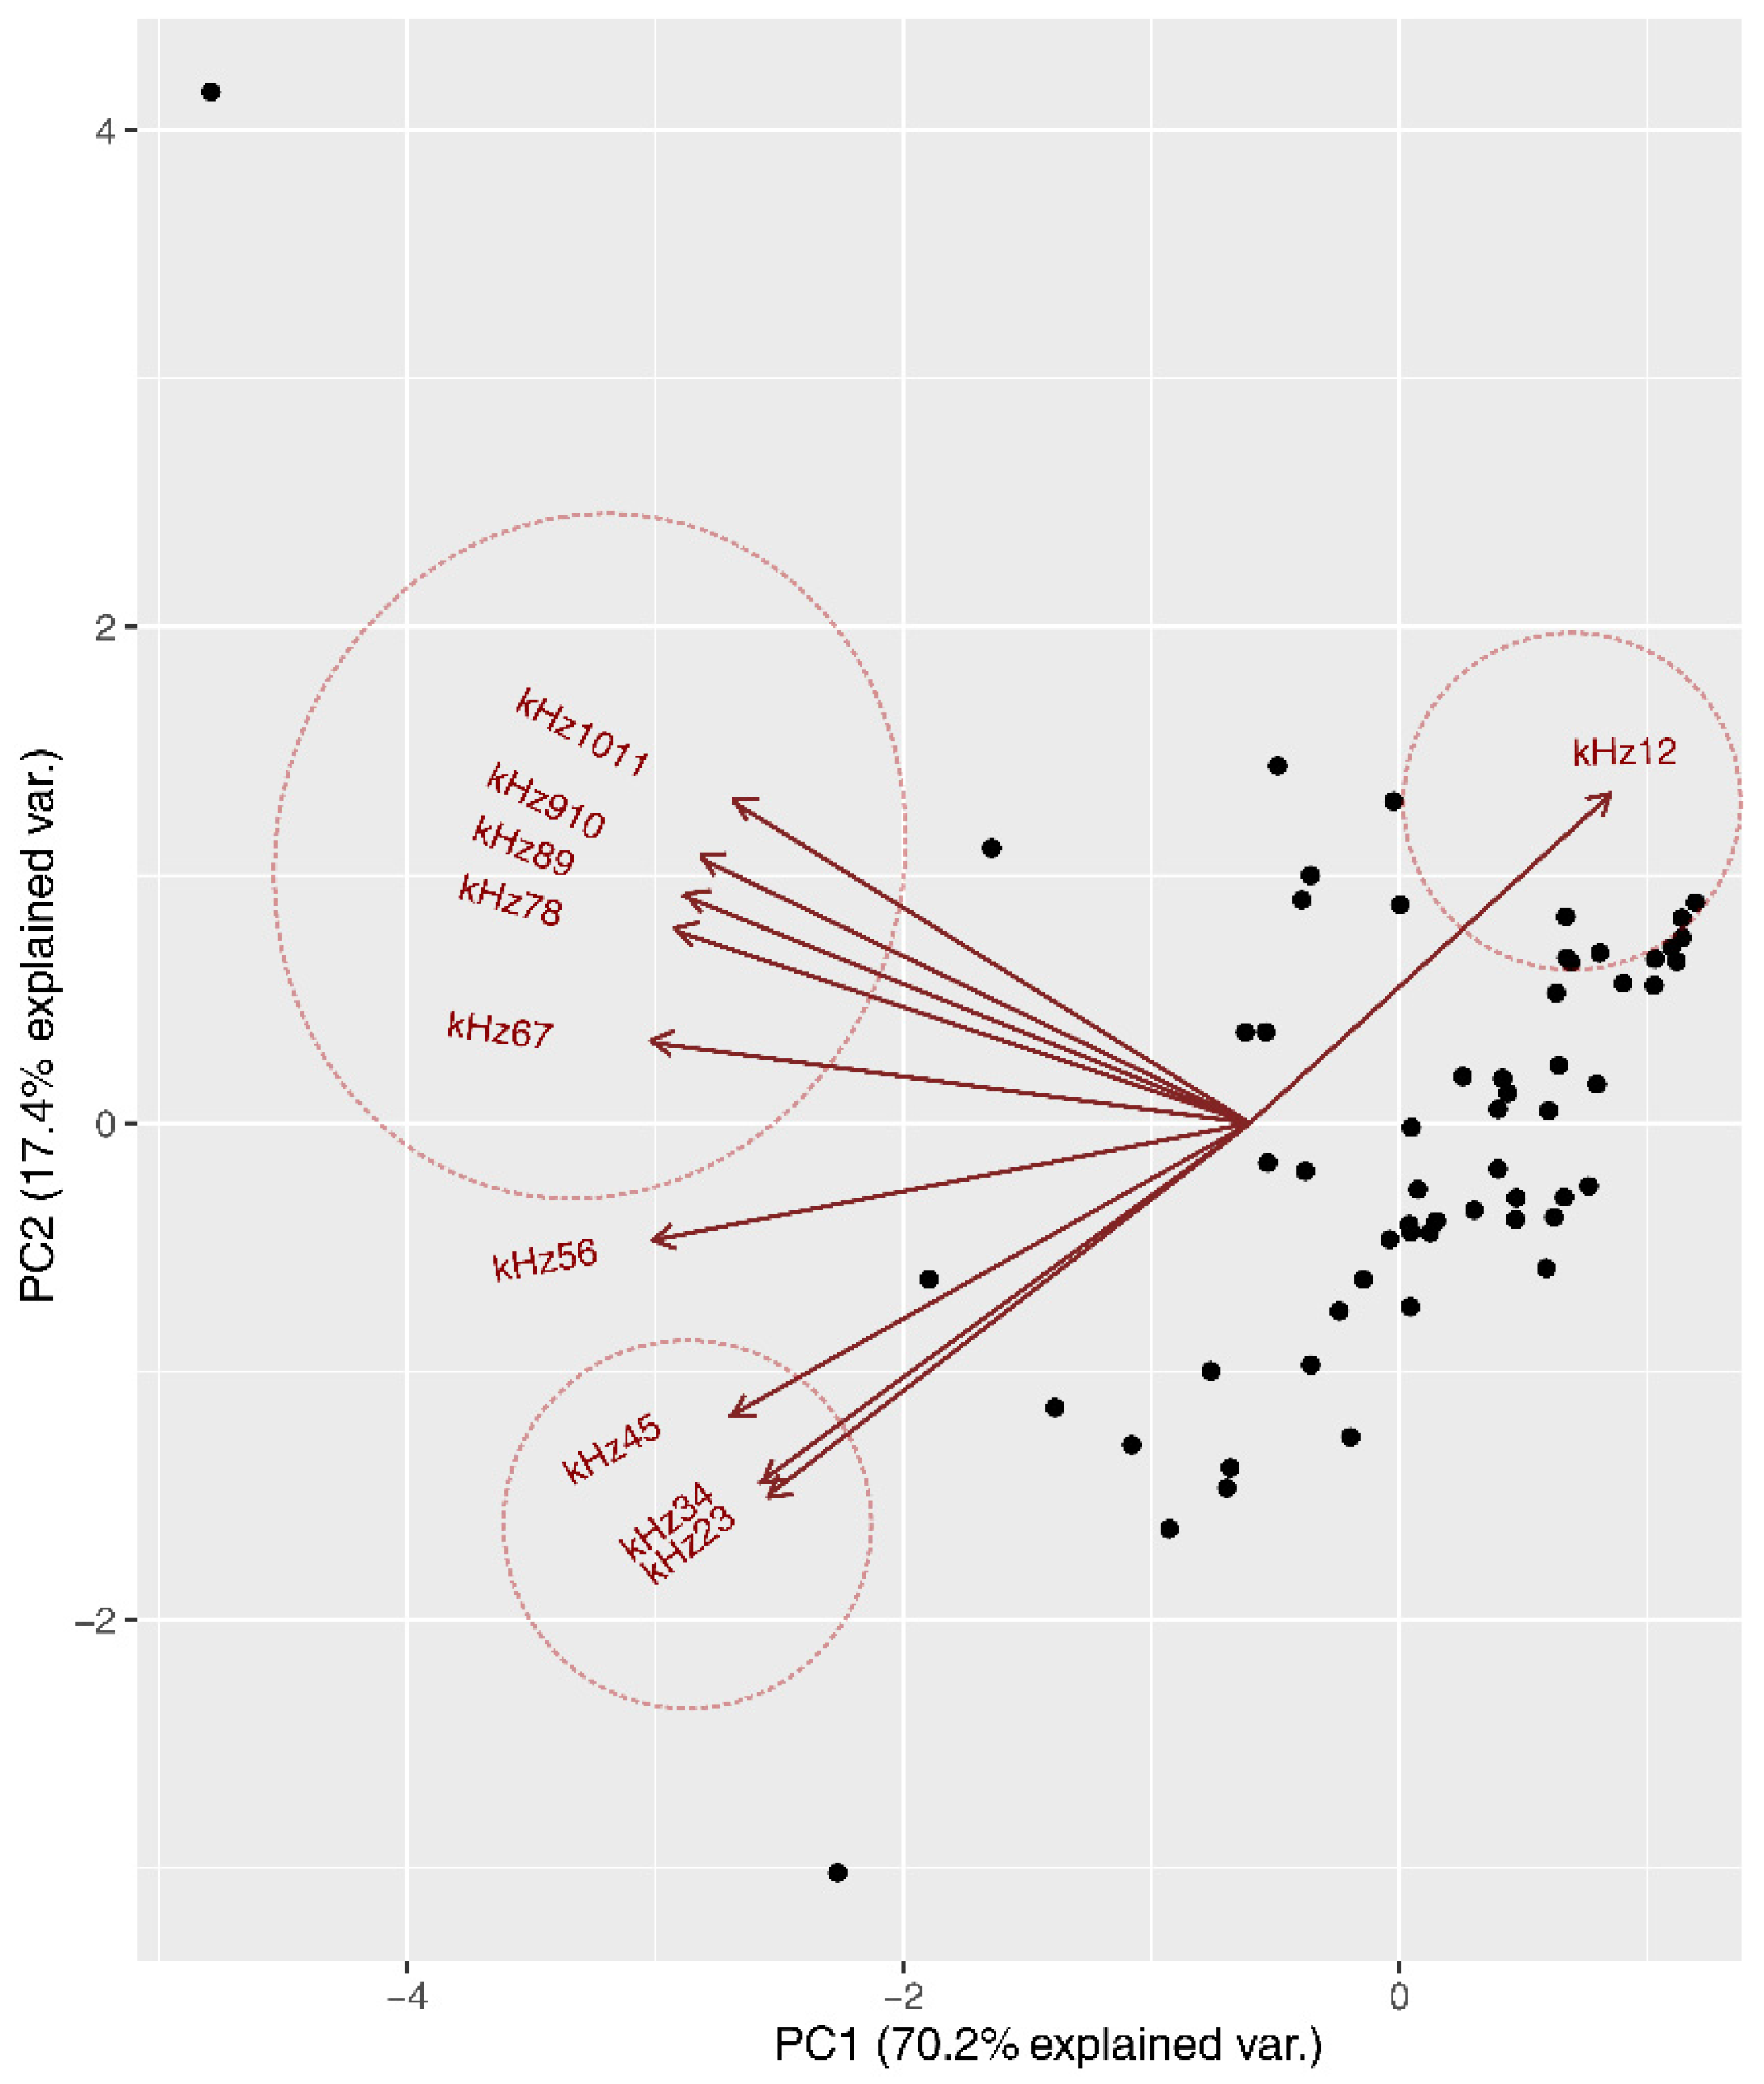
2.4.1. Principal Component Analysis

Principal component analysis (PCA) was applied to delineate acoustic frequency components across the spectrum. This dimensionality reduction technique evaluates covariance structures among multivariate datasets [24], generating orthogonal principal components through the eigen decomposition of the variance–covariance matrix. The derived components maximized the retained variance from the original acoustic variables, with dimensionality determined via eigenvalue thresholds. The components exhibiting eigenvalues >1 were retained following the Kaiser criterion for significant feature extractions. Varimax rotation was applied to enhance the interpretability of component loadings, ensuring the distinct separation of frequency-specific acoustic signatures.

2.4.2. Acoustic Niche Characterization Analysis

To investigate the avian utilization of acoustic space in urban forests, we analyzed 460 randomly sampled 15 s recordings, quantifying the frequency distributions of common bird vocalizations within 1–11 kHz.

2.4.3. Mixed-Effect Modeling

To investigate the relationship between soundscape patterns and vegetation characteristics, we used linear mixed-effect models (LMMs), incorporating the plot location and recording month as random effects using R package lme4. As the original data violated normality assumptions, we implemented Box–Cox transformations using the bestNormalize package in R to obtain the normal distributions of response variables.
Thirteen vegetation variables representing two fundamental aspects of plant communities—species composition and structural complexity—were initially considered. To mitigate multicollinearity issues, we conducted a variance inflation factor (VIF) analysis prior to model construction. In total, 2 parameters (HSR: VIF = 19.4; PSR: VIF = 29.0) exceeding the critical threshold of VIF > 10 were excluded, resulting in 11 retained variables for subsequent analyses (see Appendix A, Table A1).
The model’s structure followed established protocols for nested ecological data (Zuur et al., 2009) [25], and it is formalized as follows (for details, see the Supplementary R Code):
Yijk = βXijk + γi + δj + εijk
where
  • Yijk denotes the acoustic index value for observation k at plot i in month j;
  • Xijk denotes the matrix of 11 standardized vegetation predictors;
  • Β denotes the fixed-effect coefficients;
  • γi ~ N(0, σplot2) denotes the random intercept for the plot location (60 plots);
  • δj ~ N(0, σmonth2) denotes the random intercept for the recording month (2 months);
  • εijk ~ N(0, σres2) denotes the residual error.
Random intercepts follow zero-mean normal distributions. For each model, a multimodel inference procedure was applied using the R MuMIn package. This method allowed us to perform model selection by creating a set of models with all possible combinations of the initial variables and sorting them according to the Akaike Information Criterion (AIC) fitted with maximum likelihood, retaining those within ΔAICc ≤ 2 as the top model set. Model averaging techniques implemented via the AICcmodavg package were applied to this optimal subset to obtain robust parameter estimates. To quantify the explanatory power, we calculated both the marginal R2 (variance explained by fixed effects) and conditional R2 (combined variance explained by fixed and random effects) following Nakagawa et al.’s (2017) [26] methodology.

3. Results

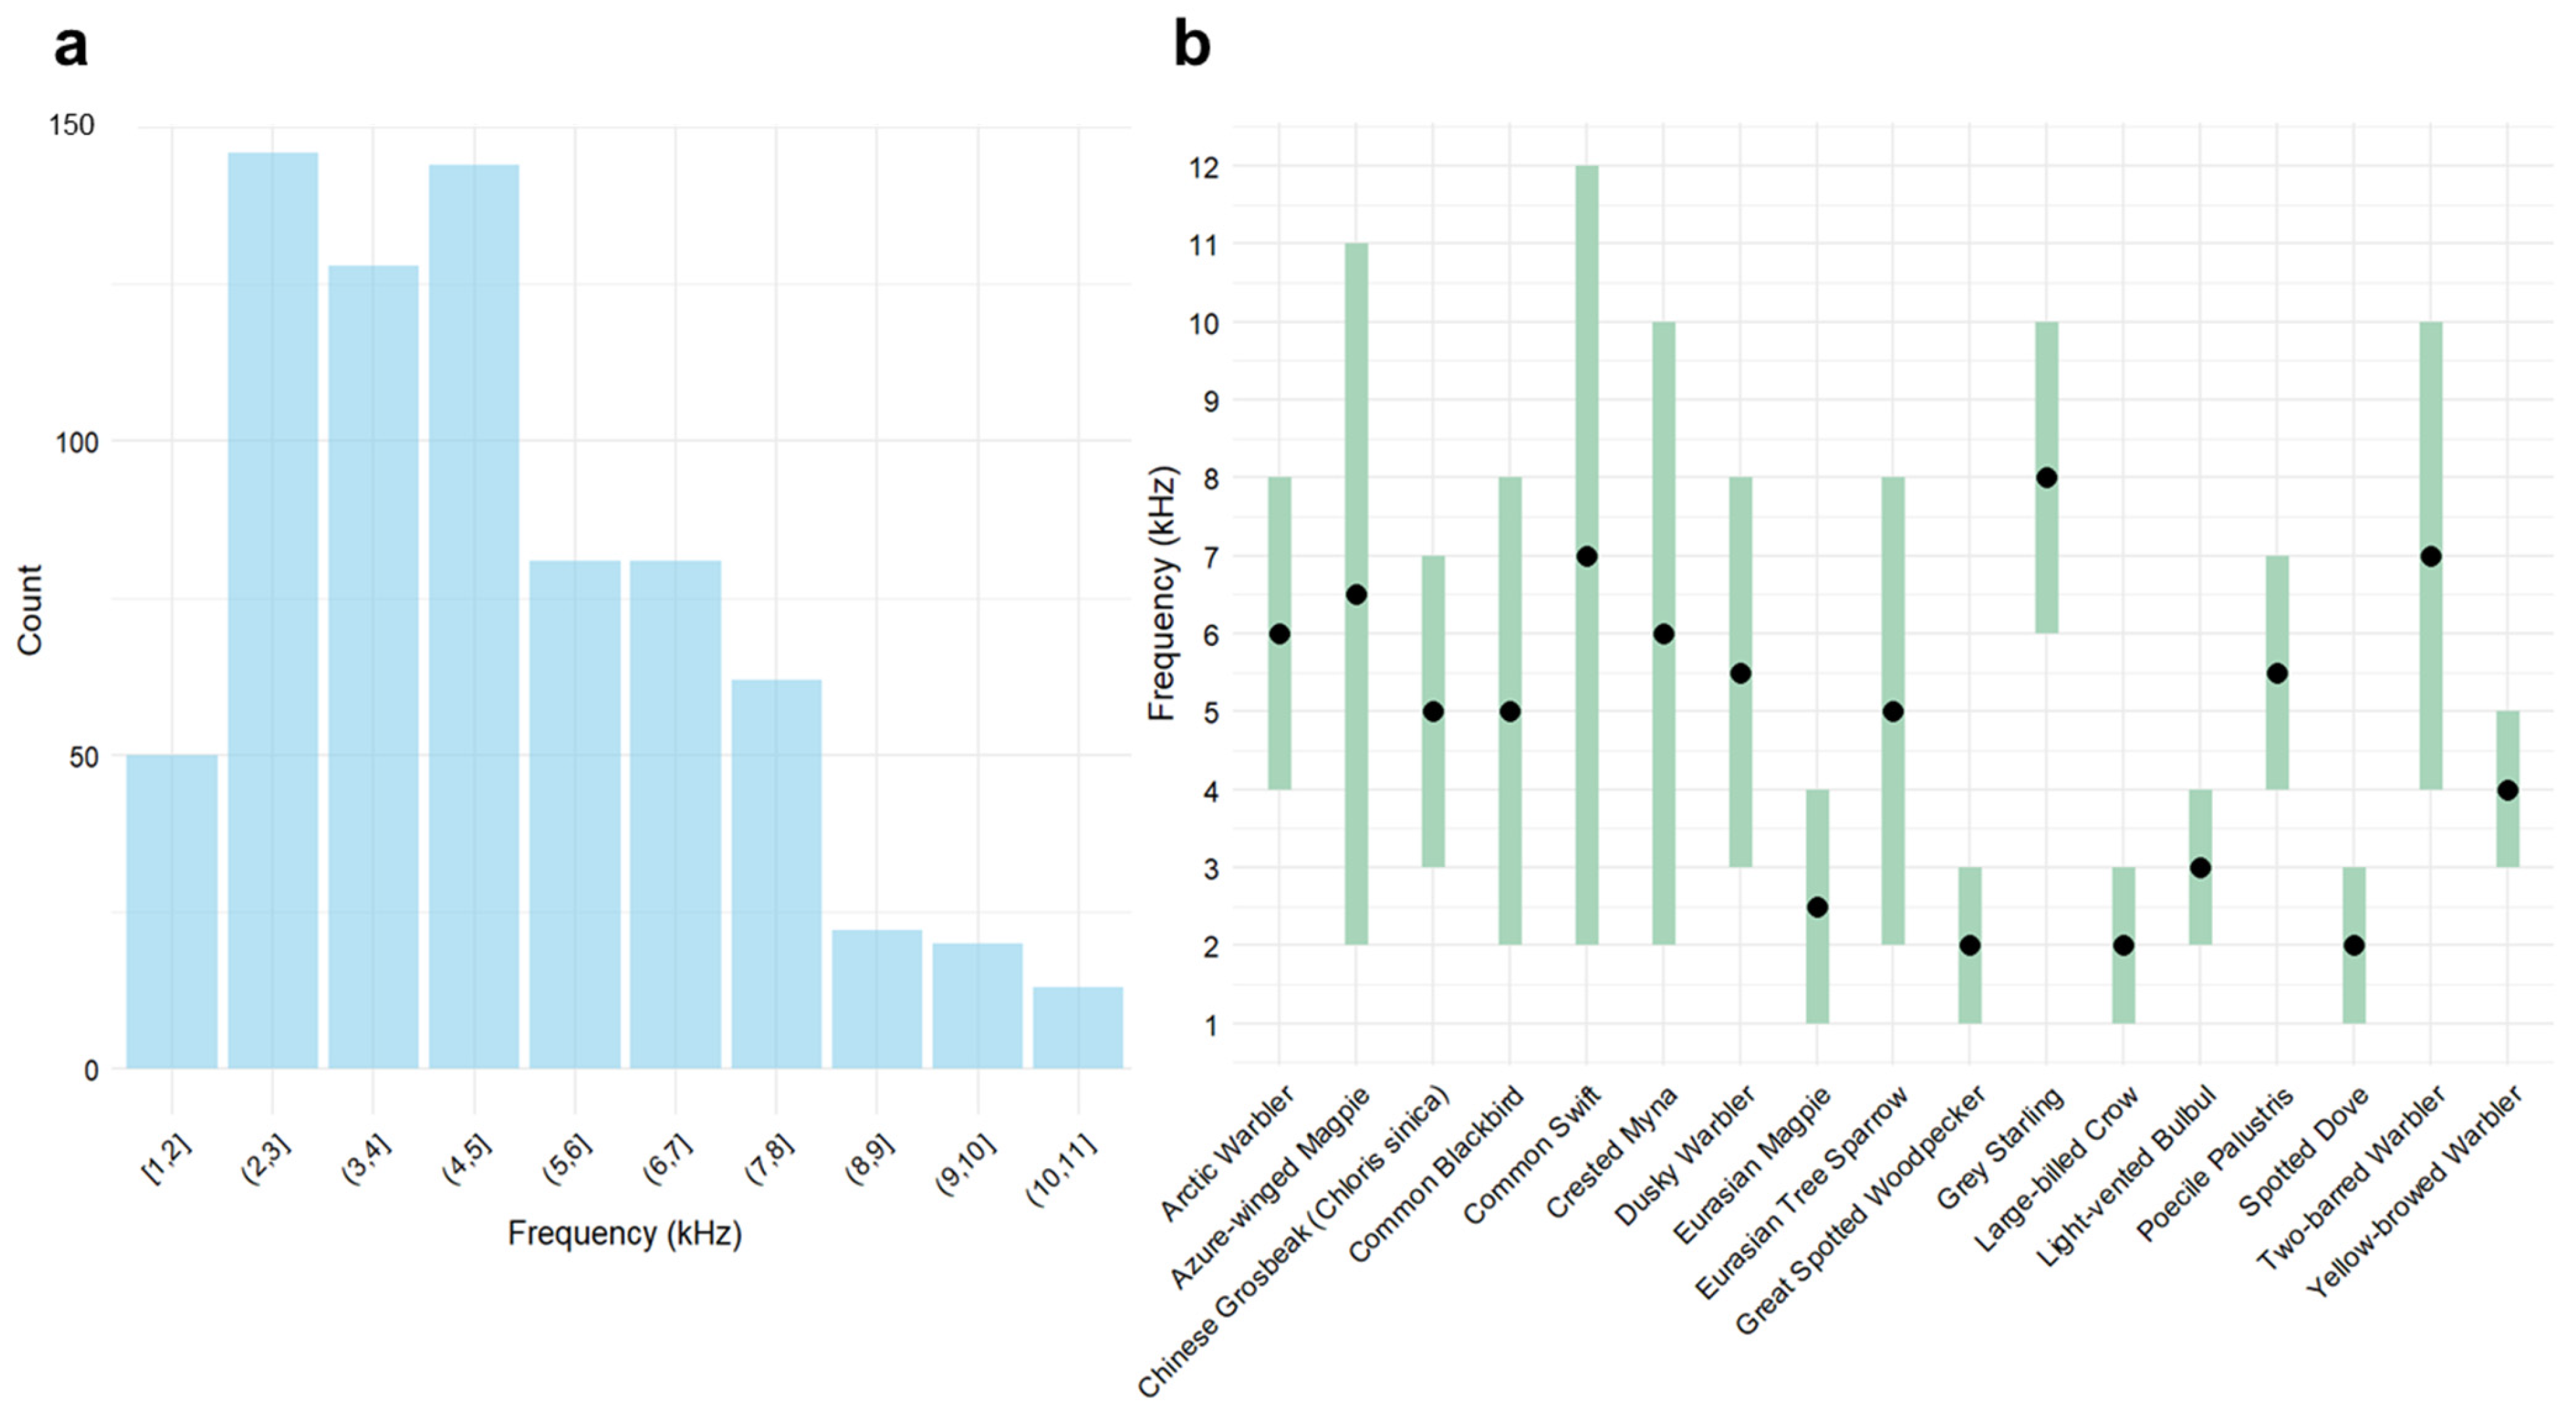
3.1. Acoustic Community Composition

3.1.1. Frequency Partitioning Patterns

The principal component analysis (PCA) of the 1–11 kHz frequency spectrum revealed distinct acoustic partitioning patterns (Figure 2). The first principal component (PC1) accounted for 70.2% of the total variance (p < 0.001), demonstrating an inverse relationship between the 1–2 kHz and the 2–11 kHz frequency ranges. PC2 explained an additional 17.7% variance (p < 0.001), resolving the biophonic frequency spectrum into three subclusters: 2–4 kHz (low frequency), 5–6 kHz (mid-frequency), and 6–11 kHz (high frequency). These spectral partitions likely represent distinct acoustic communities, with positive inter-cluster correlations suggesting complementary acoustic niche utilization within urban soundscapes.

3.1.2. Acoustic Niche Characterization

Our investigation results reveal that avian vocalizations span the entire 1–11 kHz range, with peak activities concentrated within 2–5 kHz (Figure 3a). In line with the Acoustic Niche Hypothesis (ANH), the variations in sound intensity at different frequencies within the soundscape reflect the information of different acoustic communities. To further elucidate the variation in sounds and their corresponding acoustic niches, we visualized the average frequency ranges of 20 common species (Figure 3b). The observed overlap in the acoustic niches of different species confirms the concentrated distribution of biophony niches, particularly among avian species. In the 1–2 kHz range, in addition to anthrophony, we recorded avian sounds from species such as the Eurasian magpie (Pica pica) and the Eurasian collared dove (Streptopelia decaocto), as well as amphibian calls from the black-spotted frog (Pelophylax nigromaculatus). Nevertheless, anthropogenic sounds remain the dominant noise source in this frequency range.
To further understand the occupation of acoustic space in urban forests from an intensity perspective, we visualized the proportion of the soundscape occupied by the 1–2 kHz, 2–5 kHz, and 5–11 kHz frequency bands throughout the day and mapped the corresponding shifts in the acoustic niches of typical species based on their vocalization frequencies (Figure 4).
The 1–2 kHz frequency range consistently accounted for the largest proportion of the soundscape throughout the day, reaching over 90%. This indicates that anthropogenic sounds—such as vehicle noise, human conversation, and public activities—dominate the urban park soundscape for most of the day. The primary vocalization frequencies of urban birds typically fall between 2.3 and 2.4 kHz [27], and they include the most common species in Beijing—the magpie (Pica pica) and the Oriental cuckoo (Cuculus micropterus). Their chorus contributes significantly to the dominance of biophony around dawn and dusk, when biophony takes up the highest proportion of the soundscape. However, the evening chorus in the 4–5 kHz range does not prominently feature in the overall soundscape, as it coincides with high levels of anthropogenic noise during this period. The 5–11 kHz range, while contributing minimal intensities to the soundscape, reflects the vocalization patterns of nocturnal insects that dominate the urban soundscape at night [28], such as crickets (Grylloidea) and bush crickets (Tettigoniidae). While insect sounds occur at higher frequencies than bird sounds, they emit lower intensities and exhibit distinct peak periods, indicating that each group occupies a different acoustic niche within the urban context.

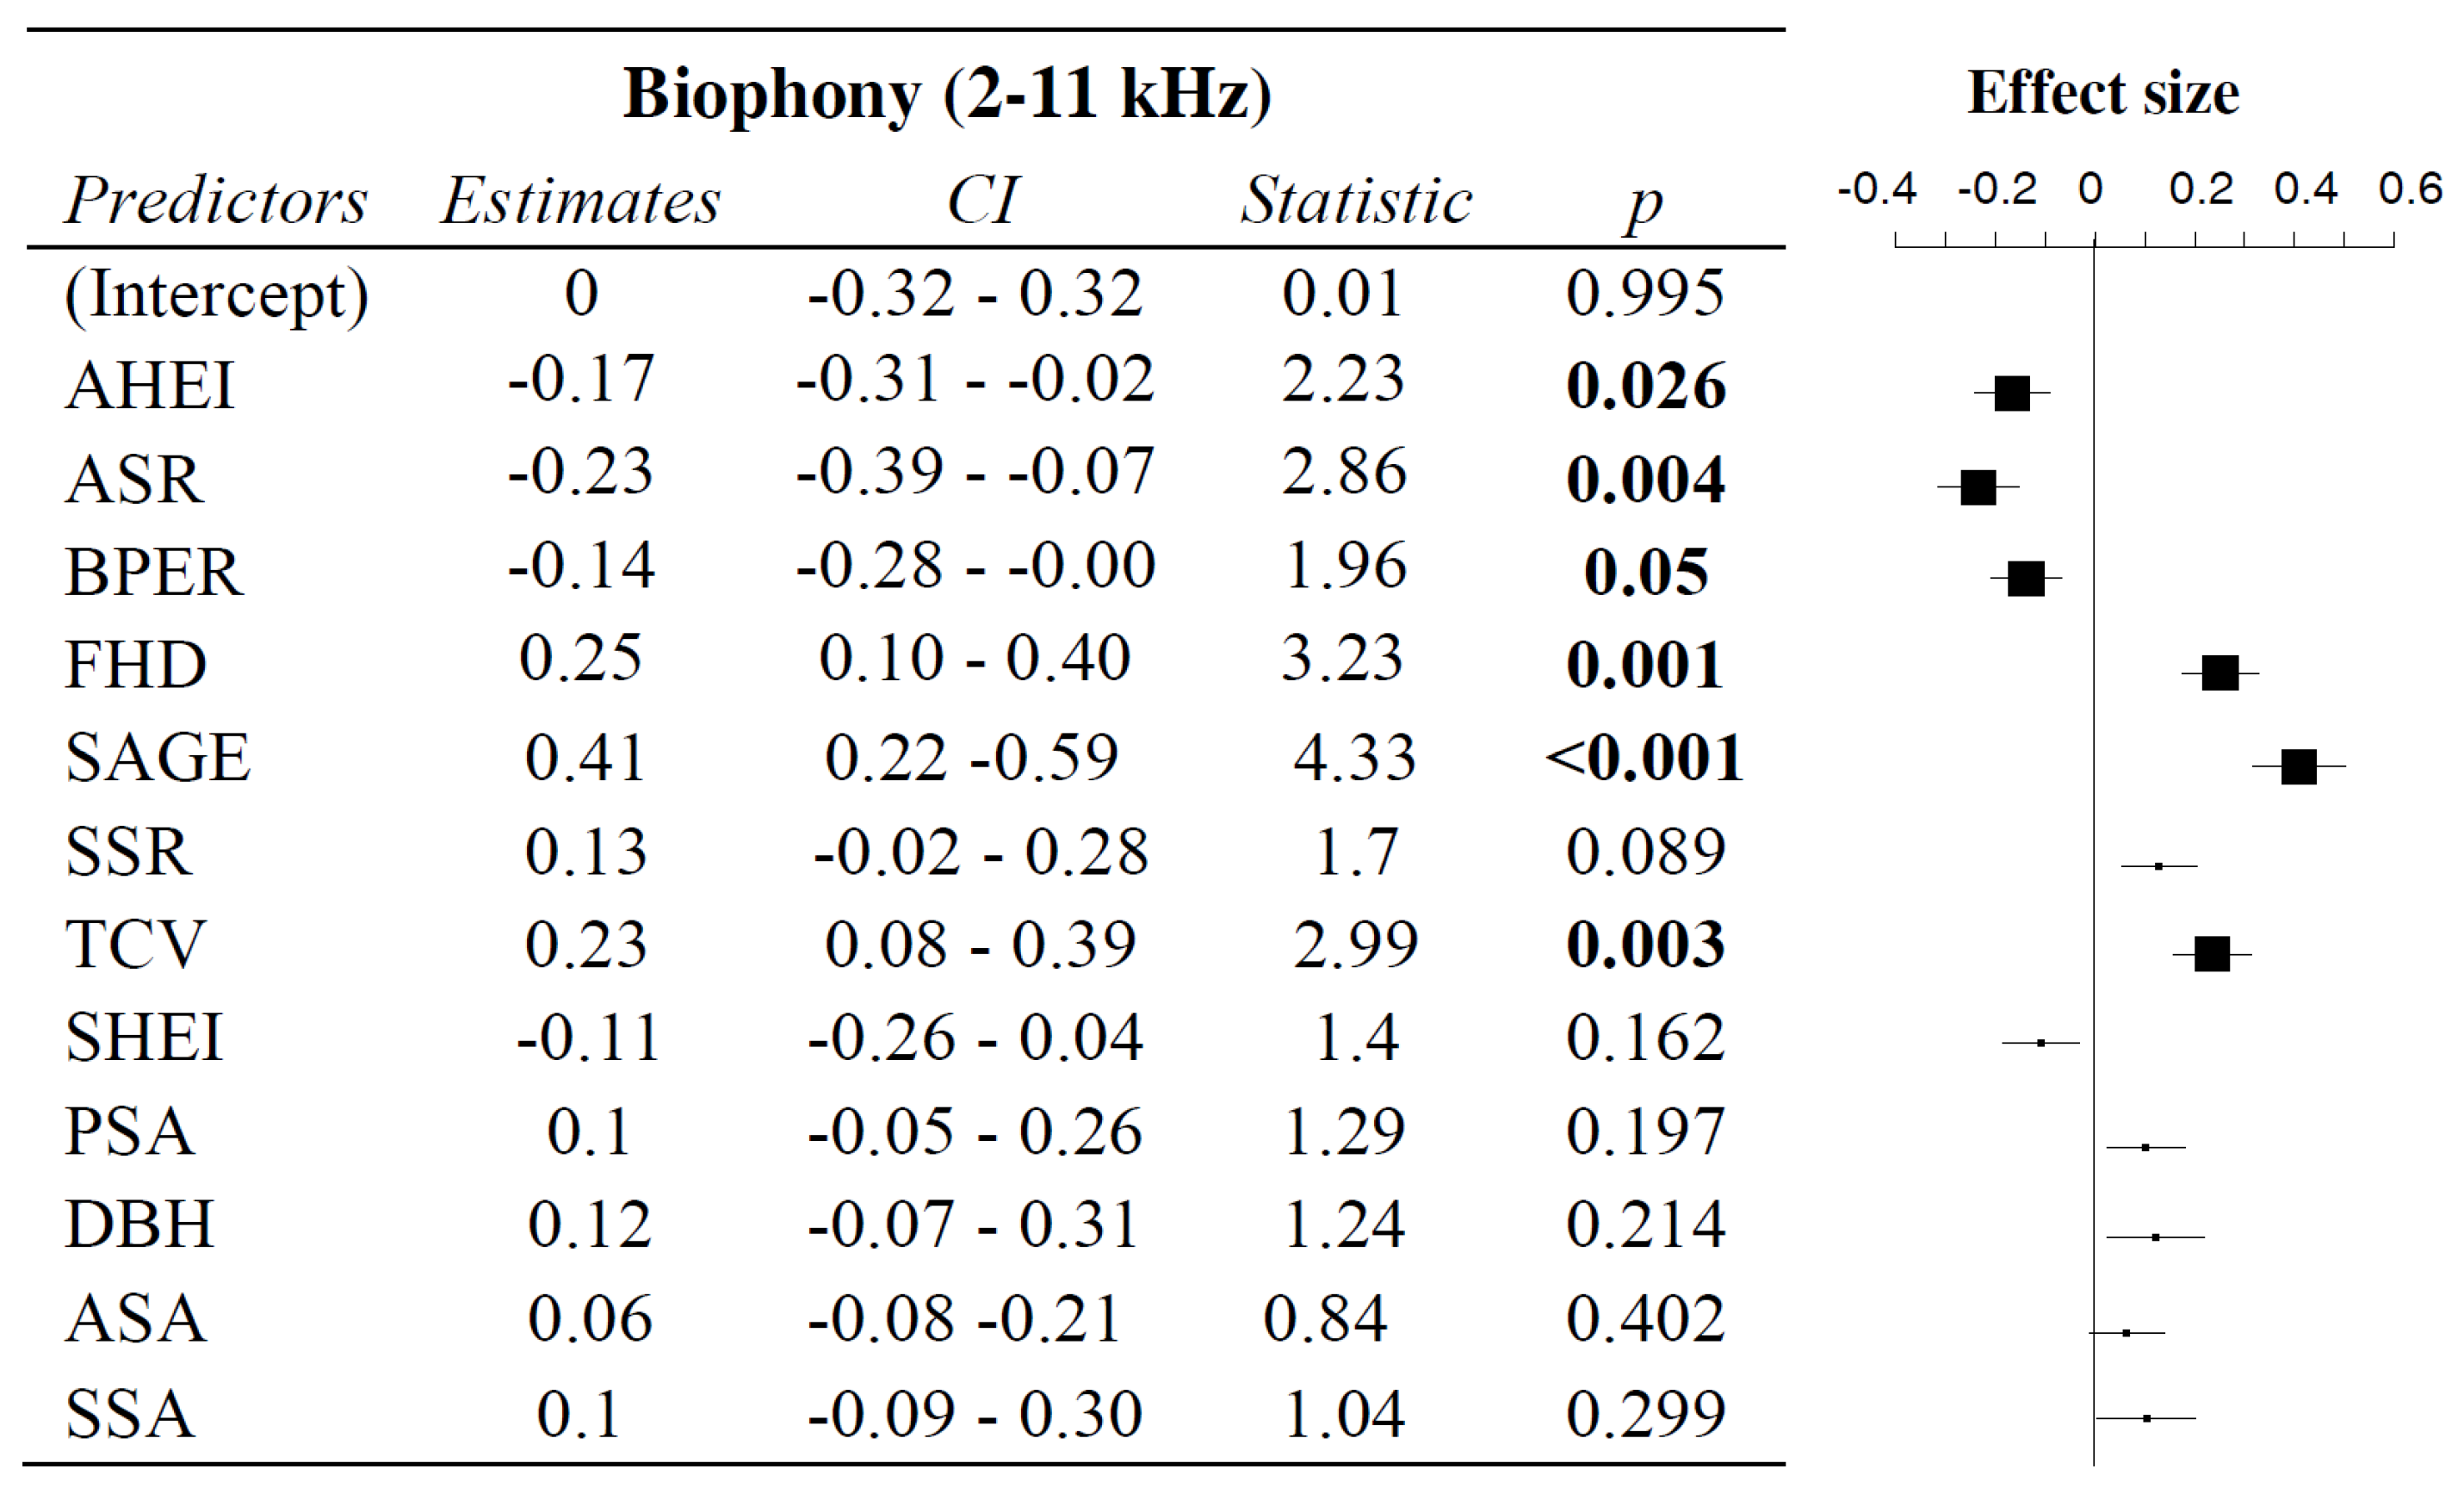
3.2. Influence of Vegetation Characteristics on Biophony

Linear mixed-model results show that the vegetation community explains a significant portion of the variation in biological sounds (R2_m = 0.43; R2_c = 0.68). The best models for explaining biophony include 19 models (delta < 2), and the final model averages 12 variables (Figure 5).
Vegetation community structure variables explain 69.4% of the model variance, with forest stand age (SAGE) being the most influential variable (19.9%). SAGE shows a significant positive effect on biophony, with older forests supporting higher biophony intensities. The vertical structure of the vegetation community has a significant positive effect on biophony. Richer vertical structures within the community lead to higher biophony PSD. Vertical structure variables—foliage height diversity (FHD, 12.2%) and tree height coefficient of variation (TCV, 11.4%)—are the second most influential in explaining the model’s variance following SAGE. Additionally, BPER has a significant negative impact on biophony.
The horizontal structure of the vegetation explains 30.6% of the model’s variance, with arbor species richness (ASR) contributing the most to the explanation within the horizontal layer (11.3%). However, unexpectedly, both ASR and the average arbor height (AHEI) show a slight negative effect on biophony.

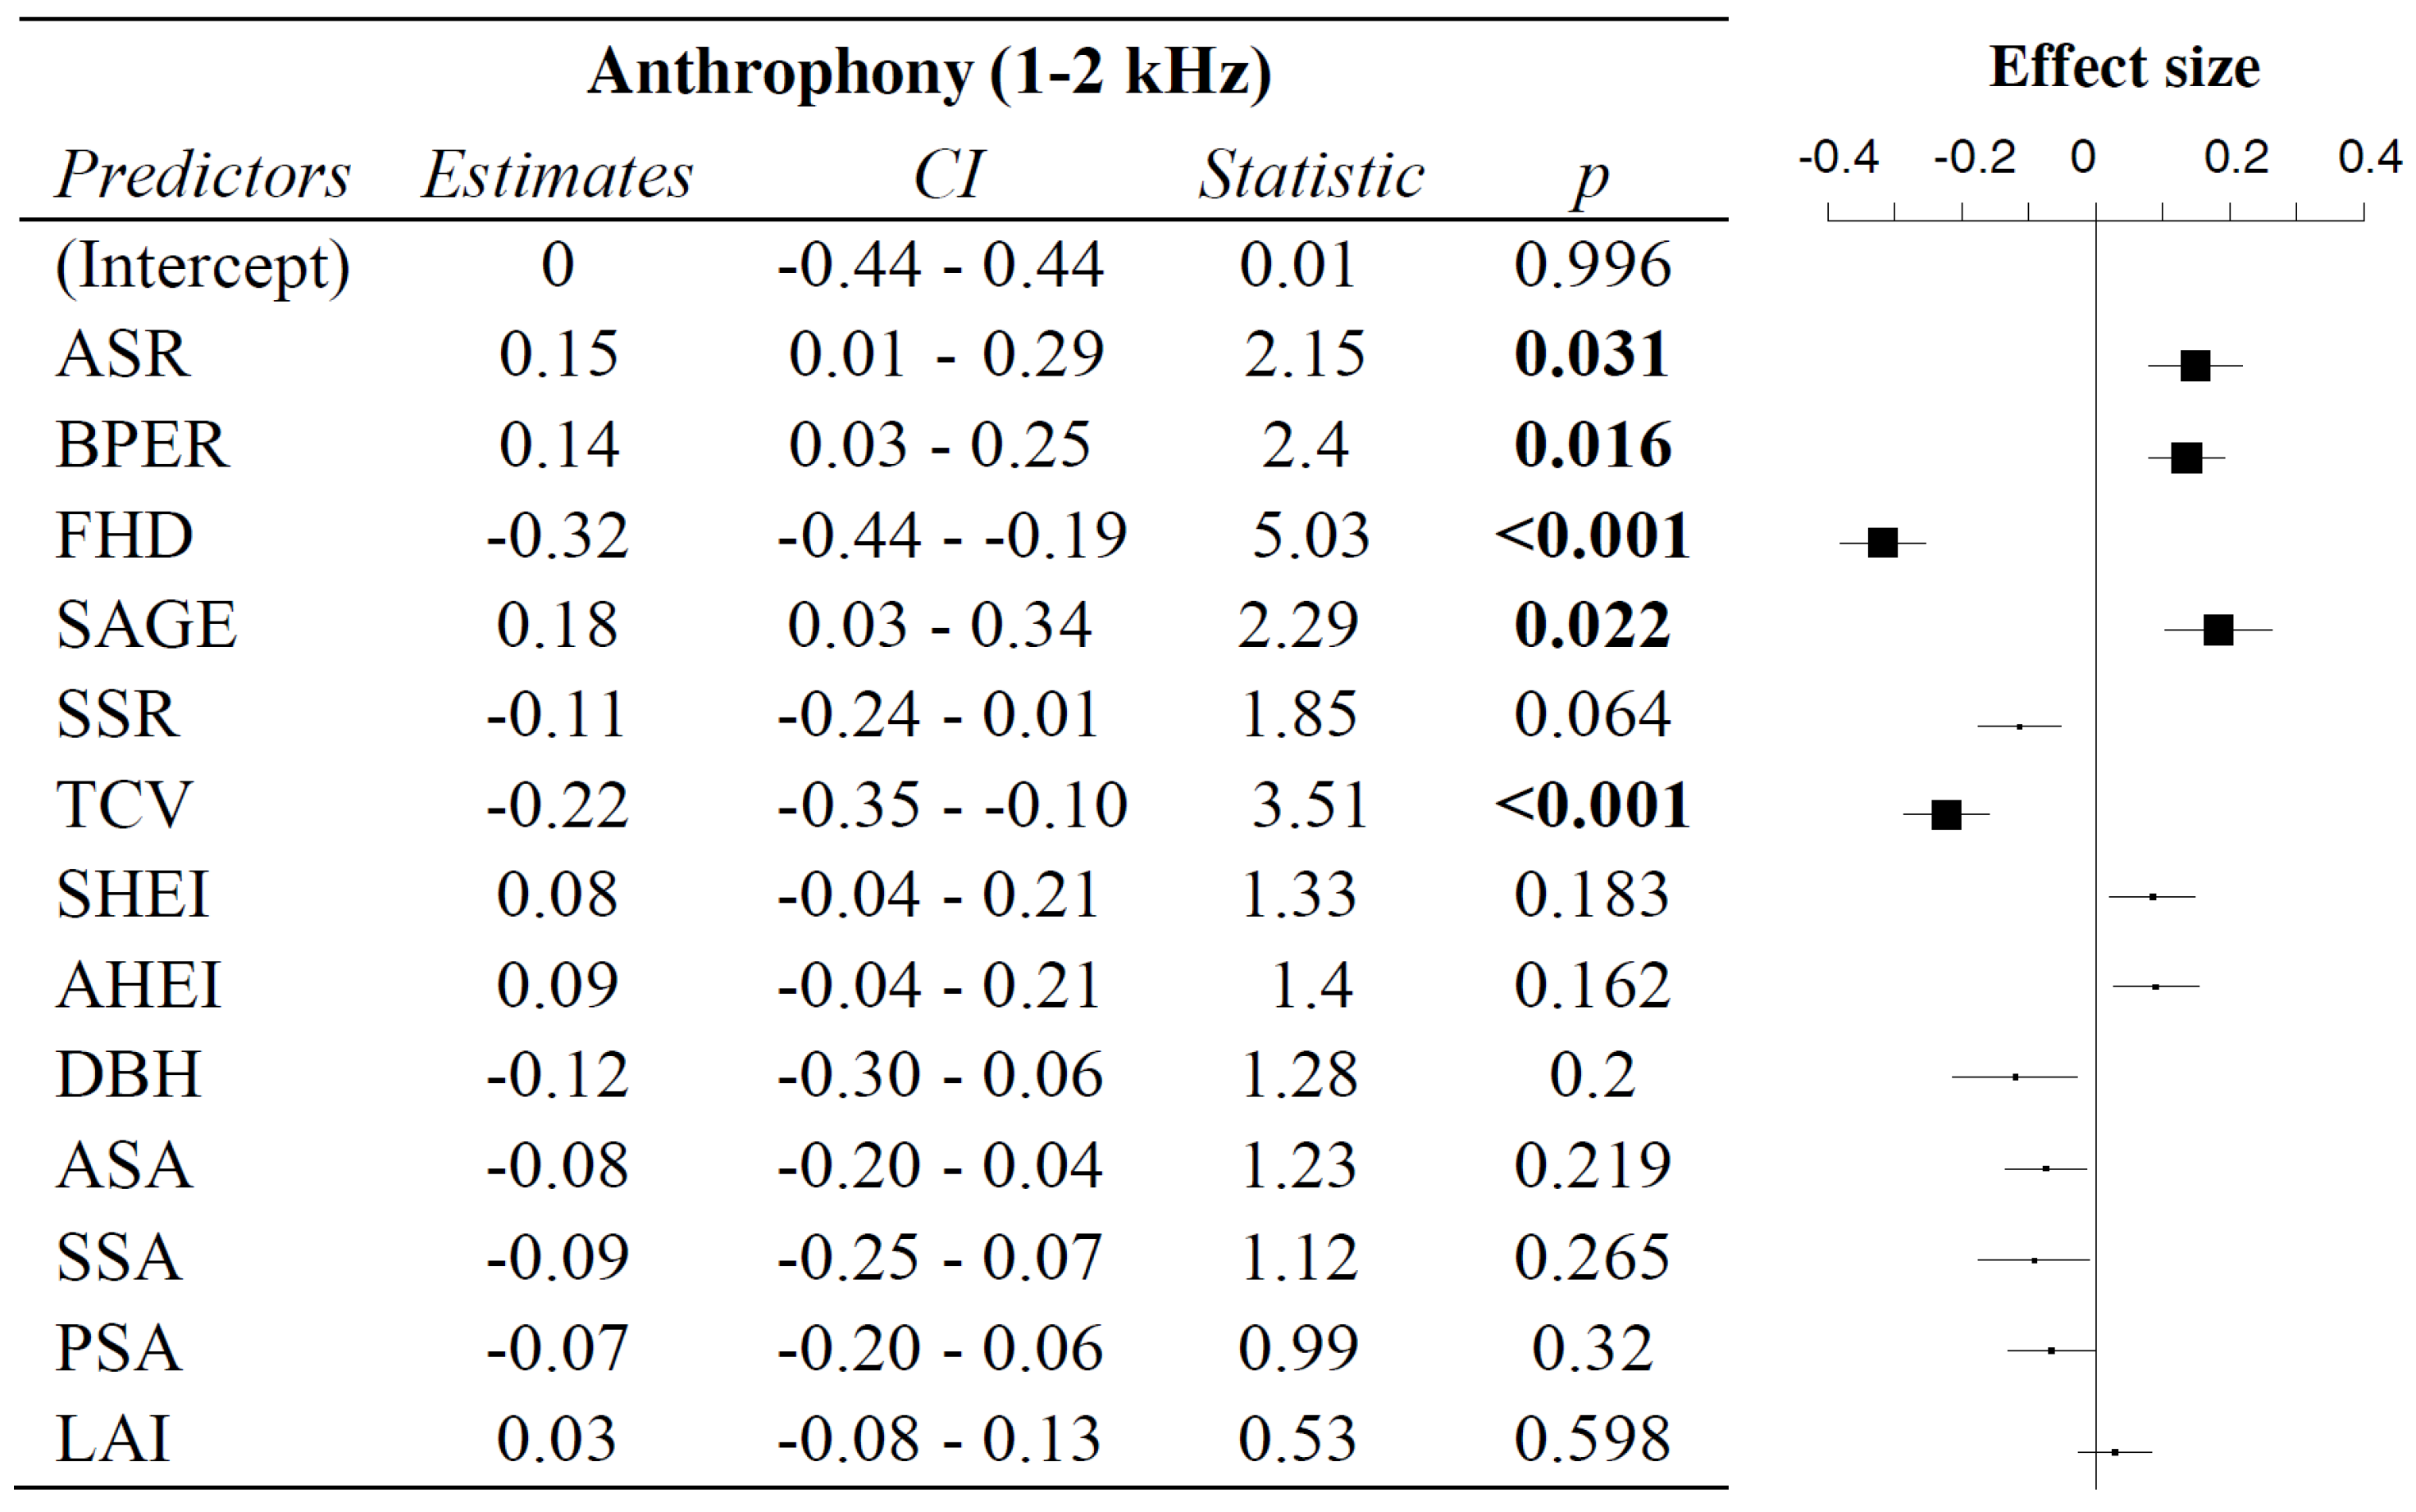
3.3. Influence of Vegetation Characteristics on Anthrophony

The regression model results between the vegetation community characteristics and PSD of anthrophony show that the vegetation community explains a relatively low proportion of the variation in anthrophony (R2_m = 0.20; R2_c = 0.46) (Figure 6). Among the 18 best models, 12 include vegetation variables.
The vertical structure of the vegetation—specifically the FHD and AHEI variation indices—explains 32.3% of the variance and is the most influential vegetation structure variable. Both variables exhibit a significant negative effect on the PSD of anthrophony. SAGE explains 10.9% of the model’s variance, with a significant positive impact on anthrophony PSD: Older forests tend to exhibit more anthrophony. In addition, tree species diversity and BPER also show a significant positive influence on the PSD of anthrophony. While Herb species richness (HSR) is not significant, it exhibits a slight negative effect on anthrophony.

3.4. Holistic Effects of Vegetation Characteristics on Soundscape

NDSI, analogously to the Normalized Difference Vegetation Index (NDVI)’s application in vegetation health assessments, quantifies the quantitative ratio of biophony to anthrophony as an indicator of acoustic environmental health [16,28]. Our mixed-effect modeling method revealed the substantial explanatory power of plant community parameters on NDSI variations (marginal R2 = 0.33; conditional R2 = 0.55). Model selection identified five top-ranked models (ΔAICc < 2), incorporating all 11 predictor variables (Table 1).
Structural vegetation characteristics emerged as the predominant driver, accounting for 74% of the explained variance (Figure 7). Key determinants included FHD (16.6% variance explained), TCV (12.6%), and mean diameter at breast height (DBH, 12.1%). Vertical complexity metrics (FHD and TCV) demonstrated significant positive associations with NDSI (p < 0.001). While the mean DBH positively influenced NDSI (p = 0.017), AHEI and SAGE exhibited counterintuitive negative relationships. BPER also exerted substantial negative impacts on NDSI (β = −0.20, p < 0.01), with each 1% increase correlating with a 0.19-unit NDSI reduction. Compositional variables explained 26% residual variance, where arbor species abundance (ASA) showed a positive correlation (β = 0.20, p = 0.018) in contrast to arbor species richness’s (ASR) negative effect (β = −0.16; p = 0.026).

4. Discussion

4.1. Vertical Vegetation Structure Provides Critical Support for Acoustic Communities

The foundational relationship between vegetation community structure and avian species diversity is well documented [29,30,31]. Avian species diversity is typically positively influenced by habitat heterogeneity, especially in forests, where greater vegetation complexity often provides more resources and nesting sites [32]. Our analysis extends this paradigm by demonstrating that vegetation structure can shape the acoustic information essential for urban wildlife, with communities having more complex vertical structures exhibiting higher biophony intensities.
Notably, habitats dominated by large-diameter trees with multi-layered structures showed concurrent increases in both biophony intensity and NDSI. Forest maturity emerged as the most influential factor affecting biophony PSD, exerting positive effects through its modulation of avian trophic organization [33,34]. Mature stands, characterized by complex structural attributes—including tree cavities, bark heterogeneity, and decaying wood—support not only avian populations but also diverse insect communities integral to acoustic ecosystems [35,36]. Historical urban parks (>200 years old) in Beijing, established through varied management strategies across temporal gradients serve as critical refugia for urban biodiversity by fostering stable, heterogeneous ecosystems [37]. These aged green spaces particularly benefit cavity-nesting species such as the common swift (Apus apus), which has historically utilized architectural crevices in ancient gatehouses and palace roofs for nesting. Our findings align with previous studies showing that structurally complex forests have greater availability with respect to food resources and more sheltered habitats, therefore better supporting avian nutritional conditions and diverse avian species, particularly species with distinct vocalization patterns adapted to different canopy layers [38,39]. This ecological trait-based perspective enhances our understanding of how biophony reflects avian community composition and habitat structure, reinforcing the importance of maintaining multi-layered vegetation in urban forest planning.
Paradoxically, while forest maturity enhances biophony intensity, it concurrently amplifies anthrophony levels. We speculate that this dual effect may arise from human preferences for landscapes featuring mature trees, particularly savanna-like parklands that attract recreational activities. Such anthropogenic pressures may degrade habitat suitability for urban wildlife despite the high ecological value of large old trees [40,41]. Consistent with prior studies demonstrating noise-induced vocal adjustments in wildlife [42,43,44], our observed negative SAGE-NDSI correlation suggests an ecological trade-off. Specifically, this relationship implies that despite the well-documented ecological value of mature trees [40,41], their role as anthropogenic attractors [45] leads to the disproportionate amplification of anthrophony relative to biophonic gains.
Our findings indicate a strong positive association between tree height diversity, foliage layering, and biophony, suggesting that while the absolute effectiveness of green barriers in noise reduction remains debated [46,47], they may support habitat security for vocal species by reducing direct human interference and expanding avian niche space [44,48]—their role in shaping soundscapes through physical and behavioral mechanisms warrants further investigation. We speculate that similar mechanisms may explain the biophonic enhancement associated with shrub and ground cover layers.
Bare ground exposure exerted deleterious impacts on soundscape health, with a 1% increase in unvegetated surface area corresponding to a 20% reduction in NDSI. These findings align with studies demonstrating that reduced understory cover diminishes avian communities and their sounds [49,50] and compromises ground-foraging species such as the common blackbird (Turdus merula) and the Eurasian tree sparrow (Passer montanus), which rely on soil-dwelling invertebrates and vegetative shelter [51,52]. The depletion of ground vegetation directly reduces food resources and nesting materials, ultimately driving the avian abandonment of degraded habitats. This phenomenon underscores the critical role of ground cover in sustaining urban acoustic communities.

4.2. Potential of Using Acoustic Methods Assessing Urban Forests

Our findings substantiate the potential of soundscape analysis as an effective tool for assessing biodiversity and ecological functionality. We not only explored the effectiveness of acoustic indices in reflecting acoustic communities’ activities but also revealed the interactions between vegetation community structure and the acoustic environment, thereby providing a novel perspective for future urban forest assessments. Acoustic indices quantify the sounds captured by digital recorders by analyzing variations in key sound properties such as amplitude, frequency, and duration to estimate the diversity of acoustic communities [53]. Although these indices serve as practical tools for investigating various ecological processes and assessing biodiversity, no single index can yet fully characterize the entire acoustic environment. The varying responses of different acoustic indices to forest structure variables reveal their distinct capacities for explaining diverse acoustic conditions [54].
Our study further supports the potential of acoustic indices as valuable tools for evaluating biodiversity and ecosystem functions. As proposed in ref. [8], acoustic signals not only reflect biological composition and diversity within ecosystems but also have critical functions in animal navigation and resource localization. Organisms utilize bioacoustic information to obtain crucial data about food sources, habitat suitability, and conspecific locations—information that fundamentally influences habitat selection and behavioral ecology. Our analysis reveals that the spatiotemporal distribution of bioacoustic communities (avian choruses and arthropod soundscapes) across different temporal periods and frequency bands reflects species-specific spatial resource utilization and acoustic ecological niche partitioning, thereby demonstrating the multifaceted role of soundscapes as biological information carriers.
The observed correlations between vegetation structure and acoustic indices align with established relationships between habitat heterogeneity and avian richness [55,56,57] (as previously discussed in Section 4.1). We posit that soundscapes function as informational media, enabling organisms to translate environmental signals into actionable ecological data. This mechanism proves to be particularly critical in dense urban forests and shrublands where visual cues are less effective [8]. For instance, acoustic communication dominates in understory layers where limited light penetration allows species to maintain resource-securing behaviors despite sensory limitations.
We believe that the soundscape paradigm offers dual benefits as a biodiversity indicator and a scientific foundation for urban ecological management strategies. Through systematic evaluation using acoustic indices, urban forest ecosystems can be continuously monitored for environmental changes, enabling the early detection of ecological stressors and data-driven decision making for sustainable urban development. Future research should integrate multidimensional acoustic data with vegetation structural parameters and microclimatic variables to develop refined ecological assessment models, ultimately enhancing the efficacy of urban forest management practices.

4.3. Acoustic Data-Driven Urban Forest Management Framework

The intensification of urbanization indicates the critical need for advanced management strategies that address both ecological and societal dimensions of urban forests. While traditional approaches have focused predominantly on visual landscape optimization, contemporary ecological understanding recognizes soundscape dynamics as integral to ecosystem functionality and human wellbeing [8,58]. Integrating acoustic methodologies into urban forest management to develop a comprehensive soundscape-based management framework has become a crucial approach to enhancing urban forest ecological functions and improving public welfare. The emphasis on vertical stratification should not be interpreted as advocating homogeneous multi-layered forests. Over-implementation could disadvantage species reliant on open canopies (e.g., some raptors) or shrub-free understories (e.g., ground-nesting birds). Management should balance structural complexity with habitat heterogeneity to preserve urban ecological networks.
Based on our findings regarding the relationship between acoustic communities and vegetation community structure, we propose that central to this framework is the designation of urban Acoustic Ecological Reserves targeting mature forest stands (especially those >30 years old) with multi-layered vertical structures. These reserves prioritize the conservation of heterogeneous-aged stands through strategic retention of snags and optimization of shrub layer coverage, enhancing foliage height diversity to stabilize avian soundscapes (2–5 kHz PSD). Strategies such as preserving standing deadwood and increasing shrub layer coverage to enhance leaf-height diversity can further support these conservation efforts. To mitigate pervasive low-frequency urban noise (<1 kHz), our results support a dual-phase noise attenuation system. Vertical scattering barriers composed of broadleaf shrubs with varying crown heights have been proposed as a potential strategy for mitigating noise pollution [59,60,61]. Previous studies indicate that vegetation can diffuse and weaken sound waves within specific frequency ranges [59], and they can also absorb sound through visco-thermal boundary effects around their organs, which is influenced by leaf area density [62]. The tall canopies of broad-leaved tree species (expansive growth forms) can further contribute to noise reduction [63]. For example, Ow and Ghosh reported that medium-density to high-density roadside vegetation barriers can lower traffic noise by 9–11 dB (A-weighted) [64]. Moreover, medium-density and high-density urban green spaces have been shown to significantly enhance acoustic comfort perceptions [65], reinforcing the value of integrating vegetation-based noise reduction strategies into urban planning. However, the absolute effectiveness of green barriers remains debated [46,47], as their noise-mitigating potential is highly dependent on vegetation density, volume, and species composition; suboptimal configurations may compromise their efficacy.
Furthermore, the development of a dynamic soundscape regulation system could be pivotal for managing and optimizing urban forests from an acoustic perspective. Establishing a “monitoring-warning-intervention” closed-loop framework would enable real-time adjustments to the acoustic environment. This approach could include constructing an acoustic fingerprint database for the real-time identification of dominant sound sources using Mel-frequency cepstral coefficient feature extraction. Additionally, integrating a three-dimensional soundscape model within a GIS platform would allow for future advancements in multi-physical field optimization, as coupling urban heat island data with soundscape information could pave the way for a collaborative model of sound, heat, and ecological processes—driving urban forest management into a new era of multidimensional regulation.

4.4. Limitation

While this study provides insights into vegetation–soundscape relationships, several limitations warrant consideration. First, the seasonal scope—focusing solely on spring—may limit the generalizability of management recommendations. Seasonal shifts in avian vocal activity (e.g., breeding vs. migration periods) could alter soundscape dynamics. While our spring-centric design prioritized minimizing confounding variables, multi-seasonal validation is critical to ensure robust, year-round urban forestry guidelines.
In addition, our frequency-based partitioning of biophony (2–11 kHz) and anthropophony (1–2 kHz) may not fully resolve spectral overlaps in environments with prominent human vocalizations or machinery exceeding 2 kHz. Although our springtime recordings in urban parks showed minimal human speech contamination in the 2–11 kHz range, this approach could misclassify overlapping signals in noisier seasons or regions. Second, excluding frequencies <1 kHz (wind-dominated in our dataset) risks omitting low-frequency anthropophony (e.g., HVAC systems) that may intermittently occur in urban forests. While this trade-off enhanced the cost-efficiency of large-scale surveys, it limits the resolutions for low-frequency noise management. Future work should integrate machine learning classifiers to automate soundscape partitioning without sacrificing accuracy, a direction we are actively pursuing. These methodological choices reflect our focus on rapid, low-cost urban ecosystem monitoring, but caution is advised when extrapolating results to acoustically complex or non-temperate environments.

5. Conclusions

This study highlights the critical role of vegetation structure in shaping urban soundscapes by potentially mediating the balance between biophony and anthrophony. We identified distinct frequency clusters representing anthropogenic and biological sound sources, reinforcing the concept of the acoustic niche. Linear mixed models further demonstrated that mature tree stands and complex vertical structures significantly enhance biophonic activity while attenuating anthropogenic noise.
Our findings underscore the ecological value of multi-layered vegetation in urban forests, emphasizing that soundscape composition is not only a product of species interactions but also a function of forest structural attributes. Our study contributes to the growing body of research advocating for soundscape-informed urban planning and management, emphasizing the role of vegetation architecture in shaping acoustic communities. By prioritizing soundscape ecology in urban forestry strategies, city planners and ecologists can foster more ecologically functional and acoustically harmonious green spaces.

Supplementary Materials

The following supporting information can be downloaded at: https://www.mdpi.com/article/10.3390/f16040669/s1, Supplementary R Code.

Author Contributions

Conceptualization, Y.Z. and C.W.; methodology, Y.Z.; software, Y.Z. and Z.B.; validation, Y.Z., Z.S., J.J. and Z.B.; formal analysis, Y.Z.; investigation, Y.Z., J.J. and Z.B.; resources, Y.Z. and C.W.; data curation, Y.Z.; writing—original draft preparation, Y.Z.; writing—review and editing, Y.Z.; visualization, Y.Z.; supervision, C.W.; project administration, Y.Z. and C.W.; funding acquisition, Y.Z., Z.S. and C.W. All authors have read and agreed to the published version of the manuscript.

Funding

This research was funded by the National Key Research and Development Program “Intergovernmental international cooperation in science, technology and innovation” (2021YFE0193200), the Natural Science Foundation of Beijing, China (No. 5244042), and the Postdoctoral Research Foundation of Shunde Innovation School of University of Science and Technology Beijing (2024BH002).

Data Availability Statement

The data presented in this study are available on request from the corresponding author.

Conflicts of Interest

The authors declare no conflicts of interest.

Appendix A

Figure A1. Twenty sampled urban parks in Beijing City, China.
Forests 16 00669 g0a1
Table A1. Variables of the vegetation units in the study area.
VariablesAbbreviationDescription
Arbor species richnessASRNumber of tree species in the sample plot
Shrub species richnessSSRNumber of shrub species in the sample plot
Herb species richness *HSR *Number of herbaceous species in the sample plot
Total plant species richness *PSR *Total number of plant species in the sample plot
Arbor species abundanceASANumber of trees in the sample plot
Shrub species abundanceSSANumber of shrubs in the sample plot
Total plant species abundancePSATotal number of plants in the sample plot
Mean diameter at breast height (m)DBHAverage diameter at breast height of trees in the sample plot
Leaf area indexLAIThe total leaf area of plants per unit area of land
Arbor height (m)AHEIAverage height of trees in the sample plot
Shrub height (m)SHEIAverage height of shrubs in the sample plot
Bare ground percentage (%)BPERPercentage of bare ground in the sample plot
Stand age (Year)SAGEAverage age of trees within each diameter structure
Foliage height diversityFHDThe vertical structural diversity of vegetation at a location
Tree height coefficient of variationTCVDifferences in tree height within a specific stand, reflecting vertical structural complexity
Note: * indicates that the variable is not finally included in the model’s analysis.

References

  1. Burivalova, Z.; Towsey, M.; Boucher, T.; Truskinger, A.; Apelis, C.; Roe, P.; Game, E.T. Using Soundscapes to Detect Variable Degrees of Human Influence on Tropical Forests in Papua New Guinea. Conserv. Biol. 2018, 32, 205–215. [Google Scholar] [CrossRef]
  2. World Bank. World Bank Forests for People, the Planet and Climate; World Bank: Washington, DC, USA, 2020. [Google Scholar]
  3. Pei, N.; Wang, C.; Sun, R.; Xu, X.; He, Q.; Shi, X.; Gu, L.; Jin, J.; Liao, J.; Li, J.; et al. Towards an Integrated Research Approach for Urban Forestry: The Case of China. Urban For. Urban Green. 2019, 46, 126472. [Google Scholar] [CrossRef]
  4. Xu, F.; Wang, X.; Li, L. NPP and Vegetation Carbon Sink Capacity Estimation of Urban Green Space Using the Optimized CASA Model: A Case Study of Five Chinese Cities. Atmosphere 2023, 14, 1161. [Google Scholar] [CrossRef]
  5. Queiroz, H.L.; Sobanski, M.B.; Magurran, A.E. Reproductive Strategies of Red-Bellied Piranha (Pygocentrus Nattereri Kner, 1858) in the White Waters of the Mamirauá Flooded Forest, Central Brazilian Amazon. Environ. Biol. Fishes 2010, 89, 11–19. [Google Scholar] [CrossRef]
  6. Fassnacht, F.E.; White, J.C.; Wulder, M.A.; Næsset, E. Remote Sensing in Forestry: Current Challenges, Considerations and Directions. For. Int. J. For. Res. 2024, 97, 11–37. [Google Scholar] [CrossRef]
  7. Sueur, J.; Farina, A. Ecoacoustics: The Ecological Investigation and Interpretation of Environmental Sound. Biosemiotics 2015, 8, 493–502. [Google Scholar] [CrossRef]
  8. Pijanowski, B.C.; Villanueva-Rivera, L.J.; Dumyahn, S.L.; Farina, A.; Krause, B.L.; Napoletano, B.M.; Gage, S.H.; Pieretti, N. Soundscape Ecology: The Science of Sound in the Landscape. BioScience 2011, 61, 203–216. [Google Scholar] [CrossRef]
  9. He, X.; Deng, Y.; Dong, A.; Lin, L. The Relationship between Acoustic Indices, Vegetation, and Topographic Characteristics Is Spatially Dependent in a Tropical Forest in Southwestern China. Ecol. Indic. 2022, 142, 109229. [Google Scholar] [CrossRef]
  10. Skowno, A.L.; Bond, W.J. Bird Community Composition in an Actively Managed Savanna Reserve, Importance of Vegetation Structure and Vegetation Composition. Biodivers. Conserv. 2003, 12, 2279–2294. [Google Scholar] [CrossRef]
  11. Davison, C.W.; Assmann, J.J.; Normand, S.; Rahbek, C.; Morueta-Holme, N. Vegetation Structure from LiDAR Explains the Local Richness of Birds across Denmark. J. Anim. Ecol. 2023, 92, 1332–1344. [Google Scholar] [CrossRef]
  12. Do Nascimento, L.A.; Campos-Cerqueira, M.; Beard, K.H. Acoustic Metrics Predict Habitat Type and Vegetation Structure in the Amazon. Ecol. Indic. 2020, 117, 106679. [Google Scholar] [CrossRef]
  13. Farina, A.; James, P. The Acoustic Communities: Definition, Description and Ecological Role. Biosystems 2016, 147, 11–20. [Google Scholar] [CrossRef]
  14. Tucker, D.; Gage, S.H.; Williamson, I.; Fuller, S. Linking Ecological Condition and the Soundscape in Fragmented Australian Forests. Landsc. Ecol. 2014, 29, 745–758. [Google Scholar] [CrossRef]
  15. Bradfer-Lawrence, T.; Gardner, N.; Bunnefeld, L.; Bunnefeld, N.; Willis, S.G.; Dent, D.H. Guidelines for the Use of Acoustic Indices in Environmental Research. Methods Ecol. Evol. 2019, 10, 1796–1807. [Google Scholar] [CrossRef]
  16. Zhao, Y.; Sheppard, S.; Sun, Z.; Hao, Z.; Jin, J.; Bai, Z.; Bian, Q.; Wang, C. Soundscapes of Urban Parks: An Innovative Approach for Ecosystem Monitoring and Adaptive Management. Urban For. Urban Green. 2022, 71, 127555. [Google Scholar] [CrossRef]
  17. Krause, B. Bioacoustics, Habitat Ambience in Ecological Balance. Whole Earth Rev. 1987, 57, 14–18. [Google Scholar]
  18. Zhou, D.; Chu, L.M. How Would Size, Age, Human Disturbance, and Vegetation Structure Affect Bird Communities of Urban Parks in Different Seasons? J. Ornithol. 2012, 153, 1101–1112. [Google Scholar] [CrossRef]
  19. Karaconstantis, C.; Desjonquères, C.; Gifford, T.; Linke, S. Spatio-temporal Heterogeneity in River Sounds: Disentangling Micro-and Macro-Variation in a Chain of Waterholes. Freshw. Biol. 2020, 65, 96–106. [Google Scholar] [CrossRef]
  20. Condit, R. Tropical Forest Census Plots: Methods and Results from Barro Colorado Island, Panama and a Comparison with Other Plots; Springer Science & Business Media: Berlin/Heidelberg, Germany, 1998; ISBN 978-3-540-64144-5. [Google Scholar]
  21. Farina, A.; Gage, S.H. Ecoacoustics: The Ecological Role of Sounds; John Wiley & Sons: Hoboken, NJ, USA, 2017; ISBN 1-119-23069-1. [Google Scholar]
  22. Pijanowski, B.C.; Farina, A.; Gage, S.H.; Dumyahn, S.L.; Krause, B.L. What Is Soundscape Ecology? An Introduction and Overview of an Emerging New Science. Landsc. Ecol. 2011, 26, 1213–1232. [Google Scholar] [CrossRef]
  23. Lawrence, B.T.; Hornberg, J.; Haselhoff, T.; Sutcliffe, R.; Ahmed, S.; Moebus, S.; Gruehn, D. A Widened Array of Metrics (WAM) Approach to Characterize the Urban Acoustic Environment; a Case Comparison of Urban Mixed-Use and Forest. Appl. Acoust. 2022, 185, 108387. [Google Scholar] [CrossRef]
  24. Gewers, F.L.; Ferreira, G.R.; Arruda, H.F.D.; Silva, F.N.; Comin, C.H.; Amancio, D.R.; Costa, L.D.F. Principal Component Analysis: A Natural Approach to Data Exploration. ACM Comput. Surv. 2021, 54, 70:1–70:34. [Google Scholar] [CrossRef]
  25. Zuur, A.F.; Ieno, E.N.; Walker, N.; Saveliev, A.A.; Smith, G.M. Mixed Effects Models and Extensions in Ecology with R, Statistics for Biology and Health; Springer: New York, NY, USA, 2009. [Google Scholar] [CrossRef]
  26. Nakagawa, S.; Johnson, P.C.D.; Schielzeth, H. The Coefficient of Determination R2 and Intra-Class Correlation Coefficient from Generalized Linear Mixed-Effects Models Revisited and Expanded. J. R. Soc. Interface 2017, 13, 20170213. [Google Scholar] [CrossRef]
  27. Nemeth, E.; Pieretti, N.; Zollinger, S.A.; Geberzahn, N.; Partecke, J.; Miranda, A.C.; Brumm, H. Bird Song and Anthropogenic Noise: Vocal Constraints May Explain Why Birds Sing Higher-Frequency Songs in Cities. Proc. R. Soc. B Biol. Sci. 2013, 280, 20122798. [Google Scholar] [CrossRef]
  28. Gage, S.H.; Axel, A.C. Visualization of Temporal Change in Soundscape Power of a Michigan Lake Habitat over a 4-Year Period. Ecol. Inform. 2014, 21, 100–109. [Google Scholar] [CrossRef]
  29. Basile, M.; Storch, I.; Mikusiński, G. Abundance, Species Richness and Diversity of Forest Bird Assemblages—The Relative Importance of Habitat Structures and Landscape Context. Ecol. Indic. 2021, 133, 108402. [Google Scholar] [CrossRef]
  30. Gonthier, D.J.; Ennis, K.K.; Farinas, S.; Hsieh, H.-Y.; Iverson, A.L.; Batáry, P.; Rudolphi, J.; Tscharntke, T.; Cardinale, B.J.; Perfecto, I. Biodiversity Conservation in Agriculture Requires a Multi-Scale Approach. Proc. R. Soc. B Biol. Sci. 2014, 281, 20141358. [Google Scholar] [CrossRef]
  31. MacArthur, R.H. Environmental Factors Affecting Bird Species Diversity. Am. Nat. 1964, 98, 387–397. [Google Scholar] [CrossRef]
  32. Tews, J.; Brose, U.; Grimm, V.; Tielbörger, K.; Wichmann, M.C.; Schwager, M.; Jeltsch, F. Animal Species Diversity Driven by Habitat Heterogeneity/Diversity: The Importance of Keystone Structures. J. Biogeogr. 2004, 31, 79–92. [Google Scholar] [CrossRef]
  33. Nikolov, S.C. Effect of Stand Age on Bird Communities in Late-Successional Macedonian Pine Forests in Bulgaria. For. Ecol. Manag. 2009, 257, 580–587. [Google Scholar] [CrossRef]
  34. Reise, J.; Kukulka, F.; Flade, M.; Winter, S. Characterising the Richness and Diversity of Forest Bird Species Using National Forest Inventory Data in Germany. For. Ecol. Manag. 2019, 432, 799–811. [Google Scholar] [CrossRef]
  35. Kebrle, D.; Hofmeister, J.; Kodet, V.; Hošek, J. Rare Birds Benefit from the Maturation of Central European Production Forests Unless These Are Limited by Spruce Dominance. SSRN 2023. [Google Scholar] [CrossRef]
  36. Szarvas, F.; Hanzelka, J.; Reif, J.; Voříšek, P.; Vermouzek, Z.; Michálek, J. Ecological Traits Predict Habitat Associations in Central European Forest Birds: Implications for Forest Management. SSRN 2025. [Google Scholar] [CrossRef]
  37. Muñoz-Pedreros, A.; González-Urrutia, M.; Encina-Montoya, F.; Norambuena, H.V. Effects of Vegetation Strata and Human Disturbance on Bird Diversity in Green Areas in a City in Southern Chile. Avian Res. 2018, 9, 38. [Google Scholar] [CrossRef]
  38. Catfolis, B.; Vanroy, T.; Verheyen, K.; Baeten, L.; Martel, A.; Pasmans, F.; Strubbe, D.; Lens, L. Avian Nutritional Condition Increases with Forest Structural Complexity. Ecol. Indic. 2023, 154, 110536. [Google Scholar] [CrossRef]
  39. Zellweger, F.; Braunisch, V.; Baltensweiler, A.; Bollmann, K. Remotely Sensed Forest Structural Complexity Predicts Multi Species Occurrence at the Landscape Scale. For. Ecol. Manag. 2013, 307, 303–312. [Google Scholar] [CrossRef]
  40. Jin, C.; Jiao, J.; Wu, C.; Mu, Y.; Zheng, S.; You, L.; Wu, W.; Liu, J.; Jiang, B. Sparse Large Trees in Secondary and Planted Forests Highlight the Need to Improve Forest Conservation and Management. Sci. Total Environ. 2024, 954, 176363. [Google Scholar] [CrossRef]
  41. Lindenmayer, D.B.; Laurance, W.F. The Ecology, Distribution, Conservation and Management of Large Old Trees. Biol. Rev. 2017, 92, 1434–1458. [Google Scholar] [CrossRef]
  42. Hao, Z.; Zhang, C.; Li, L.; Gao, B.; Wu, R.; Pei, N.; Liu, Y. Anthropogenic Noise and Habitat Structure Shaping Dominant Frequency of Bird Sounds along Urban Gradients. iScience 2024, 27, 109056. [Google Scholar] [CrossRef]
  43. Slabbekoorn, H. Songs of the City: Noise-Dependent Spectral Plasticity in the Acoustic Phenotype of Urban Birds. Anim. Behav. 2013, 85, 1089–1099. [Google Scholar] [CrossRef]
  44. Turner, A.; Fischer, M.; Tzanopoulos, J. Sound-mapping a coniferous forest—Perspectives for biodiversity monitoring and noise mitigation. PLoS ONE 2018, 13, e0189843. [Google Scholar] [CrossRef]
  45. Camacho-Cervantes, M.; Schondube, J.E.; Castillo, A.; MacGregor-Fors, I. How Do People Perceive Urban Trees? Assessing Likes and Dislikes in Relation to the Trees of a City. Urban Ecosyst. 2014, 17, 761–773. [Google Scholar] [CrossRef]
  46. Lacasta, A.M.; Peñaranda, A.; Cantalapiedra, I.R. Chapter 3.9—Green Streets for Noise Reduction. In Nature Based Strategies for Urban and Building Sustainability; Pérez, G., Perini, K., Eds.; Butterworth-Heinemann: Oxford, UK, 2018; pp. 181–190. ISBN 978-0-12-812150-4. [Google Scholar]
  47. Dzhambov, A.M.; Dimitrova, D.D. Green Spaces and Environmental Noise Perception. Urban For. Urban Green. 2015, 14, 1000–1008. [Google Scholar] [CrossRef]
  48. Hao, Z.; Zhang, C.; Li, L.; Sun, B.; Luo, S.; Liao, J.; Wang, Q.; Wu, R.; Xu, X.; Lepczyk, C.A.; et al. Can Urban Forests Provide Acoustic Refuges for Birds? Investigating the Influence of Vegetation Structure and Anthropogenic Noise on Bird Sound Diversity. J. For. Res. 2024, 35, 33. [Google Scholar] [CrossRef]
  49. Cardozo, R.; Machado, R.B. Bird Communities in the Dry Chaco of South America: Vegetation Structure and Climate Effects. Perspect. Ecol. Conserv. 2024, 22, 374–383. [Google Scholar] [CrossRef]
  50. Uebel, K.; Bonn, A.; Marselle, M.; Dean, A.J.; Rhodes, J.R. Understory Vegetation Can Promote Bird Sounds and Reduce Traffic Noise in Urban Park Soundscapes. Urban Ecosyst. 2025, 28, 71. [Google Scholar] [CrossRef]
  51. Maisey, A.C.; Haslem, A.; Leonard, S.W.J.; Bennett, A.F. Foraging by an Avian Ecosystem Engineer Extensively Modifies the Litter and Soil Layer in Forest Ecosystems. Ecol. Appl. 2021, 31, e02219. [Google Scholar] [CrossRef]
  52. Vergara, P.M.; Fierro, A.; Alaniz, A.J.; Carvajal, M.A.; Lizama, M.; Llanos, J.L. Landscape-Scale Effects of Forest Degradation on Insectivorous Birds and Invertebrates in Austral Temperate Forests. Landsc. Ecol. 2021, 36, 191–208. [Google Scholar] [CrossRef]
  53. Sueur, J.; Gasc, A.; Grandcolas, P.; Pavoine, S. Global Estimation of Animal Diversity Using Automatic Acoustic Sensors. In Sensors for Ecology: Towards Integrated Knowledge of Ecosystems; CNRS: Paris, France, 2012; pp. 99–117. [Google Scholar]
  54. Henry, K.S.; Lucas, J.R. Auditory Sensitivity and the Frequency Selectivity of Auditory Filters in the Carolina Chickadee, Poecile Carolinensis. Anim. Behav. 2010, 80, 497–507. [Google Scholar] [CrossRef]
  55. Būhning-Gaese, K. Determinants of Avian Species Richness at Different Spatial Scales. J. Biogeogr. 1997, 24, 49–60. [Google Scholar] [CrossRef]
  56. Panda, B.P.; Prusty, B.A.K.; Panda, B.; Pradhan, A.; Parida, S.P. Habitat Heterogeneity Influences Avian Feeding Guild Composition in Urban Landscapes: Evidence from Bhubaneswar, India. Ecol. Process 2021, 10, 31. [Google Scholar] [CrossRef]
  57. Lu, X.; Jia, Y.; Wang, Y. The Effect of Landscape Composition, Complexity, and Heterogeneity on Bird Richness: A Systematic Review and Meta-Analysis on a Global Scale. Landsc. Ecol. 2024, 39, 132. [Google Scholar] [CrossRef]
  58. Wang, J.; Li, C.; Yao, Z.; Cui, S. Soundscape for Urban Ecological Security Evaluation. Basic Appl. Ecol. 2024, 76, 50–57. [Google Scholar] [CrossRef]
  59. Raihan, A. A Review on the Role of Green Vegetation in Improving Urban Environmental Quality. Eco Cities 2024, 4, 2387. [Google Scholar] [CrossRef]
  60. de Oliveira, J.D.; Biondi, D.; dos Reis, A.R.N.; de Oliveira, J.D.; Biondi, D.; dos Reis, A.R.N. The Role of Urban Green Areas in Noise Pollution Attenuation. DYNA 2022, 89, 210–215. [Google Scholar] [CrossRef]
  61. Ali Khan, S.; Fatima, K.; Hussain, S.; Minhal Ali, M.; Mannan, A.; Iqbal Butt, N. Mitigation of noise pollution in urban areas by strategically planting trees and shrubs. J. Hcare. Dvp. Ctries 2023, 7, 41–47. [Google Scholar] [CrossRef]
  62. Bakker, J.J. Improving the Acoustic Absorption of Vertical Greening Systems. Master Thesis, Delft University of Technology, Delft, The Netherlands, 2021. [Google Scholar]
  63. Zhao, N.; Prieur, J.-F.; Liu, Y.; Kneeshaw, D.; Lapointe, E.M.; Paquette, A.; Zinszer, K.; Dupras, J.; Villeneuve, P.J.; Rainham, D.G.; et al. Tree Characteristics and Environmental Noise in Complex Urban Settings—A Case Study from Montreal, Canada. Environ. Res. 2021, 202, 111887. [Google Scholar] [CrossRef]
  64. Ow, L.F.; Ghosh, S. Urban Cities and Road Traffic Noise: Reduction through Vegetation. Appl. Acoust. 2017, 120, 15–20. [Google Scholar] [CrossRef]
  65. Ren, X.; Li, Q.; Yuan, M.; Shao, S. How Visible Street Greenery Moderates Traffic Noise to Improve Acoustic Comfort in Pedestrian Environments. Landsc. Urban Plan. 2023, 238, 104839. [Google Scholar] [CrossRef]
Figure 1. Typical spectra and environment of soundscapes: (a,b) Representative sound spectra from different urban forests, (c,d) photographs of the corresponding environment at study sites, (eg) field recording setup, and (g) in situ deployment on canopy trees.
Forests 16 00669 g001
Figure 2. PCA plot of frequency intervals.
Forests 16 00669 g002
Figure 3. Frequency niche overlap of bird species in the study area. (a) Birdsong frequency distribution. (b) Average frequency range of common bird species.
Forests 16 00669 g003
Figure 4. Diurnal variation in PSD (Watt/kHz) values for 3 frequency clusters and corresponding acoustic activities for various acoustic niches.
Forests 16 00669 g004
Figure 5. Effect sizes of plant community variables are predicted based on the best models’ conditional averaged coefficients for biophony. Estimates in the plot are shown using the mean values (black squares) and associated 95% Cis (black horizontal bands). The sizes of the black squares vary according to the p-value: p < 0.05 “■” and p > 0.05 “▪”.
Forests 16 00669 g005
Figure 6. Effect sizes of plant community variables are predicted based on the best models’ conditional averaged coefficient for anthrophony. Estimates in the plot are shown using the mean values (black squares) and associated 95% Cis (black horizontal bands). The sizes of black squares vary according to the p-value: p < 0.05 “■” and p > 0.05 “▪”.
Forests 16 00669 g006
Figure 7. Effect sizes of plant community variables are predicted based on the best models’ conditional averaged coefficient for NDSI. Estimates in the plot are shown using the mean values (black squares) and associated 95% Cis (black horizontal bands). The sizes of black squares vary according to the p-value: p < 0.05 “■” and p > 0.05 “▪”.
Forests 16 00669 g007
Table 1. Summary of the final best models within a delta of ≤ 2 for the NDSI.
NDSI
Model parametersRankmodel1model2model3model4model5Average model
AICc695.81 697.19 697.19 697.62 697.80
delta0.00 1.39 1.39 1.81 1.99
weight0.36 0.18 0.18 0.15 0.13
Vegetation
composition
ASR 8.0%26%
SSR 5.5%
ASA 8.0%
SSA 4.5%
Vegetation
structure
DBH 12.1%74%
LAI 1.5%
AHEI 10.1%
BPER 10.1%
SAGE 11.1%
FHD 16.6%
TCV 12.6%
Note: We indicated the variables with colors when parameters were selected in the models.
Disclaimer/Publisher’s Note: The statements, opinions and data contained in all publications are solely those of the individual author(s) and contributor(s) and not of MDPI and/or the editor(s). MDPI and/or the editor(s) disclaim responsibility for any injury to people or property resulting from any ideas, methods, instructions or products referred to in the content.

