
TreeDBH: Dual Enhancement Strategies for Tree Point Cloud Completion in Medium–Low Density UAV Data

Abstract
1. Introduction
- (1)
- This study established a proprietary dataset through UAV-mounted LiDAR and terrestrial laser scanning (TLS) data acquisition, while constructing a dedicated point cloud completion benchmark based on the FOR-instance dataset;
- (2)
- To address self-occlusion-induced incompleteness and canopy layer density disparities in medium–low density UAV point clouds, we proposed two enhancement strategies that significantly improve the integrity and precision of tree point cloud completion;
- (3)
- In this study, we applied a DBH measurement method to fit the DBH of the completed point clouds and compare the results with ground-truth measurements, verifying the impact and value of point cloud completion on single-tree parameter extraction.
2. Materials
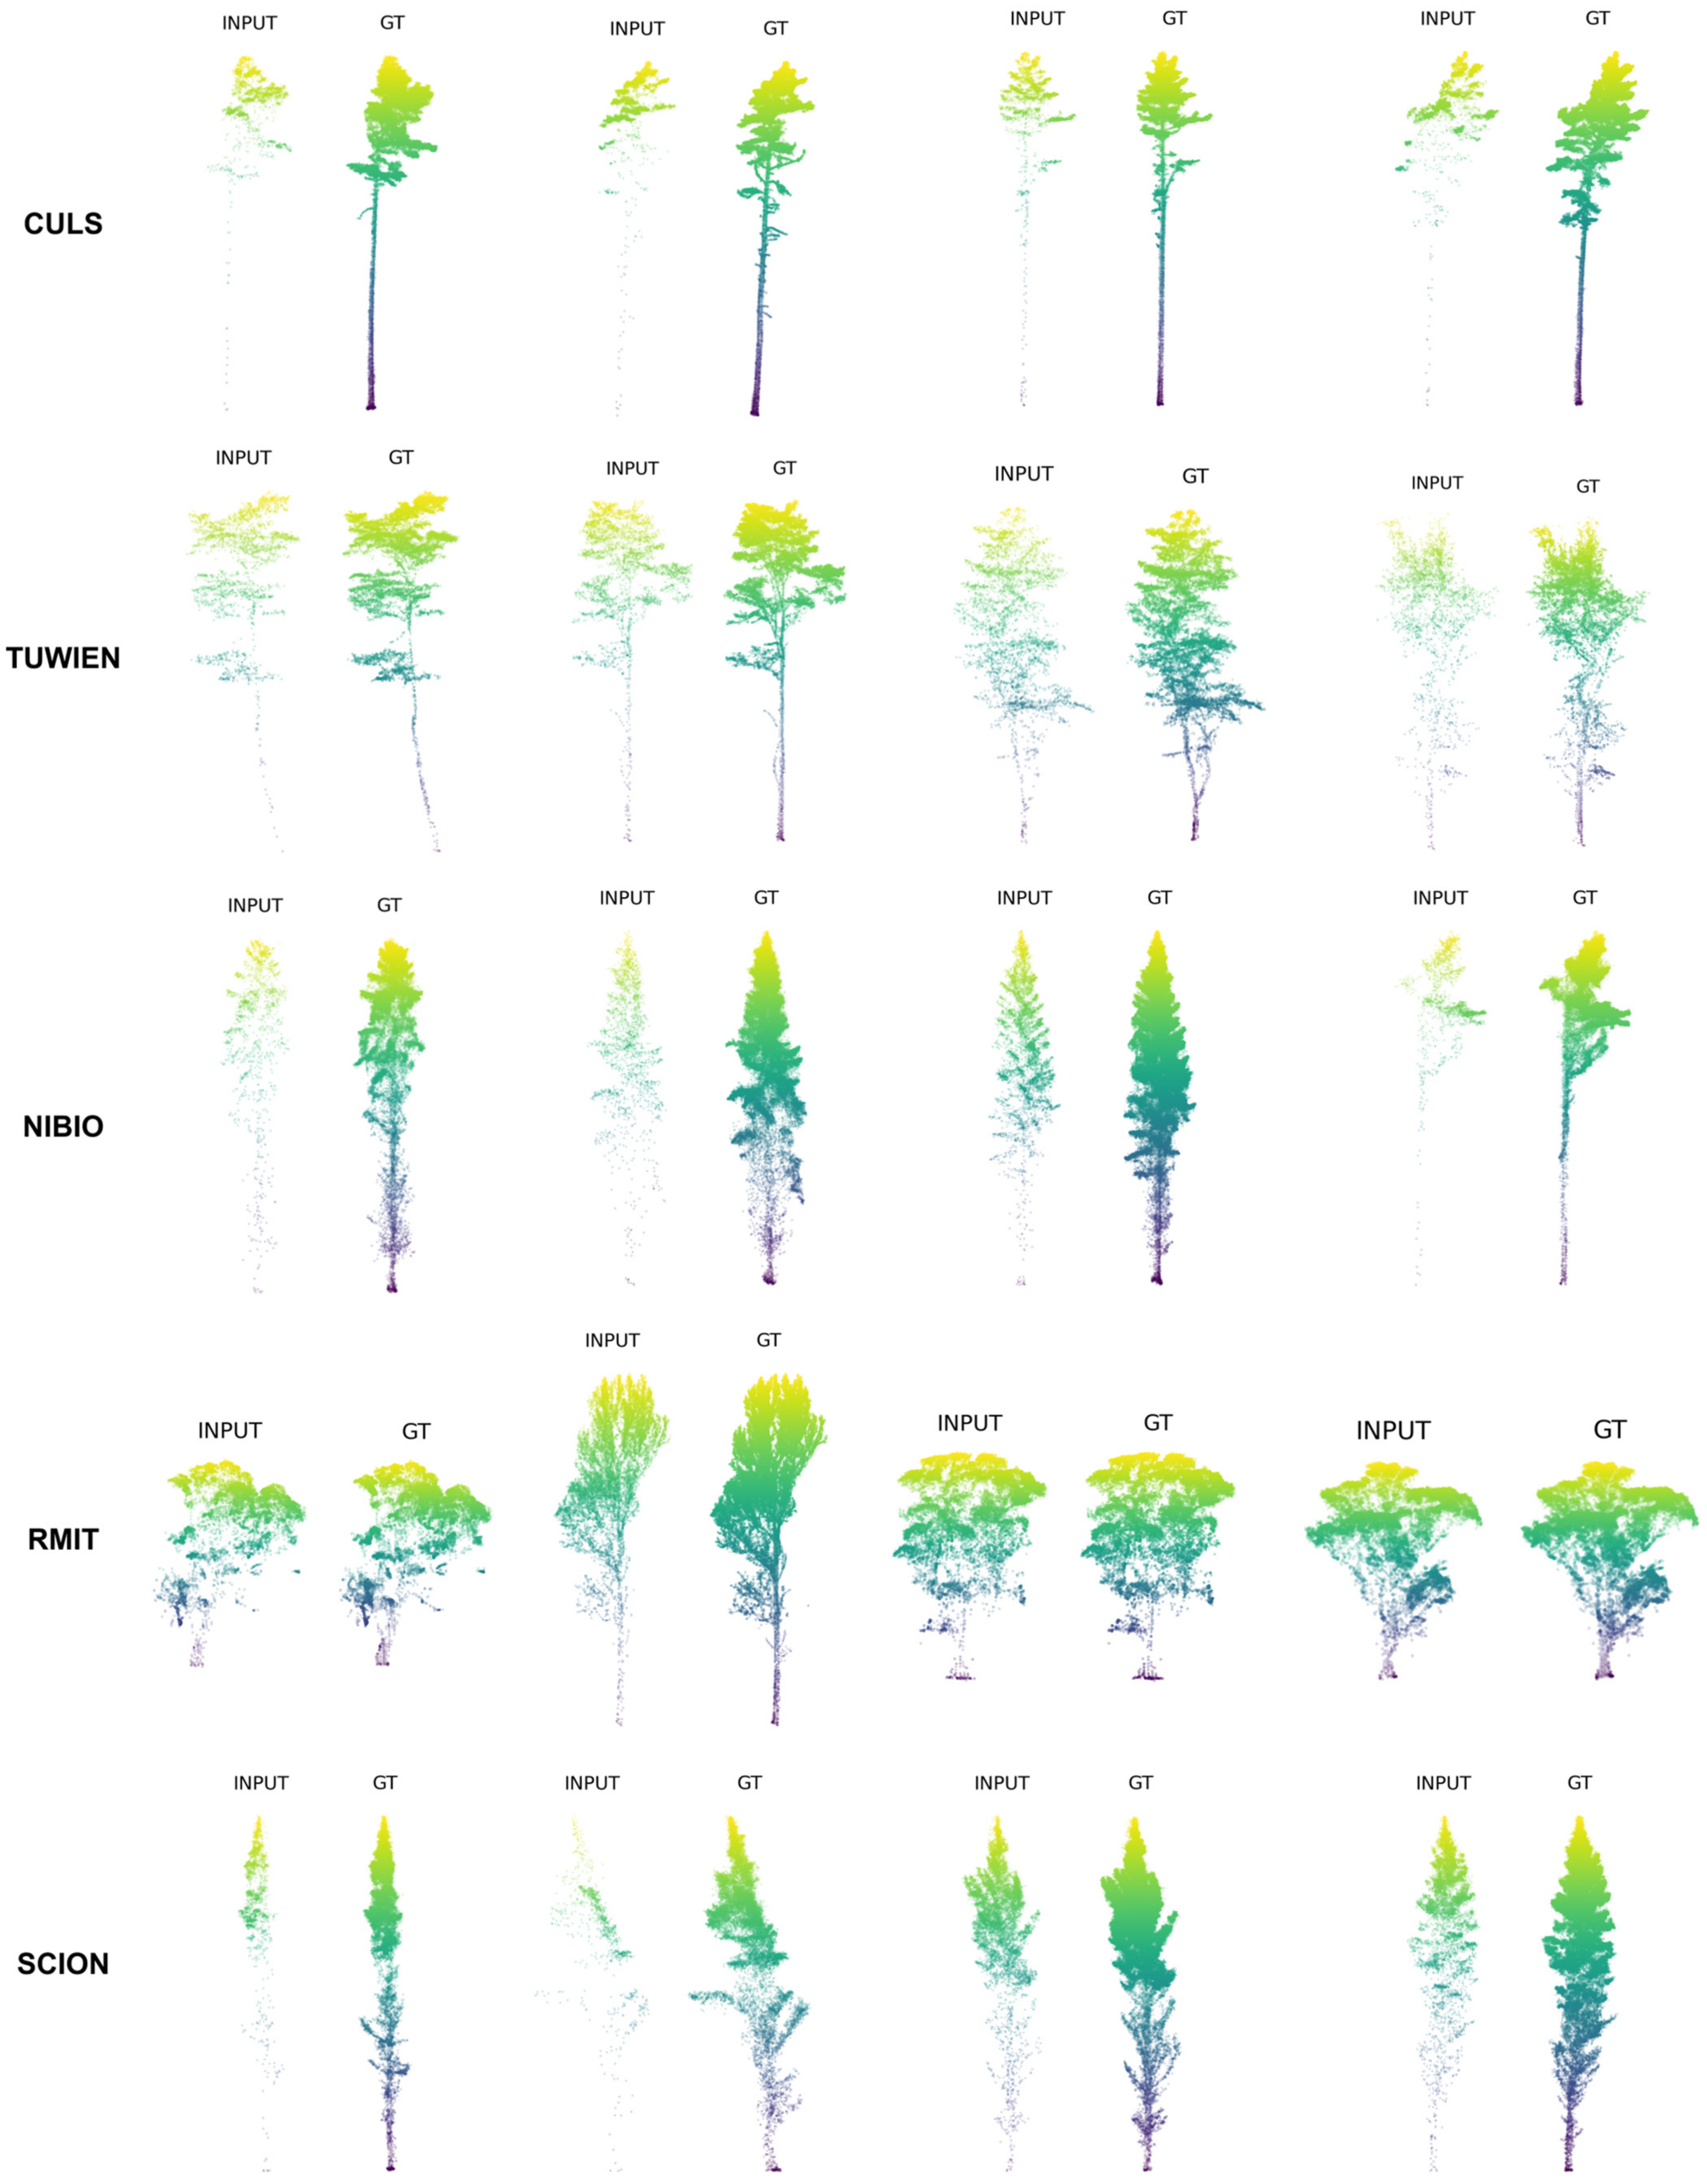
2.1. Point Cloud Completion Dataset Construction Using the FOR-Instance Benchmark
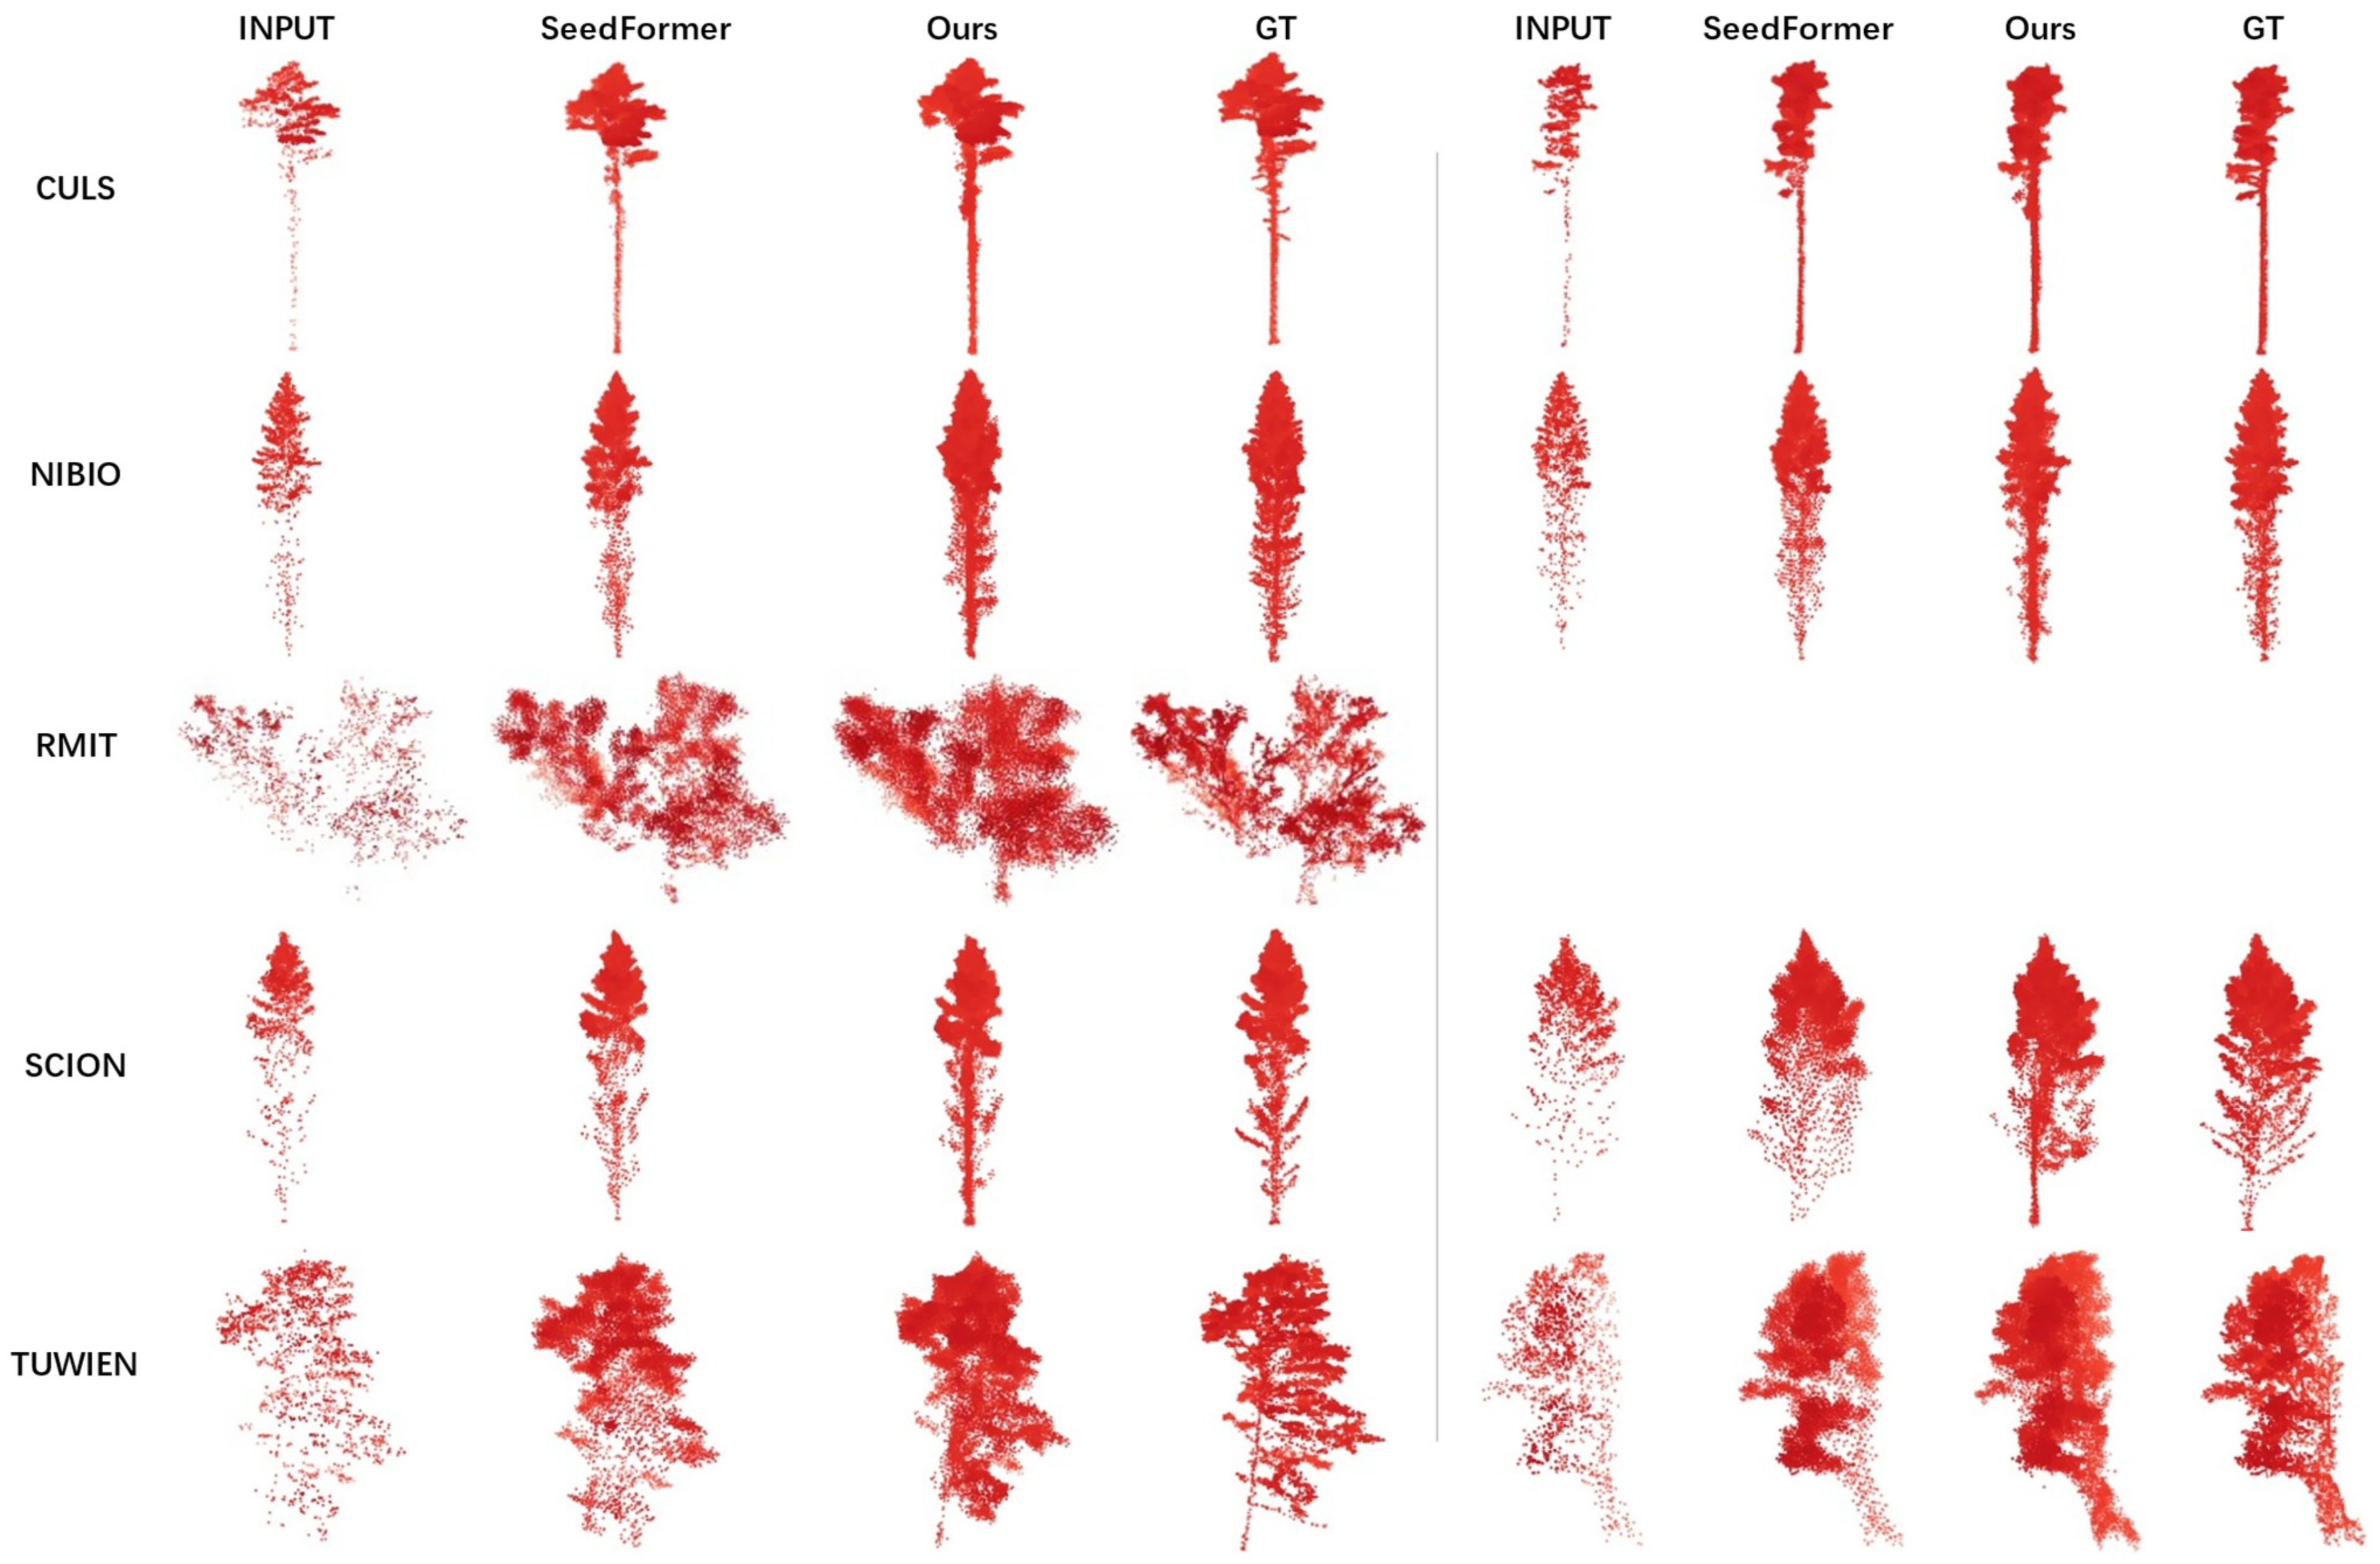
2.1.1. Overview of the FOR-Instance Dataset
- ●
- NIBIO: Boreal conifer-dominated forests (Norway, 42% of annotated data) [44];
- ●
- CULS: Temperate conifer-dominated forests (Czech Republic, 5%) [45];
- ●
- TUWIEN: Deciduous floodplain forests (Austria, 29%) [46];
- ●
- RMIT: White peppermint eucalyptus-dominated stands (Australia, 11%);
- ●
- SCION: Monocultural radiata pine plantations (New Zealand, 13%).
2.1.2. FOR-Instance Dataset Processing
2.2. Xiong’an Dataset
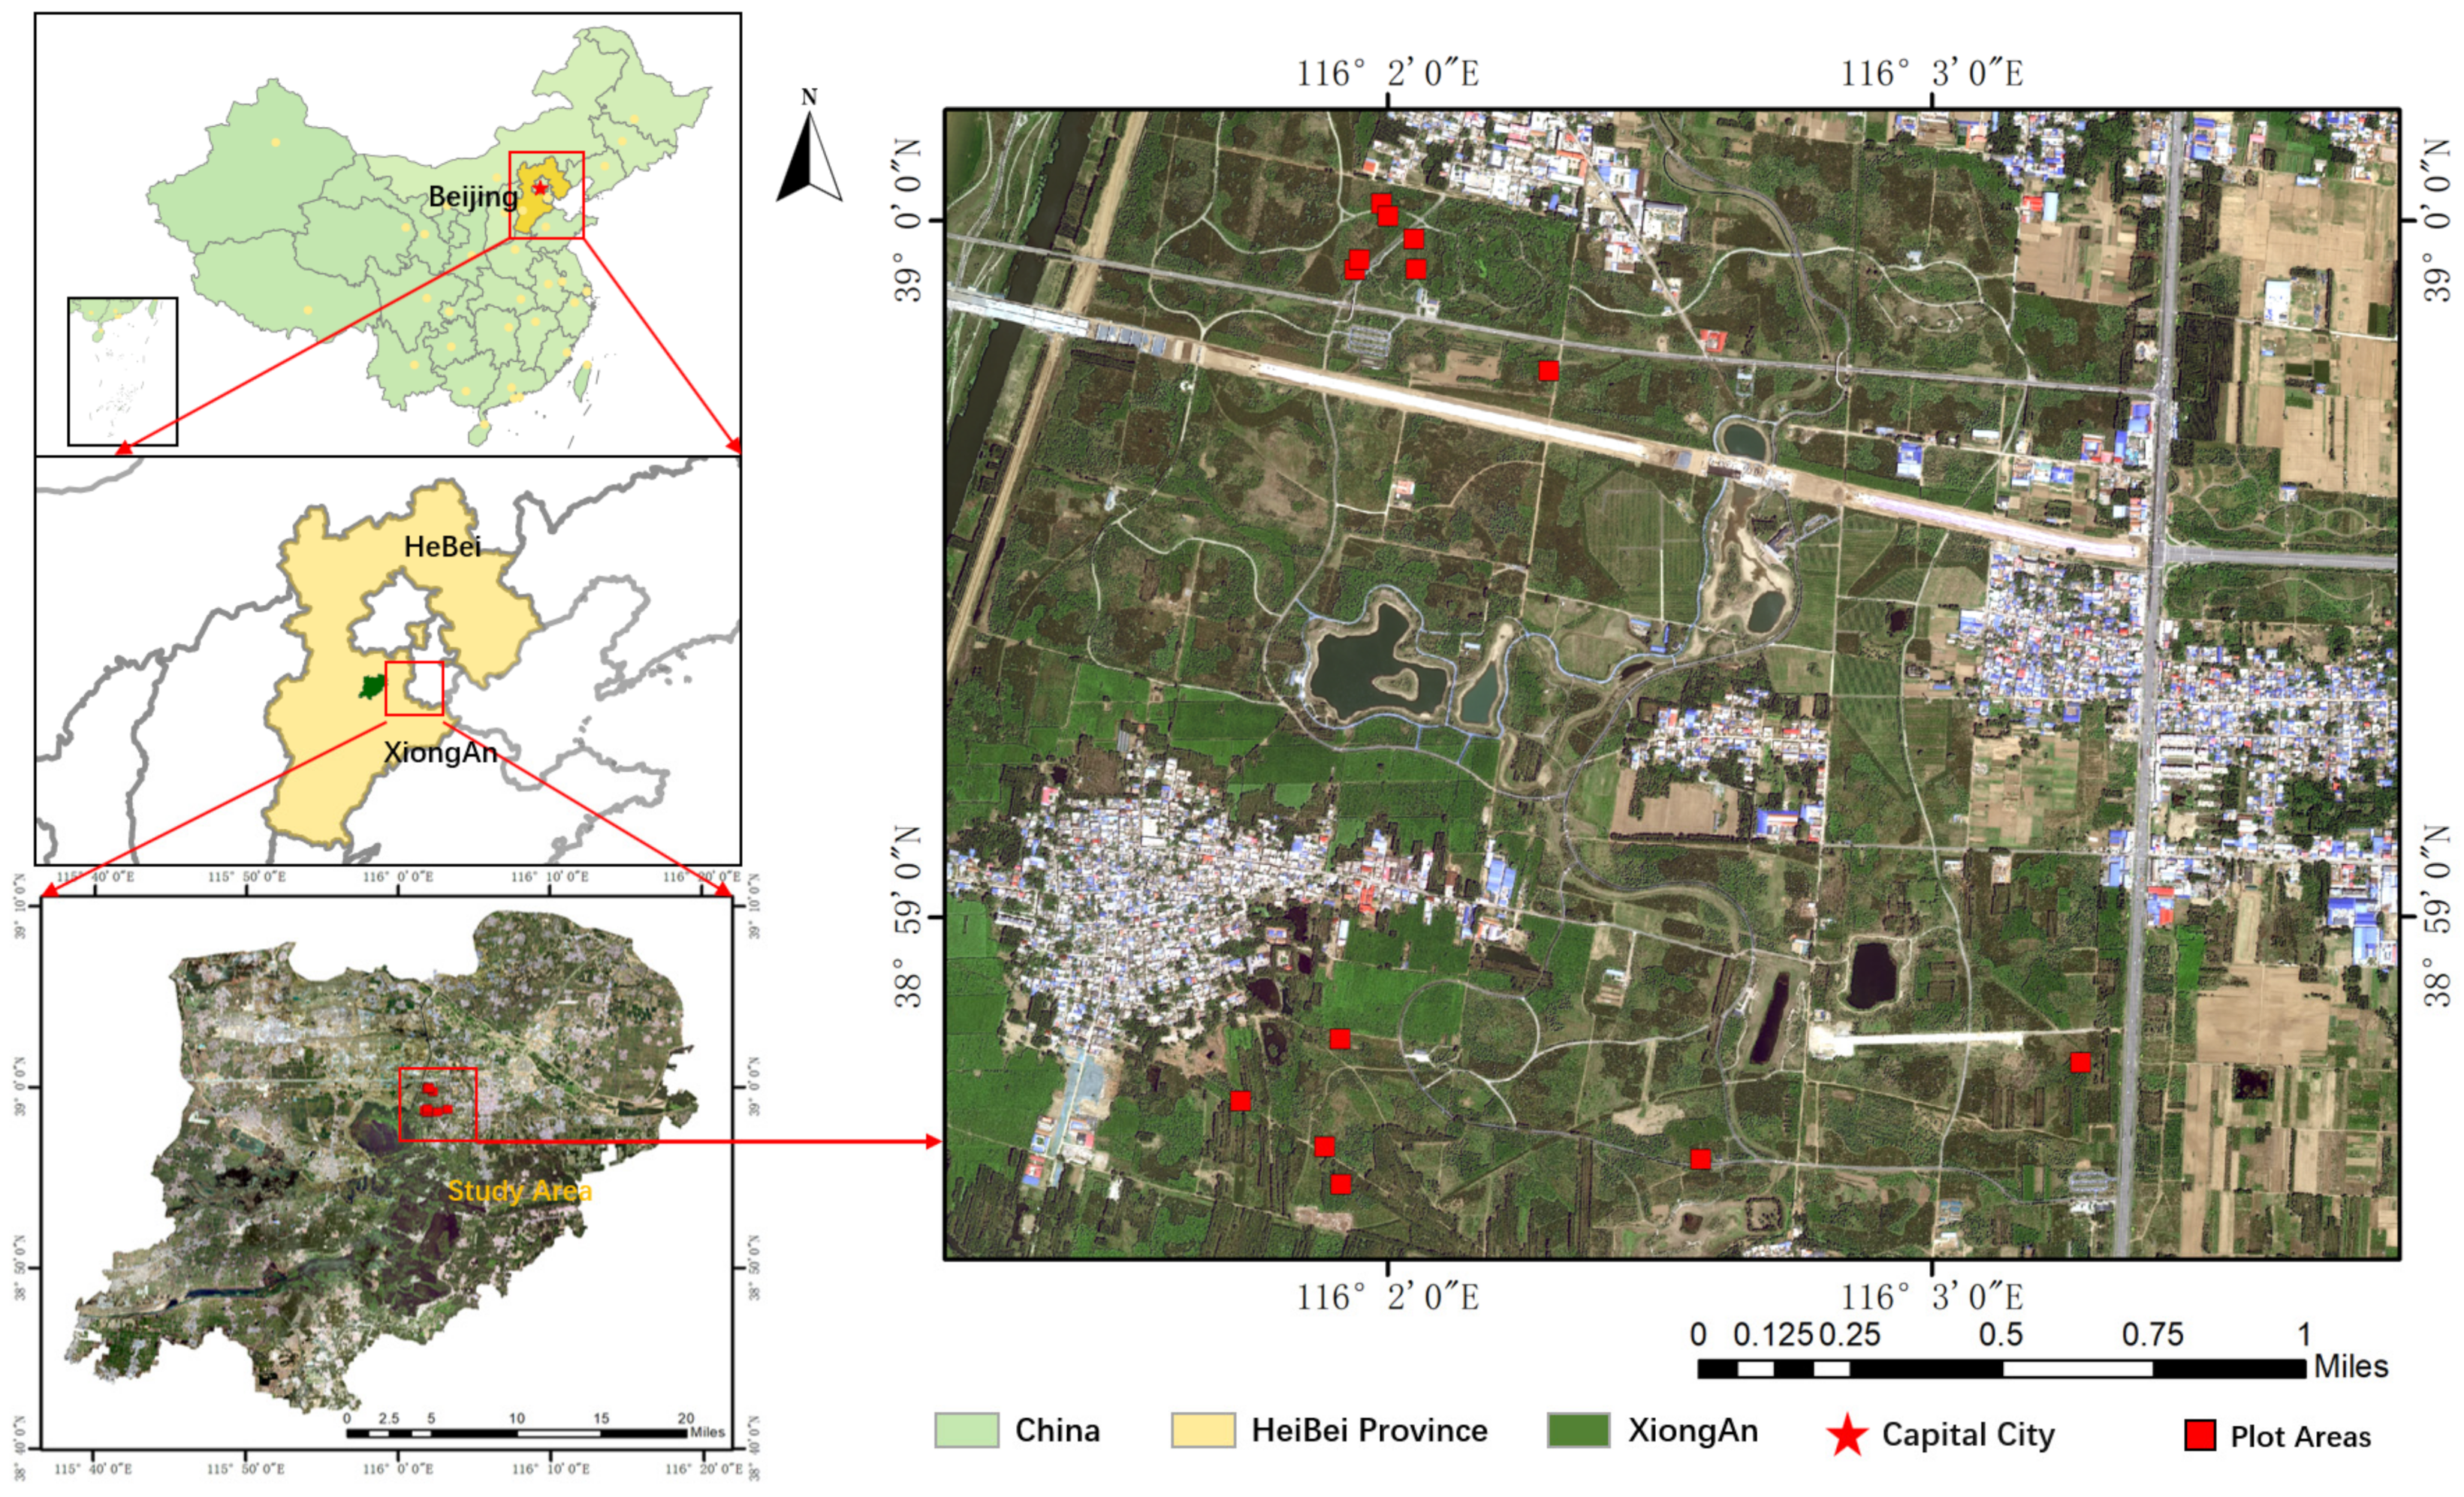
2.2.1. Study Area
2.2.2. ULS Data
2.2.3. TLS Data
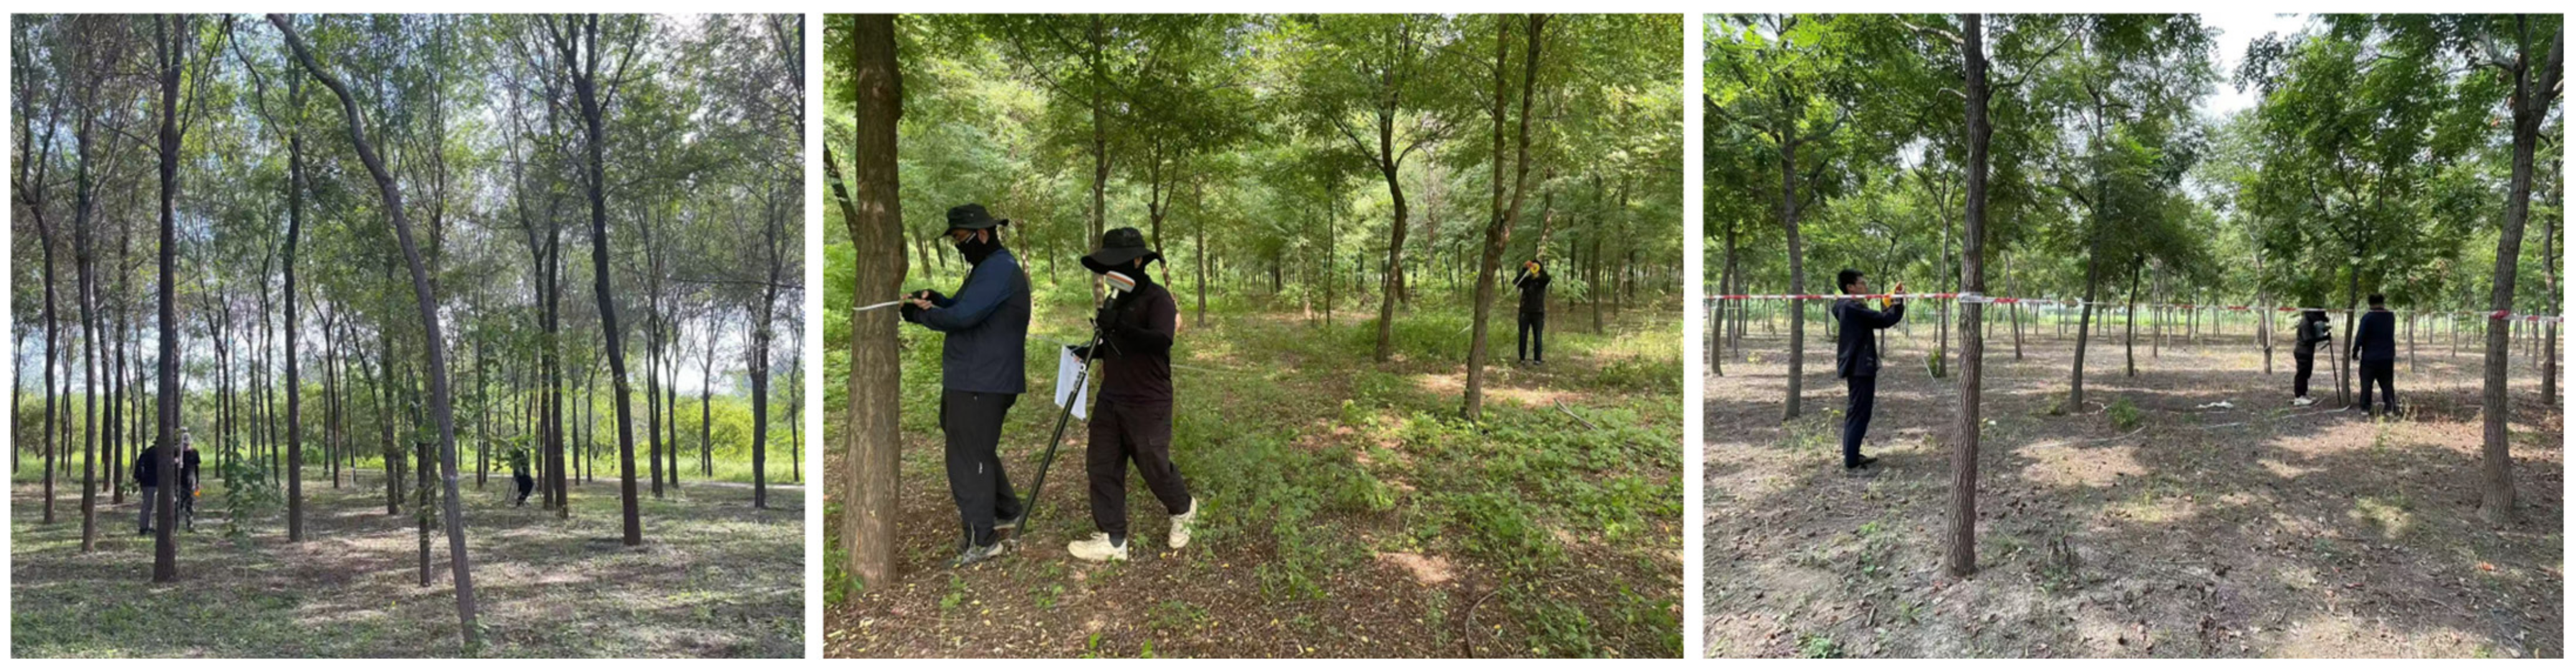
2.2.4. Field Data
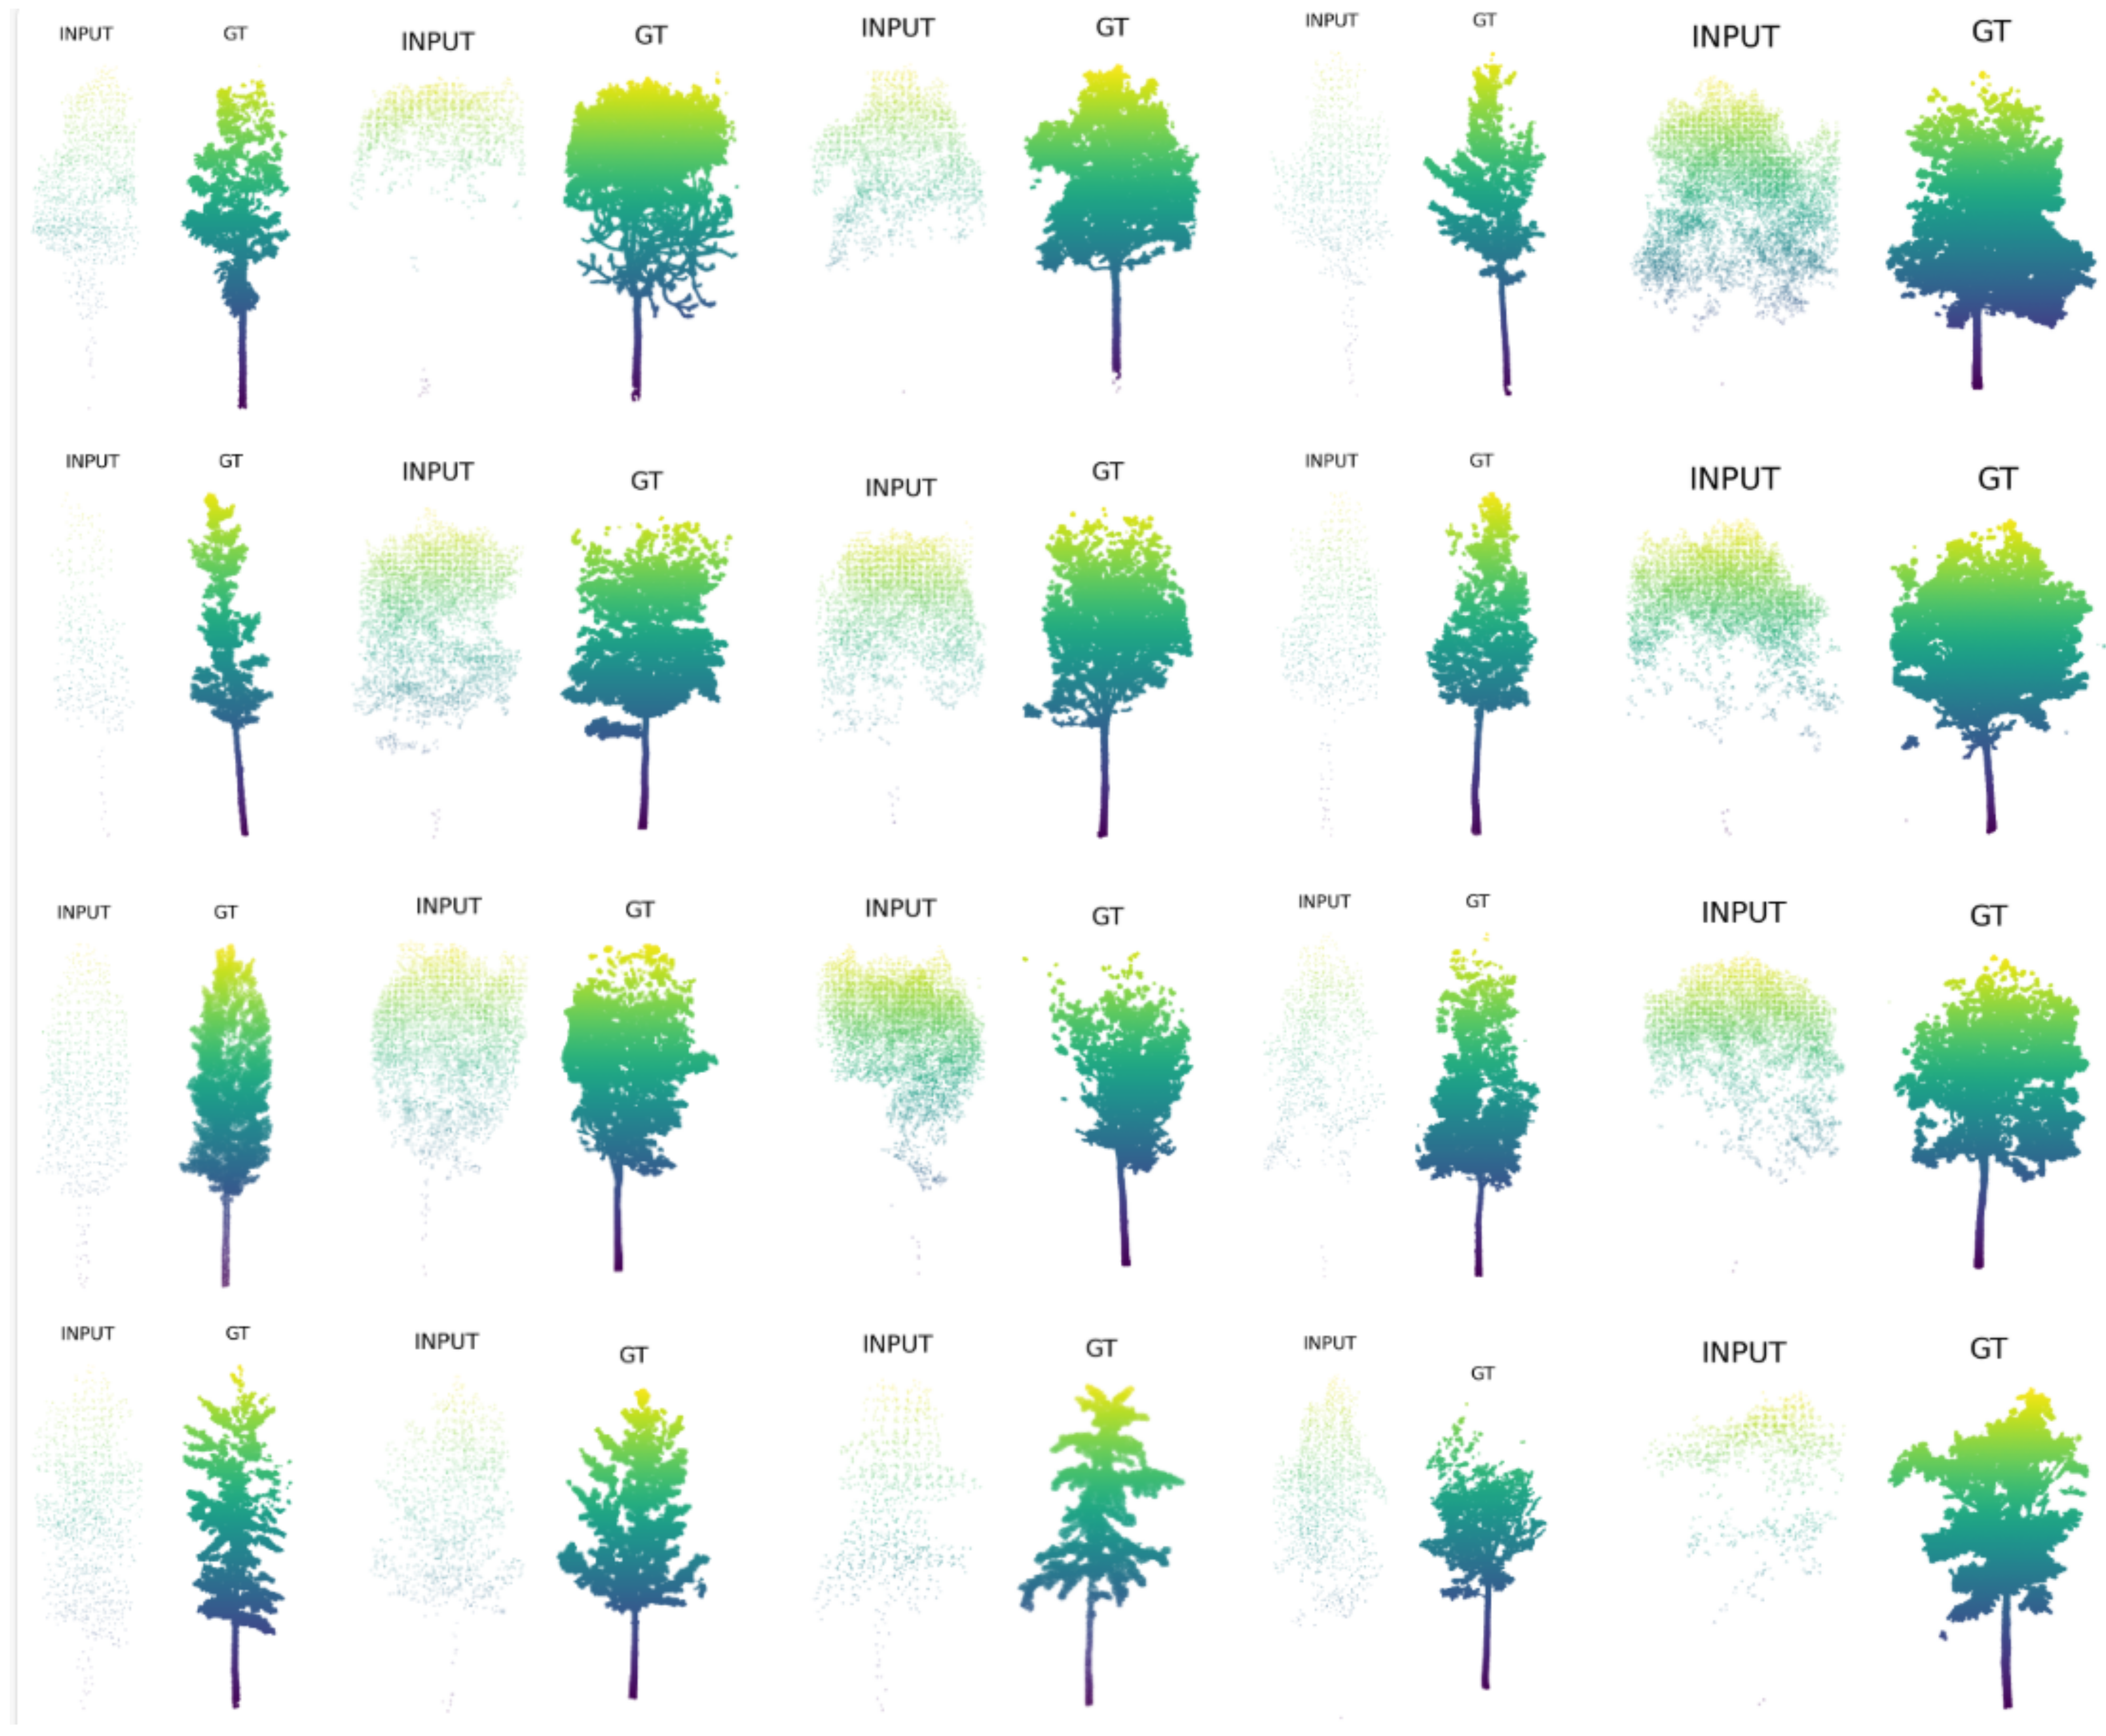
2.2.5. Dataset Creation
3. Methods
3.1. SeedFormer Model
3.2. Hierarchical Random Sampling Method
| Algorithm 1 Adaptive Point Cloud Sampling (APCS) |
| Input: : Input point cloud, : Target sample size : Median ratio of lower-layer points (pre-computed) Output: : Sampled point cloud Function APCS()
|
3.3. Loss Function
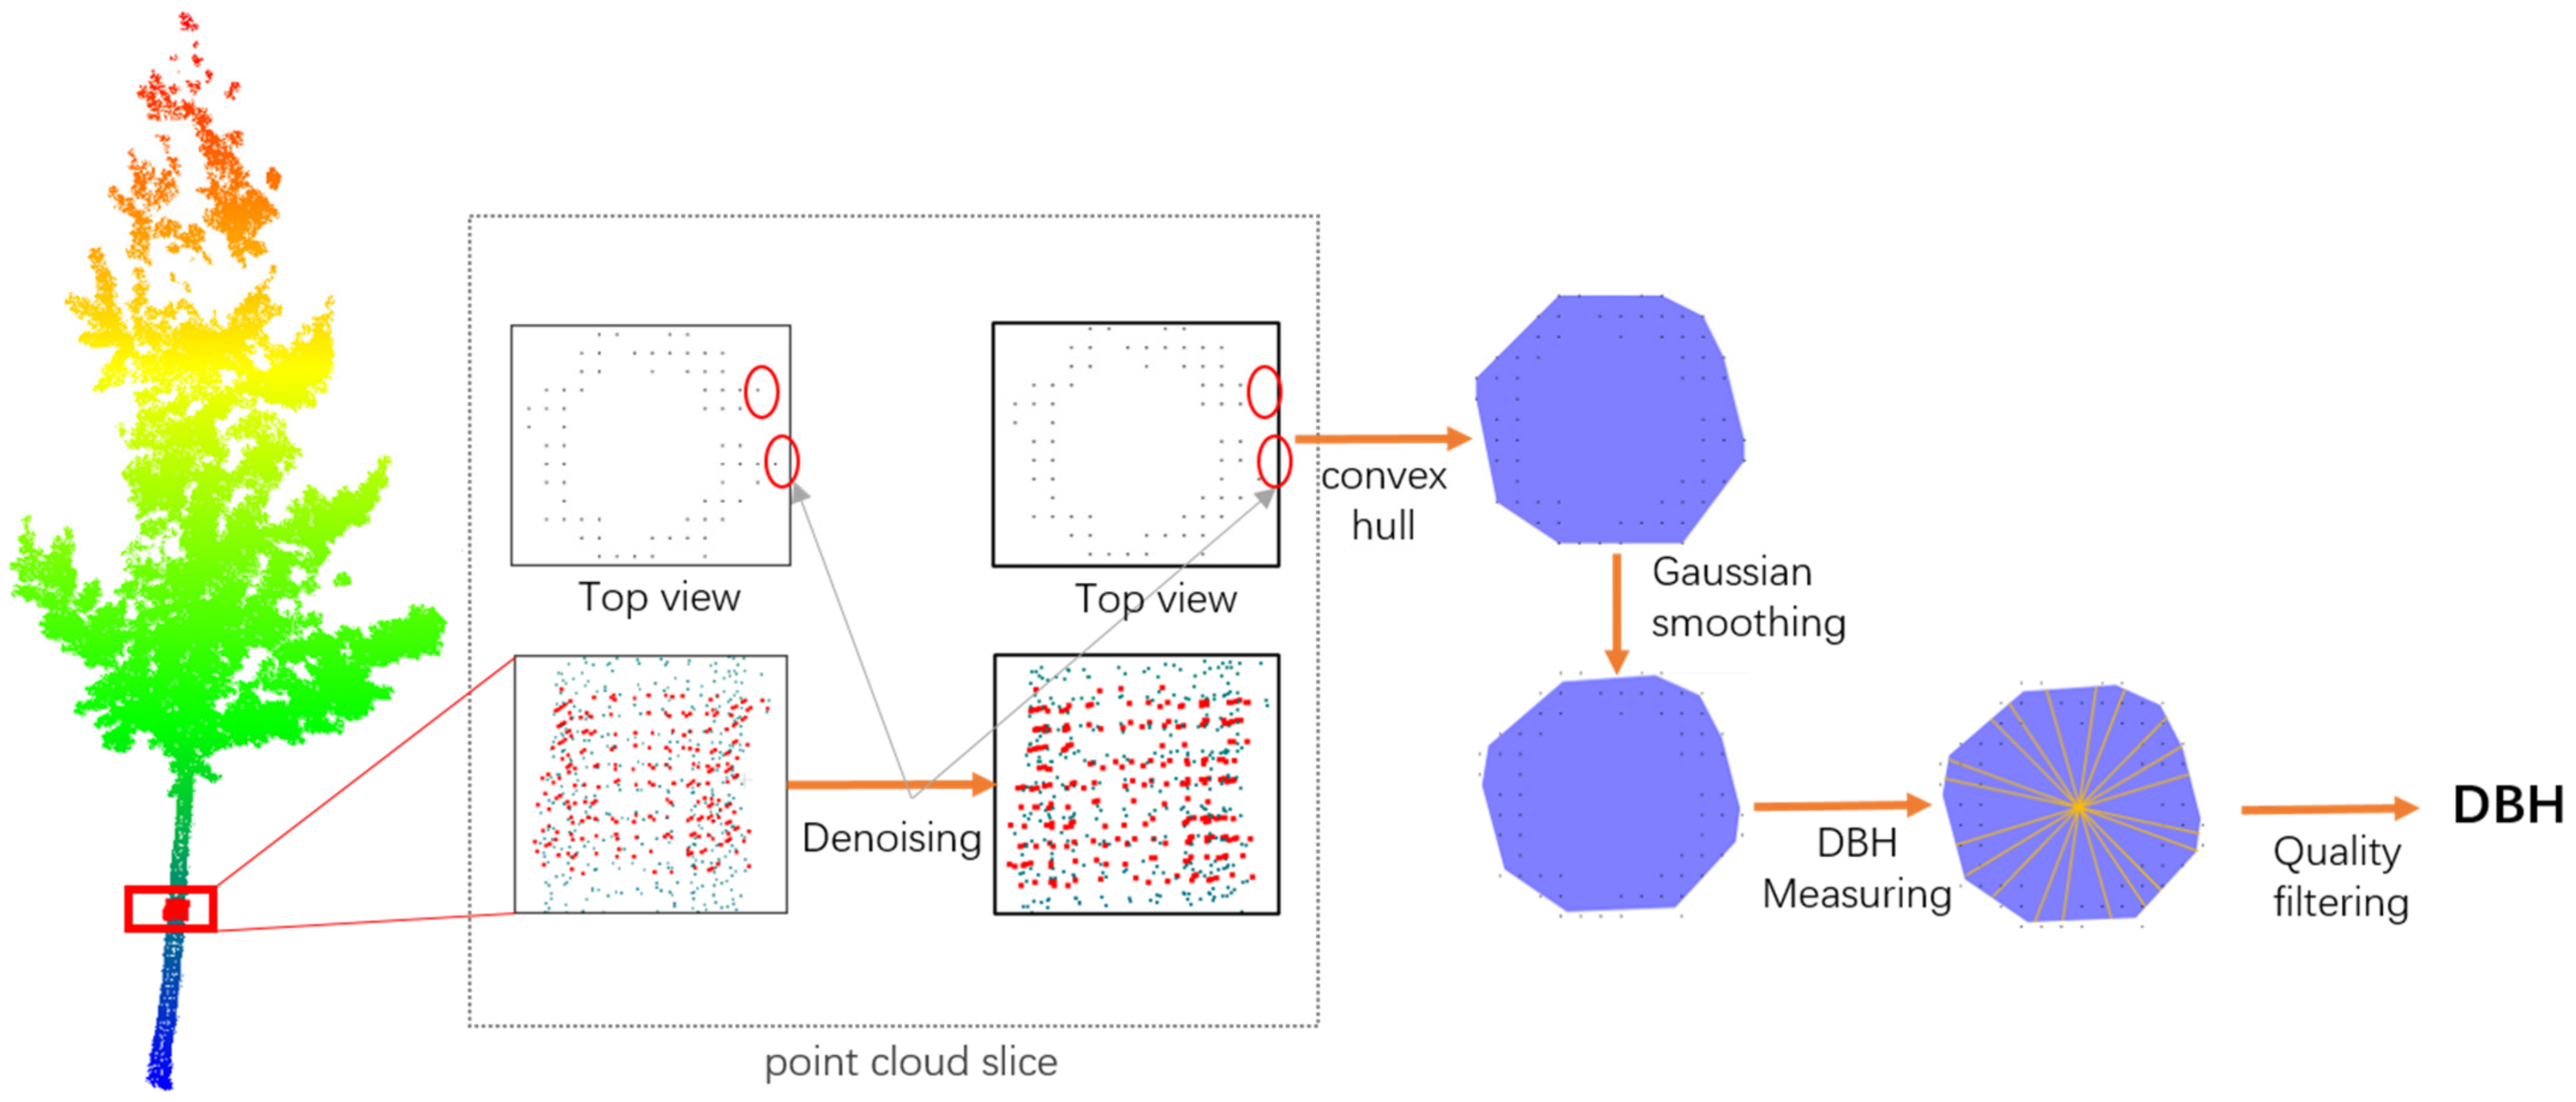
3.4. Point Cloud-Based Diameter at Breast Height Measurement Method
- (1)
- Point cloud slices are extracted from the trunk at a height between 1.25 m and 1.35 m. To address potential noise issues in the original data, denoising is performed based on the consistency of the point cloud normal vectors. Since the normal vectors of the trunk point cloud are relatively stable, while the normal vectors of noise points fluctuate significantly, this paper calculates the rate of change of the point cloud’s normal vector direction and removes points with large gradient changes to improve data quality. Additionally, to ensure the reliability and stability of the slices, the number of valid points within a slice must be no less than 25. If the number of points is insufficient, the slice thickness is appropriately increased to ensure the data is adequate to support subsequent calculations.
- (2)
- After the preprocessing of the sliced point cloud, it is projected onto the XOY plane, and its convex hull is calculated to generate a polygon representing the tree trunk boundary. To further optimize the boundary shape, Gaussian smoothing is applied to the boundary points to reduce the impact of local outliers on measurement accuracy, making the extracted tree trunk contour more stable.
- (3)
- To improve the stability and robustness of DBH measurement, this paper randomly generates 10 sets of lines that vertically pass through the centroid of the point cloud’s outer circle and calculates the length of the intersection between the lines and the tree trunk boundary’s convex hull.
- (4)
- The quality is assessed by calculating the standard deviation and mean of the 10 measurement values. If the standard deviation is greater than the set threshold (σ < 0.15 × mean measurement value), the slice point cloud is considered unable to accurately represent the tree trunk, and the DBH measurement result for that tree is discarded. Otherwise, the average of the 10 measurement results is taken as the final DBH measurement value.
4. Results
4.1. Evaluation Metrics
4.2. Experimental Setup
4.3. Experient Results of Point Cloud Completion Models
4.3.1. Experiments on FOR-Instance Dataset
4.3.2. Experiments on Xiong’an Dataset
4.3.3. Comparison of Sampling Methods Experiment
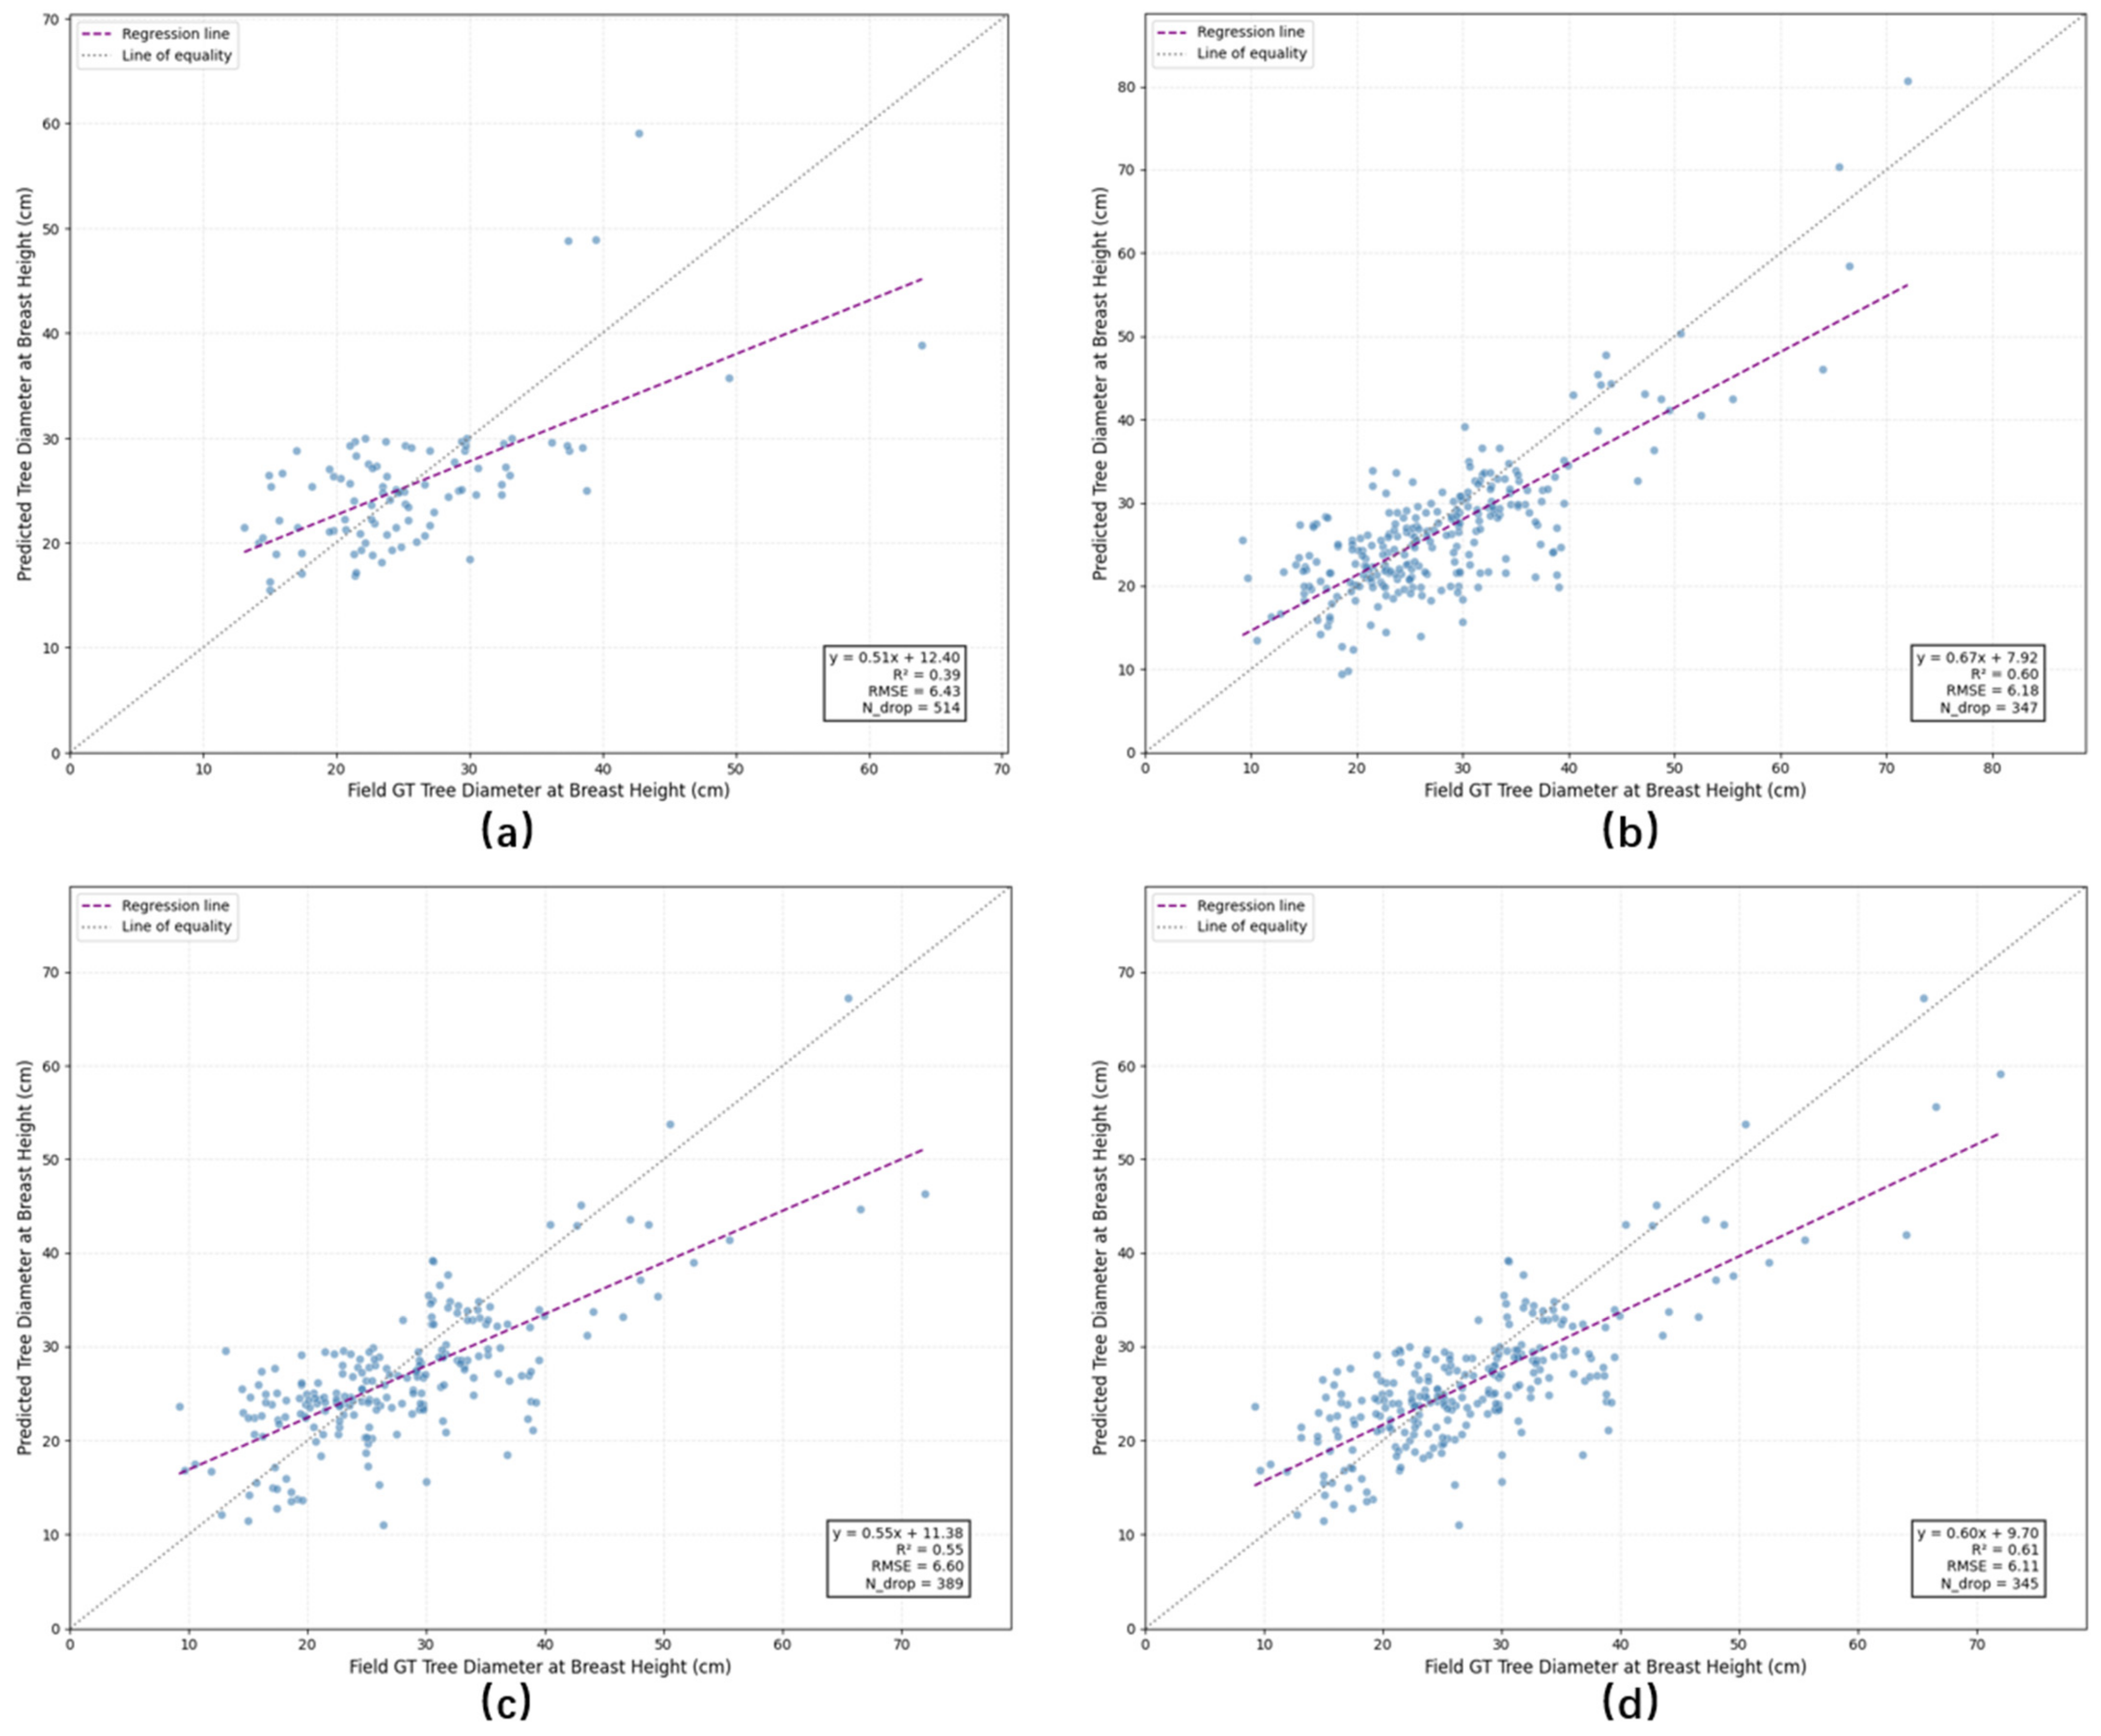
4.4. Experimental Evaluation of Point Cloud Completion in Improving the Reliability of DBH Measurement
4.4.1. Experiments on FOR-Instance Dataset
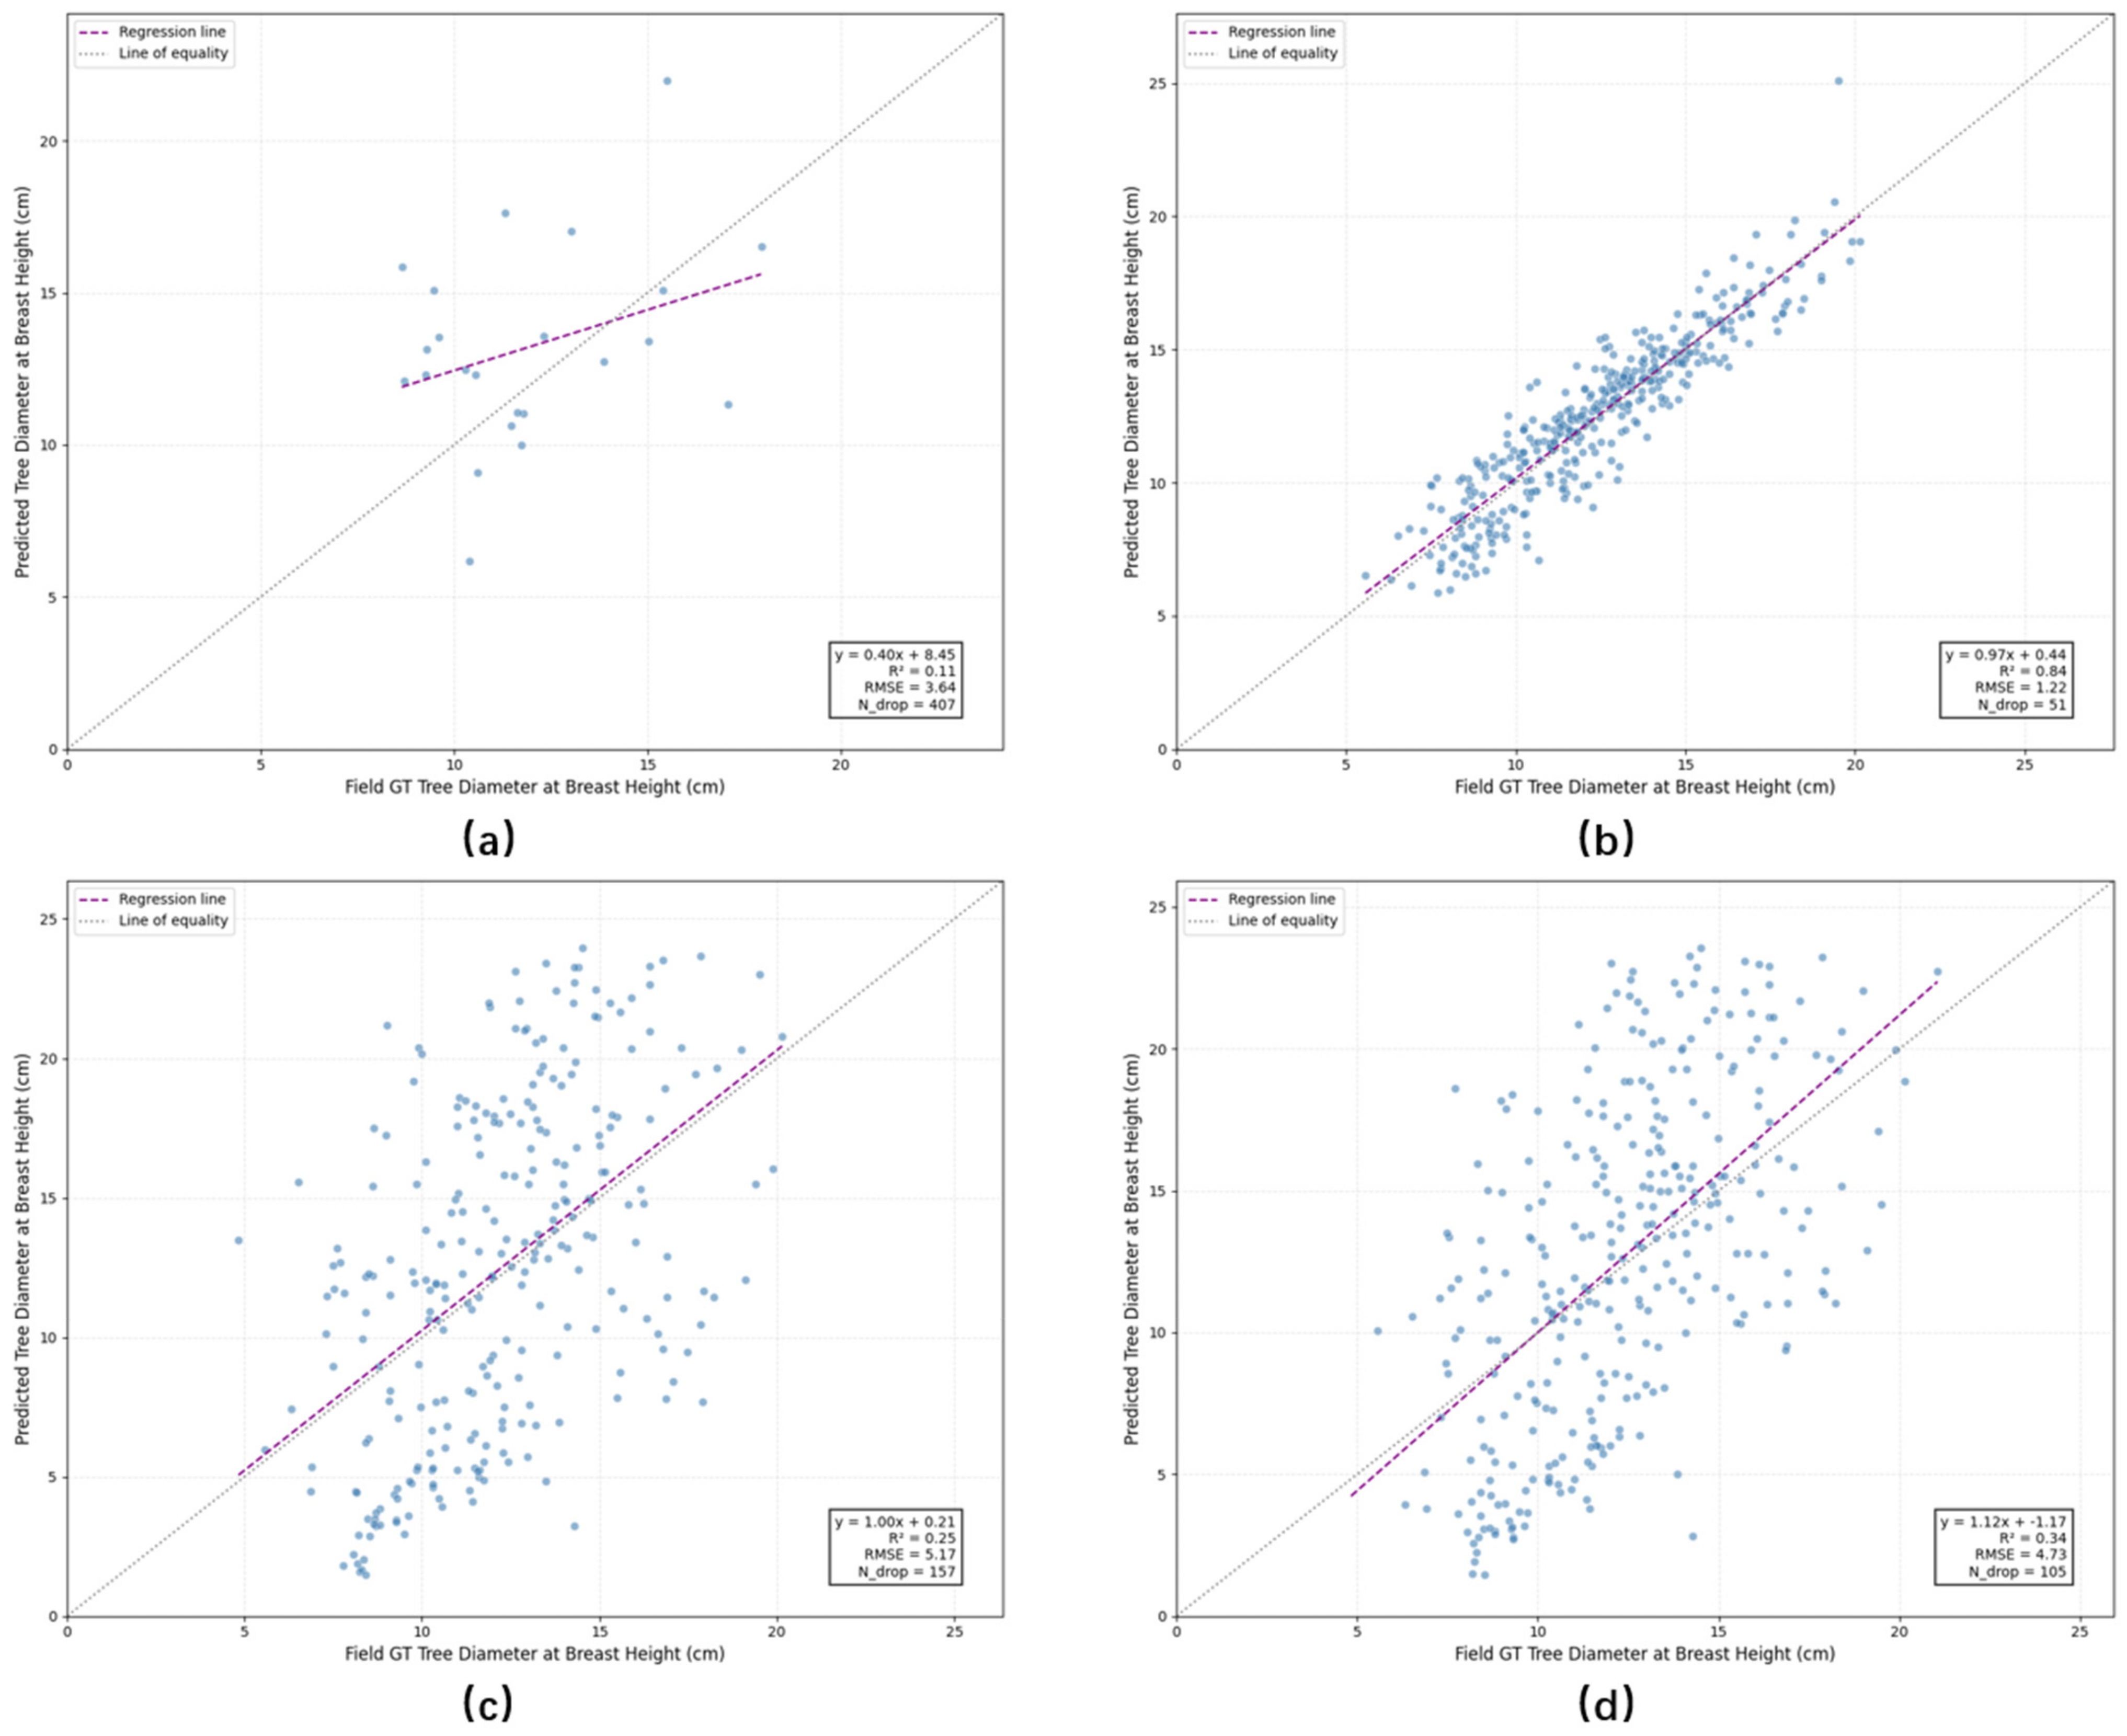
4.4.2. Experiments on Xiong’an Dataset
5. Discussion
5.1. Selection of Point Cloud Completion Models
5.2. Analysis of Sampling Method Selection
5.3. Limitations and Outlook
5.3.1. Improvement of Sampling Methods
5.3.2. Enrichment of Evaluation Metrics
5.3.3. Combined Usage Strategy of ULS and TLS Data
6. Conclusions
Author Contributions
Funding
Data Availability Statement
Conflicts of Interest
References
- Guo, Q.H.; Liu, J.; Tao, S.L.; Xue, B.; Li, L.; Xu, G.C.; Li, W.K.; Wu, F.F.; Li, Y.M.; Chen, L.H. Perspectives and prospects of Li-DAR in forest ecosystem monitoring and modeling. Chin. Sci. Bull. 2014, 59, 459–478. [Google Scholar]
- Véga, C.; Renaud, J.; Durrieu, S.; Bouvier, M. On the interest of penetration depth, canopy area and volume metrics to improve Lidar-based models of forest parameters. Remote Sens. Environ. 2016, 175, 32–42. [Google Scholar] [CrossRef]
- Chen, X.; Jiang, K.; Zhu, Y.; Wang, X.; Yun, T. Individual tree crown segmentation directly from UAV-borne LiDAR data using the PointNet of deep learning. Forests 2021, 12, 131. [Google Scholar] [CrossRef]
- Quan, Y.; Li, M.; Hao, Y.; Liu, J.; Wang, B. Tree species classification in a typical natural secondary forest using UAV-borne LiDAR and hyperspectral data. GISci. Remote Sens. 2023, 60, 2171706. [Google Scholar] [CrossRef]
- Guo, Q.; Su, Y.; Hu, T.; Zhao, X.; Wu, F.; Li, Y.; Liu, J.; Chen, L.; Xu, G.; Lin, G. An integrated UAV-borne lidar system for 3D habitat mapping in three forest ecosystems across China. Int. J. Remote Sens. 2017, 38, 2954–2972. [Google Scholar] [CrossRef]
- Xu, D.; Chen, G.; Jing, W. A single-tree point cloud completion approach of feature fusion for agricultural robots. Electronics 2023, 12, 1296. [Google Scholar] [CrossRef]
- Ge, B.; Chen, S.; He, W.; Qiang, X.; Li, J.; Teng, G.; Huang, F. Tree Completion Net: A Novel Vegetation Point Clouds Completion Model Based on Deep Learning. Remote Sens. 2024, 16, 3763. [Google Scholar] [CrossRef]
- Xu, H.; Huai, Y.; Zhao, X.; Meng, Q.; Nie, X.; Li, B.; Lu, H. SK-TreePCN: Skeleton-Embedded Transformer Model for Point Cloud Completion of Individual Trees from Simulated to Real Data. Remote Sens. 2025, 17, 656. [Google Scholar] [CrossRef]
- Yurtseven, H.; Çoban, S.; Akgül, M.; Akay, A.O. Individual tree measurements in a planted woodland with terrestrial laser scanner. Turk. J. Agric. For. 2019, 43, 192–208. [Google Scholar] [CrossRef]
- Xu, H.; Chen, W.; Liu, H. Single-wood DBH and tree height extraction using terrestrial laser scanning. J. Forest Environ. 2019, 39, 524–529. [Google Scholar]
- Ko, B.; Park, S.; Park, H.; Lee, S. Measurement of tree height and diameter using terrestrial laser scanner in coniferous forests. J. Environ. Sci. Int. 2022, 31, 479–490. [Google Scholar] [CrossRef]
- Liu, Y.; Wu, X.-Q. 3D shape completion via deep learning: A method survey. J. Graph. 2023, 44, 201–215. [Google Scholar]
- Li, Y.; Wu, X.; Chrysathou, Y.; Sharf, A.; Cohen-Or, D.; Mitra, N.J. Globfit: Consistently fitting primitives by discovering global relations. In Proceedings of the ACM SIGGRAPH 2011, SIGGRAPH 2011, Vancouver, BC, Canada, 7–11 August 2011; pp. 1–12. [Google Scholar]
- Kazhdan, M.; Hoppe, H. Screened poisson surface reconstruction. ACM Trans. Graph. (TOG) 2013, 32, 29. [Google Scholar] [CrossRef]
- Nan, L.; Xie, K.; Sharf, A. A search-classify approach for cluttered indoor scene understanding. ACM Trans. Graph. (TOG) 2012, 31, 137. [Google Scholar] [CrossRef]
- Kim, J.; Kwon, H.; Yang, Y.; Yoon, K. Learning Point Cloud Completion without Complete Point Clouds: A Pose-Aware Approach. In Proceedings of the 2023 International Conference on Computer Vision, Paris, France, 2–3 October 2023; pp. 14157–14167. [Google Scholar]
- Li, Y.; Dai, A.; Guibas, L.; Nießner, M. Database-assisted object retrieval for real-time 3d reconstruction. In Computer Graphics Forum; Wiley Online Library: Hoboken, NJ, USA, 2015; pp. 435–446. [Google Scholar]
- Xie, H.; Yao, H.; Zhou, S.; Mao, J.; Zhang, S.; Sun, W. Grnet: Gridding residual network for dense point cloud completion. In Proceedings of the European Conference on Computer Vision, Glasgow, UK, 23–28 August 2020; Springer: Berlin/Heidelberg, Germany, 2020; pp. 365–381. [Google Scholar]
- Wang, X.; Ang, M.H.; Lee, G.H. Voxel-based network for shape completion by leveraging edge generation. In Proceedings of the IEEE/CVF International Conference on Computer Vision, Montreal, BC, Canada, 11–17 October 2021; pp. 13189–13198. [Google Scholar]
- Yi, L.; Gong, B.; Funkhouser, T. Complete & label: A domain adaptation approach to semantic segmentation of lidar point clouds. In Proceedings of the IEEE/CVF Conference on Computer Vision and Pattern Recognition, Nashville, TN, USA, 19–25 June 2021; pp. 15363–15373. [Google Scholar]
- Hu, T.; Han, Z.; Shrivastava, A.; Zwicker, M. Render4Completion: Synthesizing multi-view depth maps for 3D shape completion. In Proceedings of the IEEE/CVF International Conference on Computer Vision Workshops, Seoul, Republic of Korea, 27–28 October 2019. [Google Scholar]
- Hu, T.; Han, Z.; Zwicker, M. 3D shape completion with multi-view consistent inference. In Proceedings of the AAAI Conference on Artificial Intelligence, New York, NY, USA, 7–12 February 2020; pp. 10997–11004. [Google Scholar]
- Tang, J.; Han, X.; Pan, J.; Jia, K.; Tong, X. A skeleton-bridged deep learning approach for generating meshes of complex topologies from single rgb images. In Proceedings of the IEEE/CVF Conference on Computer Vision and Pattern Recognition, Long Beach, CA, USA, 15–20 June 2019; pp. 4541–4550. [Google Scholar]
- Li, Y.; Yu, Z.; Choy, C.; Xiao, C.; Alvarez, J.M.; Fidler, S.; Feng, C.; Anandkumar, A. Voxformer: Sparse voxel transformer for camera-based 3d semantic scene completion. In Proceedings of the IEEE/CVF Conference on Computer Vision and Pattern Recognition, Vancouver, BC, Canada, 17–24 June 2023; pp. 9087–9098. [Google Scholar]
- Wen, X.; Xiang, P.; Han, Z.; Cao, Y.; Wan, P.; Zheng, W.; Liu, Y. Pmp-net: Point cloud completion by learning multi-step point moving paths. In Proceedings of the IEEE/CVF Conference on Computer Vision and Pattern Recognition, Nashville, TN, USA, 19–25 June 2021; pp. 7443–7452. [Google Scholar]
- Li, S.; Gao, P.; Tan, X.; Wei, M. Proxyformer: Proxy alignment assisted point cloud completion with missing part sensitive transformer. In Proceedings of the IEEE/CVF Conference on Computer Vision and Pattern Recognition, Vancouver, BC, Canada, 17–24 June 2023; pp. 9466–9475. [Google Scholar]
- Rong, Y.; Zhou, H.; Yuan, L.; Mei, C.; Wang, J.; Lu, T. Cra-pcn: Point cloud completion with intra-and inter-level cross-resolution transformers. In Proceedings of the AAAI Conference on Artificial Intelligence, Vancouver, BC, Canada, 26–27 February 2024; pp. 4676–4685. [Google Scholar]
- Qi, C.R.; Su, H.; Mo, K.; Guibas, L.J. Pointnet: Deep learning on point sets for 3d classification and segmentation. In Proceedings of the IEEE Conference on Computer Vision and Pattern Recognition, Honolulu, HI, USA, 21–26 July 2017; pp. 652–660. [Google Scholar]
- Yuan, W.; Khot, T.; Held, D.; Mertz, C.; Hebert, M. Pcn: Point completion network. In Proceedings of the 2018 International Conference on 3D Vision (3DV), Verona, Italy, 5–8 September 2018; IEEE: Piscataway, NJ, USA, 2018; pp. 728–737. [Google Scholar]
- Yang, Y.; Feng, C.; Shen, Y.; Tian, D. Foldingnet: Point cloud auto-encoder via deep grid deformation. In Proceedings of the IEEE Conference on Computer Vision and Pattern Recognition, Salt Lake City, UT, USA, 18–23 June 2018; pp. 206–215. [Google Scholar]
- Wen, X.; Li, T.; Han, Z.; Liu, Y. Point cloud completion by skip-attention network with hierarchical folding. In Proceedings of the IEEE/CVF Conference on Computer Vision and Pattern Recognition, Seattle, WA, USA, 13–19 June 2020; pp. 1939–1948. [Google Scholar]
- Huang, Z.; Yu, Y.; Xu, J.; Ni, F.; Le, X. Pf-net: Point fractal network for 3d point cloud completion. In Proceedings of the IEEE/CVF Conference on Computer Vision and Pattern Recognition, Seattle, WA, USA, 13–19 June 2020; pp. 7662–7670. [Google Scholar]
- Vaswani, A.; Shazeer, N.; Parmar, N.; Uszkoreit, J.; Jones, L.; Gomez, A.N.; Kaiser, A.; Polosukhin, I. Attention is all you need. In Proceedings of the 31st Conference on Neural Information Processing Systems (NIPS 2017), Long Beach, CA, USA, 4–9 December 2017. [Google Scholar]
- Yu, X.; Rao, Y.; Wang, Z.; Liu, Z.; Lu, J.; Zhou, J. Pointr: Diverse point cloud completion with geometry-aware trans-formers. In Proceedings of the IEEE/CVF International Conference on Computer Vision, Montreal, BC, Canada, 11–17 October 2021; pp. 12498–12507. [Google Scholar]
- Zhao, H.; Jiang, L.; Jia, J.; Torr, P.H.; Koltun, V. Point transformer. In Proceedings of the IEEE/CVF International Conference on Computer Vision, Montreal, BC, Canada, 11–17 October 2021; pp. 16259–16268. [Google Scholar]
- Xiang, P.; Wen, X.; Liu, Y.; Cao, Y.; Wan, P.; Zheng, W.; Han, Z. Snowflakenet: Point cloud completion by snowflake point deconvolution with skip-transformer. In Proceedings of the IEEE/CVF International Conference on Computer Vision, Montreal, BC, Canada, 11–17 October 2021; pp. 5499–5509. [Google Scholar]
- Zhou, H.; Cao, Y.; Chu, W.; Zhu, J.; Lu, T.; Tai, Y.; Wang, C. Seedformer: Patch seeds based point cloud completion with upsample transformer. In Proceedings of the European Conference on Computer Vision, Tel Aviv, Israel, 23–27 October 2022; Springer: Berlin/Heidelberg, Germany, 2022; pp. 416–432. [Google Scholar]
- Fan, H.; Su, H.; Guibas, L.J. A point set generation network for 3d object reconstruction from a single image. In Proceedings of the IEEE Conference on Computer Vision and Pattern Recognition, Honolulu, HI, USA, 21–26 July 2017; pp. 605–613. [Google Scholar]
- Jucker, T.; Caspersen, J.; Chave, J.; Antin, C.; Barbier, N.; Bongers, F.; Dalponte, M.; van Ewijk, K.Y.; Forrester, D.I.; Haeni, M. Allometric equations for integrating remote sensing imagery into forest monitoring programmes. Glob. Change Biol. 2017, 23, 177–190. [Google Scholar] [CrossRef]
- Xu, J.; Su, M.; Sun, Y.; Pan, W.; Cui, H.; Jin, S.; Zhang, L.; Wang, P. Tree Crown Segmentation and Diameter at Breast Height Prediction Based on BlendMask in Unmanned Aerial Vehicle Imagery. Remote Sens. 2024, 16, 368. [Google Scholar] [CrossRef]
- Fakhri, A.; Latifi, H.; Samani, K.M.; Fassnacht, F.E. CaR3DMIC: A novel method for evaluating UAV-derived 3D forest models by tree features. ISPRS J. Photogramm. Remote Sens. 2024, 208, 279–295. [Google Scholar] [CrossRef]
- Bogdanovich, E.; Perez-Priego, O.; El-Madany, T.S.; Guderle, M.; Pacheco-Labrador, J.; Levick, S.R.; Moreno, G.; Carrara, A.; Martín, M.P.; Migliavacca, M. Using terrestrial laser scanning for characterizing tree structural parameters and their changes under different management in a Mediterranean open woodland. For. Ecol. Manag. 2021, 486, 118945. [Google Scholar] [CrossRef]
- Puliti, S.; Pearse, G.; Surový, P.; Wallace, L.; Hollaus, M.; Wielgosz, M.; Astrup, R. For-instance: A uav laser scanning benchmark dataset for semantic and instance segmentation of individual trees. arXiv 2023, arXiv:2309.01279. [Google Scholar]
- Puliti, S.; McLean, J.P.; Cattaneo, N.; Fischer, C.; Astrup, R. Tree height-growth trajectory estimation using uni-temporal UAV laser scanning data and deep learning. Forestry 2023, 96, 37–48. [Google Scholar] [CrossRef]
- Kuželka, K.; Slavík, M.; Surový, P. Very high density point clouds from UAV laser scanning for automatic tree stem detection and direct diameter measurement. Remote Sens. 2020, 12, 1236. [Google Scholar] [CrossRef]
- Wieser, M.; Mandlburger, G.; Hollaus, M.; Otepka, J.; Glira, P.; Pfeifer, N. A case study of UAS borne laser scanning for measurement of tree stem diameter. Remote Sens. 2017, 9, 1154. [Google Scholar] [CrossRef]
- Girardeau-Montaut, D. CloudCompare; EDF R&D Telecom ParisTech: Paris, France, 2016. [Google Scholar]
- Noor, S.; Tajik, O.; Golzar, J. Simple random sampling. Int. J. Educ. Lang. Stud. 2022, 1, 78–82. [Google Scholar]
- Moenning, C.; Dodgson, N.A. Fast Marching Farthest Point Sampling; University of Cambridge, Computer Laboratory: Cambridge, UK, 2003. [Google Scholar]
- Lin, Y.; Habib, A. An adaptive down-sampling strategy for efficient point cloud segmentation. In Proceedings of the ASPRS 2015 Annual Conference, Tampa, FL, USA, 4–8 May 2015. [Google Scholar]
- Yu, X.; Rao, Y.; Wang, Z.; Lu, J.; Zhou, J. AdaPoinTr: Diverse point cloud completion with adaptive geometry-aware transformers. IEEE Trans. Pattern Anal. Mach. Intell. 2023, 45, 14114–14130. [Google Scholar] [CrossRef]


| Region | TrainSet | TestSet |
|---|---|---|
| CULS | 37 × 8 = 296 | 10 |
| NIBIO | 315 × 8 = 2520 | 81 |
| RMIT | 3 × 8 = 24 | 1 |
| SCION | 78 × 8 = 624 | 18 |
| TEWIEN | 53 × 8 = 424 | 11 |
| Total | 486 × 8 = 3888 | 121 |
| PlotID | TrainSet | TestSet |
|---|---|---|
| 150 | 35 × 8 = 280 | 8 |
| 151 | 42 × 8 = 336 | 10 |
| 152 | 27 × 8 = 216 | 6 |
| 153 | 31 × 8 = 248 | 7 |
| 155 | 28 × 8 = 224 | 7 |
| 157 | 31 × 8 = 248 | 7 |
| 158 | 21 × 8 = 168 | 5 |
| 159 | 23 × 8 = 184 | 5 |
| 160 | 32 × 8 = 256 | 7 |
| 161 | 24 × 8 = 192 | 5 |
| 162 | 16 × 8 = 128 | 3 |
| 163 | 24 × 8 = 192 | 5 |
| 164 | 17 × 8 = 136 | 4 |
| Total | 351 × 8 = 2808 | 79 |
| Region | SeedFormer | Ours | ||||
|---|---|---|---|---|---|---|
| L1_CD | L2_CD | FScore | L1_CD | L2_CD | FScore | |
| CULS | 3.61 | 0.43 | 97.39 | 3.75 | 0.47 | 96.19 |
| NIBIO | 3.95 | 0.51 | 95.66 | 4.18 | 0.59 | 94.61 |
| RMIT | 10.32 | 2.97 | 58.47 | 9.74 | 3.06 | 62.91 |
| SCION | 4.23 | 0.56 | 94.95 | 4.40 | 0.63 | 93.94 |
| TEWIEN | 6.51 | 1.24 | 84.04 | 6.57 | 1.38 | 83.34 |
| Average | 5.72 | 1.15 | 86.10 | 5.73 | 1.23 | 86.20 |
| PlotID | SeedFormer | Ours | ||||
|---|---|---|---|---|---|---|
| L1_CD | L2_CD | FScore | L1_CD | L2_CD | FScore | |
| 150 | 5.49 | 0.60 | 93.53 | 5.36 | 0.57 | 94.06 |
| 151 | 6.93 | 1.32 | 82.75 | 6.90 | 1.39 | 82.28 |
| 152 | 16.12 | 5.45 | 30.36 | 14.00 | 4.50 | 49.97 |
| 153 | 12.42 | 3.86 | 53.71 | 11.45 | 3.21 | 59.31 |
| 155 | 11.90 | 2.82 | 70.37 | 11.40 | 2.55 | 73.92 |
| 157 | 9.99 | 2.02 | 77.86 | 10.06 | 2.28 | 72.94 |
| 158 | 7.37 | 1.04 | 84.18 | 7.43 | 0.99 | 85.01 |
| 159 | 8.37 | 1.52 | 79.29 | 8.13 | 1.46 | 80.32 |
| 160 | 8.27 | 1.32 | 82.23 | 8.44 | 1.33 | 82.23 |
| 161 | 12.08 | 3.30 | 57.05 | 10.45 | 2.29 | 74.77 |
| 162 | 9.48 | 1.83 | 78.96 | 9.02 | 1.55 | 79.55 |
| 163 | 10.38 | 2.09 | 77.33 | 9.04 | 1.51 | 78.02 |
| 164 | 11.34 | 2.70 | 71.85 | 11.32 | 2.63 | 72.36 |
| Average | 10.01 | 2.30 | 72.65 | 9.46 | 2.02 | 75.75 |
| Method | CULS | NIBIO | RMIT | SCION | TUWIEN | L1_CD | L2_CD | FScore-0.01 (%) |
|---|---|---|---|---|---|---|---|---|
| RS | 3.89 | 4.17 | 9.75 | 4.3 | 6.43 | 5.71 | 1.17 | 86.54 |
| FPS | 3.66 | 4.46 | 11.33 | 4.77 | 7.25 | 6.29 | 1.44 | 82.47 |
| ADS | 7.74 | 4.27 | 10.22 | 4.49 | 6.92 | 5.92 | 1.33 | 85.04 |
| LRS (ours) | 3.75 | 4.18 | 9.74 | 4.40 | 6.57 | 5.73 | 1.21 | 86.20 |
| Region | Input | Completion (Seedformer) | Completion (Ours) | GT | ||||
|---|---|---|---|---|---|---|---|---|
| RMSE | RMSE | RMSE | RMSE | |||||
| CULS | 3.56 | 35 | 3.84 | 19 | 3.03 | 15 | 3.12 | 16 |
| NIBIO | 5.55 | 327 | 5.41 | 251 | 5.31 | 214 | 5.44 | 216 |
| RMIT | - | 4 | - | 4 | - | 4 | - | 4 |
| SCION | 4.60 | 91 | 5.73 | 70 | 5.67 | 68 | 4.62 | 68 |
| TEWIEN | 14.59 | 57 | 14.03 | 45 | 12.70 | 44 | 11.47 | 43 |
| Average | 6.43 | 514 | 6.60 | 389 | 6.11 | 345 | 6.18 | 347 |
| PlotID | Input | Completion (Seedformer) | Completion (Ours) | GT | ||||
|---|---|---|---|---|---|---|---|---|
| RMSE | RMSE | RMSE | RMSE | |||||
| 150 | 3.46 | 39 | 5.53 | 16 | 5.55 | 11 | 1.63 | 7 |
| 151 | 3.62 | 40 | 5.54 | 7 | 5.14 | 3 | 1.29 | 1 |
| 152 | - | 33 | 5.57 | 12 | 6.2 | 7 | 1.24 | 4 |
| 153 | - | 38 | 4.31 | 3 | 2.84 | 3 | 0.93 | 0 |
| 155 | - | 35 | 3.58 | 24 | 4.12 | 24 | 1.26 | 2 |
| 157 | - | 38 | 3.14 | 12 | 2.99 | 10 | 1.07 | 4 |
| 158 | 5.06 | 23 | 6.38 | 4 | 4.37 | 1 | 1.05 | 1 |
| 159 | - | 28 | 4.39 | 18 | 4.34 | 12 | 1.35 | 8 |
| 160 | 3.17 | 37 | 4.75 | 8 | 4.77 | 3 | 1.19 | 2 |
| 161 | 1.17 | 27 | 8.49 | 21 | 5.68 | 17 | 1.75 | 17 |
| 162 | - | 19 | 4.62 | 9 | 3.18 | 6 | 1.69 | 5 |
| 163 | - | 29 | 5.35 | 8 | 4.42 | 0 | 0.67 | 0 |
| 164 | - | 21 | 6.15 | 15 | 6.64 | 8 | 0.68 | 0 |
| Average | 3.64 | 407 | 5.17 | 157 | 4.73 | 105 | 1.22 | 51 |
| Method | CULS | NIBIO | RMIT | SCION | TUWIEN | L1_CD | L2_CD | FScore-0.01 (%) |
|---|---|---|---|---|---|---|---|---|
| PCN [29] | 7.47 | 6.55 | 51.41 | 7.47 | 15.47 | 17.67 | 19.52 | 58.9 |
| GRNet [18] | 5.45 | 5.37 | 14.33 | 5.47 | 7.93 | 7.71 | 2.87 | 78.3 |
| PoinTr [34] | 5.01 | 4.67 | 13.11 | 5.02 | 8.37 | 7.24 | 2.08 | 76.03 |
| AdaPoinTr [51] | 5.77 | 5.14 | 23.47 | 5.67 | 9.78 | 9.97 | 6.26 | 72.33 |
| SnowFlakeNet [36] | 3.77 | 4.1 | 10.48 | 4.33 | 6.01 | 5.86 | 1.18 | 85.18 |
| SeedFormer [37] | 3.61 | 3.95 | 10.32 | 4.34 | 6.51 | 5.72 | 1.15 | 86.1 |
Disclaimer/Publisher’s Note: The statements, opinions and data contained in all publications are solely those of the individual author(s) and contributor(s) and not of MDPI and/or the editor(s). MDPI and/or the editor(s) disclaim responsibility for any injury to people or property resulting from any ideas, methods, instructions or products referred to in the content. |
© 2025 by the authors. Licensee MDPI, Basel, Switzerland. This article is an open access article distributed under the terms and conditions of the Creative Commons Attribution (CC BY) license (https://creativecommons.org/licenses/by/4.0/).
Share and Cite
Su, Y.; Chen, Z.; Xue, X. TreeDBH: Dual Enhancement Strategies for Tree Point Cloud Completion in Medium–Low Density UAV Data. Forests 2025, 16, 667. https://doi.org/10.3390/f16040667
Su Y, Chen Z, Xue X. TreeDBH: Dual Enhancement Strategies for Tree Point Cloud Completion in Medium–Low Density UAV Data. Forests. 2025; 16(4):667. https://doi.org/10.3390/f16040667
Chicago/Turabian StyleSu, Yunlian, Zhibo Chen, and Xiaojing Xue. 2025. "TreeDBH: Dual Enhancement Strategies for Tree Point Cloud Completion in Medium–Low Density UAV Data" Forests 16, no. 4: 667. https://doi.org/10.3390/f16040667
APA StyleSu, Y., Chen, Z., & Xue, X. (2025). TreeDBH: Dual Enhancement Strategies for Tree Point Cloud Completion in Medium–Low Density UAV Data. Forests, 16(4), 667. https://doi.org/10.3390/f16040667