Abstract
The conversion of degraded ecosystems to perennial vegetation in water-limited regions creates conflicting demands for soil water maintenance and carbon sequestration. However, current understanding of these competing demands is limited. In this study, to quantify the trade-off resulting from land-use conversion (converting cropland into forest, shrub, and grassland) in the Loess Plateau, 2775 observations of soil organic carbon (SOC) stocks (to a depth of 100 cm) and 2654 observations of soil water storage (SWS) (to a depth of 500 cm) from peer-reviewed papers and measured data were synthesized. The results showed that (1) land-use conversion greatly influenced the trade-off, and in general, converting cropland into natural grassland and evergreen trees performed relatively better in carbon sequestration and soil water maintenance; (2) in rainfall zones less than 550 mm, natural grassland exhibited higher advantages in increasing SOC stock but maintained a lower SWS depletion, while forest was a better choice for rainfall greater than 550 mm; and (3) with increasing restoration age, SOC stock and SWS depletion both increased significantly; nevertheless, natural grassland appeared to be sustainable and stable to achieve a win–win result. Moreover, with increasing age, an accumulation of 0.7 Mg ha−1 SOC stock in the upper 100 cm was associated with an approximately 5.14 mm SWS decrease in the 0–500 cm soil layers. Overall, this study provides practical insights for land and water managers on how to achieve win–win results for soil- and water-related ecosystem services during ecological restoration in water-limited regions.
1. Introduction
Drylands comprise approximately 40% of the global terrestrial ecosystem surface and profoundly contribute to the carbon cycle [1]. However, dryland ecosystems generally suffer from severe land degradation and soil erosion due to irrational land-use (e.g., overgrazing or excess land reclamation) [2]. Converting croplands into perennial vegetation is regarded as an effective way to restore degraded ecosystems worldwide, and the benefits of C sequestration have been well documented in numerous studies [3,4,5]. In 1999, large-scale ecological restoration was implemented on the Loess Plateau by converting cropland into forests, shrubs, and grasslands [6]. Although the initial purpose was to prevent and cure soil erosion, it had a profound impact on improving both the rate of change and the amount of soil C [7]. Nevertheless, converting degraded ecosystems into perennial vegetation in the Loess Plateau has led to negative impacts, one of which is that soils in restored ecosystems have become severely dry in both the shallow and deep layers [8,9] because of the low precipitation, high evaporation, and high water consumption of the introduced vegetation [10]. Thus, the restoration of degraded ecosystems in arid and semi-arid environments has often been less effective than expected because of soil water shortages, resulting in tree growth retardation or even local or regional die-off. In addition, the natural regeneration was poor. Consequently, strong trade-off between soil water maintenance and carbon sequestration exists during the implementation of ecological restoration in this region [11,12,13].
In general, soil moisture is the basis for vegetation growth and related ecosystem services, such as C sequestration and biodiversity [11]. Therefore, soil water maintenance can be regarded as a supportive service that plays a vital role in regulating various ecological functions in arid environments [14]. Feng et al. concluded that revegetation in the Loess Plateau approached sustainable water resource limits in terms of C sequestration [15]. This indicates that sustainable and effective ecological restoration with the goal of carbon sequestration in water-limited areas should consider the trade-off between soil water maintenance and carbon sequestration. However, the general patterns of the trade-off between these two vital ecological soil functions at a regional scale remain challenging because of the expense and time associated with deep sampling.
Previous studies have revealed that land-use conversion types, climatic gradients, and restoration ages exert major influences on soil C sequestration and soil water dynamics. For example, converting croplands into forests, shrubs, and grasslands strongly influences C cycling by altering C sequestration, turnover, soil C loss, and vegetation biomass [16]. Additionally, different vegetation types and structures exhibited significant influences on soil at both shallow and deep depths. Moreover, Choudhury, Fiyaz, Mohapatra, and Ngachan reported that climatic gradients affected the soil water availability and the decomposition of soil organic matter [17]. Similar results were reported by Ruiz-Sinoga and Martinez-Murillo [18]. With increasing restoration age, the quality and quantity of C inputs improve, accompanied by a new microclimatic regime and enhanced organic matter protection, which contribute to SOC accumulation over time [19]. Nevertheless, soil desiccation intensified with the restoration ages, especially in the deep soil layer [20]. In summary, the factors mentioned above would significantly affect the trade-off between soil water maintenance and carbon sequestration, especially in water-limited areas [21]. Achieving win–win results between them is key to supporting sustainable vegetation restoration, especially under the multi-target trade-off in the Loess Plateau, to promote sustainable development.
Therefore, a comprehensive analysis of data on changes in soil C sequestration and soil water depletion resulting from land-use conversion may help in designing ecological programs. In particular, the assessment of land-use conversion effects on soil C and water may help achieve the specific goal of sustainable ecosystem development from the perspectives of water resource protection and carbon sequestration. We hypothesize that during the process of vegetation restoration, a trade-off exists in the changes in soil water and carbon. This trade-off is influenced by various factors including the type of land-use conversion, climate conditions, and the duration of restoration efforts. In this study, we synthesized publications and original measured data to evaluate the effects of three main land-use conversion types, namely, forest, shrub, and abandoned grassland, on maintaining soil water while increasing SOC stock. The aims of this study were to quantify the effects of land-use conversion type, rainfall zone, and restoration age on the trade-off between soil C sequestration and water maintenance, and to identify the optimal restoration models to achieve a win–win situation by increasing soil C with lower water depletion.
2. Method and Material
2.1. Data Compilation
To assess the effects of different land-use conversion types on soil water maintenance and C sequestration in the Loess Plateau, we built a database in this study that mainly included two parts: (1) data from peer-reviewed publications and (2) our original measured data. For the first data source, we collected relevant data on soil organic carbon (SOC content), SOC stock, soil water content (SWC), and soil water storage (SWS) by searching publications through the Web of Science (www.webofknowledge.com, accessed on 3 August 2023), Google Scholar search engines (scholar.google.com, accessed on 3 August 2023), and China National Knowledge Infrastructure (www.cnki.net, accessed on 3 August 2023) with the keywords “soil organic carbon” or “soil water” or “soil moisture” and “Loess Plateau”. Soil water content (SWC) refers to the amount of water present in the soil relative to the dry weight of the soil, which is typically measured using the gravimetric method. It is expressed as a percentage or g/g. In contrast, soil water storage (SWS) represents the total amount of water stored in the soil within a given volume and is calculated by multiplying soil water content by the soil bulk density and depth.
The studies included in this meta-analysis were selected based on the following inclusion criteria: (1) comparison of at least one land-use conversion type (forest, shrub, or natural grassland) to a control land-use type (cropland); (2) measurement of at least one of the variables (SOC content, SOC stock, SWC, or SWS) in both revegetated land and cropland; (3) availability of data on the number of years since conversion, either directly provided or derivable. Exclusion criteria involved studies without clear data on land-use conversion or those focusing on laboratory-based experiments rather than field observations. We acknowledge that potential biases could affect the results of this meta-analysis. Geographical bias might arise due to the uneven distribution of studies across regions, as the majority of data were sourced from loess hilly region. Furthermore, methodological biases may be present, particularly in the measurement of soil moisture content (SWC) and storage (SWS), with variations in sampling depth and moisture determination techniques across studies. To mitigate these biases, we focused on studies employing similar measurement techniques, such as oven-drying at 105 °C or neutron probe, and included only field-based studies. Additionally, the dataset may be influenced by publication bias, as studies reporting significant effects of land-use conversion are more likely to be published. We sought to address this by systematically searching multiple databases, including Web of Science, Google Scholar, and China National Knowledge Infrastructure, to capture a comprehensive range of studies. Nevertheless, specific criteria were used for different variables. For studies related to SOC content or SOC stocks, only revegetation in the first rotation was considered and data for 0–100 cm or within 100 cm were extracted. For papers related to SWC or SWS, soil moisture (gravimetric or volumetric) was determined at various depths within 0–500 cm (0–100 cm, 100–200 cm, 200–300 cm, 300–400 cm, and 400–500 cm) and in the field (laboratory experiments excluded). Methods used to determine soil moisture were oven-dry at 105 °C [22] or neutron probe [23]. The original measured data were collected from the Zhifanggou watershed [24] and the Ziwuling Forest area [25] in Ansai and Fu Counties of Shaanxi Province, respectively. Typical vegetation types, including forests, shrubs, grasslands, and control croplands, were selected. Detailed information regarding the sampling method can be found in Li et al. [26]. The final dataset comprised 131 studies, including 2775 and 2654 observations from databases related to soil C and water, respectively, covering 45 sites in six provinces (Figure 1).
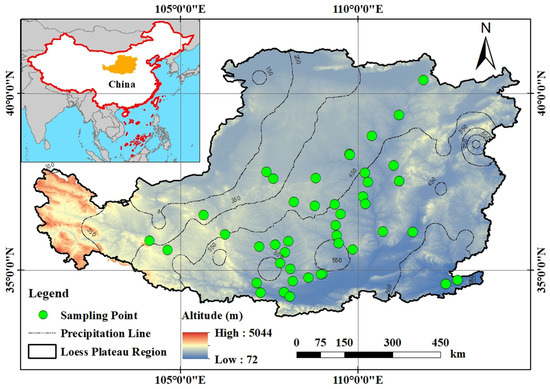
Figure 1.
The distribution of sampling sites in the Loess Plateau.
Raw data were obtained from tables or graphs extracted using the GetData Graph Digitizer (version 2.24, Russian Federation). Information, including sources of data, location, climate, current land-use type (forest, shrub, and grassland), tree species, years since vegetation restoration, soil depth, amount of SOC content or SOC stocks in each 0–100 cm soil layer, and amount of SWC or SWS in each 0–500 cm soil layer, was collected. When more than one depth was sampled, the SOC stock or SWS at all depths were summed. Based on the actual situation in the Loess Plateau, the ecological restoration age was divided into four groups: 0–10, 10–20, 20–30, and >30 years. Precipitation was divided into three groups: <450, 450–550, and >550 mm.
2.2. Data Calculation
2.2.1. Calculation of SOC Stocks and Soil Water Storage
The SOC stocks were calculated using the following equation [27]:
where SOCSd is the soil organic carbon stocks at depth d (Mg ha−1), SOCd is the soil organic carbon concentration at depth d (g kg−1), BD (g cm−3) is the soil bulk density, d is the soil thickness (cm), and SOCS100 is the soil organic carbon stocks at a depth of 100 cm (Mg ha−1).
SOCSd = SOCd × BD × d
SWS was calculated in two steps to calculate the soil water storage (SWS). Firstly, we transformed the gravimetrical soil water content (SWCg) into volumetric soil water content (SWCθ) according to the methods introduced by Jia, Wang, Shao, Luo, and Zhang [28] and Bai [29]. During this process, we tested its stability and suitability using the model in Figure S4. Secondly, SWS was derived using the following equations [30]:
where SWSd is the soil water storage (mm) at depth d; SWCθ is the volumetric soil water content (cm3 cm−3); d is the soil thickness (cm); ρ is the water density (g cm−3); and UFC is a unit conversion factor (10 mm cm−1). SWS500 is the total soil water storage (mm) at depth 0–500 cm.
SWSd = SWCθ × d × ρ−1 × UFC
2.2.2. Estimation and Validation of Soil Bulk Density
There were studies in which soil bulk density (BD) had been measured but lacked data at a specific depth; for example, data were measured in the first 60 cm but lacked that in the 60–80 cm and 80–100 cm layers. For these, we constructed a quantitative relationship between the upper and lower layers based on the random forest model in the Loess Plateau and then predicted the missing data using the established models (Figure S1). All predicted models were tested using 10-fold cross-validation (the code is shown in Supplementary Box S1). Nevertheless, for studies in which BD was not measured, we used an empirical relationship (Equations (5) and (6)) between SOC content and BD [31], which was commonly accepted [27,32]. Equations (5) and (6) are empirical formulas used to estimate BD based on SOC content. These formulas are commonly applied in the Loess Plateau due to the difficulty in directly obtaining BD data, providing a reliable method for calculating SOC stock and soil water storage (SWS). The input variables required in this model were much less than Model6 [33] but had a similar R2 (Table S1).
BD = −0.1229 × ln (SOC) + 1.2901 (for SOC < 6%)
BD = 1.3774 × e−0.0413SOC (for SOC > 6%)
2.2.3. Transformation and Estimation of SOC and SWC in Deep Soil Layers
Of the data related SOC collected from the literature, the SOC stocks units were all transformed into “Mg ha−1”. If the samples reported only soil organic matter (SOM), their SOC values were calculated from the relationship between SOM and SOC using Equation (7) [27]:
SOC = 0.58 × SOM
To increase the comparability of SOC or SWC derived from different studies, the random forest model was used following these steps: (1) establish the quantitative relationship between upper and lower layers based on training dataset, in which the relationships included SOC40–60 and SOC60–80 (Figure S2A), SOC60–80 and SOC80–100 (Figure S2B), SWC200–300 and SWC300–400 (Figure S3A), and SWC300–400 and SWC400–500 (Figure S3B); (2) perform 10-fold cross-validation for the established models based on testing dataset (Supplementary Box S1); and (3) predict the missing data based on established models.
2.2.4. Meta-Analysis
Unweighted meta-analysis, as described in previous studies [26,34], was adopted to quantify the degree of change in SOCS100 and SWS500 in revegetated lands compared with cropland. This method was chosen primarily because it allows for a larger sample size, as many studies only reported mean values without deviations, which would not meet the requirements of classical meta-analysis. Furthermore, the use of unweighted analysis is often applied when studies exhibit limited data on variability (e.g., standard deviation or standard error), which is the case for most studies included in our meta-analysis. Additionally, to address the impact of study heterogeneity on the results, we provided confidence intervals for the effect sizes in the analysis. The inclusion of confidence intervals allows us to assess the variability and sensitivity of the data, offering insight into how the results might change under different assumptions or data variations. The interpretation of these confidence intervals is discussed in the revised manuscript to provide more context on the robustness of the findings.
In this study, SSE100 and SWDE500 were calculated as the response size (Equations (8) and (9)). SOC Stock Effect at 0–100 cm (SSE100) represented the relative change in SOC stock between revegetated land (such as forest, shrub, and grassland) and cropland in the 0–100 cm soil layer. A positive SSE100 value indicates an increase in SOC stock on the revegetated land, while a negative value indicates a decrease (as detailed in Equation (8)). Soil Water Depletion Effect at 0–500 cm (SWDE500) represented the soil water storage depletion in the 0–500 cm soil layer, comparing revegetated land to cropland. It reflects the extent of water loss in deeper soil layers after land conversion (as detailed in Equation (9)). The Ratio of SOC Stock Effect to Water Depletion (RSSWD) (Equation (10)) was used to quantify the trade-off between SOC stock and soil water depletion. A higher RSSWD value indicates a stronger conflict between water availability and carbon sequestration, meaning that a greater degree of carbon is sequestered at the expense of soil water. Conversely, a lower RSSWD value suggests a relative abundance of water compared to carbon storage.
where SOCS100 denotes the soil organic carbon stock in the 0–100 cm soil profile of the revegetated land (Mg ha−1), SOCSck100 denotes the soil organic carbon stock in the 0–100 cm soil profile of the cropland (Mg ha−1), SWS500 denotes soil water storage in the 0–500 cm soil profile of the revegetated land (mm), and SWSck500 denotes soil water storage in the 0–500 cm soil profile of the cropland (mm).
A method reported earlier [35,36] was used for calculating the 95% confidence interval (CI) of the means for SSE100 or SWDE500, as shown in Equations (11) and (12):
where SEtotal denotes the standard error of the response size for the SSE100 or SWDE500 and vs and N are the variances in the response size for the SSE100 or SWDE500 and the number of observations, respectively. In this study, the 95% CI was calculated for the overall data and for each category, and the observed response sizes were considered statistically different from zero if the 95% CI did not include zero.
95% CI = 1.96 × SEtotal
2.3. Data Analysis
The Kruskal–Wallis rank sum test, performed by the kruskal.test function in R, was used to test the effect of land-use conversion types, tree species, rainfall zones, and restoration ages on SSE100 or SWDE500. Differences were considered statistically significant at p < 0.05. This method is equivalent to single-factor ANOVA, but is used when only a few individuals are included in at least one of the samples and the data are not normally distributed.
The random forest model based on the R package randomForest (https://www.rdocumentation.org/packages/randomForest, accessed on 7 May 2024) was used to quantify the relationships of BD, SOC content, and SWC between different soil layers, and to predict the lack of data according to these quantitative relationships. Compared with traditional regression models or other machine learning methods, the random forest model can perform better predictions without any hypotheses for the data [37]. To assess model stability, a self-written code for 10-fold cross-validation was used (Supplementary Box S1). In this study, the mean standardized mean square error of the testing dataset (MNMSE) in all the established models was basically equal to 1 − and the MNMSE0 of training dataset was relatively low. This indicated that the models established in this study to predict BD, SOC, and SWC were stable and valid.
3. Results
3.1. The Effects of Land-Use Conversion on the Trade-off Between SSE100 and SWDE500
When land was brought under perennial vegetation, the changes in SOCS and SWS showed distinct directions, irrespective of the type of vegetation (forest, shrub, or grassland) (Figure 2, Figures S5 and S6). In detail, the mean SSE100 of forest (0.67 ± 0.14) was higher than in shrub (0.54 ± 0.13) and in grassland (0.38 ± 0.11) (Figure 2). In contrast, the mean SWDE500s in forest, shrub, and grassland were −0.40 ± 0.03, −0.40 ± 0.02, and −0.21 ± 0.04, respectively. Grasslands have relatively low water consumption and soil C sequestration, which is different from forests and shrubs. However, the RSSWD for the different land-use conversion types were ranked in the following order: grassland (1.86) > forest (1.66) > shrubs (1.37). In addition, tree species had a significant impact on the trade-off between soil water maintenance and carbon sequestration (Figure 2). For example, similar SWDE500 was found between deciduous (0.41 ± 0.05) and evergreen (0.41 ± 0.04) trees but the latter showed much higher RSSWD (2.40) than the former (1.47). These results indicate that the performance of grasslands in maintaining soil water and increasing SOC content in semi-arid areas was higher than that of forests and shrubs, and that of evergreen trees was higher than that of deciduous trees.
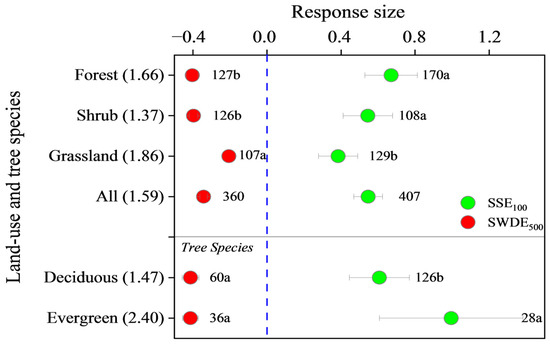
Figure 2.
The impact of vegetation restoration under the “Grain for Green” Program with different vegetation types (forest, shrub, grassland) and tree species (deciduous, evergreen) on SSE100 and SWDE500 in the Loess Plateau. Note: red and green dots with error bars denote the overall mean response values and the 95% CI of SSE100 and SWDE500, respectively, and the numbers of observations are to the right of the dots. Different lower−case letters mean significant differences among different land-use conversion types or tree species (p < 0.05); numbers in parentheses are the RSSWD values.
3.2. The Effects of Rainfall Zones on the Trade-off Between SSE100 and SWDE500
Rainfall zones significantly affected the trade-off between soil water maintenance and carbon sequestration, and their effects differed among the three land-use conversion types (Figure 3). For example, in the case of forest, higher SSE100 (0.75 ± 0.25) and lower SWDE500 (−0.24 ± 0.11) occurred, which resulted a higher RSSWD (3.06) in the >550 mm rainfall zone (Figure 3A). Nevertheless, the RSSWDs in the 450–550 mm and <450 mm were 1.59 and 0.38, respectively. For shrubs, a higher SSE100 indicates a higher SWDE500, and vice versa. The RSSWDs in the <450, 450–550, and >550 mm zones were 1.07, 1.28, and 0.17, respectively (Figure 3B). Natural grassland had lower water depletion (−0.08 to −0.23), especially the >550 mm rainfall zone (−0.08 ± 0.13), and therefore, relatively higher RSSWD was found (1.56–2.95) compared with shrub (0.17–1.28) (Figure 3C). These results indicate that converting croplands into forests in rainfall zones of >550 mm may contribute to maintaining soil water and increasing carbon sequestration. Furthermore, grassland may be a better restoration method in rainfall zones of <450 mm and 450–550 mm compared with forests and shrubs to achieve this goal.
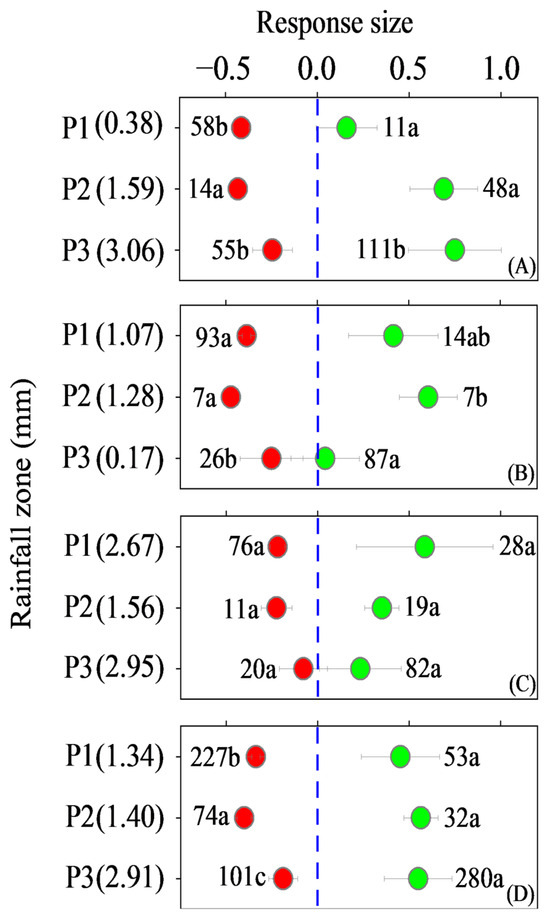
Figure 3.
The impact of vegetation restoration under the “Grain for Green” Program with different rainfall zones and vegetation types (forest, shrub, grassland) on SSE100 and SWDE500 in the Loess Plateau. Note: (A) forest; (B) shrub; (C) grassland; (D) All. P1, P2, and P3 mean <450 mm, 450–550 mm, and >550 mm. Red and green dots with error bars denote the overall mean response values and the 95% CI of SSE100 and SWDE500, respectively, and the numbers of observations are to the right of the dots. Different lower−case letters mean significant differences among different rainfall zones under the same land-use conversion type (p < 0.05); numbers in parentheses are the RSSWD values.
3.3. The Effects of Restoration Ages on the Trade-off Between SSE100 and SWDE500
Overall, the number of years that elapsed after restoration had adverse effects on soil water and carbon sequestration, and the trends among the different vegetation types were similar (Figure 4). In the cases of forest and shrub, SWDE500 was significantly lower after >10 years than <10 years, and remained at relatively stable levels (−0.42 to −0.48 in forest, −0.38 to −0.47 in shrub) (Figure 4A,B). In addition, with the accumulation of SOC, a higher RSSWD occurred after 20 years, whereas the RSSWD was <1 in the first 20 years (Figure 4A,B). Although the depletion of SWS increased with restoration ages (−0.14 to −0.30), RSSWD in grassland was between 1.41 and 3.23 (Figure 4C). These results indicate that converting cropland into grassland may achieve the stable benefit of maintaining soil water and increasing SOC content compared to forests and shrubs.
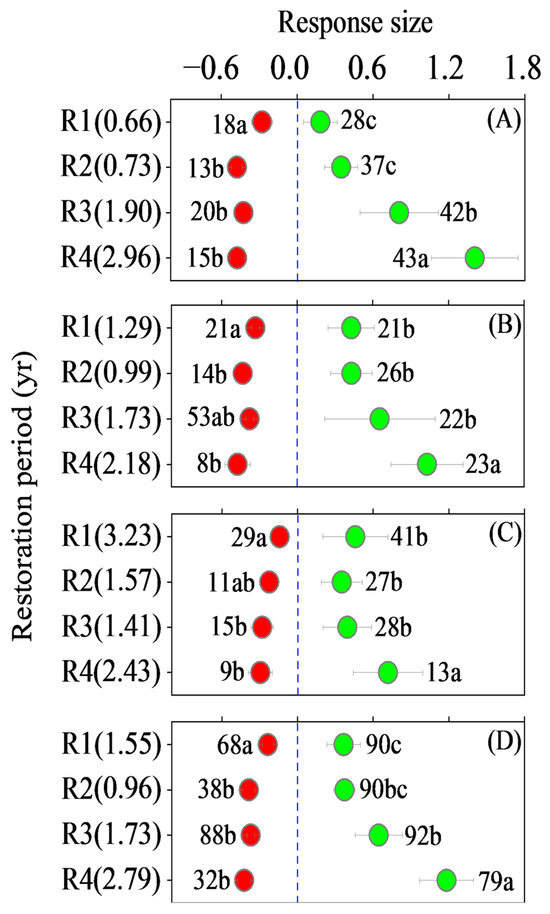
Figure 4.
The impact of vegetation restoration under the “Grain for Green” Program with different restoration periods and vegetation types (forest, shrub, grassland) on SSE100 and SWDE500 in the Loess Plateau. Note: (A) forest; (B) shrub; (C) grassland; (D) All. R1, R2, R3, and R4 mean <10, 10–20, 20–30, and >30 years. Red and green dots with error bars denote the overall mean response values and the 95% CI of SSE100 and SWDE500, respectively, and the numbers of observations are to the right of the dots. Different lower-case letters mean significant differences among different restoration periods under the same land-use conversion type (p < 0.05); numbers in parentheses are the RSSWD values.
4. Discussion
4.1. Trade-off Between Soil Water Maintenance and Carbon Sequestration Due to Large-Scale Ecological Restoration
4.1.1. Land-Use Conversion Types
The contribution of ecological restoration to ecosystem services usually varies with vegetation type, rainfall zone, restoration period, and topographic conditions [11,12,13]. The conversion of cropland into forest and shrubs resulted in higher carbon sequestration and soil water consumption than grassland (Figure 2). This can be explained by the higher organic material input through root biomass or exudation and higher water consumption by transpiration [10,16]. Nevertheless, SOC stock in natural grassland increased by 38.43% within 100 cm depth (lower than forest (67%) and shrub (54%)), but resulted in approximately half the water depletion (21%) at a depth of 500 cm compared with forest (40%) and shrub (40%) (Figure 2). In arid environments, grasslands generally have extensive root systems in the shallow layers [38], effective deposition of biomass through photosynthesis, longer growing seasons because of earlier and later seasonal growing periods, and the allocation of plant resources [33]. Deng, Shangguan, and Sweeney reported that in arid environments, converting cropland into grassland had the highest soil carbon sequestration rate compared with forest and shrub and the water depletion in grassland was much lower than other two land-use types due to shallow roots and weak transpiration [32,39]. The evergreen trees in this study may have sequestered more SOC than the deciduous trees with similar water depletion (Figure 2). This can be explained by the lower soil temperature, higher fine root biomass, and higher productivity of the evergreen tree species [40,41]. Compared with deciduous trees, the evergreen trees may allocate more photosynthetic products for fine root production [42] which was supported by Gao and Huang [43]. In terms of soil water depletion, Su and Shangguan reported no significant differences between deciduous and evergreen tree species on the Loess Plateau on a regional scale [44], which is in line with our results (Figure 2). Overall, vegetation types or tree species exhibited significant impacts on the trade-off between soil water maintenance and carbon sequestration, and grasslands have the potential to achieve this win–win situation. In addition, evergreen trees may be better if soil water is sufficient.
4.1.2. Rainfall Zones
Rainfall plays a crucial role in determining the net primary productivity and ecosystem structure in arid environments [45]; therefore, it has the potential to affect SOC dynamics through biotic functions related to both plant biomass production and organic material decomposition [46]. In this study, a higher RSSWD occurred in the relatively high rainfall zone (Figure 3), e.g., >550 mm, and converting croplands into forests had a higher RSSWD than shrubs and grasslands in this zone (Figure 3). Deng et al. reported that soil water in rainfall zones less than 600 mm was significantly reduced compared to that in rainfall zones higher than 600 mm after land-use conversion [39]. Land-use conversion sequestered more carbon but induced less water depletion in rainfall zones greater than 550 mm. Our results also support that in sufficient rainfall zones (e.g., >550 mm), converting cropland into forest may have the greatest potential to sequester more C because of the developed root system without severe soil water depletion. Wang et al. found that the trade-off between SOC and gravimetric soil moisture within a 100 cm depth decreased at rainfall > 570 mm in a semi-arid region [13]. However, in rainfall zones of less than 550 mm, a higher RSSWD than in forests and shrubs occurred in the grassland. Collins and Bras have reported that plants exposed to water stress in arid environments often have deeper and more developed root systems [47]. In addition, Jackson, Mooney, and Schulze found that although the deep root system was less widely distributed, it had high water absorption efficiency and great potential [48]. Consequently, converting croplands to natural grasslands in water-limited regions may be a better way to reduce the trade-off between these two ecological functions. In addition, Tuo et al. showed that grassland restoration resulted in greater SOC accumulation than shrubs and forests in areas with mean annual precipitation < 510 mm, whereas there were SOC losses at sites with rainfall > 510 mm [49]. Chang et al. reported significant differences in SOC accumulation between grasslands and forests in different rainfall zones [7]. For example, in dry areas, grassland exhibited a stronger capability to sequester C than in forest, while in moist areas, the forest was stronger. Overall, considering both carbon sequestration and deep soil water consumption, especially in different rainfall zones, may provide a full picture of comprehensive assessment of the trade-off between the two vital soil functions. Importantly, a recent study suggested that positive carbon sequestration by afforestation in the short-term may be further weakened by water shortages, making the restoration of degraded land in semiarid regions more challenging [50]. From this perspective, ecological restoration, such as tree planting, is not a simple solution and must be planned carefully and implemented to achieve the desired outcomes in the long run, particularly in eco-fragile regions [51].
4.1.3. Restoration Age
Previous studies have suggested that restoration age is an important factor influencing water and C cycles in soils [32,52]. Generally, with time, the quantity of C input increased through root biomass, exudation, litter, and microbial biomass, and was accompanied by a new microclimatic regime and enhanced organic matter protection that promoted SOC accumulation. In contrast, the depletion of soil water intensified over time after the conversion of croplands to perennial vegetation. Our results related to SOC stocks and SWS support these viewpoints (Figure 4), and quantitatively, an accumulation of 0.7 Mg ha−1 in the upper 100 cm was associated with an approximately 5.14 mm decrease in the 0–500 cm soil layers (Figure 5). Interestingly, from the perspective of trade-offs between SSE100 and SWDE500, converting cropland into natural grassland exhibited a steady RSSWD that was greater than 1 in all restoration periods; however, the long-term benefit of carbon sequestration in forests and shrubs may be constrained by soil water shortages. Wang, Shao, Liu, and Zhang concluded that the relationships between soil moisture and plant growth can be divided into five stages [30]: (1) The initial stage: water supply from rainfall and the deep soil layer was enough to support rapid growth. (2) The second stage: more water was needed and deep soil moisture was extracted and utilized by the roots. (3) The third stage: roots deepened continuously and the plant maintained the exuberant growth. (4) The fourth stage: the growth of plants became relative stable at a certain level that highly depended on the amount of annual rainfall. (5) The last stage: the deep soil moisture deficit may recover gradually due to the physiological senescence of trees. As a result, we suggest that natural grasslands may be a sustainable way to sequester carbon in soil in the long-term without severe soil water depletion.
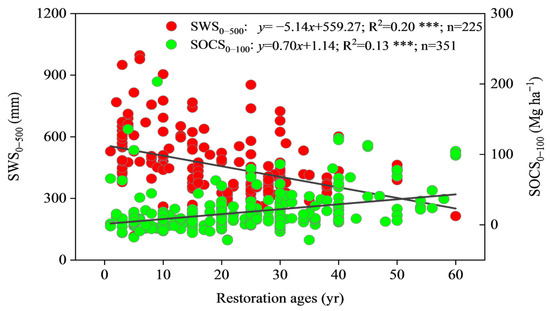
Figure 5.
Changes in SOC stocks and SWS with restoration ages. Note: *** Significance at the 0.001 probability level (p < 0.001).
4.2. Uncertainty Analysis and Implications for Land Management
4.2.1. Uncertainty Analysis
Strict accuracy is limited because of the uneven distribution of data collected from peer-reviewed publications. In addition, we only incorporated C sequestrated in soils rather than above- and below-ground biomass carbon, which is also an important C pool, especially in forests and shrubs. Nevertheless, soils comprise the largest terrestrial carbon pool and have the greatest potential to sequester C in the future. Further studies should include the C stored in the entire ecosystem to perform an overall evaluation of the trade-off. Moreover, it is necessary to take the changes in SOC stock in the deep soil layers (>100 cm) into consideration and the reasons are the following: (1) Vegetation in the semi-arid Loess Plateau usually developed extensive root systems that increased the carbon input due to low precipitation and thick soils and the root penetration depth can be up to 1000 cm. (2) Soils in deep layers displayed large accumulated C stocks but low C contents, indicating that there is an unsaturated mineral surface, which represents one of the main mechanisms regulating C stabilization, with previous research showing that deep soils (below 100 cm) also play a significant role in carbon sequestration, especially in arid and semi-arid regions [26,53]. To assess the water–carbon trade-off relationship more accurately, future studies should consider incorporating deep soil data into their analyses. This would allow for a more comprehensive understanding of the carbon dynamics and better reflect the total carbon storage across different soil depths. (3) We acknowledge that seasonal variations in soil moisture and carbon dynamics are crucial factors that may influence the results of this study. In the current analysis, all data were collected during the growing season, and the potential impacts of seasonal fluctuations were not considered. Seasonal variability in soil moisture and carbon dynamics is an important area for future research, as it can significantly affect carbon storage and transformation processes. For future studies, it would be beneficial to incorporate seasonal adjustments in the analysis, considering temporal variability across different seasons. Overall, despite the existing uncertainties in this study, we provided a thorough analysis of the trade-off between C sequestration and water maintenance, paying as much attention to the deep soil layers and influencing factors as possible.
4.2.2. Implications for Management
Soil moisture is fundamental to the tight coupling between ecosystem productivity, surface energy balance, biogeochemical cycles, and water resource availability in drylands [30] where soil water plays a central role in soil–plant systems, particularly in the soil water in deep layer [13]. This study proved that vegetation type, tree species, rainfall zone, and restoration age significantly influence the trade-off between soil water maintenance and carbon sequestration. Natural grasslands appear to be more effective in maintaining deep soil water storage and increasing SOC sequestration, especially in water-limited areas. Converting croplands into natural grasslands may be much more sustainable than converting forests and shrubs in the long term. This is supported by Liu, Dunkerley, Lopez-Vicente, Shi, and Wu [54], who reported that during the ecological restoration, grassland exhibited higher advantages in maintaining catchment water yield and soil conservation than forest and shrub. Overall, more attention should be paid to the restoration of natural grasslands in the semi-arid Loess Plateau because of their sustainable ecological functions. In addition, if soil water is not a limiting factor, forests, especially evergreen trees, are welcomed to achieve a win–win situation.
5. Conclusions
This study highlights the critical trade-off between soil organic carbon (SOC) stocks and soil water storage (SWS) resulting from land-use conversion in the Loess Plateau. The findings reveal that converting cropland to natural grassland or evergreen forests can offer favorable outcomes for both carbon sequestration and soil water conservation, with natural grassland proving particularly effective in regions with less than 550 mm of rainfall. While forest restoration performs better in areas with higher rainfall, both land-use types demonstrated enhanced carbon storage with age, though they also led to increased SWS depletion over time. The results underscore the importance of land-use decisions based on regional rainfall conditions and restoration age to balance ecosystem services. Notably, natural grassland stands out as a sustainable and stable solution, achieving a win–win scenario for both carbon and water. These insights provide valuable guidance for land and water management practices aimed at optimizing ecosystem restoration in water-limited regions, ensuring long-term benefits for both carbon sequestration and soil water retention.
Supplementary Materials
The following supporting information can be downloaded at https://www.mdpi.com/article/10.3390/f16040657/s1, Figure S1: Estimation and validation of soil bulk density between upper and lower layers in the Loess Plateau; Figure S2: Estimation and validation of SOC between upper and lower layers in the Loess Plateau; Figure S3: Estimation and validation of gravimetric soil water content between upper and lower layers in the Loess Plateau; Figure S4: Relationship between practical SWSr and computative SWSg; Figure S5: The impact of vegetation restoration under the “Grain for Green” Program with different vegetation types (forest, shrub, grassland) on SOCS of different soil layers in the Chinese Loess Plateau; Figure S6: The impact of vegetation restoration under the “Grain for Green” Program with different vegetation types (forest, shrub, grassland) on SWS of different soil layers in the Chinese Loess Plateau; Table S1: Published pedotransfer functions on soil bulk density prediction; Box S1: Code for 10-fold cross-validation.
Author Contributions
W.H.: Conceptualization, Methodology, Investigation, Writing–original draft, Writing–review and editing, Formal analysis, Visualization, and Funding acquisition. X.B.: Data retrieval, Data curation, Data analysis, and Writing–review and editing. J.C.: Data retrieval, Data curation, Data analysis, and Writing–review and editing. Z.L.: Methodology, Formal analysis, Writing–review and editing, and Funding acquisition. B.L.: Conceptualization, Methodology, Investigation, Writing–review and editing, Resources, Supervision, and Funding acquisition. All authors have read and agreed to the published version of the manuscript.
Funding
This research was funded by the National Natural Science Foundation of China (No. 42201099); the National Key Research and Development Program of China (No. 2022YFF1300403); the Fundamental Research Funds for the Central Universities (No. 2452024023) and the Key Research and Development Program for Advanced Scientific and Technological Talents in Lvliang City (No.2022RC22, No.2024RC33).
Data Availability Statement
Data will be made available on request.
Acknowledgments
We thank the Ansai Agro-Ecological Research Station on the Loess Plateau and Key Laboratory Breeding Base of Characteristic Plant Resources Chemistry Co-founded by Shanxi provincial and Lyuliang municipal government for providing research support.
Conflicts of Interest
The authors declare that they have no known competing financial interests or personal relationships that could have appeared to influence the work reported in this paper.
References
- Hanan, N.P.; Milne, E.; Aynekulu, E.; Yu, Q.; Anchang, J. A Role for Drylands in a Carbon Neutral World? Front. Environ. Sci. 2021, 9, 786087. [Google Scholar] [CrossRef]
- Lu, F.; Hu, H.; Sun, W.; Zhu, J.; Liu, G.; Zhou, W.; Zhang, Q.; Shi, P.; Liu, X.; Wu, X.; et al. Effects of national ecological restoration projects on carbon sequestration in China from 2001 to 2010. Proc. Natl. Acad. Sci. USA 2018, 115, 4039–4044. [Google Scholar] [CrossRef]
- Deng, L.; Wang, K.; Zhu, G.; Liu, Y.; Chen, L.; Shangguan, Z.P. Changes of soil carbon in five land use stages following 10 years of vegetation succession on the Loess Plateau, China. Catena 2018, 171, 185–192. [Google Scholar] [CrossRef]
- Yu, B.; Liu, G.; Liu, Q. Effects of land use changes for ecological restoration on soil moisture on the Chinese Loess Plateau: A meta-analytical approach. J. For. Res. 2020, 31, 443–452. [Google Scholar] [CrossRef]
- Zhao, F.; Sun, J.; Ren, C.; Kang, D.; Deng, J.; Han, X.; Ren, G. Land use change influences soil C, N, and P stoichiometry under ‘Grain-to-Green Program’ in China. Sci. Rep. 2015, 5, 10195. [Google Scholar] [CrossRef]
- Mao, R.; Xing, L.; Wu, Q.; Song, J.; Li, Q.; Long, Y.; Shi, Y.; Huang, P.; Zhang, Q. Evaluating net primary productivity dynamics and their response to land-use change in the loess plateau after the ‘Grain for Green’ program. J. Environ. Manag. 2024, 360, 121112. [Google Scholar] [CrossRef]
- Chang, R.; Fu, B.; Liu, G.; Liu, S. Soil carbon sequestration potential for “Grain for Green” project in Loess Plateau, China. Environ. Manag. 2011, 48, 1158–1172. [Google Scholar] [CrossRef]
- Yang, X.; Li, T. Factors controlling deep-profile soil organic carbon and water storage following Robinia pseudoacacia afforestation of the Loess Plateau in China. For. Ecosyst. 2022, 9, 100079. [Google Scholar] [CrossRef]
- Nan, G.; He, X.; Ma, L.; Qin, S.; Han, L.; Xu, S. Identify a sustainable afforestation pattern for soil carbon sequestration: Considering both soil water-carbon conversion efficiency and their coupling relationship on the Loess Plateau. Land Degrad. Dev. 2024, 35, 2058–2070. [Google Scholar] [CrossRef]
- Chen, M.; Yang, X.; Zhang, X.; Bai, Y.; Shao, M.; Wei, X.; Jia, Y.; Wang, Y.; Jia, X.; Zhu, Y.; et al. Response of soil water to long-term revegetation, topography, and precipitation on the Chinese Loess Plateau. Catena 2024, 236, 107711. [Google Scholar] [CrossRef]
- Feng, Q.; Zhao, W.; Fu, B.; Ding, J.; Wang, S. Ecosystem service trade-offs and their influencing factors: A case study in the Loess Plateau of China. Sci. Total Environ. 2017, 607–608, 1250–1263. [Google Scholar] [CrossRef] [PubMed]
- Lu, N.; Fu, B.; Jin, T.; Chang, R. Trade-off analyses of multiple ecosystem services by plantations along a precipitation gradient across Loess Plateau landscapes. Landsc. Ecol. 2014, 29, 1697–1708. [Google Scholar] [CrossRef]
- Wang, C.; Wang, S.; Fu, B.J.; Li, Z.S.; Wu, X.; Tang, Q. Precipitation gradient determines the tradeoff between soil moisture and soil organic carbon, total nitrogen, and species richness in the Loess Plateau, China. Sci. Total Environ. 2017, 575, 1538–1545. [Google Scholar] [CrossRef] [PubMed]
- Asbjornsen, H.; Goldsmith, G.R.; Alvarado-Barrientos, M.S.; Rebel, K.; Van Osch, F.P.; Rietkerk, M.; Dawson, T.E. Ecohydrological advances and applications in plant-water relations research: A review. J. Plant Ecol. 2011, 4, 3–22. [Google Scholar] [CrossRef]
- Feng, X.; Fu, B.; Piao, S.; Wang, S.; Ciais, P.; Zeng, Z.; Lü, Y.; Zeng, Y.; Li, Y.; Jiang, X.; et al. Revegetation in China’s Loess Plateau is approaching sustainable water resource limits. Nat. Clim. Change 2016, 6, 1019–1022. [Google Scholar] [CrossRef]
- Zhang, L.; Du, H.; Song, T.; Yang, Z.; Peng, W.; Gong, J.; Huang, G.; Li, Y. Conversion of farmland to forest or grassland improves soil carbon, nitrogen, and ecosystem multi-functionality in a subtropical karst region of southwest China. Sci. Rep. 2024, 14, 17745. [Google Scholar] [CrossRef]
- Choudhury, B.U.; Fiyaz, A.R.; Mohapatra, K.P.; Ngachan, S. Impact of land uses, agrophysical variables and altitudinal gradient on soil organic carbon concentration of north-eastern Himalayan region of India. Land Degrad. Dev. 2016, 27, 1163–1174. [Google Scholar] [CrossRef]
- Ruiz-Sinoga, J.D.; Martinez-Murillo, J.F. Eco-geomorphological system response variability to the 2004-06 drought along a climatic gradient of the Littoral Betic Range (southern Spain). Geomorphology 2009, 103, 351–362. [Google Scholar] [CrossRef]
- Laganiare, J.; Angers, D.A.; Para, D. Carbon accumulation in agricultural soils after afforestation: A meta-analysis. Glob. Change Biol. 2010, 16, 439–453. [Google Scholar] [CrossRef]
- Yang, F.; Huang, M.; Li, C.; Wu, X.; Guo, T.; Zhu, M. Changes in soil moisture and organic carbon under deep-rooted trees of different stand ages on the Chinese Loess Plateau. Agric. Ecosyst. Environ. 2022, 328, 107855. [Google Scholar] [CrossRef]
- Chen, Y.; Wei, T.; Ren, K.; Sha, G.; Guo, X.; Fu, Y.; Yu, H. The coupling interaction of soil organic carbon stock and water storage after vegetation restoration on the Loess Plateau, China. J. Environ. Manag. 2022, 306, 114481. [Google Scholar] [CrossRef] [PubMed]
- Yang, L.; Wei, W.; Chen, L.D.; Mo, B.R. Response of deep soil moisture to land use and afforestation in the semi-arid Loess Plateau, China. J. Hydrol. 2012, 475, 111–122. [Google Scholar] [CrossRef]
- Jia, X.; Shao, M.; Zhang, C.; Zhao, C. Regional temporal persistence of dried soil layer along south-north transect of the Loess Plateau, China. J. Hydrol. 2015, 528, 152–160. [Google Scholar] [CrossRef]
- Zhang, C.; Liu, G.; Xue, S.; Wang, G. Soil bacterial community dynamics reflect changes in plant community and soil properties during the secondary succession of abandoned farmland in the Loess Plateau. Soil Biol. Biochem. 2016, 97, 40–49. [Google Scholar] [CrossRef]
- An, S.; Zheng, F.; Zhang, F.; Van Pelt, S.; Hamer, U.; Makeschin, F. Soil quality degradation processes along a deforestation chronosequence in the Ziwuling area, China. Catena 2008, 75, 248–256. [Google Scholar] [CrossRef]
- Li, B.; Li, P.; Yang, X.; Xiao, H.; Xu, M.; Liu, G. Land-use conversion changes deep soil organic carbon stock in Chinese Loess Plateau. Land Degrad. Dev. 2020, 32, 505–517. [Google Scholar] [CrossRef]
- Guo, L.; Gifford, R.M. Soil carbon stocks and land use change: A meta analysis. Glob. Change Biol. 2002, 8, 345–360. [Google Scholar] [CrossRef]
- Jia, X.; Wang, Y.; Shao, M.; Luo, Y.; Zhang, C. Estimating regional losses of soil water due to the conversion of agricultural land to forest in China’s Loess Plateau. Ecohydrology 2017, 10, 10. [Google Scholar] [CrossRef]
- Bai, Y. Study on Soil Water Properties on Slope in Water-Wind Erosion Crisscross Region on the Loess Plateau. Master’s Thesis, Northwest A&F University, Yangling, China, 2009. [Google Scholar]
- Wang, Y.; Shao, M.; Liu, Z.; Zhang, C. Changes of deep soil desiccation with plant growth age in the Chinese Loess Plateau. Hydrol. Earth Syst. Sci. Discuss. 2012, 2012, 12029–12060. [Google Scholar] [CrossRef]
- Wu, H.; Guo, Z.; Peng, C. Land use induced changes of organic carbon storage in soils of China. Glob. Change Biol. 2003, 9, 305–315. [Google Scholar] [CrossRef]
- Deng, L.; Shangguan, Z.; Sweeney, S. “Grain for Green” driven land use change and carbon sequestration on the Loess Plateau, China. Sci. Rep. 2014, 4, 7039. [Google Scholar] [CrossRef]
- Wang, Y.; Han, X.; Jin, Z.; Zhang, C.; Fang, L. Soil Organic Carbon Stocks in Deep Soils at a Watershed Scale on the Chinese Loess Plateau. Soil Sci. Soc. Am. J. 2016, 80, 157–167. [Google Scholar] [CrossRef]
- Deng, L.; Shangguan, Z.; Wu, G.; Chang, X. Effects of grazing exclusion on carbon sequestration in China’s grassland. Earth-Sci. Rev. 2017, 173, 84–95. [Google Scholar] [CrossRef]
- Luo, Y.; Sherry, R.; Zhou, X.; Wan, S. Terrestrial carbon-cycle feedback to climate warming: Experimental evidence on plant regulation and impacts of biofuel feedstock harvest. Glob. Change Biol. Bioenergy 2009, 1, 62–74. [Google Scholar] [CrossRef]
- Luo, Y.; Hui, D.; Zhang, D. Elevated CO2 stimulates net accumulations of carbon and nitrogen in land ecosystems: A meta-analysis. Ecology 2006, 87, 53–63. [Google Scholar] [CrossRef]
- Breiman, L. Random forests. Mach. Learn. 2001, 45, 5–32. [Google Scholar] [CrossRef]
- Tate, K.R.; Ross, D.J. Elevated CO2 and moisture effects on soil carbon storage and cycling in temperate grasslands. Glob. Change Biol. 1997, 3, 225–235. [Google Scholar] [CrossRef]
- Deng, L.; Yan, W.; Zhang, Y.; Shangguan, Z. Severe depletion of soil moisture following land-use changes for ecological restoration: Evidence from northern China. For. Ecol. Manag. 2016, 366, 1–10. [Google Scholar] [CrossRef]
- Sun, L.; Hirano, T.; Yazaki, T.; Teramoto, M.; Liang, N. Fine root dynamics and partitioning of root respiration into growth and maintenance components in cool temperate deciduous and evergreen forests. Plant Soil 2020, 446, 471–486. [Google Scholar] [CrossRef]
- Yuan, Z.; Chen, H. Fine Root Biomass, Production, Turnover Rates, and Nutrient Contents in Boreal Forest Ecosystems in Relation to Species, Climate, Fertility, and Stand Age: Literature Review and Meta-Analyses. Crit. Rev. Plant Sci. 2010, 29, 204–221. [Google Scholar] [CrossRef]
- Vogt, K.A.; Grier, C.C.; Vogt, D.J. Production, turnover, and nutrient dynamics of aboveground and belowground detritus of world forests. Adv. Ecol. Res. 1986, 15, 303–377. [Google Scholar] [CrossRef]
- Gao, H.; Huang, Y. Impacts of the Three-North shelter forest program on the main soil nutrients in Northern Shaanxi China: A meta-analysis. For. Ecol. Manag. 2020, 458, 8. [Google Scholar] [CrossRef]
- Su, B.; Shangguan, Z. Decline in soil moisture due to vegetation restoration on the Loess Plateau of China. Land Degrad. Dev. 2019, 30, 290–299. [Google Scholar] [CrossRef]
- Iglesias, M.d.R.; Barchuk, A.; Grilli, M.P. Carbon storage, community structure and canopy cover: A comparison along a precipitation gradient. For. Ecol. Manag. 2012, 265, 218–229. [Google Scholar] [CrossRef]
- Campo, J.; Merino, A. Variations in soil carbon sequestration and their determinants along a precipitation gradient in seasonally dry tropical forest ecosystems. Glob. Change Biol. 2016, 22, 1942–1956. [Google Scholar] [CrossRef]
- Collins DB, G.; Bras, R.L. Plant rooting strategies in water-limited ecosystems. Water Resour. Res. 2007, 43, W06407. [Google Scholar] [CrossRef]
- Jackson, R.B.; Mooney, H.A.; Schulze, E.D. A global budget for fine root biomass, surface area, and nutrient contents. Proc. Natl. Acad. Sci. USA 1997, 94, 7362–7366. [Google Scholar] [CrossRef]
- Tuo, D.; Gao, G.; Chang, R.; Li, Z.; Ma, Y.; Wang, S.; Wang, C.; Fu, B. Effects of revegetation and precipitation gradient on soil carbon and nitrogen variations in deep profiles on the Loess Plateau of China. Sci. Total Environ. 2018, 626, 399–411. [Google Scholar] [CrossRef]
- Chai, Q.; Ma, Z.; An, Q.; Wu, G.L.; Chang, X.; Zheng, J.; Wang, G. Does Caragana korshinskii plantation increase soil carbon continuously in a water-limited landscape on the Loess Plateau. Land Degrad. Dev. 2019, 30, 1691–1698. [Google Scholar] [CrossRef]
- Holl, K.D.; Brancalion, P.H.S. Tree planting is not a simple solution. Science 2020, 368, 580. [Google Scholar] [CrossRef]
- Liang, H.; Xue, Y.; Li, Z.; Wang, S.; Wu, X.; Gao, G.; Liu, G.; Fu, B. Soil moisture decline following the plantation of Robinia pseudoacacia forests: Evidence from the Loess Plateau. For. Ecol. Manag. 2018, 412, 62–69. [Google Scholar] [CrossRef]
- Schiedung, M.; Tregurtha, C.S.; Beare, M.H.; Thomas, S.M.; Don, A. Deep soil flipping increases carbon stocks of New Zealand grasslands. Glob. Change Biol. 2019, 25, 2296–2309. [Google Scholar] [CrossRef] [PubMed]
- Liu, Y.; Dunkerley, D.; Lopez-Vicente, M.; Shi, Z.; Wu, G. Trade-off between surface runoff and soil erosion during the implementation of ecological restoration programs in semiarid regions: A meta-analysis. Sci. Total Environ. 2020, 712, 136477. [Google Scholar] [CrossRef] [PubMed]
Disclaimer/Publisher’s Note: The statements, opinions and data contained in all publications are solely those of the individual author(s) and contributor(s) and not of MDPI and/or the editor(s). MDPI and/or the editor(s) disclaim responsibility for any injury to people or property resulting from any ideas, methods, instructions or products referred to in the content. |
© 2025 by the authors. Licensee MDPI, Basel, Switzerland. This article is an open access article distributed under the terms and conditions of the Creative Commons Attribution (CC BY) license (https://creativecommons.org/licenses/by/4.0/).