Article

Leaf Plasticity Responses of Four Urban Garden Plants to Low-Light Environments Under Viaducts

College of Landscape Architecture & Art, Henan Agricultural University, Zhengzhou 450002, China
*
Author to whom correspondence should be addressed.
These authors contributed equally to this work.
Forests 2025, 16(4), 651; https://doi.org/10.3390/f16040651
Submission received: 25 February 2025 / Revised: 24 March 2025 / Accepted: 3 April 2025 / Published: 9 April 2025
(This article belongs to the Section Forest Ecophysiology and Biology)

Abstract

:
The low-light environments under urban viaducts significantly hinder plant growth and development. An in-depth study of the plasticity response mechanisms and survival strategies of plants in these conditions is crucial for selecting appropriate species. This study examined how light intensity affects leaf plasticity in four plants (Ophiopogon japonicus, Pittosporum tobira, Euonymus japonicus, and Ligustrum sinense) under two representative urban viaducts and how they respond to changes in light intensity in Zhengzhou City. The leaf morphology, physiological photosynthesis, and chlorophyll (Chl) fluorescence parameters were analyzed at three light intensities (one natural full-light and two viaduct-shaded low-light environments.): CK (full light), T1 (21.29%–25.99%), and T2 (5.16%–8.20%). The results showed that (1) with decreasing light intensity, most plants showed reductions in leaf thickness (LT), palisade and spongy tissue thickness (PT, ST), net photosynthetic rate (Pn), stomatal conductance (Gs), and Fv/Fm and Fv′/Fm, while leaf area, Chl content, and malondialdehyde (MDA) content increase, with antioxidant enzyme activity also rising. The photosynthetic indicators of O. japonicus first increased and then decreased. (2) The overall plasticity of the plants ranked from high to low as follows: O. japonicus > E. japonicus > P. tobira > L. sinense. O. japonicus showed the strongest adaptability through comprehensive photosynthetic physiology and antioxidant mechanisms, with a wide light tolerance range. E. japonicus relied more on adjustments in photosynthetic and anatomical structures, as well as leaf area. P. tobira improved light tolerance by modifying leaf area, epidermal structure, and physiological traits. L. sinense had the lowest adaptability, relying on limited antioxidant enzymes and leaf thickness adjustments. (3) In conclusion, plant plasticity is primarily reflected through photosynthetic and physiological traits. High plasticity in these parameters is key for plants to adapt to thrive in dynamic low-light environments. Therefore, when greening viaduct-shaded areas, it is crucial to consider the light environment and the light adaptability range of different plant species. Plants with high photosynthetic and physiological plasticity should be selected to ensure the optimal growth and development of plants in shaded areas.

1. Introduction

With the rapid development of China’s urbanization process, viaducts play a significant role in urban transportation, yet the environmental pollution problems stemming from viaducts have become increasingly prominent. For example, urban landscape spaces are fragmented by viaduct structures, and the semi-enclosed shaded areas formed by these viaducts are detrimental to the dispersal of automobile exhaust and dust particulate matter, severely impacting urban environmental quality and public health [1,2]. As an effective measure to ameliorate environmental pollution, the greening of viaducts were categorized into viaduct surface greening, viaduct pillar greening, and the greening of shaded areas under viaducts [3]. Among these greening methods, the greening of shaded areas under viaducts is the most widely applied method [4]. The shaded areas under viaducts refer to the areas covered by the viaduct’s sunlight shadow, exhibiting certain dynamics and seasonal variations closely related to the structure, height, width, and orientation of the viaducts [5,6]. The peculiarity of the shaded areas often results in soil compaction, vehicular emission, and severe insufficient sunlight, the intensity of which severely restricts the morphogenesis, photosynthetic physiology, biomass production, and allocation of plants in shaded greening areas under viaducts [7]. The plants under low light intensity will become stunted with yellowing leaves, poor growth, and low survival rates, reducing the ecological benefits of urban greenery [8]. Additionally, the frequent replacement of these plants under viaducts exacerbates maintenance costs and depletes human resources. At the same time, the light intensity in different areas under viaducts varies dynamically, influenced by factors such as time of day and bridge structure, resulting in uneven light distribution [6]. This unevenness leads to a significant need for plants with a broad range of light adaptability. It is essential to select plants that are not only tolerant of shade but also exhibit strong adaptability to different light intensity conditions. Therefore, studying the response strategies of various garden plants to the low-light environment under viaducts will help to select and apply suitable plants, enhance their ecological benefits, and reduce maintenance costs.
The majority of viaduct-shaded areas that receive light intensity are less than 30% of full sunlight, resulting in a significant deficit of photosynthetically active radiation [9]. Insufficient light intensity can hinder photosynthetic efficiency, impeding processes such as light resource utilization, ATP synthesis, and CO2 fixation [10,11]. To resist the interactive stresses of multiple environmental factors, especially the constraints of low-light environments, green plants in shaded areas under viaducts will change their own light environment adaptation strategies to enhance the efficiency of capturing light resources in time and thus improve their ecological adaptability, which is known as phenotypic plasticity [12]. Plants exhibit different adaptive characteristics in morphogenesis, growth traits, and photosynthetic physiological functions in response to heterogeneous habitats, a phenomenon known as phenotypic plasticity [13]. The degree of phenotypic plasticity reflects the ability of a specific genotype to adjust its morphology and physiological traits to adapt to complex environments [14]. Among the many structural organs of plants, leaves stand as the primary sites where photosynthesis occurs and where exchanges of matter and energy within the external environment take place, exhibiting a high degree of plasticity [15]. Plants exhibit plasticity responses in leaf morphology and physiology to enhance their adaptability to different light environments, mitigating the detrimental effects of light stress on their growth processes [16].
In low-light environments, plants enhance their efficiency in capturing light resources by increasing leaf area and specific leaf area (SLA) [17]. Simultaneously, they adjust palisade tissue (PT) and spongy tissue (ST) thickness, increasing the proportion of internal scattered and diffused light [18]. This reduces the loss of light quanta, ensuring sustained light absorption capacity. In low-light environments, most plants exhibit a decrease in leaf stomatal density (SD) while the stomatal area (SA) increases. This regulatory mechanism helps plants maintain a higher photosynthetic capacity under reduced light conditions [19]. Concurrently, plants elevate the activity of antioxidant enzymes like leaf superoxide dismutase (SOD) and peroxidase (POD) to mitigate the damage caused by free radicals generated from membrane lipid peroxidation. Additionally, they adjust the levels of osmotic regulators such as soluble sugar and soluble protein (SP) to maintain the stability of cell membranes and the balance of internal and external osmotic pressure under varying light conditions [20,21]. For instance, P. bournei seedlings primarily adjust the plasticity of their leaf morphological traits and physiological indicators to enhance their ability to absorb light, particularly blue and violet light, thereby improving their adaptability to low-light environments [22]. Similarly, in different light gradient environments, the seedlings of Juglans regia f. luodianense in the Karst region of China primarily rely on the plasticity of their biomass allocation and physiological traits to enhance their competitive advantage among different species and enable them to thrive in highly heterogeneous Karst rocky desertification habitats. At the same time, the morphological plasticity of Juglans regia f. luodianense seedlings is relatively low, playing a minimal role in their adaptation to varying light environments [23]. Currently, research on plant phenotypic plasticity mostly focuses on aspects such as species distribution, community composition, and productivity under changing light environments [12,24].
From the completion of the first viaduct in Zhengzhou City in 1955 to the year 2021, the number of viaducts in Zhengzhou City has reached a staggering 246, ranking third nationwide. The shaded areas under these viaducts are extensive [25]. Therefore, in the preliminary stage of this study, 31 viaducts within the third ring road of Zhengzhou City were classified through on-site surveys. Representative East–West- and North–South-oriented viaducts were selected, and the light intensity in the shade green areas of the sample viaducts was measured on-site. Using a full-light environment as the control, the response and plasticity index of leaf morphology and physiological photosynthetic indicators of four common species of green plants (Ophiopogon japonicus, Pittospourm tobira, Euonymus alatus, and Ligustrum sinense) in shaded areas under three different light gradients was measured and analyzed. This provided a basis for further understanding the ecological adaptation strategies of green plants in shaded areas under viaducts in Zhengzhou City. The primary objectives of this paper are to determine the following: (1) the distribution patterns of light in shaded areas of different types of viaducts and their limiting factors; (2) the differences in physiological and morphological responses of different types of green plants in shaded areas under viaducts to adapt to low-light environments beneath viaducts; and (3) the differences in the plasticity response of leaf morphology, physiological characteristics, photosynthetic characteristics, and Chl fluorescence parameters of plants to low-light environments in shaded areas under viaducts.

2. Materials and Methods

2.1. Sampling Points and Plant Materials

Zhengzhou is in the northern–central part of Henan Province (34°16′–34°58′ N, 112°42′–114°14′ E). The city experiences an annual sunshine duration of 1869.7 h, with a sunshine percentage of 54%. The total annual radiation is 452.6 kcal/cm2 [25]. In this study, field surveys were conducted within the third ring road of Zhengzhou to select representative viaducts. Among them, the central vehicle greening of one viaduct oriented in the East–West direction (the Nongye Viaduct, as shown in Supplementary Figure S1A) and another viaduct oriented in the North–South direction (the Jingguang Viaduct, as shown in Supplementary Figure S1B) was chosen to be investigated. To ensure consistency in environmental factors, all sampling points were located in the central greenbelt under the shadow of the viaducts, with vegetation regularly maintained and watered by the municipal landscaping department. Based on this, this study selected two standard bridge sections with larger clearance heights, and plant leaf samples were collected from the central greenbelt beneath the bridges.
Additionally, four common types of plants from the greenbelts of elevated bridges in Zhengzhou were selected as the research subjects (Supplementary Table S1, Supplementary Figure S2). These plants have been growing in the bridge greenbelt for a long time and have adapted to the local environment, rather than being newly planted during the experiment (Supplementary Table S1). To set up a reasonable control group, the same plant species were selected from the nearby youth park adjacent to the Nongye Viaduct. The park is lush with vegetation, receives ample sunlight, and the plants in the control group are not overshadowed by large trees or buildings, ensuring minimal sunlight interference. Furthermore, the youth park is located within the city, close to the Nongye Viaduct, which minimizes the interference of other environmental factors, such as air particulate pollution, on the experiment. Through this design, this study ensures environmental consistency between the control and experimental groups, allowing for an accurate assessment of the impact of elevated bridge shadow areas on plant growth.

2.2. Setting of Light Measurement Plots in Shaded Green Areas Under Viaduct

Measurement plots were established at 10-m intervals along the central greenery belt of the shaded regions of viaducts with ample clearance height. Three plots—front, middle, and rear—were arranged, each 20 m long, matching the width of the greenery belt. Within each plot, three measurement bands were placed perpendicular to the viaduct structure, spaced 6.5 m apart for repeated measurements. Five measurement points were uniformly placed along each band, with points 1 and 5 located 0.3 m inward from the boundary, and measurements taken at 1.5 m above ground [9]. The design for the North–South-oriented viaduct is shown in Supplementary Figure S3, with a similar set up for East–West-oriented viaducts.
From 8:00 a.m. to 6:00 p.m., light intensity in the central shaded area was measured every 2 h using a Ningbo Deli DL333205 (Ningbo Deli Company, Ningbo, China),multi-source illuminance meter, with three replications per sampling point. The light rate at each point was calculated, and the average light rate over three days was used as the final value. According to the measured light rate in the shaded green zones of the two viaducts and the 100% light environment in the youth park as CK, three treatment groups were established: park (100% light rate, CK), Jingguang Viaduct (21.29%–25.99% light rate, T1), and Nongye Viaduct (5.16%–8.20% light rate, T2), forming three light gradient environments. This study focused on the responses of four plant species in terms of leaf morphological traits, photosynthetic parameters, chlorophyll fluorescence parameters, and physiological indicators under varying light environments.

2.3. Leaf Morphological Characteristics

From 1 to 10 July 2023, multiple consecutive leaf samplings were conducted in various sampling areas. The sampling was performed during the peak growth period of the plants, requiring well-grown and pest-free specimens. Consistent in height and crown width, plants were selected for sampling. From different locations within the central green belt of the viaduct, optimal and intact mature leaves were randomly sampled from each of the directions of the plants. From each plant species, we collected 15–20 leaves per sampling area, with 5 repetitions per plant species in each sampling area. The measurement values of various indicators for the four plants were repeated five times for each treatment group, and the average value was taken.
The collected leaves were divided into two parts. After the first part of the leaf collection was completed, they were thoroughly cleaned, and their fresh weight (FW) was measured using an electronic balance. The leaves were then soaked in deionized water and placed in a dark refrigerator at 5 °C for 12 h. We took out the leaves, the leaves’ surface moisture was absorbed using absorbent paper, and impurities were wiped off the leaves. Subsequently, the saturated fresh weight (TW) of the leaves was measured. After determining the leaf area (LA) using a leaf area meter (CI-203, CID Bio-Science, Camas, WA, USA), the leaves were dried at 70 °C to constant weight, and the dry weight (DW) of the leaves was measured. The SLA, LDMC, and leaf relative water content (RWC) were then calculated [21].

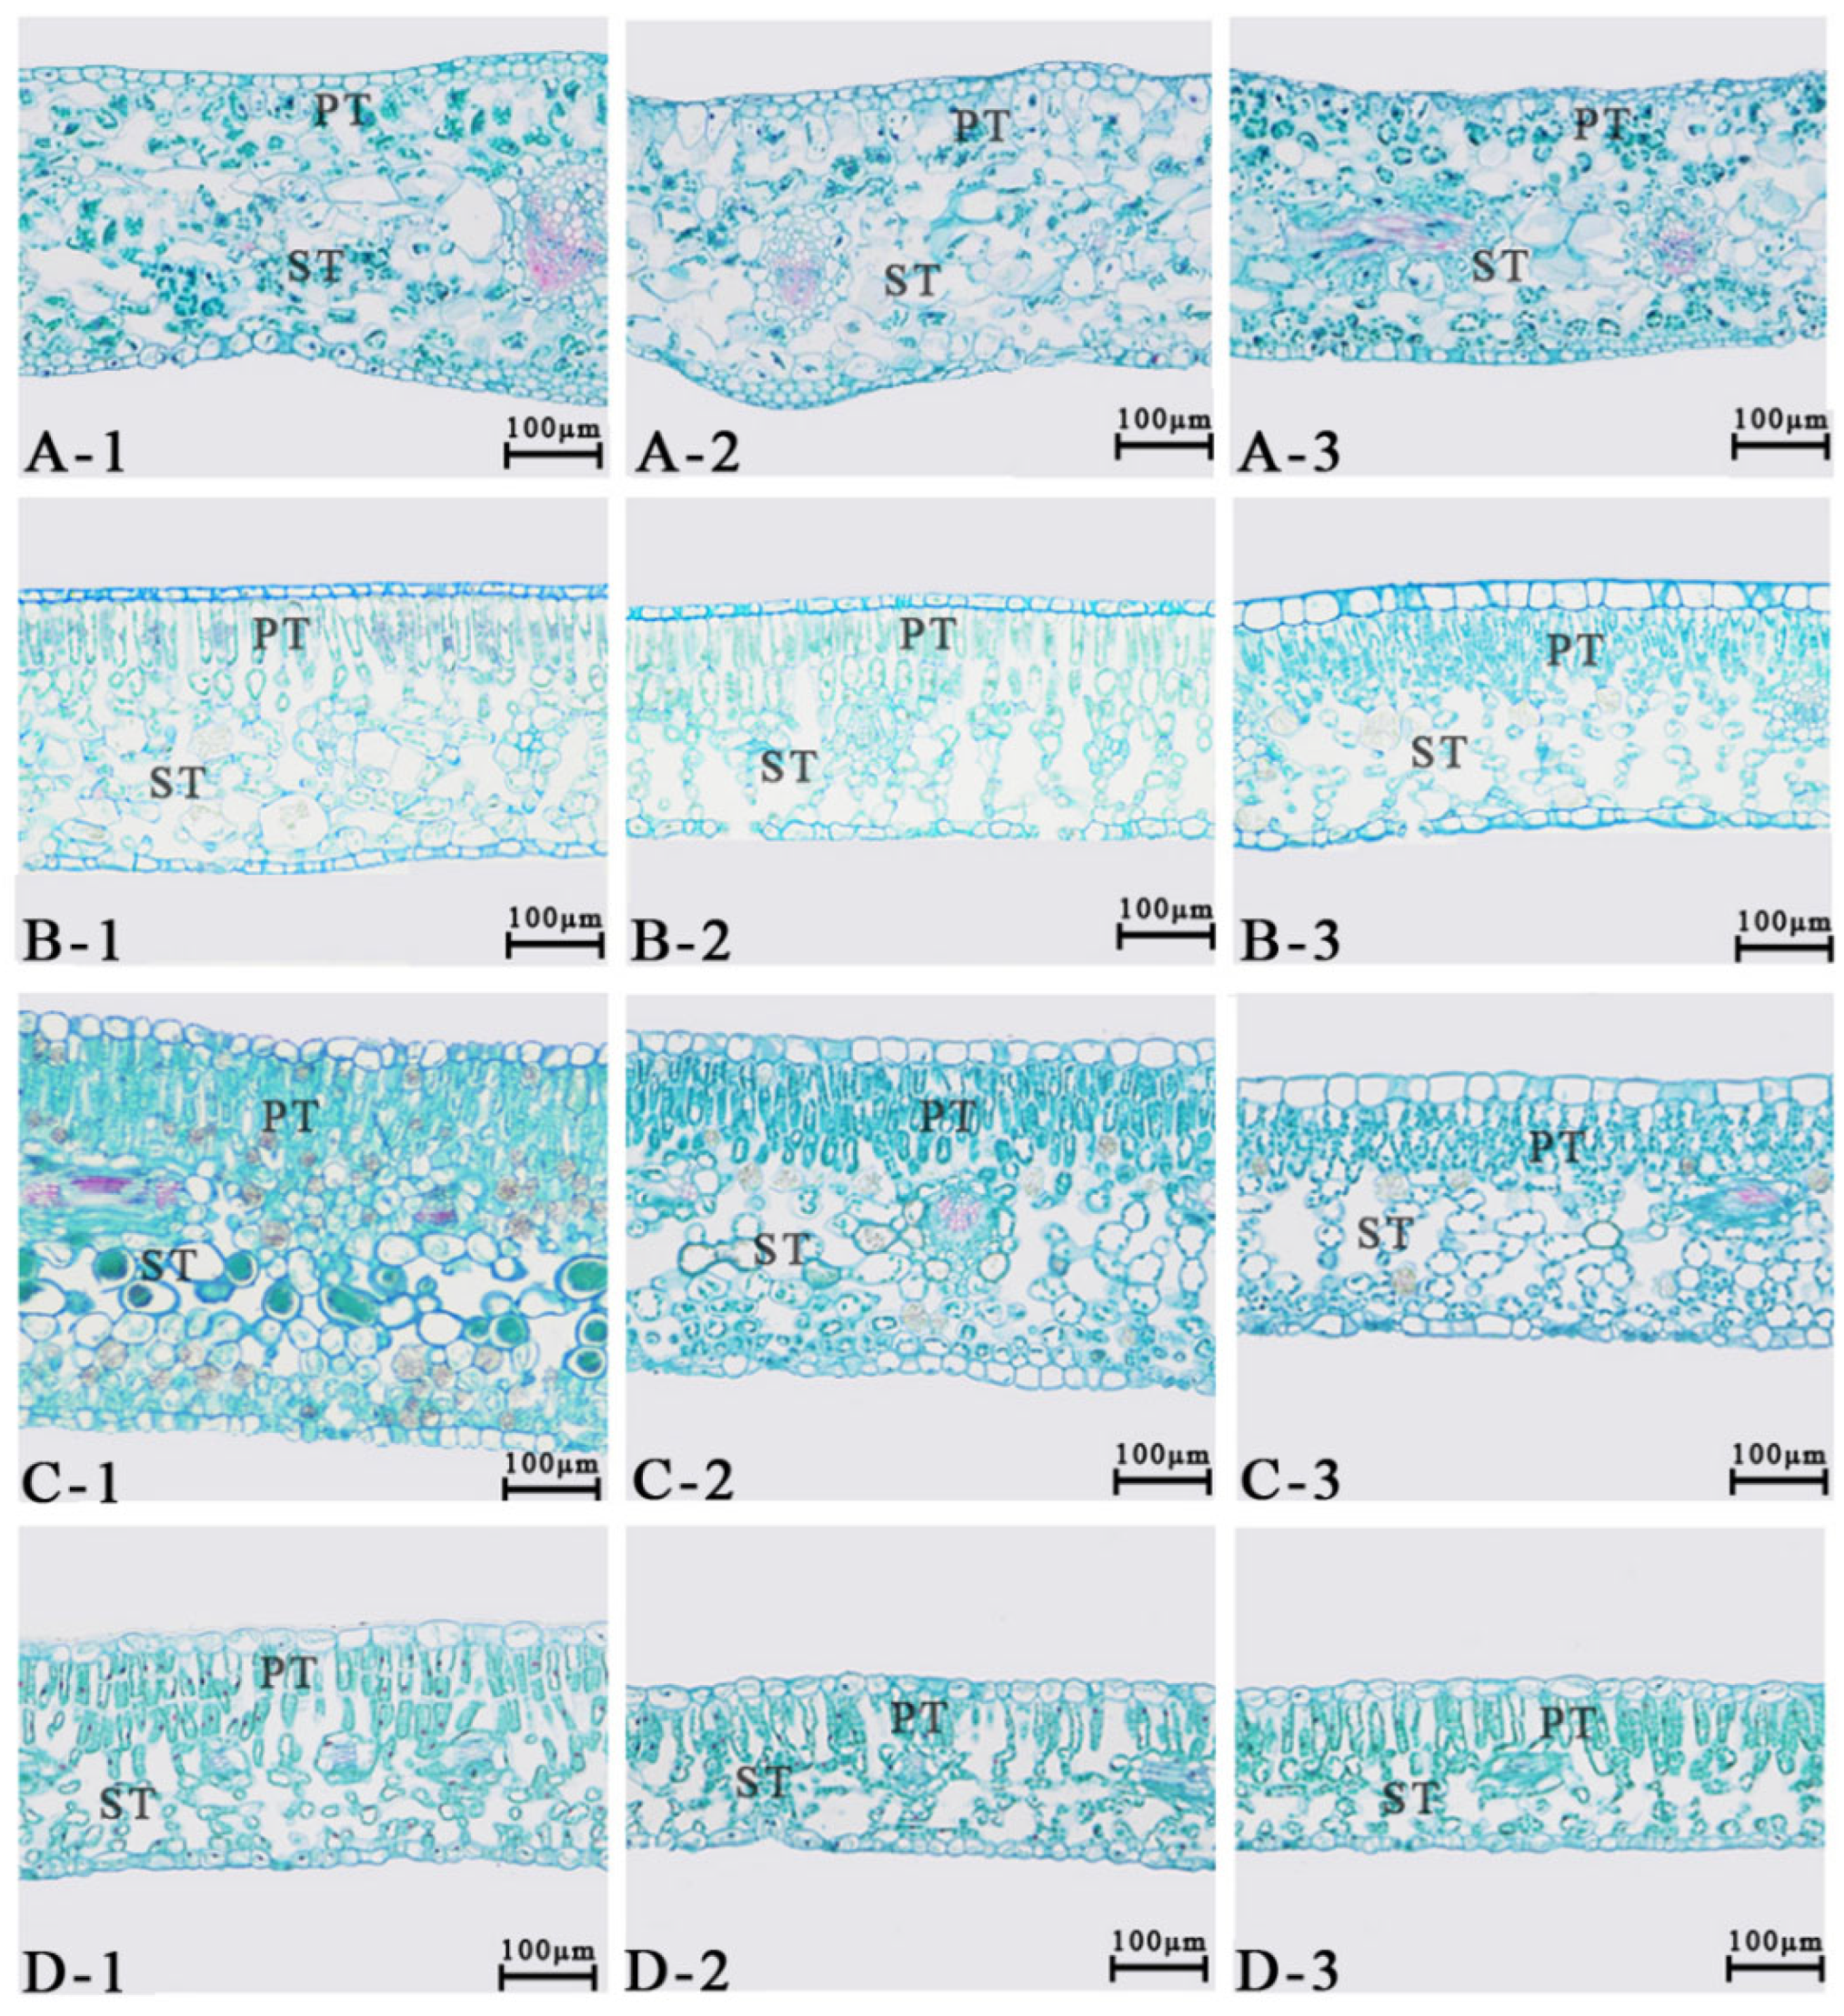
2.4. Observation of Leaf Stomata and Anatomical Structure

In this study, fresh, mature plant leaves were laid flat and cut into 1 cm × 1 cm squares. The upper epidermis and mesophyll tissue were removed, leaving only the lower epidermis. The condition of the leaf stomata was observed using a super-depth 3D video microscope (Leica-DVM6A, Wetzlar, Germany) at 1200× magnification. Subsequently, ImageJ 1.8.0 (National Institutes of Health, Bethesda, MD, USA) was employed to analyze the stomatal morphology, count the number of stomata within the photographic field of view, and calculate the SD (N/mm2) and stomatal area (SA) (µm2) [26].
SD = N/S,
SA = πGL·SW/4,
where N represents the number of stomata in the field of view, S denotes the area of the field of view, GL is the major axis, and SW is the minor axis of the elliptical area.
For observing the anatomical structure of leaves, a 5 × 5 mm section was cut along the main vein at the basal third of the leaf. The section was fixed in FAA solution (38% formaldehyde, glacial acetic acid, 70% ethanol, 5:5:90, v/v/v) for 24 h. Slides were prepared using paraffin sectioning, ethanol and xylene dehydration, wax infiltration, and embedding methods. Sections were cut to a thickness of 6–8 µm, stained with 0.05% toluidine blue solution, and sealed with neutral gum [27]. The prepared slides were observed and photographed using a Leica DM2500 microscope (Leica Microsystems, Wetzlar, Hesse, Germany). Subsequently, ImageJ 1.8.0 was used to measure leaf thickness (LT, µm), palisade tissue (PT, µm), and spongy tissue (ST, µm) and to determine the ratio of palisade tissue to spongy tissue (PT/ST).

2.5. Physiological Index Determination

The other portions of the leaves, after being treated with liquid nitrogen, were transferred to a freezer at −80 °C for preservation for the determination of plant physiological parameters. The content of chlorophyll a (Chla) and chlorophyll b (Chlb) in the leaves was determined by colorimetric analysis using a 80% acetone solution [28]; malondialdehyde (MDA) content was determined using the thiobarbituric acid method [29]; SOD activity was determined by the nitroblue tetrazolium (NBT) photoreduction method [30]; POD activity was determined by the guaiacol method [31]; SP was determined by the Coomassie brilliant blue method [32]; and the leaf relative electrical conductivity (REC) measurement method (referenced in [6]) was utilized.

2.6. Photosynthesis and Chlorophyll Fluorescence Parameters Measurement

On sunny days, the LI-6400 portable photosynthesis system (LI-COR, Lincoln, NE, USA) was employed for open gas exchange measurements of the plant net photosynthetic rate (Pn), stomatal conductance (Gs), intercellular CO2 concentration (Ci), transpiration rate (Tr), and other photosynthetic parameters. Photosynthetic parameter measurements were conducted under natural light conditions in the bridge shaded on the day of leaf collection, between 9:30 and 11:30, when the effective radiation for photosynthesis under the viaduct shade was high. Three plants of each species were measured, with five healthy, intact, and similarly sized leaves randomly selected from each plant growing on the sunny side. Three valid instantaneous values were measured for each leaf.
The same leaves were subjected to dark adaptation for over 30 min using a chlorophyll fluorometer (Junior-PAM, Heinz Walz GmbH, Effeltrich, Germany) to measure leaf chlorophyll fluorescence induction parameters, including the maximum photochemical efficiency of photosystem II (Fv/Fm), effective quantum yield of photosystem II (Fv/Fm), potential photochemical efficiency (Fv/Fo), and photosynthetic performance index (PIABS).

2.7. Statistical Analysis

Referring to the method outlined by Valladares [33], the phenotypic plasticity index (PPI) was calculated using the following formula:
PPI = (Vmax − Vmin)/Vmax;
where Vmax and Vmin represent the maximum and minimum values of each trait under three different light intensity treatments.
Experimental data were compiled, organized, and analyzed using Excel 2022 (Microsoft, Redmond, WA, USA). Statistical analysis was performed in SPSS 21.0 (SPSS Inc., Chicago, IL, USA), with one-way ANOVA used to assess the significance of differences in plant traits under varying light intensities. Different lowercase letters indicate significant differences. A two-way ANOVA was conducted to evaluate the interaction effects of light intensity and species on plant traits. Differences were considered highly significant at p < 0.01. Graphs were generated using Origin 2020 (OriginLab Corporation, Northampton, MA, USA)and Photoshop 2021 (Adobe Inc., San Jose, CA, USA) software.

3. Results

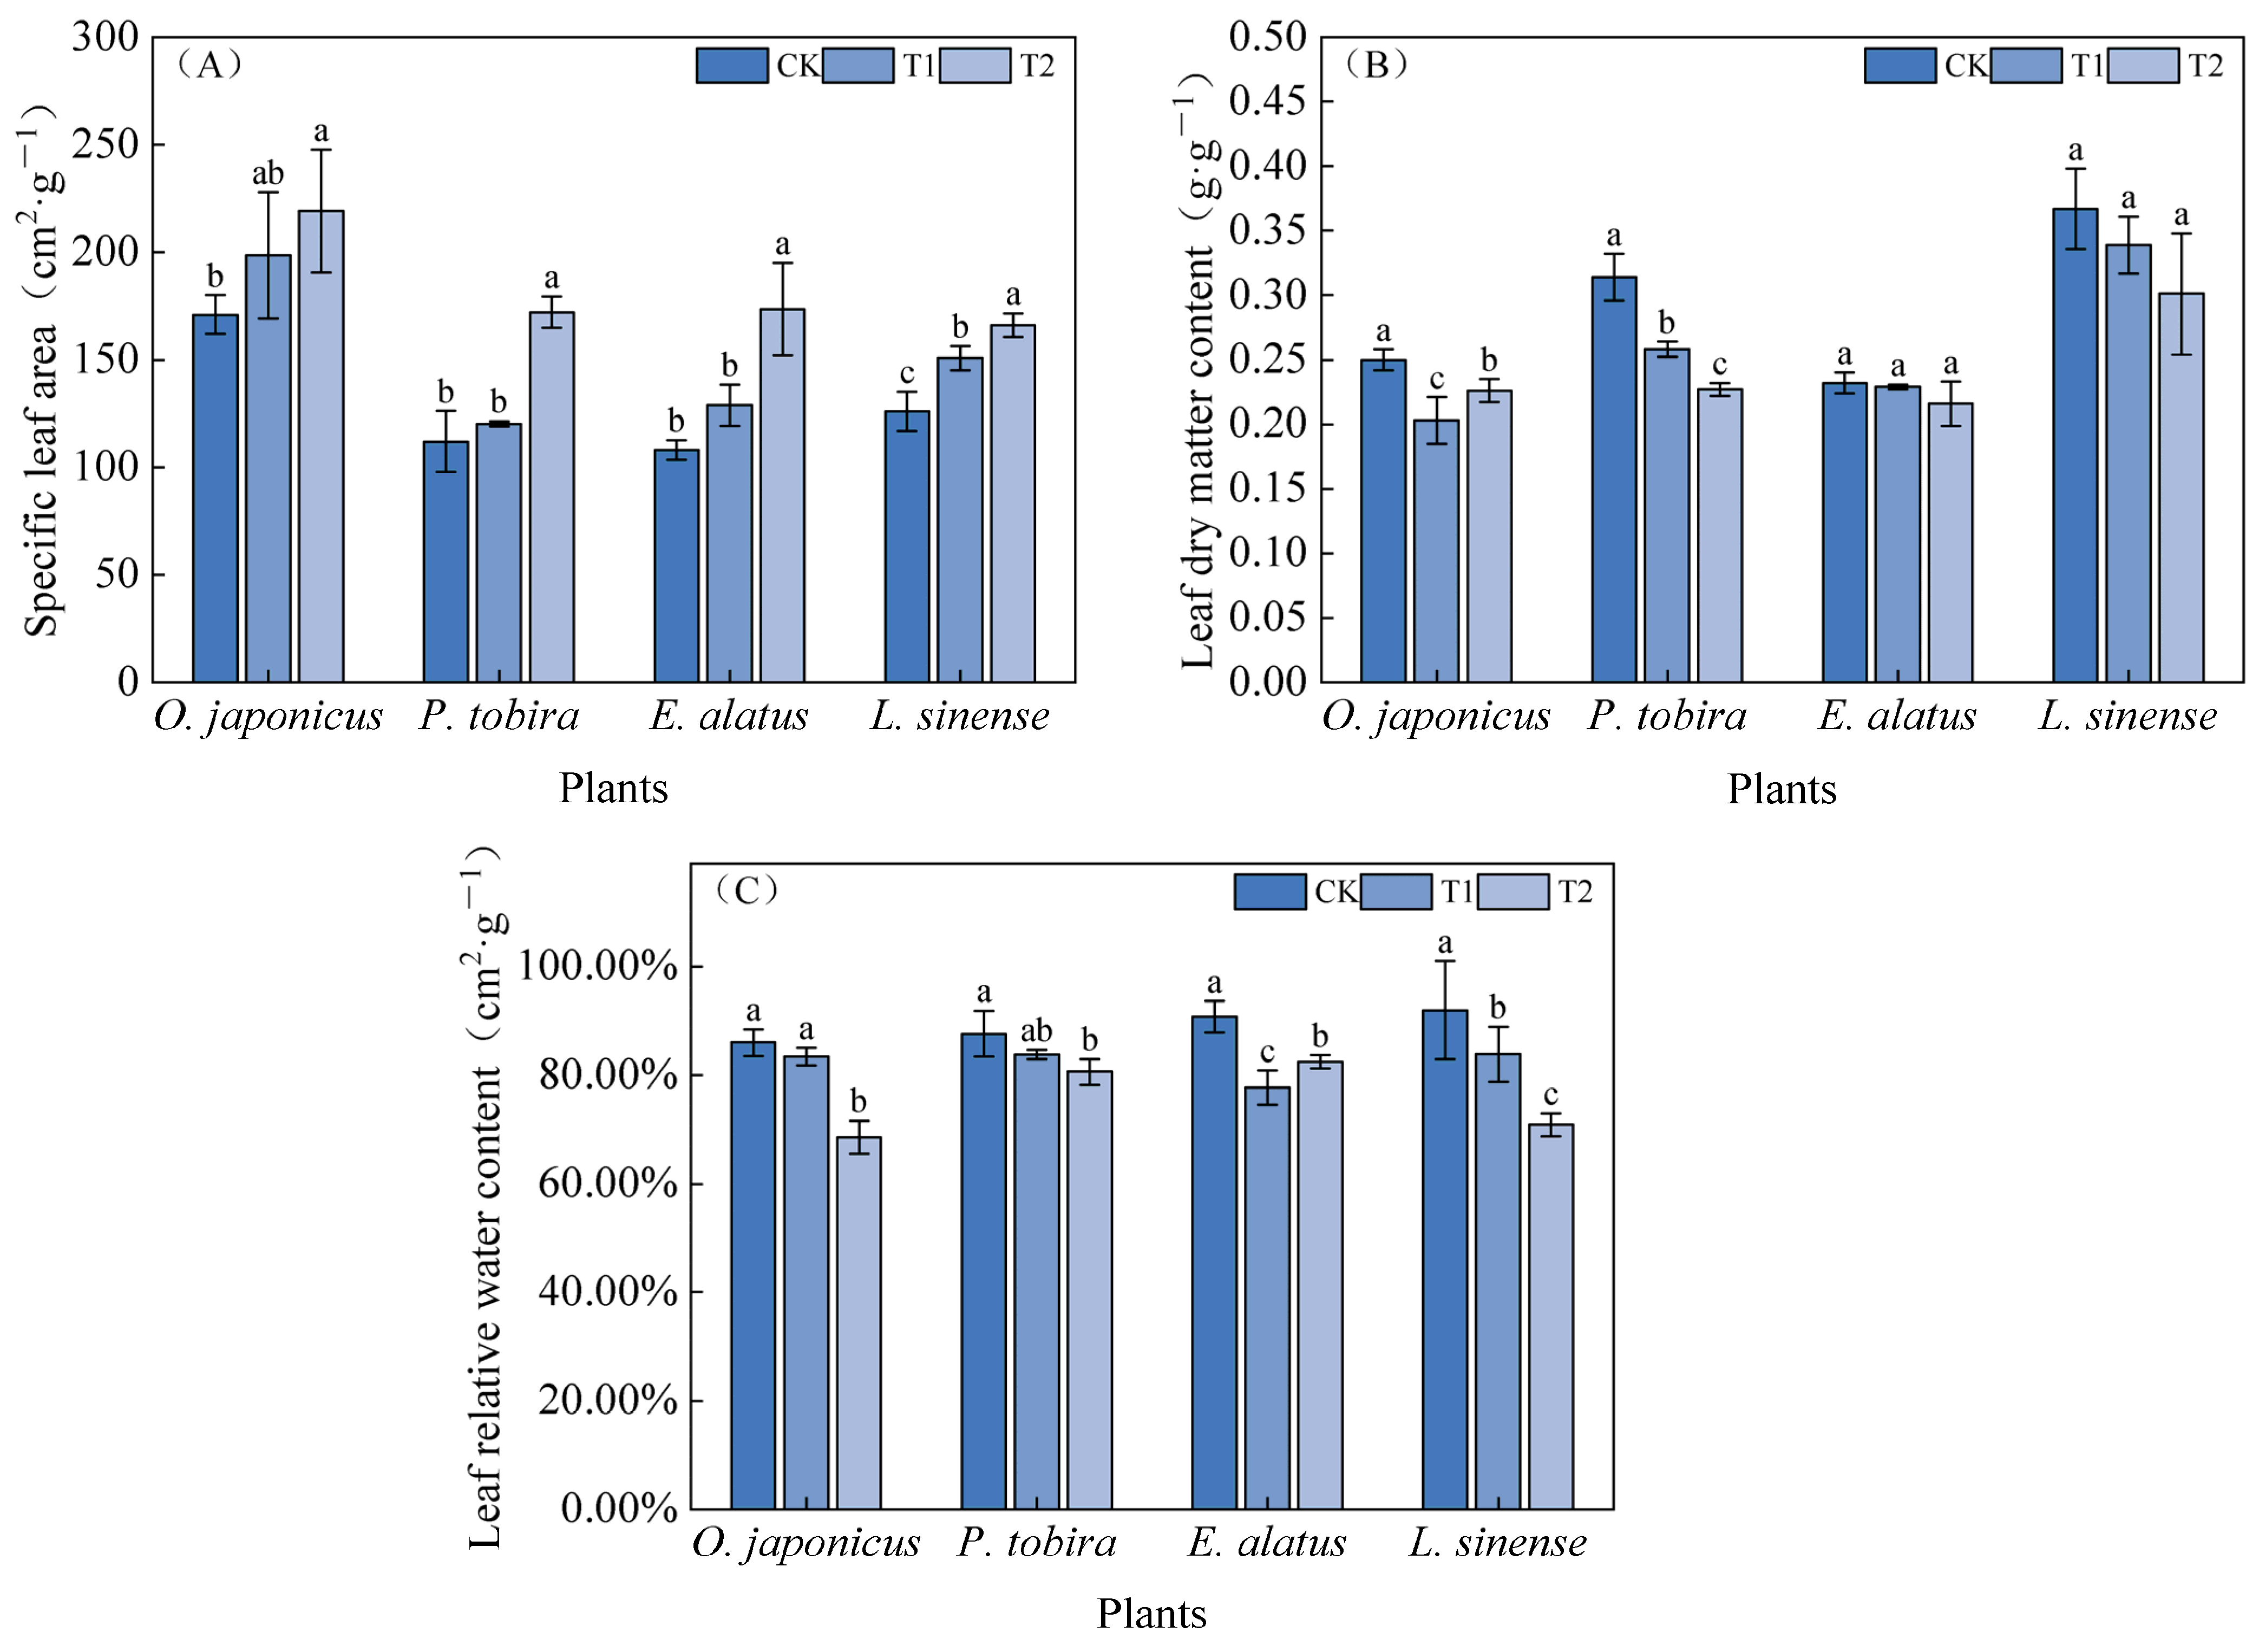
3.1. Morphological Characteristics of Plant Leaves Under Different Light Intensities

The trends in SLA, LDMC, and RWC of various plants under different light intensities are illustrated in Figure 1. The specific leaf area (SLA) of each plant increased with the decrease in light intensity (Figure 1A), and the SLA of four plants in T2 was significantly higher than that of the T1 and CK groups (p < 0.05). Among the three light treatment groups, the average SLA was the largest in O. japonicus (196.24 cm2·g−1) and the smallest in P. tobira (134.81 cm2·g−1). Meanwhile, in the T2 group, the most substantial increase in SLA compared to CK was seen in E. alatus (60.50%), while the smallest increase was observed in O. japonicus (28.14%). Conversely, LDMC decreased with a decreasing light intensity (Figure 1B). There was a significant difference between the LDMC in the CK-treated group and T2 (p < 0.05). Furthermore, except for E. alatus, the RWC of the leaves decreased progressively from CK to T1 to T2 as light intensity diminished (Figure 1C). The highest average RWC of each plant was P. tobira (83.98%), and the lowest was O. japonicus (79.33%). Notably, the highest RWC loss under T2 was observed in L. sinense (22.88%), while the lowest was in P. tobira (7.99%), relative to CK.
The variations in SD and SA of the leaves of four plants under different light environments are shown in Table 1 and Supplementary Figure S4. Among them, the SD of P. tobira and L. sinense decreased with the reduction in light intensity, while the SD of O. japonicus and E. alatus first increased and then decreased as light intensity diminished, reaching their peak under T1. Under T2, the SD of all four plants was significantly lower than in the CK full-light environment (p < 0.05). The trend in SA changes under different light intensities was inversely proportional to that of SD. The SA of the four plants reached its maximum under T2 and was significantly higher than in the CK full-light environment (p < 0.05).
The LT, PT, and ST of the four plants all exhibited a decreasing trend as light intensity diminished, reaching their minimum values under the T1 treatment (Table 1 and Figure 2). In the full-light environment of CK, LT, PT, and spongy ST of the fours were significantly higher than those in the T1 and T2 treatments (p < 0.05). Compared with CK, the T2 treatment resulted in the highest decrease rates in LT and ST thickness for E. alatus, at 33.56% and 34.55%, respectively. The lowest decrease in LT was observed in P. tobira (14.41%), while L. sinense showed the smallest decrease in ST thickness (15.77%). Concurrently, the PT of L. sinense exhibited the highest decrease rate (43.87%), whereas P. tobira showed the lowest (17.44%). The ratio of PT/ST varied among the four plants with decreasing light intensity.

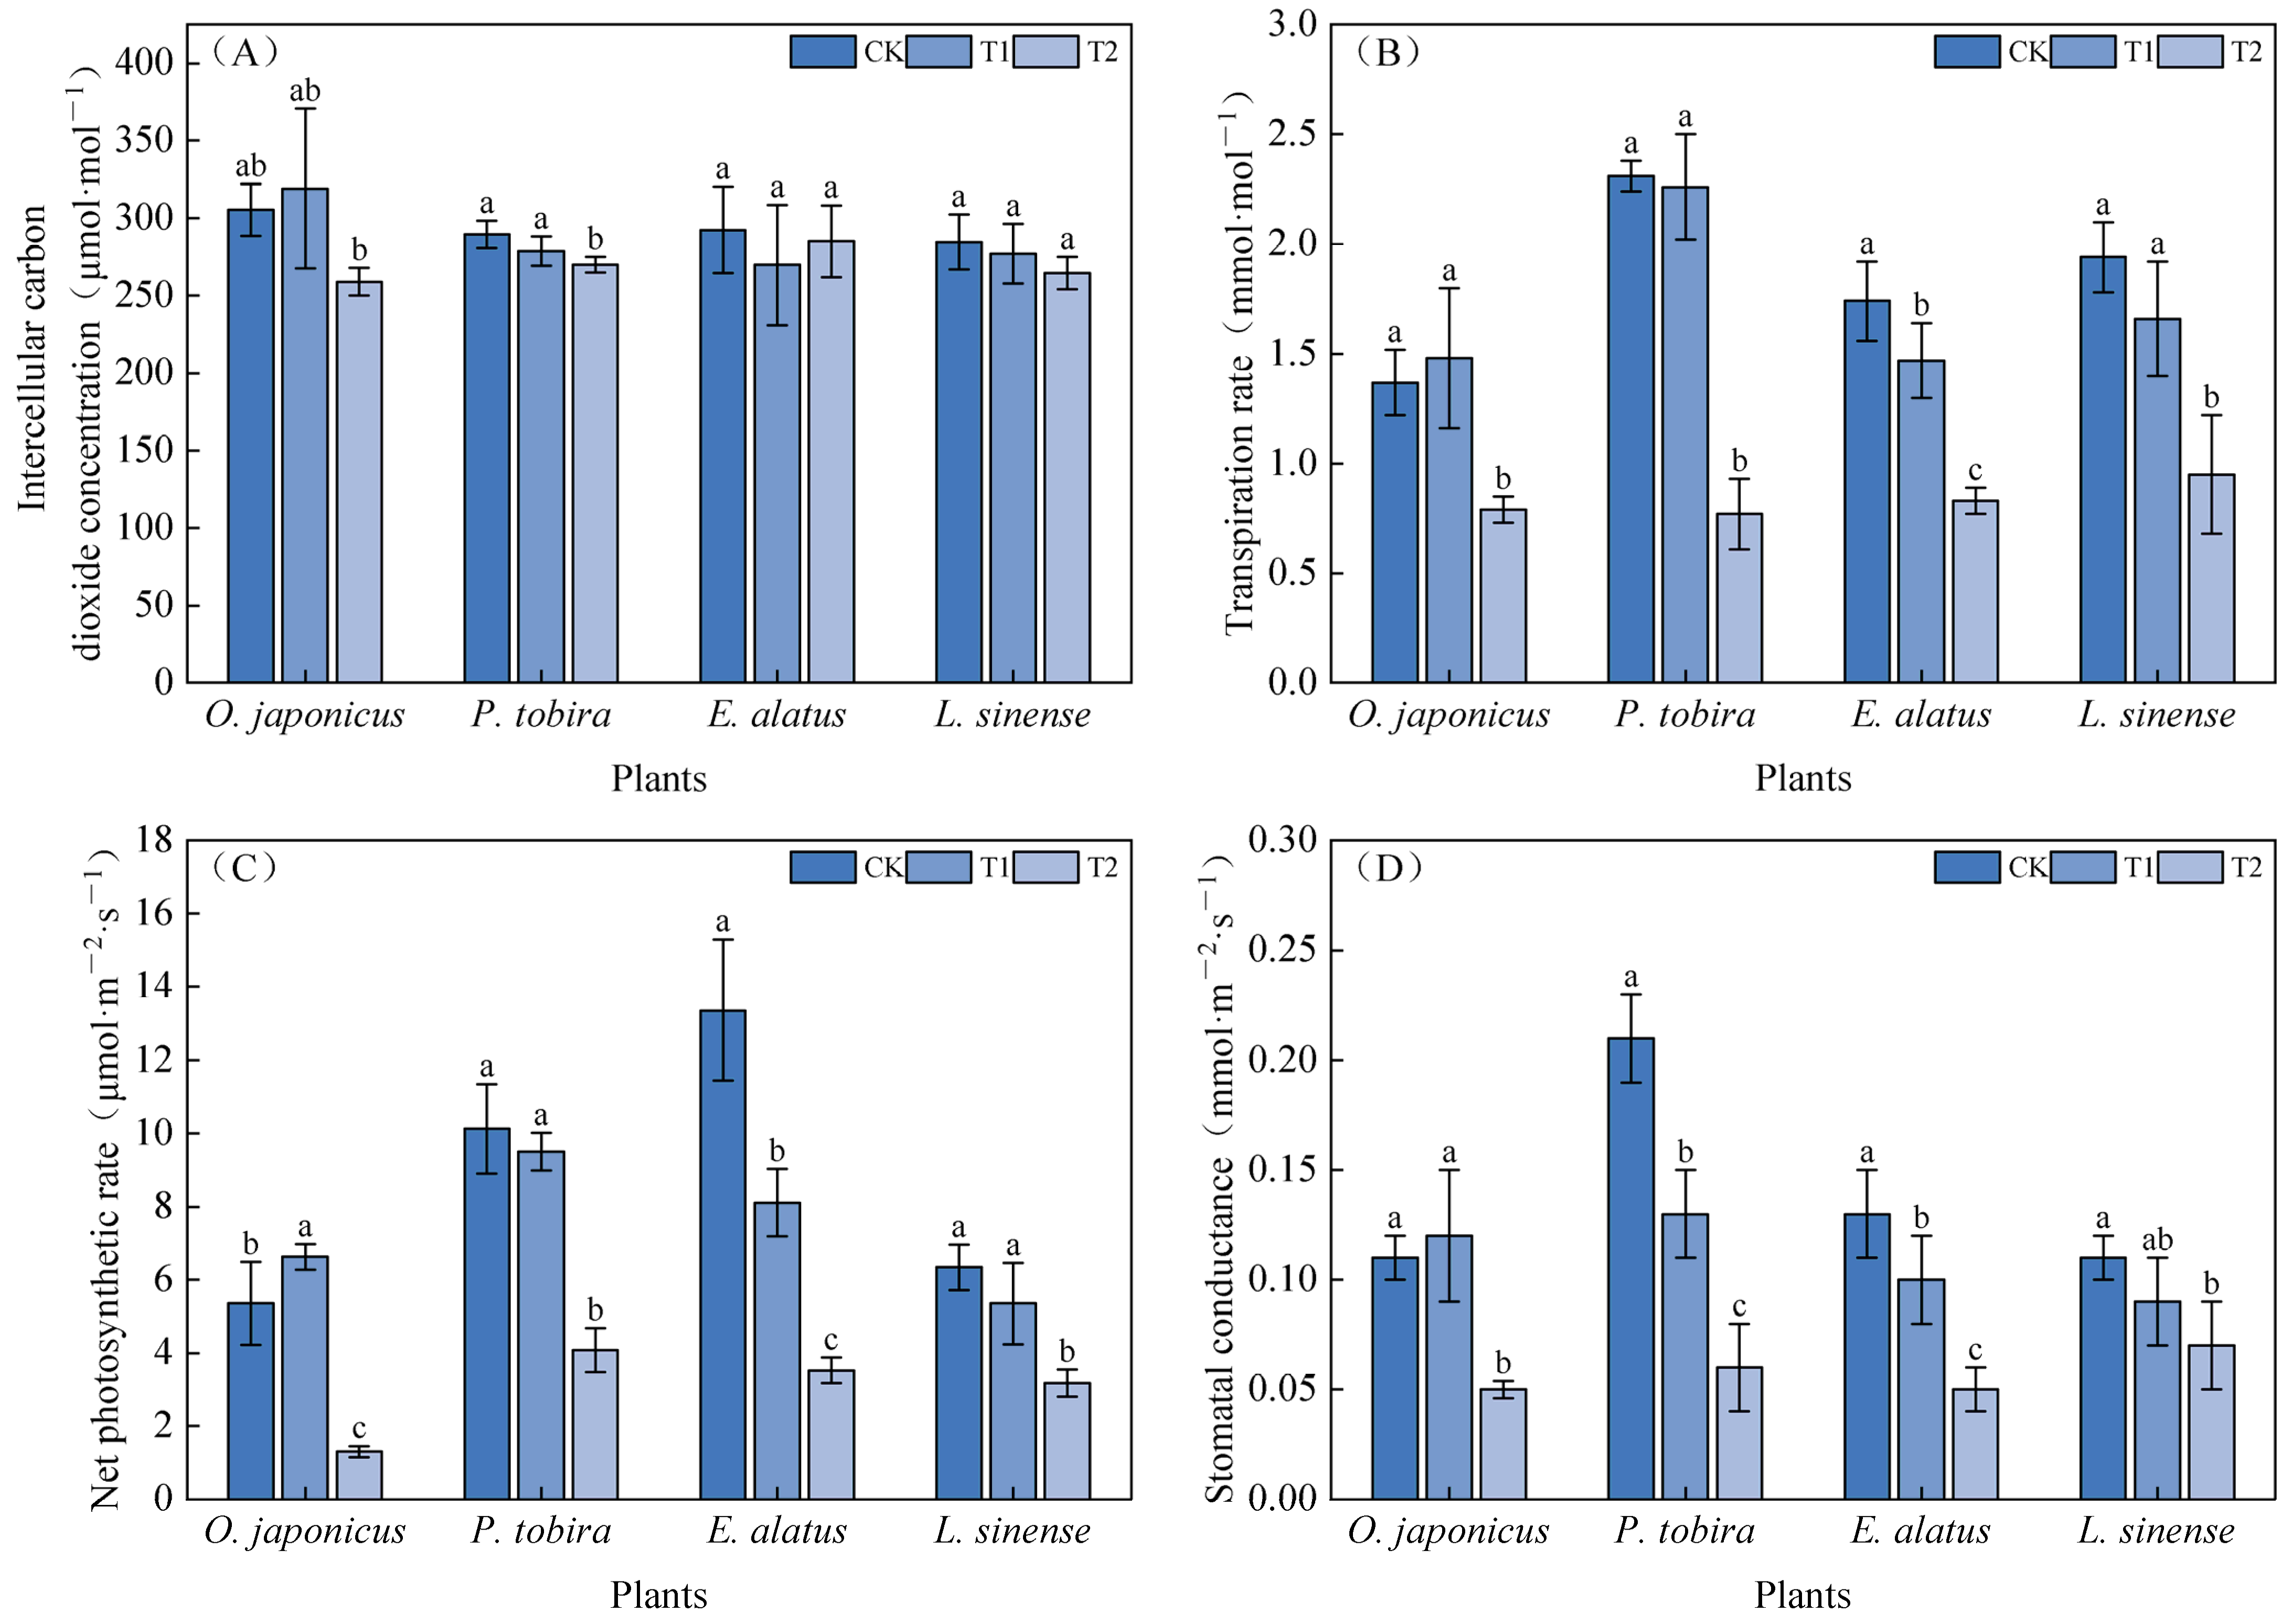
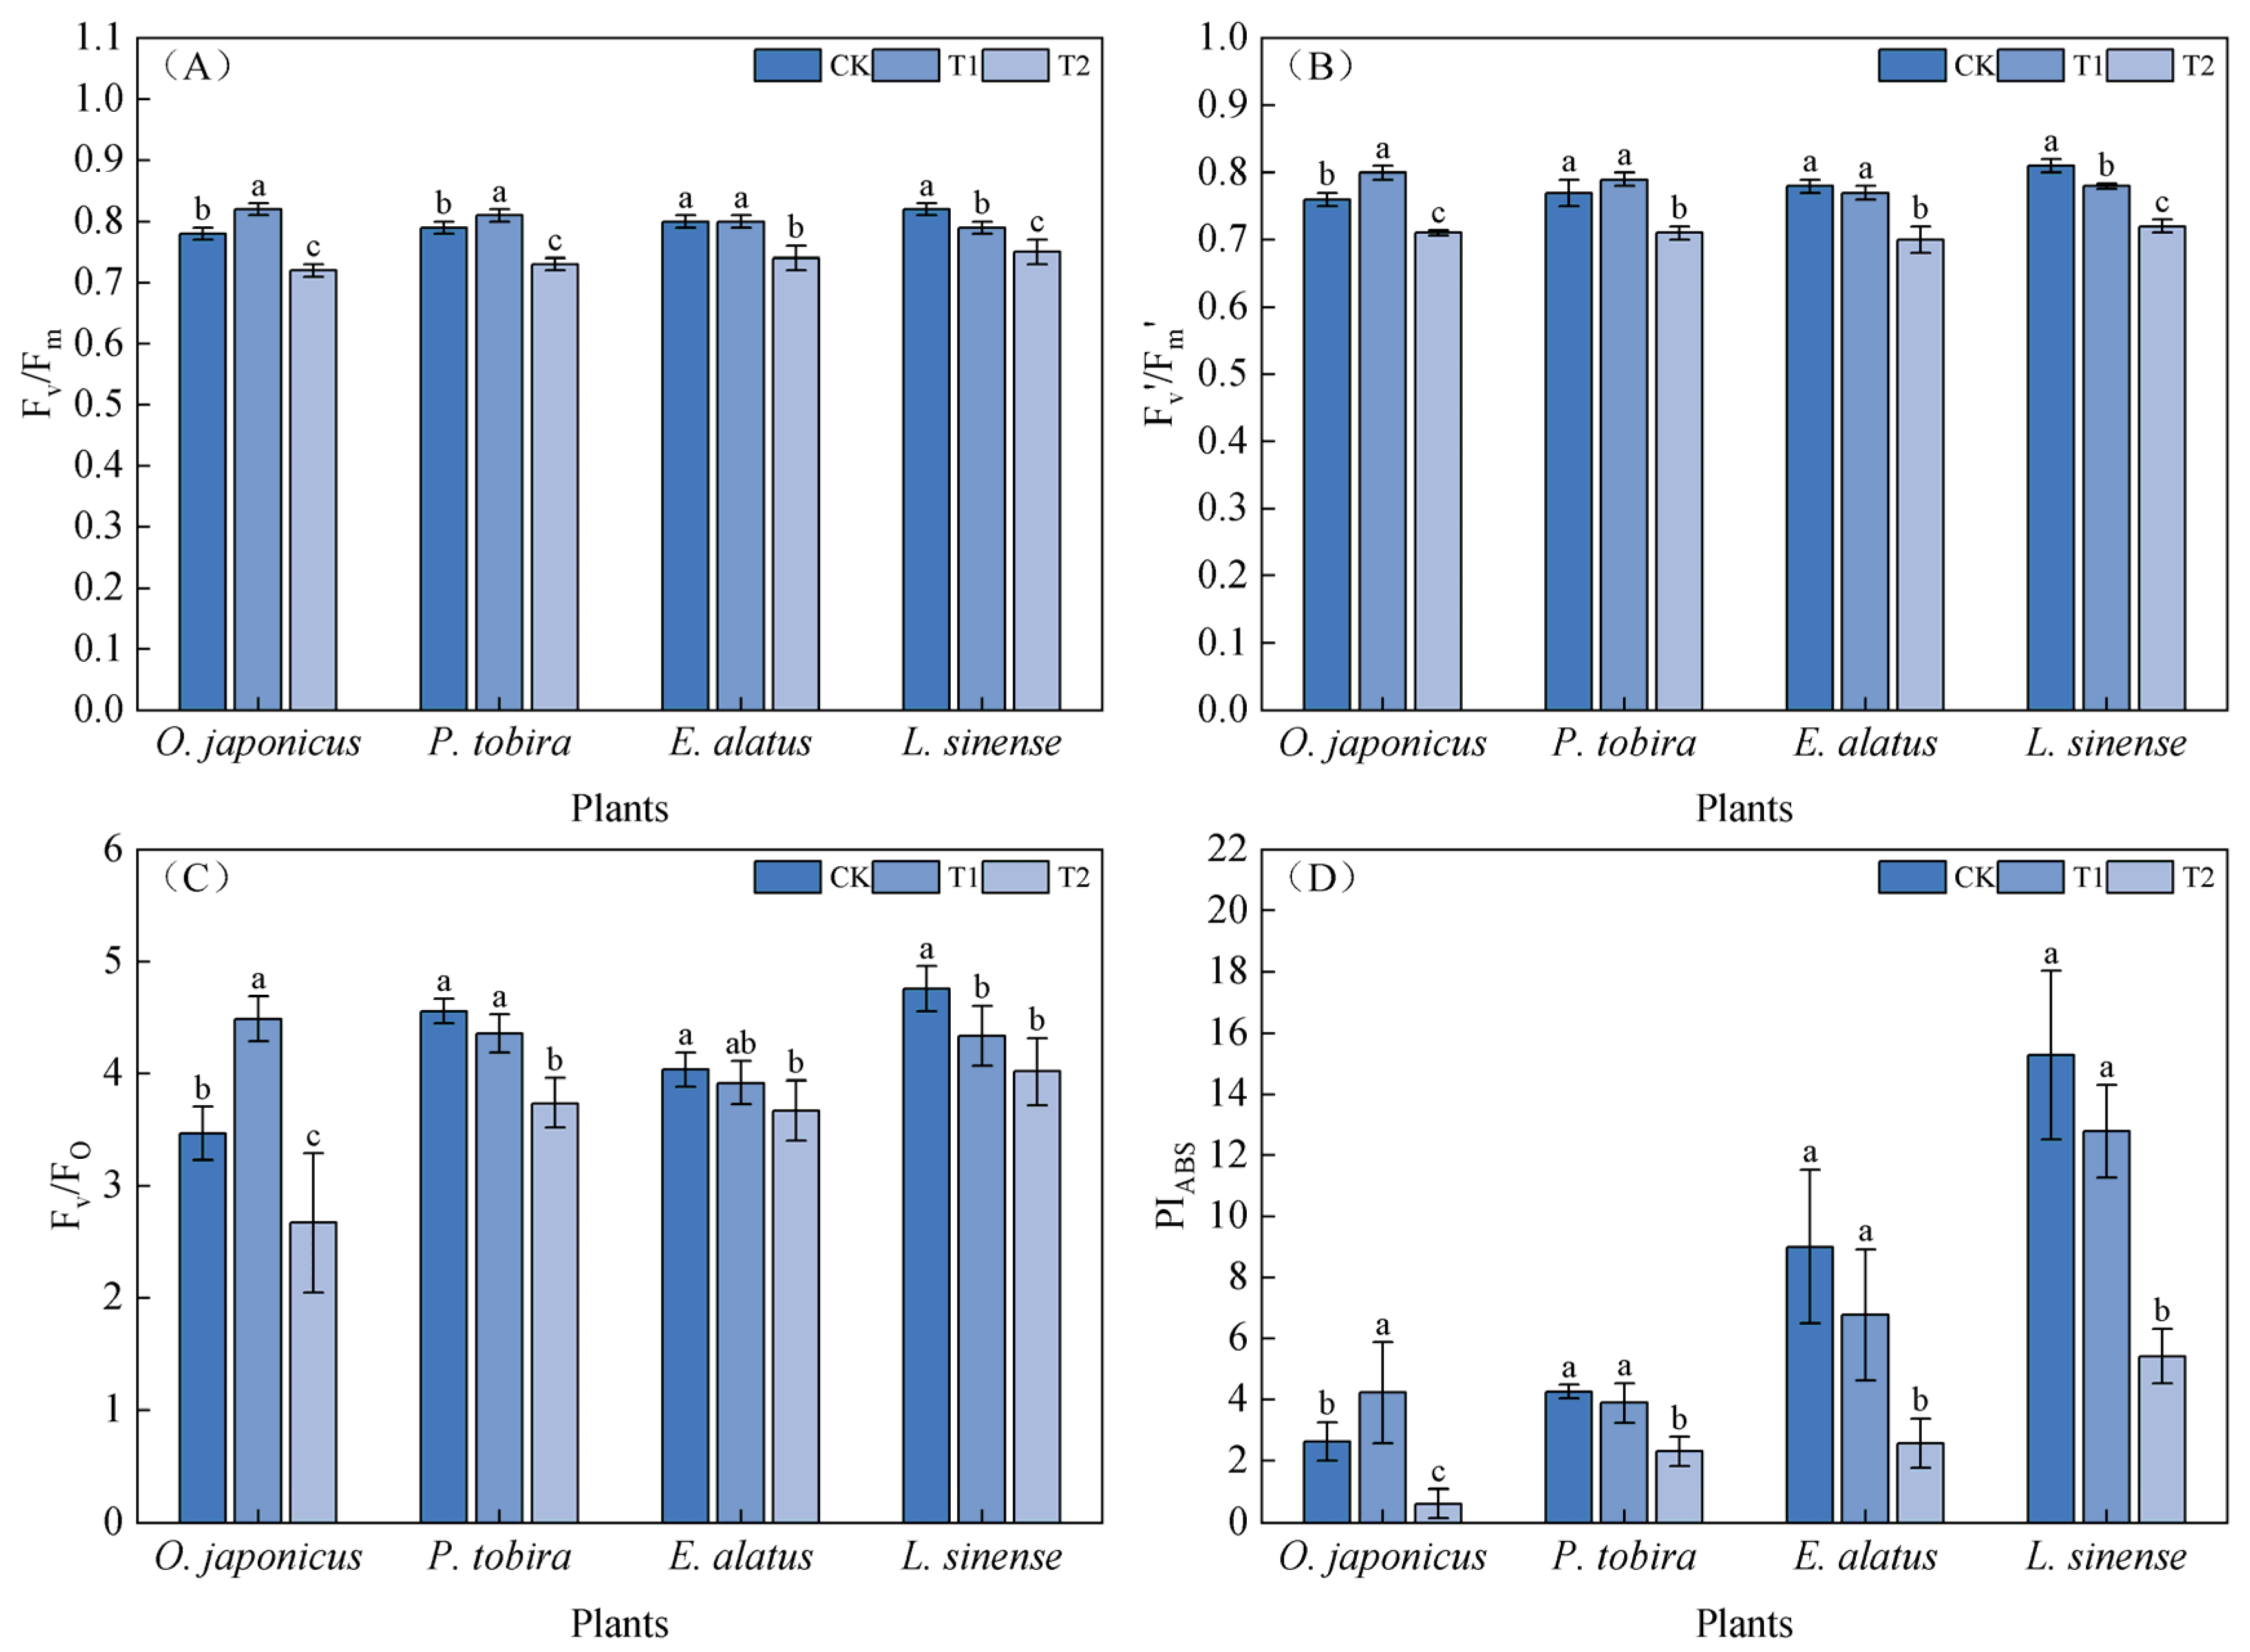
3.2. Photosynthetic Parameters and Chlorophyll Fluorescence Parameters Under Different Light Intensities

The photosynthetic parameters of P. tobira, E. alatus, and L. sinense all exhibited a decreasing trend with decreasing light intensity, while O. japonicus first increased and then decreased with decreasing light intensity, reaching their peak under T1 treatment, significantly higher than T2 (p < 0.05) (Figure 3,). Overall, the Ci and Tr of the four plant species under CK and T1 were significantly higher than T2 (p < 0.05) (Figure 3A and Figure 4B). Among the three sampling areas, the plant with the highest average Ci was O. japonicus, while the lowest was L. sinense; the plant with the highest Tr was P. tobira, and the lowest was O. japonicus. Simultaneously, considering the overall trends, the Pn and Gs under the CK treatment were significantly higher than those under T1 and T2 (p < 0.05) (Figure 3C and Figure 4D). As the light intensity continued to decrease, compared to CK, the species under the T2 treatment showed a higher loss rate of Pn, with E. alatus and O. japonicus experiencing reductions of 73.59% and 75.58%, respectively, while L. sinense exhibited the smallest loss rate (49.76%); the species with the higher loss rate of Gs conductance were E. alatus (61.54%) and P. tobira (68.93%), whereas L. sinense demonstrated the smallest loss rate (36.84%).
The trends in the maximum photochemical efficiency (Fv/Fm), effective quantum yield of photosystem II (Fv/Fm), potential photochemical efficiency (Fv/Fo), and photosynthetic performance index (PIABS) of the leaves of the four plant species under different light environment are depicted in Figure 4. Observing the overall trends across the four plants, as the light intensity decreased continuously, the values of Fv/Fm, Fv/Fm, Fv/Fo, and PIABS under the CK and T1 treatments were significantly higher than those under the poorest light condition of the T2 treatment group (p < 0.05). Examining the variations under different light treatments within the same plant species, P. tobira and O. japonicus reached their peak values of Fv/Fm and Fv/Fm under the T1 treatment, both significantly higher than those under the T2 treatment (p < 0.05) (Figure 4B). Additionally, the Fv/Fo and PIABS of O. japonicus also initially increased and then decreased with decreasing light intensity, reaching their highest values under the T1 treatment. Conversely, the chlorophyll fluorescence parameters of E. alatus and L. sinense decreased with decreasing light intensity, following a trend of CK > T1 > T2 (Figure 4C,D).

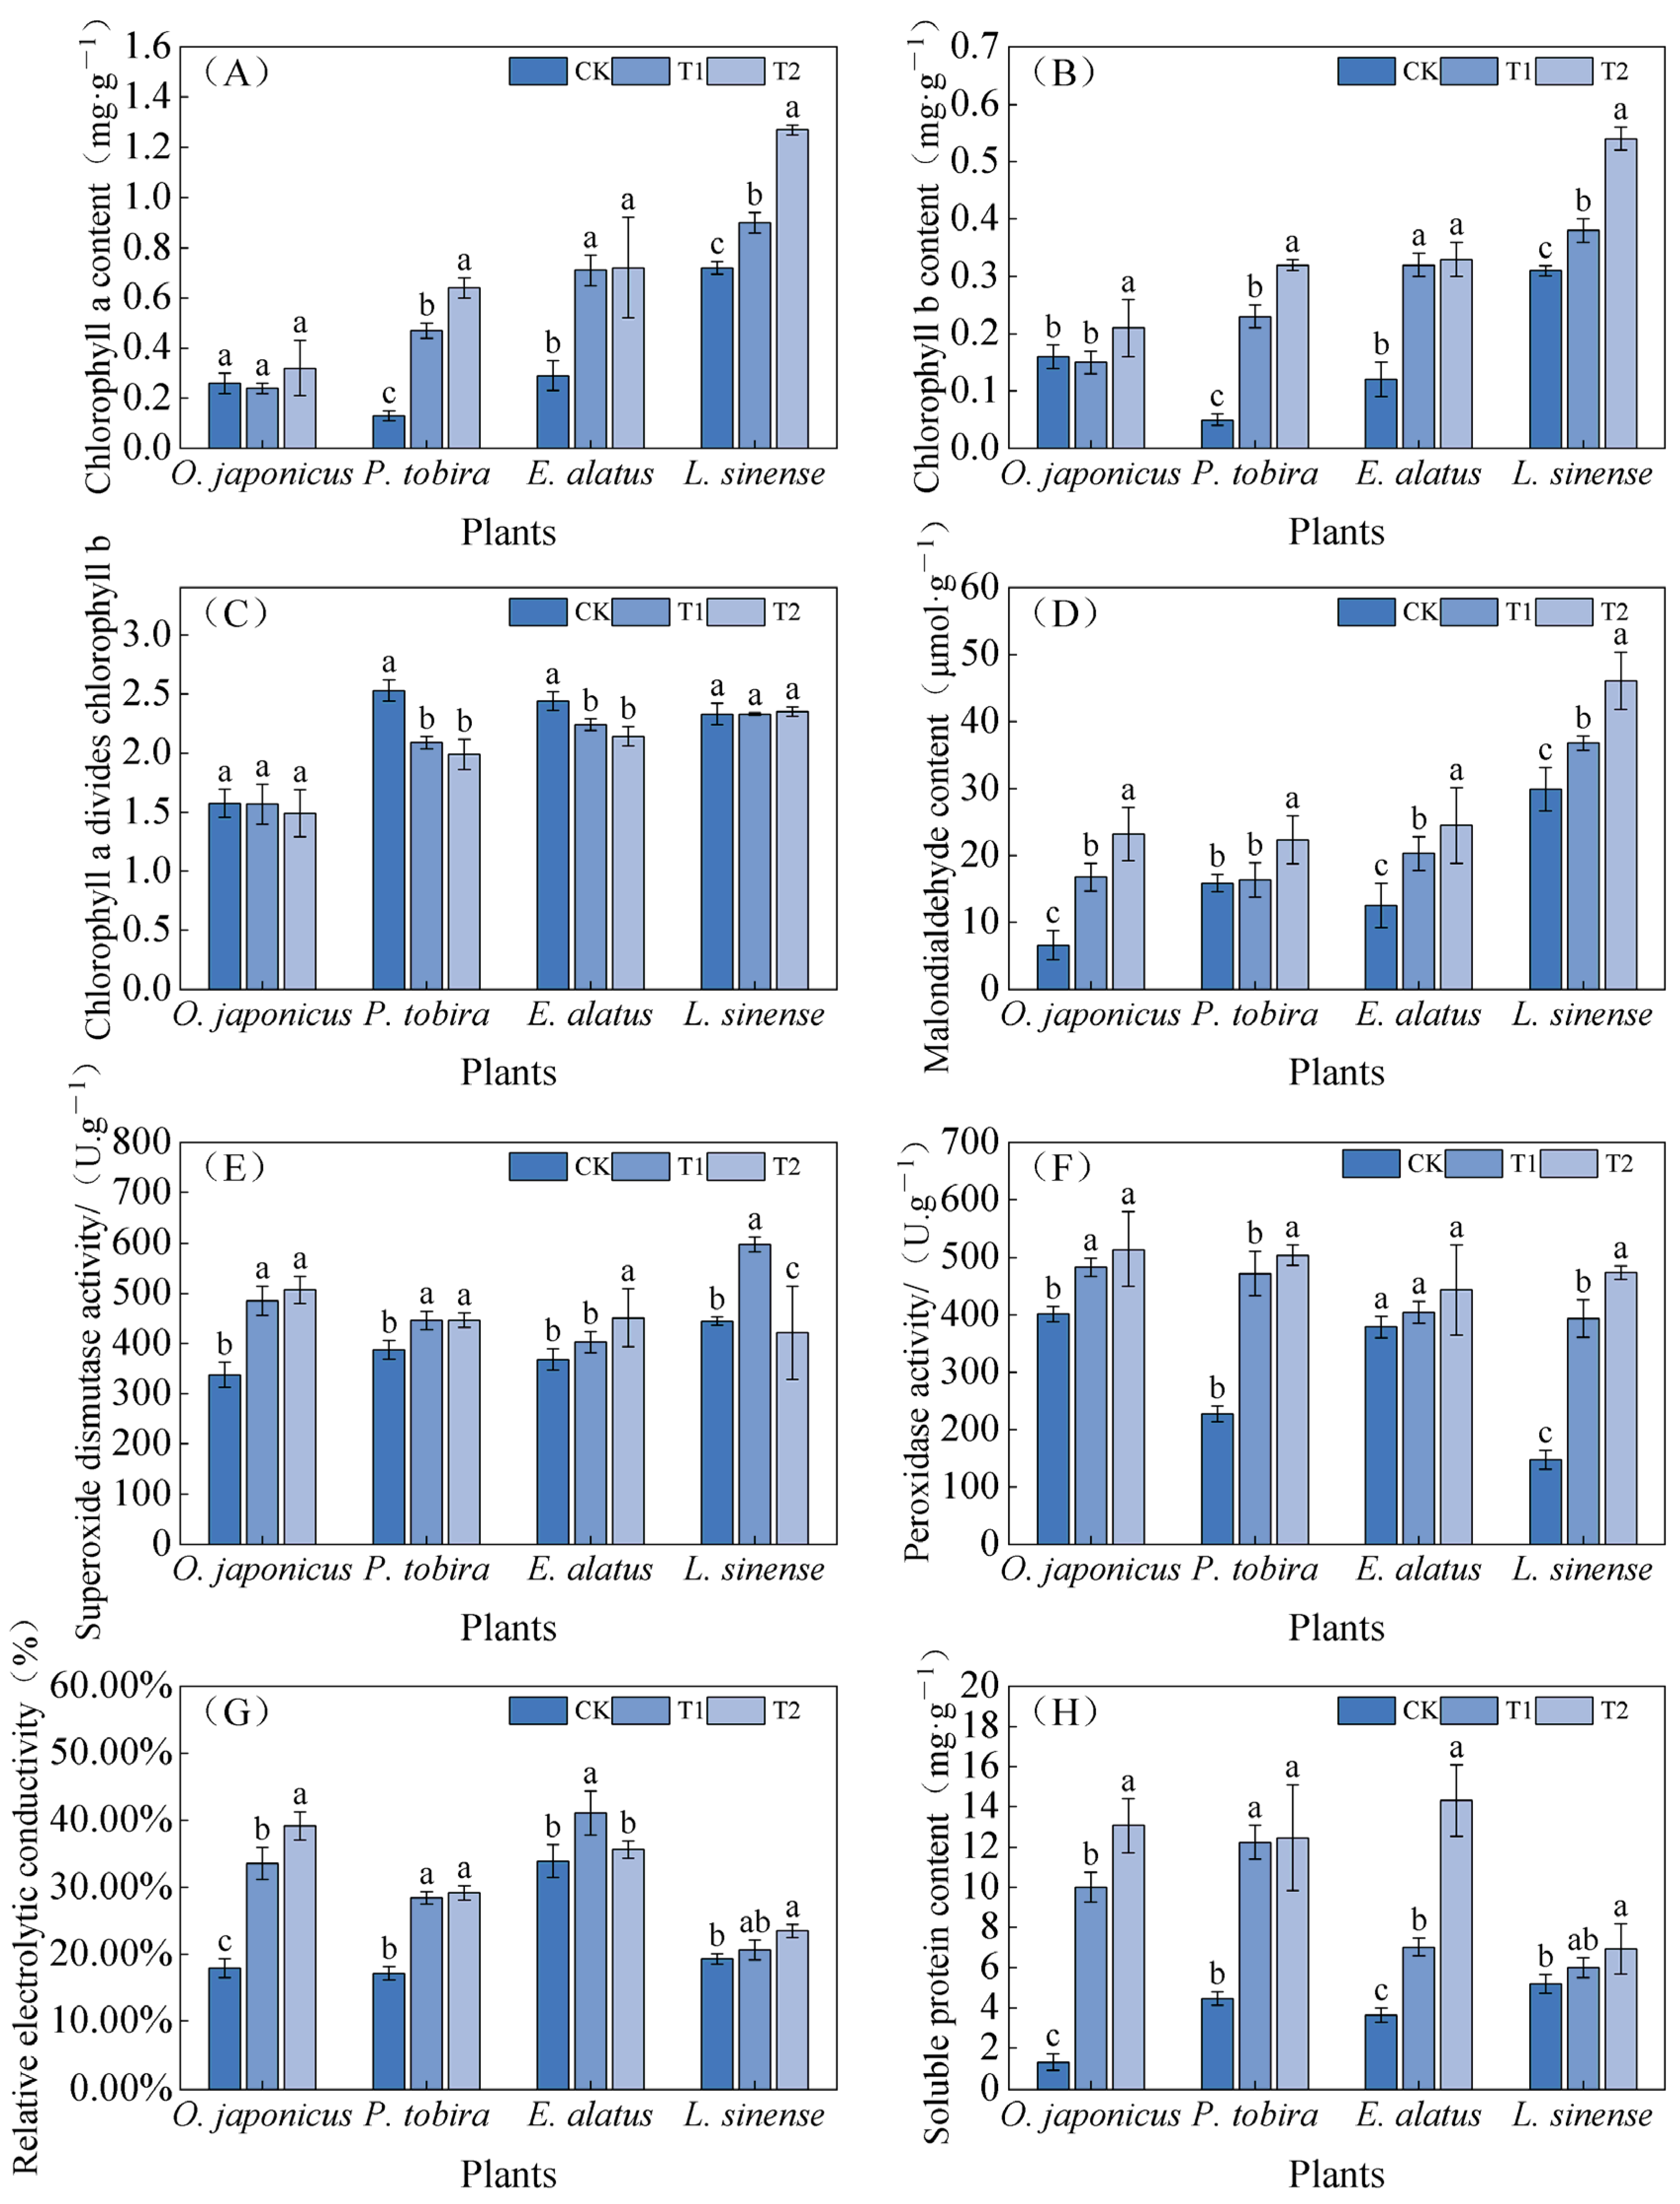
3.3. Physiological Indices Under Different Light Intensities

The variations in the physiological indices of plant leaves under different light intensities are illustrated in Figure 5, wherein the Chl a and b contents of the leaves of all plants exhibited an increasing trend as light intensity decreased, reaching their peak values under the T2 light environment (Figure 5A,B). Comparing the same plant under different light treatments, the greatest increase in the Chl a and b contents under the T2 treatment was observed in P. tobira, whereas the smallest increase was noted in O. japonicus, respectively. Additionally, except for L. sinense, the Chl a/b of each plant decreased with decreasing light intensity, and there were no significant differences in the values among the four plants under the three light intensities (p > 0.05) (Figure 5C).
In all three light environments, the leaf MDA content of the same plant exhibited an upward trend as light intensity decreased (Figure 5D), with the MDA content of the leaves under the T2 treatment significantly higher than others (p < 0.05). Among the four plants, the average leaf MDA content was highest in L. sinense and lowest in O. japonicus under the three light environments. Moreover, with the continuous decrease in light intensity, the largest increase in the leaf MDA content was observed in O. japonicus and L. sinense, while the smallest increase was noted in P. tobira. The activity of the leaf SOD and POD of each plant generally increased with decreasing light intensity, showing a pattern of CK < T1 < T2 (Figure 5E,F), and the total average values of the leaf antioxidant enzyme activity in the T1 and T2 treatment groups were significantly higher than those in CK (p < 0.05). As the light environment deteriorated, the variation in SOD activity was relatively small in P. tobira, while it was substantial in O. japonicus and L. sinense; the variation in POD activity was small in E. alatus and large in P. tobira.
From Figure 5G,H, it is evident that the SP content and relative conductivity of the leaves of the four plant species exhibited a trend of T2 > T1 > CK, all increasing as light intensity decreased. Moreover, except for L. sinense, the SP content and relative conductivity under the T2 treatment were significantly higher than those in the CK treatment group (p < 0.05) for each plant. Compared to CK, the highest increase in SP content under the T2 treatment was seen in O. japonicus, while the lowest increase was in L. sinense. The average REC of the leaves in the three sampling areas ranked from highest to lowest as follows: E. alatus (36.85%) > O. japonicus (30.19%) > P. tobira (24.89%) > L. sinense (21.13%).

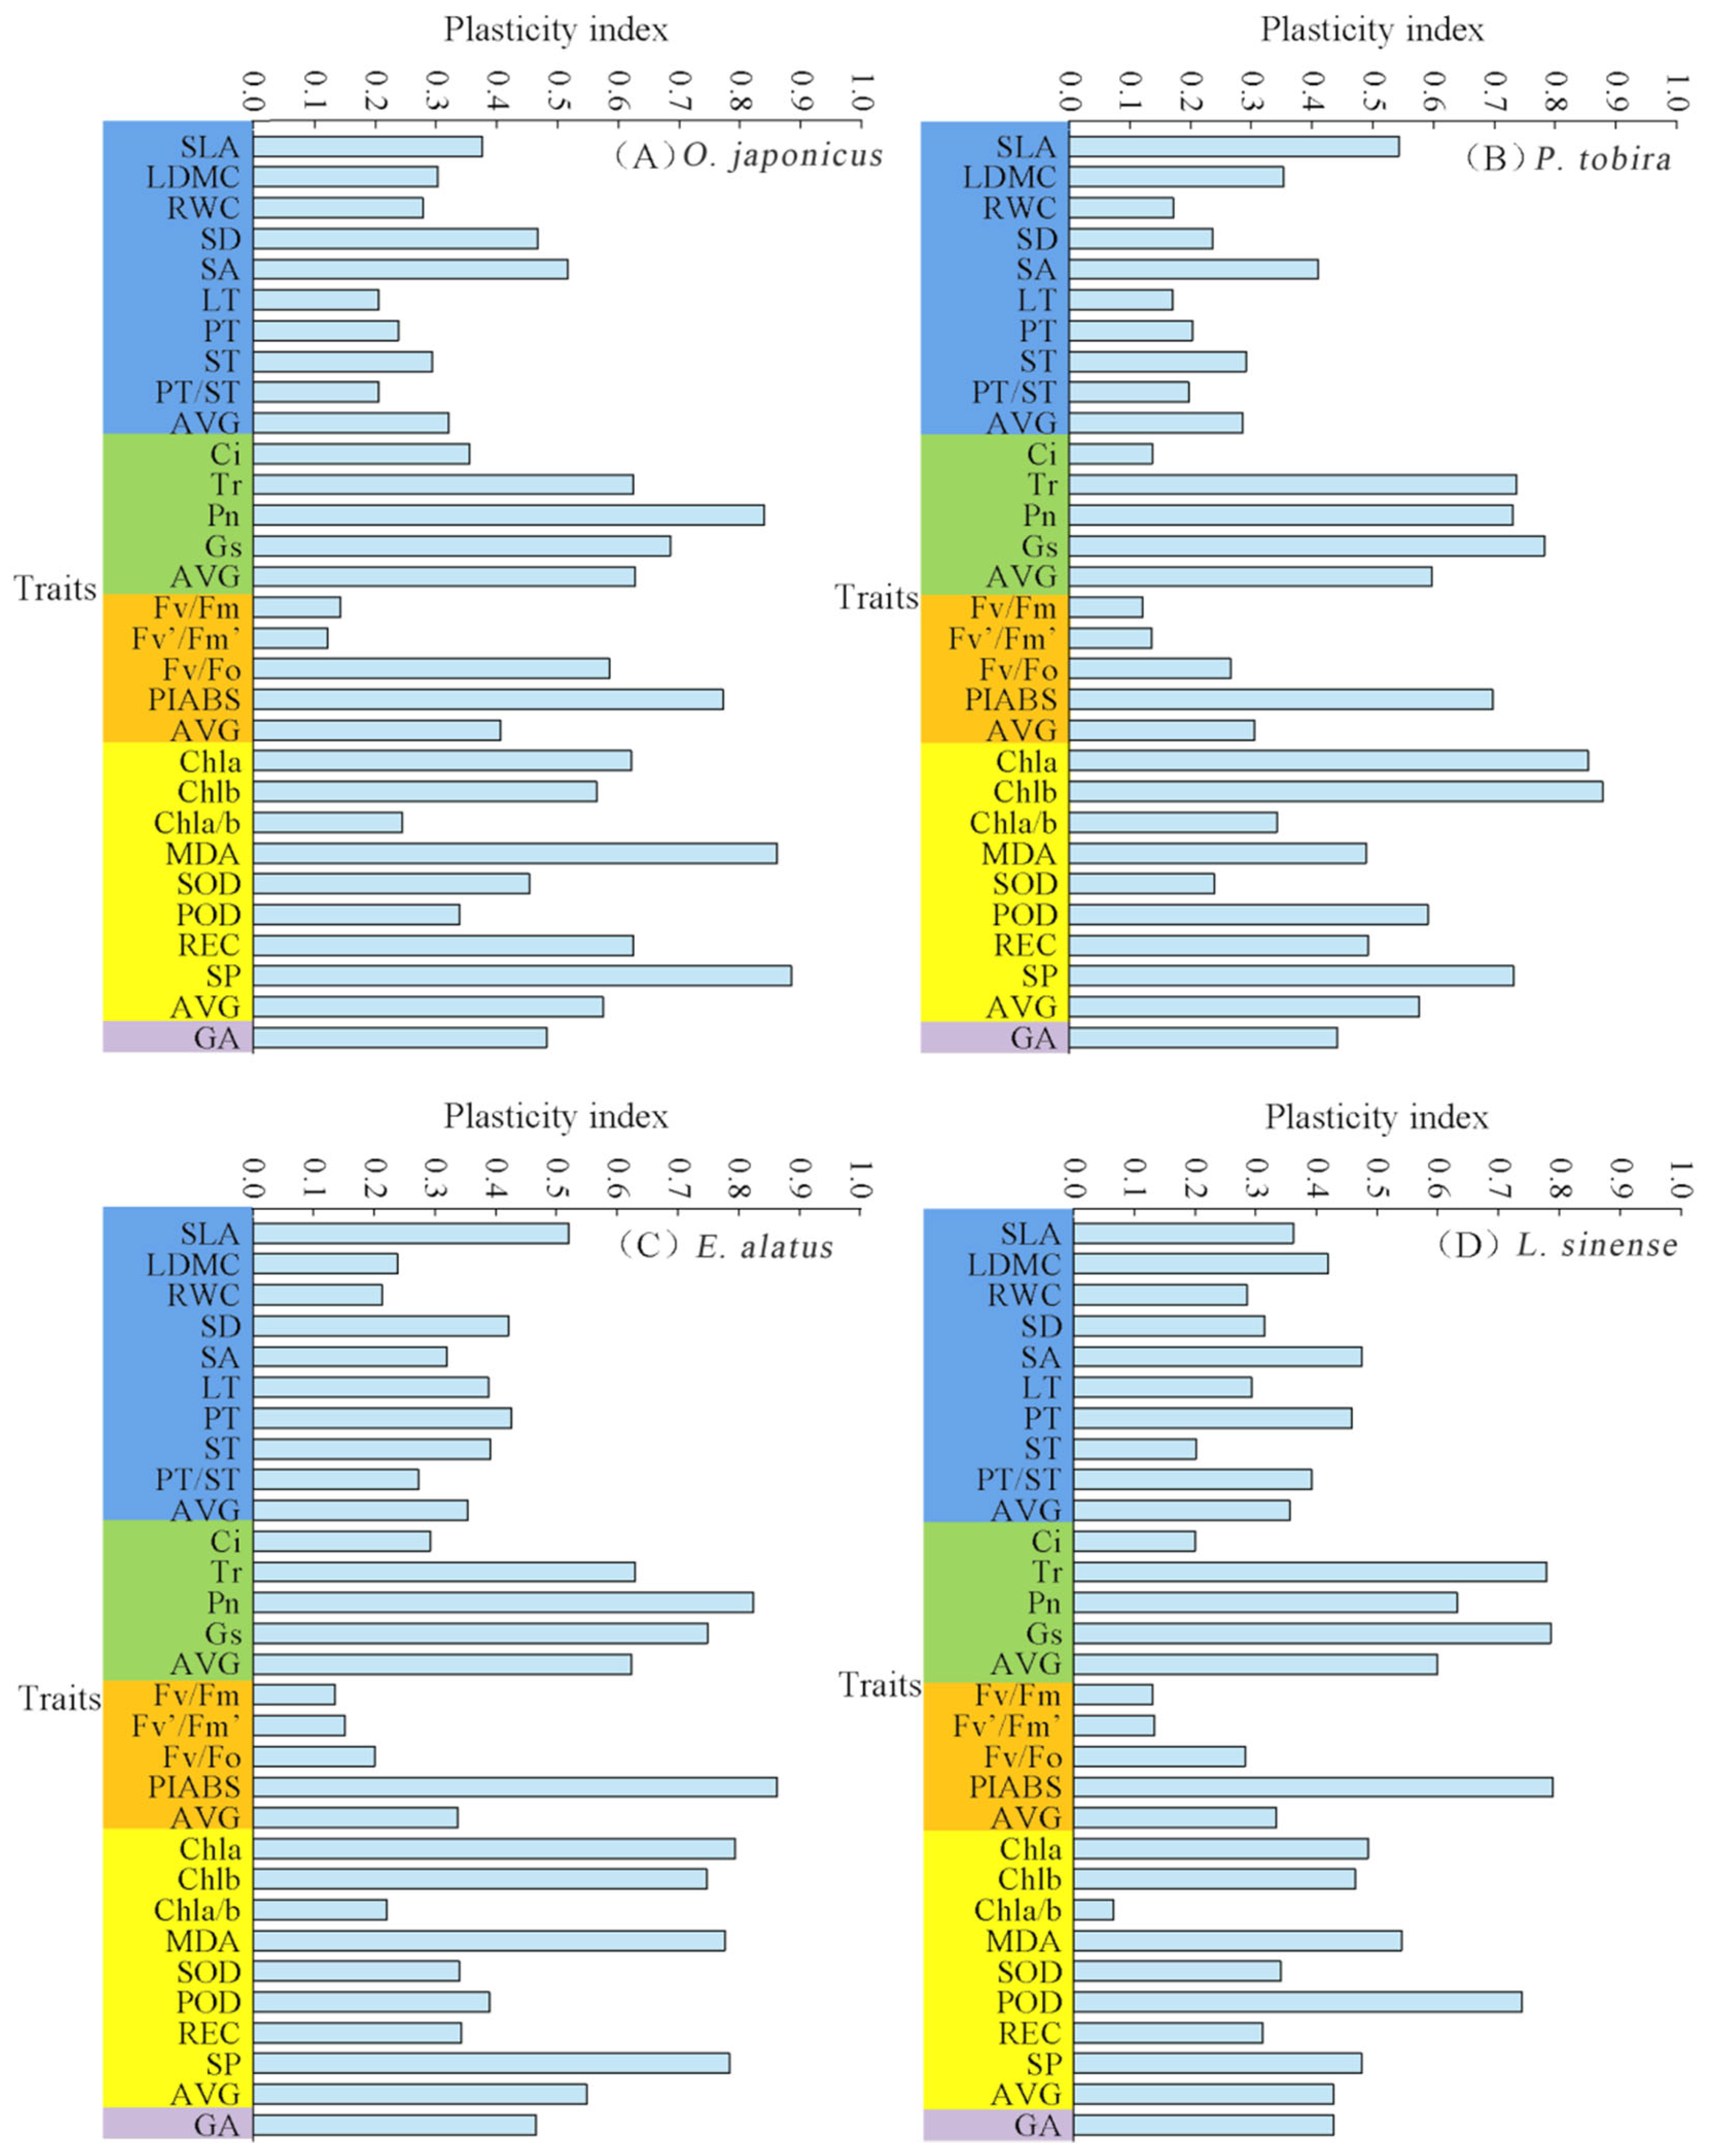
3.4. PPI of Plant Leaves Under Different Light Intensities

The plasticity indices of leaf morphological traits, photosynthetic parameters, chlorophyll fluorescence parameters, and physiological indicators of the four plants were computed (Figure 6); it was discerned that the overall average plasticity values of the four plants ranked from highest to lowest as follows: O. japonicus > E. alatus> P. tobira > L. sinense. The photosynthetic and physiological traits of the four plants exhibited relatively high plasticity under varying light environments, whereas the plasticity indices of morphological traits and chlorophyll fluorescence parameter traits were comparatively lower. In terms of photosynthetic traits, all four plant species exhibited considerable plasticity in Tr, Pn, Gs, whereas the plasticity of Ci was relatively lower. Additionally, O. japonicus exhibited a higher mean plasticity index for photosynthetic traits than the other three species. Regarding physiological indicators, O. japonicus, E. alatus, and P. tobira displayed strong plasticity in terms of Chl a and b and SP content. In contrast, the plasticity of antioxidant enzymes and the Chl a/b ratio was comparatively lower. The mean plasticity indices for physiological traits ranked as follows: O. japonicus > E. alatus > P. tobira > L. sinense. For morphological traits, P. tobira and L. sinense showed higher plasticity in SLA, while the plasticity of LDMC and RWC was relatively low. O. japonicus demonstrated higher plasticity in SD and SA. Among these species, L. sinense displayed the highest plasticity index for morphological traits, while E. alatus exhibited the lowest. In terms of chlorophyll fluorescence parameters, the PIABS of all four species exhibited strong plasticity, while the plasticity of the other three chlorophyll fluorescence parameters was relatively weaker.

3.5. Double Factor Variance Analysis of Species and Light Intensities on Different Indexes

The results of the two-way ANOVA showed that the species factor had no significant effect on Ci but had a significant impact on Fv/Fm and Fv/Fm and highly significant effects on other parameters. Light intensity significantly affected Ci and had an extremely significant effect on all other indicators. The interaction between species and light intensity had no significant effect on specific indicators such as SLA and SA, but it significantly affected Ci and POD activity and had an extremely significant effect on other indicators. Furthermore, the interaction between species and light intensity had a considerable impact on the anatomical structure of plant leaves and SD but a weaker effect on Ci. Overall, light intensity significantly influenced all indicators, with high F-values, indicating that light intensity played a dominant role in plant growth (Table 2).

4. Discussion

4.1. Response of Leaf Phenotypic Indicators to Shade

Leaf is the primary site for photosynthesis and energy exchange, making it highly sensitive to environmental changes [17]. The leaf’s morphological and physiological characteristics directly impact its light resource utilization [34]. In this study, the SLA of the four plant species increased as light intensity decreased, with a larger SLA indicating greater leaf area and thinner leaves, allowing plants to capture more light in low-light environments [35]. In low light, plants tend to reduce leaf thickness and dry weight, allocating resources to increase leaf area to maximize light absorption and enhance photosynthesis [36]. O. japonicus showed the highest SLA, indicating better adaptation to low light, while P. tobira had the lowest SLA, suggesting poorer adaptability to such conditions. The LDMC in full sunlight (CK) was higher than in shaded environments (T1 and T2). This higher LDMC reflects thicker leaves, protecting photosynthetic structures from high light and heat stress [10,37]. In high-light environments, plants prioritize leaf dry weight and thickness over leaf area, reflecting a resource allocation strategy to mitigate light stress [38]. Among the plants, L. sinense had the highest LDMC, indicating better biomass accumulation under high light, whereas E. alatus had the lowest, showing poor tolerance to strong light. RWC in leaves was lower under weak light, correlating negatively with membrane permeability, suggesting that weak-light stress damaged the cellular membranes. Additionally, soil compaction and low moisture in shaded environments may also contribute to lower RWC [7]. L. sinense showed the highest relative RWC loss under shaded conditions, indicating poor adaptation to shaded environments, with more significant damage to leaf cells compared to the other species. This phenomenon may be related to the lack of effective stress resistance mechanisms in L. sinense under shaded conditions, leading to its weaker ability to cope with water stress and light limitation [15].
Photosynthesis, respiration, and transpiration in plants were all closely linked to leaf stomata, which serve as crucial channels for gas and water exchange between plants and their external environment, exhibiting high genetic stability [39]. However, the density and size of stomata were significantly influenced by light intensity. In most plants, SD decreases while SA increases with the continuous reduction in light intensity, enabling plants to maintain a high photosynthetic capacity in low-light conditions [40]. In this study, the SA of the four plants reached its maximum under the T2 low-light environment, while SD reached its minimum. It is hypothesized that a stomatal structure with low density and large stomata is more conducive to gas and water exchange with the external environment in shaded environments, ensuring the plants’ light-use efficiency [41]. Moreover, E. alatus primarily adjusted SD, whereas L. sinense mainly adapted to shaded environments by adjusting SA, possibly due to different stomatal regulation mechanisms inherent to each plant [16].
The mesophyll differentiated into palisade and spongy parenchyma, with the PT providing structural support and performing photosynthesis, while the ST facilitated gas exchange and adapted to low-light environments [42]. Under full light, thicker mesophyll and epidermal layers are needed to refract intense light and conserve moisture. Columnar cells in the palisade tissue allow light to pass through vacuoles or intercellular spaces, dissipating light energy and preventing damage from excessive light [43]. In this study, as light intensity decreased, PT, ST, and LT decreased in the four plants, highlighting their sensitivity to light changes. The proportion of ST increased in E. alatus and L. sinense, enhancing the absorption of reflected and scattered light in low-light conditions. In contrast, O. japonicus and P. tobira exhibited different trends in palisade tissue thickness. Additionally, while LT in P. tobira and E. alatus decreased under low light, upper epidermal thickness increased under the T2 treatment, indicating varied leaf anatomical responses to low-light environments [18]. In summary, plants optimize leaf structure in low-light environments to enhance light absorption and utilization while reducing light damage and water loss, enabling them to sustain growth and physiological activities [44].

4.2. Response of Photosynthetic Parameters to Shade

Light serving as the primary energy source for photosynthesis played a crucial role in processes like electron transfer, photosynthetic phosphorylation, and carbon assimilation in the development of plant leaf morphology [45]. In continuously decreasing low-light conditions, the changes in the leaf morphology structure of the four plants result in differences in photosynthetic parameters. In this study, the photosynthetic parameters (Pn, Gs, Ci, and Tr) of O. japonicus reached their highest values under T1, showing excellent photosynthetic characteristics. It is speculated that moderate shading and low-light environments benefit the growth of O. japonicus [12]. In contrast, the photosynthetic parameters of the other three plants decreased with reduced light intensity, with some parameters under T2 significantly lower than CK, indicating that light deficiency caused resource loss and damage to their photosynthetic apparatus [45]. Studies have shown a close relationship between net photosynthetic rate and stomatal conductance. The Pn and Gs of the four plants were positively correlated, with higher Gs in treatment groups with better light intensity, effectively enhancing CO2 and water entry into the photosynthetic organs, thus increasing Pn and Tr [46].
Chl fluorescence parameters are intrinsic probes of the relationship between plant photosynthesis and the environment, reflecting the adaptability of plants to adverse conditions [47]. Fv/Fm represents the light energy conversion efficiency in PSII reaction centers, indicating the level of photosynthetic inhibition. In this study, Fv/Fm of the four plants under CK and T1 treatments was within the normal range, while under T2, it was lower, showing photoinhibition, likely due to the extremely weak-light environment restricting photosynthesis [17]. Plants optimize the photosynthetic process by adjusting the Fv/Fm ratio, allowing them to maximize the utilization of light energy under limited light conditions. In this case, the decrease in Fv/Fm values may be one of the strategies plants use to adapt to low-light environments under viaducts, indicating that the efficiency of photosystem II is reduced during the photosynthetic process, but photosynthesis can still continue [8]. Additionally, the values of Fv/Fm, Fv/Fo, and PIABS showed that O. japonicus had maximum values under T1, significantly higher than T2, suggesting that moderate shading improves light energy capture efficiency and photochemical activity, optimizing the photosynthetic structure. In contrast, E. alatus and L. sinense showed a decrease in these parameters with reduced light intensity, indicating that low-light environments might damage their photosynthetic structures, lowering Pn compared to full light conditions. Therefore, E. alatus and L. sinense are more suited to environments with relatively abundant light.

4.3. Response of Leaf Physiological Indicators to Shade

Chl a/b in O. japonicus, P. tobira, and E. alatus decreased with decreasing light intensity, with the rate of increase in the Chl b content exceeding that of Chl a. This phenomenon may be attributed to variations in the accumulation of photosynthetic pigments, which affect the ability to capture light of different qualities. Chl b primarily absorbs blue and red light, and an increase in its content helps enhance the plant’s ability to capture light in low-light environments. Moreover, the ratio of Chl a/b can also reflect the shade tolerance of plants, with lower ratios generally indicating greater shade tolerance [48]. In this study, the average Chl a/b ratio of O. japonicus was 1.5, significantly lower than the other three plants, indicating a stronger adaptation to the weak-light conditions. Conversely, the average Chl a/b ratio of L. sinense was the highest at 2.37, indicating poor shade tolerance.
Low-light stress can also trigger a rapid accumulation of intracellular free radicals, intensifying the degree of lipid peroxidation in cell membranes, resulting in a large accumulation of MDA. In this study, the content of MDA and REC of the four plants increased with decreasing light intensity, indicating that the weak-light environment exacerbated the oxidative degradation of cell membranes. Moreover, an excess of free radicals can damage the activity of the PS Ⅱ reaction center in photosynthesis, thus limiting the process of photosynthesis in plants [49]. The MDA content in L. sinense was the highest, indicating that it experienced significant stress and damage under low-light conditions; its Pn was decreased by more than 50%. In contrast, O. japonicus exhibited the lowest MDA content; its Pn was increased in the T1 low-light environment, which may suggest its higher tolerance to variations in light conditions [50].
The activities of leaf SOD, POD, and SP content in all four plants showed a trend of T2 > T1 > CK. SOD and POD, as protective enzymes in the membrane lipid peroxidation defense system, exhibited increased activity under low-light conditions, assisting plants in clearing excess reactive oxygen species and maintaining the dynamic balance of reactive oxygen and antioxidant systems [51]. Meanwhile, SP, serving as essential nutrients and osmotic regulators in plants, can maintain the osmotic pressure balance inside and outside cell membranes under low-light conditions and prevent continuous electrolyte leakage from cells [52]. Furthermore, studies have found that antioxidant enzymes such as SOD were mainly distributed near the PS I reaction center. After plants were subjected to low-light stress, the higher activity of antioxidant enzymes near PS I can promote the metabolism of reactive oxygen species. Then, the photochemical efficiency of the PS II reaction center will enhance, and the normal progress of photosynthesis is ensured [53]. The antioxidant mechanisms in response to low-light stress under viaduct shading differed among the plants. L. sinense exhibited significant changes in leaf antioxidant enzyme activity, suggesting that it primarily alleviated low-light stress damage by enhancing intracellular antioxidant enzyme activity, thus maintaining the light energy conversion efficiency of the PS II reaction center. In contrast, O. japonicus showed the highest increase in SP content, indicating that it likely adapted to the shaded low-light environment mainly through the regulation of SP content [39].

4.4. Differences in the Plasticity Index of Morphological Traits Among Four Plants

The magnitude of plasticity indicators can reflect the strength of a plant’s adaptation to environmental changes [54]. This study found that the adaptability of plants in viaduct shadow weak-light environments primarily relied on the plasticity of photosynthetic and physiological traits. These traits helped plants cope with weak-light stress by regulating the photosynthetic rate and antioxidant enzyme activity, maintaining photosynthetic efficiency, and exhibiting high plasticity [55]. In contrast, the morphological traits and Chl fluorescence parameters showed slower changes due to genetic and developmental constraints, resulting in lower plasticity indices [24]. Specifically, adjustments in Chl fluorescence parameters required more time and were influenced by multiple factors [31]. Therefore, plants mainly adapted to weak-light environments through short-term physiological regulation, while changes in morphology and fluorescence parameters were more long-term adaptations.
In terms of photosynthetic traits, all four species showed high plasticity in Tr, Gs, and Pn, enhancing light capture and carbon assimilation efficiency by increasing stomatal openness and water use efficiency [18]. Among physiological traits, P. tobira, O. japonicus, and E. alatus exhibited stronger plasticity in Chl a/b and SP content. These species increased Chl content to enhance light energy absorption while adjusting SP synthesis to improve stress resistance. In contrast, L. sinense had lower plasticity in most physiological traits, except for peroxidase, suggesting that it relied more on other physiological mechanisms, such as the antioxidant enzyme system, to cope with weak-light stress. Regarding morphological traits, O. japonicus showed higher plasticity in SD and SA, likely increasing stomatal density and area to improve gas exchange and enhance photosynthesis [19]. P. tobira demonstrated greater plasticity in SLA, which helped increase light capture. E. alatus and L. sinense also exhibited strong plasticity in various leaf morphology indicators, suggesting that they optimized leaf shape and thickness to improve photosynthesis and water use in weak-light environments. For Chl fluorescence parameters, all four species exhibited higher plasticity in PIABS, while other fluorescence parameters such as Fv/Fm and Fv/Fm had lower plasticity. This indicates that these species mainly adjusted the structure and performance of photosynthetic organs to compensate for the low plasticity in the light energy capture and photochemical efficiency of PSII reaction centers [43]. Through the collaboration of these adaptive strategies, plants are able to capture sufficient resources in low-light environments to sustain growth and physiological activities.
From the perspective of plant life forms and resistance to adversity, O. japonicus is an evergreen herbaceous plant typically found in shaded, moist environments, showing strong adaptation to low-light conditions. Its well-developed root system allows it to efficiently absorb water and nutrients from poor soils, demonstrating high plasticity and adaptability [6]. E. alatus and P. tobira are evergreen shrubs that can grow in moderately shaded environments, but they require more light than O. japonicus and are better suited to sunnier areas. They also possess strong drought and cold resistance, making them relatively resilient [56]. In contrast, L. sinense has high light requirements during its growth and thrives in well-lit environments. In the low-light environments under viaducts, its photosynthesis is significantly inhibited, leading to poor adaptability and low plasticity, making it unsuitable for most areas of the bridge’s shaded green space [56].
Based on the overall plasticity of the species, the ranking from highest to lowest plasticity was O. japonicus > E. alatus > P. tobira > L. sinense. O. japonicus exhibited the strongest adaptability to the dynamic low-light environment under viaducts, with a broad light adaptation range. E. alatus and P. tobira demonstrated moderate adaptability, relying on adjustments in photosynthetic and anatomical structures. In contrast, L. sinense displayed the lowest overall plasticity and was not suitable for growth in the dynamic low-light environment under viaducts. The analysis of the double factor variance results indicated that light intensity had a significant impact on most plant traits, particularly on the photosynthetic parameters. Species had a significant effect on leaf morphology and biochemical characteristics. The interaction between species and light intensity primarily affected leaf anatomical structure and SD but had a weaker influence on Ci. Overall, light intensity is a key factor determining plant physiological and morphological responses. Light not only directly influences photosynthesis and stomatal regulation but also affects plant growth and development through the regulation of antioxidant mechanisms, Chl synthesis, and anatomical structure [17,18].

5. Conclusions

This study measured the leaf morphology, physiological photosynthesis, and Chl fluorescence parameters of four typical viaduct shadow greening plants in Zhengzhou under three different light environments, exploring their adaptive strategies and phenotypic plasticity mechanisms in low-light environments under viaducts. (1) With decreasing light intensity, most plants showed reductions in leaf morphological traits, photosynthetic parameters, and Chl fluorescence parameters, while specific indicators like leaf area and Chl and malondialdehyde (MDA) content increased. The photosynthetic indicators of O. japonicus first increased and then decreased. (2) O. japonicus exhibited the strongest adaptive capacity through comprehensive photosynthetic physiology and antioxidant regulatory mechanisms, with a wide light adaptation range. E. japonicus mainly relied on photosynthetic and anatomical structure adjustments, as well as leaf area regulation. P. tobira enhanced light tolerance by adjusting leaf area, epidermal structure, and physiological traits. L. sinense had the weakest adaptability, relying more on limited antioxidant enzymes and leaf thickness adjustments to cope with environmental changes. (3) In conclusion, the plasticity of plants is primarily reflected through photosynthetic characteristics and physiological traits. High plasticity in photosynthetic parameters (Pn, Tr, and Gs) and physiological indicators (Chl a, b, POD, and SP) is key for plants to adapt to the dynamic low-light environment under viaducts. This study is the first to systematically evaluate the adaptive mechanisms of different plants in the low-light environment under viaducts, providing a new basis for plant selection in future urban greening projects. Therefore, when greening the shaded areas under urban viaducts, it is crucial to fully consider the light environment under the viaduct and the light adaptability range of different plant species. Plants with high photosynthetic and physiological plasticity, such as O. japonicus > E. alatus, should be selected to ensure the optimal growth and development of plants in shaded areas, thereby maximizing the ecological value and benefits of viaduct greening.

Supplementary Materials

The following supporting information can be downloaded at: https://www.mdpi.com/article/10.3390/f16040651/s1, Figure S1: Cross-sectional diagram of the viaduct samples; Figure S2: Sample Plants; Figure S3: Schematic diagram of light measurement sample of north-south direction viaduct; Figure S4: Stomatal responses of plant leaves under different light environments; Table S1: Test plants; Table S2: Summary of paper academic term abbreviations.

Author Contributions

D.H.: writing—review and editing, conceptualization, project administration. H.L.: writing—original draft, investigation, formal analysis. P.Z.: data collection and processing. J.G.: investigation, methodology. J.Y.: data curation, formal analysis. J.W.: investigation. Y.L. (Yiping Liu): validation, visualization. Z.Z.: formal analysis, validation. Y.L. (Yakai Lei): supervision, visualization, funding acquisition. All authors have read and agreed to the published version of the manuscript.

Funding

This work was supported by the National Natural Science Foundation of China (NO.31600579) and Henan Provincial Science and Technology Research project (NO.212102110185).

Data Availability Statement

Data will be made available on request.

Acknowledgments

We appreciate the editors and reviewers for their comments and suggestions on our manuscript.

Conflicts of Interest

The authors declare no conflicts of interest.

References

  1. Liu, Y.; Luo, Y.; Miao, S.; Ding, H.; Jin, T.; Chen, J. Pseudo-simultaneous measurements for the spatial-temporal characteristics of accumulation and coarse mode particles near an urban viaduct within street canyons. Atmos. Pollut. Res. 2019, 10, 1643–1654. [Google Scholar] [CrossRef]
  2. Hao, C.; Xie, X.; Huang, Y.; Huang, Z. Study on influence of viaduct and noise barriers on the particulate matter dispersion in street canyons by CFD modeling. Atmos. Pollut. Res. 2019, 10, 1723–1735. [Google Scholar] [CrossRef]
  3. Yan, L. Research of Shaded Green Space Landscape Based on Natural Light Environment Under the Urban Viaducts—Case Study on Viaducts in Wuhan City. Ph.D. Thesis, Huazhong University of Science and Technology, Wuhan, China, 2012. [Google Scholar]
  4. Wang, X.; Xin, Y.; Song, K.; Da, L. Characteristics of light condition under viaduct and suitable greening distribution in city. Chin. J. Ecol. 2006, 25, 938–943. [Google Scholar] [CrossRef]
  5. Wang, K. The Research on Site Condition and Greening Strategy of Shaded Green Space Under Viaduct—Take the Main Urban Region of Wuhan as an Example. Master’s Thesis, Huazhong University of Science and Technology, Wuhan, China, 2017. [Google Scholar]
  6. Xing, Q.; Zeng, L.; Hu, Y.; Liu, Z.; Qin, J. Effects of shade environment under viaducts on physiological characteristics of 5 greening plant species. Acta Agric. Shanghai 2021, 37, 78–85. [Google Scholar] [CrossRef]
  7. Chai, S.; Tang, J.; Mallik, A.; Shi, Y.; Zou, R.; Li, J.; Wei, X. Eco-physiological basis of shade adaptation of Camellia nitidissima, a rare and endangered forest understory plant of Southeast Asia. BMC Ecol. 2018, 18, 5. [Google Scholar] [CrossRef]
  8. Zhang, Y.; Guo, Q.; Luo, S.; Pan, J.; Yao, S.; Guo, Y.; Wang, G. Light Regimes Regulate Leaf and Twigs Traits of Camellia oleifera (Abel) in Pinus massoniana Plantation Understory. Forests 2022, 13, 918. [Google Scholar] [CrossRef]
  9. Wang, X.; Su, W.; Bu, Q.; Zhang, P. Light Characteristics and Greening Suggestions under Viaduct in Luoyang City. For. Inventory Plan. 2022, 48, 214–221. [Google Scholar] [CrossRef]
  10. Liu, Y.; Qian, C.; Ding, S.; Shang, X.; Yang, W.; Fang, S. Effect of light regime and provenance on leaf characteristics, growth and flavonoid accumulation in Cyclocarya paliurus (Batal) Iljinskaja coppices. Bot. Stud. 2017, 28, 57. [Google Scholar] [CrossRef]
  11. Yu, W.; Jiang, M.; Yue, Q.; Yang, Y.; Luo, Z.; Lv, B.; He, R.; Feng, S.; Yang, M. Effects of Low-Light Environments on the Growth and Physiological and Biochemical Parameters of Indocalamusand Seasonal Variations in Leaf Active Substance Contents. Plants 2023, 12, 3993. [Google Scholar] [CrossRef]
  12. Li, X.; Liu, C.; Chen, J.; Zhang, M.; Zhang, J.; Tong, Z.; Yang, Q. Leaf Plasticity of the Subtropical Evergreen Tree Phoebe bournei Increases with Ontogeny in Response to Sun and Shade. Forests 2023, 14, 1683. [Google Scholar] [CrossRef]
  13. Hallik, L.; Niinemets, U.; Kull, O. Photosynthetic acclimation to light in woody and herbaceous species: A comparison of leaf structure, pigment content and chlorophyll fluorescence characteristics measured in the field. Plant Biol. 2012, 14, 88–99. [Google Scholar] [CrossRef] [PubMed]
  14. Valladares, F.; Arrieta, S.; Aranda, I.; Lorenzo, D.; Sanchez-Gomez, D.; Tena, D. Shade tolerance, photoinhibition sensitivity and phenotypic plasticity of Ilex aquifolium in continental Mediterranean sites. Tree Physiol. 2005, 25, 1041–1052. [Google Scholar] [CrossRef] [PubMed]
  15. Chen, F.; Zeng, D.; Timothy, J.F.; Yao, C.; Yu, Z. Response of leaf anatomy of Chenopodium acuminatum to soil resource availability in a semi-arid grassland. Plant Ecol. 2010, 209, 375–382. [Google Scholar] [CrossRef]
  16. Chen, L.; Luo, W.; Huang, J.; Peng, S.; Xiong, D. Leaf photosynthetic plasticity does not predict biomass responses to growth irradiance in rice. Physiol. Plant. 2021, 173, 2155–2165. [Google Scholar] [CrossRef]
  17. Centofante, R.A.; Neto, R.A.; Filho, V.C.S.; Oliveira, A.E.; Assis, S.E.; Rosa, M.; Silva, G.F. Corrigendum to “Light quality on the morphoanatomy and physiology of Campomanesia pubescens (DC.) O. Berg. Seedlings”. Sci. Hortic. 2020, 267, 109083. [Google Scholar] [CrossRef]
  18. Wu, Y.; Chen, P.; Gong, W.; Gul, H.; Zhu, J.; Yang, F.; Wang, X.; Tai, W.; Liu, J.; Tian, P.; et al. Morphological and physiological variation of soybean seedlings in response to shade. Front. Plant Sci. 2022, 13, 1015414. [Google Scholar] [CrossRef]
  19. Li, Y.; Liang, W.; Zhao, B. Physiological and Microstructural Responses of Two Rhododendron Cultivars to High Temperature and Low Light. Hortic. Environ. Biotechnol. 2020, 61, 1–14. [Google Scholar] [CrossRef]
  20. Wang, D.; Huang, X.; Chen, J.; Li, L.; Cheng, J.; Wang, S.; Liu, J. Plasticity of leaf traits of Juglans regia L. f. luodianense liu et xu seedlings under different light conditions in karst habitats. Forests 2021, 12, 81. [Google Scholar] [CrossRef]
  21. Zhu, J.; Xu, C. Intraspecific differences in plant functional traits are related to urban atmospheric particulate matter. BMC Plant Biol. 2021, 21, 430. [Google Scholar] [CrossRef]
  22. An, J.; Wei, X.; Yao, Y.; Jin, N.; Wu, G.; Wang, X. Plasticity of Phoebe bournei seedlings adapting to low light environment. Guihaia 2024, 44, 501–509. [Google Scholar] [CrossRef]
  23. Wang, H.; Wu, F.; Li, M.; Zhu, X.; Shi, C.; Ding, G. Morphological and Physiological Responses of Pinus massoniana Seedlings to different light gradients. Forests 2021, 12, 523. [Google Scholar] [CrossRef]
  24. Barbosa, M.A.M.; Chitwood, H.D.; Azevedo, A.A.; Araújo, L.W.; Ribeiro, M.D.; Peres, P.E.L.; Martins, V.C.S.; Zsögön, A. Bundle sheath extensions affect leaf structural and physiological plasticity in response to irradiance. Plant Cell Environ. 2019, 42, 1575–1589. [Google Scholar] [CrossRef] [PubMed]
  25. Niu, X. Landscape Optimization Design Along the Viaduct in Zhengzhou. Master’s Thesis, Henan Agricultural University, Zhengzhou, China, 2021. [Google Scholar]
  26. Wei, C.; Luo, G.; Jin, Z.; Li, J.; Li, Y. Physiological and structural changes in leaves of Platycrater arguta seedlings exposed to increasing light intensities. Plants 2024, 13, 1263. [Google Scholar] [CrossRef]
  27. Zhang, Y.; Chen, C.; Jin, Z.; Yang, Z.; Li, Y. Leaf anatomy, photosynthesis, and chloroplast ultrastructure of Heptacodium miconioides seedlings reveal adaptation to light environment. Environ. Exp. Bot. 2022, 258, 151418. [Google Scholar] [CrossRef]
  28. Lichtenthaler, H.K.; Wellburn, A.R. Determinations of total carotenoids and chlorophylls a and b of leaf extracts in different solvents. Biochem. Soc. Trans. 1983, 11, 591–592. [Google Scholar] [CrossRef]
  29. Deng, Y.; Shao, Q.; Li, C.; Ye, X.; Tang, R. Differential responses of double petal and multi petal jasmine to shading: II. Morphology, anatomy and physiology. Sci. Hortic. 2012, 144, 19–28. [Google Scholar] [CrossRef]
  30. Favaretto, V.F.; Martinez, C.A.; Soriani, H.H.; Furriel, R.P. Differential responses of antioxidant enzymes in pioneer and latesuccessional tropical tree species grown under sun and shade conditions. Environ. Exp. Bot. 2011, 70, 20–28. [Google Scholar] [CrossRef]
  31. Liu, F.; Yang, J.; Mu, H.; Li, X.; Zhang, X.; Wen, Y.; Zhang, X. Effects of brassinolide on growth, photosynthetic rate and antioxidant enzyme activity of ornamental gourd under salt stress. Russ. J. Plant Physiol. 2023, 70, 137. [Google Scholar] [CrossRef]
  32. Sedmak, J.J.; Grossberg, S.E. A rapid, sensitive, and versatile assay for protein using Coomassie brilliant blue G250. Anal. Biochem. 1977, 79, 544–552. [Google Scholar] [CrossRef]
  33. Valladares, F.; Wright, S.J.; Lasso, E.; Kitajima, K.; Pearcy, R.W. Plastic phenotypic response to light of 16 congeneric shrubs from a panamanian rainforest. Ecology 2000, 81, 1925–1936. [Google Scholar] [CrossRef]
  34. Ni, Y.; Lin, G.; Chen, K.; Wu, C.; Zhang, Y. Flavonoid compounds and photosynthesis in Passiflora plant leaves under varying light intensities. Plants 2020, 9, 633. [Google Scholar] [CrossRef] [PubMed]
  35. Almeida, S.M.Z.; Almeida, L.P.; Giacobbo, C.L.; Galon, L.; Perboni, A.T.; Bermeo, P.; Danner, M.A. Campomanesia xanthocarpa (Myrtaceae: Myrtoideae) seedlings reveal morpho-physiological plasticity under shade conditions. Braz. J. Biol. 2023, 83, 276695. [Google Scholar] [CrossRef]
  36. Wang, S.; Song, S.; Li, J.; Yang, T.; He, Y.; Wei, X.; Jiang, M. Photosynthetic characteristics of Sinojackia huangmeiensis, a plant species with extremely small population. Chin. J. Ecol. 2023, 43, 701–708. [Google Scholar] [CrossRef]
  37. Riaño, K.; Briones, O. Leaf physiological response to light environment of three tree fern species in a Mexican cloud forest. J. Trop. Ecol. 2013, 29, 217–228. [Google Scholar] [CrossRef]
  38. Zhang, J.; Zhu, L.; Zhang, X.; Zhou, J.; Guy, R.D. Photosynthetic performance and growth responses of Liriope muscari (Decne.) L.H. Bailey (Asparagaceae) to different levels of irradiance in three seasons. Flora 2021, 278, 151798. [Google Scholar] [CrossRef]
  39. Leng, H.; Su, M.; Zhang, C. Responses of photosynthetic traits and adaplive mechanisms of Rhododendron pulchrum Sweetto different light environments. Chin. J. Ecol. 2023, 42, 1793–1801. [Google Scholar] [CrossRef]
  40. Büssis, D.; Groll, V.U.; Fisahn, J.; Altmann, T. Stomatal aperture can compensate altered stomatal density in Arabidopsis thaliana at growth light conditions. Funct. Plant Biol. 2006, 33, 1037–1043. [Google Scholar] [CrossRef]
  41. Drake, P.L.; Froend, R.H.; Franks, P.J. Smaller, faster stomata: Scaling of stomatal size, rate of response, and stomatal conductance. J. Exp. Bot. 2012, 64, 495–505. [Google Scholar] [CrossRef]
  42. Lu, Z.; Xie, K.; Pan, Y.; Ren, T.; Lu, J.; Wang, M.; Shen, Q.; Guo, S. Potassium mediates coordination of leaf photosynthesis and hydraulic conductance by modifications of leaf anatomy. Plant Cell Environ. 2019, 42, 2231–2244. [Google Scholar] [CrossRef]
  43. Fan, Y.; Chen, J.; Wang, Z.; Tan, T.; Li, S.; Li, J.; Wang, B.; Zhang, J.; Cheng, Y.; Wu, X.; et al. Soybean (Glycine max L. Merr.) seedlings response to shading: Leaf structure, photosynthesis and proteomic analysis. BMC Plant Biol. 2019, 19, 34. [Google Scholar] [CrossRef]
  44. Tsunoda, Y.; Ohno, Y.; Ishizuka, W. Photoinhibition sensitivity of Abies sachalinensis saplings under different leaf mass per area conditions: Insights into acclimation to current and future light environments. Forests 2024, 15, 1916. [Google Scholar] [CrossRef]
  45. Hong, M.; Ma, Z.; Wang, X.; Shen, Y.; Mo, Z.; Wu, M.; Chen, B.; Zhang, T. Effects of light intensity and ammonium stress on photosynthesis in Sargassum fusiforme seedlings. Chemosphere 2020, 273, 128605. [Google Scholar] [CrossRef] [PubMed]
  46. Marçal, D.M.S.; Avila, R.T.; Quiroga-Rojas, L.F.; de Souza, R.P.B.; Gomes Junior, C.C.; Ponte, L.R.; Barbosa, M.L.; Oliveira, L.A.; Martins, S.C.V.; Ramalho, J.D.C.; et al. Elevated [CO2] benefits coffee growth and photosynthetic performance regardless of light availability. Plant Physiol. Biochem. 2021, 158, 524–535. [Google Scholar] [CrossRef] [PubMed]
  47. Wan, Y.; Zhang, Y.; Zhang, M.; Hong, A.; Yang, H.; Liu, Y. Shade effects on growth, photosynthesis and chlorophyll fluorescence parameters of three Paeonia species. PeerJ 2020, 8, e9316. [Google Scholar] [CrossRef]
  48. Hazrati, S.; Tahmasebi-Sarvestani, Z.; Modarres-Sanavy, S.A.M.; Mokhtassi-Bidgoli, A.; Nicola, S. Effects of water stress and light intensity on chlorophyll fluorescence parameters and pigments of Aloe vera L. Plant Physiol. Biochem. 2016, 106, 141–148. [Google Scholar] [CrossRef]
  49. Zhang, J.; Ge, J.; Dayananda, B.; Li, J. Effect of light intensities on the photosynthesis, growth and physiological performances of two maple species. Front. Plant Sci. 2022, 13, 999026. [Google Scholar] [CrossRef]
  50. Li, D.; Wang, Y.; Song, X.; Jiang, M.; Zhao, X.; Cao, X. The inhibitory effects of simulated light sources on the activity of algae cannot be ignored in photocatalytic inhibition. Chemosphere 2022, 309, 136611. [Google Scholar] [CrossRef]
  51. Vitale, E.; Velikova, V.; Tsonev, T.; Ferrandino, I.; Capriello, T.; Arenadoi, C. The interplay between light quality and biostimulant application affects the antioxidant capacity and photosynthetic traits of soybean (Glycine max L. Merrill). Plants 2021, 10, 861. [Google Scholar] [CrossRef]
  52. Liu, Y.; Lai, L.; Zhou, J.; Li, Q.; Yi, S.; Sun, Q.; Zheng, Y. Changes in levels of enzymes and osmotic adjustment compounds in key species and their relevance to vegetation succession in abandoned croplands of a semiarid sandy region. Ecol. Evol. 2020, 10, 2269–2280. [Google Scholar] [CrossRef]
  53. Oh, H.E.; Yoon, A.; Park, Y.G. Red light enhances the antioxidant properties and growth of Rubus hongnoensis. Plants 2021, 10, 2589. [Google Scholar] [CrossRef]
  54. Stotz, G.C.; Salgado-Luarte, C.; Escobedo, V.M.; Valladares, F.; Gianoli, E. Global trends in phenotypic plasticity of plants. Ecol. Lett. 2021, 24, 2267–2281. [Google Scholar] [CrossRef]
  55. Ntawuhiganayo, E.B.; Uwizeye, F.K.; Zibera, E.; Dusenge, M.E.; Ziegler, C.; Ntirugulirwa, B.; Nsabimana, D.; Wallin, G.; Uddling, J. Traits controlling shade tolerance in tropical montane trees. Tree Physiol. 2020, 40, 183–197. [Google Scholar] [CrossRef] [PubMed]
  56. Cui, B.; Li, F.; Ma, J. Flora of Zhengzhou; Science and Technology Press of China: Beijing, China, 2008. [Google Scholar]
Figure 1. The impact of different light environments on the morphological characteristics of plant leaves. Note: Different lowercase letters indicate significant differences between treatment groups (p < 0.05). (A) Changes in leaf area of different plants. (B) Changes in leaf dry matter content of different plants. (C) Changes in leaf relative water content of different plants.
Forests 16 00651 g001
Figure 2. Anatomical structure responses of plant leaves under different light environments. Note: PT: palisade tissue, ST: spongy tissue. (A) O. japonicus, (B) P. tobira, (C) E. alatus, and (D) L. sinense. 1: CK, 2: T1, and 3: T2.
Forests 16 00651 g002
Figure 3. The impact of different light environments on the photosynthetic parameters of plant leaves. Note: Different lowercase letters indicate significant differences among the three treatment groups (p < 0.05). (A) Changes in Ci of different plants. (B) Changes in Tr of different plants. (C) Changes in Pn of different plants. (D) Changes in Gs of different plants.
Forests 16 00651 g003
Figure 4. The impact of different light environments on the chlorophyll fluorescence parameters of plants. Note: Different lowercase letters indicate significant differences among the three treatment groups (p < 0.05). (A) Changes in Fv/Fm of different plants. (B) Changes in Fv/Fm of different plants. (C) Changes in Fv/Fo of different plants. (D) Changes in PIABS of different plants.
Forests 16 00651 g004
Figure 5. The impact of different light environments on the physiological indicators of plant leaves. Note: Different lowercase letters indicate significant differences among the three treatment groups (p < 0.05). (A) Changes in Chl a of different plants. (B) Changes in Chl b of different plants. (C) Changes in Chl a/b of different plants. (D) Changes in MDA of different plants. (E) Changes in SOD of different plants. (F) Changes in POD of different plants. (G) Changes in REC of different plants. (H) Changes in SP of different plants.
Forests 16 00651 g005
Figure 6. Plasticity indices and means of various indicators for four plants under different light environments. The blue, green, orange, and yellow blocks correspond to the plasticity indices of leaf morphological characteristics, photosynthetic traits, physiological indicators, and chlorophyll fluorescence parameters of the plants, respectively. AVG: the average plasticity index of each corresponding indicator for each color block. GA in the purple block: the average plasticity index of all indicators for each plant. Abbreviations for all academic terms in this paper are provided in Supplementary Table S2.
Forests 16 00651 g006
Table 1. Changes in stomata and anatomical structures of plant leaves under different light environments.
TraitTreatmentsSpecies
Ophiopogon JaponicusPittosporum TobiraEuonymus AlatusLigustrum Sinense
SD/(N/mm2)CK272.35 ± 28.34 a261.66 ± 6.68 a275.36 ± 19.9 a404.79 ± 26.62 a
T1283.17 ± 13.14 a236.43 ± 23.48 ab287.68 ± 10.23 a395.39 ± 57.76 a
T2195.56 ± 30.91 b215.55 ± 7.01 b180.20 ± 5.90 b380.21 ± 42.19 b
SA/(µm2)CK629.97 ± 31.09 b1009.28 ± 68.92 b1051.91 ± 30.35 b186.95 ± 8.00 c
T1408.27 ± 25.95 c1412.83 ± 17.91 a898.60 ± 26.20 c241.10 ± 15.56 b
T2757.31 ± 15.57 a1523.46 ± 46.08 a1214.74 ± 38.68 a318.36 ± 13.79 a
LT
/(µm)
CK294.86 ± 9.16 a270.73 ± 2.19 a441.32 ± 13.10 a233.90 ± 2.14 a
T1273.80 ± 5.43 b234.50 ± 5.60 b344.95 ± 13.01 b172.64 ± 6.33 b
T2232.3 ± 10.52 c231.71 ± 3.83 b293.21 ± 6.37 c171.10 ± 3.14 b
PT
/(µm)
CK78.35 ± 2.57 a95.88 ± 3.13 a129.70 ± 3.32 a91.74 ± 0.51 a
T168.91 ± 2.14 b85.37 ± 1.58 b93.69 ± 4.72 b54.20 ± 2.27 b
T263.37 ± 1.13 b79.16 ± 1.18 c76.82 ± 1.33 c51.49 ± 1.10 b
ST
/(µm)
CK176.89 ± 9.81 a145.91 ± 3.58 a256.01 ± 10.18 a102.06 ± 4.49 a
T1174.50 ± 1.51 b124.54 ± 7.85 b199.33 ± 15.58 b86.87 ± 2.27 b
T2146.13 ± 13.32 b113.23 ± 5.83 b167.55 ± 4.99 c51.49 ± 1.10 b
PT
/ST
CK0.45 ± 0.03 a0.66 ± 0.04 a0.51 ± 0.01 a0.90 ± 0.05 a
T10.40 ± 0.01 b0.69 ± 0.05 a0.47 ± 0.05 b0.62 ± 0.02 b
T20.44 ± 0.04 a0.70 ± 0.05 a0.46 ± 0.04 b0.60 ± 0.01 b
Note: Different lowercase letters indicate significant differences between treatment groups (p < 0.05).
Table 2. Double factor variance analysis of species and light intensities on different indexes.
IndexesSpeciesLight IntensitySpecies × Light Intensity
pFpFpF
SLA0.000 **43.2660.000 **50.6690.191 NS1.523
LDMC0.000 **95.8130.000 **28.8290.001 **4.812
RWC0.001 **6.4780.000 **88.8260.000 **12.786
SD0.000 **827.4340.000 **127.0040.000 **42.094
SA0.000 **44.4320.000 **12.5810.202 NS1.560
LT0.000 **500.3770.000 **204.5210.000 **33.760
PT0.000 **303.3150.000 **429.7750.000 **42.115
ST0.000 **226.8440.000 **54.0170.000 **8.955
PT/ST0.000 **95.2290.000 **13.4510.000 **10.840
Ci0.427 NS1.4260.024 *4.0400.130 *1.748
Tr0.000 **19.3080.000 **130.2100.000 **6.392
Pn0.000 **57.2770.000 **174.0280.000 **14.948
GS0.000 **15.1170.000 **77.7860.000 **7.592
Fv/Fm0.021 *3.5640.000 **160.8570.000 **8.329
Fv′/Fm′0.012 *4.0650.000 **182.7740.000 **8.138
Fv/Fo0.000 **21.4930.000 **36.0930.000 **8.616
PIABS0.000 **82.2340.000 **53.4230.000 **7.260
Chl a0.000 **73.2430.000 **114.4150.000 **11.973
Chl b0.000 **40.2930.000 **122.5990.000 **7.147
Chla/b0.000 **42.3600.000 **32.0890.000 **3.558
MDA0.000 **67.2160.000 **47.0550.000 **6.831
SOD0.000 **21.9900.000 **108.1950.000 **27.002
POD0.003 **5.4020.000 **96.9290.107 *1.861
SP0.000 **21.5680.000 **148.4110.000 **15.640
REC0.000 **56.9080.000 **147.2340.000 **14.499
Note: ** indicates highly significant differences (p < 0.01); * indicates significant differences (0.01 < p < 0.05); NS indicates non-significant differences (p > 0.05). F: The degree of different factors on index change.
Disclaimer/Publisher’s Note: The statements, opinions and data contained in all publications are solely those of the individual author(s) and contributor(s) and not of MDPI and/or the editor(s). MDPI and/or the editor(s) disclaim responsibility for any injury to people or property resulting from any ideas, methods, instructions or products referred to in the content.

