Article

Benefits of Various Urban Green Spaces for Public Health Based on Landscape Elements: A Study of Public Visual Perception

College of Landscape Architecture and Horticulture, Southwest Forestry University, Kunming 650224, China
*
Author to whom correspondence should be addressed.
These authors contributed equally to this work.
Forests 2025, 16(4), 648; https://doi.org/10.3390/f16040648
Submission received: 6 March 2025 / Revised: 1 April 2025 / Accepted: 2 April 2025 / Published: 8 April 2025

Abstract

:
Urbanization has amplified the critical role of urban green spaces in enhancing public health and well-being. While natural landscape elements are known to influence physiological and psychological states through visual perception, their mechanistic pathways remain underexplored, and existing studies often focus on singular environments. This study examines how specific landscape elements affect public health and proposes optimization strategies for urban green space planning. Focusing on five green space types in Kunming (forests, wetlands, urban parks, street green spaces, and residential green spaces), this study employed PSPNet-based semantic segmentation to quantify landscape elements and conducted human–subject experiments using paired visual stimuli. Physiological metrics and psychological questionnaires were analysed to assess health outcomes. Key findings reveal that forests and urban parks, rich in natural elements (Plant and Earth and Mountain Elements), outperformed artificial-dominated spaces (residential/street green spaces) in physiological and psychological restoration. Artificially designed green spaces achieved benefits comparable to natural counterparts when mimicking natural element composition. Notably, aggregated indices (naturalness, artificiality, and enclosure) showed negligible correlations with health outcomes, underscoring the primacy of specific elements. The Plant and Earth and Mountain Elements mediated physiological recovery, while minimizing the Building and Artificial Element and enhancing the Sky Element exposure improved attention coherence. Excessive Water Element perception impaired heart rate stabilization, while psychological restoration mechanisms were multifaceted but were consistently linked to higher natural element proportions. These results provide actionable guidelines for optimizing visual proportions of natural elements in urban green space planning and management.

1. Introduction

Urban green spaces have been demonstrated to play a pivotal role in advancing public health and improving well-being amidst the rapid expansion of cities and societal development. Empirical studies have consistently indicated that urban green spaces significantly contribute to the improvement of both physical and mental health among the populace. For instance, these spaces have been associated with a reduction in the prevalence of cardiovascular and respiratory diseases [1,2], as well as a decreased risk of obesity [3]. Furthermore, urban green spaces have been shown to alleviate stress and anxiety, enhance mood, and promote overall health [4]. In addition, it provides a conducive environment for physical activities, thereby further promoting physical health and reducing the incidence of chronic diseases through exercise [5,6]. From the perspective of social well-being, green spaces have been evidenced to strengthen neighbourhoods social cohesion and foster interpersonal relationships among urban residents [7].
Visual perception constitutes approximately 70% of the human body’s perception of the environment and is a predominant sensory modality [8]. Natural environments have been demonstrated to possess superior restorative properties for the population compared to urban streets [9], and landscape elements, such as trees and water features, contained in urban green spaces are inclined to create restorative environments that facilitate the recovery of both physiological and psychological states [10]. Empirical studies indicate that urban forests exert a promotive effect on public physiological health, which can reduce blood pressure and restore heart rate, etc., although the recovery time for skin conductance levels is comparatively prolonged [11,12]. In terms of the psychological impact of urban forests on the public, attention levels have been assessed utilizing the State of Anxiety Inventory (STAI) [11,12], the State of Mind Scale (POMS) [11], and the Perceptual Recovery Scale (PRS) [13], alongside neuroscientific techniques like electroencephalography (EEG) measurements [14,15]. These studies have revealed that urban green spaces enable individuals to regulate emotions, alleviate stress [16,17], mitigate fatigue, and enhance concentration [18]. Furthermore, it has been noted that the restorative effects of diverse landscape scenarios vary according to their characteristics [19], and that the perceived restorative properties of different urban green space types differ [13,20]. Public environmental preferences also influence the restorative evaluation of urban green spaces [21]. Research has demonstrated that attributes of urban green space, such as spatial structure, biodiversity, and naturalness, exert positive effects on public health, social relations, and behaviour [22]. Specifically, environmental elements within urban green spaces can enhance mental health [23] and public satisfaction [24]. For instance, green visibility has been shown to benefit the brain’s nervous system, calming nervousness and soothing the body and mind [25], while bodies of water can regulate the production of adrenaline in the human body, effectively alleviating tension and restoring positive emotions [26]. Notably, green space environments typically confer health benefits through public perception of specific landscape elements. However, the majority of existing studies focus on singular environmental types, leaving the impacts of landscape heterogeneity underexplored and necessitating further investigation. Current research predominantly examines the effects of environmental attributes (e.g., spatial configuration) on restorative outcomes or isolated element–health relationships, while comprehensive analyses of multi-element interactions within green spaces remain nascent in their infancy.
In recent years, scholarly investigations into the visual perception of urban green spaces have transitioned from traditional methodologies, such as Scenic Beauty Estimation (SBE) [27], Semantic Differential (SD) [27], and Analytical Hierarchy Process (AHP) [28], towards more technologically advanced approaches. These contemporary techniques encompass eye-tracking methodologies [29] and image semantic segmentation technologies [30], which have been specifically adapted to enhance the precision and depth of environmental perception research. This methodology mitigates experimental biases caused by dominant confounding factors in visual perception studies, enabling more objective investigations. Eye-tracking technology has been extensively employed to assess landscape quality and visual appeal, while image semantic segmentation demonstrates broader applicability across diverse research domains. Historically, image segmentation was predominantly achieved through threshold-based methods [31], edge detection algorithms [32], and region-based segmentation techniques [33]. However, the integration of deep convolutional neural networks (CNNs) into this domain has markedly elevated the accuracy and efficacy of image semantic segmentation. This progress has culminated in the development of seminal models, including fully convolutional networks (FCNs), DeepLab, and pyramid scene parsing networks (PSPNets). FCN represents a pivotal advancement in deep learning models tailored for image segmentation tasks. It operates by classifying each pixel within an image according to distinct semantic categories, thereby enabling pixel-level segmentation [34]. DeepLab, another distinguished architecture within this field, leverages dilated convolutions to expand receptive fields, significantly enhancing the model’s ability to capture fine-grained semantic details across images. Iterative improvements, such as Atrous Spatial Pyramid Pooling (ASPP), have further refined its segmentation capabilities [35]. PSPNet, developed by Zhao et al., stands out as a robust framework for multi-scale semantic integration. By hierarchically aggregating contextual information through pyramid pooling modules, it achieves superior segmentation accuracy in complex scenes, particularly those involving multi-scale objects or environmental heterogeneity [36]. In practical applications, PSPNet has been widely adopted for analysing waterfront areas, urban streetscapes, and forest parks, with a focus on quantifying landscape quality, visual attractiveness, and ecological resilience [37]. Compared to traditional eye-tracking methods, PSPNet offers a more comprehensive and scalable approach to studying health-related benefits of environmental perceptions, such as restorative effects linked to natural landscape elements. In summary, research on landscape visual perception has transitioned from subjective approaches to objective technical methods, with the latter offering distinct advantages for quantitative analysis of visual landscapes. However, studies exploring the health benefits of green space visual perception remain limited. Leveraging image semantic segmentation technology—which provides a robust framework for elucidating underlying mechanisms—represents an effective and promising methodology for advancing such research.
In summary, public perception of natural environments remains predominantly visual, and urban green spaces often promote public health through specific landscape elements. However, existing studies have predominantly focused on single environmental types, emphasizing the impacts of spatial and morphological features on restoration, while cross-environmental commonalities remain underexplored. Compared to traditional questionnaire-based approaches for assessing visual perception, image semantic segmentation offers a more objective methodology. Although this technique has been partially applied in visual landscape studies and demonstrates suitability for investigating environmental restorative effects, its utilization in quantifying health benefits of green space visual perception—particularly through mechanistic analyses—remains limited. This study addresses these gaps by selecting five prevalent urban green spaces (forests, wetlands, urban parks, street green spaces, and residential green spaces) as research subjects. Leveraging PSPNet for semantic segmentation, we extracted landscape element indicators and integrated physiological monitoring with psychological questionnaires to evaluate public visual responses. Our objectives were to identify health-beneficial landscape elements, elucidate their mechanistic pathways, and propose evidence-based strategies for optimizing urban green space planning and management. These findings aim to advance restorative environment research and inform targeted interventions for enhancing public health outcomes.

2. Materials and Methods

2.1. Study Area and Materials

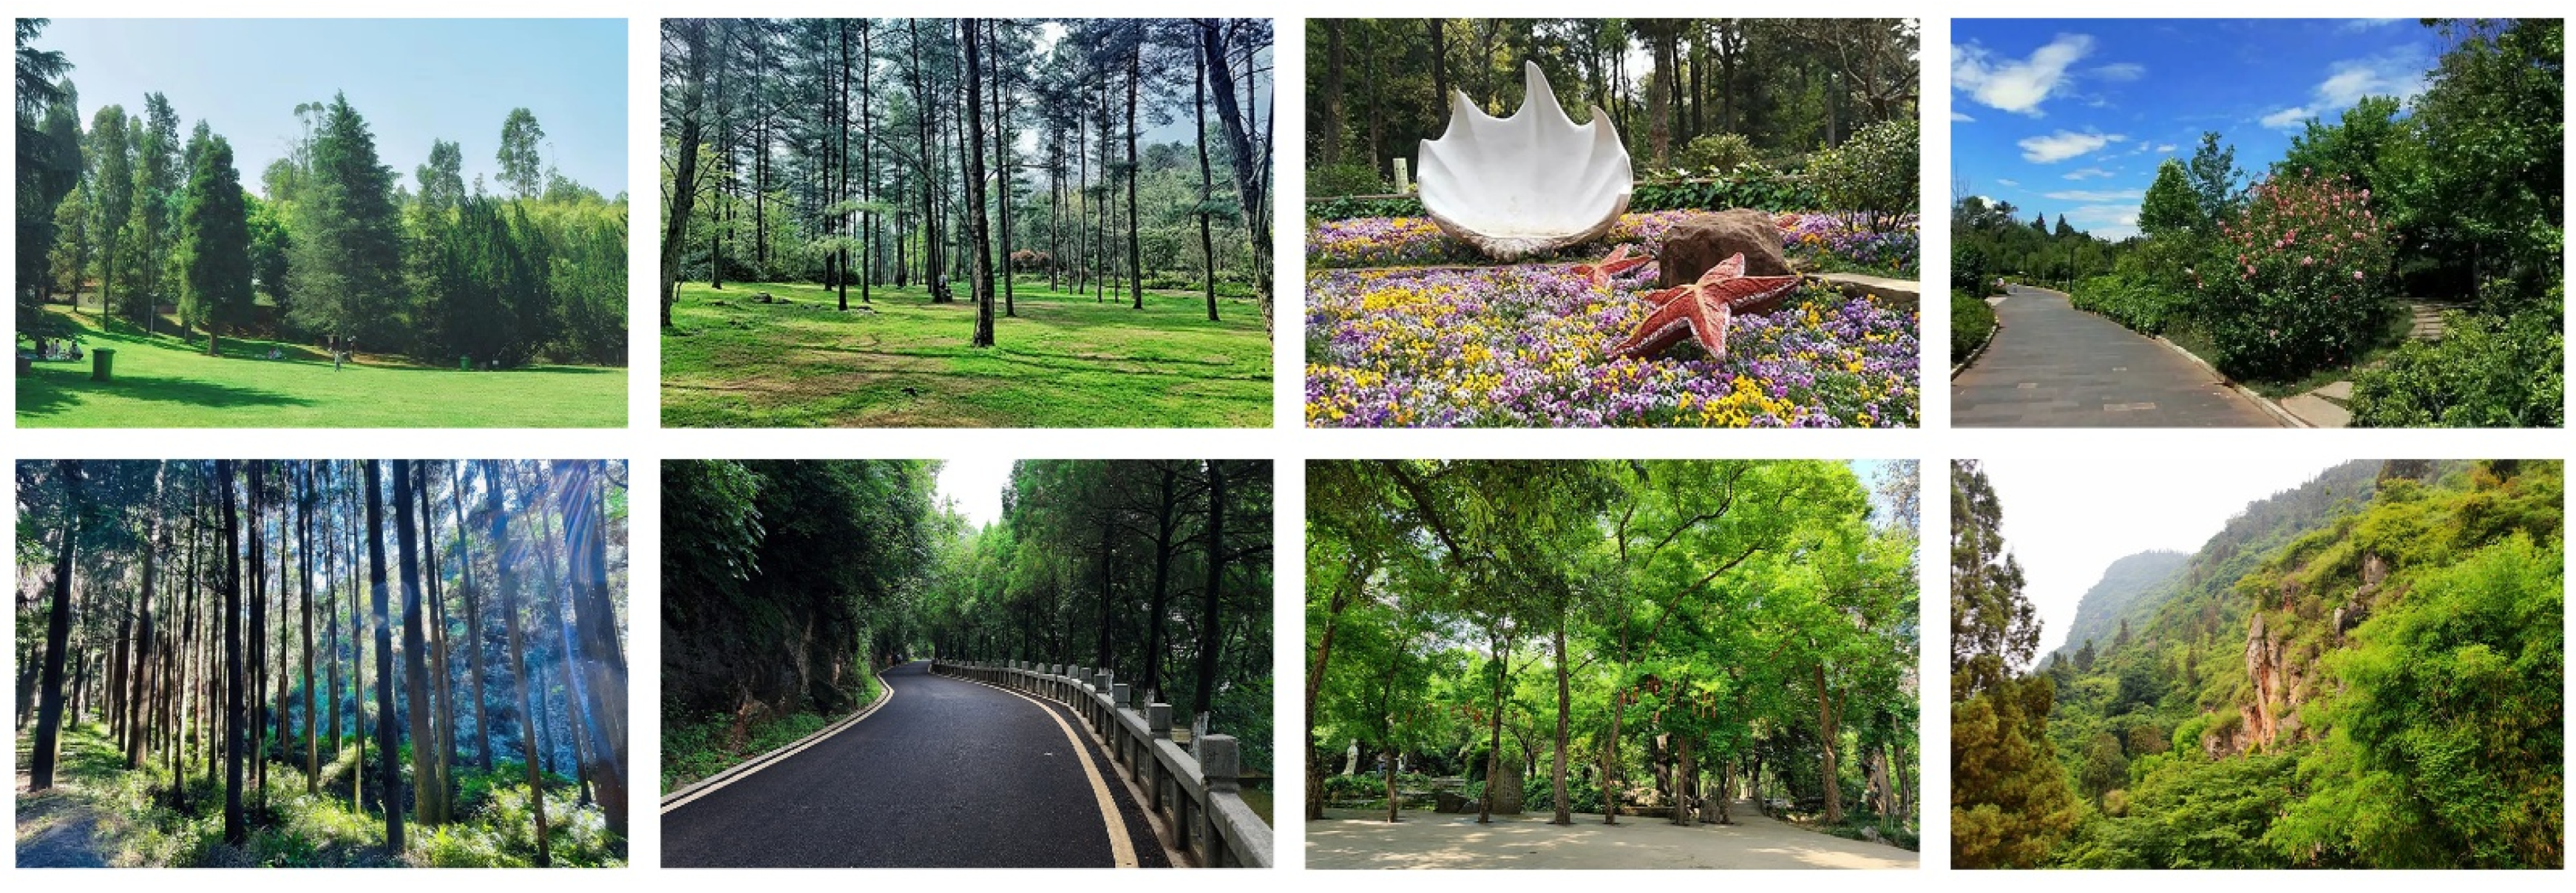
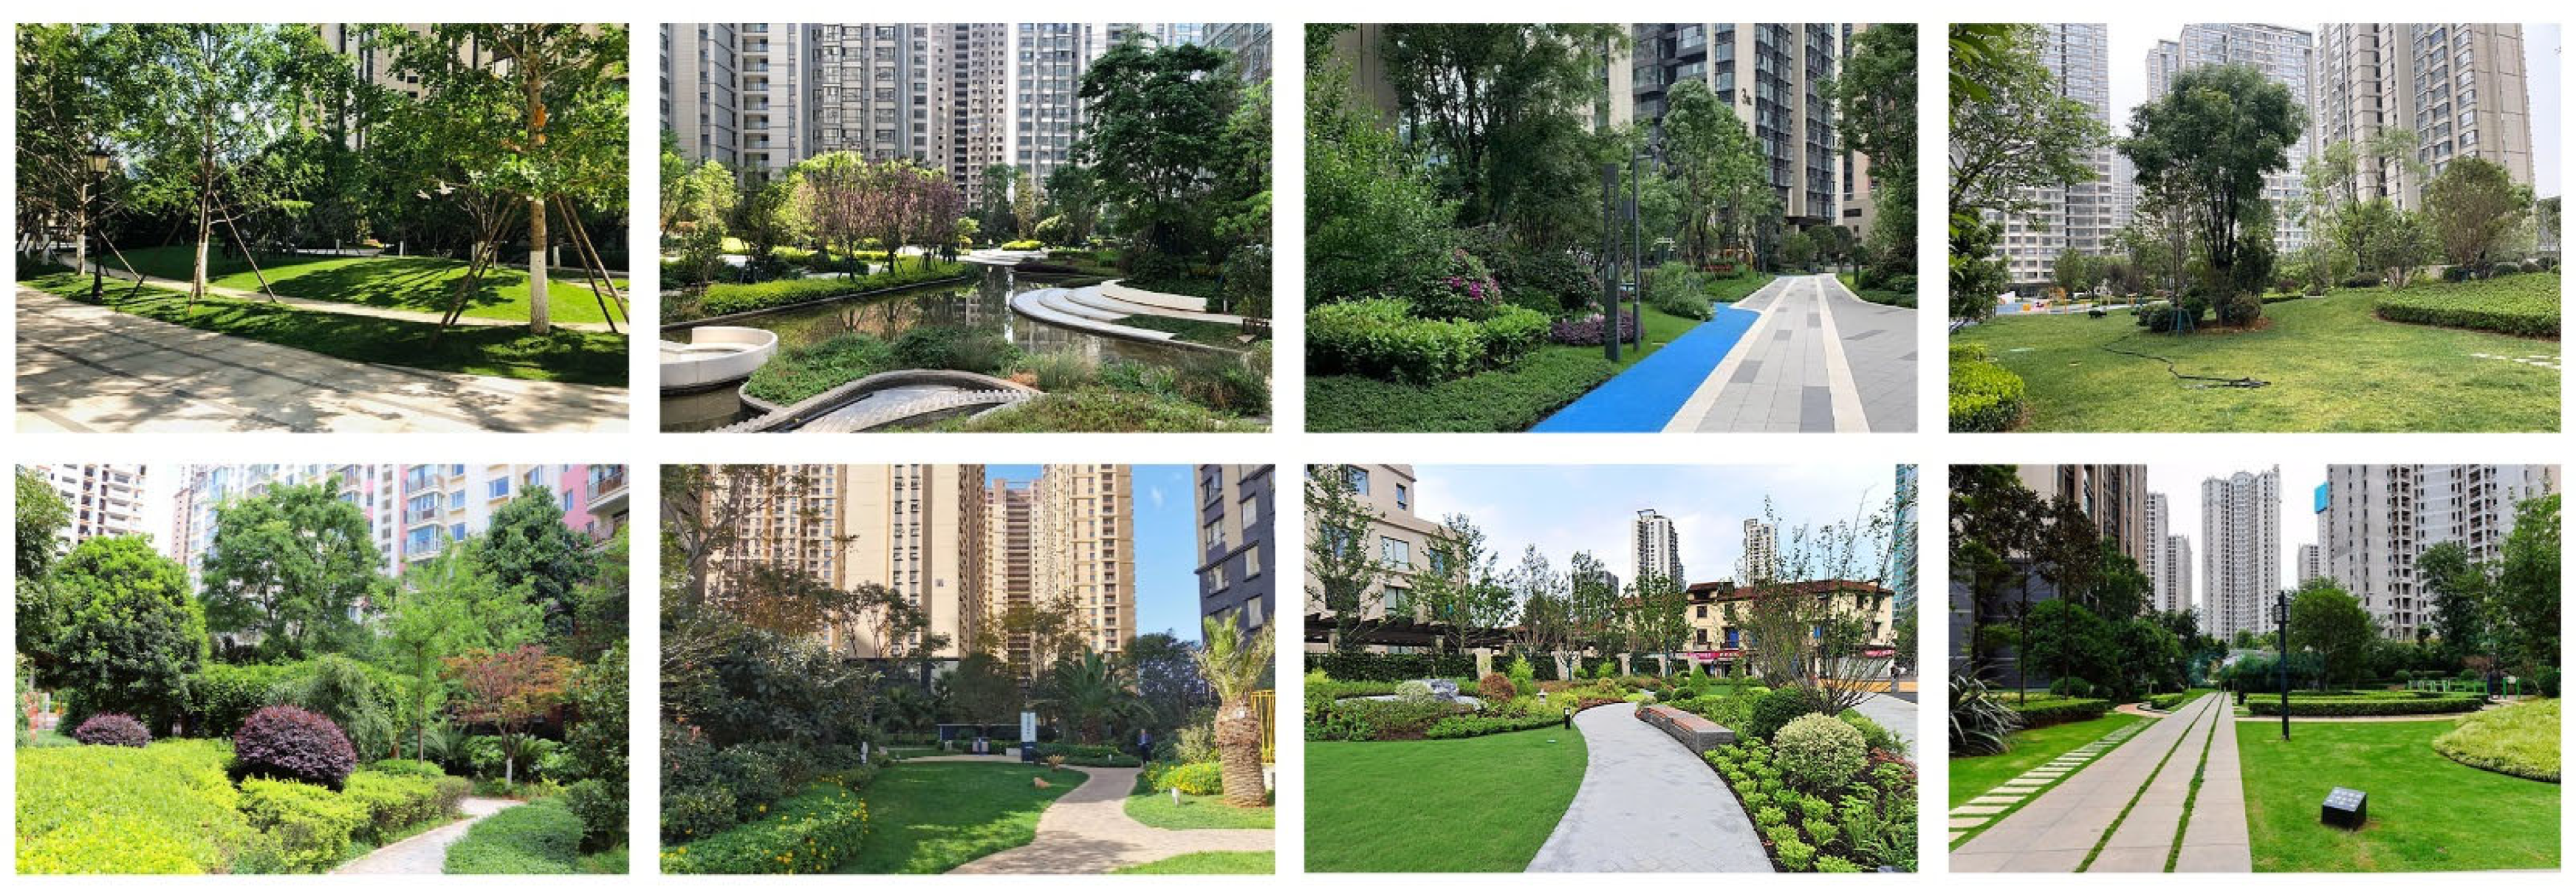
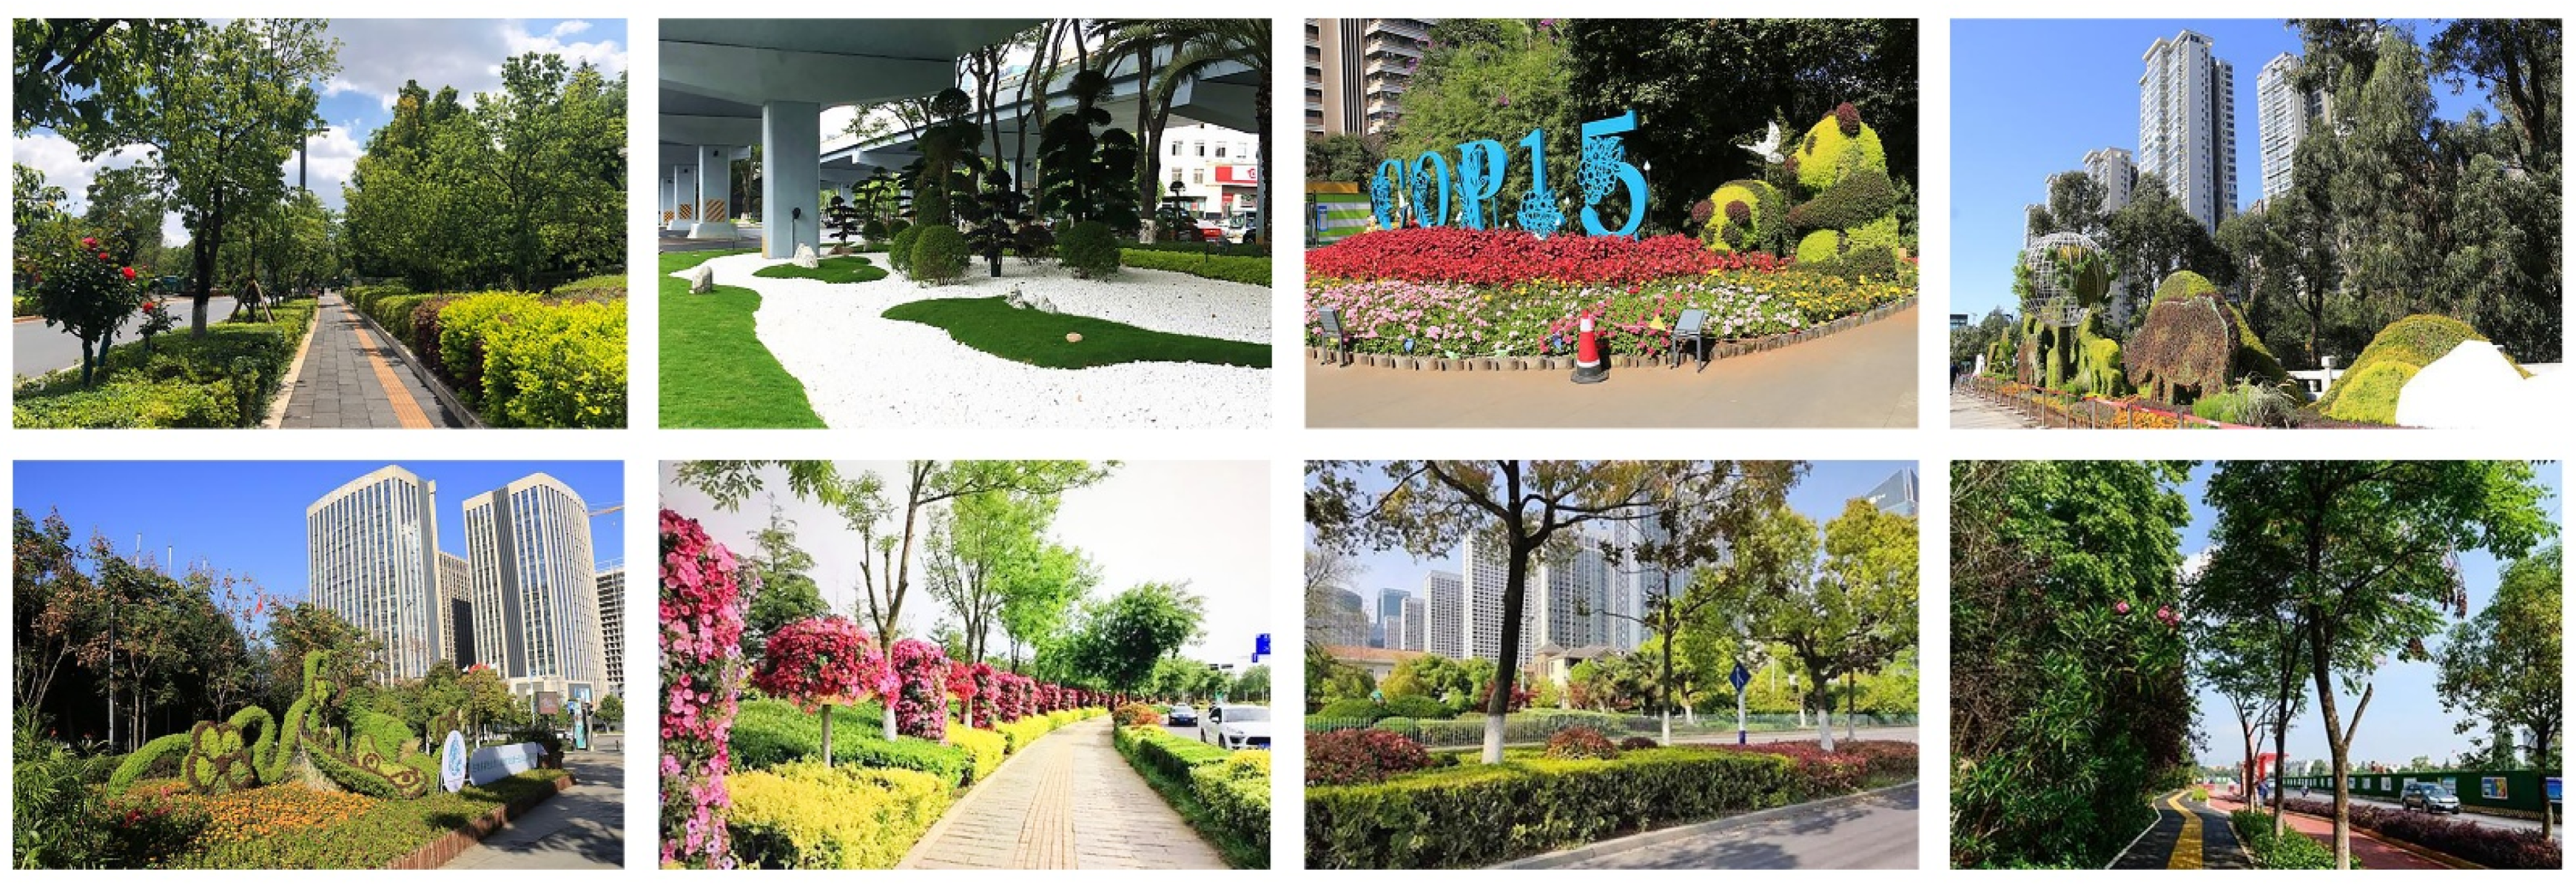
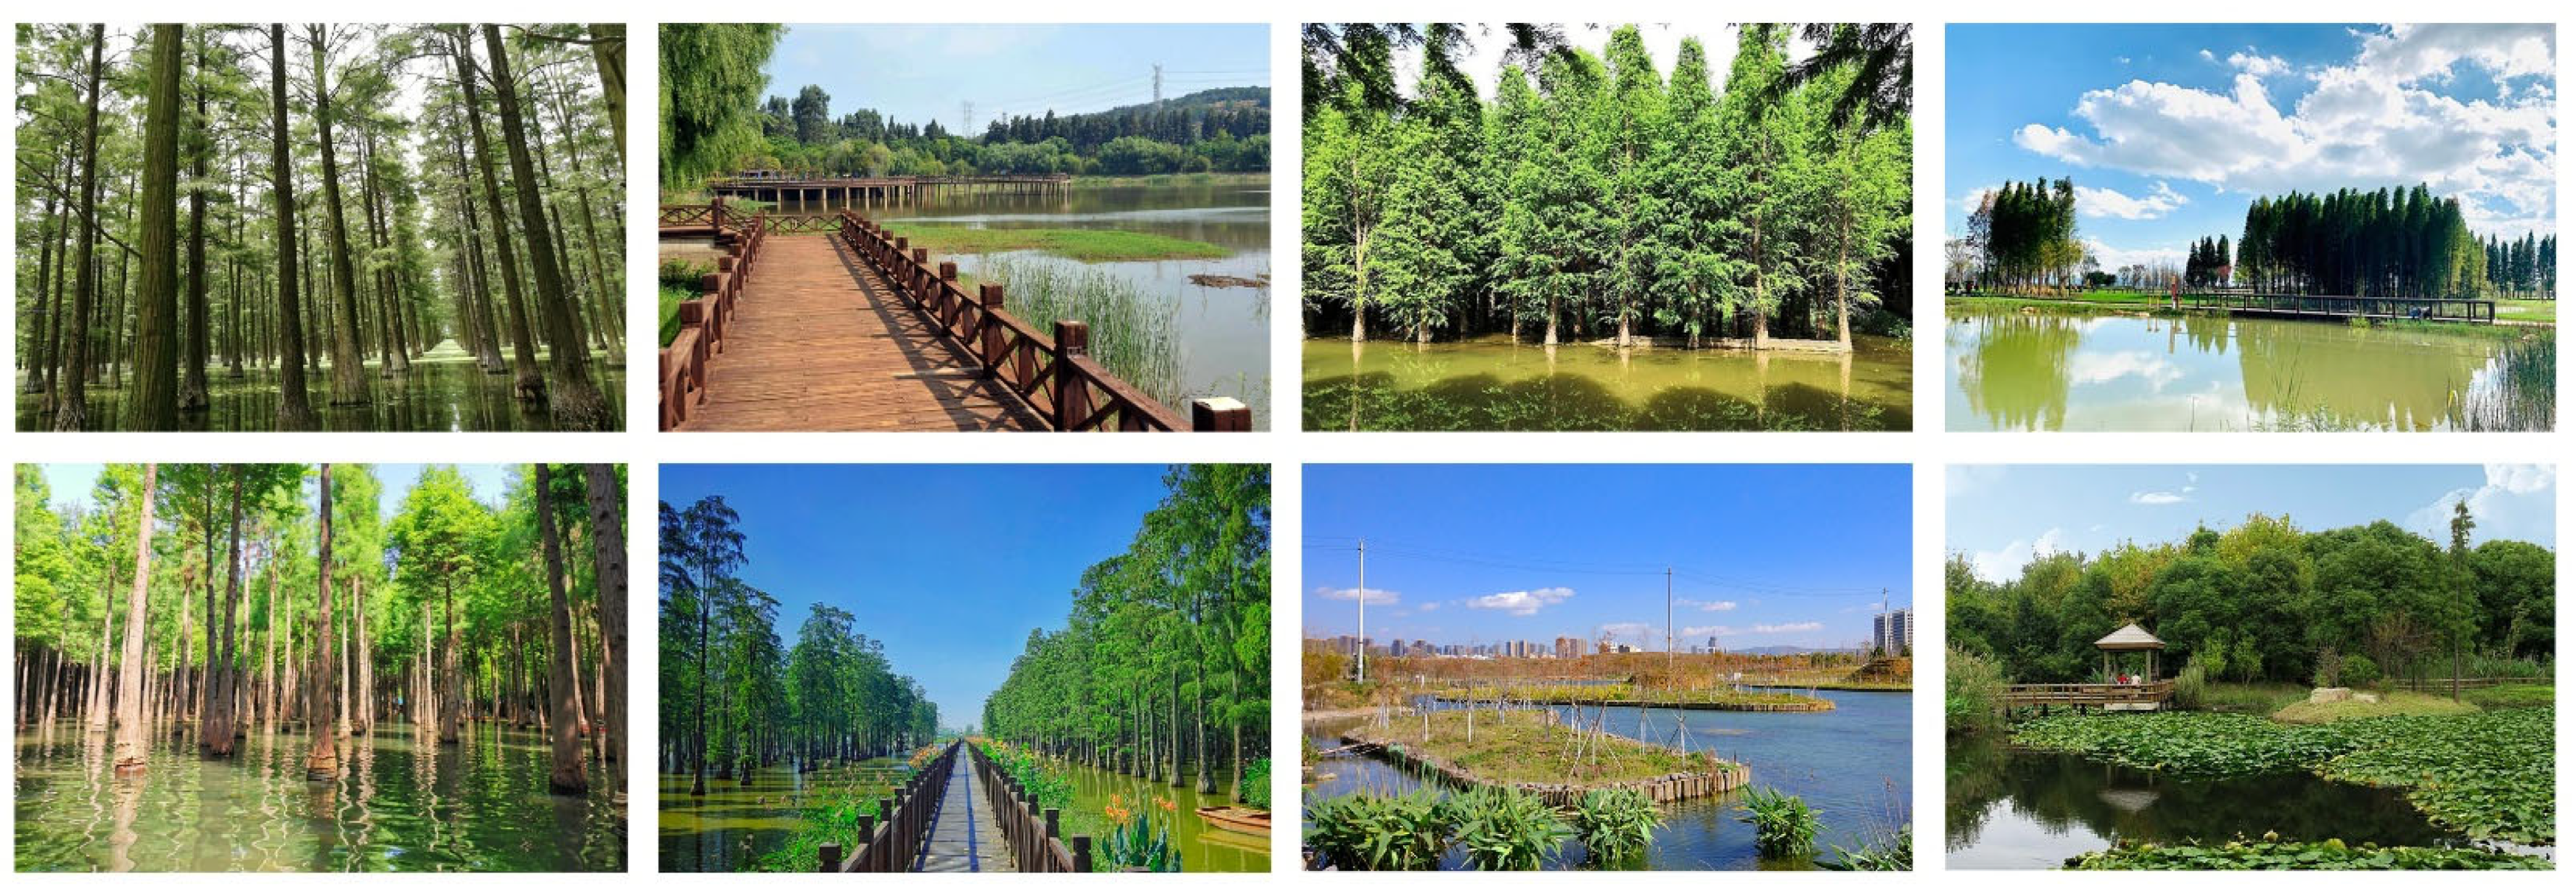
The visual materials for this study were derived from field surveys conducted in Kunming City, the provincial capital of Yunnan Province and a central hub in southwestern China. The urban core sits at a mean elevation of 1891 m above sea level, with topographic variations spanning 1500 to 2800 m. Kunming exhibits a low-latitude highland monsoon climate, characterized by mean annual values of 15 °C, 2200 h of sunshine, and 1000 mm of precipitation. This climatic regime produces marked seasonal differentiation between dry and wet periods, with prevailing clear skies and substantial annual sunshine duration. The city serves as an exemplar of progressive urban greening strategies, having been awarded multiple distinctions including China’s National Forest City, National Landscape Garden City, and the Gold Award in Category E of the UN-Habitat “International Awards for Liveable Communities” [38]. As an emerging global tourism destination and the so-called “Green Pearl” of the Yunnan-Guizhou Plateau, it has become a prime selection for international migrants seeking health-oriented urban settlements. Thus, its ecological and urban planning achievements provide an ideal context for studying landscape-health interactions. Using ArcGIS 10.7 with OpenStreetMap (OSM, https://www.openstreetmap.org/, accessed on 12 March 2023) geospatial data, established a 5 km × 5 km grid axis set up according to the natural landscape pattern of Kunming (Figure 1), and urban parks, street-side green spaces, and residential green spaces are selected among the 3 urban green spaces in combination with the factors of green space area, habitat type, vegetation, and land-use type, among which pool parks are further divided into forests, wetlands, and urban parks in accordance with their man-made parks and Natural parks are further divided into forests, wetlands, and urban parks. In the study, based on the distribution of urban green space, a total of 18 park green spaces (comprising forests and wetland environments within established forest or wetland parks), 18 street green spaces, and 15 residential green spaces were chosen. Field surveys employed visual documentation techniques during optimal spring and summer conditions, corresponding with Kunming’s phenological cycles. Post-acquisition, we curated a representative subset of environmental images for perceptual analysis (Appendix A).

2.2. Landscape Elements Extraction

2.2.1. Qualitative Analysis and Selection of Indicators for Landscape Elements

Qualitative landscape element analysis was conducted using NVIVO 20.0 software (QSR International, Melbourne, Australia) [39]. Coding analysis incorporated online media photographs and textual data, systematically categorising content by core themes. Photographic data required decomposition into constituent elements prior to node-based coding due to their inherent complexity. Through iterative qualitative analysis and synthesis of the landscape elements literature [30,40,41], landscape elements were summarized as follows: Plant Element (PE), Water Element (WE), Sky Element (SKE), Earth and Mountain Element (EME), Building and Artificial Element (BAE), and Roads and Traffic Element (RTE). On this basis, the Spatial Enclosure Element (SEE) and Contribution of Natural Element to Enclosure (CNEE) was carried out with reference to relevant studies [42]. Combined with the results of the qualitative analysis of visual materials in this study, Naturalness Index (NI), Artificiality Index (AI) and Enclosure Index (EI) were set to further explore the relationship between landscape elements and health benefits. The dimensions and related indicators are shown in Table 1.

2.2.2. Semantic Segmentation of Visual Materials

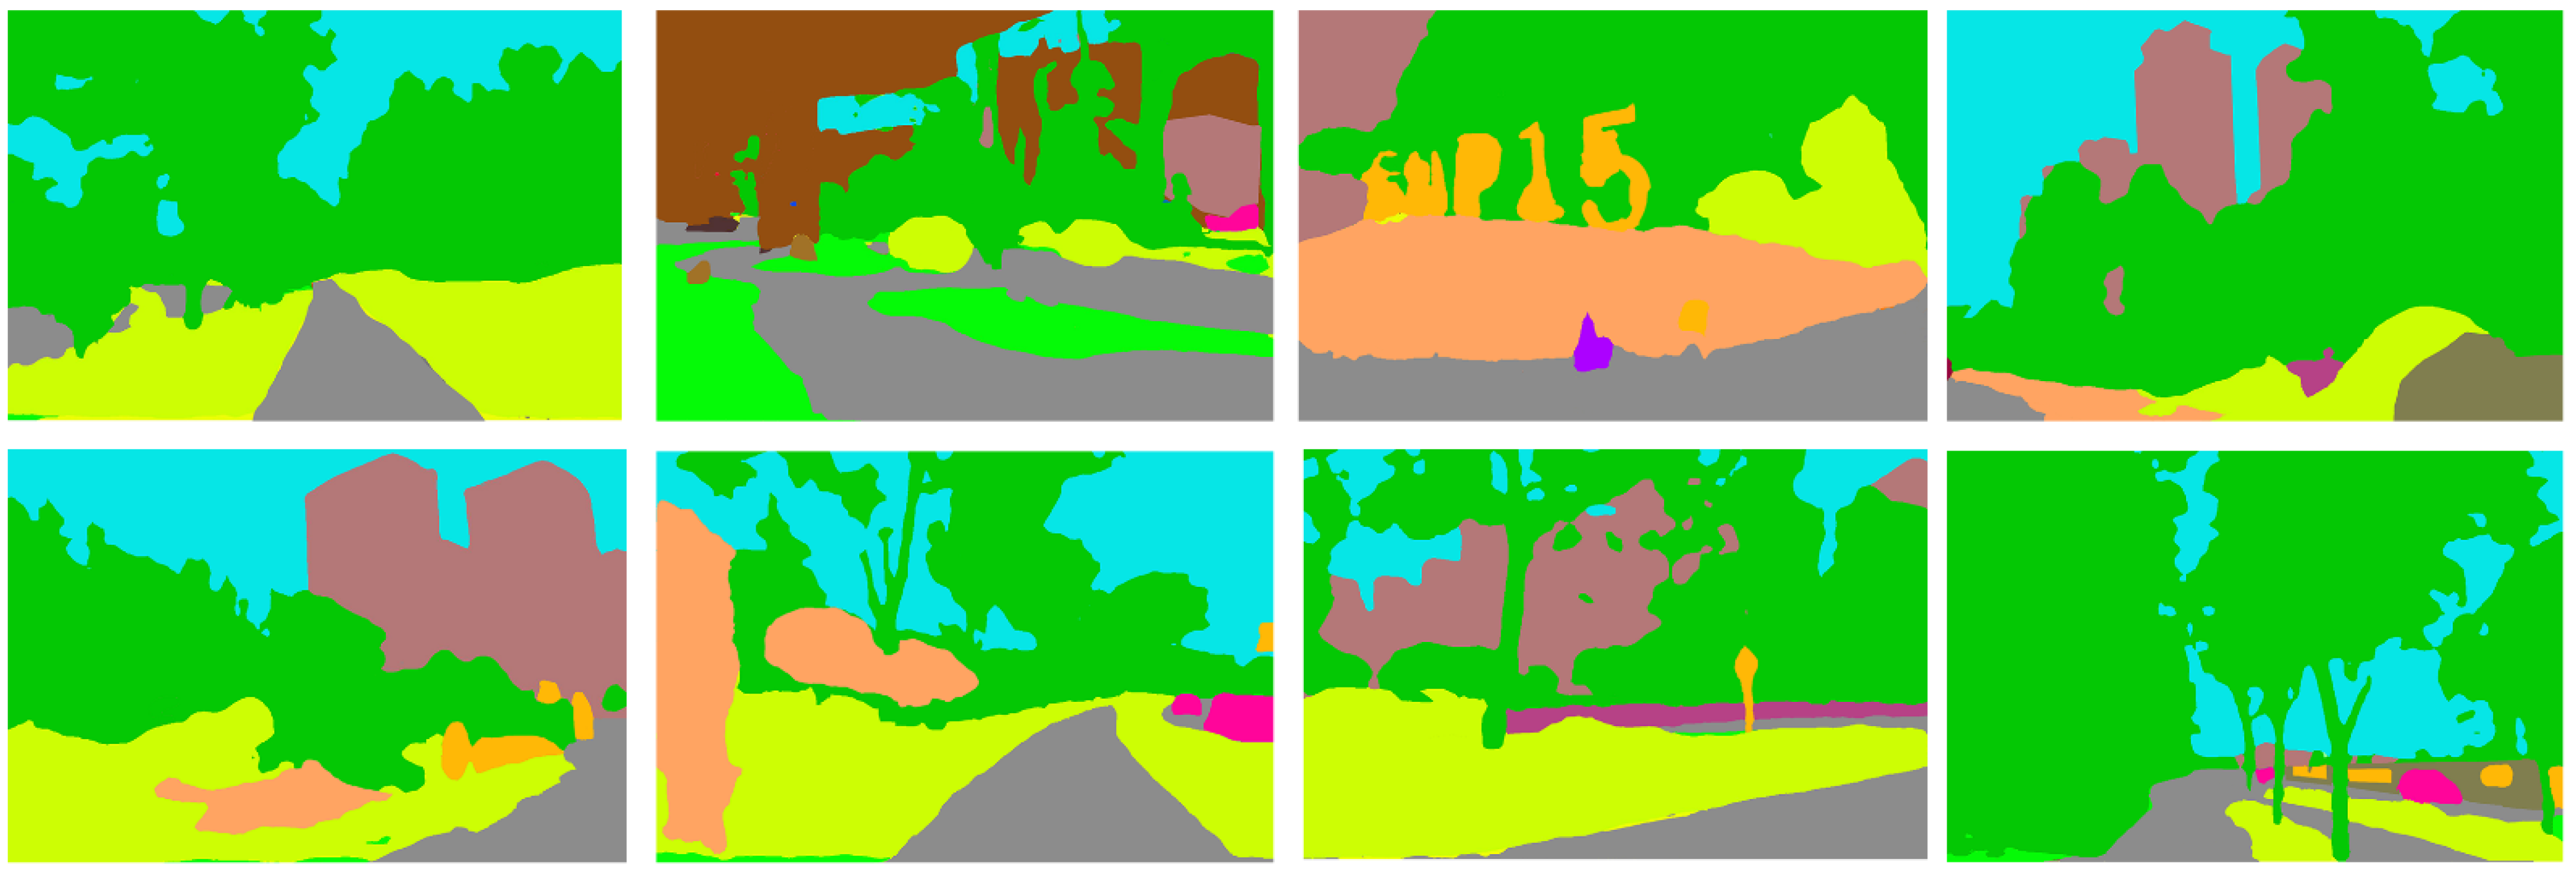
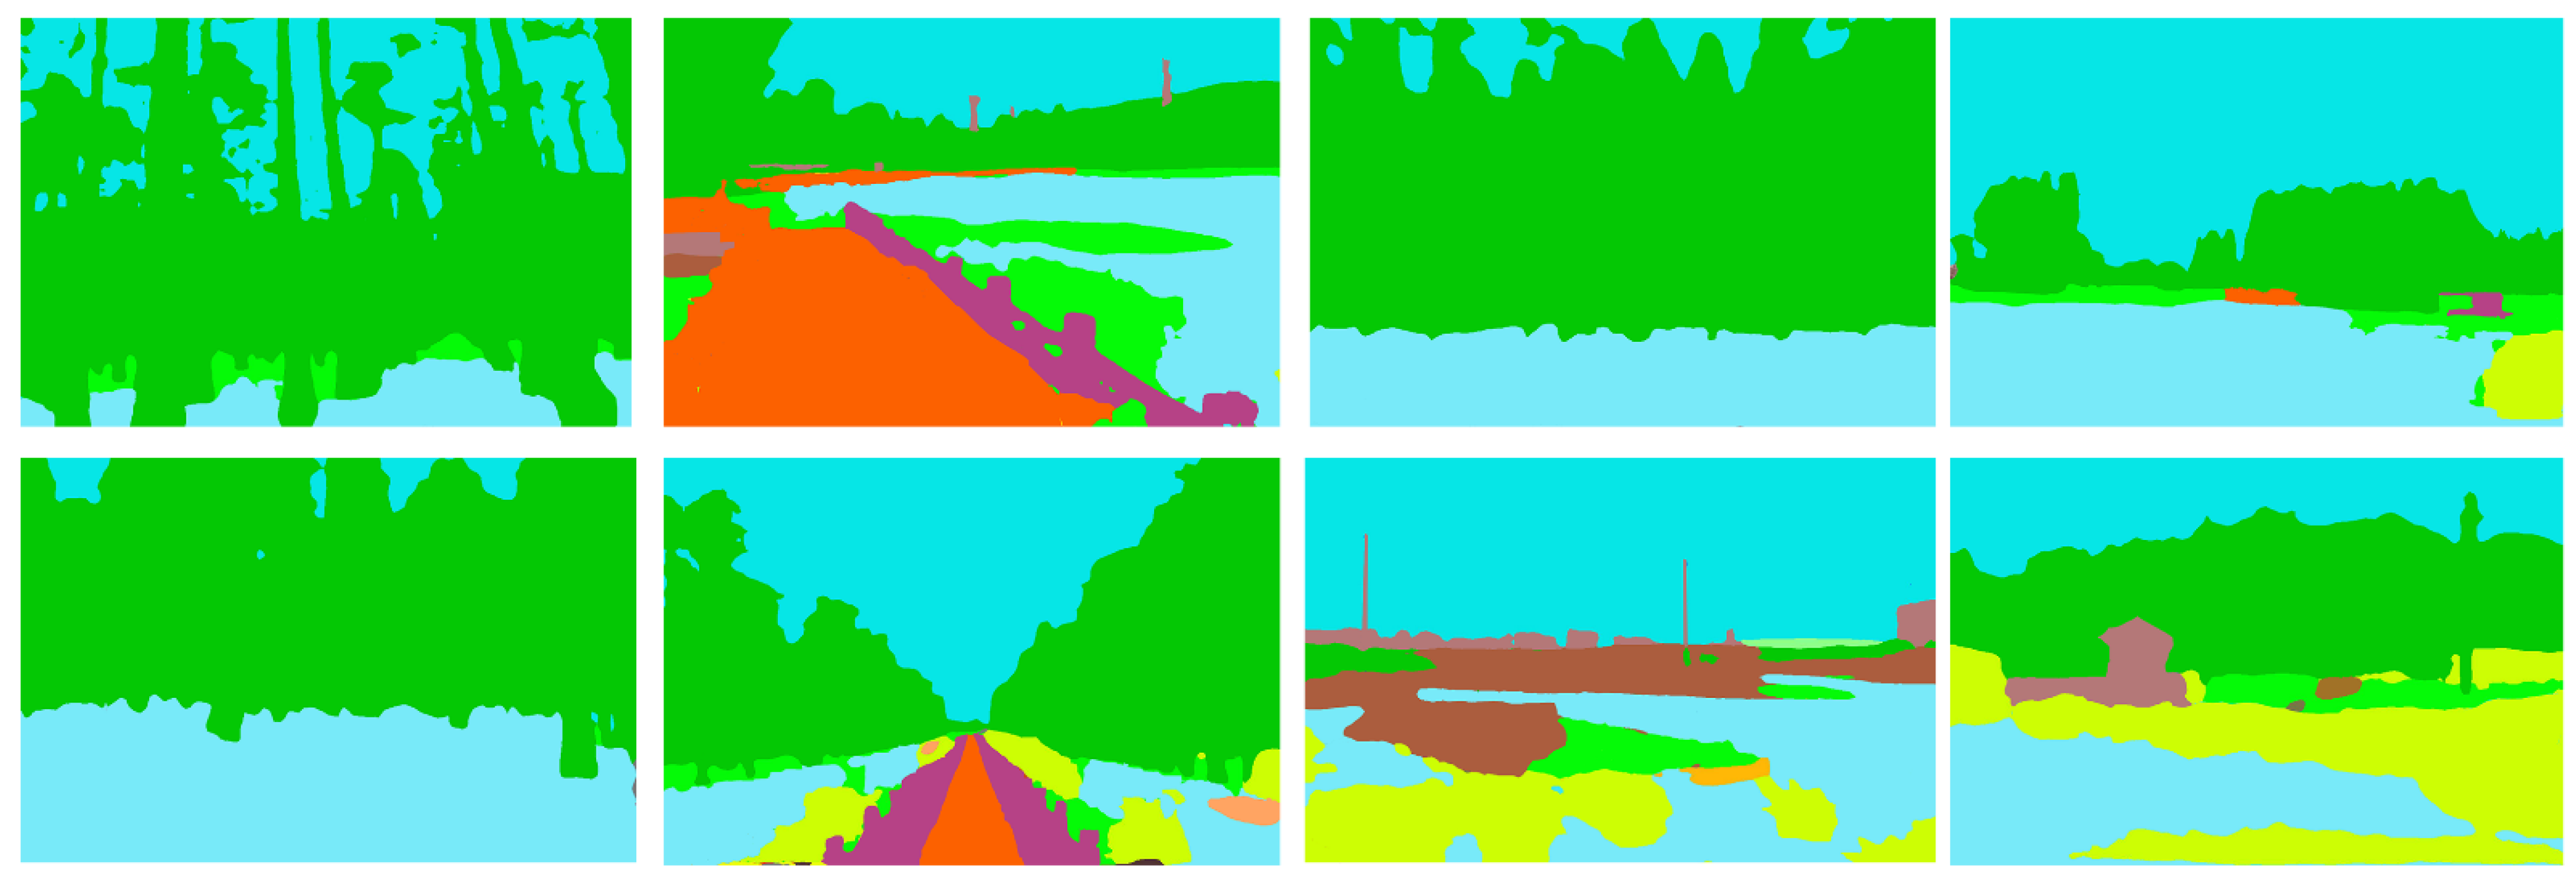
This study quantifies landscape element indicators, such as green visibility ratio and paving ratio, through image semantic segmentation. Leveraging the ADE20K dataset and a fully convolutional neural network (FCN)-trained urban image segmentation model, we achieved pixel-level classification to resolve semantic segmentation challenges, subdividing images into distinct semantic units, process schematic: Figure 2 [36]. The PSPNet model, pre-trained on the ADE20K dataset, was employed to quantitatively decompose landscape element indicators from visual materials. Semantic segmentation results for all experimental visual materials are provided in Appendix B. Post-segmentation, landscape elements across environmental types were aggregated, with outcomes summarized in Table 2.

2.3. Public Perception of Response

2.3.1. Physiological Responses and Indicators

During concurrent physiological monitoring and public perception experiments, the EYESO ECGM3 system (Braincraft Technology Co., Ltd., Beijing, China) was employed to record participants’ heart rate (HR) and skin conductance (SC), the latter being measured through skin resistance. Physiological indicators are significantly influenced by individual differences in the human body. Simply comparing them based on averages is not rigorous enough. Therefore, this study adopted the relative change rate of physiological indicators, namely the relative change rate of heart rate (ΔHR) and skin conductance (ΔSC), to enable cross-subject comparison of environmental effects [43]. The calculation method involves dividing the difference between post-experiment values and baseline values by the baseline value, then multiplying by 100%.
During states of emotional arousal (e.g., excitement or tension), characteristic physiological responses include decreased skin resistance and increased heart rate. Therefore, when the ΔSC value is negative, the post-experiment value has not returned to the baseline level. A larger value indicates a greater positive impact on skin conductance. Similarly, when the ΔHR value is positive, the post-experiment value has not returned to the baseline level. A smaller value indicates a greater positive impact on heart rate levels [44].

2.3.2. Psychological Responses and Indicators

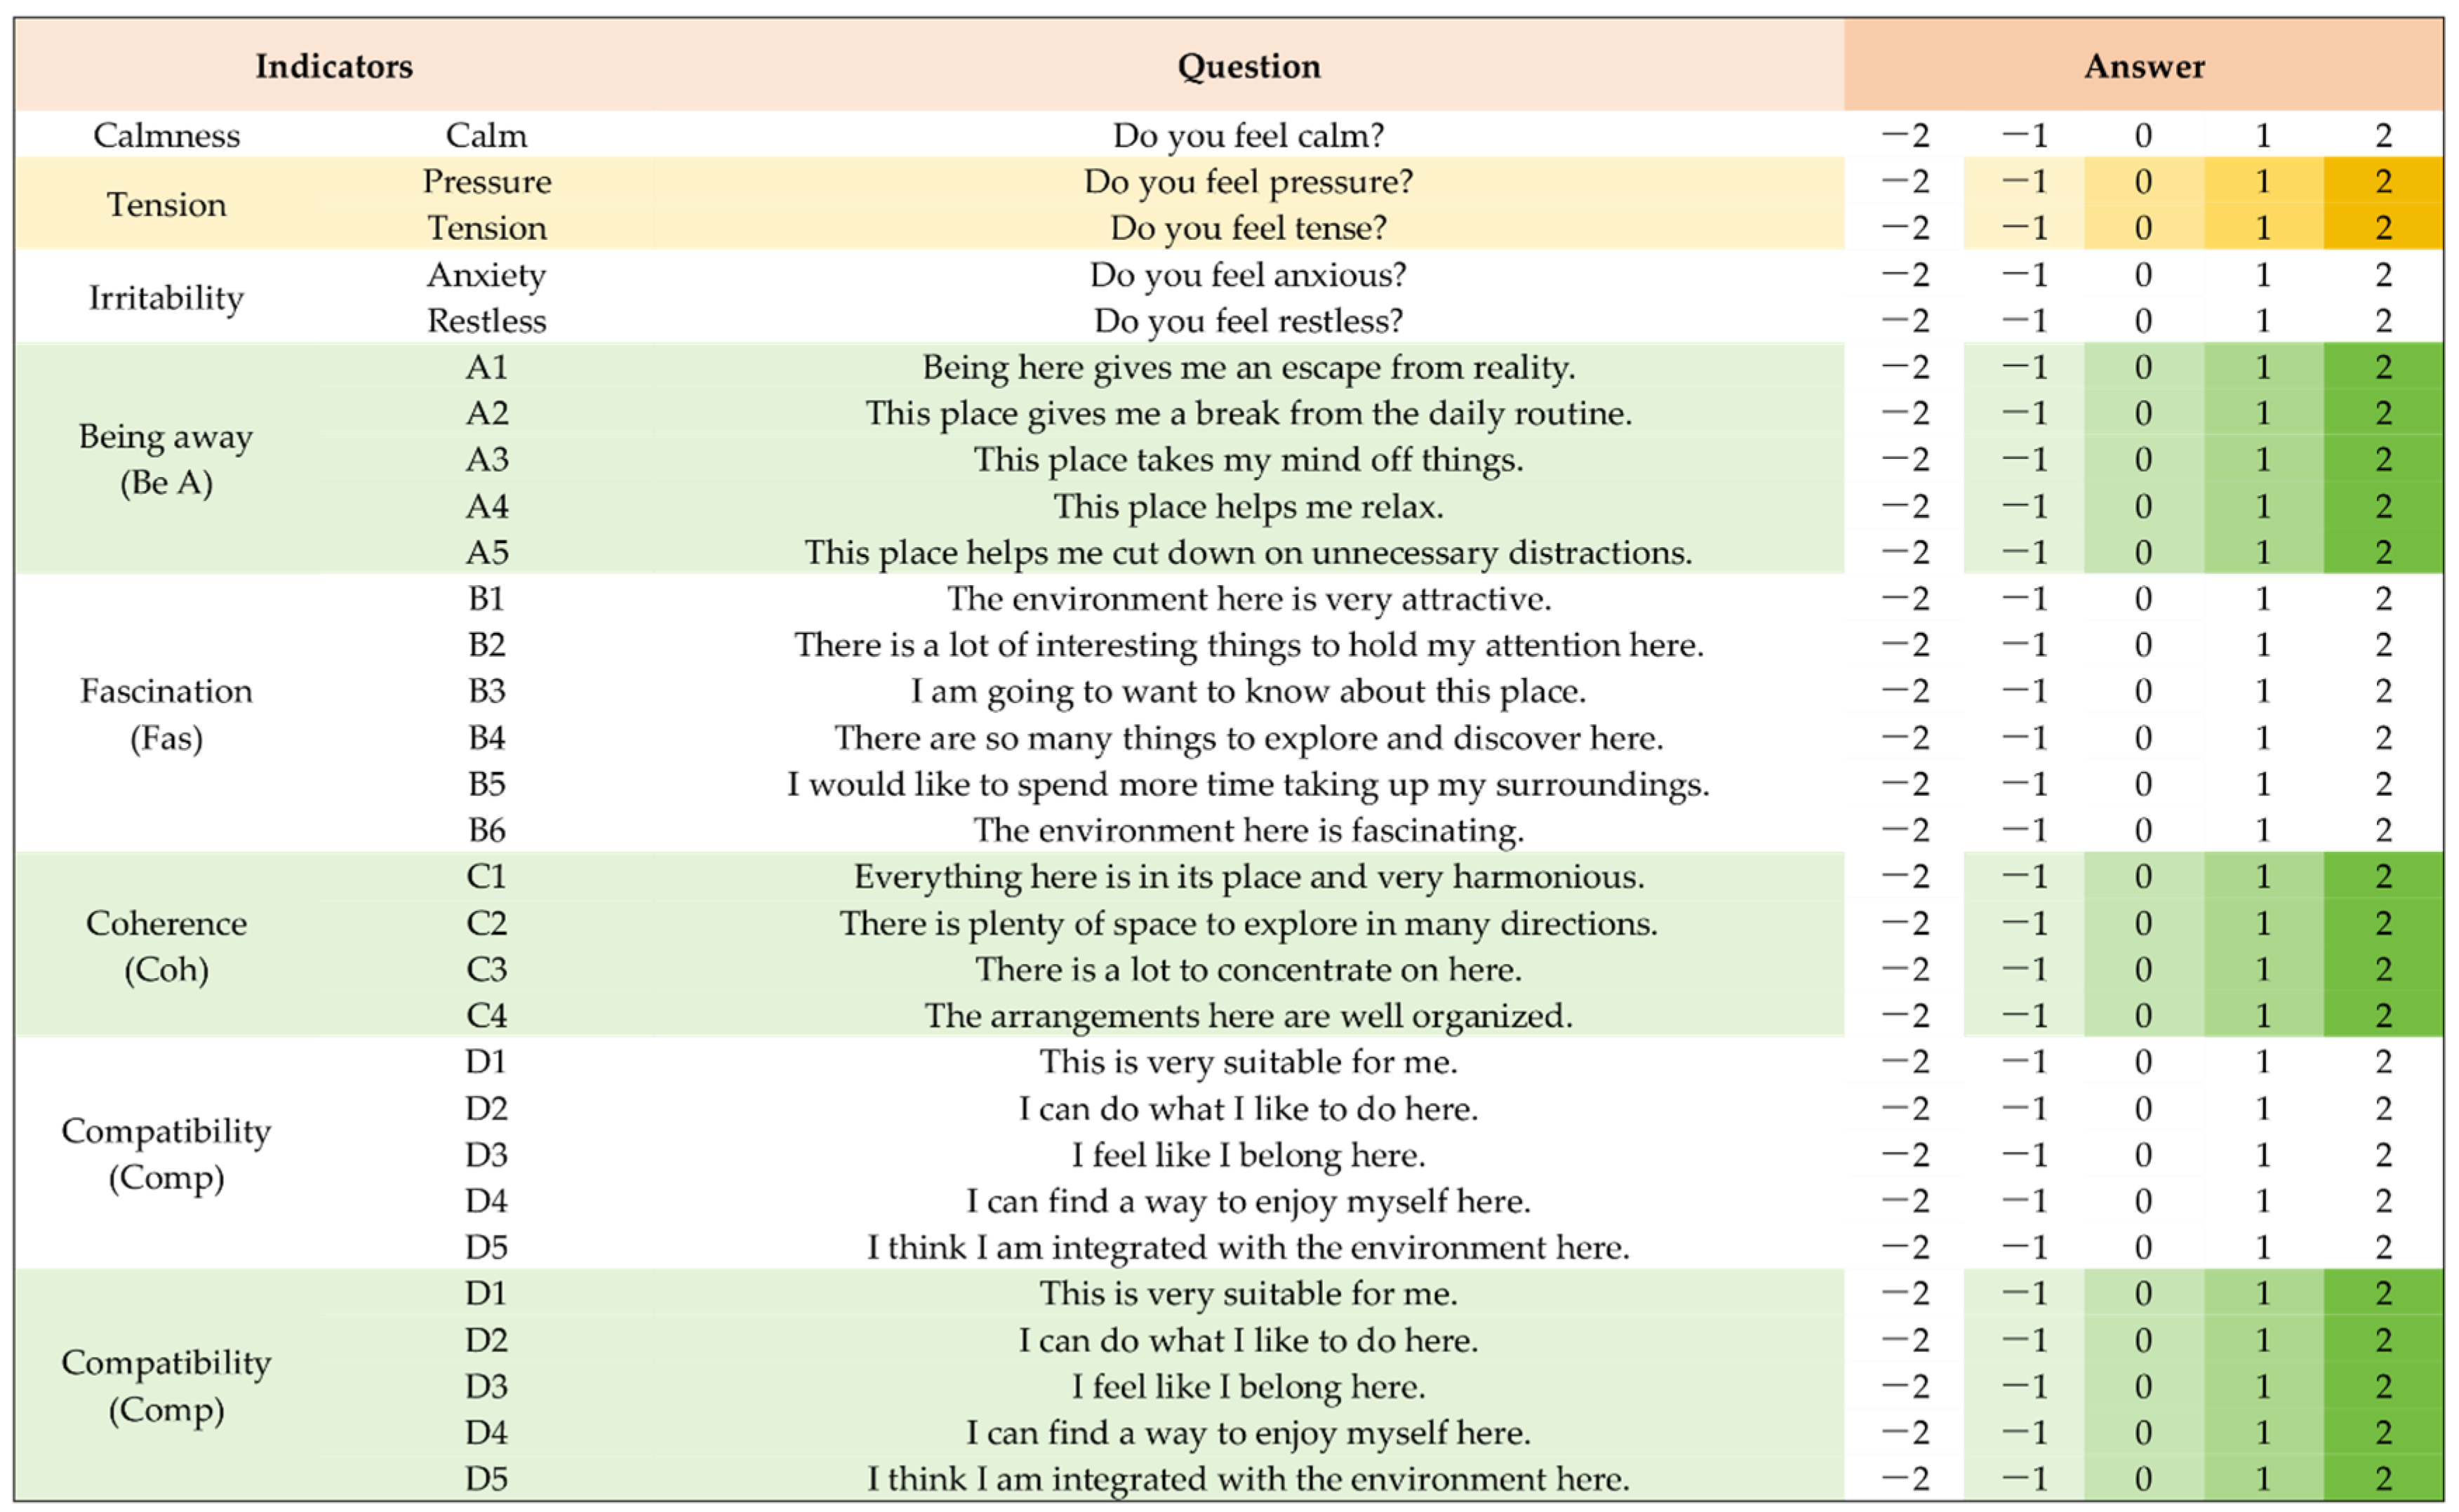
The psychological indicators were derived through a simplification of the indices of the State–Trait Anxiety Inventory and the Profile of Mood States adapted to experimental conditions, quantifying fundamental psychological states, such as calmness, stress, tension, anxiety, and restlessness [45]. In this study, these indicators were assessed using a 5-point Likert scale, ranging from −2 to 2. The streamlined psychological questionnaire comprised three distinct sections to be completed, respectively, before the start of the experiment, after the stress-inducing session, and after a period of rest or exposure to bird sounds. Reliability analysis of the psychological questionnaire yielded a Cronbach’s alpha coefficient of 0.721 (exceeding the 0.6 threshold), thereby demonstrating satisfactory internal consistency for subsequent analytical procedures.
Through further refinement, the evaluation framework was consolidated into three principal components: calmness (C), tension (T), and irritability (I). This consolidation was implemented because mental states consider several psychological effects that are not immediately observable [45]. Calmness (C) is the calm state score, tension (T) is the sum of stress and tension scores minus the calm score, and irritability (I) is the sum of agitation and restlessness scores minus the calm score. The present study of public psychological state research was also conducted using relative changes, which were the change in calmness (ΔC), the change in tension (ΔT), and the change in irritability (ΔI). Each metric was calculated as the difference between post-experimental and baseline state measurements. Comprehensive details of the questionnaire are shown in Figure 3.

2.3.3. Attention Recovery Indicators

Building upon Kaplan and Kaplan, it was proposed that attention-restoring environments exhibit four fundamental characteristics: “Being Away”, “Fascination”, “Coherence”, and “Compatibility” [46]. For the purposes of this investigation, the Perceived Restorative Scale (PRS) was adapted to measure attention restoration [47,48]. The instrument incorporated four primary indicators—Being Away (Be A), Fascination (Fas), Coherence (Coh), and Compatibility (Comp)—and 20 secondary indicators were selected for the questionnaire survey. Participants provided responses using a 5-point Likert scale (−2 to +2), assessing each descriptor through subjective evaluation (detailed items presented in Figure 3). Prior to analytical procedures, all questionnaire responses underwent Cronbach’s alpha reliability testing. The PRS scale exhibited high reliability (α = 0.866), with subscale coefficients for Being Away (0.701), Fascination (0.755), Coherence (0.725), and Compatibility (0.885)—all values surpassing the 0.6 threshold, thereby validating their suitability for further analysis.

2.4. Experimental Subjects

In accordance with established methodological standards for physiological and psychological experiments [49,50,51,52], a sample size ranging between 30 and 40 participants per group was deemed appropriate. Consistent with previous research [53], university students were recruited as participants for questionnaire surveys, visual behaviour assessments, and physiological/psychological monitoring, owing to their accessibility and representativeness. Participants comprised randomly selected undergraduates and postgraduates who provided informed consent in compliance with ethical guidelines. Initial screening via the SCL-90 questionnaire identified and excluded individuals exhibiting psychological abnormalities, with outliers subsequently removed from statistical analyses. The final valid sample comprised 180 participants (72 males and 108 females; aged 18–25), including 139 undergraduates (majors: landscape architecture, horticulture, urban and rural planning, and architecture) and 41 postgraduates (major: landscape architecture). Participants were allocated to six experimental groups: blank control (B), forest environment (F), residential green space (R), street green space (S), urban park (U), and wetland environment (W). Following data screening procedures, invalid datasets were discarded, with supplementary experiments conducted to maintain 30 valid datasets per group.

2.5. Experimental Design

All experimental sessions were conducted individually in controlled indoor environments. Each experimental session lasted approximately 10 min, with strict protocols maintaining silent conditions to preserve auditory integrity. Prior to experimentation, participants completed the SCL-90 assessment to confirm normal psychological status (threshold score < 60). Participants were then outfitted with physiological data acquisition devices and positioned at a standardized 75 cm distance from the display screen, ensuring an optimal and consistent viewing angle. Comprehensive instructions detailing the experimental protocol were provided to all participants to ensure procedural clarity and adherence to the experimental setup. The experimental procedure was systematically structured into three distinct phases: preparatory measures and baseline measurement, application of simulated stress, and the urban forest simulation experience. During the initial phase, baseline physiological values were established through a 1 min eyes-closed session, complemented by a comprehensive questionnaire assessing psychological status. In the second phase, participants were exposed to simulated stress stimuli via clips from thriller and disaster films. To mitigate physiological variability attributable to participant movement, psychological assessments were concurrently conducted through structured questioning. The third phase involved a control group who underwent a 1 min eyes-closed session, followed by visual perception experiments utilizing environmental imagery. Each test group was presented with a series of eight images, each displayed for 15 s. For consistency, audiovisual materials were pre-formatted as MP4 files. The protocol concluded with the administration of mental state scales and, for visual perception groups, attention restoration assessments. Physiological monitoring equipment was removed under supervision. The complete experimental design is schematically represented in Figure 4.

2.6. Data Analysis

Statistical analyses were performed using Excel 2023 for data statistics, and SPSS 24 (IBM Corporation, Armonk, NY, USA) was used for data analysis. Reliability analyses were used to analyse the reliability of all the scales in the study; Pearson correlations were used to analyse the correlations between physiological, psychological, and attention recovery indicators; Spearman analyses were used to analyse the correlations between indicators of landscape elements and indicators of the public’s physiological, psychological, and attention indicators; validation was carried out using validity analyses on the psychological scales, and the attention recovery scales; principal component analysis to streamline the psychological scale; using variance to analyse the experimental results of the five urban forest environments; and using mediating and moderating effects to analyse the pathways of influence of landscape elements on public health. Throughout all analyses, the threshold for statistical significance was maintained at p < 0.05 (two-tailed). Where applicable, effect sizes were reported to complement significance testing.

3. Results

3.1. Public Physiological Responses to Different Urban Green Spaces

Histogram analysis indicated that ΔHR data approximately conformed to a normal distribution. However, Levene’s test revealed significant variance heterogeneity (p = 0.000, <0.05), warranting the application of Welch’s ANOVA. Conversely, ΔSC data demonstrated both normality and variance homogeneity (Levene’s p = 0.822, >0.05), supporting the use of one-way ANOVA. As presented in Table 3, the restorative efficacy of environments on HR indicators was as follows: forest > urban park > residential green space > wetland > street green space, with forests exhibiting the most pronounced effect and street green spaces the least. Regarding SC indicators, the observed ranking was as follows: urban park > forest > wetland > residential green space>street green space, where urban parks showed the greatest benefits. Post hoc analyses comparing all environments to the blank control group confirmed that each green space type conferred significant physiological health benefits relative to the control (Figure 5). These findings demonstrate the differential restorative potential of various urban green space typologies.

3.2. Public Psychological Response to Green Spaces in Different Cities

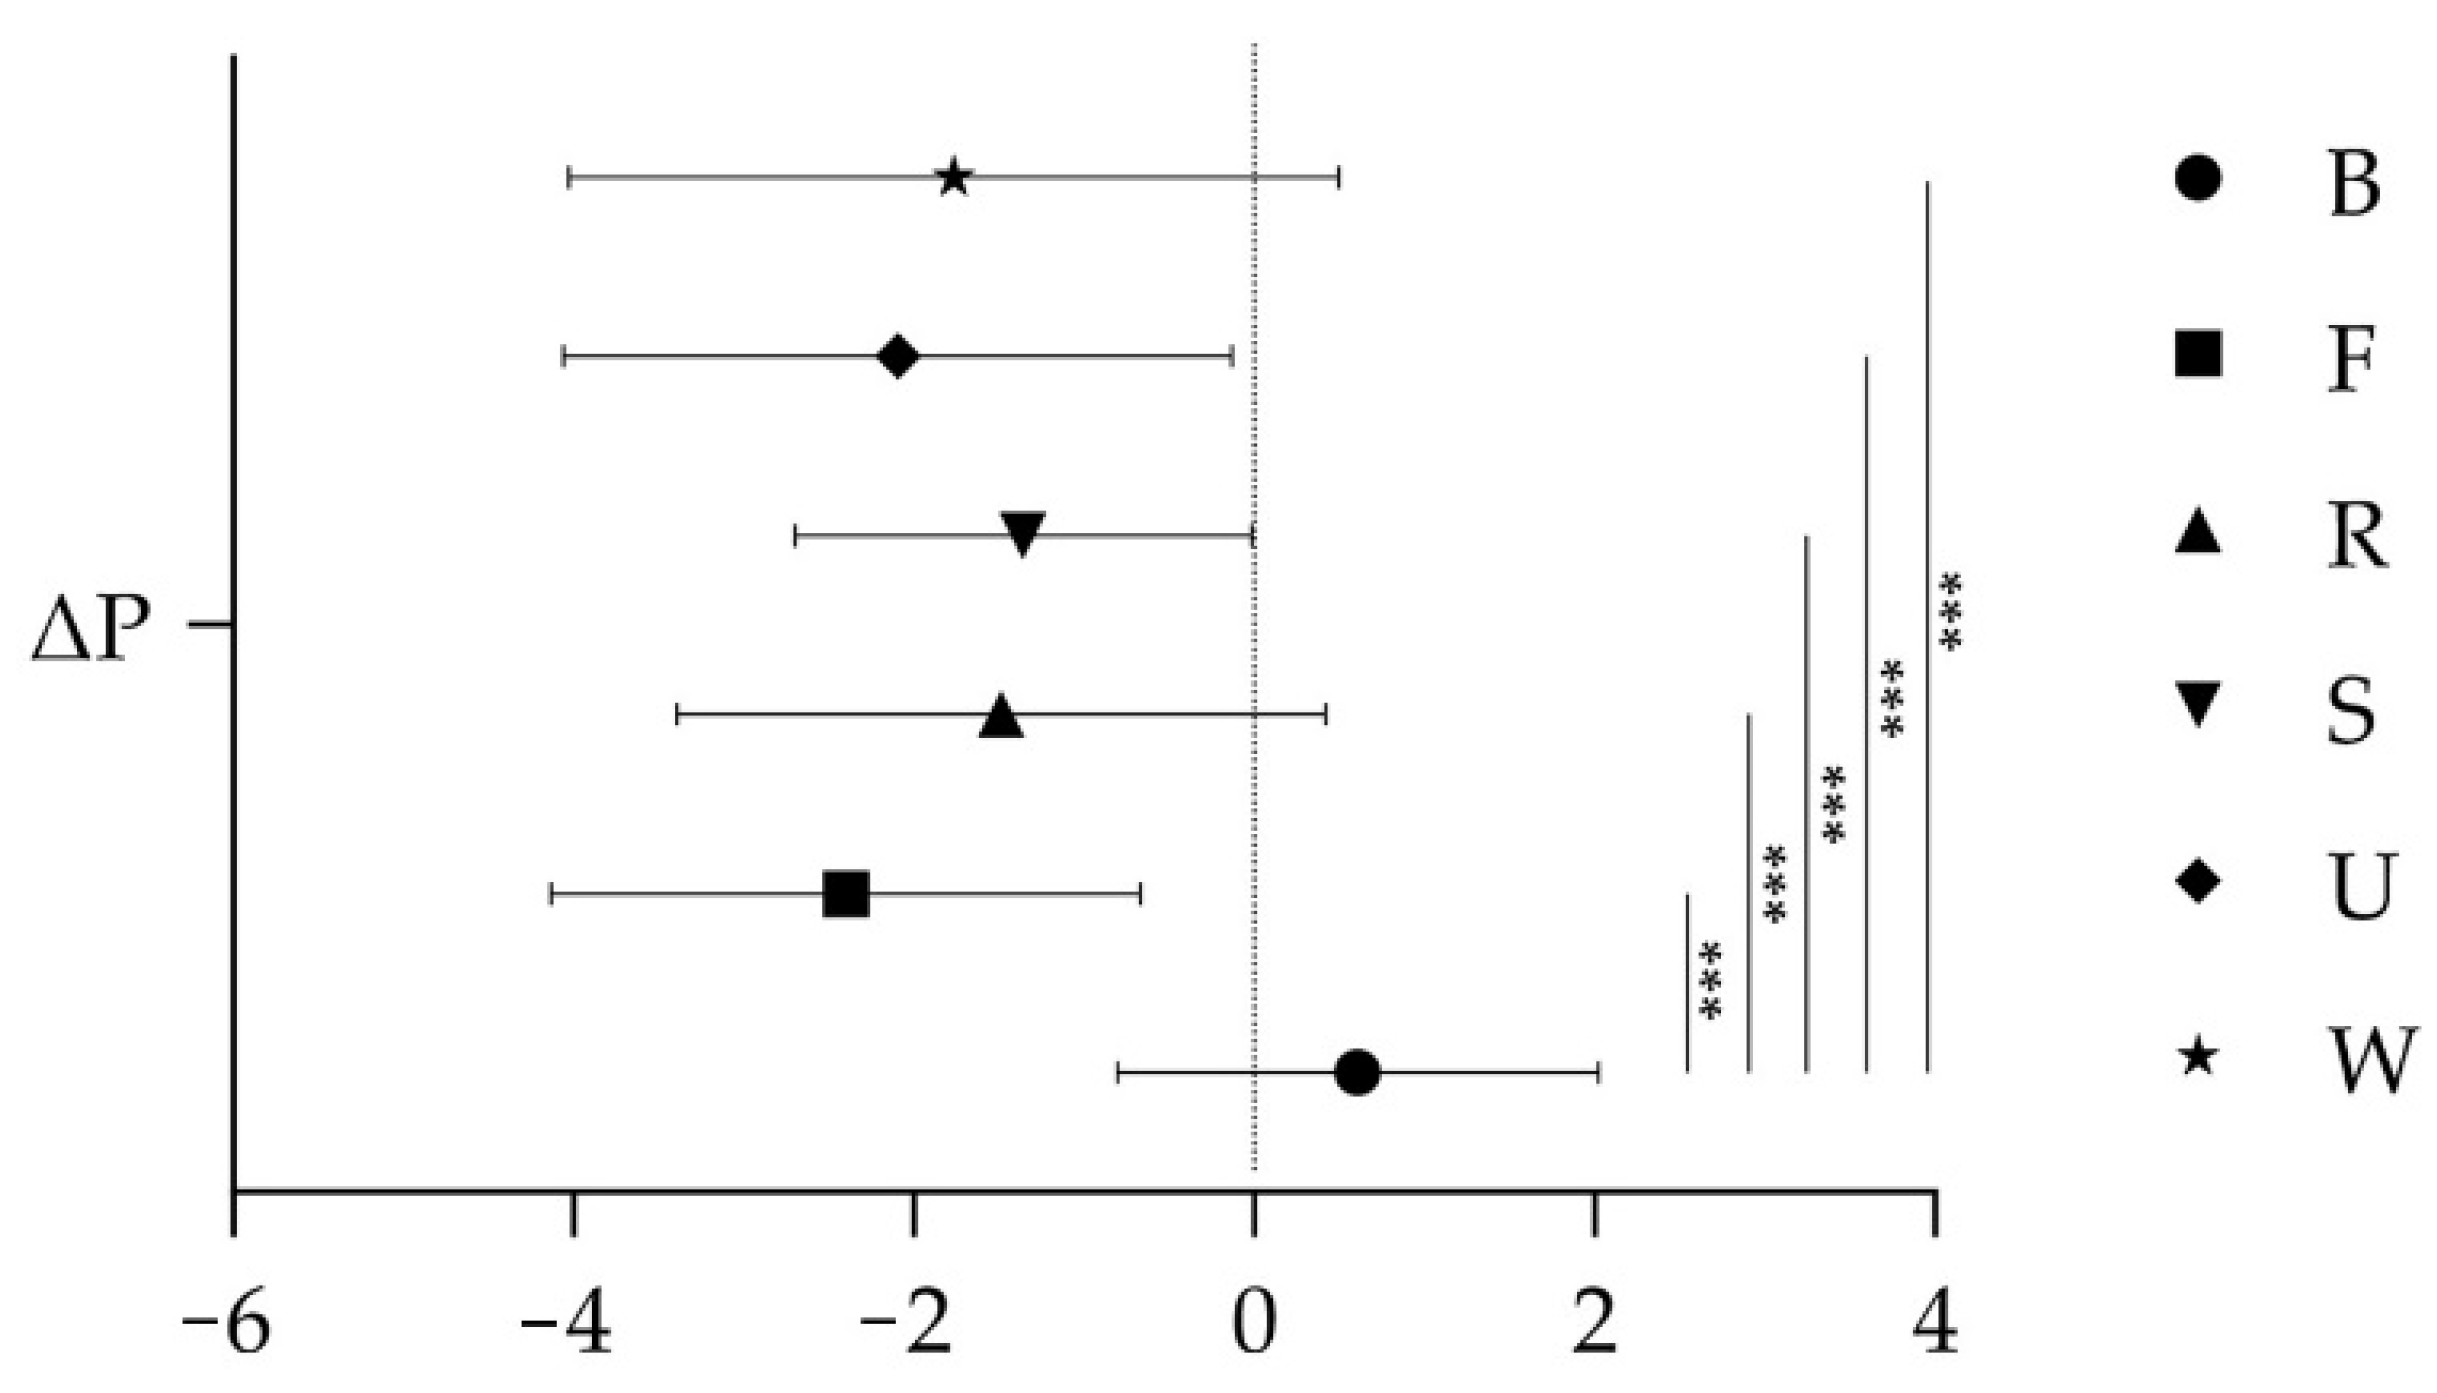
Histogram analysis verified that ΔC, ΔT, and ΔI distributions approximated normality. Pearson correlation analysis identified significant correlations among these three indicators (p = 0.000). To reduce dimensionality psychological outcomes, Principal Component Analysis (PCA) was applied to integrate ΔC, ΔT, and ΔI into a composite metric (ΔP) representing overall psychological changes. The PCA demonstrated appropriate sampling adequacy (KMO = 0.723) and sphericity (Bartlett’s test: p < 0.001), accounting for 77.44% of total variance. This composite measure showed the following:
ΔP = −0.372 × ΔC + 0.389 × ΔT + 0.375 × ΔI
Based on these calculations, ΔP was inversely proportional to ΔC and directly proportional to ΔT and ΔI. Shapiro–Wilk tests confirmed that ΔP data followed a normal distribution (p = 0.467, >0.05). Levene’s tests for ΔC, ΔT, ΔI, and ΔP revealed homogeneity of variance for ΔC (p = 0.743) and ΔT (p = 0.082, both >0.05), while ΔI (p = 0.003) and ΔP (p = 0.035, both <0.05) exhibited variance heterogeneity. Consequently, one-way ANOVA was applied to ΔC and ΔT, and Welch’s ANOVA to ΔI and ΔP, with results detailed in Table 4. All green space typologies significantly outperformed the blank control condition (all p < 0.05), exhibiting a consistent restorative gradient as follows: forest>urban park>wetland>residential green space>street green space across all indicators. Post hoc tests comparing physiological impacts of different green spaces to the blank control further confirmed significant mental health benefits for all environments relative to the control group, as illustrated in Figure 6.

3.3. Public Attention Responses in Different Urban Green Space

Histogram validation established that Being Away (Be A), Fascination (Fas), Coherence (Coh), and Compatibility (Comp) followed normal distributions. Levene’s tests demonstrated homogeneity of variance for all four indicators (p = 0.324, 0.364, 0.288, and 0.346, respectively; all >0.05). This variance profile supported the application of one-way ANOVA for between-group comparisons. As shown in Table 5, significant differences were observed only in Coh across environments, with residential green spaces scoring significantly lower than other types. However, the lack of variability in other indicators (Be A, Fas, and Comp) may stem from the inherent restorative characteristics shared by all environments, which likely minimized detectable disparities.

3.4. Relationships Between Landscape Elements and Public Physiological and Psychological Responses

3.4.1. Correlation Between Different Public Response Indicators

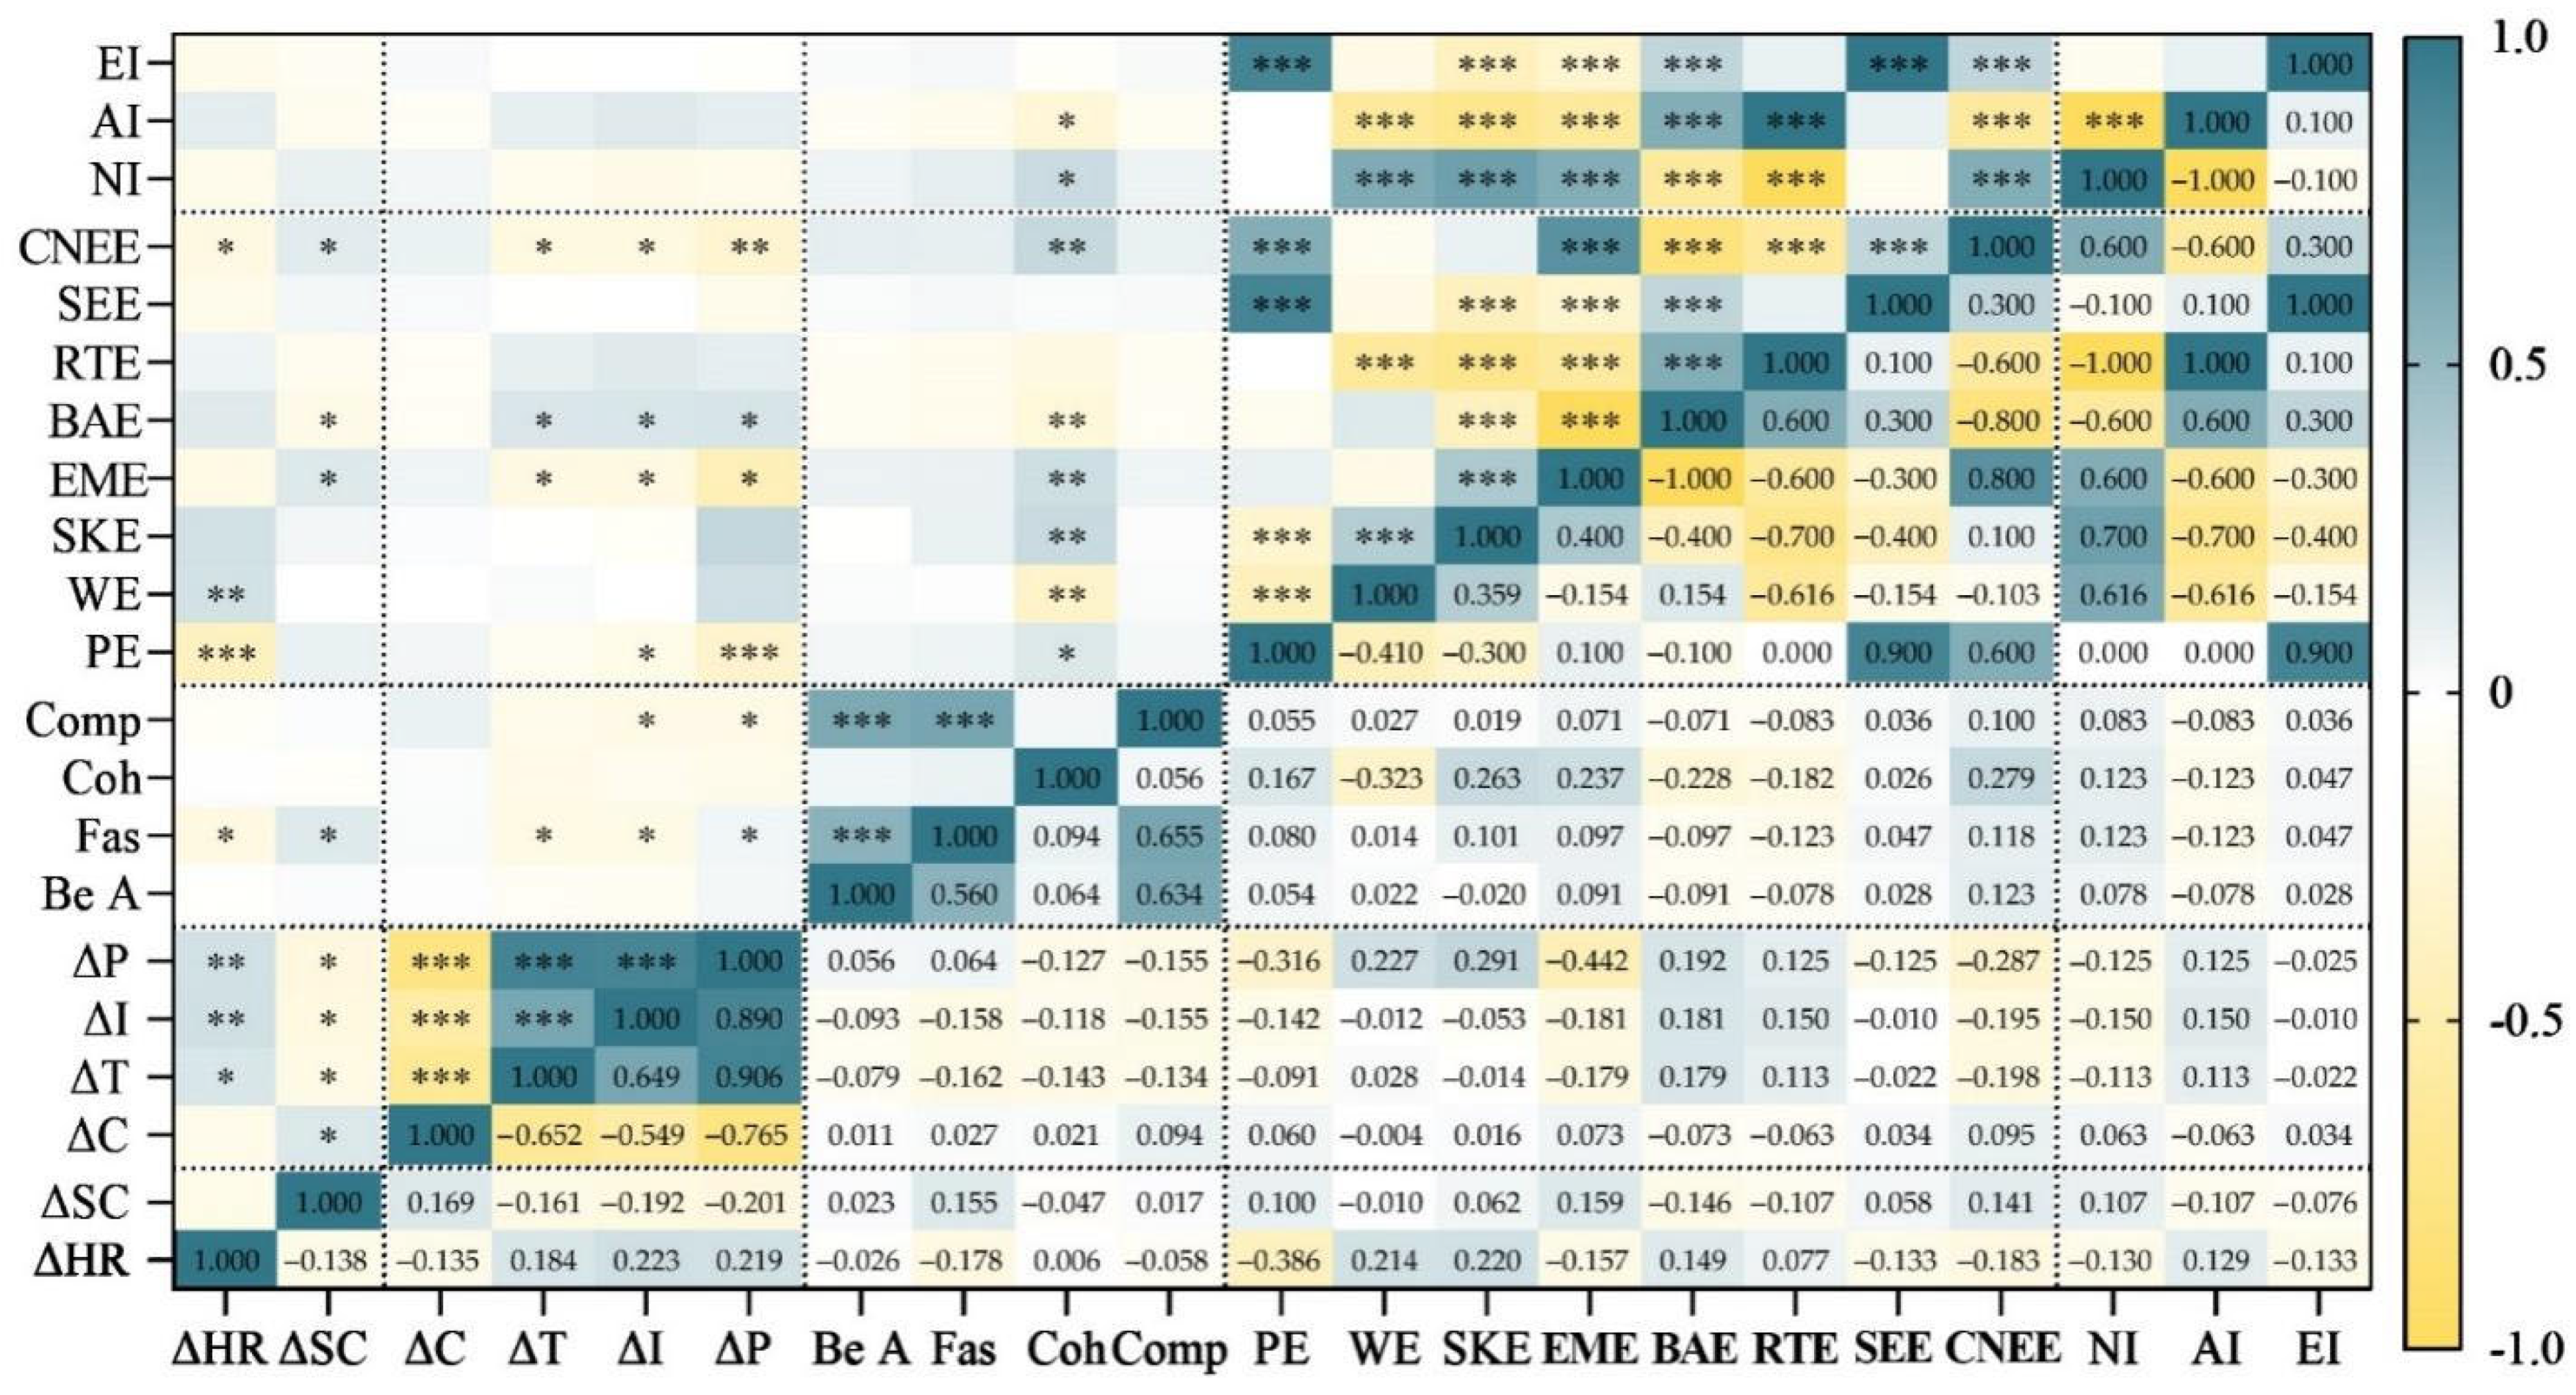
Following confirmation of non-normal distributions among landscape elements through normality testing, this study employed Pearson correlation analysis to examine relationships among physiological, psychological, and attention recovery indicators. Spearman correlation analysis was applied to assess associations between landscape elements and these health metrics. Detailed results are illustrated in Figure 7.
In terms of physiological and psychological indicators, variations in heart rate (HR) and skin conductance (SC) demonstrated significant correlations with tension (T), irritability (I), and overall psychological state (P), with SC additionally linked to calmness (C). Notably, reductions in public tension and irritability not only fostered more positive psychological states but also promoted favourable physiological responses. These observed relationships highlight that whilst psychological questionnaires may present subjective limitations, real-time physiological monitoring provides robust empirical validation for psychological improvements.
Regarding the interplay between attention, physiology, and psychology, spatial fascination (Fas) showed significant correlations with most physiological and psychological metrics, while irritability (I) and overall psychological state were also associated with compatibility (Comp). This finding implies that optimizing the fascination potential of green spaces and public-environment compatibility could substantially augment their therapeutic efficacy.

3.4.2. Correlation Between Landscape Elements and Public Response

Following the Spearman correlation analysis between landscape element indicators and public response indicators, Figure 6 reveals several notable correlations. Specifically, the Plant Element (PE) demonstrated correlations with relative change in HR (ΔHR), relative change in irritability (ΔI), relative changes in psychological states (ΔP), and coherence (Coh) in the context of attention recovery; the Water Element (WE) correlated with ΔHR and Coh; the Earth and Mountain Element (EME) correlated with ΔHR, relative change in tension (ΔT), ΔI, ΔP, and Coh; the Building and Artificial Element (BAE) correlated with ΔSC, ΔT, ΔI, ΔP, and Coh; and the Natural Element to Enclosure (CNEE) correlated with ΔHR, ΔSC, ΔT, ΔI, ΔP, and Coh. Additionally, the Sky Element (SKE), Naturalness Index (NI), and Artificiality Index (AI) exhibited correlations with Coh. These findings highlight the intricate relationships between landscape elements and public response indicators in attention recovery. Specifically, when PE, EME, and CNEE are more prominent, the restorative benefits associated with their respective indicators are more pronounced; conversely, greater BAE presence corresponds to reduced restorative benefits for its related indicators. Notably, the prominence of water elements may reduce the space’s health benefits for users. Building upon existing research, this study categorized various landscape types into three indicators: NI, AI, and Enclosure Index (EI). Nevertheless, as illustrated in Figure 7, these three indicators demonstrated no significant correlations with the public’s physiological and psychological responses, except for a weak association with Coh in attention restoration. This finding suggests that the physiological and psychological health benefits derived from green spaces are not influenced by the naturalness, artificiality, or enclosure of the green space. Rather, distinct landscape element categories drive these effects.

3.4.3. Mechanisms of Public Health Impacts of Landscape Element Indicators

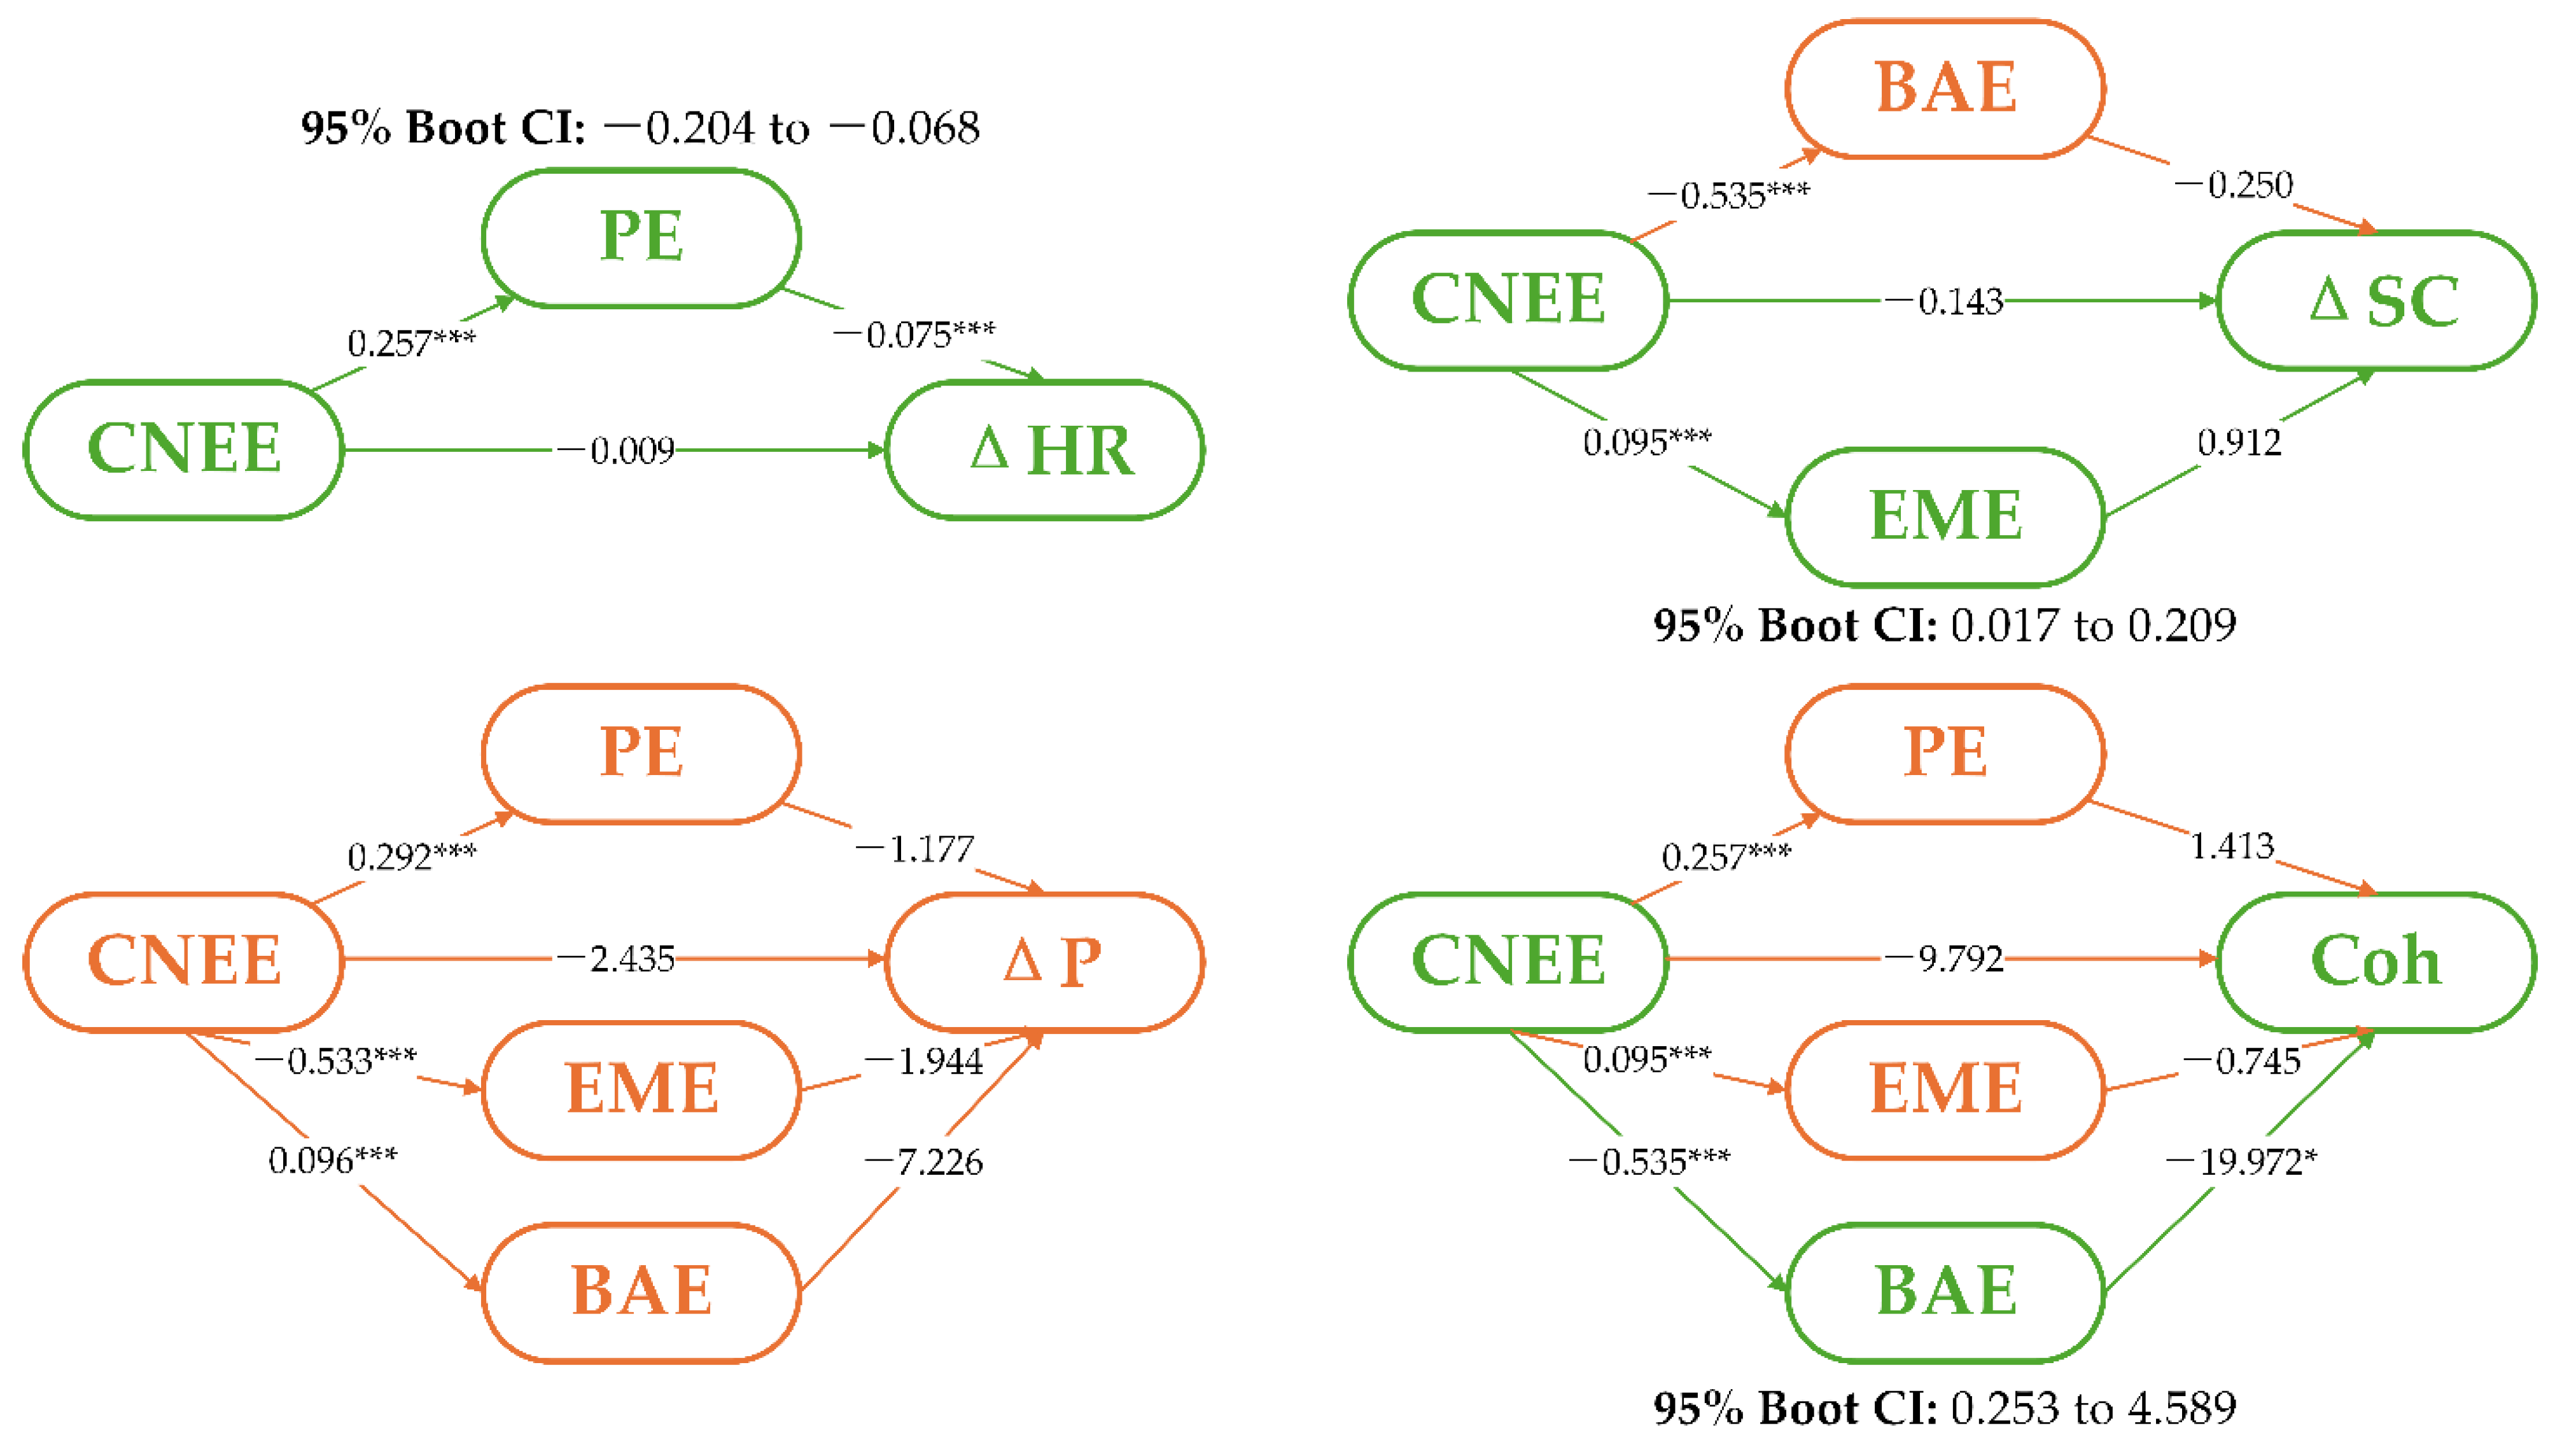
Analysis revealed that the Contribution of Natural Element to Enclosure (CNEE) of landscape elements exhibited significant correlations with most physiological and psychological indicators. However, CNEE’s quantification framework suggests that its health benefits may be mediated and may be primarily actualized through specific metrics—namely, Plant Element (PE), Earth and Mountain Element (EME), and Building and Artificial Element (BAE)—which collectively constitute the framework of Spatial Enclosure Element (SEE). Correlation analysis alone may overlook the nuanced health benefits conferred by CNEE through landscape elements. Integrating the correlations delineated in Figure 7, this investigation posits several potential pathways of influence, as detailed in Table 6. The validation of these pathways involved examining nine proposed mediating routes, where the presence of a mediating effect is affirmed either when coefficients a and b are significant and coefficient c is not, or when at least one of a or b is not significant, and coefficient c is not significant, provided that the Bootstrap 95% confidence interval excludes zero. The mediation testing protocol is elaborated in Appendix C, with outcomes presented in Figure 8, affirming the hypotheses Ha, Hb2, and Hd3. The mediating variables elucidate that CNEE facilitates health benefits via assorted landscape elements, although no mediating pathway was identified for the effect of CNEE on ΔP. This suggests that health benefits stem from the interaction of varying CNEE levels modulated by variations in PE, EME, and BAE.
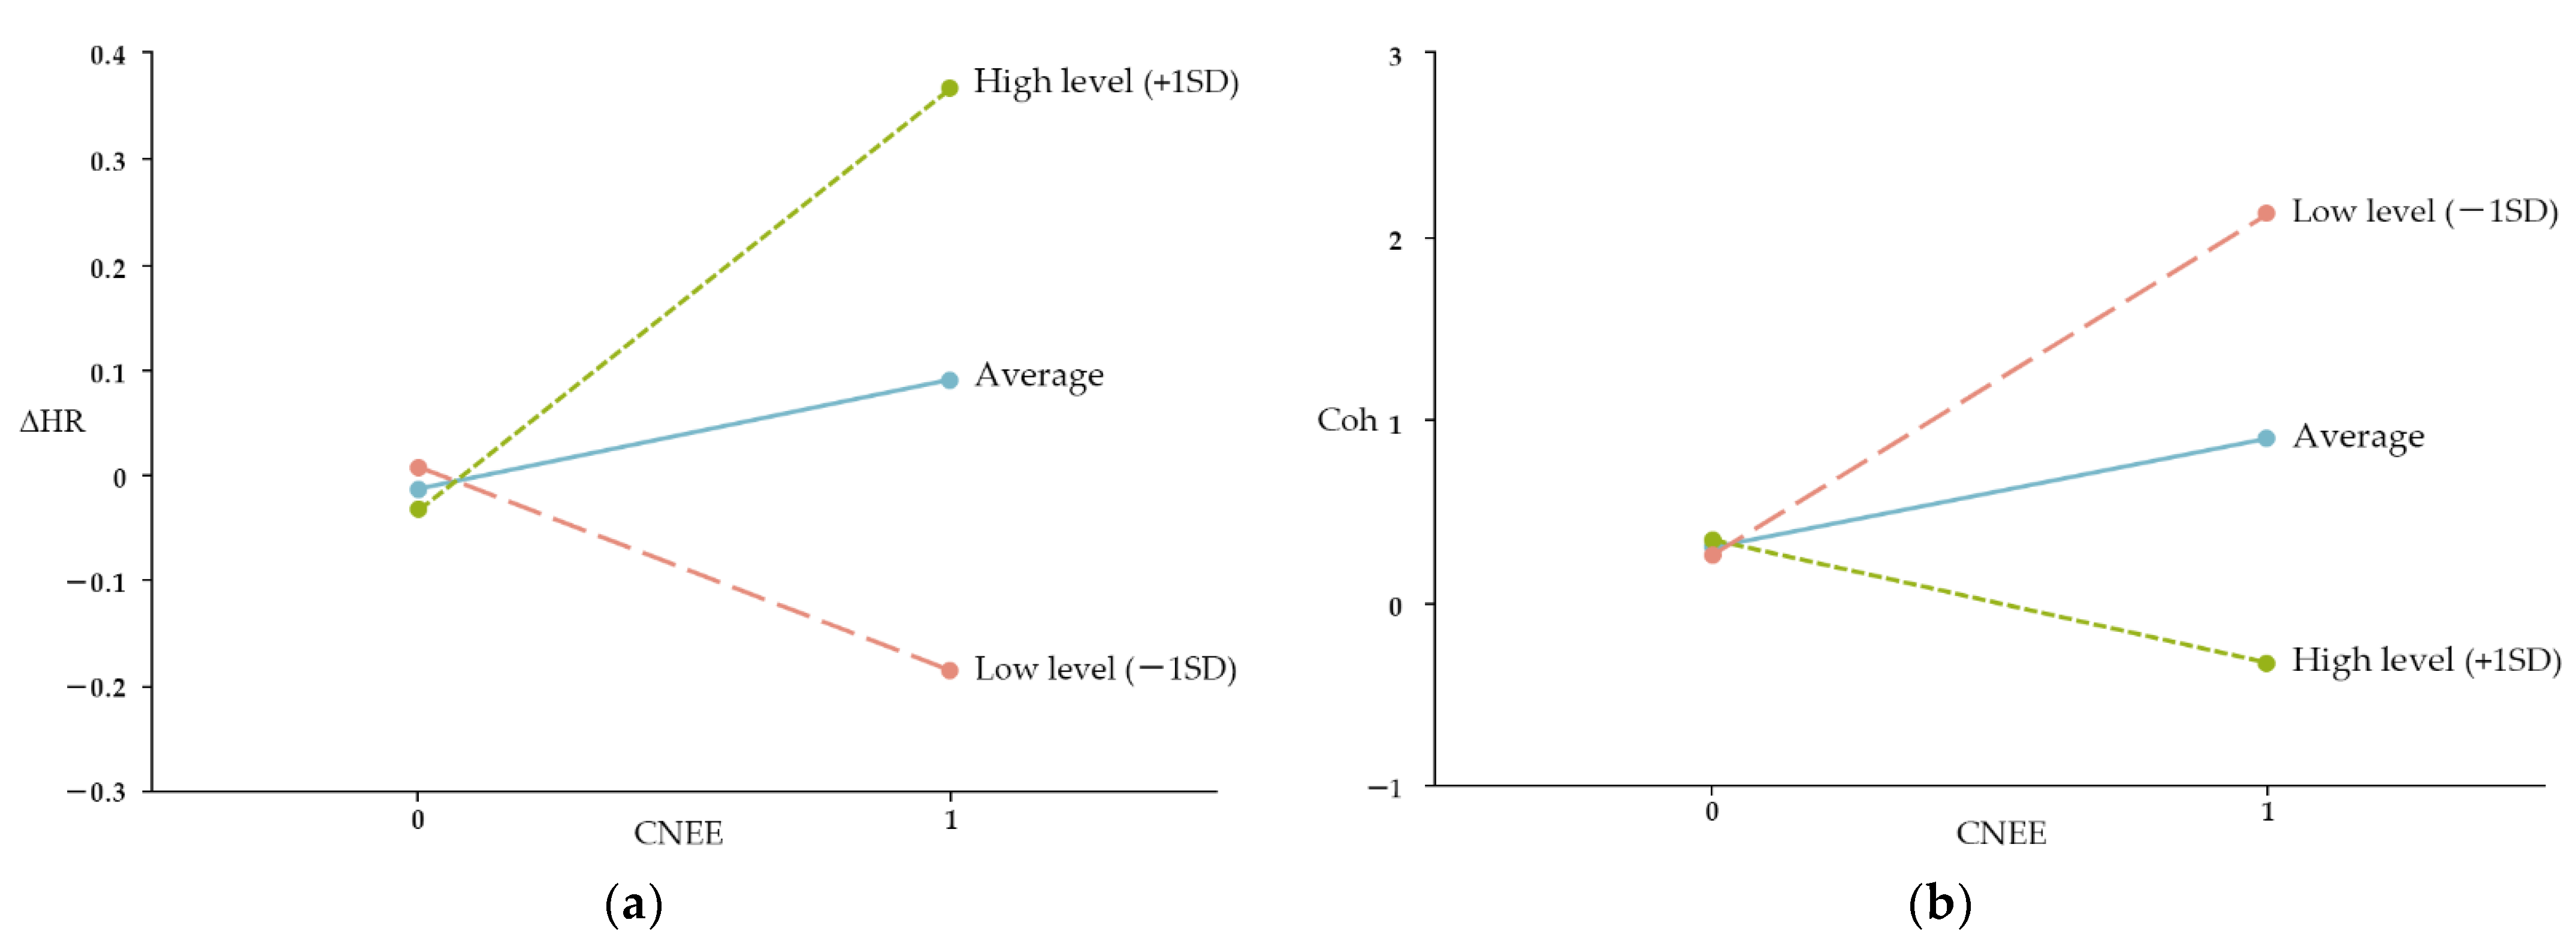
However, WE (Water Element) and SKE (Sky Element) also demonstrated correlations with select indicators. Extending on the mediation pathways identified earlier, this study further investigated whether WE and SKE acted as moderators on the CNEE→ΔHR and CNEE→Coh pathways, respectively. To ensure interpretability, independent and moderator variables were mean-centred prior to conducting analysis to align with the study’s context. Results (Table 7) confirmed significant moderating effects of WE in the CNEE→ΔHR pathway and SKE in the CNEE→Coh pathway. Simple slope analysis (Figure 9) revealed that higher WE levels weakened the heart rate recovery benefits mediated by PE (Plant Element) in the CNEE→ΔHR pathway (β = −0.263, p < 0.05). Conversely, elevated SKE levels enhanced Coh scores (β = 0.651, p < 0.05), indicating that increased sky visibility strengthens environmental coherence perception.

4. Discussion

4.1. Impact of Vision-Based Urban Green Space on Public Physiological and Psychological Health

This research utilized heart rate (HR) and skin conductance (SC) as physiological indicators, demonstrating that all five categories of urban green spaces exhibited favourable impacts compared to the blank control, aligning with established research findings [54,55]. Notably, the restorative effects on HR with the following hierarchy: forest > urban park > residential green space > wetland > street green space; for SC, the sequence was urban park > forest > wetland > residential green space > street green space. The enhancement of psychological well-being showed a comparable trend with the following: forest > urban park > wetland > residential green space > street green space. Generally, forests and urban parks demonstrated superior restorative effects on the public’s physiological and psychological states, while residential green spaces and roadside green spaces showed comparatively weaker outcomes. Regarding landscape components, the Naturalness Index (NI) was higher in the former two, with the Artificiality Index (AI) higher in the latter pair. Environments with greater naturalness conferred enhanced health benefits, consistent with previous studies [12,42,54]. Furthermore, the perception of environmental quality in forests and urban parks was more positive, with evidence suggesting that green vegetation notably lowered participants’ systolic blood pressure (SBP), HR, and low-frequency/high-frequency ratio (LF/HF) [54,56]—a likely contributor to these effects. PRS analysis indicated limited inter-environment variation except in Coherence (Coh). Lower Coh scores in residential green spaces likely stemmed from limited sky visibility and spatial enclosure (Table 5). The absence of differences in other PRS dimensions may reflect the shared restorative characteristics of urban green spaces [46]. The observed Coh discrepancies may reflect the high enclosure of residential landscapes and limited perceived sky exposure by the public, leading to a sense of inadequate spaciousness, thus influencing the differences reflected in the lower C2 scores on the PRS scale.
Overall, environments featuring higher Plant Elements (PE), such as forests and urban parks, exhibit greater physiological restoration benefits compared to urban green spaces characterized by elevated Building and Artificial Elements (BAE) levels. This aligns with established evidence demonstrating a positive relationship between the restorability of the environment and natural attributes. Specifically, arboreal elements enhance restorability, while built elements decrease restorability [56]. Additionally, this study underscores the enhanced health advantages associated with urban parks and forests, representing artificial and natural types of green spaces, respectively. This suggests that while artificially designed green areas resembling natural environments yield positive restoration effects, optimal benefits derive from natural landscape elements, such as PE, Water Element (WE), and Sky Element (SKE), irrespective of their context. To maximize naturalness and still offer superior health benefits, this is consistent with the results of existing studies [44]. In developing street-side green spaces, residential green areas, and other man-made green spaces, emphasis should be placed on increasing the presence of well-directed natural-type landscape elements accessible to the public within confined spaces, thereby enhancing the restorative potential of these environments.

4.2. Impact of Landscape Element Composition on Public Health Benefits

This study introduced a refined categorization of landscape elements through the Naturalness Index (NI), Artificiality Index (AI), and Enclosure Index (EI). Surprisingly, the investigation revealed that naturalness and artificiality were solely associated with the Coh indicator in the PRS scale, while enclosure demonstrated no significant relationships with any indicator. This pattern may reflect green spaces often falling within enclosed or semi-enclosed urban green spaces. These results reinforce the notion that public health benefits from green spaces are achieved through specific landscape elements. Notably, the Plant Element (PE) exhibited connections with heart rate (HR), irritability (I), psychological condition, and Coh; the Water Element (WE) correlated with HR and Coh; the Sky Element (SKE) related to Coh; the Earth and Mountain Element (EME) was linked to skin conductance (SC), T, I, psychological condition, and Coh; the Building and Artificial Element (BAE) was associated with SC, T, I, psychological condition, and Coh; and the Contribution of Natural Element to Enclosure (CNEE) demonstrated associations with HR, SC, T, I, psychological condition, and Coh. Remarkably, CNEE emerged as the most comprehensive indicator examined in this study. Optimal enclosure ratios (0.3–0.4 or 0.8–1) align with peak health benefits [57]. Considering the composition of CNEE’s landscape elements, it was deduced that nature-based elements within enclosed spaces are key mediators of health benefits. Furthermore, the study revealed that environments like forests and urban parks, characterized by higher percentages of PE and EME, show superior restoration of both physiological and psychological well-being, underscoring the well-established impact of Plant Elements on public health outcomes [54,58].
The intricate processes underlying green environments’ restorative effects on the public present a complex scenario [59]. By integrating the quantification approach for CNEE in this study, it is proposed that the health benefits associated with CNEE for the public are likely realized through specific indicators. Through the pathways of influence identified in this research, it was observed that the restorative impact of CNEE on HR is linked to PE as a landscape element, the restorative effect on SC is tied to EME, and the enhancement of Coh is attributed to BAE. Notably, a higher perceived presence of PE and EME was found to be more conducive to enhancing public physiological recovery indicators, while a smaller perceived proportion of BAE corresponded to higher Coh scores, indicating improved public attention recovery. No singular pathway was identified for psychological indicators, potentially reflecting the multifactorial nature of environmental psychology [46], suggesting that psychological restoration may require integrated indicators. Furthermore, the analysis of moderating effects revealed that an increased proportion of WE was associated with reduced benefits in public heart rate recovery, indicating that excessively large water bodies or proximity to water may induce negative psychological states and public anxiety [60]. Conversely, a higher proportion of perceived SKE corresponded to higher Coh scores among the public, as indicated in the questionnaire. This observation suggests that perceiving a larger sky surface creates a sense of openness and facilitates public attention recovery, consistent with studies showcasing the stress-relieving properties of the Sky Element [61].
This study’s validated pathways reveal that increasing the perceived proportion of PE and EME significantly enhances physiological recovery, while reducing BAE perception leads to improved Coh scores. Psychological restoration shows optimal improvement when natural elements are emphasized while BAE presence is minimized. Notably, excessive water features adversely impact heart rate stabilization, whereas greater sky visibility positively influences Coh. Fundamentally, restoration efficacy derives from CNEE characteristics, with PE-rich environments, like forests and urban parks, demonstrating superior restorative outcomes compared to BAE-dominated spaces. Consequently, prioritizing natural elements—particularly vegetation—remains essential for maximizing environmental restoration benefits [54,56].

4.3. Urban Green Space Planning and Enhancement Strategies Based on Landscape Elements

Recreational forest environments, typically designed as forest parks and scenic areas abundant in natural plant resources and aesthetic appeal, necessitate careful consideration of the sky perception ratio along recreational routes to enhance public Coh scores and mitigate potential claustrophobia induced by a lack of natural light within densely wooded areas [62]. The research demonstrates that the restorative capacity of designed natural environments like urban parks rivals that of natural green spaces and, in some respects, even surpasses them. Given that urban parks are the most frequented green spaces by the public, it is crucial for urban park development to align visual perceptions closer to natural green spaces through strategic landscape design that emphasizes plant perception and judicious incorporation of water elements to enhance spatial interest [61]. However, excessive presence of water features or close proximity to water bodies may engender feelings of insecurity and psychological unease [60], with a corresponding decrease in heart rate calming efficacy as water body perception increases. Similarly to forest settings, wetland environments notably accessible to the public are typically realized as wetland parks, requiring careful attention to the distance between recreational paths and water bodies, safety measures in waterfront zones, and prioritization of Plant Element perception, including the introduction of water-dependent plant species. In contrast, enclosed and semi-enclosed spaces with high Artificial Element content, like street-side green spaces and residential green areas, underscore the significance of natural elements, such as Plant Elements. Research findings suggest that heightened perception of Plant Elements and Earth and Mountain Elements significantly bolsters environmental restoration. For instance, in street-side green spaces, aside from ensuring driver visibility, strategic placement of additional trees and shrubs for visual screening can reduce Building and Artificial Elements perception. In residential settings, optimizing Coh scores requires appropriate sky perception ratios, controlled building spacing, and enhanced perception of natural elements achieved through multi-layered vegetation structures and strategically placed rock formations in landscape design.

4.4. Limitations and Future Research Perspectives

While this study provides a robust analysis of the influence of landscape elements on public health through quantifying the semantic segmentation of various green spaces and investigating a range of physiological and psychological indicators related to public perception, several limitations should be acknowledged. The study’s participant cohort, while sizeable, was overrepresented by students, particularly landscape architecture students. Therefore, the homogeneity of participants (age 18–25, 77% landscape majors) limits extrapolation to older adults or non-student populations. Future research should prioritise more diverse demographic representation, with particular attention to controlling for professional backgrounds and occupational variables [63]. The existing literature suggests that age structure or gender differences may also lead to different health benefits from different urban green spaces [64,65]. Beyond controlling educational and professional factors, further investigation is warranted to examine whether these demographic characteristics produce differential outcomes. Specifically, research could explore whether age enhances the stress-reducing effects of Plant Elements (potentially showing greater benefits for elderly populations) or whether gender influences preferences for particular landscape features such as water elements. Regarding landscape composition, plant components encompass various types such as trees, shrubs, herbs, and flowers, their individual contributions remain unclear and merit specific examination. Furthermore, the current research focused primarily on urban green spaces, with only limited inclusion of blue-green spaces The comparative health impacts of these distinct environmental types require more systematic investigation. Emerging evidence indicates that the public responds differently to varying plant colours [45], highlighting another important dimension for future research. Subsequent studies should investigate how different Plant Elements and their chromatic characteristics interact to influence health outcomes, potentially informing more nuanced landscape design approaches.

5. Conclusions

This study provides theoretical foundations and practical guidance for urban green space development, augmentation, and management by semantically classifying various urban green space kinds and employing physiological, psychological, and attention recovery as indicators. The findings demonstrate that residential greenspaces and streetside greenspaces, which contain a greater percentage of artificial features, do not offer the same environmental restorative advantages as natural-dominated environments, like urban parks, which have a higher proportion of natural elements. In terms of spatial kind, artificially generated green spaces will likewise have good restorative advantages when their visual quality is comparable to that of natural green spaces. In terms of landscape composition metrics, naturalness and artificiality indices showed significant associations with coherence (Coh), while enclosure demonstrated no meaningful relationships with other measured indicators. The mediating effect and moderating effect tests revealed that PE was responsible for the restorative benefits of Contribution of Natural Element to Enclosure (CNEE) on heart rate (HR), Earth and Mountain Element (EME) for the restorative benefits on skin conductance (SC), and Building and Artificial Element (BAE) for the restorative benefits on Coh. The results further indicate that physiological benefits were maximized when participants perceived greater proportions of Plant Elements (PEs) and EMEs, a lower perceived proportion of BAE results in a higher Coh score for public attention recovery; a lower heart rate-calming ability is associated with a larger perceived proportion of water elements; and a higher Coh score is associated with a higher perceived proportion of Sky Element (SKE). While optimizing natural elements remains paramount for enhancing the pathways, influencing them to appear more complex with any landscape elements. This study examines the effects of various landscape elements on public health, adds to the body of knowledge regarding how the environment affects the public’s restorative benefits through vision, offers fresh perspectives on the relationship between people and the natural environment, and proposes new ideas for improving the restorative benefits of urban green spaces based on the results of various urban green spaces.

Author Contributions

Conceptualization, K.Y. and Z.Z.; methodology, K.Y.; software, M.W.; formal analysis, K.Y.; investigation, M.W. and X.S.; resources, Z.Z.; data curation, K.Y. and X.S.; writing—original draft preparation, K.Y. and X.S.; writing—review and editing, Z.Z.; visualization, K.Y.; supervision, project administration and funding acquisition, Z.Z. All authors have read and agreed to the published version of the manuscript.

Funding

This research was supported by the Yunnan Fundamental Research Projects (grant No. 202301AT070222) and the First-rate (A) Discipline Landscape Architecture Construction Funding of Yunnan Province, China.

Data Availability Statement

The data presented in this study are available from the corresponding author upon request due to the involvement of ongoing research.

Acknowledgments

Thanks to the EYESO ECGM3 system (Beijing, China) for technical support and all the volunteers who participated in the experiment. And thanks to the reviewers and editors for their contribution to this paper.

Conflicts of Interest

The authors declare no conflicts of interest.

Abbreviations

The following abbreviations are used in this manuscript:
STAIState of Anxiety InventoryTTension
POMSState of Mind ScaleIIrritability
PRSPerceived Restorative ScaleΔPRelative Changes in Psychological States
SBEScenic Beauty EstimationPEPlant Element
SDSemantic DifferentialWEWater Element
AHPAnalytical Hierarchy ProcessSKESky Element
FCNFully Convolutional NetworksEMEEarth and Mountain Element
PSPNetPyramid Scene Parsing NetworkBAEBuilding and Artificial Element
BBlank GroupRTERoads and Traffic Element
FForest GroupSEESpatial Enclosure Element
RResidential Green Space GroupCNEEContribution of Natural Element to Enclosure
SStreet Green Space GroupNINaturalness Index
UUrban Park GroupAIArtificiality Index
WWetland GroupEIEnclosure Index
HRHeart RateBe ABeing Away
SCSkin ConductanceFasFascination
EEGElectroencephalographyCohCoherence
CCalmnessCompCompatibility

Appendix A

Figure A1. Visual materials for the forest environment.
Forests 16 00648 g0a1
Figure A2. Visual materials for the residential green space environment.
Forests 16 00648 g0a2
Figure A3. Visual materials for the street green space environment.
Forests 16 00648 g0a3
Figure A4. Visual materials for the urban park environment.
Forests 16 00648 g0a4
Figure A5. Visual materials for the wetland environment.
Forests 16 00648 g0a5

Appendix B

Figure A6. Semantic segmentation results for the forest environment.
Forests 16 00648 g0a6
Figure A7. Semantic segmentation results for the residential green space environment.
Forests 16 00648 g0a7
Figure A8. Semantic segmentation results for the street green space environment.
Forests 16 00648 g0a8
Figure A9. Semantic segmentation results for the urban park environment.
Forests 16 00648 g0a9
Figure A10. Semantic segmentation results for the wetland environment.
Forests 16 00648 g0a10

Appendix C

Table A1. Intermediation effect hypothesis testing.
No.c Total Effecta (p)b (p)a × b Mediated Effect95% Boot CIc’ Direct EffectConclusion
Ha−0.028 *0.257 ***−0.075 ***−0.019−0.204–−0.068−0.009Fully intermediated
Hb10.077−0.535 ***−0.2500.134−1.571–1.952−0.143Intermediation not significant
Hb20.0770.095 ***0.9120.0870.017–0.209−0.143Fully intermediated
Hc1−2.437 *0.292 ***−1.177−0.344−0.148–0.094−2.435Intermediation not significant
Hc2−2.437 *−0.533 ***−1.9441.036−2.185–2.467−2.435Intermediation not significant
Hc3−2.437 *0.096 ***−7.226−0.694−0.239–0.116−2.435Intermediation not significant
Hd11.176 ***0.257 ***1.4130.364−0.002–0.184−9.792Intermediation not significant
Hd21.176 ***0.095 ***−0.745−0.071−0.198–0.162−9.792Intermediation not significant
Hd31.176 ***−0.535 ***−19.972 *10.6750.253–4.589−9.792Fully intermediated
Notes. *: p < 0.05; ***: p < 0.001. In this study, if a and b are significant, c is not significant, or if at least one of a and b was not significantly significant, c was not significant and the 95% boot CI did not contain zero, then it is fully intermediated.

References

  1. Gascon, M.; Triguero-Mas, M.; Martínez, D.; Dadvand, P.; Rojas-Rueda, D.; Plasència, A.; Nieuwenhuijsen, M.J. Residential green spaces and mortality: A systematic review. Environ. Int. 2016, 86, 60–67. [Google Scholar] [CrossRef]
  2. Van den Bosch, M.; Sang, Å.O. Urban natural environments as nature-based solutions for improved public health—A systematic review of reviews. Environ. Res. 2017, 158, 373–384. [Google Scholar] [CrossRef] [PubMed]
  3. Van den Berg, M.; Wendel-Vos, W.; van Poppel, M.; Kemper, H.; van Mechelen, W.; Maas, J. Health benefits of green spaces in the living environment: A systematic review of epidemiological studies. Urban For. Urban Green. 2015, 14, 806–816. [Google Scholar] [CrossRef]
  4. Ulrich, R.S. View through a window may influence recovery from surgery. Science 1984, 224, 420–421. [Google Scholar] [CrossRef] [PubMed]
  5. Maas, J.; Verheij, R.A.; Groenewegen, P.P.; De Vries, S.; Spreeuwenberg, P. Green space, urbanity, and health: How strong is the relation? J. Epidemiol. Community Health 2006, 60, 587–592. [Google Scholar] [CrossRef]
  6. Barton, J.; Pretty, J. What is the best dose of nature and green exercise for improving mental health? A multi-study analysis. Environ. Sci. Technol. 2010, 44, 3947–3955. [Google Scholar] [CrossRef]
  7. Orban, E.; Sutcliffe, R.; Dragano, N.; Jöckel, K.-H.; Moebus, S. Residential surrounding greenness, self-rated health and interrelations with aspects of neighborhood environment and social relations. J. Urban Health 2017, 94, 158–169. [Google Scholar] [CrossRef]
  8. Kalevi, K.; Matti, Y.; Liisa, T.; Harri, S. Determinants of restorative experiences in everyday favorite places. Health Place 2008, 14, 636–652. [Google Scholar]
  9. Van den Berg, A.E.; Jorgensen, A.; Wilson, E.R. Evaluating restoration in urban green spaces: Does setting type make a difference? Landsc. Urban Plan. 2014, 127, 173–181. [Google Scholar] [CrossRef]
  10. Hartig, T.; Mang, M.; Evans, G.W. Restorative effects of natural environment experiences. Environ. Behav. 1991, 23, 3–26. [Google Scholar] [CrossRef]
  11. Xi, W.; Yanlong, Z.H.; Zhao, R.; Niu, L. Study on the Effects of Four Campus GreenLandscapes on College Students‘ Physiologicaland Psychological Indicators. Chin. Landsc. Archit. 2020, 36, 92–97. [Google Scholar] [CrossRef]
  12. Gao, Y.; Huang, H.; Ye, J.; Li, Z.; Zheng, Y. Influence of Landscape Naturalness Degree in Campus Green Spaceson Human Physiological and Psychological Indicators. J. Chin. Urban For. 2022, 20, 103–109. [Google Scholar]
  13. Lai, K.Y.; Sarkar, C.; Sun, Z.; Scott, I. Are greenspace attributes associated with perceived restorativeness? A comparative study of urban cemeteries and parks in Edinburgh, Scotland. Urban For. Urban Green. 2020, 53, 126720. [Google Scholar] [CrossRef]
  14. Huang, C.; Chang, C.; Chang, W. A Study of Human’s Relax Affection in Different Natural Landscape Photos—Evidences from Neuroscience. Data Res. 2019, 3, 13. [Google Scholar] [CrossRef]
  15. Wang, Y.; Xu, M. Electroencephalogram application for the analysis of stress relief in the seasonal landscape. Int. J. Environ. Res. Public Health 2021, 18, 8522. [Google Scholar] [CrossRef]
  16. Mackay, G.J.; Neill, J.T. The effect of “green exercise” on state anxiety and the role of exercise duration, intensity, and greenness: A quasi-experimental study. Psychol. Sport Exerc. 2010, 11, 238–245. [Google Scholar] [CrossRef]
  17. Ryan, R.M.; Weinstein, N.; Bernstein, J.; Brown, K.W.; Mistretta, L.; Gagné, M. Vitalizing effects of being outdoors and in nature. J. Environ. Psychol. 2010, 30, 159–168. [Google Scholar] [CrossRef]
  18. Berman, M.G.; Jonides, J.; Kaplan, S. The cognitive benefits of interacting with nature. Psychol. Sci. 2008, 19, 1207–1212. [Google Scholar] [CrossRef]
  19. Wang, X.; Rodiek, S.; Wu, C.; Chen, Y.; Li, Y. Stress recovery and restorative effects of viewing different urban park scenes in Shanghai, China. Urban For. Urban Green. 2016, 15, 112–122. [Google Scholar] [CrossRef]
  20. Jiang, M.; Hassan, A.; Chen, Q.; Liu, Y. Effects of different landscape visual stimuli on psychophysiological responses in Chinese students. Indoor Built Environ. 2020, 29, 1006–1016. [Google Scholar] [CrossRef]
  21. Huang, Y.; Fu, W.; Weng, Y.; Wang, M. A Study on the Relationship between Individual Landscape Preference, Perceived Restorativeness Scale and Health Benefits Assessment of Urban Forest Pathway—A Case Study of Fudao. Chin. Landsc. Archit. 2020, 36, 73–78. [Google Scholar] [CrossRef]
  22. Sun, Y.; Wang, X.; Zhu, J.; Chen, L.; Jia, Y.; Lawrence, J.M.; Jiang, L.-H.; Xie, X.; Wu, J. Using machine learning to examine street green space types at a high spatial resolution: Application in Los Angeles County on socioeconomic disparities in exposure. Sci. Total Environ. 2021, 787, 147653. [Google Scholar] [PubMed]
  23. Reyes-Riveros, R.; Altamirano, A.; De La Barrera, F.; Rozas-Vásquez, D.; Vieli, L.; Meli, P. Linking public urban green spaces and human well-being: A systematic review. Urban For. Urban Green. 2021, 61, 127105. [Google Scholar] [CrossRef]
  24. Wood, L.; Hooper, P.; Foster, S.; Bull, F. Public green spaces and positive mental health–investigating the relationship between access, quantity and types of parks and mental wellbeing. Health Place 2017, 48, 63–71. [Google Scholar] [CrossRef]
  25. Zhu, S.-X.; Hu, F.-F.; He, S.-Y.; Qiu, Q.; Su, Y.; He, Q.; Li, J.-Y. Comprehensive evaluation of healthcare benefits of different forest types: A case study in Shimen National Forest Park, China. Forests 2021, 12, 207. [Google Scholar] [CrossRef]
  26. Yang, C.; Tan, S.; Chen, L.; Hu, Y. An ESs-based perspective of urban natural health benefits: Service efficacy, cascadinglogic and assessment framework. Chin. Landsc. Archit. 2022, 38, 97. [Google Scholar]
  27. Qi, T.; Zhang, G.; Wang, Y.; Liu, C.; Li, X. Research on landscape quality of country parks in Beijing as based on visual and audible senses. Urban For. Urban Green. 2017, 26, 124–138. [Google Scholar] [CrossRef]
  28. Sang, K.; Fontana, G.L.; Piovan, S.E. Assessing railway landscape by AHP process with GIS: A study of the yunnan-vietnam railway. Remote Sens. 2022, 14, 603. [Google Scholar] [CrossRef]
  29. Sheng, K.; Liu, L.; Wang, F.; Li, S.; Zhou, X. An Eye-Tracking Study on Exploring Children’s Visual Attention to Streetscape Elements. Buildings 2025, 15, 605. [Google Scholar] [CrossRef]
  30. Zhang, D.; Chen, H.; Zhang, X.; Tan, L. Evaluation of Landscapes and Soundscapes in Traditional Villages in the Hakka Region of Guangdong Province Based on Audio-Visual Interactions. Buildings 2025, 15, 259. [Google Scholar] [CrossRef]
  31. Kittler, J.; Illingworth, J. Minimum error thresholding. Pattern Recognit. 1986, 19, 41–47. [Google Scholar] [CrossRef]
  32. Li, E.-S.; Zhu, S.-L.; Zhu, B.-S.; Zhao, Y.; Xia, C.-G.; Song, L.-H. An adaptive edge-detection method based on the canny operator. In Proceedings of the 2009 International Conference on Environmental Science and Information Application Technology, Wuhan, China, 4–5 July 2009; pp. 465–469. [Google Scholar]
  33. Tremeau, A.; Borel, N. A region growing and merging algorithm to color segmentation. Pattern Recognit. 1997, 30, 1191–1203. [Google Scholar]
  34. Long, J.; Shelhamer, E.; Darrell, T. Fully convolutional networks for semantic segmentation. In Proceedings of the IEEE Conference on Computer Vision and Pattern Recognition, Boston, MA, USA, 7–12 June 2015; pp. 3431–3440. [Google Scholar]
  35. Liang-Chieh, C.; Papandreou, G.; Kokkinos, I.; Murphy, K.; Yuille, A. Semantic image segmentation with deep convolutional nets and fully connected CRFS. In Proceedings of the International Conference on Learning Representations, San Diego, CA, USA, 7–9 May 2015. [Google Scholar]
  36. Zhao, H.; Shi, J.; Qi, X.; Wang, X.; Jia, J. Pyramid scene parsing network. In Proceedings of the IEEE Conference on Computer Vision and Pattern Recognition, Honolulu, HI, USA, 21–26 July 2017; pp. 2881–2890. [Google Scholar]
  37. Hu, A.; Yabuki, N.; Fukuda, T.; Kaga, H.; Takeda, S.; Matsuo, K. Harnessing multiple data sources and emerging technologies for comprehensive urban green space evaluation. Cities 2023, 143, 104562. [Google Scholar]
  38. Party History Research Office of the Communist Party of China Kunming Municipal Committee; Office of Kunming Municipal Local Chronicles Compilation Committee. Kunming Nianjian 2023; The Nationalities Publishing House of Yunnan: Kunming, China, 2024. [Google Scholar]
  39. Huang, S.; Zhneg, Y.; Cheng, L.; Ji, C.; Wang, S.; Dong, J. The impact mechanism of urban park health benefit evaluationbased on landscape preference. J. Nanjing For. Univ. (Nat. Sci. Ed.) 2022, 46, 221. [Google Scholar]
  40. Fu, H.; Guan, J.; Zhong, Q.; Fu, L.; Jian, Y.; Li, J. Landscape Elements, ecosystem services and users’ Happiness: An indicator framework for park management based on cognitive appraisal theory. Ecol. Indic. 2024, 165, 112209. [Google Scholar] [CrossRef]
  41. Zou, J.; Jiang, H.; Ying, W.; Qiu, B. Scenic Influences on Walking Preferences in Urban Forest Parks from Top-View and Eye-Level Perspectives. Forests 2024, 15, 2020. [Google Scholar] [CrossRef]
  42. Zhang, J.; Zhang, X.; Yuan, Y.; Zhu, L. Landscape Evaluation of Different Types of Streets Based on Street View Images. J. Shandong For. Sci. Technol. 2021, 51, 53–60. [Google Scholar]
  43. Li, Z.; Kang, J. Sensitivity analysis of changes in human physiological indicators observed in soundscapes. Landsc. Urban Plan. 2019, 190, 103593. [Google Scholar]
  44. Yi, K.; Zhang, J.; Zhang, Z.; Shi, X.; Du, W.; Yang, L.; Wei, M. Differences in Public Perceptions of Recovery in Different Urban Forests Based on Birdsong. Forests 2024, 15, 2217. [Google Scholar] [CrossRef]
  45. Zhang, Z. Public Response to Characteristics of Forest Color and Its Influence: A Case Study of Forest in Autumn of Jiuzhai Valley, Sichuan Province. Ph.D. Thesis, Chinese Academy of Forestry, Beijing, China, 2017. [Google Scholar]
  46. Kaplan, S. The restorative benefits of nature: Toward an integrative framework. J. Environ. Psychol. 1995, 15, 169–182. [Google Scholar]
  47. Rennit, P.; Maikov, K. Perceived restoration scale method turned into (used as the) evaluation tool for parks and open green spaces, using Tartu city parks as an example. City Territ. Archit. 2015, 2, 6. [Google Scholar]
  48. Huang, S.; Qi, J.; Li, W.; Dong, J.; van den Bosch, C.K. The Contribution to Stress Recovery and Attention Restoration Potential of Exposure to Urban Green Spaces in Low-Density Residential Areas. Int. J. Environ. Res. Public Health 2021, 18, 8713. [Google Scholar] [CrossRef] [PubMed]
  49. Dupont, L.; Ooms, K.; Antrop, M.; Eetvelde, V.V. Comparing saliency maps and eye-tracking focus maps: The potential use in visual impact assessment based on landscape photographs. Landsc. Urban Plan. 2016, 148, 17–26. [Google Scholar]
  50. Boya, Y.; Jie, B.; Linjie, W.; Yuying, C. Psychophysiological Impacts of Traffic Sounds in Urban Green Spaces. Forests 2022, 13, 960. [Google Scholar] [CrossRef]
  51. Peng, W.; Youjun, H.; Wenjuan, Y.; Nan, L.; Jiaojiao, C. Effects of Soundscapes on Human Physiology and Psychology in Qianjiangyuan National Park System Pilot Area in China. Forests 2022, 13, 1461. [Google Scholar] [CrossRef]
  52. Shi, H.; Luo, H.; Wei, Y.; Shin, W.-S. The influence of different forest landscapes on physiological and psychological recovery. Forests 2024, 15, 498. [Google Scholar] [CrossRef]
  53. Williamson, I.; Wildbur, D.; Bell, K.; Tanner, J.; Matthews, H. Benefits to university students through volunteering in a health context: A new model. Br. J. Educ. Stud. 2018, 66, 383–402. [Google Scholar]
  54. Calogiuri, G.; Evensen, K.; Weydahl, A.; Andersson, K.; Patil, G.; Ihlebæk, C.; Raanaas, R.K. Green exercise as a workplace intervention to reduce job stress. Results from a pilot study. Work 2015, 53, 99–111. [Google Scholar]
  55. Liu, B.; Lian, Z.; Brown, R.D. Effect of Landscape Microclimates on Thermal Comfort and Physiological Wellbeing. Sustainability 2019, 11, 5387. [Google Scholar] [CrossRef]
  56. Shen, H.; He, X.; He, J.; Li, D.; Liang, M.; Xie, X. Back to the village: Assessing the effects of naturalness, landscape types, and landscape elements on the restorative potential of rural landscapes. Land 2024, 13, 910. [Google Scholar] [CrossRef]
  57. Zhao, W.; Li, X.; Zhu, X.; Ye, H.; Xu, H. Restorative properties of green sheltered spaces and their morphological characteristics in urban parks. Urban For. Urban Green. 2023, 86, 127986. [Google Scholar]
  58. Picavet, H.S.J.; Milder, I.; Kruize, H.; De Vries, S.; Hermans, T.; Wendel-Vos, W. Greener living environment healthier people?: Exploring green space, physical activity and health in the Doetinchem Cohort Study. Prev. Med. 2016, 89, 7–14. [Google Scholar] [PubMed]
  59. Chen, Z.; Zhai, X.Q.; Ye, S.Y.; Zhang, Y.; Yu, J. A Meta-analysis of Restorative Nature Landscapes and Mental Health Benefits on Urban Residentsand Its Planning Implication. Urban Plan. Int. 2016, 31, 16–26. [Google Scholar]
  60. Xiaoyue, Z. Research on the Influence of Types and Features of Blue-Green Space on Pressure Recovery. Master’s Thesis, Harbin Institute of Technology, Harbin, China, 2019. [Google Scholar]
  61. Zhu, J.; Lin, X.; Shao, H.; Li, W.; Dong, J.; Zheng, Y. Research on the lmpact of Forest Park Landscape Elements on Health Benefits Based on Multi-source Data. J. Northwest For. Univ. 2024, 41, 634–643. Available online: https://zlxb.zafu.edu.cn/cn/article/doi/10.11833/j.issn.2095-0756.20230534 (accessed on 27 December 2024).
  62. Francová, A.; Jablonská, M.; Fajnerová, I. Design and evaluation of virtual reality environments for claustrophobia. PRESENCE Virtual Augment. Real. 2023, 32, 23–34. [Google Scholar]
  63. Johnson, T.; Burgoyne, A.P.; Mix, K.S.; Young, C.J.; Levine, S.C. Spatial and mathematics skills: Similarities and differences related to age, SES, and gender. Cognition 2022, 218, 104918. [Google Scholar]
  64. Jiang, S.; Liu, J. Comparative Study of Cultural Landscape Perception in Historic Districts from the Perspectives of Tourists and Residents. Land 2024, 13, 353. [Google Scholar] [CrossRef]
  65. Poderoso, R.A.; Peroni, N.; Hanazaki, N. Gender influences in the perception and use of the landscape in a rural community of German immigrant descendants in Brazil. J. Ethnobiol. 2017, 37, 779–797. [Google Scholar]
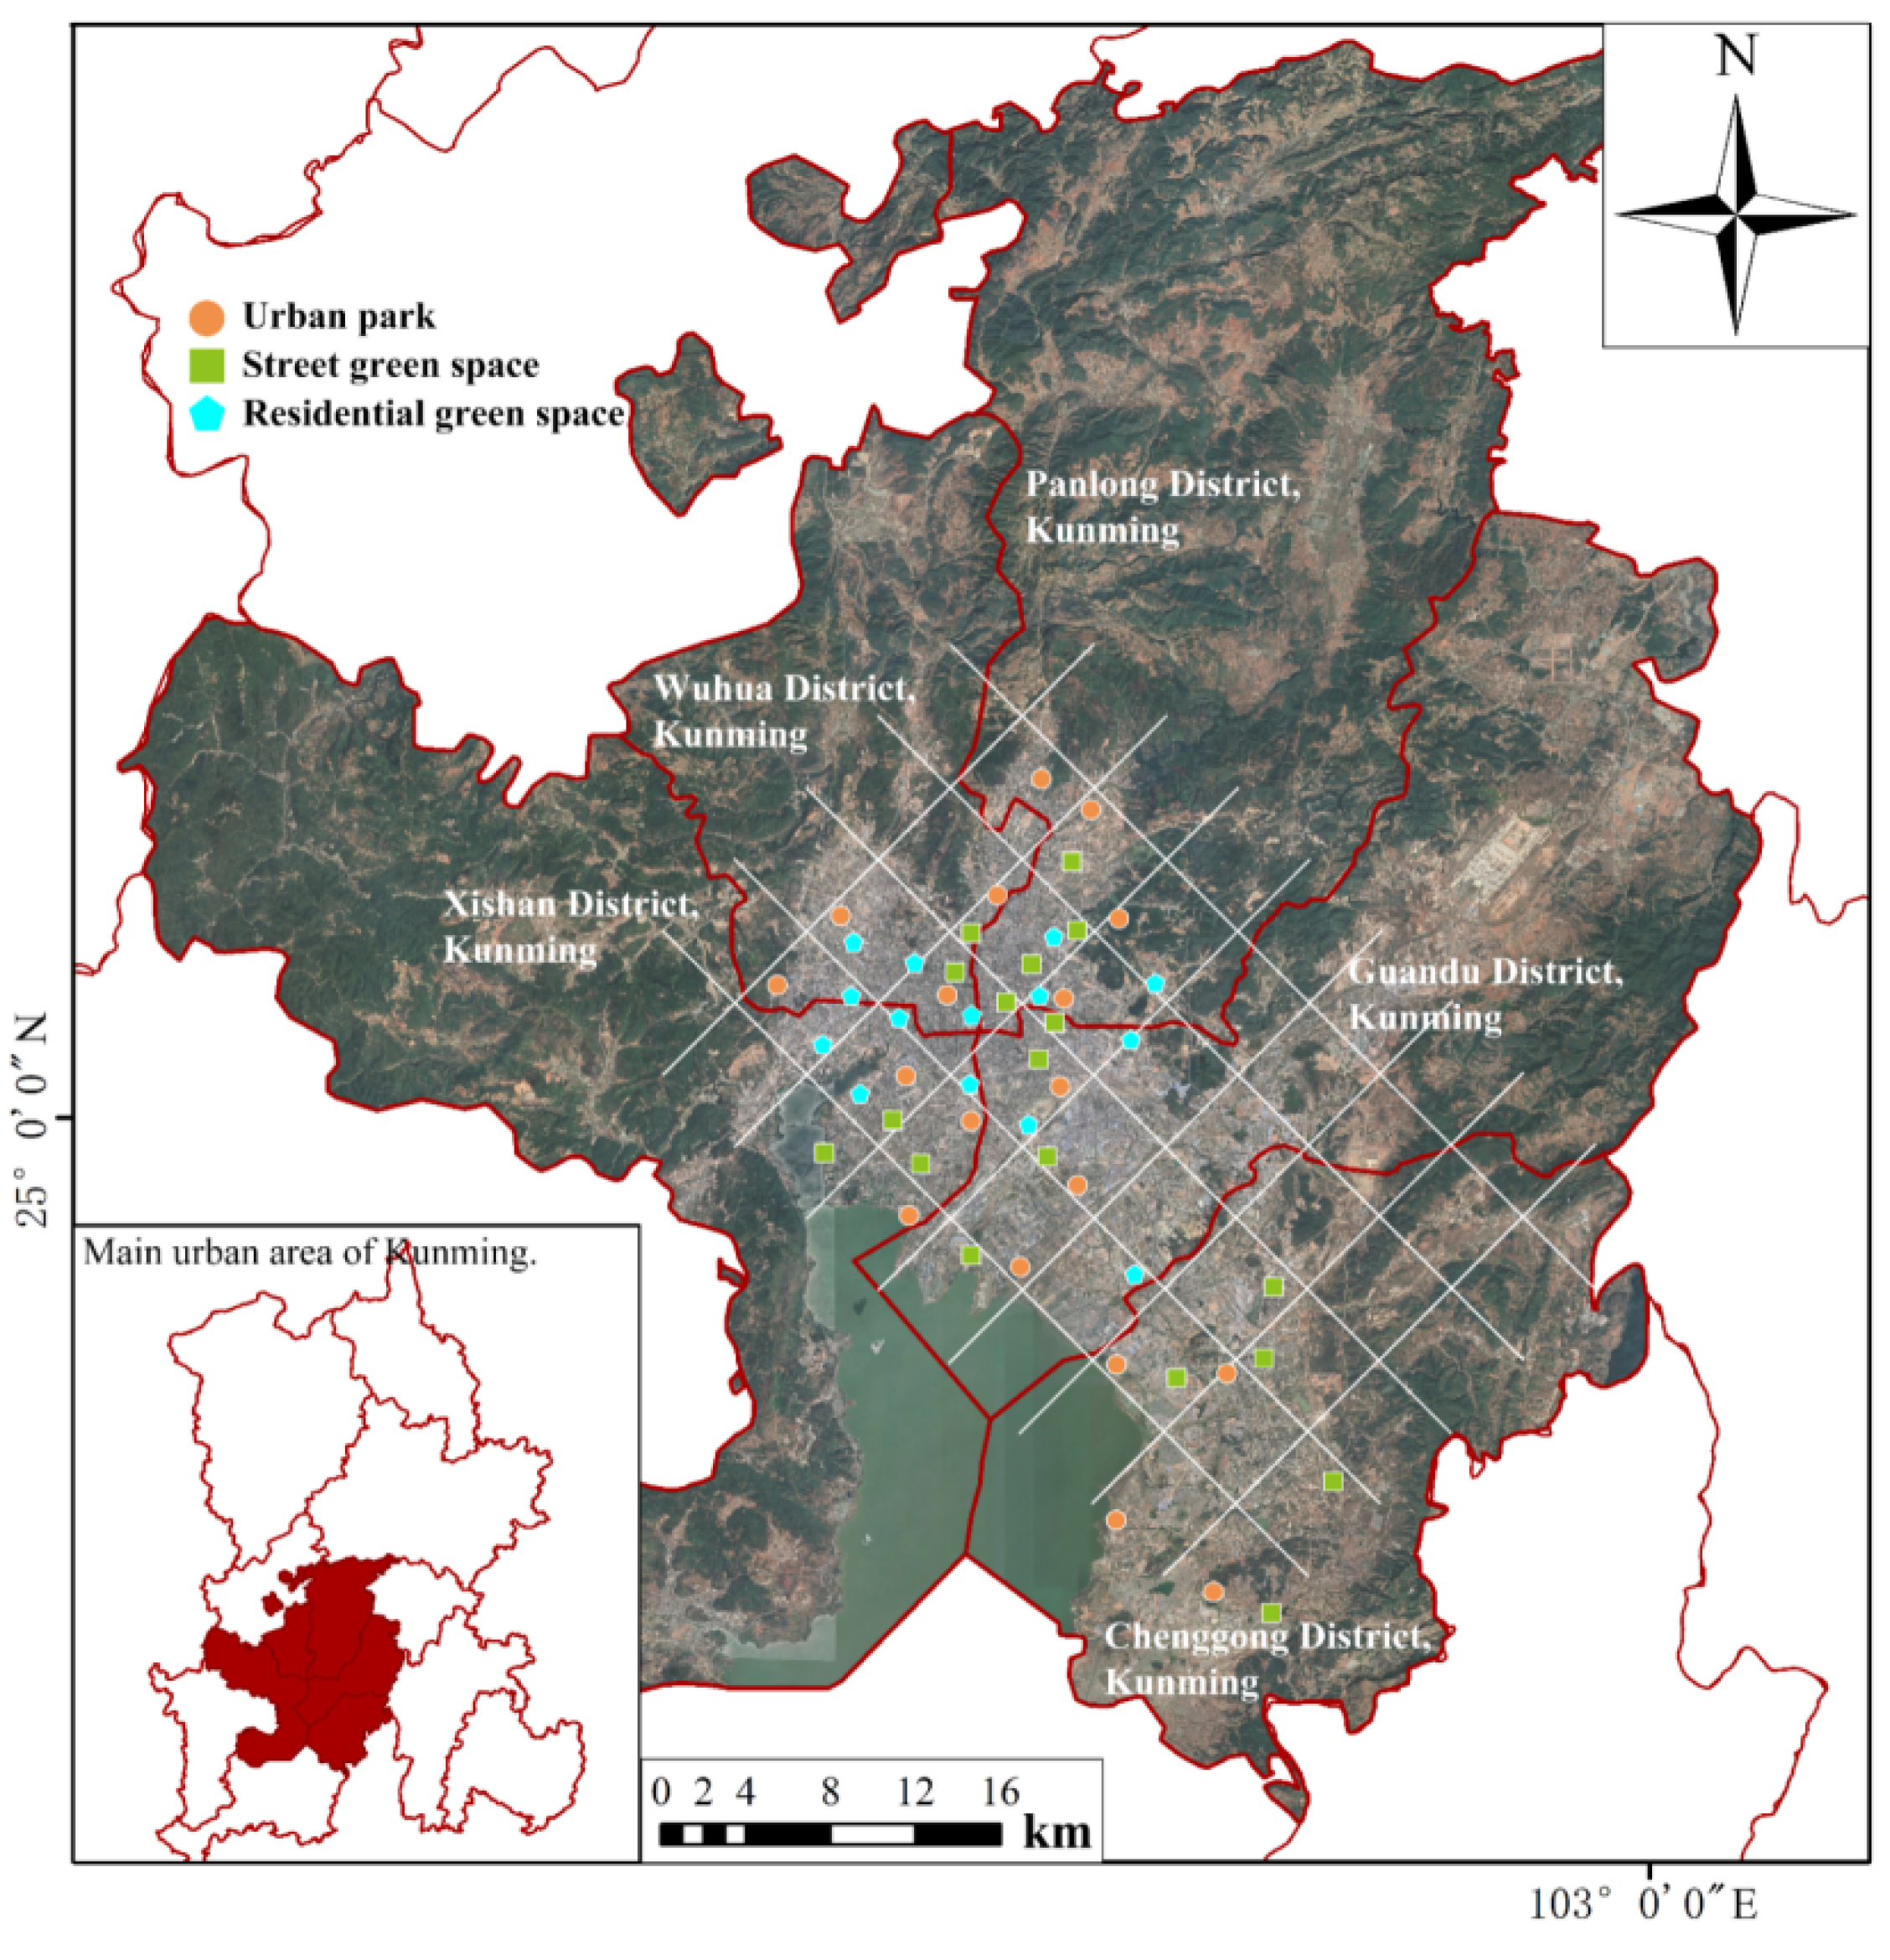
Figure 1. Diagram showing the location of Kunming’s major urban area and the study sample locations; the orange oval represents the parks, and the numbers match the parks’ serial numbers in Table 1. Map source: OSM (https://www.openstreetmap.org/, accessed on 12 March 2023); review number: GS (2024)0650.
Forests 16 00648 g001
Figure 2. Schematic diagram of semantic segmentation process.
Forests 16 00648 g002
Figure 3. Psychological State and PRS Scale. Notes: The colours in the table do not have any special meaning and are only used to differentiate the data.
Forests 16 00648 g003
Figure 4. Schematic diagram of the experimental process.
Forests 16 00648 g004
Figure 5. Post hoc tests of the benefits of different types of green space on physiological indicators: (a) ΔHR, (b) ΔSC. Notes. *: p < 0.05, **: p < 0.01, ***: p < 0.001, blank control (B), forest environment (F), residential green space (R), street green space (S), urban park (U), and wetland environment (W).
Forests 16 00648 g005
Figure 6. Post hoc tests of the benefits of different types of green space on psychological indicators. Notes. blank control (B), forest environment (F), residential green space (R), street green space (S), urban park (U), and wetland environment (W). Notes: ***: p < 0.001.
Forests 16 00648 g006
Figure 7. Results of correlation analysis between different landscape elements and public perception responses. *: p < 0.05; **: p < 0.01; ***: p < 0.001.
Forests 16 00648 g007
Figure 8. Results of the mediated path test. Green represents full mediation, and orange represents insignificant mediation effects. * p < 0.05, *** p < 0.001.
Forests 16 00648 g008
Figure 9. Simple slope plots of moderating effects: (a) moderating variable is WE; (b) moderating variable is SKE.
Forests 16 00648 g009
Table 1. Selection of indicators for landscape elements.
Landscape Element IndexType of Landscape ElementElement
IndexCalculation MethodTypeCalculation Method
Naturalness Index (NI)Sum of PE, WE, SKE and EME in the environment.Plant Element (PE)Sum of the percentage of Tree, Shrub, Grass, and Flower in the environment.Tree
Shrub
Grass
Flower
Water Element (WE)Percentage of Water in the environment.Water (including lakes, rivers, etc.)
Sky Element (SKE)Percentage of Sky in the environment.Sky
Earth and Mountain Element (EME)Sum of the percentage of Earth, Mountain, and Rock in the environment.Mountain
Earth
Rock
Artificiality Index (AI)Sum of BAE and RTE in the environment.Building and Artificial Element (BAE)Sum of the percentage of Building, Wall, Fence, Signboard, Trash and Landscape Seats in the environment.Building
Wall
Fence
Signboard
Trash
Landscape Seats
Lamp
Roads and Traffic Element (RTE)Sum of the percentage of Road, Sidewalk, Car, Bridge and Boat in the environment.Road
Sidewalk
Car
Bridge
Boat
Enclosure Index (EI)EI equals SEE of the environment.Spatial Enclosure Element (SEE)Sum of the percentage of Tree, Mountain, Building, Wall and Fence in the environment.-
Contribution of Natural Element to Enclosure (CNEE)The contribution of the Tree and Mountain in SEE.-
Table 2. Semantic segmentation results for different landscape types. Notes: The abbreviations of column headers are provided in Table 1. F: forest environment, R: residential green space environment, S: street green space environment, U: urban park environment, W: wetland environment.
PEWESKEEMEBAERTESEECNEENIAIEI
F74.16%0.00%11.41%5.46%2.00%7.08%56.75%96.48%91.03%9.08%56.75%
R64.24%1.65%4.49%0.00%19.33%10.27%56.97%66.08%70.39%29.60%56.97%
S57.16%0.00%11.75%0.17%17.94%12.97%51.10%64.89%69.08%30.91%51.10%
U76.74%1.37%14.10%0.82%3.36%3.58%61.59%95.37%93.03%6.94%61.59%
W48.21%19.99%23.30%1.93%3.32%3.23%43.40%92.35%93.44%6.55%43.40%
Table 3. Differences in the relative change rates of public physiological health indicators in different environments.
Environment Groups (Mean ± SD)Fp
BFRSUW
ΔHR0.073 ± 0.147−0.013 ± 0.037−0.004 ± 0.0230.012 ± 0.025−0.008 ± 0.0530.010 ± 0.0673.7940.004 **
ΔSC−0.058 ± 0.1540.068 ± 0.1320.030 ± 0.1420.010 ± 0.1310.079 ± 0.1290.054 ± 0.1283.8630.002 **
Notes. **: p < 0.01, blank control (B), forest environment (F), residential green space (R), street green space (S), urban park (U), and wetland environment (W).
Table 4. Differences in the relative change rates of public psychology indicators in different urban forest environments.
Environment Groups (Mean ± SD)Fp
BFRSUW
ΔC−0.200 ± 0.9611.000 ± 1.1140.733 ± 0.9800.700 ± 0.8370.900 ± 0.9950.800 ± 0.0675.6200.000 ***
ΔT0.767 ± 1.654−2.800 ± 2.203−1.700 ± 2.395−1.567 ± 1.675−2.367 ± 2.428−2.167 ± 2.39410.3130.000 ***
ΔI0.633 ± 1.884−2.500 ± 2.047−1.467 ± 2.315−1.300 ± 1.622−2.233 ± 2.161−1.667 ± 3.4179.2910.000 ***
ΔP0.610 ± 1.415−2.399 ± 1.732−1.484 ± 1.906−1.357 ± 1.342−2.093 ± 1.964−1.765 ± 2.26014.0550.000 ***
Notes. ***: p < 0.001, blank control (B), forest environment (F), residential green space (R), street green space (S), urban park (U), and wetland environment (W).
Table 5. Differences in environmental effects on attention recovery in different urban green spaces.
Environment Groups (Mean ± SD)Fp
FRSUW
Be A0.59 ± 0.590.45 ± 0.710.41 ± 0.510.53 ± 0.650.49 ± 0.720.3930.814
Fas0.59 ± 0.590.38 ± 0.590.48 ± 0.450.61 ± 0.630.52 ± 0.680.7080.588
Coh0.42 ± 0.80−0.16 ± 0.730.13 ± 0.590.33 ± 0.770.22 ± 0.792.7160.032 *
Comp0.47 ± 0.850.33 ± 0.830.30 ± 0.680.41 ± 0.950.39 ± 1.070.1710.953
Notes. *: p < 0.05, forest environment (F), residential green space (R), street green space (S), urban park (U), and wetland environment (W).
Table 6. Pathway hypotheses for the impact of landscape elements on public health.
Number (No.)Impact PathNumber (No.)Impact Path
HaCNEE→PE→ΔHRHc3CNEE→BAE→ΔP
Hb1CNEE→BAE→ΔSCHd1CNEE→PE→Coh
Hb2CNEE→EME→ΔSCHd2CNEE→EME→Coh
Hc1CNEE→PE→ΔPHd3CNEE→BAE→Coh
Hc2CNEE→EME→ΔP--
Table 7. Moderating effect hypothesis testing.
Model 1Model 2Model 3
Beta (SE)t (p)Beta (SE)t (p)Beta (SE)t (p)
X: CNEE
Y: ΔHR
M: WE
const0.000 (0.002)0.0000.000(0.002)0.000−0.013(0.004)−3.150 ***
CNEE−0.028(0.012)−2.311 *−0.043(0.012)−3.581 ***0.104(0.045)2.316 *
WE 0.091(0.022)4.052 ***−0.263(0.107)−2.471 *
CNEE × WE 3.833(1.129)3.395 ***
F, ΔFF = 5.341 *, ΔF = 5.431 *F = 11.158 ***, ΔF = 16.419 ***F = 11.813 ***, ΔF = 11.526 **
X: CNEE
Y: Coh
M: WE
const0.192 (0.048)4.009 ***0.192(0.048)4.009 ***−0.034(0.127)−0.269
CNEE1.176(0.332)3.541 **1.288(0.350)3.681 ***3.759(1.335)2.815 **
WE −0.661(0.652)−1.014−6.624(3.178)−2.084 *
CNEE × WE 64.490(33.652)1.916
F, ΔFF = 12.541 **, ΔF = 12.541 **F = 6.785 **, ΔF = 1.082F = 5.830 **, ΔF= 3.672
X: CNEE
Y: Coh
M: SKE
const0.192(0.048)4.009 ***0.192(0.048)3.995 ***0.298(0.067)4.473 ***
CNEE1.176(0.332)3.541 **1.140(0.411)2.776 **0.595(0.471)1.263
SKE 0.147(0.975)0.1510.651(0.987)0.660
CNEE × SKE −20.815(9.187)−2.266 *
F, ΔFF = 12.541 **, ΔF = 12.541 **F = 6.240 **, ΔF = 0.023F = 5.988 **, ΔF = 5.133 *
Notes. X denotes the independent variable, Y denotes the dependent variable, and M denotes the moderator variable. *: p < 0.05; **: p < 0.01; ***: p < 0.001. If the intersection shows significance, it proves that there is a moderating effect.
Disclaimer/Publisher’s Note: The statements, opinions and data contained in all publications are solely those of the individual author(s) and contributor(s) and not of MDPI and/or the editor(s). MDPI and/or the editor(s) disclaim responsibility for any injury to people or property resulting from any ideas, methods, instructions or products referred to in the content.