Abstract
Analyzing the soil carbon, nitrogen, and phosphorus content, along with their stoichiometric ratios across different urban-rural gradients, can offer essential insights into enhancing soil quality and the sustainable management of urban green space ecosystems. This study focused on Nanchang, China, examining two typical urban forest types (Pinus massoniana forests and Camphora officinarum forests), two typical urban wetlands types (river wetlands and pond wetlands), as well as urban natural and artificial grasslands. It analyzed the distribution characteristics of organic carbon (SOC), total nitrogen (TN), total phosphorus (TP), and their stoichiometric ratios along the “urban-suburban-rural” gradients in surface (0–20 cm) and deep (20–40 cm) soil. The results indicated that in the deep soil of Pinus massoniana forests, rural areas exhibited significantly higher SOC content compared to suburban areas. In the surface soil of Camphora officinarum forests, the TN content and N:P were significantly greater in urban areas compared to rural areas (p < 0.05). Both soil layers in river wetlands showed significantly higher soil TN levels in urban areas compared to rural areas. Additionally, in the deep soil of pond wetlands, urban areas showed significantly greater TN content, C:P, and N:P, compared to rural areas (p < 0.05). For natural grasslands, soil C:N was significantly more in suburban and rural areas than in urban areas for both soil layers. In artificial grasslands, the SOC content in deep soil was significantly greater in rural areas compared to urban areas (p < 0.05). In the deep soil of suburban areas, soil TP content in Camphora officinarum forests was highly significantly greater than that in Pinus massoniana forests (p < 0.01). The SOC, TN content, and C:P were considerably higher in pond wetlands compared to river wetlands (p < 0.05). The SOC content of natural grasslands was significantly higher compared to artificial grasslands (p < 0.05). Nitrate nitrogen was highly significantly and positively correlated with soil N:P in the deep soil of Pinus massoniana forests (p < 0.01), and soil pH was highly significantly and negatively correlated with soil N:P in the surface soil of pond wetlands (p < 0.01). The urbanization process has altered the SOC, TN, and TP nutrient status to some extent, exacerbating the imbalance of nutrient elements in green space soils along the “urban-suburban-rural” gradients.
1. Introduction
Urban green spaces, an influential part of global ecosystems, fulfill a vital role in improving air quality, enhancing the urban climate, and safeguarding biodiversity [1,2]. The growth and development of plants are indispensable from soil, with soil nutrient patterns directly affecting stabilization of urban green space ecosystems. While plants absorb nutrients from the soil, microbial decomposition processes return nutrients, such as organic matter, to the soil, forming a biological micro-cycle system. This process is crucial for the sustainable development of ecological service in urban green space [3,4]. Ecological stoichiometry is a fundamental theory that examines the concentrations of various elements (mainly SOC, TN, and TP) within biological systems and their material cycles, reflecting the dynamic balance among these elements [5]. The elements of SOC, TN, and TP are closely interrelated, and their stoichiometric characteristics are crucial for vegetation growth and soil nutrient cycling [6].
Urban soil is a vital component of urban green space ecosystems, essential for supplying the nutrients necessary for plant growth and for absorbing and processing urban waste materials [7]. However, environmental pressures brought about by urbanization and human activities have altered the physicochemical properties of urban soils, disrupting the balance of soil nutrients [8,9]. Previous studies have shown that urbanization can both reduce SOC and increase SOC storage [10,11]. Forest soils in urban areas have higher nitrogen availability, and nitrogen deposition significantly accelerates soil acidification in urbanized environments [12,13]. Urbanization may also promote the additional input of phosphorus into soils, leading to increased phosphorus saturation and reduced phosphorus adsorption capacity [14]. Compared to non-urban soils, the low SOC and high TN and TP contents lead to lower C:N, C:P, and N:P in urban soils, severely disrupting the balance of SOC, TN, and TP content [15].
Urban expansion typically radiates from the central urban areas, forming a distinct “urban-suburban-rural” gradient. Understanding the characteristics of SOC, TN, and TP, as well as their stoichiometric relationships across different gradients in urban green spaces, is crucial for studying soil nutrient availability and nutrient balance during rapid urbanization [15]. Urban green spaces typically include urban forests, urban wetlands, and urban grasslands [16]. Regarding urban forests, Cusack’s research found that urban forests have lower soil carbon-to-nitrogen ratios and lower concentrations of nitrate and ammonium nitrogen compared to rural forests. Intense human activities during urbanization have altered the rate of forest soil carbon conversion, consequently affecting the soil organic carbon cycle [17]. Chen et al.’s study on the phosphorus concentration in the topsoil of five forest types throughout the “urban-suburban-rural” gradients in Nanchang, China, demonstrated that the TP content in soils from urban areas is markedly higher than in soils from suburban and rural areas [18]. Furthermore, due to their abundant moisture, urban wetlands may have different soil nutrient distribution and dynamics compared to urban forests, while urban grasslands, which typically accumulate less organic matter, may exhibit different patterns of soil nutrient variation compared to urban forests. Previous research has demonstrated that soil organic carbon content in urban wetlands rises along urban-rural gradients, while soil nitrogen content in urban grasslands is notably higher in urban areas compared to suburban and rural areas [19,20]. A review of existing studies indicates that most research focuses on a specific type of green space or the overall urban green space, and studies on urban wetlands and urban grasslands are still relatively scarce [21]. Therefore, simultaneous analysis of urban forests, urban wetlands, and urban grasslands is essential for a comprehensive understanding of the effects of changes in urban-rural gradients on SOC, TN, TP, and their stoichiometric characteristics in urban green spaces.
As the capital of Jiangxi Province and a representative example of rapid urbanization, Nanchang reflects the urbanization patterns of many second- and third-tier cities in China, making it highly representative. The urban road network effectively defines spatial boundaries and supports systematic sampling, providing a clear spatial basis for soil dynamic studies. This method has now been widely used to analyze urban-rural gradients changes [22,23,24]. In this context, Nanchang has developed a ‘four-ring’ road network, including the urban expressway first ring, second ring, Nanchang city ring highway, and Nanchang city second ring highway, which exhibits significant spatial gradients variations. This makes it an excellent region for studying soil nutrient dynamics across the “urban-suburban-rural” gradients [25]. Therefore, this study focuses on the forests, wetlands, and grasslands along different urban-rural gradients in Nanchang City, analyzing the stoichiometric characteristics of SOC, TN, and TP in each urban green space type and their correlations with soil physical and chemical properties. This study aims to: (1) elucidate the distribution characteristics of SOC, TN, and TP stoichiometric ratios along urban-rural gradients across various urban green space types, and (2) ascertain the principal factors influencing the stoichiometric characteristics of SOC, TN, and TP in these diverse urban green spaces. The research findings will provide a reference for urban green space planning and soil quality improvement decision-making in the study area.
2. Materials and Methods
2.1. Study Area
Nanchang City (28°09′–29°11′ N, 115°27′–116°35′ E) is situated in the central region of China, covering a total area of 7195 km2. The main geomorphological types include plains and hills, with a generally flat terrain that gradually slopes from the northwest to the southeast. The city is characterized by a humid subtropical monsoon climate, which features substantial rainfall, distinct seasonal changes, brief spring and autumn periods, and prolonged summers. The average annual temperature is 17.8 °C, with annual rainfall ranging from 1600 to 1800 mm, and the average frost-free period spans 278 days. The soils are mainly paddy soil and red soil based on the Chinese soil classification standards [26], which are classified as gleysols and ferralsols in the World Reference Base for Soil Resources (https://www.isric.org/). In terms of vegetation zoning, it belongs to the typical subtropical evergreen broadleaf forests region of Central Asia, with common tree species including Pinus massoniana, Camphora officinarum, and Cunninghamia lanceolata [27]. According to the latest Nanchang City Statistical Yearbook (2023) [28], the green space area is 15,144.95 ha, with a green space ratio of 40.2% in the built-up area. Urban green spaces are distributed along multiple ring roads, with urban forests mainly concentrated in the Meiling Scenic Area in the west and north, as well as along the riverbanks. Urban wetlands are predominantly found in the northeastern region, with the exception of Poyang Lake wetlands. Within the ring roads, the majority of wetlands are along the Gan River and scattered pond wetlands. Urban grasslands are spread across various functional areas within each ring road, providing recreational spaces for residents.
2.2. Plot Setup and Sample Collection
The sampling area is situated within the boundaries of the second ring expressway in Nanchang City. In this study, the urban-rural gradients are defined based on the existing road network: the urban areas refer to the region within the second ring road, which covers the core urban areas of Nanchang, with dense traffic and a high degree of urbanization. The suburban areas refer to the region between the second ring road and the ring expressway, located on the outskirts of the urban areas, with a relatively lower degree of urbanization, but still within the main range of urban expansion and development. The rural areas refer to the region between the ring expressway and the second ring expressway, located on the periphery of the city, with the lowest degree of urbanization, mainly consisting of agricultural and natural landscapes, and relatively sparse traffic.
Along the urban-rural gradients defined above, forests, wetlands, and grasslands urban green space types were selected for plot setup in urban, suburban, and rural areas during July and August of 2024. When selecting green space subcategories, factors such as the dominant vegetation types, wetland types and their actual distribution, forests composition, and site conditions in the study area were comprehensively considered. Pinus massoniana and Camphora officinarum are typical native coniferous and broadleaf tree species in Nanchang, with the latter being the city tree of Nanchang, having high ecological and economic value. Additionally, the growth characteristics of these two species differ, which can highlight the influence of different forest types on soil nutrients. Therefore, this study ultimately selected Pinus massoniana forests and Camphora officinarum forests as two typical urban forest types. The Pinus massoniana forests and Camphora officinarum forests here refer to tree stands where the volume of Pinus massoniana or Camphora officinarum accounts for 65% of the total stand volume, based on the technical regulations of the continuous national forests resource inventory in China. In selecting typical urban wetland types, this study chose the more common river wetlands and pond wetlands in the study area to reflect the differences in soil nutrient absorption between natural and artificial wetlands. Urban grasslands were divided into two subcategories: natural grasslands and artificial grasslands. In each urban-rural gradient area, the selection of sampling sites considered factors such as the representativeness of the sampling section, accessibility, forests composition, and site conditions, making them well-suited for the scale of this study. Specifically, due to significant differences in population density, socioeconomic status, and infrastructure levels across the three regions, the sampling points have strong regional representativeness. In order to more accurately analyze the impact of urban-rural gradient changes on soil nutrients, this study also controlled for site and stand factors. Specifically, for each green space subclass, site factors such as elevation, slope, and soil type were kept consistent. For Pinus massoniana or Camphora officinarum forests, stand factors such as tree density, average diameter at breast height (DBH), and average tree height were also kept consistent.
Three plots were set up for each green space subcategory, with a total of 54 plots, each measuring 20 m × 20 m. The distribution of sample plots is shown in Figure 1. Since active nutrient cycling is typically dominated in the upper soil layers [29], this study sampled and analyzed the soil from the 0–40 cm soil layer. Prior to sampling, surface litter and the humus layer were removed, and then soil samples were collected in two layers: surface soil (0–20 cm) and deep soil (20–40 cm). From the soil profile perspective, the sampling layers in urban forests involved both the leaching layer and the accumulation layer, while the sampling layers in urban wetlands and urban grasslands mainly involved the accumulation layer. Specifically, soil samples were collected using a 5 cm diameter soil auger following a five-point sampling method. After mixing the samples evenly, they were air-dried naturally and passed through a 2 mm sieve for determining soil physicochemical properties. Furthermore, soil bulk density was determined through stratified sampling using a 100 cm3 ring knife. The basic overview of the sample sites is shown in Table 1.
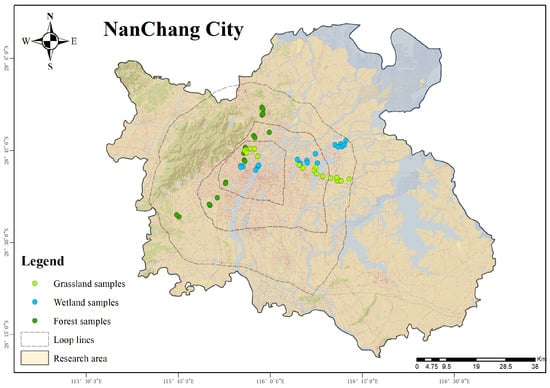
Figure 1.
Location of the study area and distribution of sample plots.

Table 1.
General description of sample plots.
2.3. Soil Sample Analysis
The soil moisture content was assessed via the oven-drying method, soil bulk density was evaluated using the ring knife method, soil pH was quantified through the potentiometric method, SOC was measured using the potassium dichromate oxidation-heating method, and TN was determined using the sulfuric acid digestion–Kjeldahl method. Following digestion with HClO4–H2SO4, TP was quantified using the molybdenum-antimony colorimetric technique. Ammonium nitrogen was quantified by the potassium chloride extraction–indophenol blue colorimetric method, while nitrate nitrogen was assessed using the phenol disulfonic acid colorimetric method. Following extraction with 0.5 moL L−1 NaHCO3, available phosphorus was quantified with the ammonium fluoride hydrochloric acid colorimetric technique [30].
2.4. Statistical Analysis
In SPSS 25.0, the K-S test was employed to evaluate the normality of the raw data, and data that deviated from a normal distribution were converted utilizing the Box–Cox method to satisfy the normality assumption. To analyze the content of SOC, TN, TP, and their stoichiometric ratios across different urban-rural gradients, One-way analysis of variance (ANOVA) was employed. If notable differences were observed, Duncan’s multiple comparison test was applied. In R 4.4.2, correlation analysis between soil stoichiometric ratios and influencing factors was performed using the Correlation and ggplot2 packages, and heat maps were generated. The remaining charts were created using Excel 2010 and Origin 2024 software.
3. Results
3.1. Stoichiometric Characteristics of SOC, TN, and TP in Urban Forests and Their Influencing Factors
As shown in Table 2, the mean SOC content in two soil layers of Pinus massoniana forests were 21.0 and 14.7 g·kg−1, respectively, the mean TN content were 0.950 and 0.612 g·kg−1, respectively, and the mean TP content were 0.394 and 0.315 g·kg−1, respectively. In the deep soil, the SOC was markedly higher in rural areas compared to suburban areas (p < 0.05), whereas the differences in soil TN and TP content between different urban-rural gradients were not significant in two soil layers (p > 0.05), indicating that rural environments may be more favorable for organic matter accumulation, and nitrogen and phosphorus elements may be controlled by other factors. In the Camphora officinarum forests, the mean SOC content in two soil layers were 20.6 and 15.6 g·kg−1, respectively, the mean TN content was 0.847 and 0.669 g·kg−1, respectively, and the mean TP content was 0.440 and 0.316 g·kg−1, respectively. In the surface soil, the soil TN in urban areas was significantly higher compared to rural areas (p < 0.05), whereas the differences in SOC and TP content between different urban-rural gradients were not significant in both soil layers (p > 0.05), suggesting that variations in the urban-rural gradients exert a minimal influence on phosphorus content. Additionally, an independent samples t-test was conducted on the SOC, TN, and TP content of different forest types in the same soil layer and gradient. The results showed that in the deep soil of suburban areas, the soil TP content in Camphora officinarum forests was significantly greater than in Pinus massoniana forests (p < 0.01), while the differences in SOC and TN content between forest types in both soil layers were not statistically significant (p > 0.05).
Table 2.
SOC, TN, and TP content of Pinus massoniana forests and Camphora officinarum forests.
As shown in Figure 2, the mean soil C:N in two soil layers of Pinus massoniana forests were 23.3 and 24.8, respectively, the mean C:P were 56.0 and 47.4, respectively, and the mean N:P were 2.47 and 1.93, respectively. In the deep soil, the soil C:P in urban areas was markedly elevated compared to suburban areas (p < 0.05), and the soil N:P was significantly higher in urban areas compared to suburban and rural areas (p < 0.05). However, the differences in soil C:N between the two soil layers across different urban-rural gradients were not significant (p > 0.05). In the Camphora officinarum forests, the mean soil C:N in two soil layers were 25.1 and 23.7, respectively, the mean C:P were 48.5 and 51.7, respectively, and the mean N:P were 2.04 and 2.30, respectively. In the surface soil, the N:P was considerably higher in urban areas compared to suburban and rural areas (p < 0.05). However, no notable differences were observed in soil C:N and C:P between urban and rural gradients in two soil layers (p > 0.05). Clearly, the most prominent effect of changes in the urban-rural gradients on the stoichiometric of SOC, TN, and TP in urban forests was reflected in the soil N:P. Furthermore, the differences in soil C:N, C:P, and N:P between forest types in both soil layers under the same gradient were not statistically significant (p > 0.05).
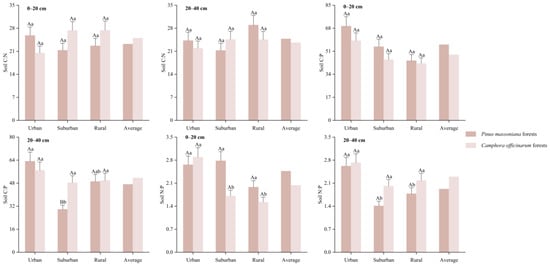
Figure 2.
SOC, TN, and TP stoichiometry ratios of Pinus massoniana forests and Camphora officinarum forests. Note: The “Average” values represent the SOC, TN, and TP stoichiometric ratios without distinguishing between urban-rural gradients. Different capital letters indicate significant differences (p < 0.05) between different forest types in the same soil layer under the same gradient, and different lower-case letters indicate significant differences (p < 0.05) between different gradients in the same soil layer in the same forest type. Same as below.
A correlation study was performed to discover the primary factors affecting the stoichiometric ratios of SOC, TN, and TP in relation to soil physicochemical properties. Table 3 presented a fundamental statistical assessment of the physicochemical properties of urban forests soils. The Pearson correlation analysis results (Figure 3) indicated a substantial positive link between the soil N:P and nitrate nitrogen in the deep soil of Pinus massoniana forests (r = 0.802, p < 0.01). A substantial negative association was found in the surface soil of Camphora officinarum forests between the soil N:P and both soil bulk density and accessible phosphorus (r = −0.751, r = −0.684, p < 0.05).
Table 3.
Basic statistics of soil physicochemical properties in Pinus massoniana forests and Camphora officinarum forests.
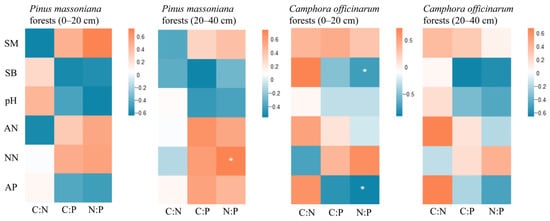
Figure 3.
Correlation analysis of SOC, TN, and TP stoichiometric ratios with influencing factors in Pinus massoniana forests and Camphora officinarum forests. Note: SM refers to soil moisture content, SB refers to soil bulk density, AN refers to ammonium nitrogen, NN refers to nitrate nitrogen, and AP refers to available phosphorus. *: p < 0.05.
3.2. Stoichiometric Characteristics of SOC, TN, and TP in Urban Wetlands Soils and Their Influencing Factors
Table 4 illustrated that the mean SOC content in the two soil layers of river wetlands was 15.1 and 9.73 g·kg−1, respectively. The mean TN content was 0.688 and 0.577 g·kg−1, respectively, while the mean TP content was 0.413 and 0.280 g·kg−1, respectively. In the surface soil, the TN content in urban areas was markedly more than in rural areas (p < 0.05). In the deep soil, both SOC and TN content in urban areas were significantly elevated compared to suburban and rural areas (p < 0.05). The disparities in soil TP content across various urban-rural gradients in both soil layers are not statistically significant (p > 0.05). In the pond wetlands, the mean SOC content in two soil layers were 18.5 and 13.2 g·kg−1, respectively; the mean TN content was 0.989 and 0.786 g·kg−1, respectively; and the mean TP content was 0.351 and 0.262 g·kg−1, respectively. In the surface soil, the SOC content in urban areas was markedly greater than that in rural areas (p < 0.05), whereas in the deep soil, the TN content in urban areas was dramatically elevated compared to rural areas (p < 0.05). The disparities in soil TP content across various urban-rural gradients in both soil layers were not statistically different (p > 0.05). The distribution of SOC and soil TN was markedly affected by urbanization and soil depth, while soil TP showed a diminished level of urban-rural variance. In the deep soil of the suburban areas, the SOC and soil TN content of pond wetlands were significantly higher than river wetlands (p < 0.05). However, the differences in soil TP content between different forest types in both soil layers under the same gradient were not statistically significant (p > 0.05).
Table 4.
SOC, TN, and TP content of river wetlands and pond wetlands.
As shown in Figure 4, the mean soil C:N in the two soil layers of river wetlands were 24.6 and 17.7, respectively, the mean C:P were 39.0 and 35.3, respectively, and the mean N:P were 1.69 and 2.03, respectively. In the surface soil, the soil C:N in rural areas was markedly higher than in urban and suburban areas (p < 0.05). In the deep soil, the soil C:P in the urban areas was markedly elevated compared to the suburban areas (p < 0.05), and the soil N:P in urban areas was significantly greater than in both suburban and rural areas (p < 0.05). The mean soil C:N in the two soil layers of pond wetlands were 19.4 and 16.8, respectively; the mean C:P were 39.0 and 35.3, respectively; and the mean N:P were 2.82 and 3.21, respectively. In the surface soil, the soil C:N in rural areas was markedly elevated compared to urban and suburban areas (p < 0.05), while the soil C:P in urban areas was much greater than that in rural areas (p < 0.05). In the deep soil, the soil C:P and N:P in urban areas were markedly elevated compared to those in suburban and rural areas (p < 0.05). Therefore, it could be seen that the stoichiometric of SOC, TN, and TP were jointly influenced by the urban-rural gradients, wetlands types, and soil depth. Furthermore, in the surface soil of the rural area, the soil C:N in river wetlands was significantly higher than in pond wetlands (p < 0.01). In the two soil layers of urban areas, the soil C:P in pond wetlands was significantly higher than in river wetlands (p < 0.01). Additionally, in the deep soil of suburban areas, the soil C:P in pond wetlands was significantly higher compared to river wetlands (p < 0.05). Soil N:P in pond wetlands was also significantly higher than in river wetlands in the surface soil of urban areas and deep soil of suburban areas (p < 0.01). In the deep soil of urban areas, the soil N:P in pond wetlands was significantly higher than in river wetlands (p < 0.05).
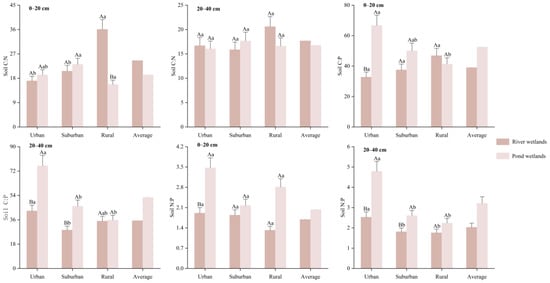
Figure 4.
SOC, TN, and TP stoichiometry ratios of river wetlands and pond wetlands.
The basic statistical properties of urban wetlands soil physicochemical characteristics were shown in Table 5. A correlation analysis was performed between the stoichiometric ratios of SOC, TN, and TP in urban wetlands soils and their physicochemical properties. The findings (Figure 5) demonstrated a substantial positive correlation between soil C:N in the surface and deep soil of river wetlands and ammonium nitrogen and nitrate nitrogen, respectively (r = 0.721, r = 0.723, p < 0.05). Soil N:P in the surface soil of pond wetlands exhibited a strong negative association with soil pH (r = −0.809, p < 0.05).
Table 5.
Basic statistics of soil physicochemical properties in river wetlands and pond wetlands.
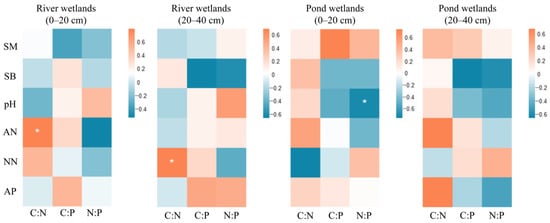
Figure 5.
Correlation analysis of SOC, TN, and TP stoichiometric ratios with influencing factors in river wetlands and pond wetlands. *: p < 0.05. Abbreviations follow the legend to Table 3.
3.3. Stoichiometric Characteristics of SOC, TN, and TP in Urban Grasslands Soils and Their Influencing Factors
Table 6 indicated that the mean SOC content in the two soil layers of natural grasslands was 17.1 and 13.3 g·kg−1, respectively. The mean TN content was 0.885 and 0.754 g·kg−1, respectively, and the mean TP content was 0.366 and 0.276 g·kg−1, respectively. The SOC content in surface soil exhibited a progressive increase throughout the urban-rural gradients, with statistically significant variations seen between each gradient pair (p < 0.05). Furthermore, the TN content in rural areas was markedly greater than that found in urban and suburban areas. In the deep soil, the SOC and TP contents in suburban and rural areas were markedly greater than those in urban areas (p < 0.05), while the TN content in rural areas was significantly elevated compared to both urban and suburban areas (p < 0.05). The mean SOC content of artificial grasslands in two soil layers were 14.0 and 11.2 g·kg−1, respectively. The mean TN content was 0.794 and 0.640 g·kg−1, respectively, and the mean TP content was 0.533 and 0.427 g·kg−1, respectively. In the deep soil, rural areas demonstrated markedly elevated SOC concentration compared to urban areas (p < 0.05). No significant variations were detected in the soil TN and TP concentrations between the urban and rural gradients across both soil layers (p > 0.05). Different grasslands varieties had variable sensitivities to alterations in the urban-rural gradients, with soil depth significantly influencing nutrient delivery and accumulation. Additionally, in the surface soil of rural areas and deep soil of suburban areas, the SOC content in natural grasslands was significantly higher than in artificial grasslands (p < 0.05). In the two soil layers of urban areas, the soil TP content in artificial grasslands was significantly higher compared to natural grasslands (p < 0.05). However, the differences in soil TN content between forest types in two soil layers under the same gradient were not statistically significant (p > 0.05).
Table 6.
SOC, TN, and TP content of natural and artificial grasslands.
From Figure 6, it can be seen that the mean soil C:N in the two soil layers of natural grasslands were 18.5 and 16.9, respectively, the mean soil C:P were 47.4 and 50.5, respectively, and the mean soil N:P were 2.60 and 3.33, respectively. The soil C:N in both soil layers of suburban and rural areas were markedly elevated compared to those in the urban areas (p < 0.05). In the deep soil, the N:P in urban areas was significantly greater than that in suburban and rural areas (p < 0.05). However, the variations in soil C:P across different urban-rural gradients in both soil layers were not statistically significant (p > 0.05). The mean soil C:N for artificial grasslands in two soil layers were 17.4 and 17.0, respectively; the mean soil C:P were 32.0 and 39.8, respectively; and the mean soil N:P were 1.87 and 2.29, respectively. The disparities in soil C:N, C:P, and N:P across various urban-rural gradients in both soil strata were not statistically significant (p > 0.05). The soil C:N and N:P in natural grasslands were more profoundly affected by the urban-rural gradients, while in artificial grasslands, management approaches may result in more uniform nutrient levels throughout varying urban-rural gradients. Furthermore, in the surface soil of suburban areas, the C:N in natural grasslands was significantly higher than in artificial grasslands (p < 0.05). Soil C:P of natural grassland was significantly greater than that of artificial grassland in the deep soil of urban areas. In urban areas, soil N:P was significantly greater in natural grassland and reached a highly significant level in the deep soil (p < 0.01).
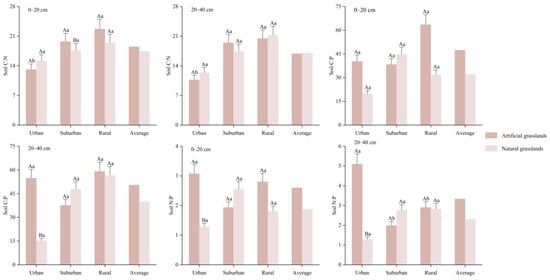
Figure 6.
SOC, TN, and TP stoichiometry ratios of natural and artificial grasslands.
Table 7 presented the fundamental statistical aspects of the physicochemical characteristics of urban grasslands soil. A correlation analysis was performed between the stoichiometric ratios of SOC, TN, and TP in urban grasslands soils and their physicochemical properties. The findings (Figure 7) demonstrated a substantial positive association between soil C:N and soil bulk density in the surface soil, as well as with nitrate nitrogen in the deep soil of natural grasslands (r = 0.697, r = 0.709, p < 0.05). In the surface soil of artificial grasslands, the soil C:P and N:P exhibited a substantial positive correlation with soil pH (r = 0.703, r = 0.692, p < 0.05) and a significant negative association with ammonium nitrogen (r = −0.729, r = −0.778, p < 0.05).
Table 7.
Basic statistics of soil physicochemical properties in natural and artificial grasslands.
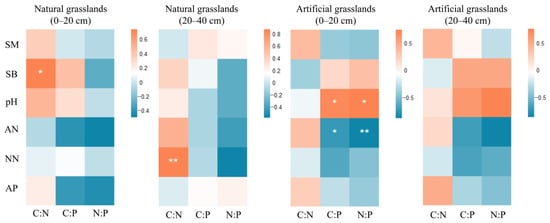
Figure 7.
Correlation analysis of SOC, TN, and TP stoichiometric ratios with influencing factors in natural and artificial grasslands. *: p < 0.05, **: p < 0.01. Abbreviations follow the legend to Table 3.
To visually present the distribution patterns and influencing factors of soil carbon, nitrogen, and phosphorus stoichiometric characteristics along the urban-rural gradient for different types of green spaces, we have summarized the key findings of this study in Table 8.
Table 8.
Key findings on the soil carbon, nitrogen, and phosphorus stoichiometric characteristics of urban green spaces in this study.
4. Discussion
4.1. SOC, TN, and TP Content and Stoichiometric Characteristics in Urban Green Spaces
The present study revealed that in the deep soil of Pinus massoniana forests, the SOC content in the rural areas was notably higher in rural areas compared to suburban areas. This suggested that urbanization might promote the decomposition of SOC in Pinus massoniana forests, thereby reducing its accumulation capacity. This outcome aligns with the observations of Chen et al. [31] on the urban-rural gradients of Pinus massoniana forests in Guangdong Province, China. Studies have shown that the surface temperature in Nanchang City gradually decreases from the city center to the periphery [32]. Higher temperatures help increase soil microbial activity, promoting SOC decomposition, which is unfavorable for SOC accumulation. Therefore, this study hypothesized that elevated temperature may be an important factor leading to the higher SOC content in rural areas. However, due to the lack of specific temperature data to support this hypothesis, further verification will be needed in future studies. In addition, litter is an important source of SOC, and the lower SOC content observed in the urban and suburban areas may also be related to reduced organic matter input, largely attributed to the timely removal of litter, which consequently hampers organic matter accumulation [33]. In the deep soil of river wetlands and surface soil of pond wetlands, urban areas had significantly higher SOC content compared to rural areas. This observation could be attributed to the higher concentration of human activities and pollution sources in urban areas, such as the discharge of organic waste and nutrient inputs from agricultural activities, which could lead to an increase in soil organic matter [34]. The variation in SOC content across different types of green spaces may be related to several factors, such as vegetation cover and land use practices. The SOC content in Pinus massoniana forests may be more strongly influenced by temperature, while river and pond wetlands may be more impacted by pollutant inputs and human activities. As a result, the SOC content in different types of green spaces exhibits distinct urban-rural gradients distribution characteristics. Additionally, this study found that in the deep soil of suburban areas, the SOC and soil TN content in pond wetlands were significantly higher than those in river wetlands. This may be due to the prolonged water accumulation and less frequent water flow disturbances in pond wetlands, which favor organic matter accumulation and the effective retention of nitrogen. In contrast, river wetlands may experience more frequent water flow changes and nutrient loss, leading to lower SOC and TN content in the soil. This finding is consistent with previous research on wetland soil characteristics [35].
Regarding soil TN, the study found that urban areas exhibited significantly higher TN content compared to rural areas in the surface soil of Camphora officinarum forests. This may be due to the relatively warmer and more humid climatic conditions in urban areas, influenced by factors such as the phenomenon of urban heat, facilitating the mineralization of humus and consequently lead to an increase in soil TN content [36]. Regarding soil TP, the differences between the two types of urban wetlands across different urban-rural gradients are not significant, indicating that land use and pollution sources between regions have a smaller impact on phosphorus accumulation. Phosphorus migration and accumulation may rely more on the movement and sedimentation processes of water bodies rather than solely on urban-rural gradients differences. This is congruent with the work of Arisoesilaningsih et al. [35]. Additionally, the study found that in natural grasslands, rural areas contained significantly higher levels of SOC, TN, and TP than urban area. In rural areas, land use practices are more natural or traditional, with diverse plant communities that promote organic matter accumulation. In urban areas, however, soil disturbances due to the urbanization process are more frequent, and the plant species are more homogeneous, which suppresses the acceleration of SOC, soil TN, and TP [37,38]. A comparative analysis of different forest types under the same gradient showed that in the deep soil of suburban areas, the soil TP content in Camphora officinarum forests was significantly higher than in Pinus massoniana forests. This may be related to the phosphorus demand and absorption mechanisms of Camphora officinarum and Pinus massoniana during their growth. Camphora officinarum is a relatively moisture-loving, deep-rooted tree species with a strong phosphorus absorption capacity, particularly in deep soil. The roots of Camphora officinarum may be able to reach deeper soil layers, absorbing and accumulating more phosphorus. In contrast, the relatively shallow roots of Pinus massoniana may primarily rely on phosphorus in the surface soil, leading to lower TP content in deeper soil layers [39].
This research revealed that rural soil C:N was considerably greater than that of urban and suburban areas in the surface soil of wetlands. This phenomenon may be attributed to a more natural ecological environment and less anthropogenic interference in rural areas [40]. Simultaneously, the high nitrogen deposition in urban areas may also contribute to the observed trends in natural grasslands. Regarding soil C:P, in the deep soil of Pinus massoniana forests and river wetlands, the soil C:P in the urban areas was markedly higher than in the suburban areas. This may be because of a higher accumulation of SOC in urban areas, while total phosphorus content remains relatively stable. In terms of soil N:P, urban forests indicate that the N:P in urban areas was markedly elevated compared to suburban and rural areas. This may reflect higher nitrogen accumulation in urban soils, where urbanization activities such as combustion, traffic, and agricultural waste emissions may have increased nitrogen sources, thus altering the soil nitrogen-phosphorus ratio [41]. A comparable trend was likewise noted in the deep soil of natural grasslands, further indicating that urban areas may face higher nitrogen deposition. Compared to phosphorus accumulation, the excess of nitrogen sources leads to a larger N:P [42]. In the case of artificial grasslands, no remarkable differences in soil stoichiometric ratios were demonstrated between various gradients. This could be related to the management practices and human interventions in artificial grasslands.
4.2. Influencing Factors of SOC, TN, and TP Stoichiometric Ratios in Urban Green Spaces
This study discovered a substantial positive correlation between ammonium nitrogen and soil C:N in the surface of soil in river wetlands. This may be because in wetlands soils, an increase in ammonium nitrogen promotes the buildup of both SOC and nitrogen, thereby raising the soil C:N [43]. At the same time, the accumulation of ammonium nitrogen in wetlands soils may promote nitrogen transformation processes by microorganisms, further affecting the soil C:N [44]. Prior research has produced results analogous to those of this study [45,46]. This study identified a substantial negative association between ammonium nitrogen and soil C:P in the surface soil of artificial grasslands. This may pertain to nitrogen-deficient situations in grasslands ecosystems. Nitrogen sources in urban grasslands are rather scarce. Hence, the rise in ammonium nitrogen may result in the preferential utilization of nitrogen over carbon and phosphorus, thereby reducing the soil C:P [47]. This research demonstrated a substantial positive correlation between nitrate nitrogen and soil C:N in the deep soil of river wetlands. This suggests that nitrate nitrogen in wetlands soils may promote the accumulation of nitrogen and carbon in the soil by affecting microbial processes or the conversion of soil organic matter [48]. This research revealed a strong positive correlation between nitrate nitrogen and soil N:P in the deep soil of Pinus massoniana forests. This may be because the increase in nitrogen sources in forests soils often triggers competition between nitrogen and phosphorus, leading to changes in the soil N:P [49].
Soil pH plays a crucial role in regulating nutrient distribution and cycling across various urban green space ecosystems. The results of this study showed a strong positive correlation between soil pH and soil C:P in the surface soil of artificial grasslands. Higher soil pH may have promoted the organic matter decomposition and phosphorus release in the soil, thereby increasing the soil C:P [50]. Additionally, soil pH was strongly negatively correlated with the soil N:P in the surface soil of pond wetlands, but significantly positively correlated with the soil N:P in the surface soil of artificial grasslands. This may be because the acidic conditions of wetlands soils limit phosphorus release, thereby affecting the soil N:P [51]. Conversely, in grasslands ecosystems, elevated pH may facilitate nitrogen transformation and enhance plant nitrogen absorption, resulting in a greater utilization of nitrogen compared to phosphorus, hence augmenting the soil N:P [52].
Soil bulk density reflects the degree of soil compaction and porosity, which significantly influences soil aeration, drainage, and microbial activity [53]. This study identified a strong positive correlation between soil bulk density and the soil carbon-to-nitrogen ratio in the surface soil in natural grasslands. An elevated soil bulk density may restrict oxygen availability in the soil, thus hindering the microbial mineralization of SOC and resulting in a relative buildup of carbon and nitrogen, which raises the soil C:N [54]. In Camphora officinarum forests, the inverse relationship between soil bulk density and soil N:P suggested that soil compaction may impede nutrient release. Available phosphorus is the form of phosphorus that plants and microorganisms can directly absorb, and its variation directly affects the plants’ demand for and ability to absorb phosphorus [55]. This study showed that available phosphorus was significantly negatively correlated with soil N:P in the surface soil of Camphora officinarum forests. This may be because, with the decrease in available phosphorus, the limiting effect of phosphorus may intensify, leading to an increased relative absorption of nitrogen by plants, thereby affecting the soil N:P [56]. This finding supports previous research on the effect of phosphorus limitation on plant nitrogen and phosphorus absorption [57,58].
The number of soil sampling points in this study was relatively limited, and there was a lack of soil sampling and analysis below the 40 cm depth. Future research could increase the number of sampling points and further explore the dynamic changes in the stoichiometric characteristics of deep SOC, TN, and TP along the urban-rural gradients. Moreover, variations in groundwater levels may influence the stoichiometric properties of SOC, TN, and TP. However, this factor was not fully considered in the present study, and further in-depth research should integrate groundwater levels, plant, and microbial ecological stoichiometric characteristics.
5. Conclusions
This study examines the trends in SOC, TN, and TP stoichiometric properties along the urban-rural gradients in the urban green spaces in Nanchang, China, and revealed the main factors influencing soil stoichiometric ratios. Our results showed that urban-rural gradient changes had the most significant effect on the forest soil N:P, while forest types had less influence on the stoichiometric characteristics of SOC, TN and TP. Wetland type and urban-rural gradients significantly affected soil stoichiometric characteristics, especially the higher C:P and N:P of pond wetlands in urban areas. SOC and TN content in river wetlands and pond wetlands differed across urban-rural gradients, while TP content showed less variation. Soil C:N and N:P in natural grasslands were significantly affected by the urban-rural gradient, while no significant differences were observed in artificial grasslands. Moreover, factors that significantly affected the stoichiometric characteristics of SOC, TN, and TP in urban green spaces mainly included ammonium nitrogen, nitrate nitrogen, soil pH, and soil bulk density. Urbanization has modified the nutrient status of SOC, TN, and TP, amplifying the imbalance of nutrient elements in green space soils across the “urban-suburban-rural” gradients. However, the nutrient cycling mechanisms still require further investigation, particularly in relation to plant and microbial ecological stoichiometric characteristics. This study provides a systematic analysis of how variations in the urban-rural gradients and soil physicochemical properties influence the stoichiometric characteristics of SOC, TN, and TP in different urban green spaces, offering fresh perspectives on the distribution and cycling of soil nutrients in urban green space ecosystems.
Author Contributions
Conceptualization, J.W.; Methodology, J.W.; Formal analysis, J.W., T.Z. and Z.W.; Writing—original draft preparation, J.W.; Writing—review and editing, B.Y. and Q.Y.; Supervision, B.Y. All authors have read and agreed to the published version of the manuscript.
Funding
This research received no external funding.
Data Availability Statement
Data will be made available upon request.
Acknowledgments
The authors would like to thank the anonymous reviewers for their helpful comments and suggestions.
Conflicts of Interest
Juan Wang is employed by Jiangxi Linbo Planning and Design Co., Ltd., her employer’s company was not involved in this study, and there is no relevance between this research and their company. The remaining authors declare that the research was conducted in the absence of any commercial or financial relationships that could be construed as a potential conflict of interest.
References
- Aronson, M.F.J.; Lepczyk, C.A.; Evans, K.L.; Goddard, M.A.; Lerman, S.B.; MacIvor, J.S.; Nilon, C.H.; Vargo, T. Biodiversity in the City: Key Challenges for Urban Green Space Management. Front. Ecol. Environ. 2017, 15, 189–196. [Google Scholar] [CrossRef]
- Shahtahmassebi, A.R.; Li, C.; Fan, Y.; Wu, Y.; Lin, Y.; Gan, M.; Wang, K.; Malik, A.; Blackburn, G.A. Remote Sensing of Urban Green Spaces: A Review. Urban For. Urban Gree. 2021, 57, 126946. [Google Scholar] [CrossRef]
- Ungaro, F.; Maienza, A.; Ugolini, F.; Lanini, G.M.; Baronti, S.; Calzolari, C. Assessment of Joint Soil Ecosystem Services Supply in Urban Green Spaces: A Case Study in Northern Italy. Urban For. Urban Green. 2022, 67, 127455. [Google Scholar] [CrossRef]
- Yang, Z.; Zhang, J.J.; Zhao, J.C.; Hu, Y.; Li, Y.; Wang, B. Response of Soil Carbon, Nitrogen, and Phosphorus Stoichiometric Characteristics of Pinus tabuliformis Forests to Stand Age and Density in the Loess Plateau Region of Western Shanxi Province, Northern China. J. Beijing For. Univ. 2024, 46, 30–40. [Google Scholar]
- Van de Waal, D.B.; Elser, J.J.; Martiny, A.C.; Sterner, R.W.; Cotner, J.B. Progress in ecological stoichiometry. Front. Microbiol. 2018, 9, 1957. [Google Scholar] [CrossRef]
- Chen, Z.; Xu, X.; Wen, Y.; Cheng, M.; Wang, X. The Critical Role of Soil Ecological Stoichiometric Ratios: How Does Reforestation Improve Soil Nitrogen and Phosphorus Availability? Plants 2024, 13, 2320. [Google Scholar] [CrossRef]
- Cheng, Z.; Hettiarachchi, G.M.; Kim, K.H. Urban Soils Research: SUITMA 10. J. Environ. Qual. 2021, 50, 2–6. [Google Scholar] [CrossRef]
- Xu, F.; Zhao, S.; Li, S. Dynamic Responses of Soil Organic Carbon to Urbanization: A Global Perspective. Glob. Change Biol. 2024, 30, e17573. [Google Scholar] [CrossRef]
- Lin, S.; Zhang, H.; Lam, J.F.I. Urban Soil Ecological Risk Assessment Based on “Climate Change-Resilience”. Environ. Monit. Assess. 2025, 197, 218. [Google Scholar] [CrossRef]
- Lorenz, K.; Lal, R. Managing soil carbon stocks to enhance the resilience of urban ecosystems. Carbon Manag. 2015, 6, 35–50. [Google Scholar]
- Dobson, M.C.; Crispo, M.; Blevins, R.S.; Warren, P.H.; Edmondson, J.L. An assessment of urban horticultural soil quality in the United Kingdom and its contribution to carbon storage. Sci. Total Environ. 2021, 777, 146199. [Google Scholar] [PubMed]
- Caron, S.; Garvey, S.M.; Gewirtzman, J.; Schultz, K.; Bhatnagar, J.M.; Driscoll, C.; Hutyra, L.R.; Templer, P.H. Urbanization and fragmentation have opposing effects on soil nitrogen availability in temperate forest ecosystems. Glob. Change Biol. 2023, 29, 2156–2171. [Google Scholar]
- Huang, J.; Zhang, W.; Mo, J.; Wang, S.; Liu, J.; Chen, H. Urbanization in China drives soil acidification of Pinus massoniana forests. Sci. Rep. 2015, 5, 13512. [Google Scholar] [CrossRef]
- Cunha, G.K.G.; da Cunha, K.P.V.; Araújo, F.; Angelini, R. Urbanization increases the risk of phosphorus loss in sandy soils of tropical ecosystems. Chemosphere 2024, 349, 140937. [Google Scholar] [PubMed]
- Fu, Y.; Yang, X.; Wang, J. Stoichiometric Characteristics of Soil C, N and P of Green Space along an Urban-Suburb-Rural Gradient in Nanchong. Chin. J. Ecol. 2020, 39, 4038–4047. [Google Scholar]
- Guo, Y.; Han, J.; Bao, H.; Wu, Y.; Shen, L.; Xu, X.; Chen, Z.; Smith, P.; Abdalla, M. A Systematic Analysis and Review of Soil Organic Carbon Stocks in Urban Greenspaces. Sci. Total Environ. 2024, 948, 174788. [Google Scholar] [CrossRef]
- Cusack, D.F. Soil Nitrogen Levels Are Linked to Decomposition Enzyme Activities along an Urban-Remote Tropical Forest Gradient. Soil Biol. Biochem. 2013, 57, 192–203. [Google Scholar]
- Chen, F.; Li, X.; Nagle, G.; Zhan, S. Topsoil Phosphorus Signature in Five Forest Types along an Urban-Suburban-Rural Gradient in Nanchang, Southern China. J. For. Res. 2010, 21, 39–44. [Google Scholar]
- Zhang, H.; Li, C.; Zhang, Y.; Zhang, L. Dynamic change characteristics of wetlands in Hefei and their driving factors along the urban–rural gradient. Wetlands 2024, 44, 101. [Google Scholar]
- Cusack, D.F.; Lee, J.K.; McCleery, T.L.; LeCroy, C.S. Exotic grasses and nitrate enrichment alter soil carbon cycling along an urban–rural tropical forest gradient. Glob. Change Biol. 2015, 21, 4481–4496. [Google Scholar]
- Wang, Q.; Li, Y.; Wang, L.W.; Xiang, M.; Yuan, D.; Shao, S.; Gou, Q. Stoichiometric Characteristics of Soil C, N and P of Green Space along Urban–Suburb-Rural Gradient in Eastern Chengdu. Soils 2017, 49, 358–363. [Google Scholar]
- Yesilonis, I.; Giorgio, V.; Hu, Y.; Pouyat, R.; Szlavecz, K. Changes in soil chemistry after 17 years in urban and rural Forest patches. Front. Ecol. Evol. 2022, 10, 786809. [Google Scholar] [CrossRef]
- Tešić, M.; Stojanović, N.; Knežević, M.; Bojović, D.D.; Petrović, J.; Pavlović, P. The Impact of the degree of urbanization on spatial distribution, sources and levels of heavy metals pollution in urban soils—A case study of the city of Belgrade (Serbia). Sustainability 2022, 14, 13126. [Google Scholar] [CrossRef]
- Zhai, C.; Wang, W.; He, X.; Zhou, W.; Xiao, L.; Zhang, B. Urbanization drives SOC accumulation, its temperature stability and turnover in forests, Northeastern China. Forests 2017, 8, 130. [Google Scholar] [CrossRef]
- Li, P.Q.; Fang, X.M.; Chen, F.S.; Wang, F.; Yu, J.; Wang, S.; Li, Z. Variability of Soil Water Soluble Organic Carbon Content and Its Response to Temperature Change in Green Spaces along Urban-to-Rural Gradient of Nanchang, China. Chin. J. Appl. Ecol. 2015, 26, 3398–3404. [Google Scholar]
- GB/T 17296-2009; China Information Classification and Coding Standardization Technical Committee. Classification and Codes for Chinese Soil. Standards Press of China: Beijing, China, 2009.
- Lv, T.; Wang, L.; Zhang, X.; Xie, H.; Lu, H.; Li, H.; Liu, W.; Zhang, Y. Coupling Coordinated Development and Exploring Its Influencing Factors in Nanchang, China: From the Perspectives of Land Urbanization and Population Urbanization. Land 2019, 8, 178. [Google Scholar] [CrossRef]
- National Bureau of Statistics. Nanchang Statistical Yearbook 2023; China Statistics Press: Beijing, China, 2023. [Google Scholar]
- Jiang, J.; Lu, Y.; Chen, B.; Ming, A.; Pang, L. Nutrient resorption and C: N: P stoichiometry responses of a Pinus massoniana plantation to various thinning intensities in Southern China. Forests 2022, 13, 1699. [Google Scholar] [CrossRef]
- Zhang, J.E. Common Experimental Research Methods and Techniques in Ecology; Chemical Industry Press: Beijing, China, 2007. [Google Scholar]
- Chen, H.; Zhang, W.; Gilliam, F.; Liu, L.; Huang, J.; Zhang, T.; Wang, W.; Mo, J. Changes in Soil Carbon Sequestration in Pinus massoniana Forests along an Urban-to-Rural Gradient of Southern China. Biogeosciences 2013, 10, 6609–6616. [Google Scholar]
- Xiong, Q.; Chen, W.; He, L.; Luo, S.; Li, H. Study on the Influencing Factors and the Spatiotemporal Heterogeneity of Urban Heat Island Effect in Nanchang City of China. J. Asian Archit. Build. Eng. 2023, 22, 1444–1457. [Google Scholar]
- Lajtha, K.; Bowden, R.D.; Crow, S.; Fekete, I.; Kotroczó, Z.; Plante, A.; Simpson, M.J.; Nadelhoffer, K.J. The detrital input and removal treatment (DIRT) network: Insights into soil carbon stabilization. Sci. Total Environ. 2018, 640, 1112–1120. [Google Scholar]
- Li, D.; Ning, Z.; Chen, G.; Li, Y.N.; Cui, B.; Wang, Q.; Xie, T. The Effect of Land Use and Land Cover on Soil Carbon Storage in the Yellow River Delta, China: Implications for Wetland Restoration and Adaptive Management. J. Environ. Manag. 2024, 367, 122097. [Google Scholar]
- Arisoesilaningsih, E.; Soejono, S. Diversity of Drought-Resistant Plants and the Benefits of Their Biomass for Improving Fertility of a Degraded Soil of Brantas River Basin. J. Degrad. Min. Lands Manag. 2015, 2, 303. [Google Scholar]
- Tobiašová, E.; Dębska, B.; Porhajašová, J. Influence of the fractional composition of humus substances on the proportion of water-resistant aggregates. J. Cent. Eur. Agric. 2015, 16, 131–139. [Google Scholar]
- Meng, L.H.; Zeng, H.; Xiong, Y.M.; Guo, D. Soil Carbon, Nitrogen and Phosphorus Contents and Fine Root Biomass under Different Vegetation Types and Building Densities in Shenzhen City. Acta Sci. Nat. Univ. Pekin. 2013, 49, 899–907. [Google Scholar]
- Rai, P.K.; Rai, A.; Singh, S. Change in Soil Microbial Biomass along a Rural-Urban Gradient in Varanasi (UP, India). Geol. Ecol. Landsc. 2018, 2, 15–21. [Google Scholar]
- Xu, J.; Jian, Z.; Zhang, Y.; Deng, X.; Lei, L.; Zeng, L.; Xiao, W.; Ni, Y. Nutrient Variations and Their Use Efficiency of Pinus massoniana Seedling Tissues in Response to Low Phosphorus Conditions. Forests 2024, 15, 351. [Google Scholar] [CrossRef]
- Bielińska, E.J.; Futa, B.; Ukalska-Jaruga, A.; Weber, J.; Chmielewski, S.; Wesołowska, S.; Mocek-Płóciniak, A.; Patkowski, K.; Mielnik, L. Mutual relations between PAHs derived from atmospheric deposition, enzymatic activity, and humic substances in soils of differently urbanized areas. J. Soils Sediment. 2018, 18, 2682–2691. [Google Scholar] [CrossRef]
- Rao, P.; Hutyra, L.R.; Raciti, S.M.; Templer, P.H. Atmospheric nitrogen inputs and losses along an urbanization gradient from Boston to Harvard Forest, MA. Biogeochemistry 2014, 121, 229–245. [Google Scholar] [CrossRef]
- Chang, H.; Liu, Y.; Wang, Y.; Zhang, L.; Song, Z.; Hsueh, I. Nitrogen Emissions-Based Assessment of Anthropogenic Regional Ecological Risk: An Example of Taiwanese Urbanization, 1990–2015. Environ. Manag. 2018, 62, 968–986. [Google Scholar]
- Wang, J.; Bai, J.; Zhao, Q.; Lu, Q.; Xia, Z. Five-year changes in soil organic carbon and total nitrogen in coastal wetlands affected by flow-sediment regulation in a Chinese delta. Sci. Rep. 2016, 6, 21137. [Google Scholar] [CrossRef]
- Alldred, M.; Baines, S.B. Effects of wetland plants on denitrification rates: A meta-analysis. Ecol. Appl. 2016, 26, 676–685. [Google Scholar] [CrossRef] [PubMed]
- Bravo, D.; Hill, A.R. The Effect of Chronic High Groundwater Nitrate Loading on Riparian Forest Growth and Plant–Soil Processes. Water Air Soil Pollut. 2012, 223, 73–84. [Google Scholar] [CrossRef]
- Gao, H.; Bai, J.; Xiao, R.; Yan, D.; Huang, L.; Huang, C. Soil net nitrogen mineralization in salt marshes with different flooding periods in the Yellow River Delta, China. Clean–Soil Air Water 2012, 40, 1111–1117. [Google Scholar] [CrossRef]
- Dromantienė, R.; Pranckietienė, I.; Jodaugienė, D.; Paulauskienė, A. The influence of various forms of nitrogen fertilization and meteorological factors on nitrogen compounds in soil under laboratory conditions. Agronomy 2020, 10, 2011. [Google Scholar] [CrossRef]
- Li, Z.; Zeng, Z.; Song, Z.; Wang, F.; Tian, D.; Mi, W.; Huang, X.; Wang, J.; Song, L.; Yang, Z.; et al. Vital roles of soil microbes in driving terrestrial nitrogen immobilization. Glob. Change Biol. 2021, 27, 1848–1858. [Google Scholar] [CrossRef]
- Heuck, C.; Smolka, G.; Whalen, E.D.; Frey, S.; Gundersen, P.; Moldan, F.; Fernandez, I.J.; Spohn, M. Effects of long-term nitrogen addition on phosphorus cycling in organic soil horizons of temperate forests. Biogeochemistry 2018, 141, 167–181. [Google Scholar] [CrossRef]
- Qu, T.; Du, W.; Yuan, X.; Yang, Z.; Liu, D.; Wang, D.; Yu, L. Impacts of grazing intensity and plant community composition on soil bacterial community diversity in a steppe grassland. PLoS ONE 2016, 11, e0159680. [Google Scholar] [CrossRef] [PubMed]
- Zhang, Y.; Wang, L.; Hu, Y.; Xi, X.; Tang, Y.; Chen, J.; Fu, X.; Sun, Y. Water organic pollution and eutrophication influence soil microbial processes, increasing soil respiration of estuarine wetlands: Site study in Jiuduansha wetland. PLoS ONE 2015, 10, e0126951. [Google Scholar] [CrossRef]
- Heyburn, J.; McKenzie, P.; Crawley, M.J.; Fornara, D.A. Effects of grassland management on plant C: N: P stoichiometry: Implications for soil element cycling and storage. Ecosphere 2017, 8, e01963. [Google Scholar] [CrossRef]
- Dibar, D.T.; Zhang, K.; Yuan, S.; Zhang, J.; Zhou, Z.; Ye, X. Ecological stoichiometric characteristics of Carbon (C), Nitrogen (N) and Phosphorus (P) in leaf, root, stem, and soil in four wetland plants communities in Shengjin Lake, China. PLoS ONE 2020, 15, e0230089. [Google Scholar]
- Thompson, G.L.; Kao-Kniffin, J. Urban grassland management implications for soil C and N dynamics: A microbial perspective. Front. Ecol. Evol. 2019, 7, 315. [Google Scholar]
- Wang, Z.; Chen, L.; Pan, Y.; Zhao, D.; Yang, Y.; Li, X.; Wang, H. Responses in species diversity in the Hulunbuir grassland to phosphorus addition under nitrogen-limiting and non-limiting conditions. Front. Plant Sci. 2024, 15, 1393471. [Google Scholar] [CrossRef] [PubMed]
- Ceulemans, T.; Stevens, C.J.; Duchateau, L.; Jacquemyn, H.; Gowing, D.J.G.; Merckx, R.; Wallace, H.; Rooijen, N.V.; Goethem, T.; Bobbink, R.; et al. Soil phosphorus constrains biodiversity across European grasslands. Glob. Change Biol. 2014, 20, 3814–3822. [Google Scholar] [CrossRef]
- Chi, Y.; Song, S.; Xiong, K. Effects of different grassland use patterns on soil bacterial communities in the karst desertification areas. Front. Microbiol. 2023, 14, 1208971. [Google Scholar] [CrossRef] [PubMed]
- Tahovská, K.; Choma, M.; Čapek, P.; Kaštovská, E.; Kaňa, J.; Kopáček, J. Increased Saprotrophic Activity and Phosphate Leaching Following Forest Soil Decomposition without Root Access. Forests 2024, 15, 1378. [Google Scholar] [CrossRef]
Disclaimer/Publisher’s Note: The statements, opinions and data contained in all publications are solely those of the individual author(s) and contributor(s) and not of MDPI and/or the editor(s). MDPI and/or the editor(s) disclaim responsibility for any injury to people or property resulting from any ideas, methods, instructions or products referred to in the content. |
© 2025 by the authors. Licensee MDPI, Basel, Switzerland. This article is an open access article distributed under the terms and conditions of the Creative Commons Attribution (CC BY) license (https://creativecommons.org/licenses/by/4.0/).