Abstract
Mixing and matching N2-fixing leguminous species is a crucial strategy to enhance quality and efficiency in sustainable forestry. Tree leaves and rhizosphere are primary sites for matter and energy exchange, functioning as key assimilation organs that forests provide for ecological services. The introduction of functional species alters soil properties, which, in turn, directly or indirectly shape leaf functional traits, soil microbial dynamics, and their association. However, the correlation between aboveground functional traits and belowground rhizosphere soil microorganisms of dominant tree species in mixed leguminous and non-leguminous forests remains unclear. In this study, the responses and correlations of leaf functional traits and rhizosphere soil microbial communities of Castanopsis hystrix Hook. f. & Thomson ex A. DC. across three forest types were investigated. A pure forest (PF) of C. hystrix was designated as control forest, while a leguminous mixed forest (LMF) consisting of C. hystrix and the leguminous species Acacia mangium Willd. as well as a non-leguminous mixed forest (NMF) comprising C. hystrix and the non-leguminous species Schima superba Gardner & Champ. served as experimental forests. Seven leaf functional trait indices were measured, and the high-throughput sequencing of soil microbial communities was included in the analysis. The results were as follows: Firstly, compared to the pure forest, the specific leaf area (SLA) of C. hystrix significantly decreased in both mixed forest types (p < 0.05). Additionally, in comparison to the pure forest, the leaf area (LA) and leaf organic carbon content (LOC) of C. hystrix significantly reduced (p < 0.05), whereas the leaf total phosphorus content (LTP) significantly increased in the non-leguminous tree species mixed forest (p < 0.01). The leaf dry matter content (LDMC), relative chlorophyll content (RCC), and leaf total nitrogen content (LTN) of C. hystrix exhibited no significant differences among the three forest types (p > 0.05). Secondly, neither the dominant phyla of rhizosphere soil microorganisms nor the bacterial richness and diversity had differences in the mixed forests. However, the richness and diversity of rhizosphere soil fungi significantly increased in the mixed forests, and those in the leguminous mixed forest exhibited more positive effects compared to those in the non-leguminous mixed forest. Finally, redundancy analysis (RDA) showed significant correlations between plant leaf functional traits and rhizosphere soil microorganisms. Specifically, LDMC, SLA, LTN, and LTP of C. hystrix showed significant correlations with differences in the structure of bacterial community (p < 0.05), and LTN was significantly correlated with differences in the structure of the fungal community (p < 0.05). In summary, we found that plant leaf functional traits and the community of rhizosphere soil microorganisms displayed significant differences in the mixed forests, and those mixed with leguminous trees may further enhance the assimilation processes by modifying the utilization of nutrients such as carbon, nitrogen, and phosphorus by plants and microorganisms. Meanwhile, our results support the interaction of physiological and ecological processes between the aboveground and belowground parts of C. hystrix. These findings emphasize the important roles of N2-fixing leguminous trees and synergy of aboveground–belowground processes in establishing sustainable artificial forests.
1. Introduction
Artificial forests represent important natural resources for human welfare. China has the largest expanse of artificial forests globally, covering an area of 79.54 million hectares, which constitutes approximately one-third of the country’s overall forested land [1]. Nonetheless, as indicated by survey statistics from the State Forestry Administration, nearly 50% of tree plantations consist of monoculture forests [2]. The widespread planting of monoculture forests may lead to various issues, such as soil acidification, a decline in biodiversity, and a reduction in forest stability [3,4]. These factors significantly hinder the sustainable development of artificial forest ecosystems. Empirical research has indicated that the establishment of mixed forests, in contrast to pure forests, enhances key ecological functions, including the mitigation of soil acidification [5], the enhancement of biodiversity [6], the increase in soil carbon sequestration [6,7], and the enhancement of forest floor productivity [8]. For instance, a meta-analysis of global datasets on multispecies planting research has shown that mixing tree species from different functional types generally enhanced resource use efficiency and increased productivity, primarily through the interactions among different tree species as they occupy their respective ecological niches, facilitating mutual support and compensation, thereby contributing to a more resilient and stable forest ecosystem [9]. In comparison to pure forests, the productivity of mixed forests can increase by 20% to 30%, with stands that incorporate N2-fixing tree species potentially experiencing productivity increases of up to 50% [10,11,12]. Li et al. [13] demonstrated that the relative abundance of certain dominant phyla in the bacterial and fungal communities of mixed forests comprising Pinus massoniana Lamb. and Erythrophleum fordii Oliv. increased significantly compared to pure P. massoniana forest. A study by Gei and Powers [14] revealed that introducing Acosmium panamense Benth., a N2-fixing leguminous tree species, into artificial forest afforestation significantly enhanced soil total carbon, total nitrogen, labile carbon content, and potential nitrogen mineralization rates, compared to non-N2-fixing species. Ren et al. [15] analyzed the differences in leaf functional traits of Pinus thunbergii Parl. between mixed and pure forests. Their results indicated that the leaf functional traits of P. thunbergii, such as leaf area and leaf carbon content, differed significantly when mixed with Robinia pseudoacacia L. Additionally, soil organic carbon, total nitrogen, and total phosphorus levels also showed significant differences, with soil organic carbon having a notable impact on leaf functional traits. Furthermore, N2-fixing leguminous tree species are widely distributed across various terrestrial ecosystems. The symbiotic N2-fixing of leguminous species satisfied their own nitrogen demand and simultaneously contributed significant amounts of inorganic nitrogen to the mixed-forest ecosystem through litter and organic debris [16]. However, the presence of leguminous trees may intensify interspecific competition among leguminous species in mixed forests [17]. To date, research on mixed forests comprising leguminous tree species predominantly addressed aspects such as plant community structure [18], forest productivity [19], soil nutrient dynamics [14,20], and carbon sequestration [21]. Nevertheless, there remains a limited understanding of how plant physiological ecology and soil microorganisms adapt to the mixed planting of leguminous and non-leguminous tree species.
The leaves and rhizosphere of trees serve as essential sites for the exchange of substances and energy, playing a crucial role in the ecological services rendered by these organisms. On one hand, the functional traits of plant leaves are sensitive indicators of the adaptive strategies that trees employ in response to environmental fluctuations [22,23]. For example, in response to water stress across various habitats, Tamarix ramosissima Ledeb. has demonstrated resource-conserving adaptations, including an increase in leaf thickness and a reduction in both leaf area and specific leaf area to mitigate stress effects [24]. When mixed with Caragana korshinskii Kom., Pinus sylvestris var. mongholica Litv. modifies its physiological traits by decreasing its specific leaf area and enhancing leaf nitrogen content, thereby improving resource acquisition within the mixed-species forest [25]. Following shading, Heptapleurum heptaphyllum (L.) Y. F. Deng has been observed to increase biomass accumulation through enhancements in leaf thickness, leaf fresh mass, and leaf dry mass. Conversely, Duranta erecta L. enhanced its light capture efficiency by increasing specific leaf area while simultaneously decreasing both leaf fresh mass and leaf dry mass [26]. Furthermore, Taxus wallichiana var. mairei (Lemée & H. Lév.) L. K. Fu & Nan Li adapted to a high-nitrogen environment by increasing its specific leaf area in response to elevated nitrogen input, while also maintaining stable growth and enhancing its resilience through improved phosphorus utilization rates and the regulation of stoichiometric ratios [27]. On the other hand, the rhizosphere represents a zone in which the root systems of plants engage in active interactions with microorganisms. Soil microorganisms within the rhizosphere exhibit adaptive responses to environmental fluctuations in a top-down manner, and rhizosphere secretions play an important role in this adaptation process. Typically, root secretions, as an important component of rhizosphere deposition, can be classified based on molecular weight into two categories: high-molecular-weight and low-molecular-weight root secretions. High-molecular-weight secretions are predominantly composed of mucilage and extracellular enzymes, with mucilage comprising polysaccharides and oligosaccharides. Conversely, low-molecular-weight secretions mainly include low molecular organic acids, sugars, phenols, and various amino acids (including non-protein amino acids such as those involved in iron transport in plants) [28]. Carbon fixed by plants through photosynthesis can be released into the rhizosphere as root secretions. These secretions, along with various secondary rhizosphere metabolites, supply essential carbon, nitrogen, and other nutrients to the rhizosphere microorganisms, significantly influencing the diversity and abundance of these microbial communities [29]. In response to environmental stress, plants can release different types of root secretions to alleviate adverse effects. Beneficial microorganisms in the rhizosphere, referred to as PGPM (plant growth-promoting microorganisms), can enhance plant resilience through mechanisms such as the production of antimicrobial compounds and the induction of resistance [30]. This reciprocal feedback between aboveground and belowground processes contributes to the establishment of more complex and stable ecosystems. In recent years, the significance of plant functional traits and microbial diversity in enhancing ecosystem multifunctionality have become research hotspots [31,32]. Differences in plant functional traits influence the quantity, quality, and decomposition rates of litter, which serves as a vital nutrient source for soil microorganisms, while differences in litter quantity and quality further regulate soil microbial communities [33,34]. Although the relationship between the two has been explored in different studies, the results have not yielded consistent conclusions. For example, Li et al. [35] and Li et al. [36] demonstrated a significant correlation between plant functional traits and the diversity and composition of rhizosphere soil microbial communities. Conversely, Leff et al. [37] reported an absence of correlation between plant functional traits and the diversity of rhizosphere soil microbial communities. Currently, it appears that this relationship may be influenced by various factors, including soil type, climate [36], and mixed planting methods [35]. Research has shown that mixing with leguminous or non-leguminous tree species has an impact on the physicochemical properties of soil. Furthermore, these soil properties have a direct impact on leaf functional traits and soil microbial communities, with the correlation between the two exhibiting some degree of differences [38]. However, further investigation is required to understand how the mixing with leguminous or non-leguminous species has an impact on correlation between leaf functional traits and soil microorganisms.
Castanopsis hystrix is an evergreen broadleaf tree belonging to the Fagaceae family and the Castanopsis genus. It has long been a valuable native timber and afforestation species widely planted in South China due to its strong adaptability, rapid growth rate, straight trunk, and high-quality wood [39,40,41]. Recent studies on artificial forests of C. hystrix has predominantly focused on comparative analyses of soil physicochemical properties [42,43], microbial communities [42,44], nutrient cycling [45], forest restoration [46], and biodiversity [47]. However, the adaptations and correlations between the leaf functional traits of C. hystrix and the rhizosphere soil microbial communities in mixed-forest ecosystems containing both leguminous and non-leguminous species remain unclear. In South China, Acacia mangium and Schima superba are common plantation species, representing typical N2-fixing leguminous and non-leguminous species [48], respectively, and are often selected for mixed-forest plantations. This study focuses on three specific forest types: a pure forest of C. hystrix, a mixed forest of C. hystrix and A. mangium, and a mixed forest of C. hystrix and S. superba. The objective is to investigate the responses and adaptations of C. hystrix after being mixed with leguminous (A. mangium) and non-leguminous (S. superba) tree species, thereby providing data to assess the sustainability of mixed forests containing C. hystrix. Our study mainly answers the following three questions: (1) How do the leaf functional traits of C. hystrix respond when mixed with leguminous and non-leguminous tree species? (2) How does the rhizosphere soil microbial community of C. hystrix respond when mixed with leguminous and non-leguminous tree species? (3) Are there correlations between leaf functional traits and the diversity of the rhizosphere soil microbial community, and what are the characteristics of these correlations? Addressing these questions will yield mechanistic insights that enhance our understanding of the health and sustainability of mixed forests comprising C. hystrix.
2. Materials and Methods
2.1. Materials
2.1.1. Study Site
The study site is located at the Longdong Forestry Station in the northeastern suburbs of Guangzhou, Guangdong Province, China (23°11′02″~23°18′21″ N, 113°20′10″~113°27′50″ E). This area is characterized by a subtropical monsoon climate, which includes hot summers and mild winters, with an average annual temperature of 21.7 °C and an average annual precipitation of 1694 mm [49]. The afforestation zone is situated in a hilly landscape covering a total forest land area of 1622 hectares, of which approximately 932 hectares are classified as ecological public welfare forests, representing 57.4% of the total area. The altitude within the forest farm varies from 100 to 538 m. The dominant soil type is mountain reddish loam, primarily resulting from the prolonged weathering of rocks such as granite and sandstone. Most regions exhibit a high organic matter content in the topsoil, with a soil layer thickness ranging from 40 to 80 cm. The soil of plots is characterized as strongly acidic, with a pH value of 4.03–4.11, soil total potassium content of 6.35–13.49 g kg−1, available phosphorus of 0.63–0.72 mg kg−1, and available potassium of 29.99–32.41 mg kg−1 [50]. The artificial forest in this region displays a simple forest structure, with vegetation stratified into a canopy layer and an understory layer, which includes herbs, shrubs, and small trees, with Castanopsis hystrix being the dominant species in the canopy layer [51].
2.1.2. Experiment Design and Sampling
At the Longdong Forestry Station, three different types of artificial forest stands, characterized by comparable site conditions and understory vegetation, were selected for study: monoculture forest (pure forest, PF) consisting solely of C. hystrix, a leguminous mixed forest (leguminous mixed forest, LMF) comprising C. hystrix and the N2-fixing leguminous species Acacia mangium, and a non-leguminous mixed forest (non-leguminous mixed forest, NMF) featuring C. hystrix alongside the non-leguminous species Schima superba. In January 2024, three plots measuring 20 m × 20 m were investigated in each forest type (for a total of 9 plots). During the measurement of each tree within these plots, basic information was recorded, including tree height and diameter at breast height (DBH, DBH ≥ 5 cm) for each species, from which averages were subsequently calculated (refer to Table 1). Significantly, C. hystrix constituted over 60% of the cross-sectional area in the pure forest, leguminous mixed forest, and non-leguminous mixed-forest plots. In April 2024, a sampling of the average trees from the nine plots was undertaken. Following the guidelines of LY/T2812-2017 [52], six healthy and robust trees of C. hystrix were systematically selected in an “S” line from each forest type of pure C. hystrix forest, leguminous mixed forest, and non-leguminous mixed forest. From the outer edge of the crown of each selected tree, approximately 200 g of fully expanded, healthy, mature leaves from the current year’s growth were randomly collected at a uniform height in the east, south, west, and north orientations. Rhizosphere soil was brushed off with a small brush disinfected with alcohol at 1–3 mm from the root of each sample tree (at the one-third division line from the trunk), and soil samples were then collected and placed into 2 mL sterile centrifugal tubes, yielding a total of 54 soil samples. These samples were promptly placed in a foam box containing dry ice for transportation back to the laboratory, where they were stored in a −80 °C ultra-low-temperature freezer for soil DNA extraction, PCR amplification, and high-throughput sequencing within two weeks. Sample plot locations are shown in Figure 1.

Table 1.
Basic information of three forest types in tree-by-tree measurement and soil physio-chemical properties.

Figure 1.
Sample plot locations and photos of the site. Note: PF—pure forest, LMF—leguminous mixed forest, NMF—non-leguminous mixed forest (the same below).
2.2. Methods
2.2.1. Measurement of Leaf Functional Traits
The processing of leaf samples was conducted in a systematic manner. Initially, the leaf area (LA) of twelve randomly selected mature leaves from the current growth season was quantified using ImageJ (version 1.54k) software. Subsequently, six of these leaves were randomly selected for the measurement of relative chlorophyll content (RCC) using a plant nutrient detector, specifically the SPAD-502 (Konica Minolta, Tokyo, Japan). Following this, the twelve leaves were weighed using an electronic balance with an accuracy of 0.001 g to determine the fresh leaf mass. These twelve leaves, along with an extra 200 g of fresh leaves, were then placed in paper envelopes and put through an initial drying process in an oven at 105 °C for a duration of two hours, followed by baking at 75 °C until a constant mass was achieved. The dry leaf mass of the twelve leaves was subsequently recorded. The specific leaf area (SLA) was calculated as the ratio of leaf area to dry leaf mass (cm2 g−1), while the leaf dry matter content (LDMC) was calculated as the ratio of dry leaf mass to fresh leaf mass (g g−1). The dried 200 g leaf samples were ground, and the leaf organic carbon content (LOC, g kg−1) was measured using the oxidative volumetric method with potassium dichromate. Additionally, the leaf total nitrogen (LTN, g kg−1) was measured through distillation titration, and the leaf total phosphorus content (LTP, g kg−1) was determined using the vanadium–molybdenum yellow colorimetric method [53].
2.2.2. High-Throughput Amplicon Sequencing of Soil Microbes
Extraction of Genomic DNA from Soil Microorganisms
Genomic DNA from rhizosphere soil microorganisms was extracted from 2 mL centrifugal tube soil samples (6 replicate soil samples from each plot, 18 samples from one forest type, and a total of 54 samples were subjected to microbiological sequencing) that had been preserved in an ultra-low temperature freezer, in accordance with the protocol outlined in the E.Z.N.A.® Soil DNA Kit. The quality of the extracted DNA was evaluated by agarose gel electrophoresis using a 1% agarose gel, while the concentration and purity of the DNA were quantified using the NanoDrop 2000 spectrophotometer (Thermo Fisher Scientific, Waltham, MA, USA).
PCR Amplification and High-Throughput Sequencing
The extracted DNA was forwarded to Shanghai Meiji Biomedical Technology Co. (Shanghai, China) for the amplification and sequencing of the bacterial 16S rRNA gene and the fungal internal transcribed spacer (ITS) gene. The amplification of the bacterial 16S rRNA gene was conducted using the primers 338F (5′-ACTCCTACGGGAGGCAGCAG-3′) and 806R (5′-GGACTACHVGGGTWTCTAAT-3′) [54]. For the fungal ITS gene, amplification was carried out using the primers ITS1F (5′-CTTGGTCATTTAGAGGAAGTAA-3′) and ITS2R (5′-GCTGCGTTCTTCATCGATGC-3′) [55]. Following amplification via a T100 Thermal Cycler PCR instrument (BIO-RAD, Hercules, CA, USA), the PCR products were isolated after electrophoresis, purified with a DNA Gel Recovery and Purification Kit (PCR Clean-Up Kit, Shanghai Meiji Suhua Biomedical Technology Co., Shanghai, China), and quantified using a Qubit 4.0 (Thermo Fisher Scientific, MA, USA). Subsequently, a MiSeq library was constructed using the Next flex Rapid DNA-Seq Kit. After successfully passing quality control assessments, sequencing was performed on the Illumina MiSeq PE300 sequencing platform.
2.2.3. Data Analysis
The double-ended raw sequencing data were obtained from the sequencing platform and underwent quality control using fastp software (version 0.19.6) [56]. The proportion of reads with Q30 and Q20 scores in all samples exceeded 95%, and they could be assembled through FLASH software (version 1.2.11) [57]. Following the default parameters of the Qiime2 workflow [58], the optimized sequences were denoised using either the DADA2 [59] plugin or the Deblur [60] plugin, with the exclusion of chloroplast and mitochondrial sequences annotated in the samples. Subsequently, the sequences were subjected to pump-flattening to reduce the influence of sequencing depth on subsequent data analyses, including alpha diversity. The processed sequences were clustered at a 97% similarity threshold using Usearch [61], which involved selecting sequences with the highest frequency while eliminating chimeric sequences to delineate each operational taxonomic unit (OTU). All sequences were classified into OTUs based on varying degrees of similarity, with representative OTUs at the 97% similarity level employed for further annotation, where OTUs represent species taxonomic information. Ultimately, the effective OTUs for all samples were counted and normalized, and then the Venn Diagram package in R (version 4.2.1) was used to analyze the common and unique OTUs among the samples, with the results presented in the form of a Venn diagram.
Following data processing, the annotated representative operational taxonomic units (OTUs) for both bacteria and fungi were analyzed using the ribosomal database project (RDP, version 11.5) [62] classifier in combination with the Silva database (version 138, Release138 http://www.arb-silva.de), as well as the basic local alignment search tool (BLAST, version 2.2.24) [63] classifier within the Unite database (version 8, Release 8.0 http://unite.ut.ee/index.php (accessed on 18 May 2024)). All obtained raw sequence datasets have been uploaded to the NCBI Sequence Read Archive (SRA) with the accession number PRJNA1214083. Then, we analyzed the microbial community composition in three forest types using ggplot2 in R (version 4.2.1) to draw community bar graphs based on the phylum level. In order to explore the diversity of rhizosphere soil microbial communities, the alpha diversity indices, specifically Chao1, Shannon, and Simpson, were then calculated for each group of samples using Mothur (version 1.48.0) software [64]. In addition, the Wilcoxon rank-sum test was used to analyze the differences between the sample groups. Rarefaction curve graphs were plotted using ggplot2 and dplyr packages in R (version 4.2.1). They were used to determine whether the sample size was sufficient to cover most of the species or microbial types in the community. The calculations for the alpha diversity indices are presented in Equations (1)–(3).
Richness Chao1 index:
The Chao1 index was introduced by Chao in 1984 [65]. Chaol denotes the predicted number of OTUs, Sobs denotes the actual number of OTUs, n1 denotes the number of OTUs with only one sequence (e.g., singletons), and n2 denotes the number of OTUs with only two sequences (e.g., doubletons). Higher value of Chaol indicates greater richness of the microbial community.
Simpson index:
Shannon index:
The Simpson index was introduced by Simpson in 1949 [66], and the Shannon index was introduced by Shannon in 1948 [67]. Sobs denotes the actual number of OTUs, N denotes the number of all sequences, and ni denotes the number of sequences contained in the i-th OTU. A higher Simpson value indicates lower diversity, while a higher Shannon value indicates higher diversity.
In order to analyze the differences in community structure, principal coordinate analysis (PCoA) based on the unweighted unifrac distance metric was conducted at the OTU level. This analysis aimed to evaluate the similarities and differences in the composition of rhizosphere soil microbial communities across different groups. Simultaneously, the analysis of similarity (ANOSIM) was employed to determine whether the observed differences between groups (two or more) were significantly greater than the differences within the groups, thereby assessing the significance of the groupings. PCoA and ANOSIM were performed using the vegan package in R (version 4.2.1). The software LEfSe (version 1.1.2) [68] was used to perform a linear discriminant analysis (LDA) of the samples based on their taxonomic composition across three forest types. This analysis aimed to identify the communities or species that exhibited a statistically significant influence on the differentiation of the samples.
Finally, we conducted a comparative analysis of leaf functional traits in three forest types and investigated the relationship between microbial samples and leaf functional traits in three forest types. Additionally, we assessed the correlation between the seven functional traits across all samples and the α-diversity index of rhizosphere soil bacteria and fungi, as well as the relative abundance of dominant phyla. The details are as follows: (1) To investigate the differences in leaf functional traits of C. hystrix across different forest types, in SPSS (version 27.0.1), a one-way ANOVA was conducted to analyze the significance of differences in seven leaf functional traits, i.e., leaf area (LA), specific leaf area (SLA), leaf dry matter content (LDMC), root-to-crown ratio (RCC), leaf organic carbon (LOC), leaf total nitrogen (LTN), and leaf tissue phosphorus (LTP). A total of 54 samples were analyzed, comprising six trees per plot across three plots for each forest type, resulting in 18 total replications. Furthermore, LSD multiple comparisons were conducted with a significance threshold set at p < 0.05. (2) A redundancy analysis (RDA) was conducted using seven functional trait indices of C. hystrix from 54 leaf samples, with the relative abundance of OTUs measured from 54 rhizosphere soil samples. This analysis aimed to analyze the correlation between leaf functional traits and rhizosphere soil microorganisms. Additionally, the envfit function could further quantify the fitness of the leaf functional traits to the sorting axis and to identify the leaf functional traits that significantly influenced rhizosphere soil microorganisms. The purpose of the permutation test was to test the significance of the relationship between variables and to determine whether the observed significant relationship between plant functional traits and microbial samples is real or due to random factors. (3) Mantel Test was calculated to evaluate the positive or negative correlations between the seven leaf functional traits (54 samples) and the α-diversity indices of rhizosphere soil bacteria and fungi, as well as the relative abundance of dominant phyla, with significance also determined at p < 0.05. RDA and Mantel Test were performed using the vegan package in R (version 4.2.1).
3. Results
3.1. Castanopsis Hystrix Leaf Functional Traits
Significant differences in leaf functional traits were observed in mixed forests of C. hystrix with leguminous or non-leguminous species when compared to pure forest of C. hystrix. In comparison to pure forest, the leaf area (LA) of C. hystrix showed a highly significant reduction in non-leguminous mixed forest (p < 0.01). Additionally, specific leaf area (SLA) was highly significantly reduced in both types of mixed forests (p < 0.01). However, leaf dry matter content (LDMC) did not demonstrate significant differences across the three forest types (p > 0.05) (Figure 2a–c). Furthermore, leaf organic carbon (LOC) of C. hystrix was significantly lower in non-leguminous mixed forest (p < 0.05), while leaf total phosphorus (LTP) showed a highly significant increase in the same forest type (p < 0.01). Conversely, leaf total nitrogen (LTN) and relative chlorophyll content (RCC) did not show significant differences among the three forest types (p > 0.05) (Figure 2d–g).
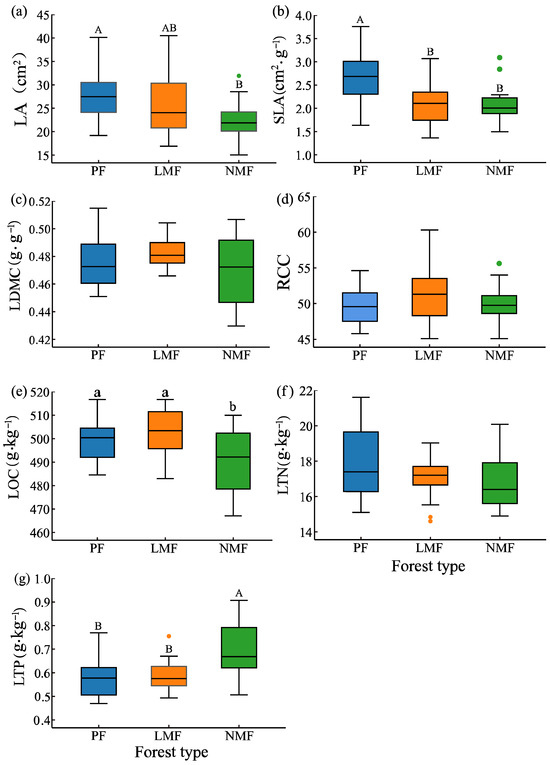
Figure 2.
The effect of tree species mixing of leguminous and non-leguminous species on leaf functional traits of C. hystrix. Note: PF—pure forest, LMF—leguminous mixed forest, NMF—non-leguminous mixed forest. (a) LA—leaf area, (b) SLA—specific leaf area, (c) LDMC—leaf dry matter content, (d) RCC—relative chlorophyll content, (e) LOC—leaf organic carbon content, (f) LTN—leaf total nitrogen content, (g) LTP—leaf total phosphorus content. The error bars represent the standard deviation of the mean values (n = 18). Distinct letters are used to denote the significance of differences in functional traits of C. hystrix leaves across various forest types, with uppercase letters (A, B) indicating highly significant differences (p < 0.01) and lowercase letters (a, b) indicating significant differences (p < 0.05). Given the considerable variability in field conditions, data from all the samples in each plot were incorporated into the analysis, and the points depicted in the figure that were identified as outliers were also incorporated into the analysis.
3.2. Rhizosphere Soil Microbial Community of Castanopsis hystrix
3.2.1. Sample Size Testing
After quality control for this experiment, a total of 2,892,746 high-throughput bacterial reads and 7,045,726 high-throughput fungal reads were obtained. Following the random draw leveling process for each sample, in accordance with the default minimum number of samples read, we ultimately obtained 2,084,130 valid sequences for bacteria and 3,297,780 valid sequences for fungi per sample. The average length of the sequences was about 410 bp (bacterial) and 246 bp (fungal). As can be seen in Figure S1, the rarefaction curves for both bacterial and fungal reads exhibited a gradual plateau as the number of reads increased. This observation indicates that the quantity of reads was sufficient to detect the majority of microorganisms present, thereby effectively demonstrating the diversity of bacteria and fungi in the rhizosphere soil and ensuring the reliability of subsequent analyses [69].
3.2.2. Effects of Tree Species Mixing on the Composition of Soil Microbial Communities in the Rhizosphere of C. hystrix
In the pure forest of C. hystrix (PF), a total of 4081 operational taxonomic units (OTUs) of bacteria and 2229 OTUs of fungi were identified. In contrast, the forest of C. hystrix mixed with leguminous tree species (LMF) exhibited 3733 bacterial OTUs and 2926 fungal OTUs. Furthermore, the C. hystrix forest mixed with non-leguminous species (NMF) revealed 4230 bacterial OTUs and 2990 fungal OTUs (Figure 3a,b). These findings suggest that the incorporation of both leguminous and non-leguminous tree species into the C. hystrix ecosystem enhances the total number of fungal OTUs within its rhizosphere; however, the total bacterial OTUs in the two types of mixed forest were lower or higher than that of the C. hystrix pure forest. This indicates that the total number of bacterial OTUs is influenced by the species composition of the mixed forests. A total of 2487 bacterial OTUs and 923 fungal OTUs were found to be shared across the rhizospheres of PF, LMF, and NMF. Notably, the rhizosphere of C. hystrix in NMF exhibited the least difference in endemic rhizosphere bacteria, while mixing with leguminous tree species did not result in an increase but rather a decrease in the total OTUs of endemic rhizosphere bacteria. Conversely, with respect to rhizosphere fungi, the number of endemic fungal OTUs in the two mixed forests rose from 630 to 1061 and 1089, respectively, surpassing the number of shared fungal OTUs by 138 and 166, respectively.
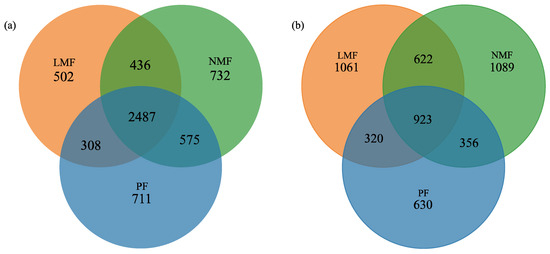
Figure 3.
Venn diagram of shared and endemic OTUs of bacteria (a) and fungi (b) in the rhizosphere of C. hystrix in pure forest and mixed forests of leguminous and non-leguminous species.
Following the taxonomic annotation of operational taxonomic units (OTUs) utilizing the Silva database for bacteria and the UNITE database for fungi, the analysis revealed that the bacterial taxa were classified into 28, 27, and 28 phyla across the C. hystrix pure forest (PF), the C. hystrix mixed with leguminous species forest (LMF), and the C. hystrix mixed with non-leguminous species forest (NMF), respectively. Meanwhile, fungal taxa were classified into 14, 13, and 14 phyla across these same forest types. In all three forest types, the top ten shared bacterial phyla accounted for 97.68%, 97.81%, and 97.25% of the total bacterial taxa, respectively (Figure 4a). The top five predominant bacterial phyla identified were Proteobacteria, Actinobacteriota, Acidobacteriota, Chloroflexi, and Planctomycetota. Similarly, the top ten shared fungal phyla accounted for 99.98%, 99.99%, and 99.98% of the total fungal taxa across the respective forest types (Figure 4b). The top five predominant fungal phyla were Basidiomycota, Ascomycota, Unclassified_k_Fungi (in the UNITE database, Unclassified_k_Fungi is a fungal group that has not been clearly classified at the phylum level), Mortierellomycota, and Glomeromycota.
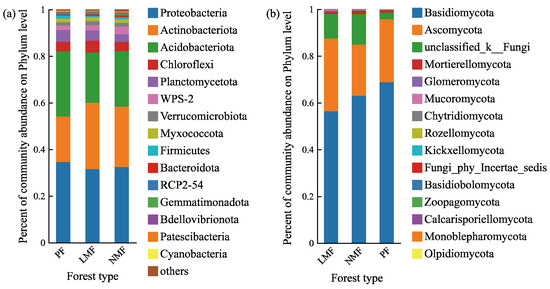
Figure 4.
The relative abundance of bacterial phyla (a) and fungal phyla (b) in the rhizosphere of C. hystrix in pure forest and mixed forests of leguminous and non-leguminous species. Different colours in the figures indicate relative abundance at different phyla levels. In the Silva database, WPS-2 and RCP-54 are a bacterial group that has not been clearly classified at the phylum level. In the UNITE database, Unclassified_k_Fungi and Fungi_phy_Incertae_sedis are a fungal group that has not been clearly classified at the phylum level.
The introduction of leguminous or non-leguminous tree species into forest ecosystems exerted an influence on the relative abundances of certain dominant microbial phyla. Specifically, within the top ten dominant bacterial phyla, the relative abundances of Actinobacteria and Bacteroidota were significantly increased in both the leguminous mixed forest (LMF) and the non-leguminous mixed forest (NMF) when compared to the pure forest of C. hystrix (PF) (p < 0.05). However, no significant differences were observed between the LMF and NMF (p > 0.05). Conversely, the relative abundances of Acidobacteria and Firmicutes were significantly reduced in LMF (p < 0.05), with Firmicutes showing a significant difference between LMF and NMF (p < 0.05). Additionally, the relative abundances of Planctomycetes and WPS-2 were significantly higher in NMF compared to PF (p < 0.01), with Planctomycetes being significantly more abundant in LMF than in NMF (p < 0.05), and WPS-2 (In the Silva database, WPS-2 is a bacterial group that has not been clearly classified at the phylum level) showing a significantly higher abundance in NMF than in LMF (p < 0.05). No significant differences were observed in the other bacterial phyla (p > 0.05) (Figure 5a). For the top ten dominant fungal phyla, the relative abundances of Glomeromycota, Unclassified_k_Fungi, and Fungi_phy_Incertae_sedis (in the UNITE database, Fungi_phy_Incertae_sedis is a fungal group that has not been clearly classified at the phylum level) were significantly increased in both mixed forest types compared to PF (p < 0.05), although no significant differences were found between the two mixed forest types (p > 0.05). The relative abundance of Mucoromycota was significantly lower in LMF (p < 0.05), while Kickxellomycota exhibited a significantly lower abundance in NMF (p < 0.05). Furthermore, the abundance of Ascomycota did not differ significantly between pure and mixed forests (p > 0.05), but significant differences were observed between LMF and NMF (p < 0.05). No significant differences were found in the relative abundances of the other fungal phyla (p > 0.05) (Figure 5b).
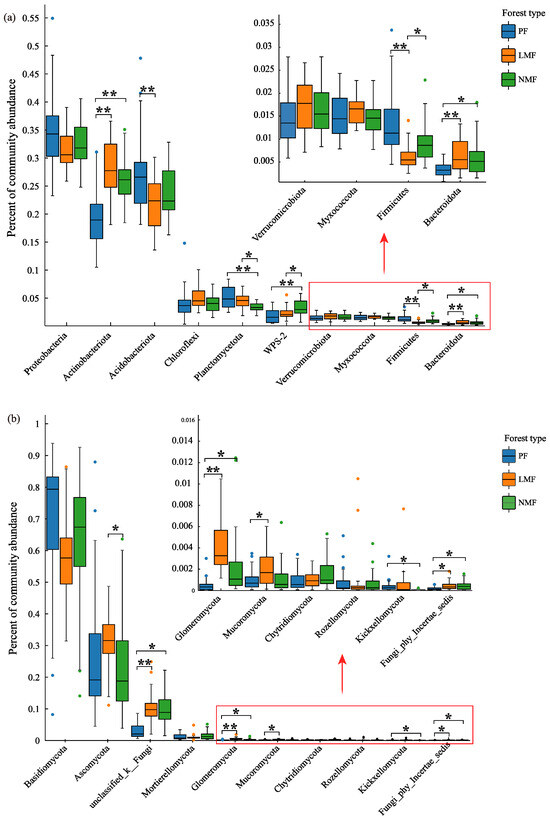
Figure 5.
Analysis of significant differences in rhizosphere bacterial phyla (a) and fungal phyla (b) of C. hystrix in pure forest and mixed forests of leguminous and non-leguminous species. Note: Error bars indicate standard deviation of means (n = 18). Significance of differences is indicated by *, where “**” indicates highly significant differences (p < 0.01), and “*” indicates significant differences (p < 0.05). In the Silva database, WPS-2 is a bacterial group that has not been clearly classified at the phylum level. In the UNITE database, Unclassified_k_Fungi and Fungi_phy_Incertae_sedis are two fungal groups that have not been clearly classified at the phylum level.
3.2.3. Effects of Tree Species Mixing on the Diversity of Soil Microbial Communities in the Rhizosphere of Castanopsis hystrix
The mixing of tree species in plantations had different effects on the diversity of bacterial and fungal communities within the rhizosphere of C. hystrix. Specifically, the introduction of species mixing did not result in significant differences in the richness or diversity of the bacterial community in the rhizosphere soil. Statistical analyses indicated no significant differences in the bacterial richness indices (Chao1 index) or community diversity indices (Shannon index and Simpson index) between the pure forest of C. hystrix and the mixed forests (p > 0.05). Conversely, tree species mixing significantly increased both the richness and diversity of fungal communities in the rhizosphere soil. In comparison to pure forest, mixed forests of C. hystrix exhibited significantly higher fungal Chao1 and Shannon indices (p < 0.05), accompanied by a significantly lower Simpson index (p < 0.05). Furthermore, the mixed forest of C. hystrix with leguminous species demonstrated a greater capacity to enhance the richness and diversity of rhizosphere soil fungal communities in comparison to the mixed forest of C. hystrix with non-leguminous species (Table 2). Principal coordinates analysis (PCoA) conducted on the rhizosphere soil bacterial and fungal communities of C. hystrix across the three forest types revealed that no significant differences in the composition of the bacterial community were found between pure and mixed forests. However, significant differences were observed in the composition of the fungal community in the rhizosphere soil. ANOSIM also revealed significant differences in the composition of the rhizosphere fungal community of C. hystrix, and the differences between groups were greater than those observed within groups (r = 0.8277, p = 0.001) (Figure 6a,b).
Table 2.
Alpha (α) diversity indices of bacteria and fungi in the C. hystrix rhizosphere soil in pure and mixed forests.
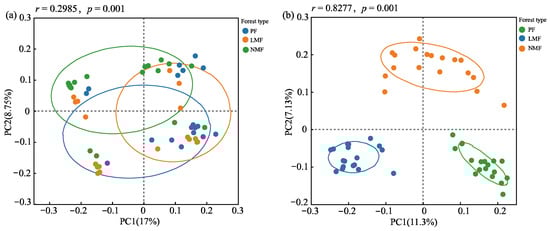
Figure 6.
Results of principal coordinate analysis (PCoA) of rhizosphere soil bacteria (a) and fungi (b) in the C. hystrix pure forest and mixed forests. The dots represent the microbial community of each sample, and the circles represent confidence intervals.
3.2.4. Discriminant Analysis of Species Differences in Rhizosphere Soil Microbial Communities of Castanopsis hystrix Across Three Forest Types
To analyze biomarkers with statistically significant differences in abundance across the three forest types, the linear discriminant analysis effect size (LEfSe) method was used to analyze the species that play important roles in each group. In the LEfSe clustering dendrogram, nodes colored blue, orange, and green correspond to bacterial and fungal groups that play important roles in the C. hystrix pure forest (PF), mixed C. hystrix with leguminous species (LMF), and mixed C. hystrix with non-leguminous species (NMF), respectively (Figure 7a,b).
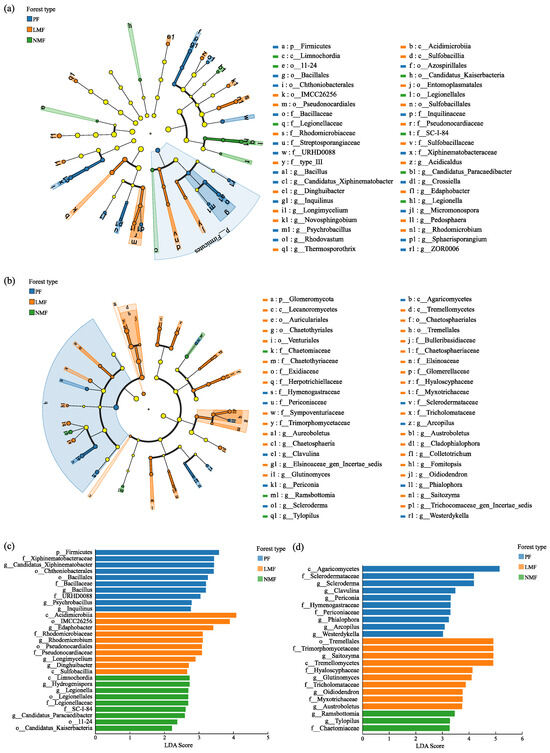
Figure 7.
Results of LEfSE analysis of rhizosphere soil bacteria (a,c) and fungi (b,d) in the C. hystrix pure forest and mixed forests. Note: Figures (a,b)—yellow nodes represent microbial taxa that do not play significant roles in any of the subgroups. The arrangement of circles, progressing from the innermost to the outermost, represents species at the taxonomic levels of phylum (p), class (c), order (o), family (f), and genus (g). Figures (c,d)—Different colours indicate colonies aggregated in different forest types.
The linear discriminant analysis (LDA) plot derived from the LEFSe analysis identified 29 taxa with significant differences in abundance among rhizosphere soil bacteria at an LDA threshold of 2 (Figure 7c). Within the PF group, 10 bacterial taxa were significantly higher abundances (LDA Score > 2.5), which included Firmicutes at the phylum level; Chthoniobacteriales and Bacillales at the order level; Xiphinematobacteraceae, Bacillaceae, and URHD0088 (in the Silva database, URHD0088 is a bacterial group that has not been clearly classified at the family level) at the family level; and Candidatus_Xiphinematobacter, Bacillus, Psychrobacillus, and Inquilinus at the genus level. In the LMF group, a similar trend was observed, with 10 bacterial taxa significantly elevated (LDA Score > 2.5), including Acidimicrobiia and Sulfobacillia at the class level; IMCC26256 (in the Silva database, IMCC26256 is a bacterial group that has not been clearly classified at the order level) and Pseudonocardiales at the order level; Rhodomicrobiaceae and Pseudonocardiaceae at the family level; and Edaphobacter, Rhodomicrobium, Longimycelium, and Dinghuibacter at the genus level. Furthermore, in the NMF group, seven bacterial taxa were significantly elevated (LDA Score > 2.5), which included Limnochordia at the class level; Legionellales at the order level; Legionellaceae and SC-I-84 (in the Silva database, SC-I-84 is a bacterial group that has not been clearly classified at the family level) at the family level; and Hydrogenispora, Legionella, and Candidatus_Paracaedibacter at the genus level. A total of 23 taxa were identified with significant differences in abundance among rhizosphere soil fungi under the LDA threshold of 3 (Figure 7d). Within the PF group, 10 fungal taxa were significantly higher (LDA Score > 3), which included Agaricomycetes at the class level; Sclerodermataceae, Hymenogastraceae, and Periconiaceae at the family level; and Scleroderma, Clavulina, Periconia, Phialophora, Arcopilus, and Westerdykella at the genus level. Similarly, in the LMF group, 10 fungal taxa were found to be significantly higher (LDA Score > 3), including Tremellomycetes at the class level; Tremellales at the order level; Trimorphomycetaceae, Hyaloscyphaceae, Tricholomataceae, and Myxotrichaceae at the family level; and Saitozyma, Glutinomyces, Oidiodendron, and Austroboletus at the genus level. Additionally, in the NMF group, three fungal taxa were significantly higher (LDA Score > 3), including Chaetomiaceae at the family level, and Ramsbottomia and Tylopilus at the genus level.
3.3. Association of Leaf Functional Traits with Rhizosphere Soil Microbial Diversity
3.3.1. Relationship Between Leaf Functional Traits and Rhizosphere Bacterial and Fungal Communities
The results of redundancy analysis (RDA) revealed significant correlations between bacterial and fungal communities and leaf functional traits, with the first and second ordering axes explaining 63.97% and 62.96% of the total variance in bacterial and fungal variables, respectively (Figure 8a,b). The results of the RDA, along with the envfit function test, identified leaf dry matter content (LDMC), specific leaf area (SLA), leaf nitrogen content (LTN), and leaf phosphorus content (LTP) as the primary factors affecting the structure of the rhizosphere bacterial community in C. hystrix. Furthermore, LTN was also identified as the predominant factor affecting the structure of the rhizosphere fungal community in C. hystrix (Figure 8a,b, Table 3).

Figure 8.
Redundancy analysis of C. hystrix leaf functional traits and rhizosphere bacteria (a) and fungi (b) in pure forest and mixed forests of leguminous and non-leguminous species. Note: PF—pure forests, LMF—leguminous mixed forest, NMF—non-leguminous mixed forest. LA—leaf area, SLA—specific leaf area, LDMC—leaf dry matter content, RCC—relative chlorophyll content, LOC—leaf organic carbon content, LTN—leaf total nitrogen content, LTP—leaf total phosphorus content. The dots represent the microbial community of each sample (54 samples); the arrows correspond to leaf functional traits (54 samples), with the direction of the arrows indicating the direction of change in leaf functional traits in the ordination space. The length of the arrows represents the strength of the correlation between leaf functional traits and the ordination axes. The relative position of the dots to the leaf functional trait arrows reflects the relationship between rhizosphere soil microorganisms and leaf functional traits.
Table 3.
Envfit function test for rhizosphere soil bacterial and fungal communities and leaf functional traits in C. hystrix in pure forest and mixed forests of leguminous and non-leguminous species.
3.3.2. Correlations of Rhizosphere Microbial Alpha (α) Diversity, Relative Abundance of Dominant Flora, and Leaf Functional Traits
The investigation into the correlation between rhizosphere microbial α-diversity indices and the leaf functional traits of C. hystrix demonstrated that the bacterial Shannon and Simpson indices exhibited significant positive correlations with the leaf dry matter content (LDMC) of C. hystrix (p < 0.05). Furthermore, the bacterial Chao1, Simpson, and Shannon indices were also significantly and positively correlated with leaf total nitrogen content (LTN) (p < 0.05), while the Chao1 index showed a significant positive correlation with leaf total phosphorus content (LTP) (p < 0.05). In contrast, none of the fungal α-diversity indices displayed significant correlations with the leaf functional traits (p > 0.05) (Figure 9a,b). The correlation analysis about the relative abundance of dominant bacterial and fungal phyla in relation to plant leaf functional traits revealed that the relative abundance of the bacterial phylum Proteobacteria showed a significant positive correlation with LDMC (p < 0.05). Additionally, the abundance of Chloroflexi was significantly positively correlated with specific leaf area (SLA) (p < 0.05), while the abundances of Actinobacteria and Acidobacteria were significantly positively correlated with LTN (p < 0.05). Moreover, Planctomycetes demonstrated a highly significant positive correlation with relative chlorophyll content (RCC) (p < 0.01). The abundance of the fungal phylum Basidiomycota was significantly positively correlated with leaf organic carbon (LOC) (p < 0.05), and Glomeromycota abundance exhibited a significant positive correlation with SLA (p < 0.05). No significant correlations were found for other dominant phyla in relation to leaf functional traits (p > 0.05).

Figure 9.
Correlation of rhizosphere microbial α-diversity indices, dominant phyla, and leaf functional traits of C. hystrix: (a) bacteria and (b) fungi. Note: Significance of differences is indicated by *, where “**” indicates highly significant differences (p < 0.01), and “*” indicates significant differences (p < 0.05). The size of the circle represents the magnitude of the correlation, while the color indicates whether it is a positive or negative correlation.
4. Discussion
4.1. Response of Leaf Functional Traits of Castanopsis hystrix to the Mixing of Leguminous or Non-Leguminous Tree Species
Changes in leaf functional traits are widely recognized as adaptive responses of plants to their environmental conditions [70,71]. This study investigates the responses of the leaf functional traits of C. hystrix when mixed with both leguminous and non-leguminous trees, which may reflect the adaptive strategies employed by C. hystrix. Firstly, we found that when compared to pure forest of C. hystrix, the specific leaf area (SLA) was significantly reduced in both leguminous and non-leguminous mixed forests. The leaf area (LA) significantly decreased only in non-leguminous mixed forest, while leaf dry matter content (LDMC) showed no significant differences across the three forest types (Figure 2a–c). These results differ from results in several other studies. For instance, Qin et al. [72] reported that LDMC in mixed forest of Pinus massoniana was significantly higher than in pure forest, with no significant differences in LA and SLA. Similarly, Li [73] observed that LA and SLA of Phoebe bournei (Hemsl.) Yen C. Yang significantly increased in mixed forest with Cunninghamia lanceolata (Lamb.) Hook., while SLA of C. lanceolata decreased. Furthermore, Zhang et al. [74] found that the mixing of Eucalyptus urophylla S.T.Blake × Eucalyptus grandis W. Hill ex Maiden with Dalbergia odorifera T. C. Chen led to an increase in LA and LDMC of E. urophylla × E. grandis, accompanied by a reduction in SLA. These different findings indicate the complexity of the effects of tree mixing on leaf functional traits, which are influenced by factors such as mixing species, forest age, and stand conditions. The research findings indicate that plant mixing increases competition for resources, such as light, among different species. In mixed forests, the leaves of C. hystrix have become thinner and smaller in morphology, while maintaining a relatively stable leaf dry matter content to adapt to species mixing.
Secondly, the physiological characteristics of leaves in mixed species of C. hystrix with leguminous and non-leguminous tree species show inconsistent differences, and these differences were linked to the functional type of the mixed species [75]. In comparison to pure forest, mixing with non-leguminous species led to a significant reduction in leaf organic carbon (LOC) and a significant increase in leaf total phosphorus (LTP). However, no significant differences were observed in leaf total nitrogen (LTN) and relative chlorophyll content (RCC) across the three forest types examined (Figure 2d–g). These findings align partially with previous studies on species mixing, which generally indicate that such mixing enhances the nutrient content of leaves. For example, Wang et al. [25] reported that, in comparison to pure forest of Pinus tabuliformis Carrière, mixing with Caragana korshinskii significantly decreased LTP and increased LOC of P. tabuliformis leaves, while no notable difference remained in LTN. Conversely, when Pinus sylvestris var. mongholica was mixed with C. korshinskii, a significant increase in LTN was observed, while LOC and LTP remained relatively stable. Chen et al. [76] investigated the effects of mixing C. lanceolata with both leguminous N2-fixing species (Acacia auriculiformis A. Cunn. ex Benth. and Robinia pseudoacacia L.) and non-leguminous N2-fixing species (Morella rubra Lour. and Alnus formosana Makino) on leaf nitrogen content and found that it significantly or extremely significantly increased in all four mixed forests compared to the pure forest. Additionally, the mixing of Ulmus pumila L. with R. pseudoacacia resulted in significant increases in LTN by 12.44%, LTP by 20.56%, and RCC ranging from 3.5% to 7.98% compared to leaves from pure forest [77]. The discrepancies between the findings of this study and those of previous research may be attributed to the varying interactions of leguminous with different tree mixtures [75]. Theoretically, mixing with leguminous species should have the potential to enhance the nitrogen content in leaf tissues. A mixed forest comprising Acacia mangium, a typical N2-fixing species, is expected to significantly elevate the total nitrogen content in the leaves of C. hystrix leaves when compared to pure forest. However, the findings of this study revealed no statistically significant difference in total leaf nitrogen content across the different mixed forest types, which may be attributed to the nitrogen content within the community being affected by a large number of factors [78]. Specifically, A. mangium, being in a competitive growth phase, likely utilizes a substantial portion of the fixed nitrogen for its own growth, returning only a limited amount to the soil through litter, most of the nitrogen is retained within the plants themselves, and the capacity of the mixed species to enhance leaf nitrogen content through soil nitrogen uptake is limited [17]. Furthermore, existing literature indicates that soil nitrogen availability significantly influenced differences in leaf total nitrogen content [74]. South China is a region with high nitrogen deposition [79], with the nitrogen deposition rate in Guangzhou exceeding 40 kg N ha−1 yr−1 in recent decades [80]. These high nitrogen deposition levels may have resulted in ecosystem nitrogen saturation and thus the lack of significant difference in leaf total nitrogen content.
4.2. Response of Rhizosphere Bacterial and Fungal Communities of Castanopsis hystrix to Mixing of Leguminous or Non-Leguminous Tree Species
In this study, we found that species mixing plantation did not significantly alter the dominance of bacterial and fungal phyla (with relative abundance ≥ 1%). The dominant bacterial phyla in the pure forest of C. hystrix were Acidobacteria, Actinobacteria, and Proteobacteria, while the leading fungal phyla were Basidiomycota and Ascomycota (Figure 4a,b). In the mixed forests of C. hystrix, the dominant bacterial phyla in the rhizosphere soils continued to be Proteobacteria, Actinobacteria, and Acidobacteria, with Basidiomycota and Ascomycota remaining the dominant fungal phyla. This observation suggests that species mixing plantation does not significantly alter the dominant bacterial and fungal phyla (with relative abundance ≥ 1%). Similarly, Wen et al. [81] reported that the dominant fungal phyla in the rhizosphere soil of both pure and mixed forests of C. hystrix in Guangxi were Basidiomycota and Ascomycota. Collectively, these findings align with our results, indicating that the dominant species of soil bacteria and fungi are relatively stable across different mixing treatments, likely influenced by regional climatic and soil conditions.
The mixing of tree species can alter the abundance of microbial phyla. In comparison to pure forest, the relative abundances of Actinobacteria and Bacteroidota were significantly elevated in both leguminous and non-leguminous mixed forests. Conversely, the relative abundances of Acidobacteria and Firmicutes were significantly decreased solely in the leguminous mixed forest (Figure 5a). A previous study had shown that the abundance of Actinobacteria tended to be significantly positively correlated with total soil nitrogen content [82]. In this study, the abundance of Actinobacteria was significantly increased in both types of mixed forests, with a more pronounced increase observed in the leguminous species mixed forest. LEfSe analysis also indicates that Actinobacteria are significantly enriched in the leguminous species mixed forest. This suggests that the mixing of leguminous tree species enhanced the availability of nitrogen in the soil [83]. The soil nitrogen content observed in the three forest types examined in Table 1 support and validate this conclusion. Microbiota belonging to Bacteroidetes are the main mineralizers of organic carbon, which can increase the organic carbon content in the soil and provide energy for microbial proliferation [84]. As shown in Table 1, the organic carbon content in the mixed forests was significantly higher than that in the pure C. hystrix forest. Consequently, the relative abundance of Bacteroidetes in the mixed forests was markedly greater than that in the pure forest. Acidobacteria primarily consist of acidophilic bacteria, which flourish in acidic environments. The findings of this study indicated that the relative abundance of Acidobacteria in mixed forests was lower than that in the pure forest of C. hystrix (27.9%), with the leguminous mixed forest exhibiting a lower abundance (21.5%) compared to the non-leguminous mixed forest of C. hystrix (23.8%). This reduction may be attributed to a partial alleviation in soil acidification resulting from species mixing. In Table 1, the pH of the mixed forests is indeed higher than that of the pure forest. In terms of fungal phyla, the relative abundances of Ascomycota, Basidiomycota, and Mortierellomycota did not exhibit significant differences between pure and mixed forests (Figure 5b). Ascomycota and Basidiomycota are primarily saprophytic fungi that decompose recalcitrant organic matter, such as cellulose and lignin found in plant residues [85]. These two fungal phyla exhibit high tolerance and wide ecological niches [86], which may explain why their abundances did not show a significant difference under different mixing conditions. Through LEfSe analysis, it was found that the microbial communities playing important roles in the three forest types were different. The rhizosphere bacterial groups that play an important role in pure C. hystrix forests include Bacillaceae and Bacillus under the Firmicutes with relatively low relative abundance, as well as Xiphinematobacteraceae and Candidatus Xiphinematobacter under the phylum Verrucomicrobia with relatively low abundance. In mixed forests, the rhizosphere bacterial groups that play an important role include Acidimicrobiia, Pseudonocardiales, Kineococcus, Longimycelium under the Actinobacteria with relatively high relative abundance in LMF and Limnochordia, Hydrogenispora under the Firmicutes with relatively low relative abundance, while Legionella and Candidatus_Paracaedibacter are under the Proteobacteria with relatively high relative abundance in NMF. This observation further supports the idea that bacterial phyla with low abundance contribute to the differences in the community structure of rhizosphere soil bacteria [87]. The rhizosphere fungal communities that played an important role in both pure and mixed C. hystrix forests consist entirely of families and genera belonging to the phyla Basidiomycota and Ascomycetes. However, different families and genera are enriched in different forest types. In summary, the variation in microbial communities across forest types can be attributed to the impact of plant activities on the rhizosphere environment. This adaptation to diverse ecological conditions requires specific microbial adaptations, leading to differences in the abundance of enriched rhizosphere bacterial and fungal communities [88].
The fungal diversity within the rhizosphere soil of C. hystrix was more sensitive to tree species mixing than bacterial diversity. Alpha diversity analysis and principal component analysis (PCoA) showed that the mixing of leguminous and non-leguminous species did not significantly affect the richness (Chao1 index) or diversity (Shannon index and Simpson index) of the bacterial community in the rhizosphere soil. In contrast, species mixing resulted in an increase in both richness and diversity of the fungal community, with a more pronounced effect observed in the leguminous mixed forest (Table 2, Figure 6a,b). Wen et al. [81] demonstrated that the richness and diversity of rhizosphere soil fungi were significantly increased by mixing C. hystrix with Pinus elliottii Engelm. and Michelia macclurei Dandy, compared to a pure C. hystrix forest. Similar results were reported in the case of Eucalyptus robusta Sm. mixed with Acacia mangium, which also led to an increase in the diversity and complexity of soil fungal communities [89]. The sensitivity of fungal diversity to the mixing of tree species may be attributed to improved assimilation efficiency within forest ecosystems, resulting in a greater input of plant residues and apoplasts that contain macromolecular organic matter. This requires the presence of corresponding fungal communities capable of utilizing and degrading these organic macromolecular compounds (e.g., cellulose, lignin, etc.) [90,91]. In contrast, bacteria primarily act on smaller organic molecules (e.g., easily degraded soluble organic carbon in rhizosphere secretions). The species diversity of these smaller organic molecules is significantly lower than that of macromolecules in mixed forests [92], which accounts for the lack of significant differences in the bacterial communities of the rhizosphere soil across the three forest types investigated in this study, alongside a notable increase in the richness and diversity of rhizosphere soil fungi.
4.3. Correlations of Leaf Functional Traits with Rhizosphere Soil Microbial Community Diversity
The RDA results showed that the diversity of the rhizosphere bacterial community of Castanopsis hystrix is significantly correlated with leaf dry matter content (LDMC), specific leaf area (SLA), leaf total nitrogen (LTN), and leaf total phosphorus (LTP). By comparison, the diversity of the rhizosphere soil fungal community exhibited a significant correlation with LTN (Figure 8a,b, Table 3). These findings suggest that there may be an interaction between the diversity of the rhizosphere soil microbial community and the leaf functional traits of C. hystrix. Plants can adapt to environmental changes by regulating their functional traits, which, in turn, affect soil processes and the composition of microbial communities [93]. Through the analysis of the correlation between leaf functional traits and the α-diversity index and dominant bacterial phyla, it was found that the total nitrogen and total phosphorus content in leaves showed a significant positive correlation with soil bacterial α-diversity. The phyla Acidobacteria and Actinobacteria showed a highly significant positive correlation with the total nitrogen content in leaves, while the phylum Basidiomycota showed a significant positive correlation with the organic carbon content. The phyla Acidobacteria and Actinobacteria play a significant role in the mineralization of organic matter, thereby increasing the available nitrogen content in the soil [94]. The phylum Basidiomycota contributes to the stabilization and turnover of soil organic carbon and can form mycorrhizal symbiotic relationships with plants, which enhances the soil’s organic carbon content [95]. Carbon and nitrogen are absorbed by the roots and transported to the leaves, where the leaves fix carbon through photosynthesis and accumulate a large amount of organic matter as rhizosphere secretions released into the rhizosphere. Along with various secondary metabolites in the rhizosphere secretions, these compounds supply carbon, nitrogen, phosphorus, and other essential nutrients to rhizosphere microorganisms, rhizosphere bacteria, or fungi aggregates around the roots, influencing the diversity and abundance of soil microorganisms in the rhizosphere [29], forming interactions between aboveground and belowground organisms. Chen et al. [96] conducted a meta-analysis on the effects of plant functional traits on soil microbial biomass in mixed-species plantations, revealing that the effects of species mixing on soil microbial biomass intensified with increases in SLA, LDMC, LTN, and LTP, with the elemental composition of leaves indirectly influenced by microorganisms. Adesemoye et al. [97] investigated the effects of microbial agent addition on nutrient uptake in Zea mays L., finding that the microbial agent enhanced plant growth, reduced soil nitrogen and phosphorus content, and improved nutrient uptake by the plant. In summary, the exchange of materials among plants, soil, and rhizosphere microorganisms forms a highly complex and extensive interactive system. Through the correlational analysis of leaf functional traits and rhizosphere microorganisms, this study highlights the potential interconnectedness of aboveground and belowground biological processes within mixed-species plantation systems.
5. Conclusions
Overall, tree species mixing shaped the functional traits of C. hystrix leaves, which became morphologically thinner and smaller in mixed forests and maintained relatively stable leaf dry matter content to adapt to environmental changes. Tree species mixing also increased the richness and diversity of rhizosphere microbial communities. Notably, mixing with leguminous species not only preserved nutrient use efficiency through the adaptive functional traits of C. hystrix leaves but also significantly improved the richness and diversity of rhizosphere microbial communities. This study further elucidates the ecological adaptation strategies of trees in response to mixing with leguminous and non-leguminous species, by integrating both the aboveground and belowground ecosystem components, and provides new insights for the development of high-quality, high-yield, and sustainable artificial forests. Future research should encompass a broader range of tree species combinations, soil nutrient dynamics, fine root functional traits, rhizosphere secretions, and plant growth patterns to more comprehensively assess the responses during the species mixing process, ultimately contributing to the enhancement of quality and efficiency in tropical and subtropical artificial forests.
Supplementary Materials
The following supporting information can be downloaded at: https://www.mdpi.com/article/10.3390/f16020367/s1, Figure S1: Rarefaction curves of soil bacteria (a) and fungi (b) in the C. hystrix rhizosphere.
Author Contributions
Conceptualization, Y.W., Q.M. and Y.L.; investigation, Y.W., S.Z., G.X. and Y.S.; methodology, Y.W., J.L., Q.M. and S.S.; project administration, Q.M. and Y.L.; resources, Q.M. and Y.L.; data creation and formal analysis, Y.W., G.X. and S.Z.; software and visualization, Y.W.; validation, Y.L.; supervision, Y.W.; writing—original draft, Y.W.; writing—review and editing, Y.L. and Q.M.; funding acquisition, Y.L. and Q.M. All authors have read and agreed to the published version of the manuscript.
Funding
This research was supported by the Science and Technology Project of Guangdong Forestry Bureau (2023KJCX001), the National Natural Science Foundation of China (32171596), and the Science and technology plan project of Guangzhou (2024A04J10005).
Data Availability Statement
Data are contained within the article.
Acknowledgments
We are grateful to Guo Yong of Longdong Forestry Station, for providing information on the location of the sample plots, and to the staff of the Teaching and Research Department of the Tree Group of the College of Forestry and Landscape Architecture, South China Agricultural University, for their help with the sampling.
Conflicts of Interest
The authors declare no conflicts of interest.
References
- Du, Z.; Hu, J.; Xiao, Q.; Feng, Q.; He, P.; Li, R. Analysis on characteristics and development countermeasures of plantation resources in China. Cent. South For. Invent. Plan 2020, 39, 5–10. [Google Scholar]
- Administration State Forest E. A Report of Forest Resources in China (2009–2013); China Forestry Press: Beijing, China, 2014. [Google Scholar]
- Zeng, W.; Xiao, F.; Yu, L. Plantation Forest Resource Dynamic and Its Development Strategy Research in China; Academic Symposium on Ecological Forestry; Livelihood-Oriented Forestry and Technological Innovation in Western China: Guiyang, China, 2013. [Google Scholar]
- Liu, S.; Yang, Y.; Wang, H. Development strategy and management countermeasures of planted forests in China: Transforming from timber-centered single objective management towards multi-purpose management for enhancing quality and benefits of ecosystem services. Acta Ecol. Sin. 2018, 38, 1–10. [Google Scholar]
- Coll, L.; Ameztegui, A.; Collet, C.; Löf, M.; Mason, B.; Pach, M.; Verheyen, K.; Abrudan, I.; Barbati, A.; Barreiro, S.; et al. Knowledge gaps about mixed forests: What do European forest managers want to know and what answers can science provide? Ecol. Manag. 2018, 42, 106–115. [Google Scholar] [CrossRef]
- Xu, H.D.; Yu, M.K.; Cheng, X.R. Abundant fungal and rare bacterial taxa jointly reveal soil nutrient cycling and multifunctionality in uneven-aged mixed plantations. Ecol. Indic. 2021, 21, 107932. [Google Scholar] [CrossRef]
- Brassard, B.W.; Chen, H.Y.H.; Bergeron, Y.; Paré, D. Differences in fine root productivity between mixed- and single-species stands. Funct. Ecol. 2011, 25, 238–246. [Google Scholar] [CrossRef]
- Jucker, T.; Bouriaud, O.; Avacaritei, D.; Coomes, D.A.; Knops, J.; Knops, J. Stabilizing effects of diversity on aboveground wood production in forest ecosystems: Linking patterns and processes. Ecol. Lett. 2014, 17, 1560–1569. [Google Scholar] [CrossRef]
- Feng, Y.; Schmid, B.; Loreau, M.; Forrester, D.I.; Fei, S.; Zhu, J.; Tang, Z.; Zhu, J.; Hong, P.; Fang, J.; et al. Multispecies forest plantations outyield monocultures across a broad range of conditions. Science 2022, 376, 865–868. [Google Scholar] [CrossRef] [PubMed]
- Forrester, D.I. The spatial and temporal dynamics of species interactions in mixed-species forests: From pattern to process. Ecol. Manag. 2014, 39, 282–292. [Google Scholar] [CrossRef]
- Pretzsch, H.; Forrester, D.I. Stand dynamics of mixed species stands compared with monocultures. In Mixed-Species Forests; Springer: Berlin/Heidelberg, Germany, 2017. [Google Scholar]
- Yin, Z.F.; Sun, H.G.; Tan, Z.F.; Liu, W. Research progress on productivity of mixed forests. Chin. J. Appl. Ecol. 2023, 34, 3135–3143. [Google Scholar]
- Li, J.F.; Wang, H.; Huang, H.M.; Tong, X.L.; Wang, J.; Liao, Y.L.; Huang, X.M.; Ming, A.G.; You, Y.M. Effects of mixed plantation of Pinus massoniana with different broadleaf species on soil microbial community composition and diversity. Guangxi Sci. 2024, 31, 439–450. [Google Scholar]
- Gei, M.G.; Powers, J.S. Do legumes and non-legumes tree species affect soil properties in unmanaged forests and plantations in Costa Rican dry forests? Soil. Biol. Biochem. 2013, 57, 264–272. [Google Scholar] [CrossRef]
- Ren, Y.W.; Zhong, X.Y.; Yi, H.P.; Chang, Y. Effects of different stand types on leaf functional traits, understory species diversity and soil nutrients. SciEngine 2023, 36, 161–168. [Google Scholar]
- Tedersoo, L.; Laanisto, L.; Rahimlou, S.; Toussaint, A.; Hallikma, T.; Pärtel, M. Global database of plants with root-symbiotic nitrogen fixation: NodDB. J. Veg. Sci. 2018, 29, 560–568. [Google Scholar] [CrossRef]
- Xu, H.; Detto, M.; Fang, S.; Chazdon, R.L.; Li, Y.; Hau, B.C.H.; Fischer, G.A.; Weiblen, G.D.; Hogan, J.A.; Zimmerman, J.K.; et al. Soil nitrogen concentration mediates the relationship between leguminous trees and neighbor diversity in tropical forests. Commun. Biol. 2020, 3, 317. [Google Scholar] [CrossRef] [PubMed]
- Wei, L.Y.; Shen, W.J. Effects of introduced native tree species on plant community soil microbial and chemical properties in two subtropical degraded leguminous plantations in south China. Res. Soil. Water Conserv. 2013, 20, 24–31. [Google Scholar]
- Xu, M.; Gao, D.; Fu, S.; Lu, X.; Wu, S.; Han, X.; Yang, G.; Feng, Y. Long-term effects of vegetation and soil on the microbial communities following afforestation of farmland with Robinia pseudoacacia plantations. Geoderma 2020, 367, 114263. [Google Scholar] [CrossRef]
- Li, Y.; Han, C.; Sun, S.; Zhao, C. Effects of tree species and soil enzyme activities on soil nutrients in dryland plantations. Forests 2021, 12, 1153. [Google Scholar] [CrossRef]
- Zhang, J.Q.; Su, Y.Q.; Kang, Y.X.; Xu, X.M.; Qin, L. Carbon sequestration of young Robinia pseudoacacia plantation in Loess Plateau. Chin. J. Appl. Ecol. 2009, 20, 2911–2916. [Google Scholar]
- Lavorel, S.; Grigulis, K.; Lamarque, P.; Colace, M.P.; Garden, D.; Girel, J.; Pellet, G.; Douzet, R. Using plant functional traits to understand the landscape distribution of multiple ecosystem services. J. Ecol. 2011, 99, 135–147. [Google Scholar] [CrossRef]
- Shi, Y.; Wen, Z.; Gong, S. Comparisons of relationships between leaf and fine root traits in hilly area of the Loess Plateau, Yanhe River basin, Shaanxi Province, China. Acta Ecol. Sin. 2011, 31, 6805–6814. [Google Scholar]
- Zhang, x.; Li, R.; Zhen, Z.; Li, Z.; Gong, L.; Luo, Y.; Wu, X. Leaf functional traits of Tamarix ramosissima in extremely arid region and their relationship with soil physicochemical factors. Acta Ecol. Sin. 2023, 43, 3699–3708. [Google Scholar]
- Wang, J.; Shi, W.; Wu, H.; Hu, B.; Cheng, X.; Han, H. Characteristics of leaf functional traits of typical coniferous plantations in Northern Shanxi and their relationship with soil factors. Acta Bot. Boreali-Occident. Sin. 2023, 43, 835–845. [Google Scholar]
- Luo, J.F.; Luo, Z.X.; Zhao, S.Q.; Wu, S.N.; Luo, X.L.; Sui, X. Responses of leaf functional traits to partial shading of a photovoltaic array and their different ecological strategies. J. West. China For. Sci. 2022, 51, 48–53. [Google Scholar]
- Xing, Z.Y.; Lin, J.Y.; Bo, Y.X.; Lin, J.D.; Zhang, A.P.; Deng, B.W.; Zheng, D.X.; Jin, S.F. Effects of nitrogen addition on functional traits and plasticity of Taxus chinensis var. mairei leaves. Acta Agri Univ. Jiangxiensis 2023, 45, 125–133. [Google Scholar]
- Marschner, H. Mineral Nutrition of Higher Plants, 1st ed.; Academic Press: London, UK, 1996; pp. 1–889. [Google Scholar]
- Fuente Cantó, C.; Simonin, M.; King, E.; Moulin, L.; Bennett, M.J.; Castrillo, G.; Laplaze, L. An extended root phenotype: The rhizosphere, its formation and impacts on plant fitness. Plant J. 2020, 103, 951–964. [Google Scholar] [CrossRef] [PubMed]
- Bakker, P.A.H.M.; Doornbos, R.F.; Zamioudis, C.; Berendsen, R.L.; Pieterse, C.M.J. Induced systemic resistance and the rhizosphere microbiome. Plant Pathol. J. 2013, 29, 136–143. [Google Scholar] [CrossRef] [PubMed]
- Lareen, A.; Burton, F.; Schäfer, P. Plant root-microbe communication in shaping root microbiomes. Plant Mol. Biol. 2016, 90, 575–587. [Google Scholar] [CrossRef]
- Laforest-Lapointe, I.; Paquette, A.; Messier, C.; Kembel, S.W. Leaf bacterial diversity mediates plant diversity and ecosystem function relationships. Nature 2017, 546, 145–147. [Google Scholar] [CrossRef] [PubMed]
- Hendriks, M.; Mommer, L.; de Caluwe, H.; Smit-Tiekstra, A.E.; van der Putten, W.H.; de Kroon, H.; Wurzburger, N. Independent variations of plant and soil mixtures reveal soil feedback effects on plant community overyielding. J. Ecol. 2013, 101, 287–297. [Google Scholar] [CrossRef]
- Zhou, Y.; Clark, M.; Su, J.; Xiao, C. Litter decomposition and soil microbial community composition in three Korean pine (Pinus koraiensis) forests along an altitudinal gradient. Plant Soil 2015, 386, 171–183. [Google Scholar] [CrossRef]
- Li, S.; Wang, H.; Gou, W.; Wu, G.; Su, P. Relationship between leaf functional traits of mixed desert plants and microbial diversity in rhizosphere. Ecol. Environ. Sci. 2020, 29, 1713–1722. [Google Scholar]
- Li, Y.; Xu, T.; Ai, Z.; Zhou, Z.; Ma, F. Relationship between plant functional traits and rhizosphere bacterial community structure of two Caragana species. Acta Prataculturae Sincia 2022, 31, 38–49. [Google Scholar]
- Leff, J.W.; Bardgett, R.D.; Wilkinson, A.; Jackson, B.G.; Pritchard, W.J.; De Long, J.R.; Oakley, S.; Mason, K.E.; Ostle, N.J.; Johnson, D.; et al. Predicting the structure of soil communities from plant community taxonomy, phylogeny, and traits. ISME J. 2018, 12, 1794–1805. [Google Scholar] [CrossRef] [PubMed]
- Duan, Y. Study on Effects of Intercropping Leguminous Green Manure on Tea Plantation Soil Environment and Tea Leaves Amino Acids Metabolism. Ph.D. Thesis, Nanjing Agricultural University, Nanjing, China, 1 May 2022. [Google Scholar]
- Xu, Y. Guangdong Forestry, 1st ed.; Guangdong Science and Technology Press: Guangzhou, China, 1990; pp. 1–552. [Google Scholar]
- Tang, J.; Zhu, X.; Jia, H.; Zeng, J.; Guo, W.; Huang, D. Growth dynamics and tree form quality of mixed Betula alnoides-Castanopsis hystrix plantation. J. Nanjing For. Univ. 2022, 46, 97–105. [Google Scholar]
- Li, N.; Yang, Y.; Li, Z.; Xu, F.; Chen, X.; Zhu, B.; Zhang, W. Variation analysis of leaf phenotypic in different provenance of Castanopsis hystrix. Subtropical. Plant Sci. 2023, 52, 318–326. [Google Scholar]
- Wang, R.; Ma, J.; Liang, H.; Zhang, Y.; Yang, J.; Chen, F.; Wang, Y.; Yan, W. Changes in soil properties, microbial quantity and enzyme activities in four Castanopsis hystrix forest types in Subtropical China. Plants 2023, 12, 2411. [Google Scholar] [CrossRef] [PubMed]
- Ye, Y.; Wang, H.; Luan, J.; Ma, J.; Ming, A.; Liu, S. Early effects of different tree species mixing on aggregate organic carbon fractions. Chin. J. Ecol. 2024, 43, 3350. [Google Scholar]
- Liang, Y.; Ming, A.; He, Y.; Luo, Y.; Tan, L.; Qin, L. Structure and function of soil bacterial communities in the monoculture and mixed plantation of Pinus massoniana and Castanopsis hystrix in southern subtropical China. Chin. J. Appl. Ecol. 2021, 32, 878–886. [Google Scholar]
- Wang, H.; Liu, S.; Wang, J.; You, Y.; Yang, Y.; Shi, Z.; Huang, X.; Zheng, L.; Li, Z.; Ming, A.; et al. Mixed-species plantation with Pinus massoniana and Castanopsis hystrix accelerates C loss in recalcitrant coniferous litter but slows C loss in labile broadleaf litter in southern China. Ecol. Manag. 2018, 43, 207–213. [Google Scholar] [CrossRef]
- Mo, Y.; Wang, J.; Chen, L.; Wei, G.; Yang, M. Effects of different mixed models on growth and plant diversity in Eucalyptus plantations. Southwest China J. Agric. Sci. 2022, 35, 1185–1192. [Google Scholar]
- Wang, L.; Wen, Y.G.; Zhou, X.G.; Zhu, H.G.; Sun, D.J. Effects of mixing Eucalyptus urophylla × E. grandis with Castanopsis hystrix on understory vegetation and soil properties. Ecol. Environ. Sci. 2022, 31, 1340–1349. [Google Scholar]
- Pang, Z.H.; Dai, Q.H. Afforestation Techniques for Major Tree Species in Guangxi, 1st ed.; Guangxi Science and Technology Press: Nanning, China, 2002; pp. 1–270. [Google Scholar]
- Liu, D.J.; Luo, H.Y.; Cheng, Y.; Li, X.; Liu, X.J.; Yang, S.F.; Chen, F.Q.; Ju, C.; Liu, J.X.; Lie, Z.Y. Growth and nutrient response to phosphorus addition of different modified tree species in Acacia mangium plantation. J. Trop. Subtrop. Bot. 2024, 34, 737–746. [Google Scholar]
- Wang, F. Overview of the forest land soil survey in Longyandong Forest Farm, Guangdong Province. NongJia KeJi 2015, 31, 18–19. [Google Scholar]
- Chen, F.; Guo, Y.; Huang, M.; Feng, W.; Ye, Q.; Liu, J.; Li, X. Community structure characteristics and management strategies of Castanopsis hystrix plantation with different restoration years. J. Anhui Agric. Univ. 2022, 49, 48–55. [Google Scholar]
- LY/T 2812-2017; Methods for the Determination of Functional Traits in Forest Woody Plants. CSP: Beijing, China, 2017.
- Pérez-Harguindeguy, N.; Díaz, S.; Garnier, E.; Lavorel, S.; Poorter, H.; Jaureguiberry, P.; Bret-Harte, M.S.; Cornwell, W.K.; Craine, J.M.; Gurvich, D.E.; et al. New handbook for standardised measurement of plant functional traits worldwide. Aust. J. Bot. 2013, 61, 167–234. [Google Scholar] [CrossRef]
- Xu, N.; Tan, G.C.; Wang, H.Y.; Gai, X.P. Effect of biochar additions to soil on nitrogen leaching, microbial biomass and bacterial community structure. Eur. J. Soil. Biol. 2016, 24, 1–8. [Google Scholar] [CrossRef]
- Zheng, Q.; Hu, Y.T.; Zhang, S.S.; Noll, L.; Böckle, T.; Dietrich, M.; Herbold, C.W.; Eichorst, S.A.; Woebken, D.; Richter, A.; et al. Soil multifunctionality is affected by the soil environment and by microbial community composition and diversity. Soil Biol. Biochem. 2019, 51, 107521. [Google Scholar] [CrossRef] [PubMed]
- Chen, S.F.; Zhou, Y.Q.; Chen, Y.; Gu, J. Fastp: An ultra-fast all-in-one FASTQ preprocessor. Bioinformatics 2018, 34, i884–i890. [Google Scholar] [CrossRef] [PubMed]
- Mago, T.; Salzberg, S.L. FLASH: Fast length adjustment of short reads to improve genome assemblies. Bioinformatics 2011, 27, 2957–2963. [Google Scholar] [CrossRef] [PubMed]
- Bolyen, E.; Rideout, J.R.; Dillon, M.R.; Bokulich, N.A.; Abnet, C.C.; Al-Ghalith, G.A.; Alexander, H.; Alm, E.J.; Arumugam, M.; Asnicar, F.; et al. Reproducible, interactive, scalable and extensible microbiome data science using QIIME 2. Nat. Biotechnol. 2019, 37, 852–857. [Google Scholar] [CrossRef]
- Callahan, B.J.; McMurdie, P.J.; Rosen, M.J.; Han, A.W.; Johnson, A.J.A.; Holmes, S.P. DADA2: High-resolution sample inference from Illumina amplicon data. Nat. Methods 2016, 13, 581–583. [Google Scholar] [CrossRef]
- Amir, A.; McDonald, D.; Navas-Molina, J.A.; Kopylova, E. Deblur rapidly resolves single-nucleotide community sequence patterns. mSystems 2017, 2, 10–1128. [Google Scholar] [CrossRef] [PubMed]
- Zhou, Y.; Liu, Y.X.; Li, X. USEARCH 12: Open-source software for sequencing analysis in bioinformatics and microbiome. iMeta 2024, 3, e236. [Google Scholar] [CrossRef]
- Cole, J.R.; Wang, Q.; Fish, J.A.; Chai, B.; McGarrell, D.M.; Sun, Y.; Brown, C.T.; Porras-Alfaro, A.; Kuske, C.R.; Tiedje, J.M. Ribosomal Database Project: Data and tools for high throughput rRNA analysis. Nucleic Acids Res. 2014, 41, D633–D642. [Google Scholar] [CrossRef] [PubMed]
- Pearson, W.R. Using BLAST for sequence similarity searching. Curr. Protoc. Bioinform. 2013, 40, 115. [Google Scholar]
- Schloss, P.D.; Westcott, S.L.; Ryabin, T.; Hall, J.R.; Hartmann, M.; Hollister, E.B.; Lesniewski, R.A.; Oakley, B.B.; Parks, D.H.; Robinson, C.J.; et al. Introducing mothur: Open-source, platform-independent, community-supported software for describing and comparing microbial communities. Appl. Environ. Microbiol. 2009, 75, 7537–7541. [Google Scholar] [CrossRef] [PubMed]
- Chao, A.; Lee, S. Estimating the number of classes via sample coverage. J. Am. Stat. Assoc. 1984, 87, 210–217. [Google Scholar] [CrossRef]
- Simpson, E.H. Measurement of diversity. Nature 1949, 163, 688. [Google Scholar] [CrossRef]
- Shannon, C.E. A mathematical theory of communication. Bell Syst. Tech. J. 1948, 27, 379–423. [Google Scholar] [CrossRef]
- Chang, F.; He, S.; Dang, C. Assisted selection of Biomarkers by Linear Discriminant Analysis Effect Size (LEfSe) in microbiome data. J. Vis. Exp. 2022, 19, e61715. [Google Scholar] [CrossRef]
- Xue, L.; Ren, H.D.; Li, S.; Leng, X.H.; Yao, X.H. Soil bacterial community structure and co-occurrence pattern during vegetation restoration in Karst Rocky desertification area. Front. Microbiol. 2017, 7, 2377. [Google Scholar] [CrossRef]
- Freschet, G.T.; Violle, C.; Bourget, M.Y.; Scherer Lorenzen, M.; Fort, F. Allocation, morphology, physiology, architecture: The multiple facets of plant above- and below-ground responses to resource stress. New Phytol. 2018, 219, 1338–1352. [Google Scholar] [CrossRef]
- Jiang, F.; Cadotte, M.W.; Jin, G. Size- and environment-driven seedling survival and growth are mediated by leaf functional traits. Proc. R. Soc. B Biol. Sci. 2022, 289, 20221400. [Google Scholar] [CrossRef]
- Qin, J.; Shangguan, Z.P. Effects of forest types on leaf functional traits and their interrelationships of Pinus massoniana coniferous and broad-leaved mixed forests in the subtropical mountain, Southeastern China. Ecol. Evol. 2019, 9, 6922–6932. [Google Scholar] [CrossRef]
- Li, S. Effects of Mixed Model on Leaf and Root Functional Traits of Phoebe bournei and Cunninghamia lanceolata. Master’s Thesis, Central South University of Forestry and Technology, Changsha, China, 1 May 2019. [Google Scholar]
- Zhang, H.; Lan, Y.; Jiang, C.; Cui, Y.; He, Y.; Deng, J.; Lin, M.; Ye, S. Leaf traits explain the growth variation and nitrogen response of Eucalyptus urophylla × Eucalyptus grandis and Dalbergia odorifera in mixed culture. Plants 2024, 13, 988. [Google Scholar] [CrossRef]
- Bussotti, F.; Pollastrini, M. Evaluation of leaf features in forest trees: Methods, techniques, obtainable information and limits. Ecol. Indic. 2015, 15, 219–230. [Google Scholar] [CrossRef]
- Chen, Q.; Huang, K.Y.; Dai, J.; Chen, D.X.; Lan, X.; Cheng, L.; Chen, X.M.; Li, K.P. Effects of nitrogen-fixing tree species on total N content and enzyme activity of Cunninghamia lanceolata under mixed plantation pattern. J. South. Agric. 2016, 47, 608–613. [Google Scholar]
- Qin, J.; Shang, G.Z.P. Leaf nutrient contents and photosynthetic physiological characteristics of Ulmus pumila Robinia pseudocacia mixed forests. Chin. J. Appl. Ecol. 2010, 21, 2228–2234. [Google Scholar]
- Liu, M.; Chen, S.; An, Q. Photosynthetic and physiological characteristic of three common species in different communities. Acta Bot. Boreal. Occident. Sin. 2015, 35, 998–1004. [Google Scholar]
- Wang, R.; Balkanski, Y.; Boucher, O.; Ciais, P.; Peñuelas, J.; Tao, S. Significant contribution of combustion-related emissions to the atmospheric phosphorus budget. Nat. Geosci. 2015, 8, 48–54. [Google Scholar] [CrossRef]
- Huang, L.; Zhu, W.; Ren, H.; Chen, H.; Wang, J. Impact of atmospheric nitrogen deposition on soil properties and herb-layer diversity in remnant forests along an urban-rural gradient in Guangzhou, southern China. Plant Ecol. 2012, 213, 1187–1202. [Google Scholar] [CrossRef]
- Wen, X.; Wang, R.; Jiang, Y.; Deng, X.; Wei, S.; Liu, X.; Wang, Y. Diversity and composition of rhizosphere fungal community in pure and mixed forests of south China. Pol. J. Ecol. 2021, 69, 1505–2249. [Google Scholar] [CrossRef]
- Nacke, H.; Thürmer, A.; Wollherr, A.; Will, C.; Hodac, L.; Herold, N.; Schöning, I.; Schrumpf, M.; Daniel, R. Pyrosequencing-based assessment of bacterial community structure along different management types in German forest and grassland soils. PLoS ONE 2011, 6, e17000. [Google Scholar] [CrossRef] [PubMed]
- Li, M.; Xu, H.C.; Mo, X.Q.; Xiao, N.; You, Y.M.; Huang, X.M.; Wen, Y.G.; Zhu, H.G. Effects of mixture of valuable nitrogen-fixing tree species Dalbergia odorifera and second-generation Eucalyptus urophylla on structure and function of soil microbial community in subtropical China. Guangxi Zhi Wu 2021, 41, 1476–1485. [Google Scholar]
- Li, Y.; Lee, C.G.; Watanabe, T.; Murase, J.; Asakawa, S.; Kimura, M. Identification of microbial communities that assimilate substrate from root cap cells in an aerobic soil using a DNA-SIP approach. Soil Biol. Biochem. 2011, 43, 1928–1935. [Google Scholar] [CrossRef]
- Annala, M.J.; Lehosmaa, K.; Ahonen, S.H.K.; Karttunen, K.; Markkola, A.M.; Puumala, I.; Mykrä, H. Effect of riparian soil moisture on bacterial, fungal and plant communities and microbial decomposition rates in boreal stream-side forests. Ecol. Manag. 2022, 47, 120344. [Google Scholar] [CrossRef]
- Xu, H.C.; You, L.H.; You, H.M.; Yu, J.L.; Cheng, F.S.; Ye, G.F.; Huang, Y.L.; Huang, A.Z.; Li, J.M. Effects of different soil management patterns on soil fungal community composition in a Castanea henryi orchard. J. Fruit. Sci. 2021, 38, 1942–1955. [Google Scholar]
- Song, Z. Effect of Tree Species Richness on Soil Microbial Diversity in a Planted Mixed Forest in South Subtropical Region, Guangxi, China. Master’s Thesis, Chinese Academy of Forestry Sciences, Beijing, China, 1 May 2020. [Google Scholar]
- Li, H.; Su, J.; Yang, X.; Zhu, Y. Distinct rhizosphere effect on active and total bacterial communities in paddy soils. Sci. Total Environ. 2019, 50, 422–430. [Google Scholar] [CrossRef]
- Pereira, A.P.D.A.; Santana, M.C.; Zagatto, M.R.G.; Brandani, C.B.; Wang, J.; Verma, J.P.; Singh, B.K.; Cardoso, E.J.B.N. Nitrogen-fixing trees in mixed forest systems regulate the ecology of fungal community and phosphorus cycling. Sci. Total Environ. 2021, 50, 143711. [Google Scholar] [CrossRef]
- Kabuyah, R.N.T.M.; van Dongen, B.E.; Bewsher, A.D.; Robinson, C.H. Decomposition of lignin in wheat straw in a sand-dune grassland. Soil Biol. Biochem. 2012, 44, 128–131. [Google Scholar] [CrossRef]
- Wei, J.X.; Wang, C.; He, B.; You, Y.M.; Huang, X.M. Research progress on soil microorganisms in Eucalypt forests. J. Zhejiang AF Univ. 2022, 39, 1144–1154. [Google Scholar]
- Qiu, H.; Ge, T.; Liu, J.; Chen, X.; Hu, Y.; Wu, J.; Su, Y.; Kuzyakov, Y. Effects of biotic and abiotic factors on soil organic matter mineralization: Experiments and structural modeling analysis. Eur. J. Soil. Biol. 2018, 26, 27–34. [Google Scholar] [CrossRef]
- Delgado Baquerizo, M.; Fry, E.L.; Eldridge, D.J.; Vries, F.T.; Manning, P.; Hamonts, K.; Kattge, J.; Boenisch, G.; Singh, B.K.; Bardgett, R.D. Plant attributes explain the distribution of soil microbial communities in two contrasting regions of the globe. New Phytol. 2018, 219, 574–587. [Google Scholar] [CrossRef] [PubMed]
- Li, X.; Wang, A.; Wan, W.; Luo, X.; Zheng, L.; He, G.; Huang, D.; Chen, W.; Huang, Q. High salinity inhibits soil bacterial community mediating nitrogen cycling. Appl. Environ. Microbiol. 2021, 87, e136621. [Google Scholar] [CrossRef]
- Trejos-Espeleta, J.C.; Marin-Jaramillo, J.P.; Schmidt, S.K.; Sommers, P.; Bradley, J.A.; Orsi, W.D. Principal role of fungi in soil carbon stabilization during early pedogenesis in the high Arctic. Proc. Natl. Acad. Sci. USA 2024, 121, e1892278175. [Google Scholar] [CrossRef] [PubMed]
- Chen, C.; Chen, H.Y.H.; Chen, X.; Koricheva, J. Functional diversity enhances, but exploitative traits reduce tree mixture effects on microbial biomass. Funct. Ecol. 2020, 34, 276–286. [Google Scholar] [CrossRef]
- Adesemoye, A.O.; Torbert, H.A.; Kloepper, J.W. Enhanced plant nutrient use efficiency with PGPR and AMF in an integrated nutrient management system. Can. J. Microbiol. 2008, 54, 876–886. [Google Scholar] [CrossRef]
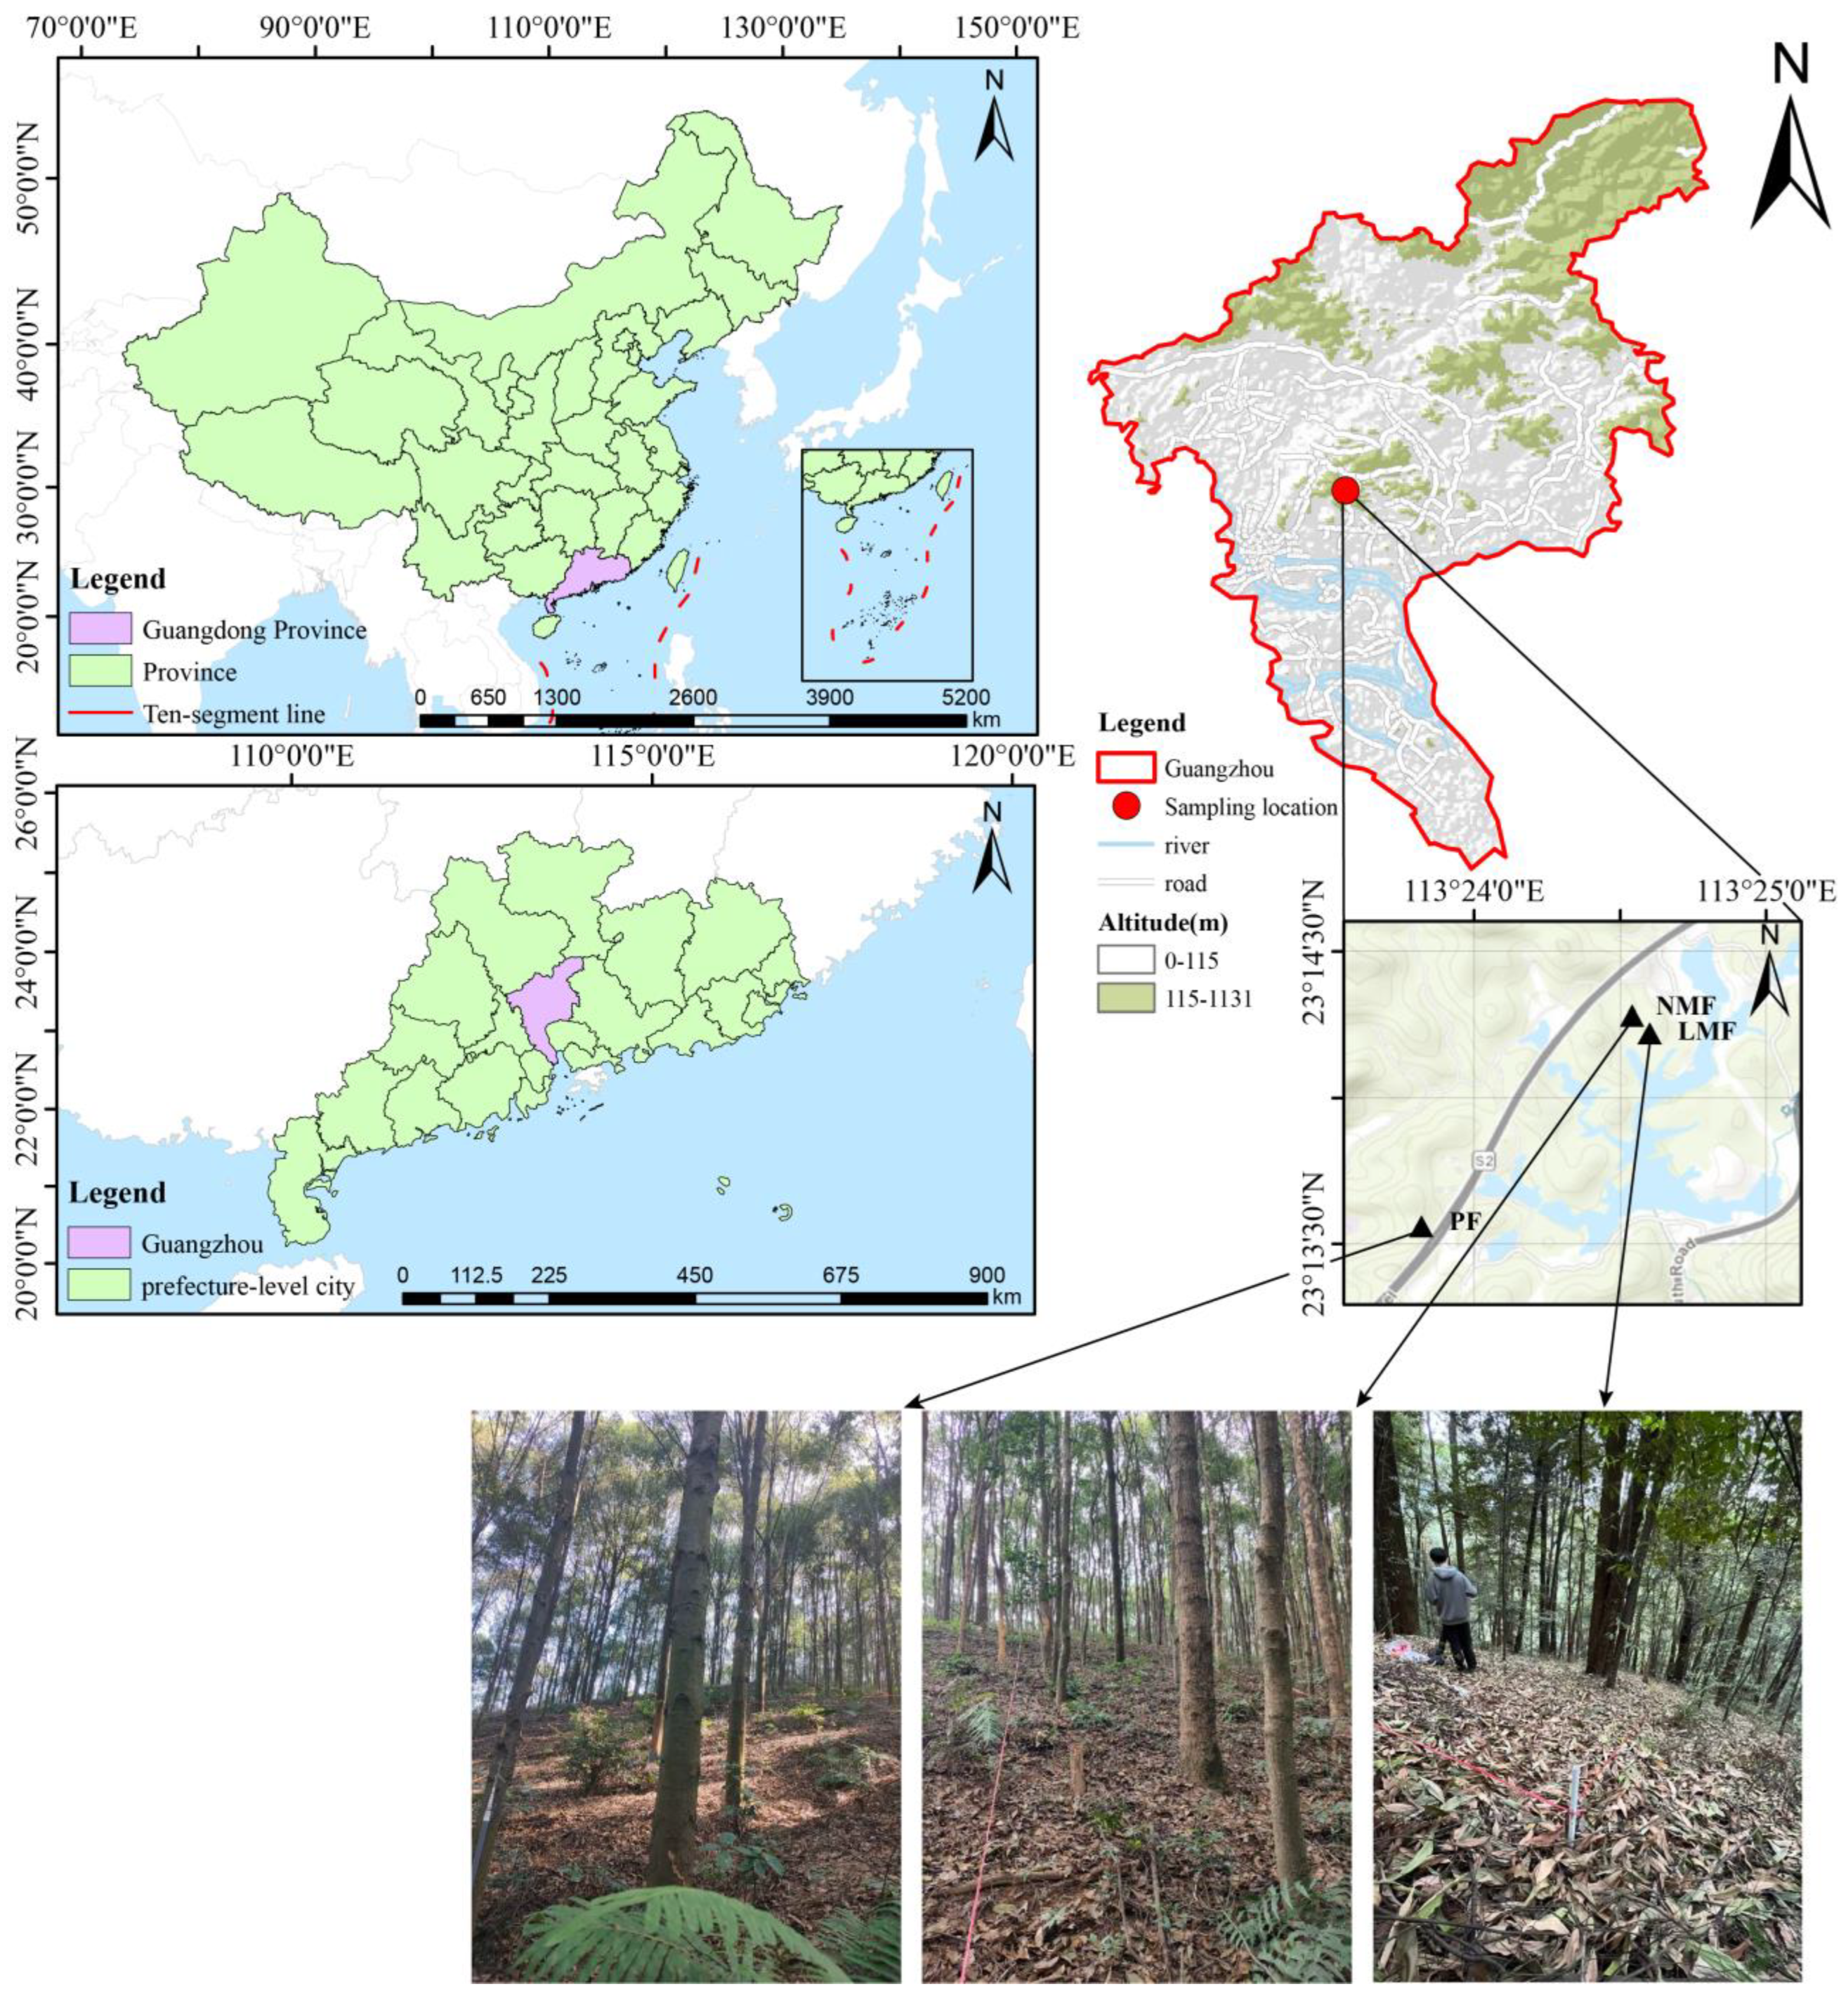

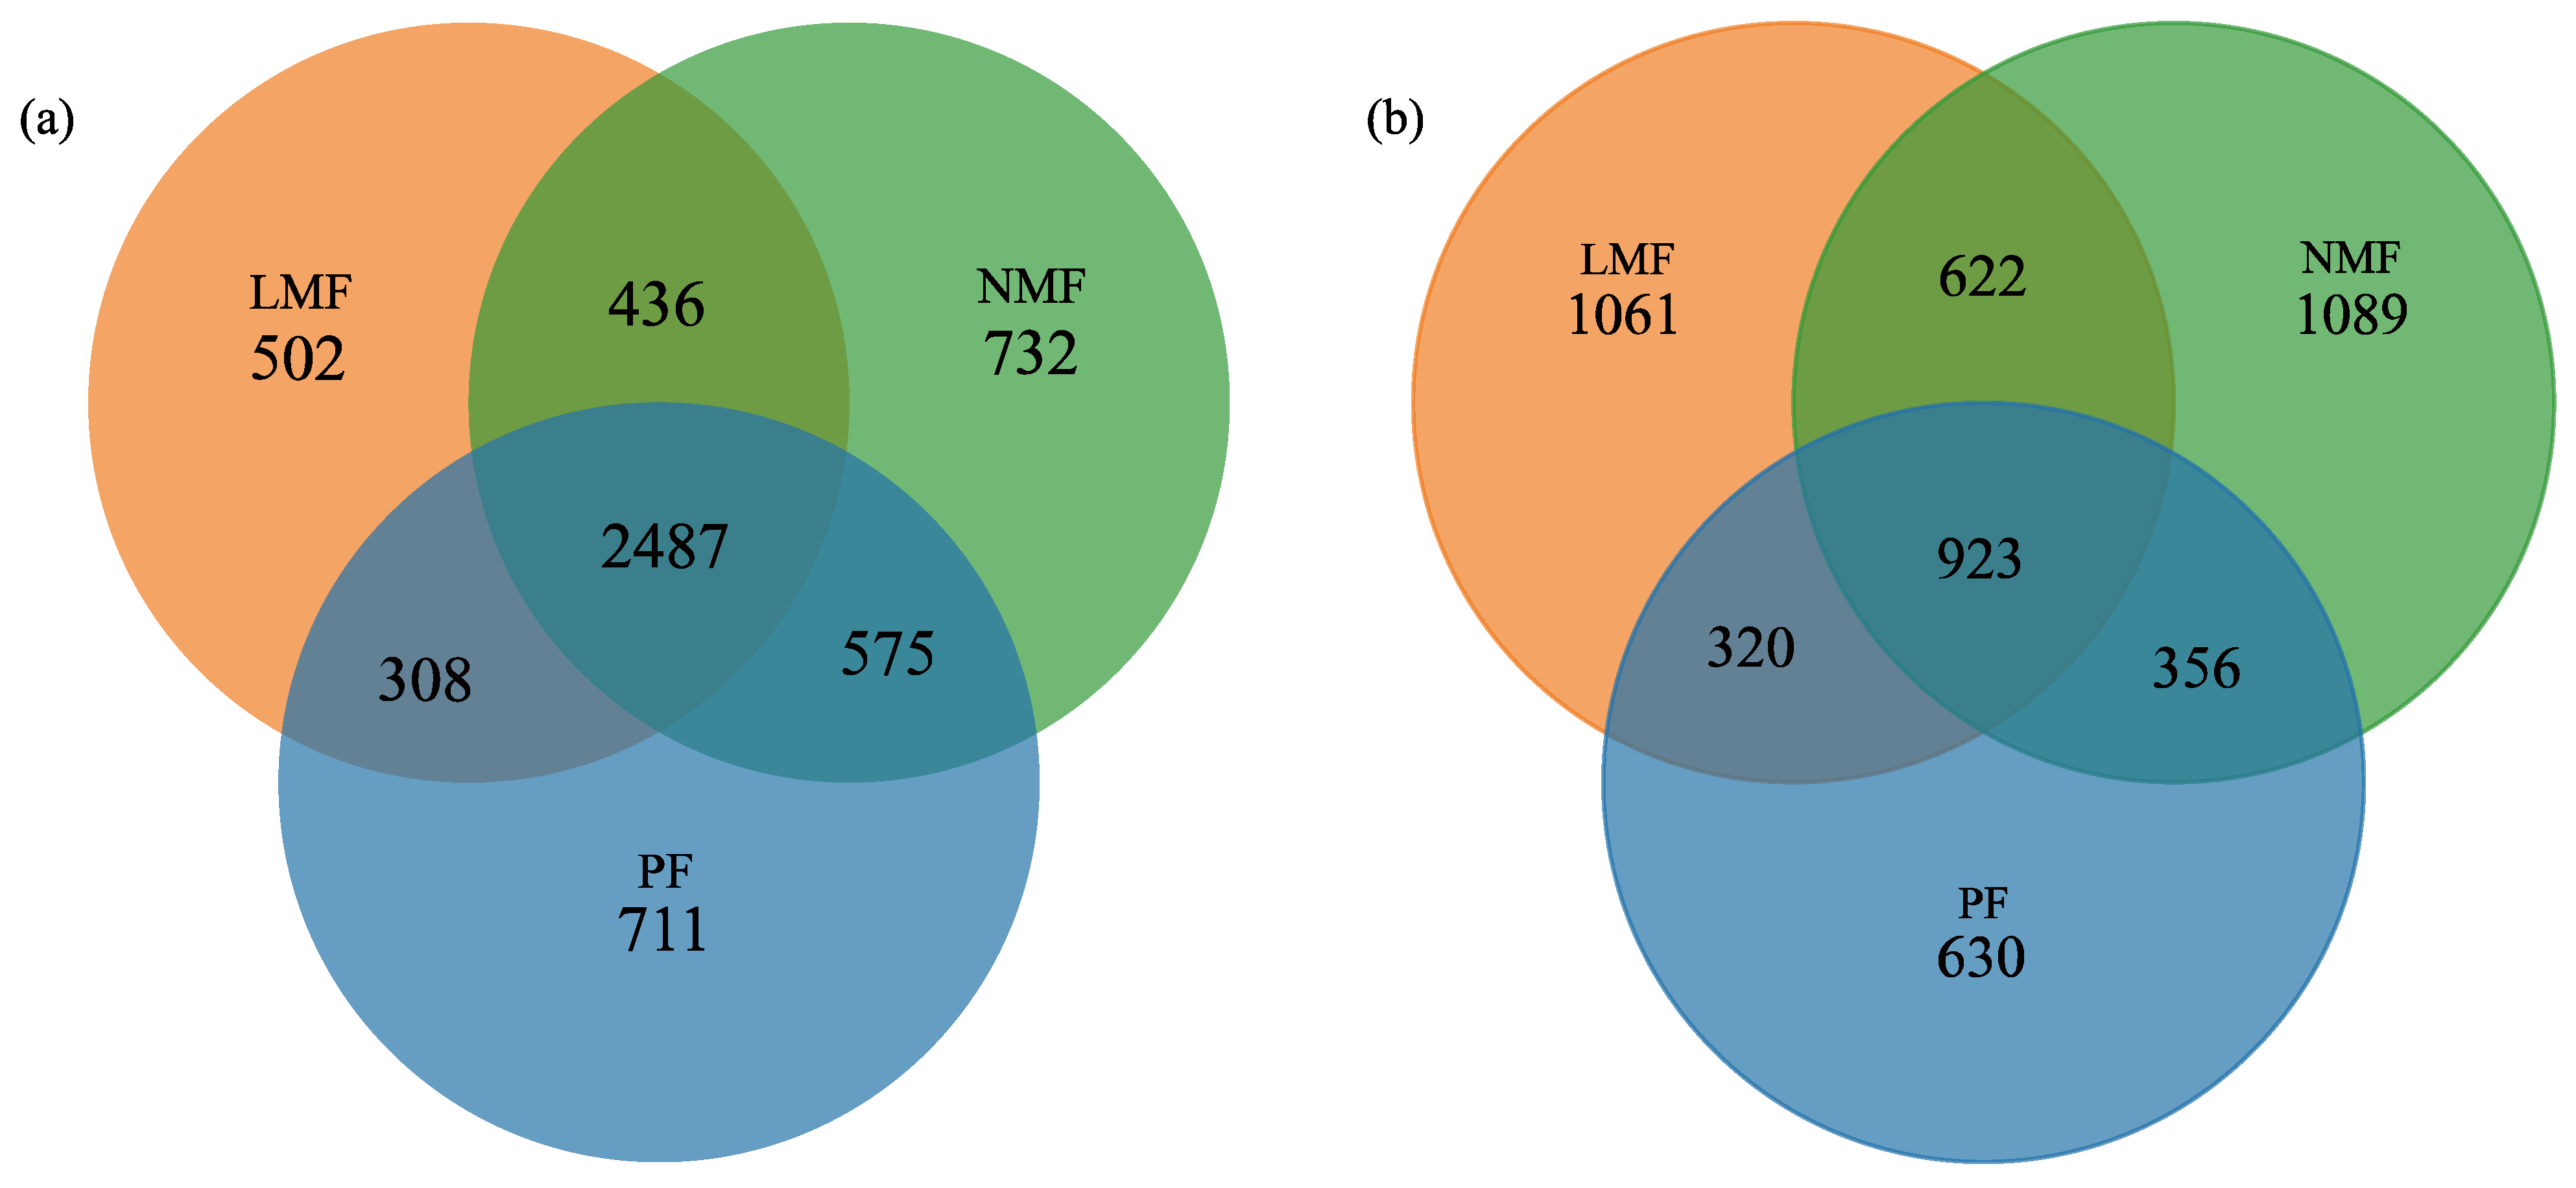
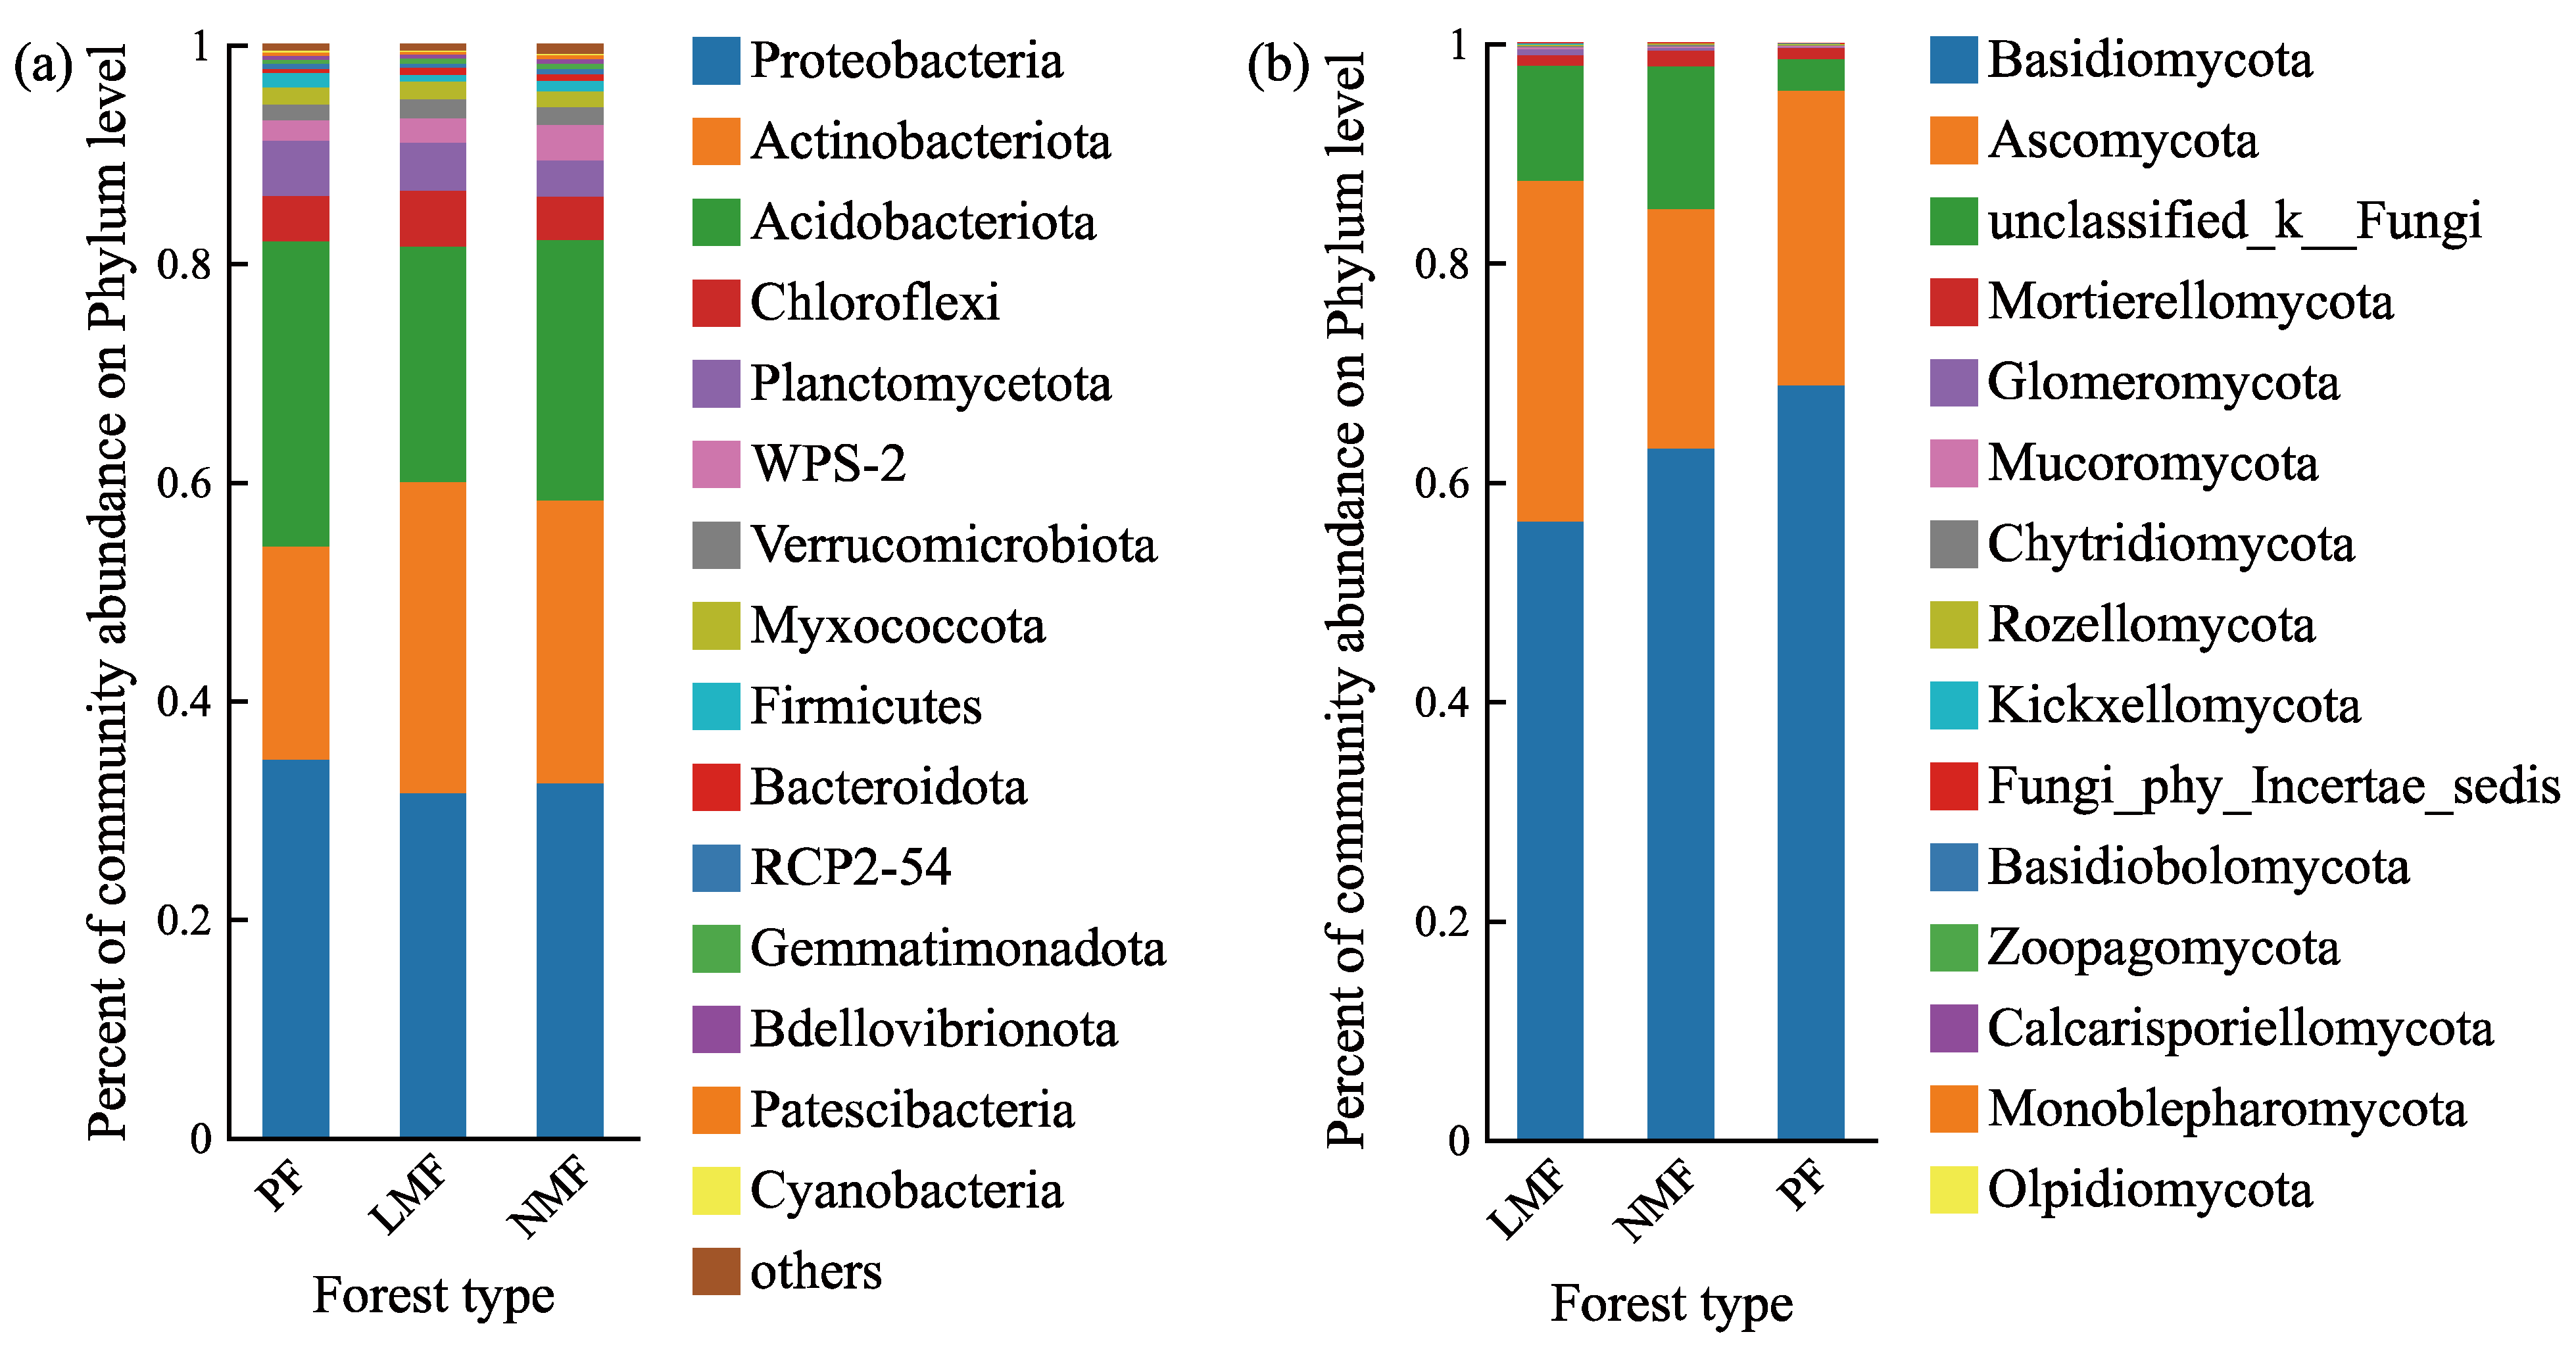
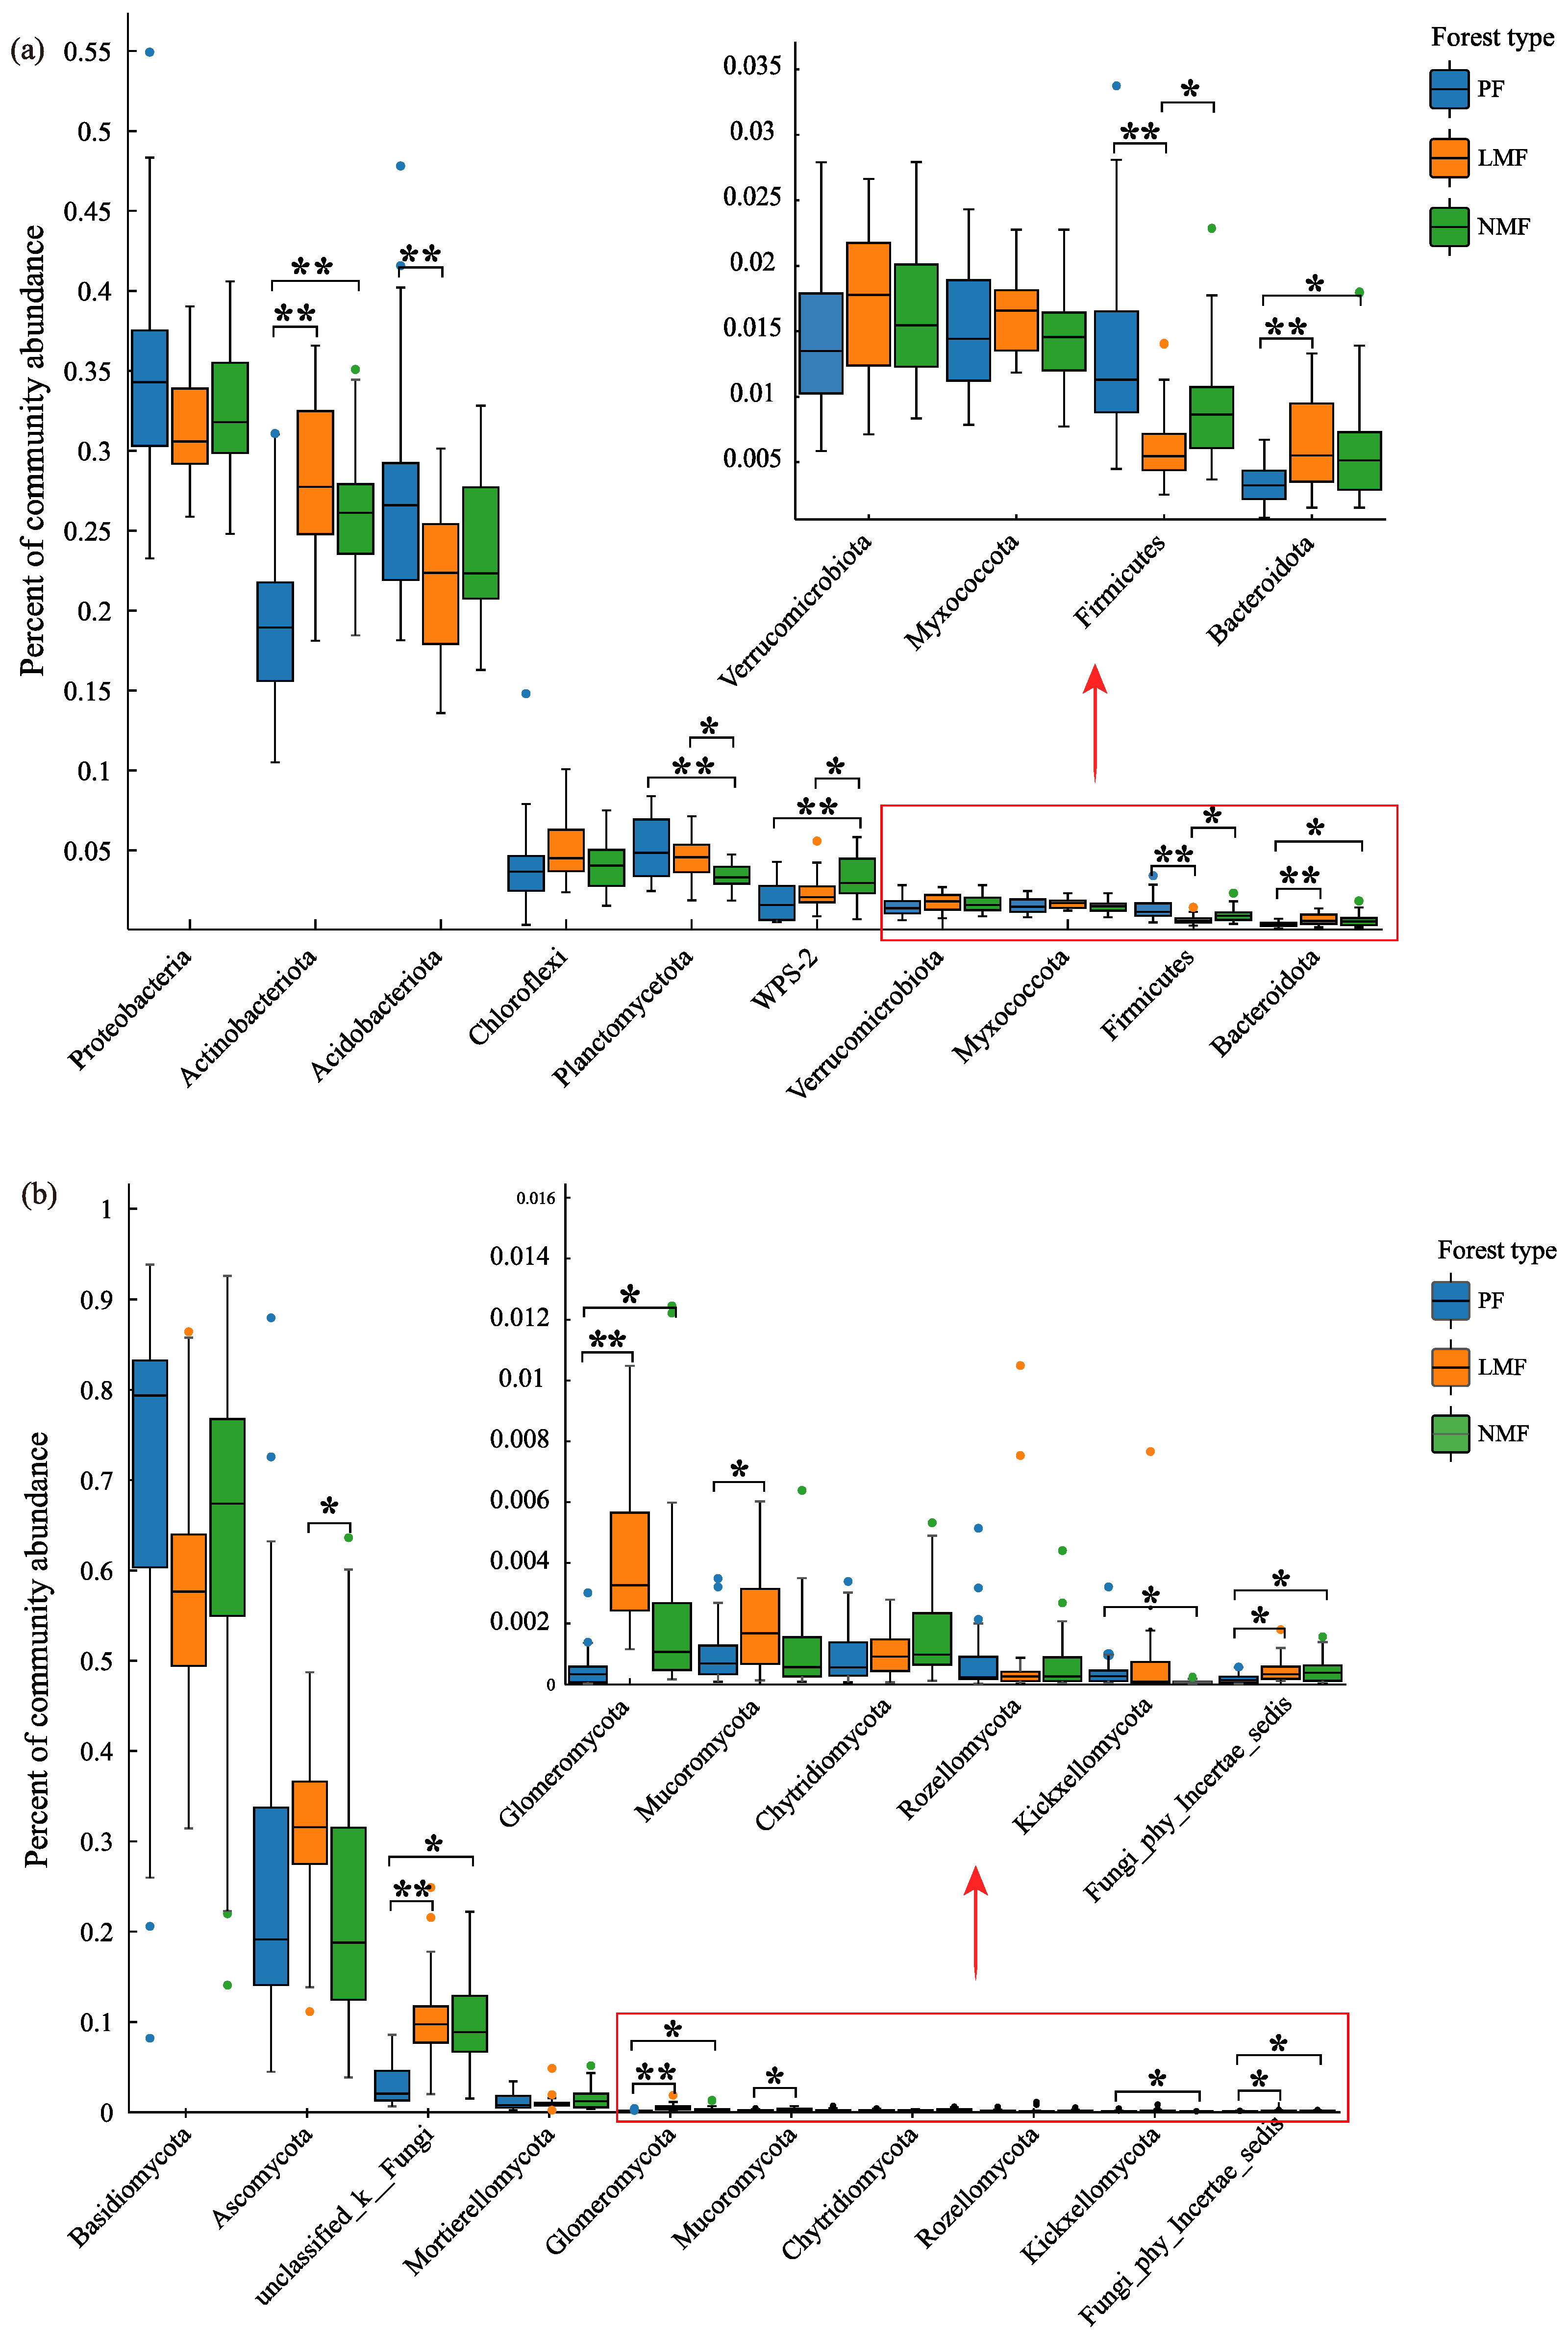
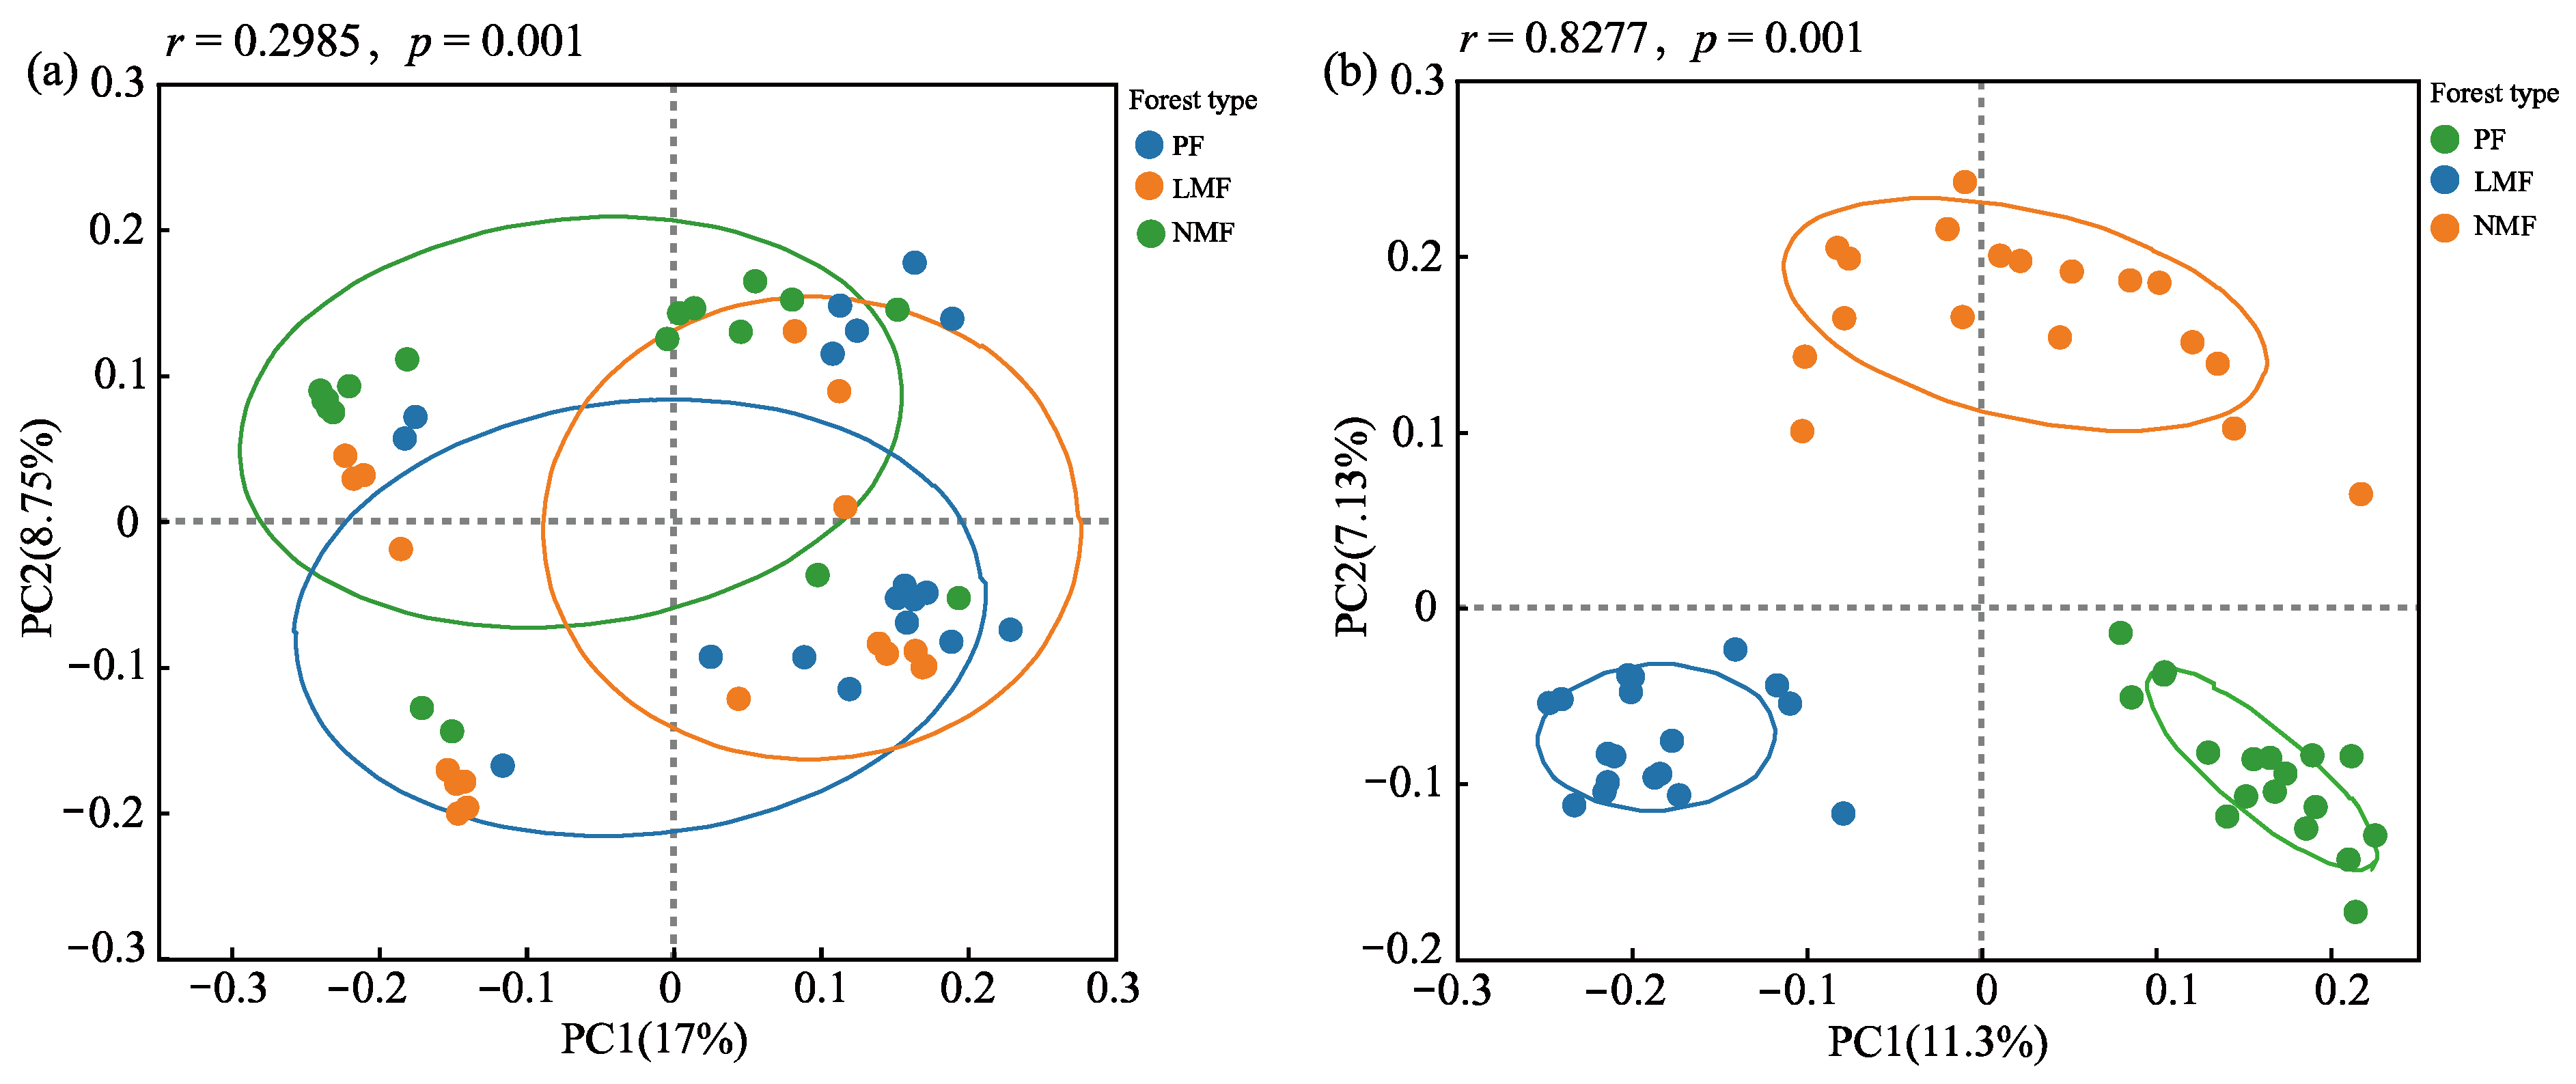

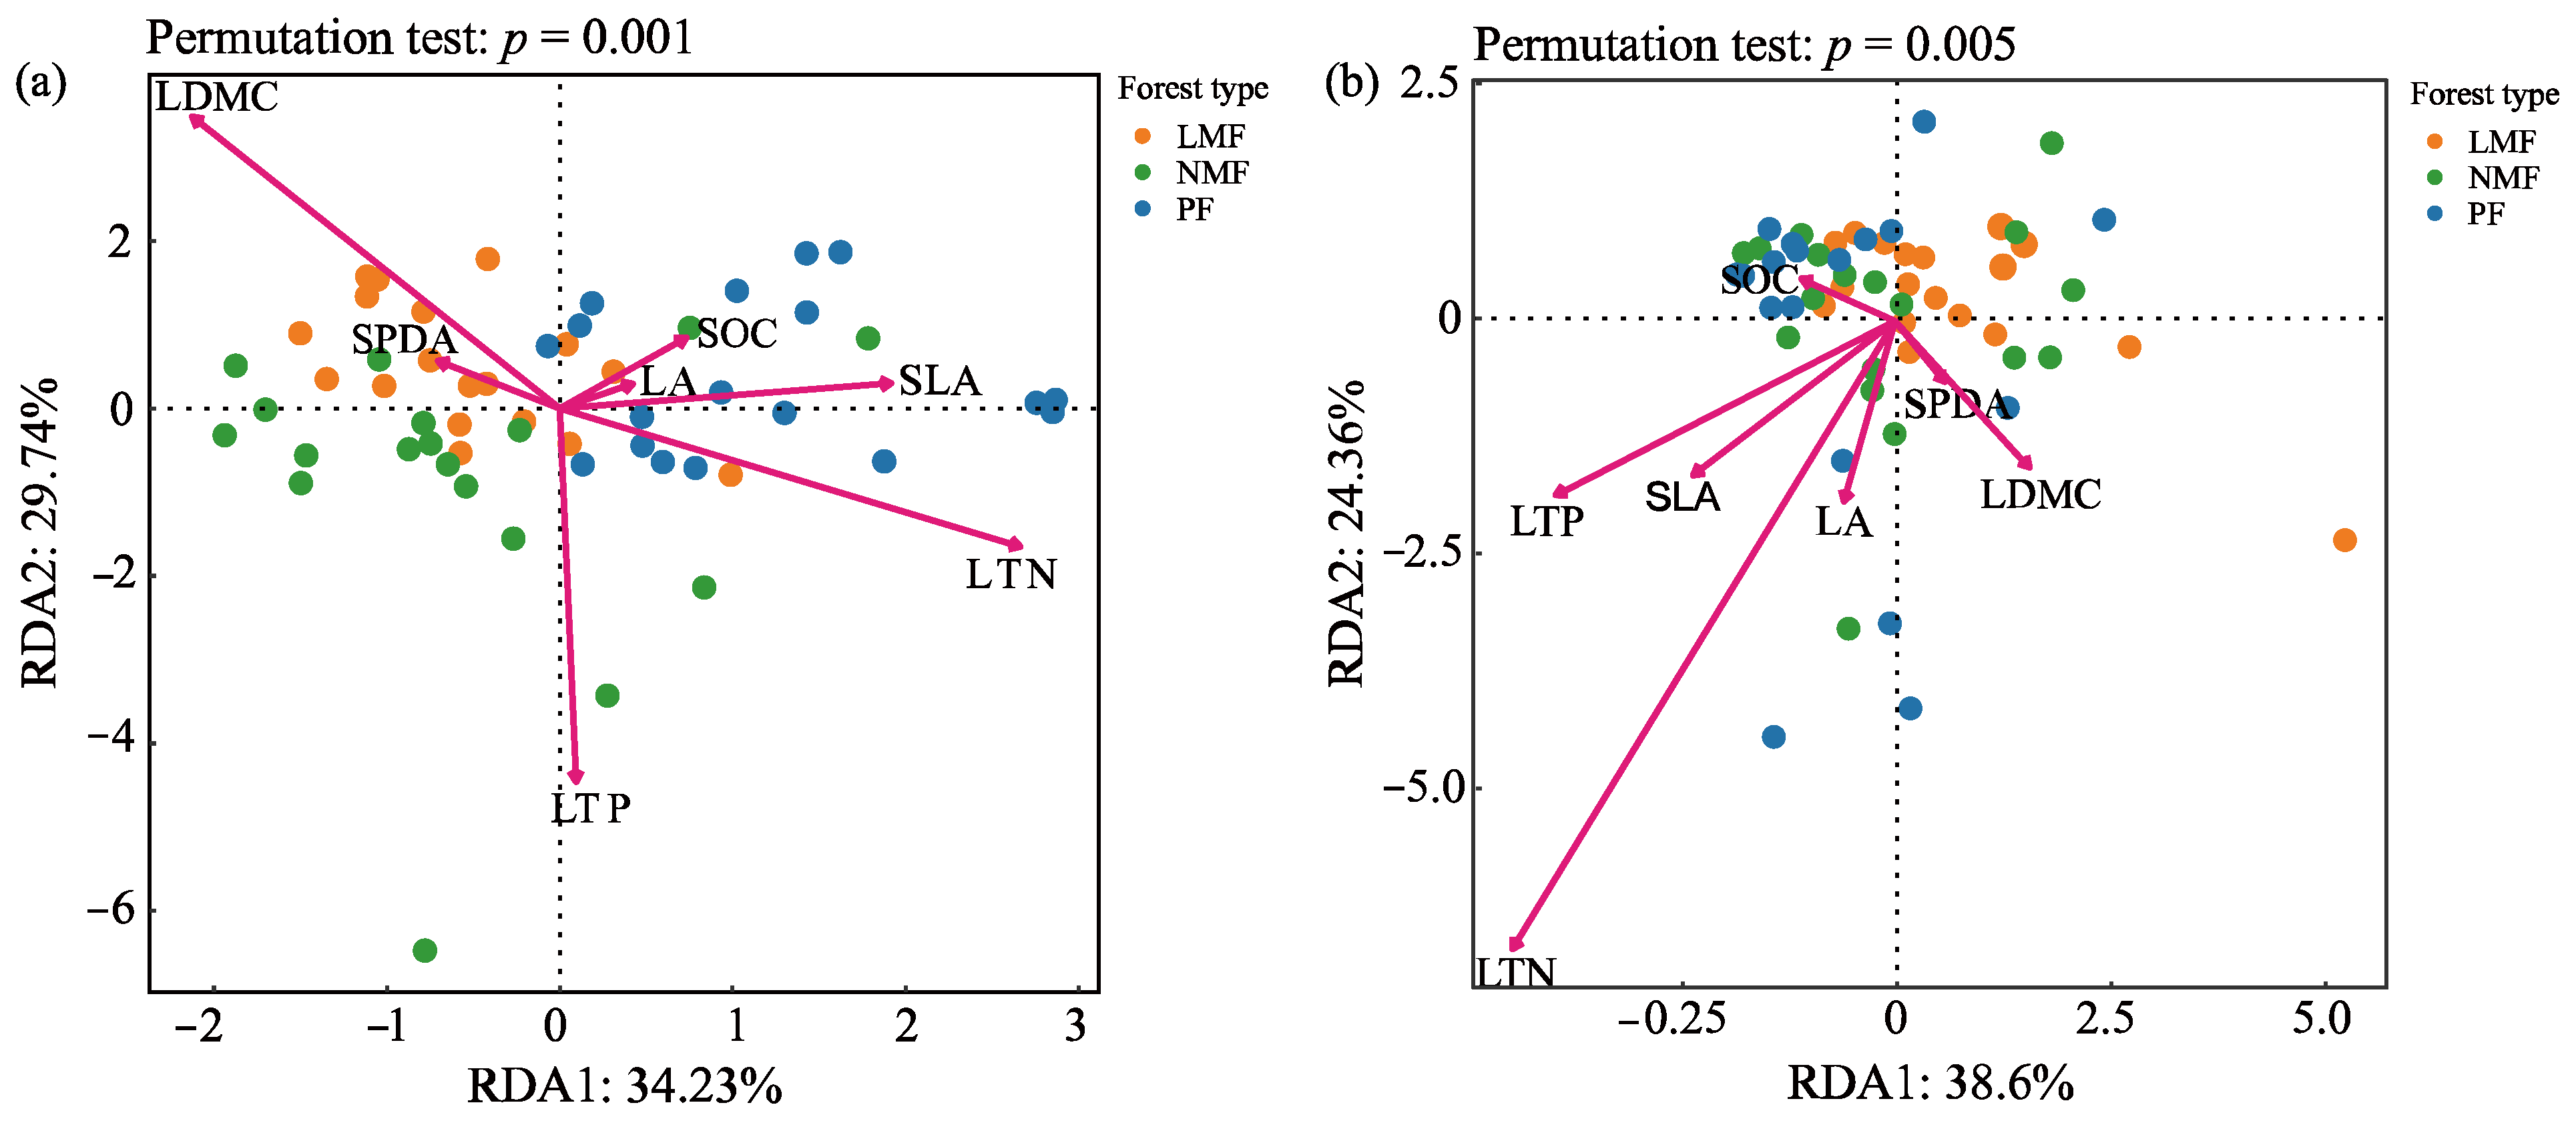
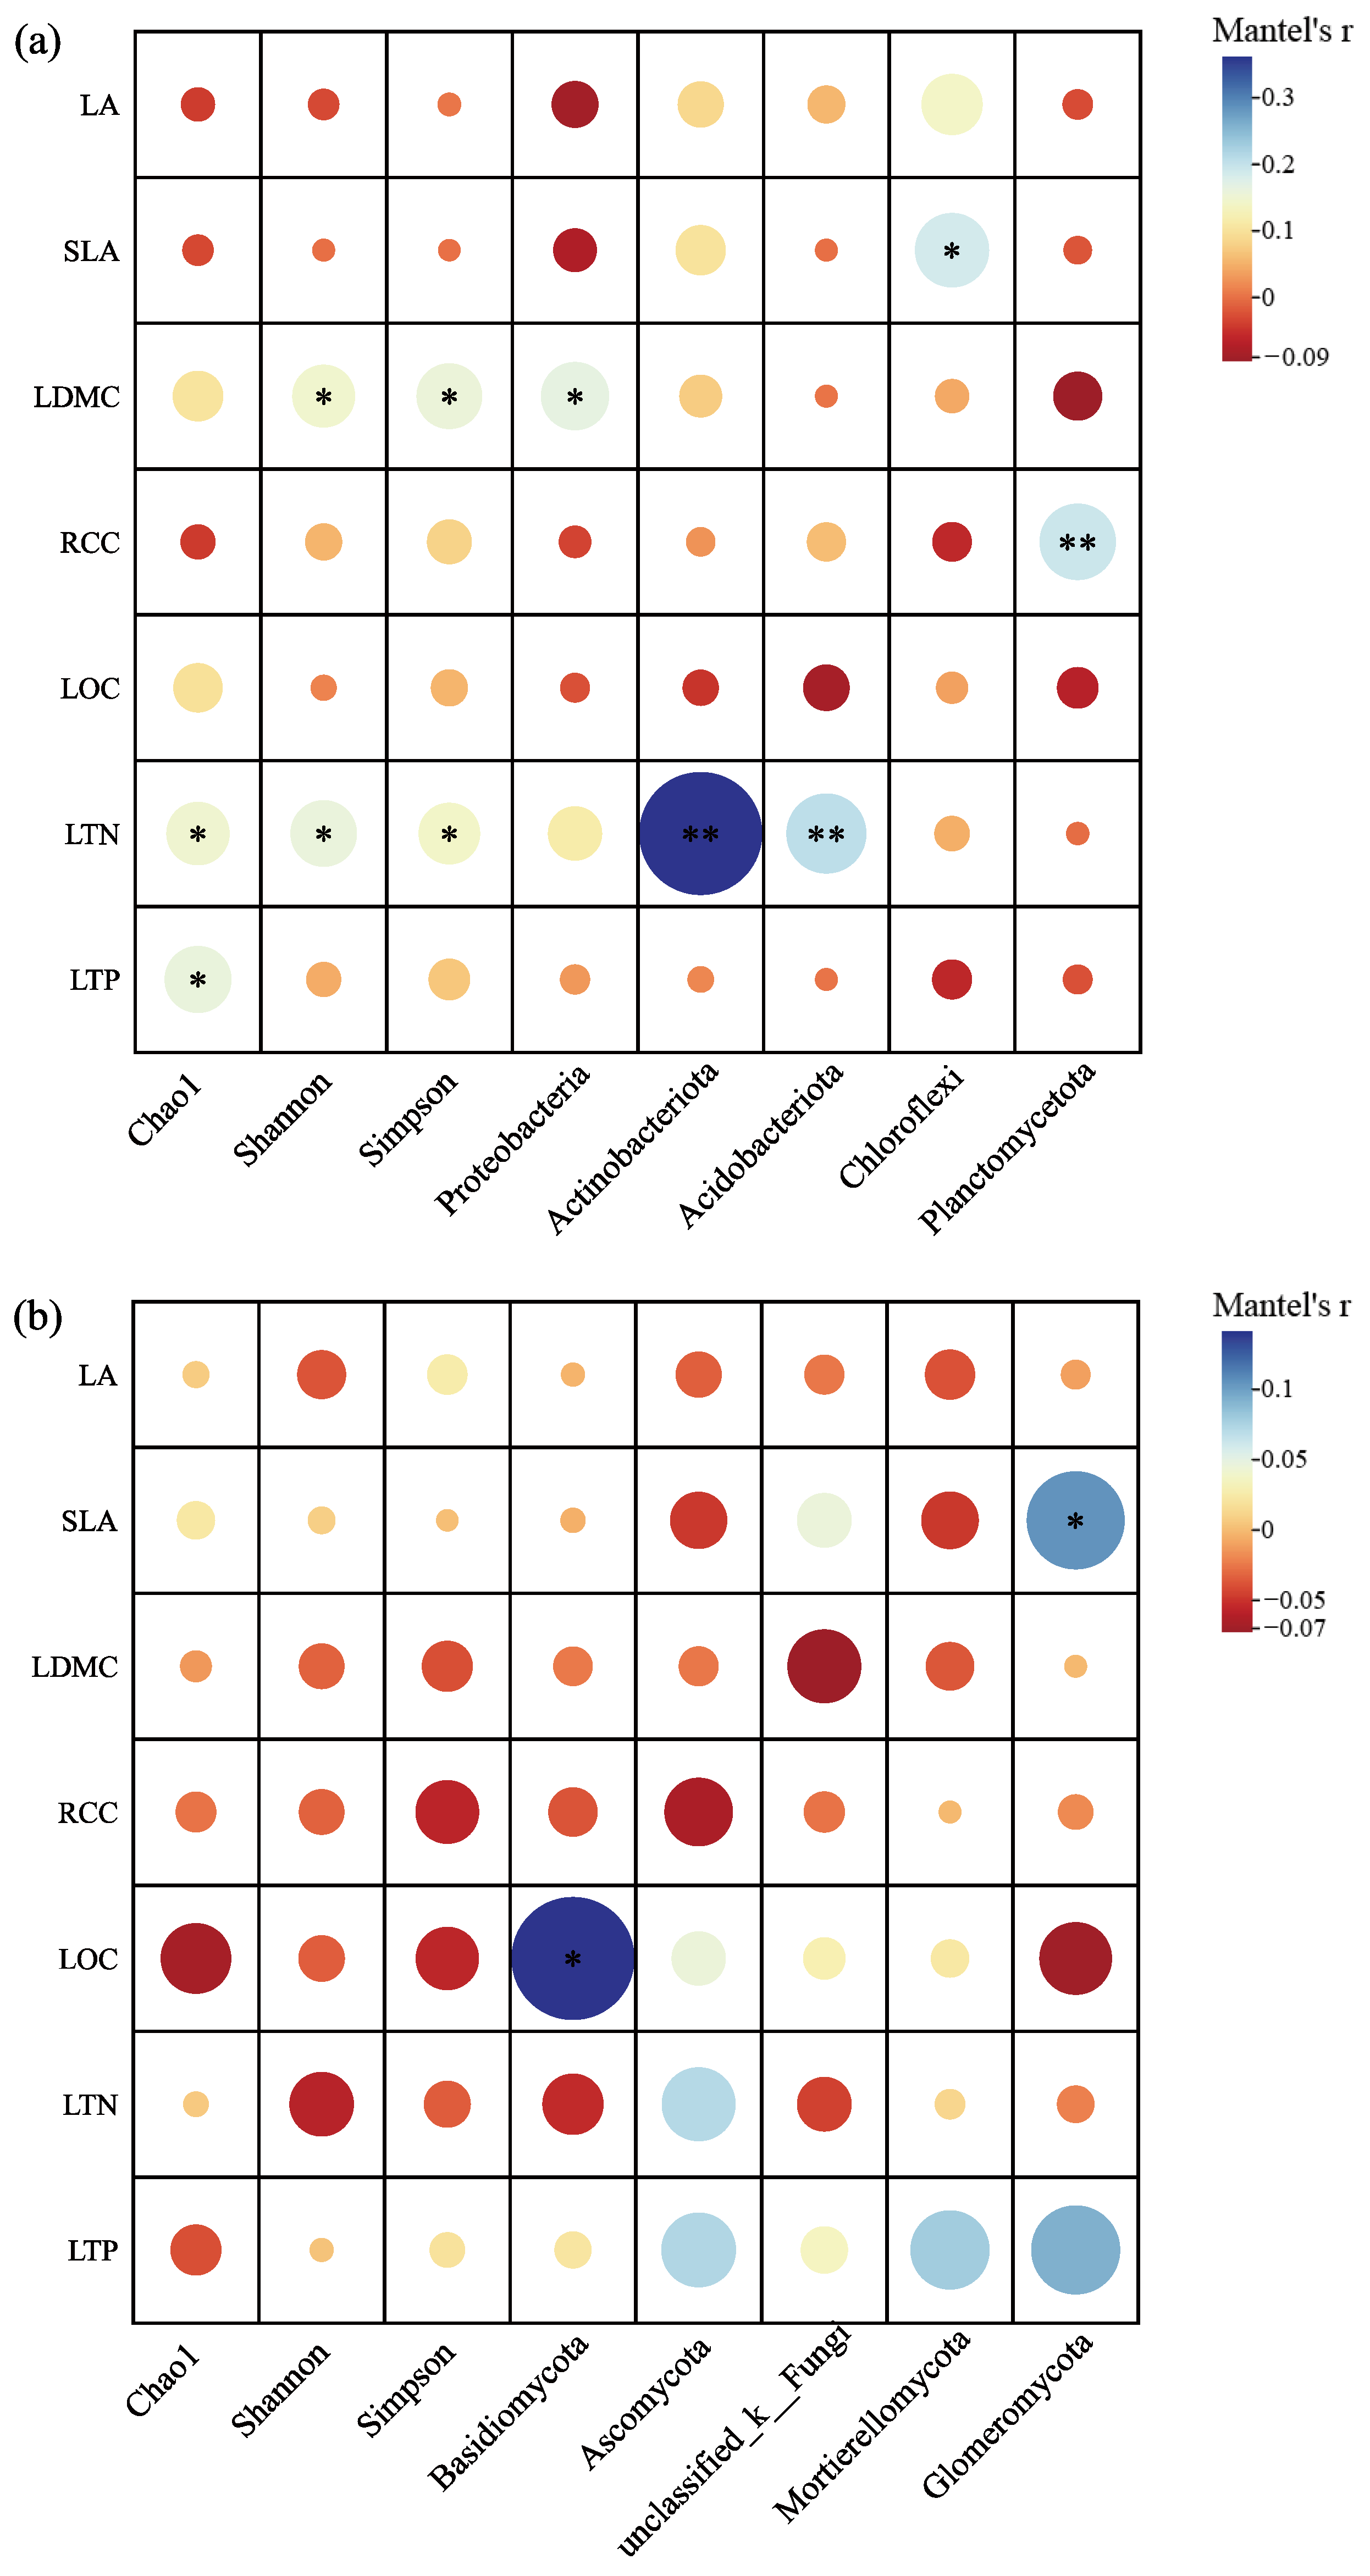
Disclaimer/Publisher’s Note: The statements, opinions and data contained in all publications are solely those of the individual author(s) and contributor(s) and not of MDPI and/or the editor(s). MDPI and/or the editor(s) disclaim responsibility for any injury to people or property resulting from any ideas, methods, instructions or products referred to in the content. |
© 2025 by the authors. Licensee MDPI, Basel, Switzerland. This article is an open access article distributed under the terms and conditions of the Creative Commons Attribution (CC BY) license (https://creativecommons.org/licenses/by/4.0/).