Article

The Effects of Different Moso Bamboo Densities on the Physiological Growth of Indocalamus latifolius Cultivated in Moso Bamboo Forests

1
Zhejiang Academy of Forestry, Hangzhou 310023, China
2
Northwest Zhejiang Bamboo Forest Ecosystem Positioning Observation and Research Station, National Forestry and Grassland Administration, Hangzhou 310023, China
*
Author to whom correspondence should be addressed.
Forests 2025, 16(4), 636; https://doi.org/10.3390/f16040636
Submission received: 1 March 2025 / Revised: 2 April 2025 / Accepted: 4 April 2025 / Published: 5 April 2025

Abstract

:
Cultivating Indocalamus latifolius in moso bamboo (Phyllostachys edulis) forests is a technique in a compound economical and ecological agroforestry system. However, the impacts of different moso bamboo densities on the physiological growth of I. latifolius remain unclear. The aim of this study was to elucidate the adaptation mechanism of I. latifolius to the environment in forests with different moso bamboo densities. One-year-old I. latifolius seedlings were planted in moso forests with four different densities (CK: 0 plants·ha−1; T1: 1050 plants·ha−1; T2: 2100 plants·ha−1; T3: 3150 plants·ha−1) for two years. The biomass and contents of nitrogen (N), phosphorus (P), potassium (K), starch (ST), and soluble sugars (SSs) in old leaves, new leaves, stems, rhizomes and roots of I. latifolius, as well as leaf functional traits [leaf length (LL), leaf width (LW), leaf thickness (LT), leaf area (LA), specific leaf area (SLA), and leaf tissue density (LTD)] and root morphology [root surface area (RSA), root length (RL), root diameter (RD), and specific root length (SRL)] were measured. With the increase in moso bamboo density, the biomass of various organs of I. latifolius showed a trend of first increasing and then decreasing, and all reached the highest level under treatment T1. Compared with the CK, treatments T1, T2, and T3 significantly increased the LL, LW, LT, LA, RL, RSA, RD, and length ratio of thicker roots (diameter > 2 mm) of I. latifolius, while significantly decreasing the SRL, SLA, and length ratio of finer roots (diameter ≤ 0.2 mm). Treatments T1, T2, and T3 significantly reduced the N content in the stems and rhizomes, the P content in the old leaves, and the SS content in the new leaves, and they increased the P content and K content in new leaves, stems, rhizomes, and roots; the N content in roots; and the starch contents in old leaves and new leaves. Treatment T1 significantly increased the N content in old leaves and the SS contents and the SS/ST of old leaves, roots, and rhizomes, and it decreased the N content in new leaves and the ST contents in roots, rhizomes and stems. Our results indicated that moso bamboo forests with low density can effectively promote the growth of I. latifolius in the forest. I. latifolius adapts to the shading and the root competition of moso bamboo by expanding the leaf area and promoting root growth. In this process, it supports the morphological plasticity of leaves and roots through the mechanisms of reabsorbing P and K and the directional transportation of photosynthetic products.

1. Introduction

Moso bamboo (Phyllostachys edulis (Carr.) H. de Lehaie f. edulis) is a bamboo species with the largest distribution area in China, and it holds significant economic value [1]. However, in recent years, due to factors such as the continuous increase in labor costs, growing market competition, and low added value of bamboo forests, farmers have lost confidence in managing moso bamboo forests, leading to large-scale abandonment of these forests [2]. Planting cash crops in a moso bamboo forest can improve the economic benefits of the bamboo forest and enhance the biodiversity of the ecosystem [3]. Indocalamus latifolius is a bamboo (Poaceae) with leaves that are used to produce zongzi, a traditional Chinese delicacy, and it also produces flavonoids and essential oils [4]. I. latifolius is moderately shade tolerant and can grow well in moso bamboo, coniferous, and broad-leaved forests [5]. Therefore, underplanting I. latifolius in moso bamboo forests provides great potential for enhancing the economic benefits of moso bamboo forests.
The competitive relationships among co-existing plants are at the core of research in agroforestry composite system management, as they directly determine the yield and benefits of understory cash crops [6]. The aboveground parts of co-existing plants vie for light, while root systems compete for water and nutrient resources [7]. Stand density represents a crucial factor influencing the distribution and physiological growth of understory plants, as it markedly modifies the intensity of competition for light and soil resources among co-existing plants [8]. Firstly, with respect to the aboveground parts, even subtle changes in light intensity can exert an impact on the pigment content, stomatal conductance, transpiration, and photosynthesis of plant leaves [9,10]. Plants with high plasticity can adapt to different light environments by regulating leaf functional traits, longitudinal stem growth, and root morphogenesis [11]. Plants with different shade tolerance exhibit diverse and sometimes even opposite adaptive growth and development strategies under light stress [12]. For example, most C3 plants have a higher photosynthetic rate and thus stronger light adaptability compared to C4 plants [13]. A decrease in light intensity can reduce the photosynthesis, leaf thickness, and leaf area of some plants. However, it can also stimulate leaf expansion and stem elongation in some plants, enabling them to capture more light [14]. Plants can also adjust the carbon allocation pattern among different organs, as well as the ratio of carbon storage to respiratory consumption, to cope with the insufficient carbon assimilation caused by shading [15]. Changes in understory light conditions also directly or indirectly affect the allocation strategies of nutrient elements in understory vegetation such as nitrogen and phosphorus. Research indicates that nutrient elements can optimize the interception capacity of photosynthetically active radiation by regulating the leaf area index, leaf morphology, and chlorophyll content [16]. For instance, under low-light conditions, plants focus on optimizing photosynthetic efficiency, reducing investment in vegetative growth, and optimizing the allocation mechanism of nitrogen and phosphorus to maintain basic physiological functions and enhance stress resistance [17]. Plants may reduce the allocation of nutrients to non-photosynthetic organs (such as stems and roots) and prioritize ensuring the nutrient supply to leaves to sustain the carbon assimilation process under low-light stress, although plant growth may be restricted to some extent [18]. However, due to differences in plant shade tolerance, the response strategies of plant growth and the allocation of resources (nutrients and carbon) to light changes are not uniform.
On the other hand, for the underground system, different stand densities exert different intensities of root competition pressure on understory vegetation [19]. Under resource competition, the root growth of understory vegetation is usually inhibited [7]. Some studies have found that under the compound planting mode, understory vegetation changes the vertical and horizontal distribution patterns of roots, separates ecological niches, and ultimately reduces inter-specific root competition [20]. Some vegetation allocates more carbon to lateral roots and root hairs to enhance their own water and nutrient competition capabilities [21]. However, the root growth of understory vegetation can also be promoted by the secretion of beneficial metabolites from the roots of co-existing plants and nitrogen-fixing effects [22,23]. It can be seen that only by promoting the inter-specific interactions in the agro-forestry complex ecosystem, reducing competition mechanisms, and enhancing complementarity can the development of the agro-forestry complex ecosystem be facilitated.
Moso bamboo is a typical clonal plant. The stand density of moso bamboo forests (moso bamboo density) changes annually, as new bamboos emerge every year [24]. To appropriately thin the forest and maintain the stand density within a reasonable range is beneficial to the growth and reproduction of I. latifolius in the understory. I. latifolius, also a clonal plant, possesses remarkable resource physiological integration capabilities and physiological construction plasticity [25]. When adapting to changes in light conditions and root competition, I. latifolius may demonstrate more flexible growth and resource allocation strategies. However, the adaptive growth and resource allocation strategies of I. latifolius in moso bamboo forests with different stand densities remain unclear. Therefore, in this study, we investigated the functional traits of leaves and roots, the biomass, the nutrient elements, and the allocation of photosynthetic products in different organs of I. latifolius in moso bamboo forests with varying stand densities. The aim of this study is to deepen our understanding of the adaptation mechanisms of I. latifolius to different understory growth environments.

2. Materials and Methods

2.1. Experimental Set up

The experimental moso bamboo forest is located in Tantou Village (29°15′ N, 118°29′ E), Kaihua County, Quzhou City, Zhejiang Province, China. It has a typical subtropical monsoon climate with an annual average temperature of 16.6 °C, an average annual sunshine duration of 1633.5 h, an annual rainfall of 1830.8 mm, a frost-free period of 252 d, and an altitude of 76 m. Prior to the experiment, the moso bamboo forest had undergone over 40 years of extensive management. During this time, only a small quantity of spring bamboo shoots were harvested, and 4 du bamboos (over 6 years old) were felled. Moreover, neither fertilization nor intercropping had ever been implemented. The density of moso bamboos in the forest ranged from 3 000 to 3 300 plants·ha−1. The quantitative ratio among 1 du bamboos (1 year old), 2 du bamboos (2–3 years old), and 3 du bamboos (4–5 years old) is 1:1:1. The soil layer thickness in the bamboo forest was greater than 50 cm. The soils in the region were classified as red loam and were derived from weathered product sand shale. One kilogram of the soil (pH = 4.94) contained 1.25 g of total nitrogen (N), 11.4 g of total potassium (K), 0.326 g of total phosphorus (P), 108.2 mg of hydrolyzable N, 103.4 mg of available K, 7.25 mg of available P, and 15.8 g of organic carbon.
In October 2021, moso bamboo density and DBH, as well as physical and chemical properties of the soil, were investigated. Moso bamboo forests with a common cultivation history, slope, bamboo density, DBH, and soil nutrient content were selected for the experiment. First, sixteen square plots (20 m × 20 m) were set up and divided into four experimental zones for four test replicas. Each experimental zone contained four plots for four different treatments. The basic information of each treatment plot is listed in Table 1. The canopy density in bamboo forests was measured using a plant canopy analyzer (LI-COR Inc., LAI-2200C, Lincoln, NE, USA).

2.2. Harvest and Measurements

In November 2021, moso bamboos were felled according to the bamboo density of each treatment in Table 1. When felling moso bamboo, relatively older and more densely grown bamboos were removed first to ensure that the remaining moso bamboos were evenly distributed in the plot. The stumps and roots of the felled bamboo, as well as the rhizomes and their roots within a 2 m × 2 m square area centered around the stumps, were also removed. All plots were reclaimed once at a depth of 0–20 cm. During the reclamation, all the rhizomes, roots, and bamboo stumps of the moso bamboo forest in the plot of the CK were completely removed. In November 2021, one-year-old I. latifolius seedlings were planted in the moso bamboo forest at a density of 4500 plants·ha−1. The identification of I. latifolius was based on the Flora of Zhejiang Province (2021). These I. latifolius seedlings were obtained by dividing mother bamboos of the same origins in February 2021. The height of the seedlings was 39.2 ± 2.7 cm. In November 2022, moso bamboos were felled again, and the number of felled moso bamboos was the same as the number of new moso bamboos that grew at the beginning of the year, so as to keep the moso bamboo density in each sample plot unchanged. Meanwhile, all the branches and leaves of the I. latifolius that had grown before its transplantation were trimmed off, leaving only the newly sprouted branches and leaves of that year.
In October 2023, 5 clumps (each one-year-old seedling can develop into a clump after being cultivated for two years) of I. latifolius were randomly selected from each sample plot, with a total of 80 clumps collected. During sampling, based on the morphology and appearance of the leaves, old leaves (grown in 2022), new leaves (grown in 2023) (Figure 1), and stems were separated using scissors. Subsequently, all roots and rhizomes were excavated. The soil was passed through a 10-mesh sieve to collect the scattered fine roots. All rhizomes, roots, stems, and leaves were sealed in sealing bags and brought back to laboratory through ice boxes (0–2 °C). After being rinsed with clean water, the root samples were scanned using a duplex scanner (Regent Instruments Inc., WinRhizo Pro, Québec, QC, Canada) to obtain root images with a resolution of 500 dpi. The root images were analyzed by WinRhizo software (version 2.0) to obtain root morphology parameters including root length (RL, cm), root surface area (RSA, cm2), and root average diameter (RD, mm) (Table 2). The ratio of the root length of each diameter grade (rl) to the total root length was used to calculate the root length ratio (RLR). Then, the leaves, stems, rhizome and roots were devitalized at 105 °C for 30 min to cease their physiological metabolism and were dried at 65 °C to a constant weight to obtain the dry weight (biomass). The specific root length (SRL, cm·g−1) was the ratio of root length to root dry weight. The biomass of roots, rhizomes, and leaves, as well as the root morphological parameters for each sample plot, are the average values of the 5 clumps of I. latifolius. The root/shoot ratio was the ratio of the biomass of the belowground part (rhizomes and roots) to that of the aboveground part (stems and leaves).
Ten leaves were randomly selected from the leaves of each clump of I. latifolius. A vernier caliper was used to measure their leaf length (LL, cm), leaf width (LW, cm), and leaf thickness (LT, mm). The leaf area (LA, cm2) was measured using an LI-3000C leaf area meter (LI-COR Inc., Lincoln, NE, USA). Subsequently, the leaf samples were placed in an oven at 105 °C for 30 min and then dried to a constant weight at 65 °C to obtain the leaf dry mass (LDM, g). The specific leaf area (SLA, cm2·g−1) and leaf tissue density (LTD, g·cm−3) were calculated by the following formulas. A total of 50 leaves were measured in each sample plot. The leaf morphological traits of each sample plot were the average values of these 50 leaves.
RLR = rl/RL
SLA = LA/LDM
LTD = LDM/(LA × LT)
The leaves of 5 clumps of I. latifolius were mixed evenly, and then 200 g from the leaf pool were taken to measure the contents of N, P, K, and non-structural carbohydrates [NSC, including soluble sugar (SS) and starch (ST)]. The same methods used for leaves were adopted to determine the nutrient elements and NSC in roots, rhizomes, and stems. The contents of N, P, and K were measured by the H2O2-H2SO4 method, Vanadium molybdenum yellow colorimetry, and Flame photometer method, respectively [26]. The concentration of mobile sugars and starch was measured by the anthrone sulfuric acid method [27]. The full forms of all the abbreviations are presented in Table 2.

2.3. Statistical Analysis

Difference significance and correlation between parameters were analyzed using SPSS software (version 20.0; SPSS Inc., Chicago, IL, USA). The significance of the difference in the data between different treatments was tested using factorial analysis of variance (ANOVAs). Pearson’s correlation analysis method was used to analyze the correlations between the trait indicators of leaves and roots and the contents of nutrient elements and NSCs. The normality of residuals was statistically tested by the Shapiro–Wilk test.

3. Results

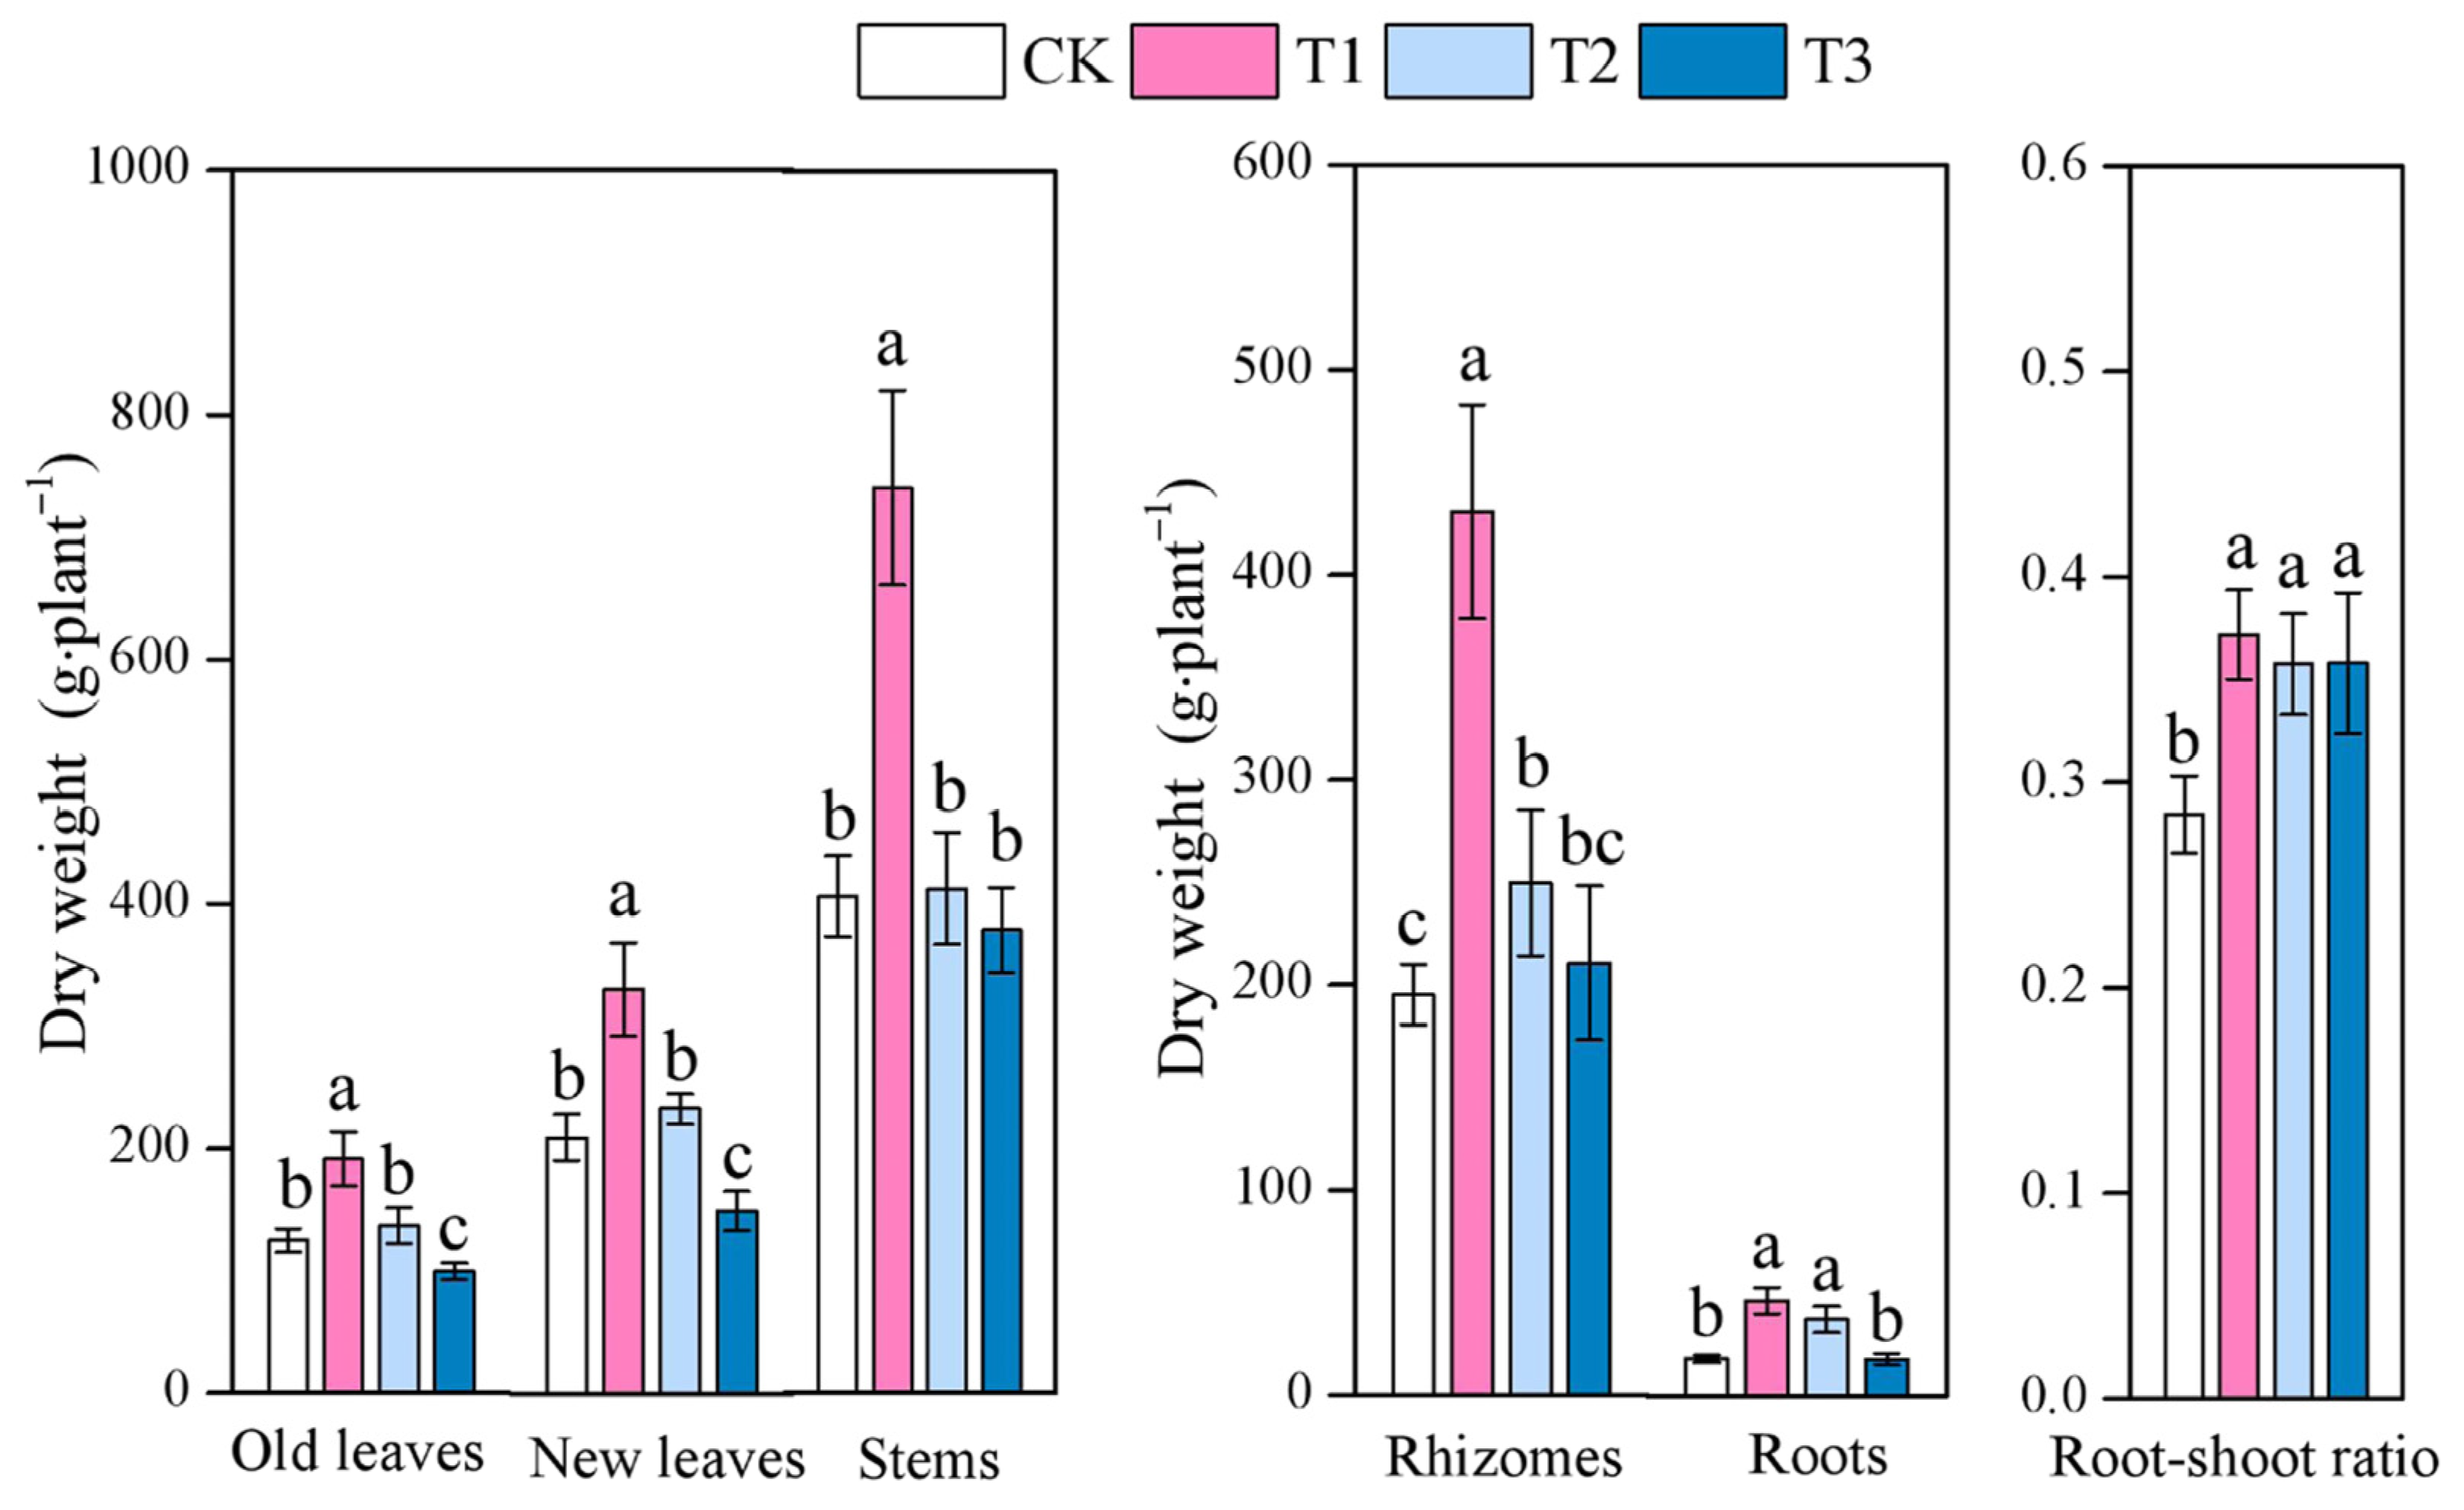
3.1. Effect of Different Moso Bamboo Densities on the Biomass Allocation of I. latifolius

Biomass of leaves (LB), roots (RB), stems, rhizomes, and root/shoot ratio was measured to reflect growth characteristics and carbon allocation strategies of I. latifolius under different bamboo densities. As the density of moso bamboo increased, the biomass of old leaves, new leaves, stems, rhizomes, and roots of I. latifolius exhibited a trend of first increasing and then decreasing. Significantly, the peak values for all these organs’ biomasses were observed under treatment T1. Compared with the treatment of the CK, treatment T1 significantly increased the biomass of all organs. Treatment T2 significantly increased the biomass of roots and rhizomes, while the treatment T3 significantly decreased the biomass of new leaves and old leaves. Moreover, treatments T1, T2, and T3 significantly increased the root/shoot ratio of I. latifolius compared with the CK treatment (Figure 2).

3.2. Effect of Different Moso Bamboo Densities on the Nutrient Elements and Unstructured Carbohydrates Allocation of I. latifolius

Different moso bamboo densities significantly affected the allocation strategies of nutrient elements (Table 3). As moso bamboo density increased, the N content in old leaves exhibited a pattern of initially rising and subsequently declining, attaining its maximum value under treatment T1. In contrast, the N content in new leaves, stems, and rhizomes showed a pattern of first decreasing and then increasing. Simultaneously, the N content in roots exhibited a gradual increase. It was worth noting that there were significant differences in the allocation strategies of N compared with P and K. In contrast to CK, treatments T1, T2, and T3 led to a significant reduction in the P and K content of old leaves. Conversely, these treatments resulted in a significant increase in the P and K content of new leaves, stems, rhizomes, and roots.
Different densities of standing bamboo significantly affected the allocation strategies of NSCs (Table 4). As the density of moso bamboo increased, the contents of ST and SS and SS/ST of old leaves the first increased and then decreased, reaching their peak values under treatment T1. Compared with the CK, treatments T1, T2, and T3 significantly increased ST content in new leaves and decreased SS content and SS/ST in new leaves and stems. The ST content in the stems under treatment T1 was significantly lower than that in the stems under the other three treatments. As moso bamboos increased, the SS content in the rhizomes first showed an upward trend and then a downward trend, reaching its peak under treatment T1. Meanwhile, the starch content in the rhizomes gradually decreased, and the SS/ST gradually increased. In addition, the SS content and SS/ST in the roots both exhibited a pattern of increasing first and then decreasing, whereas the starch content showed a trend of decreasing first and then increasing, with all these indicators reaching their extreme values under treatment T1.

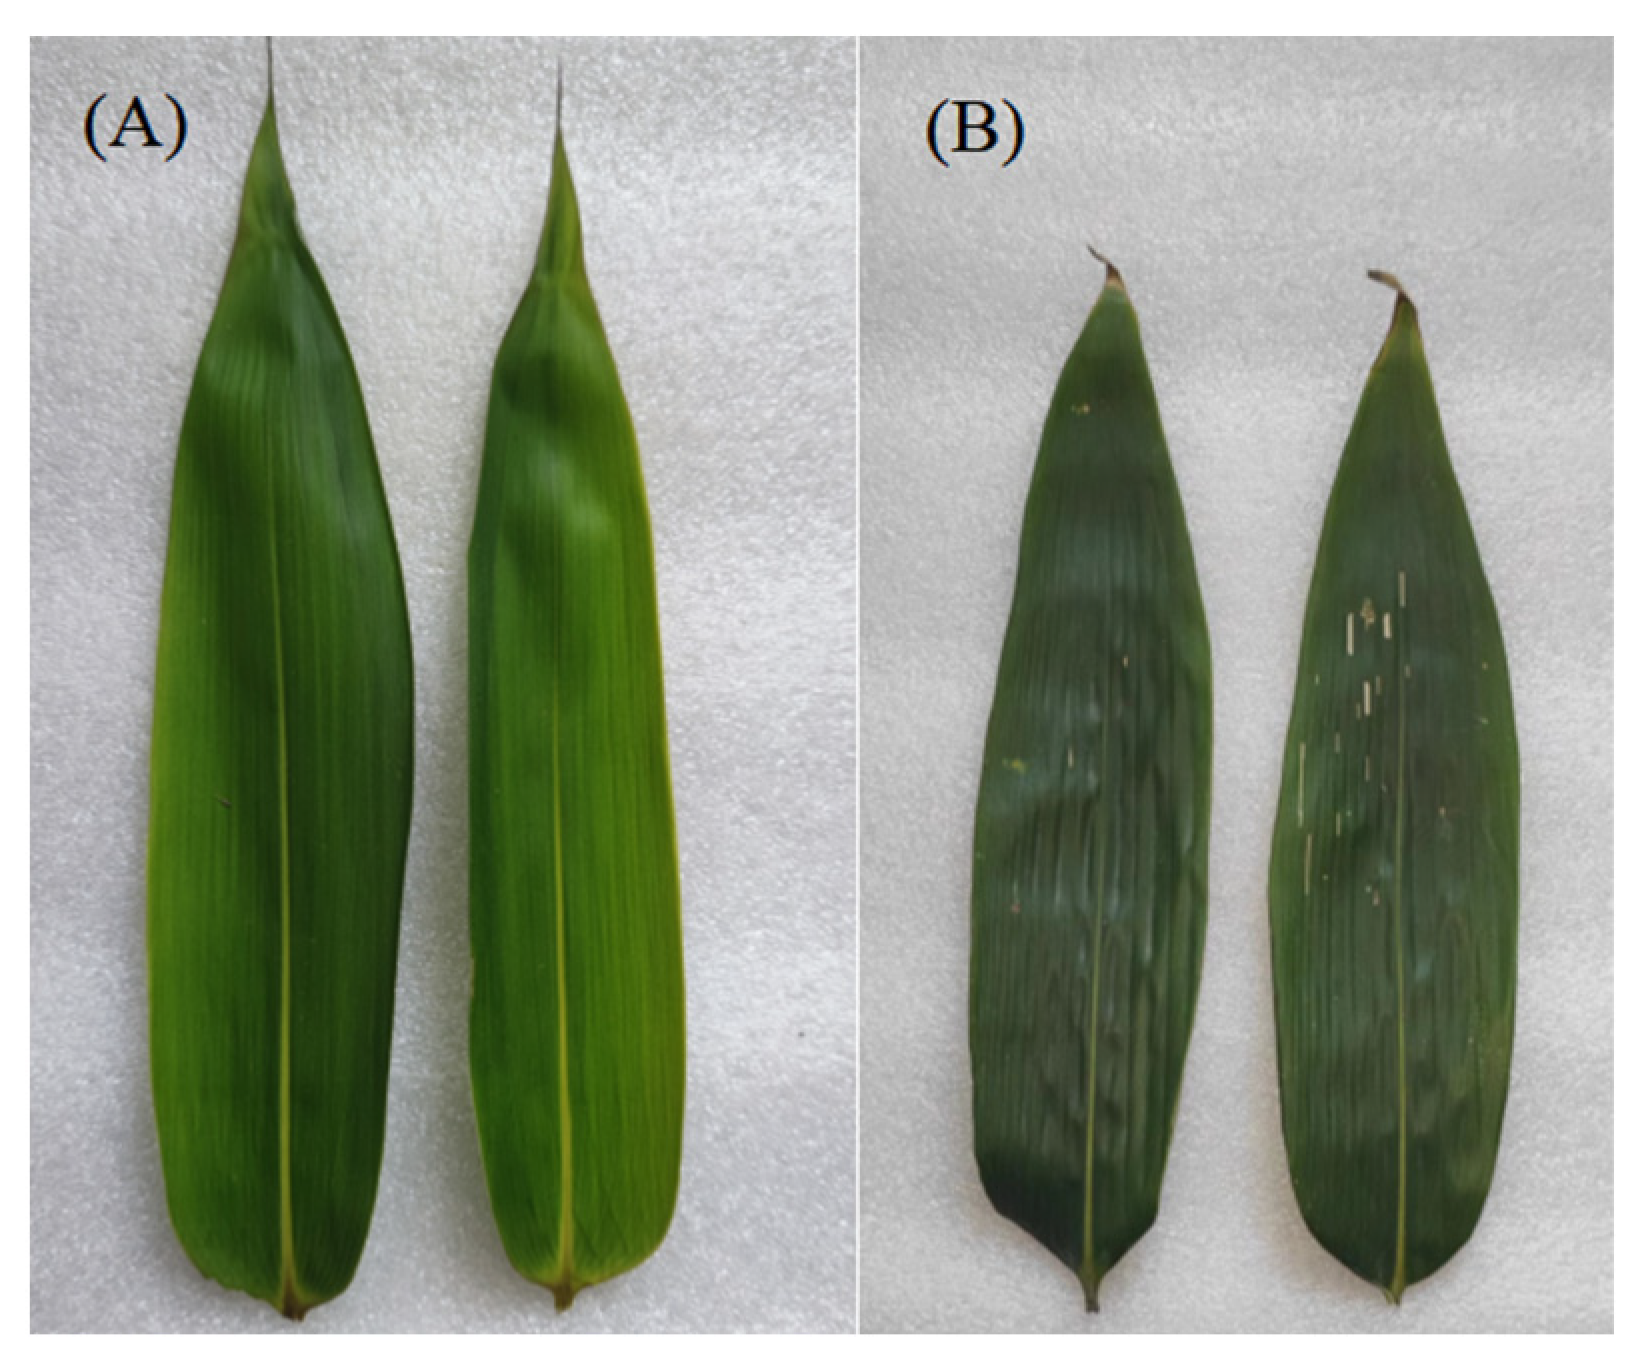
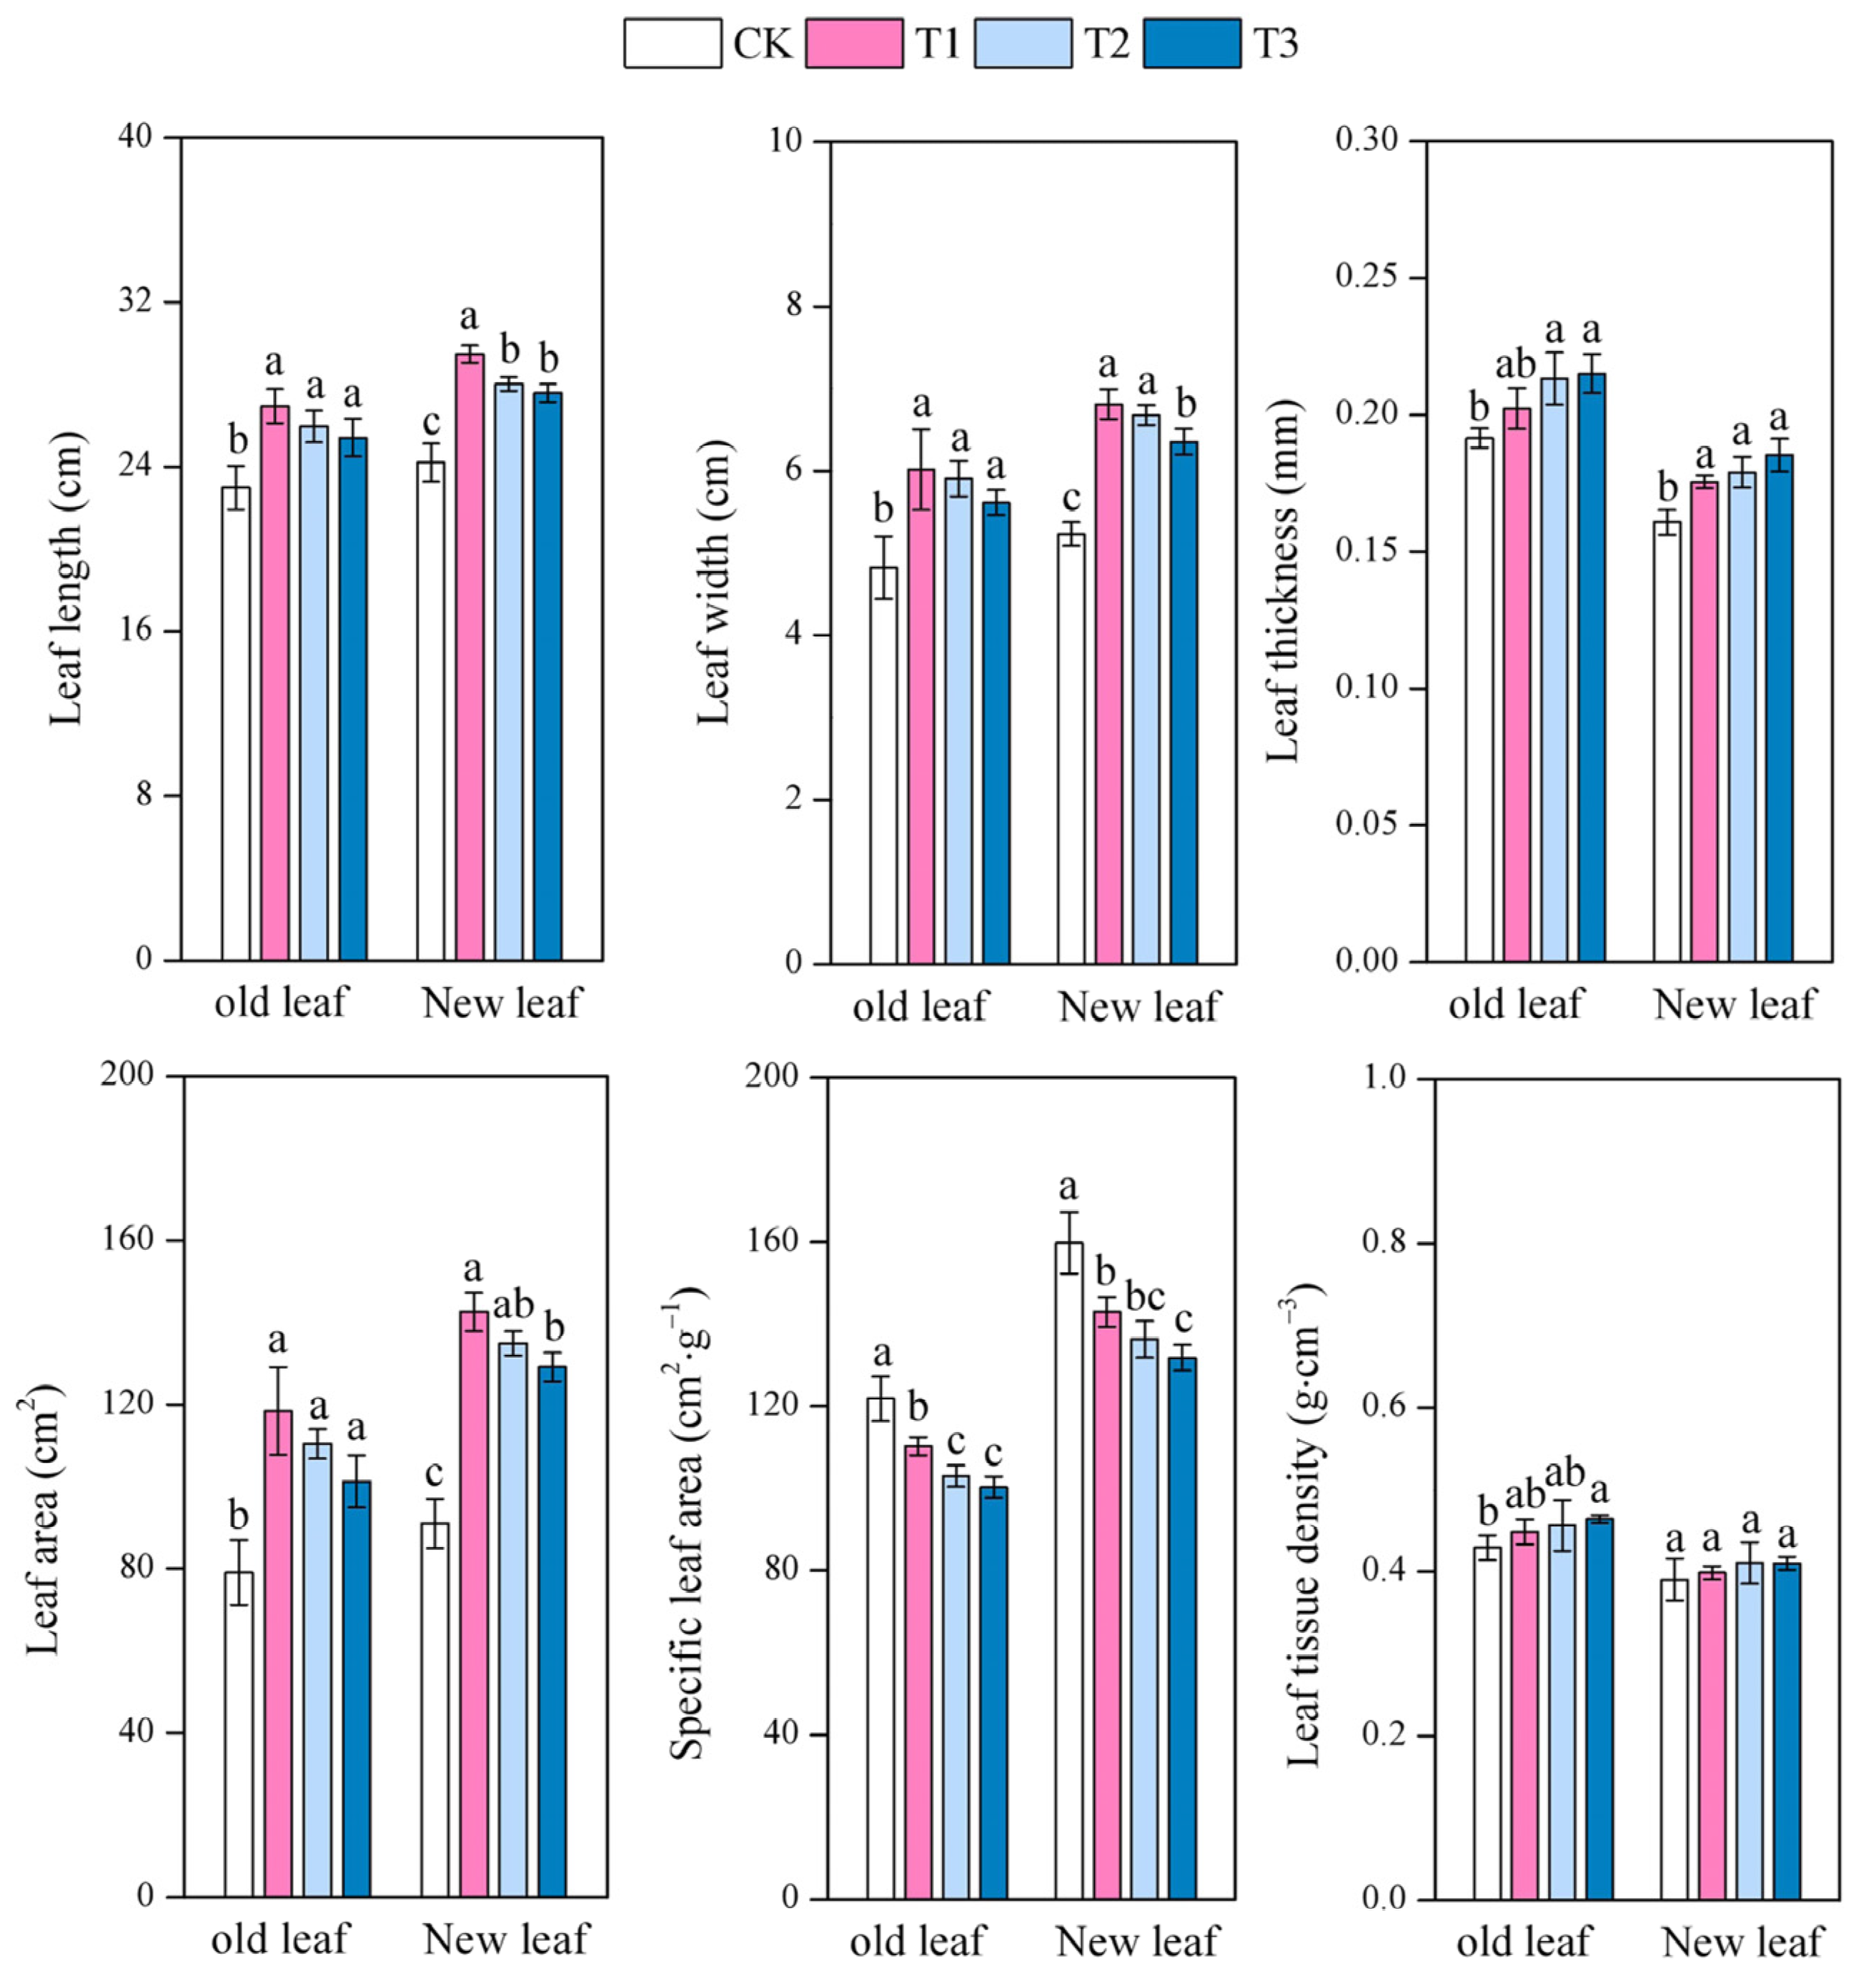
3.3. Effect of Different Moso Bamboo Densities on the Leaf Functional Traits of I. latifolius

Different moso bamboo densities significantly affected the leaf functional traits of I. latifolius (Figure 3). As the density of moso bamboo increased, the LL, LW, and LA of old leaves and new leaves first increased and then decreased, reaching their peak under treatment T1. Compared with the CK, treatments T1, T2, and T3 significantly increased the LL, LW, and LA and decreased the SLA of old and new leaves. Concurrently, the LT of old and new leaves under treatments T2 and T3 was greater than that under CK. Compared with the CK, treatment T1 elevated the LT of old leaves. Treatment T3 significantly increased the LTD of old leaves.

3.4. Effect of Different Moso Bamboo Densities on the Root Morphology of I. latifolius

Different densities of standing bamboo significantly affected the root morphology of I. latifolius (Figure 4). As the density of moso bamboo increased, the RL and RSA first increased and then decreased, reaching their peak values under treatment T1. Compared with the CK, treatments T1, T2, and T3 significantly enhanced the RD and decreased the SRL. Conversely, these treatments led to a significant decrease in the RLR for roots with a diameter in the range of 0 to 0.2 mm. Simultaneously, they brought about an increase in the RLR for roots with a diameter greater than 2 mm (Figure 5).

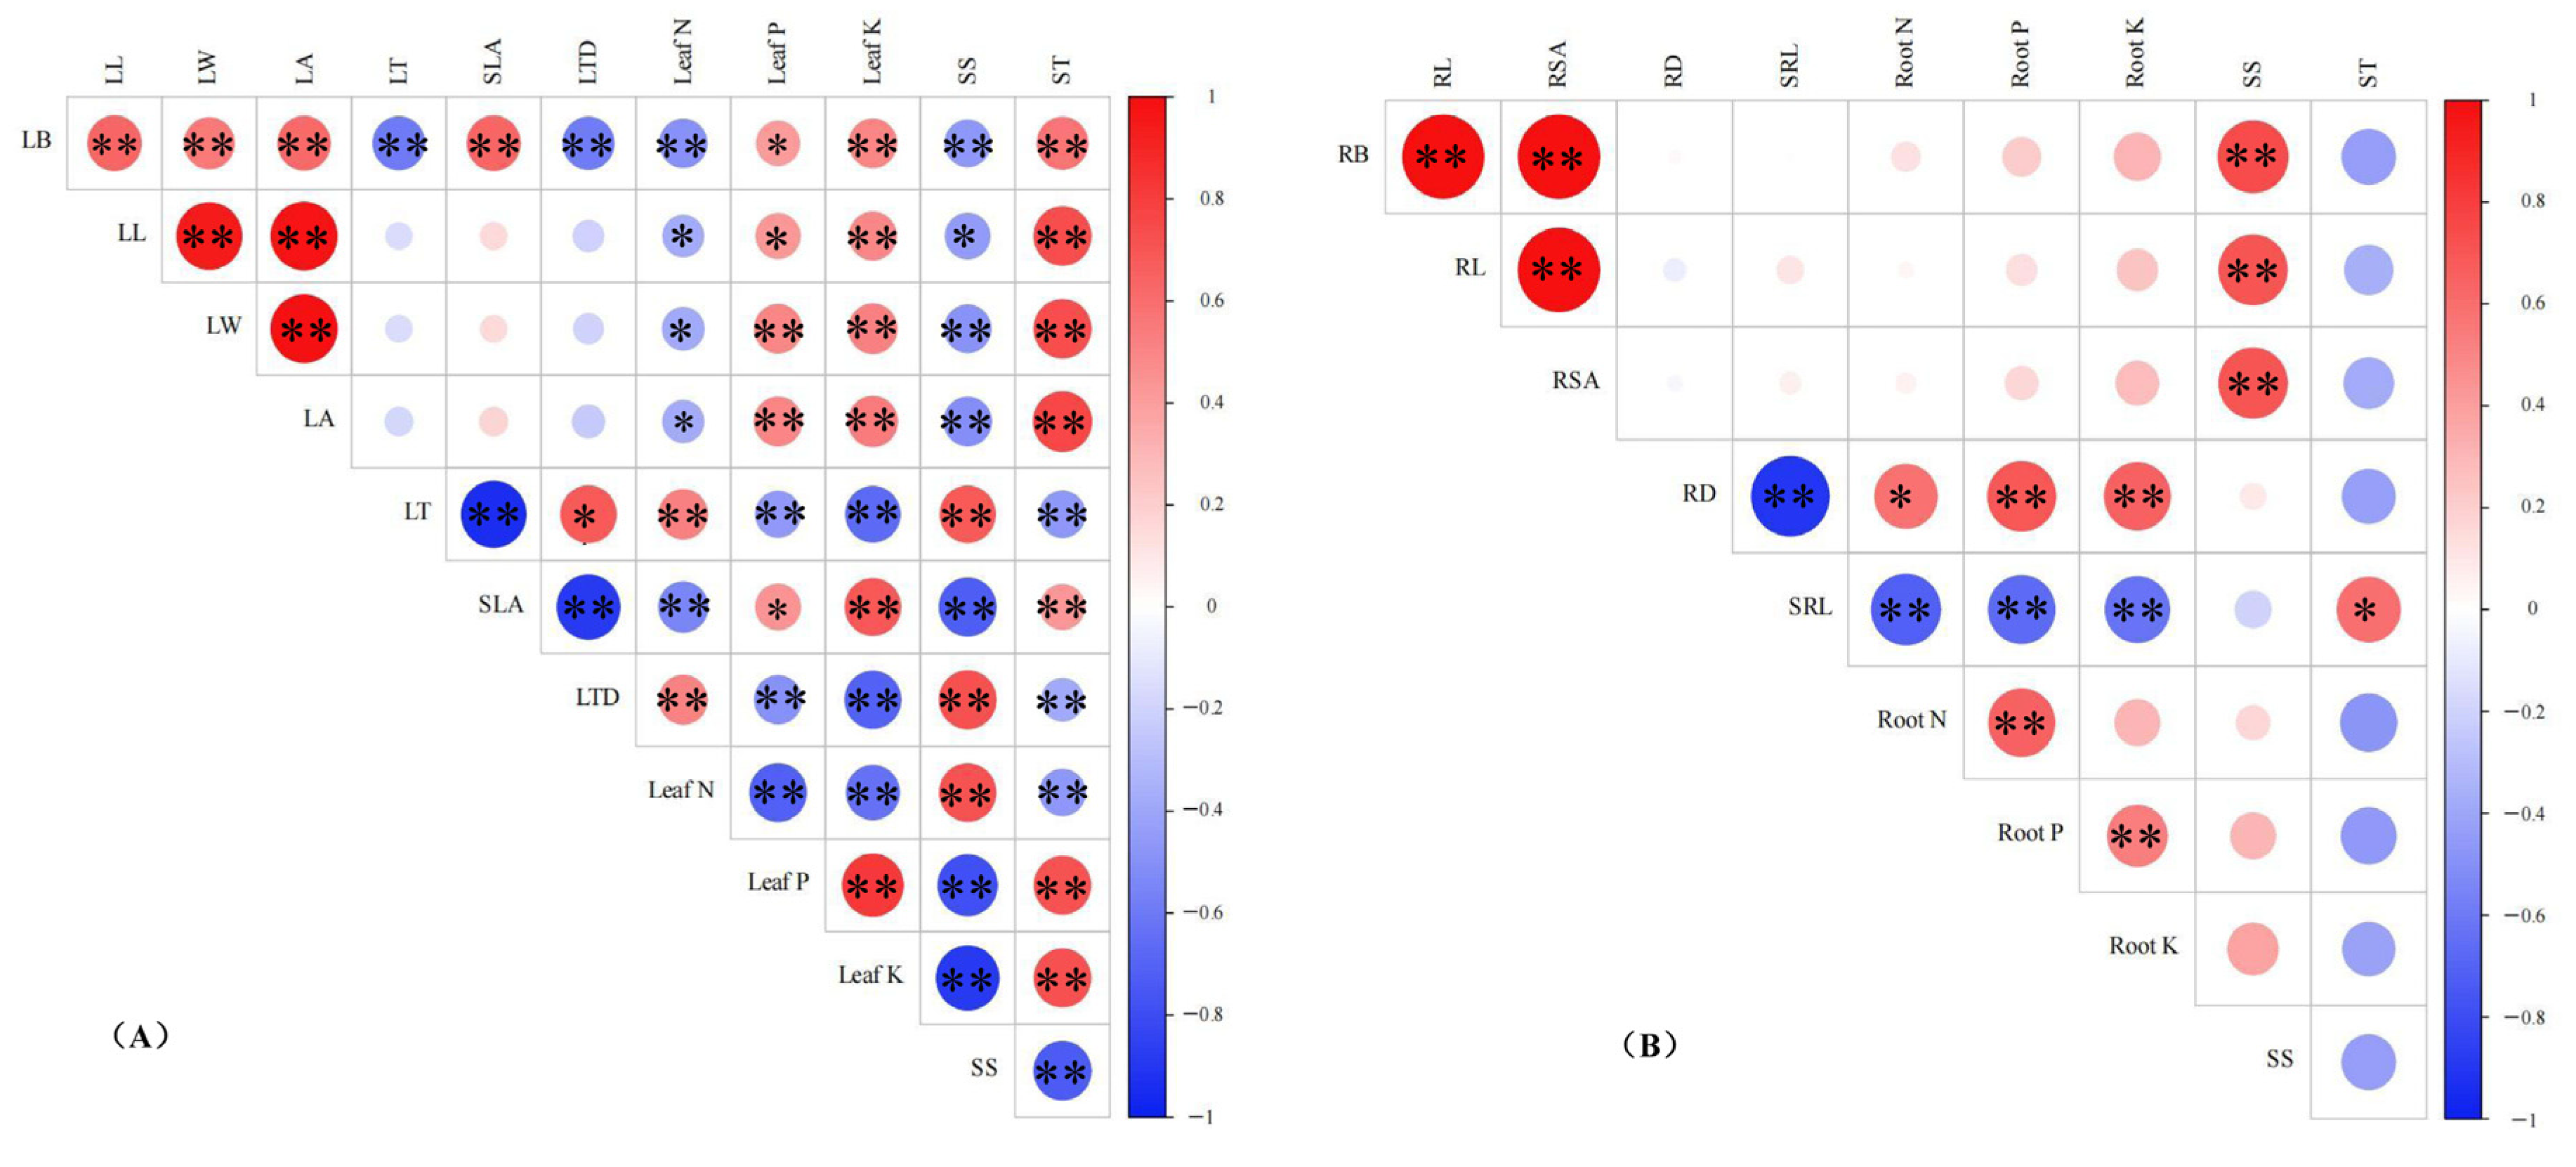
3.5. Correlation Analysis Among the Indicators Parameters

LB, LL, LW, LA, and SLA demonstrated a significant positive correlation (p < 0.05) with leaf K, leaf P, and leaf ST. Conversely, these variables exhibited a significant negative correlation with leaf SS and leaf N. In contrast, LT and LTD were significantly positively correlated (p < 0.01) with SS and leaf N, while showing a significant negative correlation (p < 0.01) with leaf K, leaf P, and leaf ST. Furthermore, RB, RL, and RSA were found to be positively correlated with root SS. RD presented a positive correlation with root P and root N. SRL showed a significant positive correlation with root ST, whereas it was negatively correlated with root N and root P (Figure 6).

4. Discussion

4.1. Responses of Biomass Allocation to Different Moso Bamboo Densities

The biomass allocation strategies of plants for adapting to different light conditions in the forest understory help plants better acquire resources in specific light environments, maintain growth, reproduction, and survival, and enhance their competitiveness and adaptability within the community [13,15,28]. Judging from the variation trend in biomass, the most suitable range of canopy density for the growth of I. latifolius is 0.3–0.35 (treatment T1). It is reasonable to speculate that the light condition without moso bamboo shading (CK) may have imposed a certain degree of strong light stress on the growth of I. latifolius, thereby inhibiting the carbon assimilation process of the leaves [29]. It has been found through research that the light saturation points of some bamboo species, including I. latifolius, fall within the range of 400 to 800 (µmol·m−2·s−1), and these bamboo species are inhibited by intense light when the light intensity reaches 1500 (µmol·m−2·s−1) [30]. This may be an important factor hindering the increase in the leaf yield of I. latifolius. When the light intensity is lower than the demand range of I. latifolius, the biomass accumulation of all organs of I. latifolius is significantly inhibited. Similar results have also been found in the shading studies of other plants, and the optimal shading rates vary among different plants. For example, the optimal shading rate for Lycium chinense is 35% [31]. Some studies have also found that the absence of shading is not the most favorable condition for a large number of plants. Instead, 50% shading can significantly promote the biomass accumulation of plants [32]. In this study, when comparing T1 with CK, the biomass growth rate of the underground parts (rhizomes 120.7% and roots 156.1%) was higher than that of the aboveground parts (old leaves 53.4%, new leaves 57.8%, and stems 82.2%). Moreover, the biomass of both new and old leaves under treatment T3 was significantly lower than that of the control, while the biomass of rhizomes and roots remained comparable to that of the control. As a result, the root/shoot ratio of I. latifolius increased under shading conditions. This indicates that under shading conditions, I. latifolius gives more priority to the growth of rhizomes and roots rather than the aboveground parts, which is consistent with the research findings of previous studies on shade-tolerant plants [33]. However, due to the differences in adaptability to low light, plants may also exhibit opposite results. For instance, when subjected to shading conditions, the height of Acacia tortilis shows an upward trend. Additionally, the root/shoot ratio decreases as A. tortilis allocates more resources preferentially to the growth of stems and leaves [34].

4.2. Responses of Leaf Functional Traits to Different Moso Bamboo Densities

Under dynamic light conditions, the leaf functional traits of plants often exhibit strong plasticity to achieve the purpose of self-protection and adaptation to the environment [35]. Moreover, the covariation among leaf morphological traits is an important mechanism for plants to adapt to environmental changes, enabling them to better cope with these changes [36]. The understory light intensity gradually decreases with the increasing density of moso bamboo. Under appropriate shading conditions, I. latifolius promotes leaf expansion by increasing LA, LL, and LW, thereby enhancing its ability to capture light energy in moderately low-light environments. Simultaneously, I. latifolius adapts to the shading conditions by increasing the LT and reducing the SLA. However, some studies have found opposite results, showing that plants tend to reduce the LT and increase the SLA under shading conditions, which is conducive to reducing the construction cost of leaves and improving the photosynthetic efficiency [37]. This difference may be related to the shade tolerance of plants and their growth cycles. For example, some studies have found that the responses of the leaf thickness of tree peonies to shading are opposite during the rapid seed growth period and the maturation period [38]. In addition, different from simple shading treatment, the increase in moso bamboo density will, to a certain extent, change the temperature and humidity in the forest, which may also cause changes in LT. Some studies have found that both temperature and relative humidity are positively correlated with leaf thickness and stomatal index [39]. The relatively thin leaves of I. latifolius under the condition of no shading (CK) may also be due to the strong light stress. Some studies have found that moderate shading can relieve the strong light stress caused by full sunlight on semi-sun plants and increase the leaf biomass, as well as promote the thickening of the leaves [40,41].

4.3. Responses of Root Morphology to Different Moso Bamboo Densities

In this study, appropriate shading promotes the growth of roots, which is similar to some previous studies [42]. However, most of the previous studies have found that shading inhibits the accumulation and extension of root biomass. This may be related to the carbon assimilation capabilities of different plants under different light intensities, as the inhibition of root growth in these studies is usually accompanied by a decrease in the photosynthetic product accumulation [43,44]. Compared with the treatment T1, the aboveground biomass under the T2 treatment decreased significantly, while the root growth was not significantly inhibited. This is in line with the characteristics of shade-tolerant plants; that is, under shading conditions, resources are preferentially allocated to the roots to maintain normal growth under light stress [43]. However, an excessively high density of the bamboo forest (treatment T3) intensifies the interspecific competition of roots, which will also significantly inhibit root growth. This may be due to the competition for root resources or the inhibition of root growth through root exudates [45]. A report has found that intercropping with apple trees significantly reduces the root length density of ryegrass [7]. Meanwhile, the closer the distance between species, the more intense the root competition, and the specific root length decreases significantly, which is similar to the results of this study. Although treatment T1 promotes root growth, it reduces the RLR of roots with a diameter of 0–0.2 mm, resulting in an increase in RD and a decrease in SRL. This indicates that although moderate shading is beneficial to the growth of I. latifolius, the roots of moso bamboo still inhibit the growth of the fine roots of I. latifolius.

4.4. Responses of Nutrient Elements and Photosynthate Allocation to Different Moso Bamboo Densities

In this study, the treatments of T1, T2, and T3 significantly increased the contents of P and K in various organs of I. latifolius but decreased the content of P in the old leaves. This may be because I. latifolius initiates the reabsorption process of P and K, redistributing the nutrient elements from the senescent leaves to new leaves, stems, rhizomes, and roots to adapt to the environment under the moso bamboo forest and improve the utilization efficiency of elements. Some studies have also found that shading has a greater impact on the contents and balance of P and K in leaves [46]. The elemental reabsorption mechanism of plants can alleviate elemental limitations under adverse conditions such as drought and shading [47]. In addition, under the moso bamboo forest, I. latifolius tends to allocate more N to its roots, so as to promote the growth and development of the roots and enhance their ability to absorb water and K. Relatively speaking, the ability of I. latifolius to reabsorb N is rather poor when it adapts to the environment under the forest. Therefore, it is advisable to appropriately supply N fertilizer to I. latifolius growing under the forest, so as to reduce the risk of N deficiency that may occur in its new leaves.
The environment under the moso bamboo forest increases the contents of SS and ST in the old leaves of I. latifolius but reduces the content of SS in the new leaves. This may be because, compared with old leaves, new leaves are incompletely developed and have insufficient ability to utilize light. Therefore, it is speculated that the low-light environment created by mild shading may have exerted a certain inhibitory effect on the photosynthesis of new leaves [48]. Moreover, the faster growth and carbon metabolism of new leaves lead to a quicker consumption of SS. The response strategies of the photosynthetic products allocation in the aboveground parts (new leaves and stems) and the underground parts (rhizomes and roots) to the environment in the moso bamboo forest are different. Overall, in the moso bamboo forest, I. latifolius tends to store more ST in the aboveground parts, while allocating or converting more SS in the rhizomes and roots to promote their growth and competition for resources. Some studies have shown that SS are transported to the roots through the phloem, which promotes root growth and thus gives the roots a greater competitive advantage in absorbing nutrients such as N [49].

5. Conclusions

I. latifolius adapts to the understory environment with different moso bamboo densities by regulating the strategies of morphological construction of leaves and roots, as well as the strategies of nutrient and photosynthetic product allocation. Firstly, I. latifolius adapts to the shaded environment under the bamboo forest by increasing the length, width, area, and thickness of its leaves. Then, it also strengthens its ability to compete with moso bamboo for resources and space by increasing the root length and root surface area. In addition, I. latifolius exhibits a strong ability to reabsorb phosphorus and potassium in the bamboo forest, which helps to alleviate the nutrient deficiency for the growth of new tissues. However, its ability to reabsorb nitrogen is relatively weak, so appropriate supplementation is necessary. In order to adapt to the environment in the moso bamboo forest, I. latifolius tends to use the aboveground parts as a carbon reservoir, accumulating more starch. At the same time, it allocates or converts more soluble sugars in the rhizomes and roots to promote their growth and competition for resources. Overall, it is feasible to plant I. latifolius in a moso bamboo forest with a low bamboo density. A low-density moso bamboo forest can effectively promote the growth of I. latifolius in the forest, which benefits from the morphological plasticity of the leaves and roots of I. latifolius, as well as its strategies for nutrient and photosynthetic product allocation. However, in a high-density moso bamboo forest, the dual pressures of aboveground shading and underground root competition increase, which will still significantly inhibit the growth of I. latifolius in the forest.

Author Contributions

Z.Y. and H.N., designed the experiments. Z.Y., J.Z. and H.N., performed the analysis. Z.Y. and H.N., drafted the manuscript. All the authors critically revised and approval the final version of this manuscript. All authors have read and agreed to the published version of the manuscript.

Funding

This study was supported by funding from the Forestry Science and Technology Project of the Cooperation between Zhejiang Province and the Academy (2022SY16), National Natural Science Foundation of China (32201645).

Data Availability Statement

The data presented in this study are available on request from the corresponding author.

Conflicts of Interest

The authors declare no conflicts of interest.

References

  1. Peng, Z.H.; Lu, Y.; Li, L.B.; Zhao, Q.; Feng, Q.; Gao, Z.M.; Lu, H.Y.; Hu, T.; Yao, N.; Liu, K.Y.; et al. The draft genome of the fast-growing non-timber forest species moso bamboo (Phyllostachys heterocycla). Nat. Genet. 2013, 45, 456–461. [Google Scholar] [CrossRef] [PubMed]
  2. Yin, J.Y.; Ge, Z.P.; Deng, X.; Shi, Y.J.; Xu, L.; Zhou, G.M.; Ye, Y.Z.; Zhang, F.G.; Zhou, Y.F.; Li, C.; et al. Abandonment lead to structural degradation and changes in carbon allocation patterns in Moso bamboo forests. For. Ecol. Manag. 2019, 449, 117449. [Google Scholar] [CrossRef]
  3. Yang, B.; Meng, X.; Singh, A.K.; Wang, P.; Song, L.; Zakari, S.; Liu, W. Intercrops improve surface water availability in rubber-based agroforestry systems. Agric. Ecosyst. Environ. 2020, 298, 106937. [Google Scholar] [CrossRef]
  4. Zhang, Y.L.; Zhao, J.C.; Yang, Z.Y.; Shi, R.; Li, Q.; Wang, Y.B.; He, L.; Chen, Y.J. Analysis of biochemical components and antioxidant capacity of Indocalamus leaves of different varieties. Sci. Technol. Food Ind. 2022, 43, 93–100. [Google Scholar]
  5. Yang, L.T.; Xie, Y.Y.; Zuo, K.Y.; Xu, S.; Gu, R.; Chen, S.L.; Guo, Z.W. Effects of ramet ratio on photosynthetic physiology of Indocalamus decorus clonal system under heterogeneous light environment. Chin. J. Plant Ecol. 2022, 46, 88–101. [Google Scholar]
  6. Dai, Y.S.; Yang, T.; Shen, L.; Wang, X.Y.; Zhang, W.L.; Liu, T.T.; Zhang, W. Root growth, distribution, and physiological characteristics of alfalfa in a poplar/alfalfa silvopastoral system compared to sole-cropping in Northwest Xinjiang. China Agrofor. Syst. 2021, 95, 1137–1153. [Google Scholar] [CrossRef]
  7. Wei, W.W.; Liu, T.T.; Shuai, Z.; Lei, S.; Wang, X.Y.; Li, L.H.; Zhu, Y.; Zhang, W. Root spatial distribution and belowground competition in an apple/ryegrass agroforestry system. Agric. Syst. 2024, 215, 103869. [Google Scholar] [CrossRef]
  8. Cui, R.; Qi, S.; Wu, B.C.; Zhang, D.; Zhang, L.; Zhou, P.; Ma, N.; Huang, X. The influence of stand structure on understory herbaceous plants species diversity of Platycladus orientalis plantations in Beijing, China. Forests 2022, 13, 1921. [Google Scholar] [CrossRef]
  9. Yan, N.; Xu, X.F.; Wang, Z.D.; Huang, J.Z.; Guo, D.P. Interactive effects of temperature and light intensity on photosynthesis and antioxidant enzyme activity in Zizania latifolia Turcz. plants. Photosynthetica 2013, 51, 127–138. [Google Scholar] [CrossRef]
  10. Grunwald, Y.; Yaaran, A.; Moshelion, M. Illuminating plant water dynamics: The role of light in leaf hydraulic regulation. New Phytol. 2024, 241, 1404. [Google Scholar] [CrossRef]
  11. Feng, L.Y.; Raza, M.A.; Li, Z.C.; Chen, Y.K.; Khalid, M.H.B.; Du, J.B.; Liu, W.G.; Wu, X.L.; Song, C.; Yu, L.; et al. The influence of light lntensity and leaf movement on photosynthesis characteristics and carbon balance of soybean. Front. Plant Sci. 2019, 9, 1952. [Google Scholar] [CrossRef] [PubMed]
  12. Wegener, F.; Beyschlag, W.; Werner, C. High intraspecific ability to adjust both carbon uptake and allocation under light and nutrient reduction in Halimium halimifolium L. Front. Plant Sci. 2015, 6, 609. [Google Scholar]
  13. Su, B.Y.; Song, Y.X.; Song, C.; Cui, L.; Yong, T.W.; Yang, W.Y. Growth and photosynthetic responses of soybean seedlings to maize shading in relay intercropping system in Southwest China. Photosynthetica 2014, 52, 332–340. [Google Scholar] [CrossRef]
  14. Gommers, C.M.M.; Visser, E.J.W.; Onge, K.R.S.; Voesenek, L.A.C.J.; Pierik, R. Shade tolerance: When growing tall is not an option. Trends Plant Sci. 2013, 18, 65–67. [Google Scholar] [CrossRef] [PubMed]
  15. Bahn, M.; Lattanzi, F.A.; Hasibeder, R.; Wild, B.; Koranda, M.; Danese, V.; Brüggemann, N.; Schmitt, M.; Siegwolf, R.; Richter, A. Responses of belowground carbon allocation dynamics to extended shading in mountain grassland. New Phytol. 2013, 198, 116–126. [Google Scholar] [CrossRef] [PubMed]
  16. Li, H.; Zhu, Y.; Wang, G.; Liu, R.; Huang, D.; Song, M.; Zhang, Y.; Wang, H.; Wang, Y.; Shao, R. Maize yield increased by matching canopy light and nitrogen distribution via controlled-release urea/urea adjustment. Field Crops Res. 2024, 308, 109284. [Google Scholar] [CrossRef]
  17. Xie, H.T.; Yu, M.K.; Cheng, X.R. Effects of light intensity variation on nitrogen and phosphorus contents, allocation and limitation in five shade-enduring plants. Chin. J. Plant Ecol. 2017, 41, 559–569. [Google Scholar]
  18. Tang, J.C.; Sun, B.; Cheng, R.M.; Shi, Z.M.; Luo, D.; Liu, S.R.; Centritto, M. The Effect of Low Irradiance on Leaf Nitrogen Allocation and Mesophyll Conductance to CO2 in Seedlings of Four Tree Species in Subtropical China. Plants 2021, 10, 2213. [Google Scholar] [CrossRef]
  19. Fu, X.; Wang, J.; Di, Y.; Wang, H.M. Differences in Fine-Root Biomass of Trees and Understory Vegetation among Stand Types in Subtropical Forests. PLoS ONE 2015, 10, e0128894. [Google Scholar] [CrossRef] [PubMed]
  20. Cardinael, R.; Mao, Z.; Prieto, I.; Stokes, A.; Dupraz, C.; Kim, J.H.; Jourdan, C. Competition with winter crops induces deeper rooting of walnut trees in a Mediterranean alley cropping agroforestry system. Plant Soil 2015, 391, 219–235. [Google Scholar] [CrossRef]
  21. Natalie, C.; Bever, J.D. Carbon allocation and competition maintain variation in plant root mutualisms. Ecol. Evol. 2018, 8, 5792–5800. [Google Scholar]
  22. Ma, J.M.; Liu, D.; Zhao, P.Y.; Dou, M.; Yang, X.H.; Liu, S.L.; Nian, F.Z.; Tong, W.J.; Li, J.Y.; Xu, Z.L.; et al. Intercropping of tobacco and maize at seedling stage promotes crop growth through manipulating rhizosphere microenvironment. Front. Plant Sci. 2024, 15, 1470229. [Google Scholar] [CrossRef] [PubMed]
  23. Xiong, X.; Zhuo, G.Y.; Zhang, D.Q.; Zhuo, G.Y. Soil organic carbon accumulation modes between pioneer and old-growth forest ecosystems. J. Appl. Ecol. 2020, 57, 2419–2428. [Google Scholar] [CrossRef]
  24. Zhao, J.C.; Cai, C.J. Physiological integration improves nitrogen use efficiency of moso bamboo: An isotopic (15N) assessment. For. Ecol. Manag. 2023, 542, 121073. [Google Scholar] [CrossRef]
  25. Zhuang, M.H.; Li, Y.C.; Chen, S.L. Advances in the researches of bamboo physiological integration and its ecological significance. J. Bamboo Res. 2011, 30, 5–9. [Google Scholar]
  26. Tong, R.; Zhou, B.Z.; Jiang, L.N.; Ge, X.G.; Cao, Y.H. The growth of Chinese fir is limited by nitrogen: Evidences from N:P ratio, N or P variability and NuRE based on a regional investigation. For. Ecol. Manag. 2020, 460, 117905. [Google Scholar] [CrossRef]
  27. Li, M.H.; Xiao, W.F.; Wang, S.G.; Cheng, G.W.; Cherubini, P.; Cai, X.H. Mobile carbohydrates in Himalayan treeline trees I. evidence for carbon gain limitation but not for growth limitation. Tree Physiol. 2008, 28, 1287–1296. [Google Scholar]
  28. Xie, H.T.; Yu, M.K.; Cheng, X.R. Leaf non-structural carbohydrate allocation and C:N:P stoichiometry in response to light acclimation in seedlings of two subtropical shade-tolerant tree species. Plant Physio. Bioc. 2018, 124, 146–154. [Google Scholar] [CrossRef]
  29. Zhang, M.; Ming, Y.; Wang, B.H.; Jin, H.L. Strategies for adaptation to high light in plants. Abiotech 2024, 5, 381–393. [Google Scholar] [PubMed]
  30. Jing, X.; Cai, C.J.; Fan, S.H.; Liu, G.L.; Li, X.J. Research advances in ecological adaptability of bamboo under environmental stresses. World For. Res. 2018, 31, 36–41. [Google Scholar]
  31. Zhang, Y.P.; Onda, Y.C.; Kato, H.; Feng, B.; Gomi, T. Understory biomass measurement in a dense plantation forest based on drone-SfM data by a manual low-flying drone under the canopy. J. Environ. Manag. 2022, 312, 114862. [Google Scholar] [CrossRef] [PubMed]
  32. Semchenko, M.; Lepik, M.; Götzenberger, L.; Zobel, K. Positive effect of shade on plant growth: Ameliorationof stress or active regulation of growth rate? J. Ecol. 2012, 100, 459–466. [Google Scholar] [CrossRef]
  33. Lu, X.; Huang, J.Y.; Wo, Y.; Yang, N.; Lin, Z.L.; Zhao, L.X.; Li, T.Q.; Gao, K. Effects of Shading on Biomass and Material Distribution Rule of Jerusalem artichoke. J. Inner Mongolia Univ. Natl. (Nat. Sci.) 2021, 3, 225–230. [Google Scholar]
  34. Smith, T.M.; Shackleton, S.E. The effects of shading on the establishment and growth of Acacia tortilis seedlings. S. Afr. J. Bot. 1988, 54, 375–379. [Google Scholar] [CrossRef]
  35. Yu, J.; Li, Q.; Wu, X.; Zhu, C.; Huang, S.; Yang, F.; Hou, X. Adaptational responses of leaf functional traits of Dicranopteris dichotoma to environmental factors in different vegetational restoration stages. Glob. Ecol. Conserv. 2023, 44, e02484. [Google Scholar] [CrossRef]
  36. Akram, M.A.; Zhang, Y.; Wang, X.; Shrestha, N.; Malik, K.; Khan, I.; Ma, W.; Sun, Y.; Li, F.; Ran, J.; et al. Phylogenetic independence in the variations in leaf functional traits among different plant life forms in an arid environment. J. Plant Physiol. 2022, 272, 153671. [Google Scholar] [CrossRef] [PubMed]
  37. Yang, M.; Liu, M.G.; Lu, J.Y.; Yang, H.M. Effects of shading on the growth and leaf photosynthetic characteristics of three forages in an apple orchard on the Loess Plateau of eastern Gansu, China. PeerJ 2019, 7, e7594. [Google Scholar] [CrossRef] [PubMed]
  38. Han, C.J.; Yu, M.; Wang, Q.; Wang, L.; Yang, H.P.; Zhao, Y.J.; Dong, H.Z. Leaf structure and seed histochemistry analyses provided structural insights into the improved yield and quality of tree peony seed under light shading conditions. Sci. Rep. 2020, 10, 4328. [Google Scholar] [CrossRef] [PubMed]
  39. Moura, B.B.; Alves, E.S. Climatic factors influence leaf structure and thereby affect the ozone sensitivity of Ipomoea nil ‘Scarlet O’Hara’. Environ. Pollut. 2014, 194, 11–16. [Google Scholar] [CrossRef]
  40. Sun, J.; Li, X.M.; Zhang, J. Preliminary Studies on the Influence of Light Intensity on Growth and Saponin Contents of DIoscorea zingiberensis. Acta Bot. Boreali Occident. Sin. 2011, 31, 536–542. [Google Scholar]
  41. Wang, W.Y.; Zhao, D.D.; Zhang, G.X.; Su, T.X. Comparison of anatomical structure and shade tolerance of three species of Ranunculaceae under shading. J. Southern Agric. 2024, 6, 1713–1723. [Google Scholar]
  42. Aguiar, A.C.; Robinson, S.A.; French, K. Friends with benefits: The effects of vegetative shading on plant survival in a green roof environment. PLoS ONE 2019, 14, e0225078. [Google Scholar] [CrossRef] [PubMed]
  43. Shang, S.J.; Wang, Y.J.; Wang, N.; Yang, J.L.; Xu, S.; He, X.Y.; Chen, W. Effects of light intensity on physiological and growth characteristics of paeonia suffruticosa var. papaveracea. Chin. J. Ecol. 2020, 39, 2963–2973. [Google Scholar]
  44. Liu, S.Q.; Liu, Y.Z.; Liu, S.Q.; Ma, Y.; Dai, M.M.; Liu, J.R.; Liu, C. Effects of Shade Stress on the Synthesis of Cellulose and Lignin in Maize Nodal Roots. J. Agron. Crop Sci. 2025, 211, e70015. [Google Scholar]
  45. Gaucher, C.; Gougeon, S.; Mauffette, Y.; Christian, M. Seasonal variation in biomass and carbohydrate partitioning of understory sugar maple (Acer saccharum) and yellow birch (Betula alleghaniensis) seedlings. Tree Physiol. 2005, 25, 93–100. [Google Scholar] [CrossRef] [PubMed]
  46. Chen, F.J.; Zhao, G.J.; Shen, Y.X.; Zhu, H.; Li, Z.J.; Tan, B.L. Shading and Water Addition Alleviate the Elemental Limitations of the Early Restoration Community in a Stressful Environment. Plants 2024, 13, 2626. [Google Scholar] [CrossRef]
  47. Nan, H.; Mao, Q.G.; Zhong, X.Z.; Sun, X.B.; Xu, Q.H.; Li, M.M.; Chen, H. Factors driving the positive resorption of aluminum and iron from old leaves. Plant Soil 2023, 488, 443–450. [Google Scholar]
  48. Wu, J.W.; Su, Y.; Wang, J.H.; He, Q.; Qiu, Q.; Ma, J.W.; Li, J.Y. Morphological and physiological acclimation of Catalpa bungei plantlets to different light conditions. Photosynthetica 2018, 56, 537–548. [Google Scholar] [CrossRef]
  49. Hu, S.L.; Liu, D.; Guo, B.; Li, H.Y.; Zhu, Q.D.; Zhang, Z.H. OsSTP1 mediates sucrose allocation to regulate rice responses to different nitrogen supply levels. Chin. J. Biotechnol. 2024, 40, 3500–3514. [Google Scholar]
Figure 1. Images of new leaves and old leaves of I. latifolius (A): new leaves; (B): old leaves.
Forests 16 00636 g001
Figure 2. Effect of different moso bamboo densities on the biomass allocation of I. latifolius. Note: a, b, c—different letters indicate significant differences among different treatments (p < 0.05). The values in the bar chart are the means and standard errors.
Forests 16 00636 g002
Figure 3. Effect of different moso bamboo densities on the leaf functional traits of I. latifolius. Note: a, b, c—different letters indicate significant differences among different treatments (p < 0.05). The values in the bar chart are the means and standard errors.
Forests 16 00636 g003
Figure 4. Effect of different moso bamboo densities on the root morphology of I. latifolius. Note: a, b, c—different letters indicate significant differences among different treatments (p < 0.05). The values in the bar chart are the means and standard errors.
Forests 16 00636 g004
Figure 5. Effect of different moso bamboo densities on the root length and root length ratio of roots with different diameter grade of I. latifolius. Note: a, b, c—different letters indicate significant differences among different treatments (p < 0.05). The values in the bar chart are the means and standard errors.
Forests 16 00636 g005
Figure 6. The relationships among the functional traits of leaves and roots, nutrient elements, and non-structural carbohydrates. Note: red and blue indicate positive and negative correlations, respectively. (A): leaves, df = 30, |r| > 0.349 is p < 0.05, |r| > 0.449 is p < 0.01; (B): roots, df = 14, |r| > 0.497 is p < 0.05, |r| > 0.623 is p < 0.01. **: Correlation is significant at the 0.01 level (p < 0.01). *: Correlation is significant at the 0.05 level (p < 0.05).
Forests 16 00636 g006
Table 1. The basic information of the sample plots under different treatments.
TreatmentsBamboo Density
(Plants·ha−1)
The Proportion of Bamboo
at Different Ages
Canopy Density
CK00
T110501:1:10.30~0.35
T221001:1:10.55~0.60
T331501:1:10.75~0.80
Table 2. Abbreviations of all indicators.
AbbreviationsFull Form
RLRoot length
RSARoot surface area
RDRoot average diameter
RLRRoot length ratio
rlRoot length of each diameter grade
SRLSpecific root length
LLLeaf length
LWLeaf width
LTLeaf thickness
LALeaf area
SLASpecific leaf area
LDMLeaf dry mass
LTDLeaf tissue density
NNitrogen
PPhosphorus
KPotassium
NSCsNon-structural carbohydrates
SSSoluble sugar
STStarch
Table 3. Effect of different moso bamboo densities on the nutrient element allocation of I. latifolius.
Nutrient Element ContentsTreatmentsOld LeavesNew LeavesStemsRhizomesRoots
Nitrogen
(mg·g−1)
CK17.08 ± 0.33 b16.97 ± 0.47 a6.35 ± 0.19 a4.33 ± 0.09 a6.21 ± 0.09 c
T118.35 ± 0.39 a15.90 ± 0.68 b5.56 ± 0.32 b4.14 ± 0.07 b6.52 ± 0.17 b
T217.53 ± 0.47 b16.13 ± 0.69 ab5.94 ± 0.17 b4.04 ± 0.14 b6.75 ± 0.16 a
T317.35 ± 0.33 b17.05 ± 0.40 a5.92 ± 0.17 b4.10 ± 0.11 b6.86 ± 0.29 a
Phosphorus
(mg·g−1)
CK1.59 ± 0.05 a1.49 ± 0.15 c1.40 ± 0.04 c0.93 ± 0.08 b0.88 ± 0.04 b
T11.39 ± 0.02 b1.73 ± 0.04 b1.52 ± 0.07 b1.26 ± 0.11 a1.02 ± 0.08 a
T21.42 ± 0.03 b1.92 ± 0.08 a1.54 ± 0.04 b1.21 ± 0.03 a1.07 ± 0.08 a
T31.45 ± 0.04 b1.75 ± 0.08 b1.68 ± 0.05 a1.12 ± 0.09 a1.10 ± 0.06 a
Potassium
(mg·g−1)
CK7.25 ± 0.41 a7.58 ± 0.52 b6.63 ± 0.50 b5.35 ± 0.13 b6.41 ± 0.12 b
T16.31 ± 0.32 b8.39 ± 0.24 a7.62 ± 0.34 a6.11 ± 0.33 a7.28 ± 0.55 a
T26.21 ± 0.22 b9.09 ± 0.45 a7.56 ± 0.41 a6.18 ± 0.59 a7.26 ± 0.51 a
T36.33 ± 0.28 b8.76 ± 0.75 a7.46 ± 0.35 a6.01 ± 0.30 a7.15 ± 0.35 a
Note: a, b, c—different letters indicate significant differences among different treatments (p < 0.05). The values are the means and standard errors.
Table 4. Effect of different moso bamboo densities on the non-structural carbohydrate allocation of I. latifolius.
Non-Structural Carbohydrates ContentsTreatmentsOld LeavesNew LeavesStemsRhizomesRoots
soluble sugar
(mg·g−1)
CK21.10 ± 2.49 b16.44 ± 0.38 a51.91 ± 4.31 a61.93 ± 0.96 b20.97 ± 1.29 b
T125.82 ± 1.19 a13.93 ± 0.88 b39.21 ± 2.16 c66.97 ± 2.63 a25.06 ± 1.88 a
T223.04 ± 1.55 b13.10 ± 1.13 b43.50 ± 1.91 b64.82 ± 2.24 ab23.08 ± 2.22 ab
T323.47 ± 0.65 ab10.68 ± 1.05 c45.11 ± 2.00 b60.05 ± 2.46 b21.33 ± 1.11 b
Starch
(mg·g−1)
CK207.85 ± 4.02 b224.95 ± 6.25 b241.63 ± 7.08 a330.86 ± 10.72 a222.42 ± 10.60 a
T1220.77 ± 7.88 a240.37 ± 4.62 a221.54 ± 5.59 b320.30 ± 10.47 ab202.73 ± 6.83 b
T2220.22 ± 5.30 a246.81 ± 4.22 a242.90 ± 6.56 a305.22 ± 7.03 b210.67 ± 5.63 ab
T3218.82 ± 7.43 a241.4 ± 5.19 a240.11 ± 4.29 a281.91 ± 11.49 c209.77 ± 7.83 ab
Sugar/starchCK0.101 ± 0.010 b0.073 ± 0.001 a0.215 ± 0.012 a0.187 ± 0.008 b0.094 ± 0.007 b
T10.117 ± 0.004 a0.058 ± 0.004 b0.177 ± 0.009 b0.209 ± 0.005 a0.124 ± 0.012 a
T20.105 ± 0.007 ab0.053 ± 0.005 b0.179 ± 0.009 b0.212 ± 0.009 a0.109 ± 0.009 ab
T30.107 ± 0.005 ab0.044 ± 0.004 c0.188 ± 0.007 b0.213 ± 0.011 a0.102 ± 0.008 ab
Note: a, b, c—different letters indicate significant differences among different treatments (p < 0.05). The values are the means and standard errors.
Disclaimer/Publisher’s Note: The statements, opinions and data contained in all publications are solely those of the individual author(s) and contributor(s) and not of MDPI and/or the editor(s). MDPI and/or the editor(s) disclaim responsibility for any injury to people or property resulting from any ideas, methods, instructions or products referred to in the content.

