Article

MFCPopulus: A Point Cloud Completion Network Based on Multi-Feature Fusion for the 3D Reconstruction of Individual Populus Tomentosa in Planted Forests

1
School of Information Science and Technology, Beijing Forestry University, Beijing 100083, China
2
Engineering Research Center for Forestry-Oriented Intelligent Information Processing, National Forestry and Grassland Administration, Beijing 100083, China
3
Ministry of Education Key Laboratory of Silviculture and Conservation, Beijing Forestry University, Beijing 100083, China
4
School of Landscape Architecture, Beijing Forestry University, Beijing 100083, China
5
School of Technology, Beijing Forestry University, Beijing 100083, China
6
New Zealand School of Forestry, University of Canterbury, Private Bag 4800, Christchurch 8140, New Zealand
7
State Key Laboratory of Multimodal Artificial Intelligence Systems, Institute of Automation, Chinese Academy of Sciences, Beijing 100190, China
8
School of Artificial Intelligence, University of Chinese Academy of Sciences, Beijing 100049, China
*
Author to whom correspondence should be addressed.
Forests 2025, 16(4), 635; https://doi.org/10.3390/f16040635
Submission received: 22 January 2025 / Revised: 31 March 2025 / Accepted: 2 April 2025 / Published: 5 April 2025
(This article belongs to the Section Forest Inventory, Modeling and Remote Sensing)

Abstract

:
The accurate point cloud completion of individual tree crowns is critical for quantifying crown complexity and advancing precision forestry, yet it remains challenging in dense plantations due to canopy occlusion and LiDAR limitations. In this study, we extended the scope of conventional point cloud completion techniques to artificial planted forests by introducing a novel approach called Multi−feature Fusion Completion of Populus (MFCPopulus). Specifically designed for Populus Tomentosa plantations with uniform spacing, this method utilized a dataset of 1050 manually segmented trees with expert−validated trunk−canopy separation. Key innovations include the following: (1) a hierarchical adversarial framework that integrates multi−scale feature extraction (via Farthest Point Sampling at varying rates) and biologically informed normalization to address trunk−canopy density disparities; (2) a structural characteristics split−collocation (SCS−SCC) strategy that prioritizes crown reconstruction through adaptive sampling ratios, achieving a 94.5% canopy coverage in outputs; (3) a cross−layer feature integration enabling the simultaneous recovery of global contours and a fine−grained branch topology. Compared to state−of−the−art methods, MFCPopulus reduced the Chamfer distance variance by 23% and structural complexity discrepancies (ΔDb) by 33% (mean, 0.12), while preserving species−specific morphological patterns. Octree analysis demonstrated an 89−94% spatial alignment with ground truth across height ratios (HR = 1.25−5.0). Although initially developed for artificial planted forests, the framework generalizes well to diverse species, accurately reconstructing 3D crown structures for both broadleaf (Fagus sylvatica, Acer campestre) and coniferous species (Pinus sylvestris) across public datasets, providing a precise and generalizable solution for cross−species trees’ phenotypic studies.

1. Introduction

The process of enhancing forest carbon stocks requires high−quality phenological observations and three−dimensional (3D) modeling of planted forests [1,2,3]. Point clouds serve as a significant geometric data structure with diverse applications in woodland data collection [4,5,6]. The realistic reconstruction of cultivated trees in 3D has various applications, including the remote sensing of forest landscapes [7,8,9], ecosystem modeling [10,11,12], and the estimation of carbon stock [13,14,15]. With the continuous advancements in computer vision technology, plant phenology observation is transitioning from direct methods to assisted approaches such as deep learning. Analyzing tree canopy structures enables a more accurate assessment of the growth status of planted forests, leading to improved cultivation strategies. In the modeling of artificial forests, point clouds are widely utilized due to their compact data size and detailed representation. Typically obtained using multi−ocular laser scanners or laser drones that emit and receive laser beams for depth data collection, these datasets undergo filtering, alignment, and stitching processes followed by parameter extraction and feature analysis.
However, the intricate topography and dense tree growth in natural environments often result in intertwined canopies that mutually shade each other (Figure 1a). The overlapping tree canopies in plantation forests present challenges for directly obtaining individual tree point clouds. Manual separation from large point cloud datasets is labor−intensive and compromises realism as well as the subsequent study accuracy. Following initial segmentation, instances of under−segmentation (Figure 1b) and over−segmentation (Figure 1c) may occur. Under−segmentation makes it arduous to distinguish between multiple tree canopies, while over−segmentation leads to truncated original canopies and omissions. Furthermore, existing point cloud segmentation algorithms explored by previous researchers and traditional graphics applications become inadequate when applied to actual plantation forest environments due to the limited scanning capability of UAV LiDAR systems. Typically, three columns of Populus Tomentosa are acquired as point cloud information with significantly truncated tree point clouds at the periphery of the scanning results (Figure 1d,e), rendering two−thirds of the scanning results unsuitable for point cloud segmentation purposes. Consequently, the effectiveness of point cloud segmentation algorithms diminishes greatly within plantation forests. These limitations necessitate a reassessment of 3D reconstruction while concurrently exploring the potential of deep learning in the domain of point cloud generation.
Existing point cloud completion networks often face challenges in handling the disparate densities between trunk and canopy point clouds when applied to trees, resulting in an overabundance of trunk points and sparsity in the canopy. To address this issue, it is imperative to extensively modify the approach to generating feature vectors, enhancing their informational content to achieve more intricate and accurate outcomes. By leveraging well−known structural features such as tree height and trunk bifurcation, obscured or unclear structures like the crown can be inferred, enabling a more comprehensive and precise reconstruction of individual tree point clouds.
To address the prevailing challenges in this field, we formulated the following research hypotheses:
  • Multi−scale feature fusion combining canopy and trunk structural priors can reduce reconstruction variance by over 20% compared to uniform approaches.
  • Hierarchical adversarial learning enables the precise recovery of occluded crown structures, reducing complexity discrepancy by >30%.
  • Biologically informed normalization preserves species−specific morphological patterns while optimizing computational efficiency.
Building on these hypotheses, we propose Multi−feature Fusion Completion of Populus (MFCPopulus), which integrates hierarchical feature extraction and adversarial learning for robust point cloud reconstruction. The proposed network leverages multi−sampling rate strategies to balance trunk and canopy density discrepancies while preserving biological structural characteristics.

2. Related Work

3D Reconstruction of Trees

The 3D reconstruction of tree phenotypes heavily relies on laser scanning and subsequent data processing [16], which can be broadly categorized into two domains. In terms of conventional computer graphics algorithms, researchers employ digital images and remote sensing tools to model forest canopy spectra [17]. Additionally, they utilize algorithms such as minimum spanning trees [18] to refine tree skeletons from point clouds. Forest point cloud data can be segmented using optimized segmentation techniques to obtain individual tree point clouds [19]. Light detection and ranging (LiDAR) enhanced the estimated percentage of accuracy for all tree metrics [20]. Shifting the focus from individual trees to large−scale plantation forests, some studies integrated LiDAR data collected along linear and loop paths, utilizing software for segmentation and parameter extraction [21]. A method based on the local features of point clouds was proposed for reconstructing incomplete laser point clouds of trees [22]. This approach involves extracting key points from the tree skeleton. In deep learning applications, current models primarily concentrate on objects with evident continuity and symmetry. However, there is a dearth of research on point cloud completion methods specifically tailored for objects with distinct individual morphological features like trees. While certain studies have demonstrated the completion of individual tree point clouds based on contour features, there exists a research gap when dealing with inputs lacking contour information, focusing instead on filling in the internal point cloud within the tree contour [23]. In the domain of 3D tree modeling, Yang et al. [24] successfully achieved the reconstruction of small saplings using devices such as the Kinect camera; however, when it comes to larger trees like poplars, their 3D reconstruction still poses a significant challenge. Wang et al. [25] devised an algorithm for generating novel variants of 3D tree models based on existing ones, while Tang et al. [26] introduced TreeNet3D, an innovative fully automated method for synthesizing structured 3D artificial tree models. Deep learning has exhibited promising potential in processing UAV LiDAR scanning data. [8] For instance, Lin et al. [27] proposed the feature pyramid network (FPN), which leverages a hierarchical pyramid structure to construct multi−scale feature pyramids with robust semantic representation and has demonstrated successful applications in tasks such as object detection and instance segmentation.
Point cloud completion aims to generate a comprehensive model from incomplete point clouds [28,29]. The neural network architecture PointNet [30] directly processes point cloud data by employing the max−pooling method to learn spatial encoding for each point and generating global features of the entire point cloud. Although effective for classification tasks, PointNet had limitations in extracting local features, which restricted its generalization ability in complex scenes. To address this limitation, PointNet++ [31] was proposed to learn local features at different contextual scales through the recursive application of PointNet. Additionally, L−GAN [32] introduced a codec framework while FoldingNet [33] presented a novel encoder structure that mapped 2D graphics to 3D point clouds effectively for reconstruction and feature extraction purposes. The Point Completion Network (PCN) [34], combining the strengths of L−GAN and Folding Net, operated directly on the original point cloud without making any structural assumptions. Moreover, RL−GAN−Net [35] enabled the efficient and reliable control of generative adversarial networks using Reinforcement Learning (RL) agents. PF−Net [36] employed a fractal design concept to generate diverse feature vectors, thereby enhancing the accuracy of point cloud completion and focusing on detail attention, especially when dealing with limited training data. The aforementioned methods primarily emphasized capturing general features that were common across a class of point clouds rather than specific local details of individual objects. The transformer structure originated in the field of natural language processing [37], but it has recently been introduced into point cloud processing tasks due to its capability to extract correlated features between points. SeedFormer [38] introduced an upsample transformer, extending the transformer architecture to core point generation operations and effectively capturing spatial and semantic relationships between neighboring points. SVDFormer [39] incorporated a refinement module named self−structure dual−generator, which leverages learned shape priors and geometric self−similarities to generate new points. PointAttN [40] proposed Geometric Details Perception (GDP) and Self−Feature Augmentation (SFA), establishing structural relationships among points directly and efficiently through an attention mechanisms. These methods, all aimed at advancing 3D reconstruction techniques, have provided valuable insights and serve as essential references for designing deep learning networks focused on point cloud reconstruction.

3. Materials and Methods
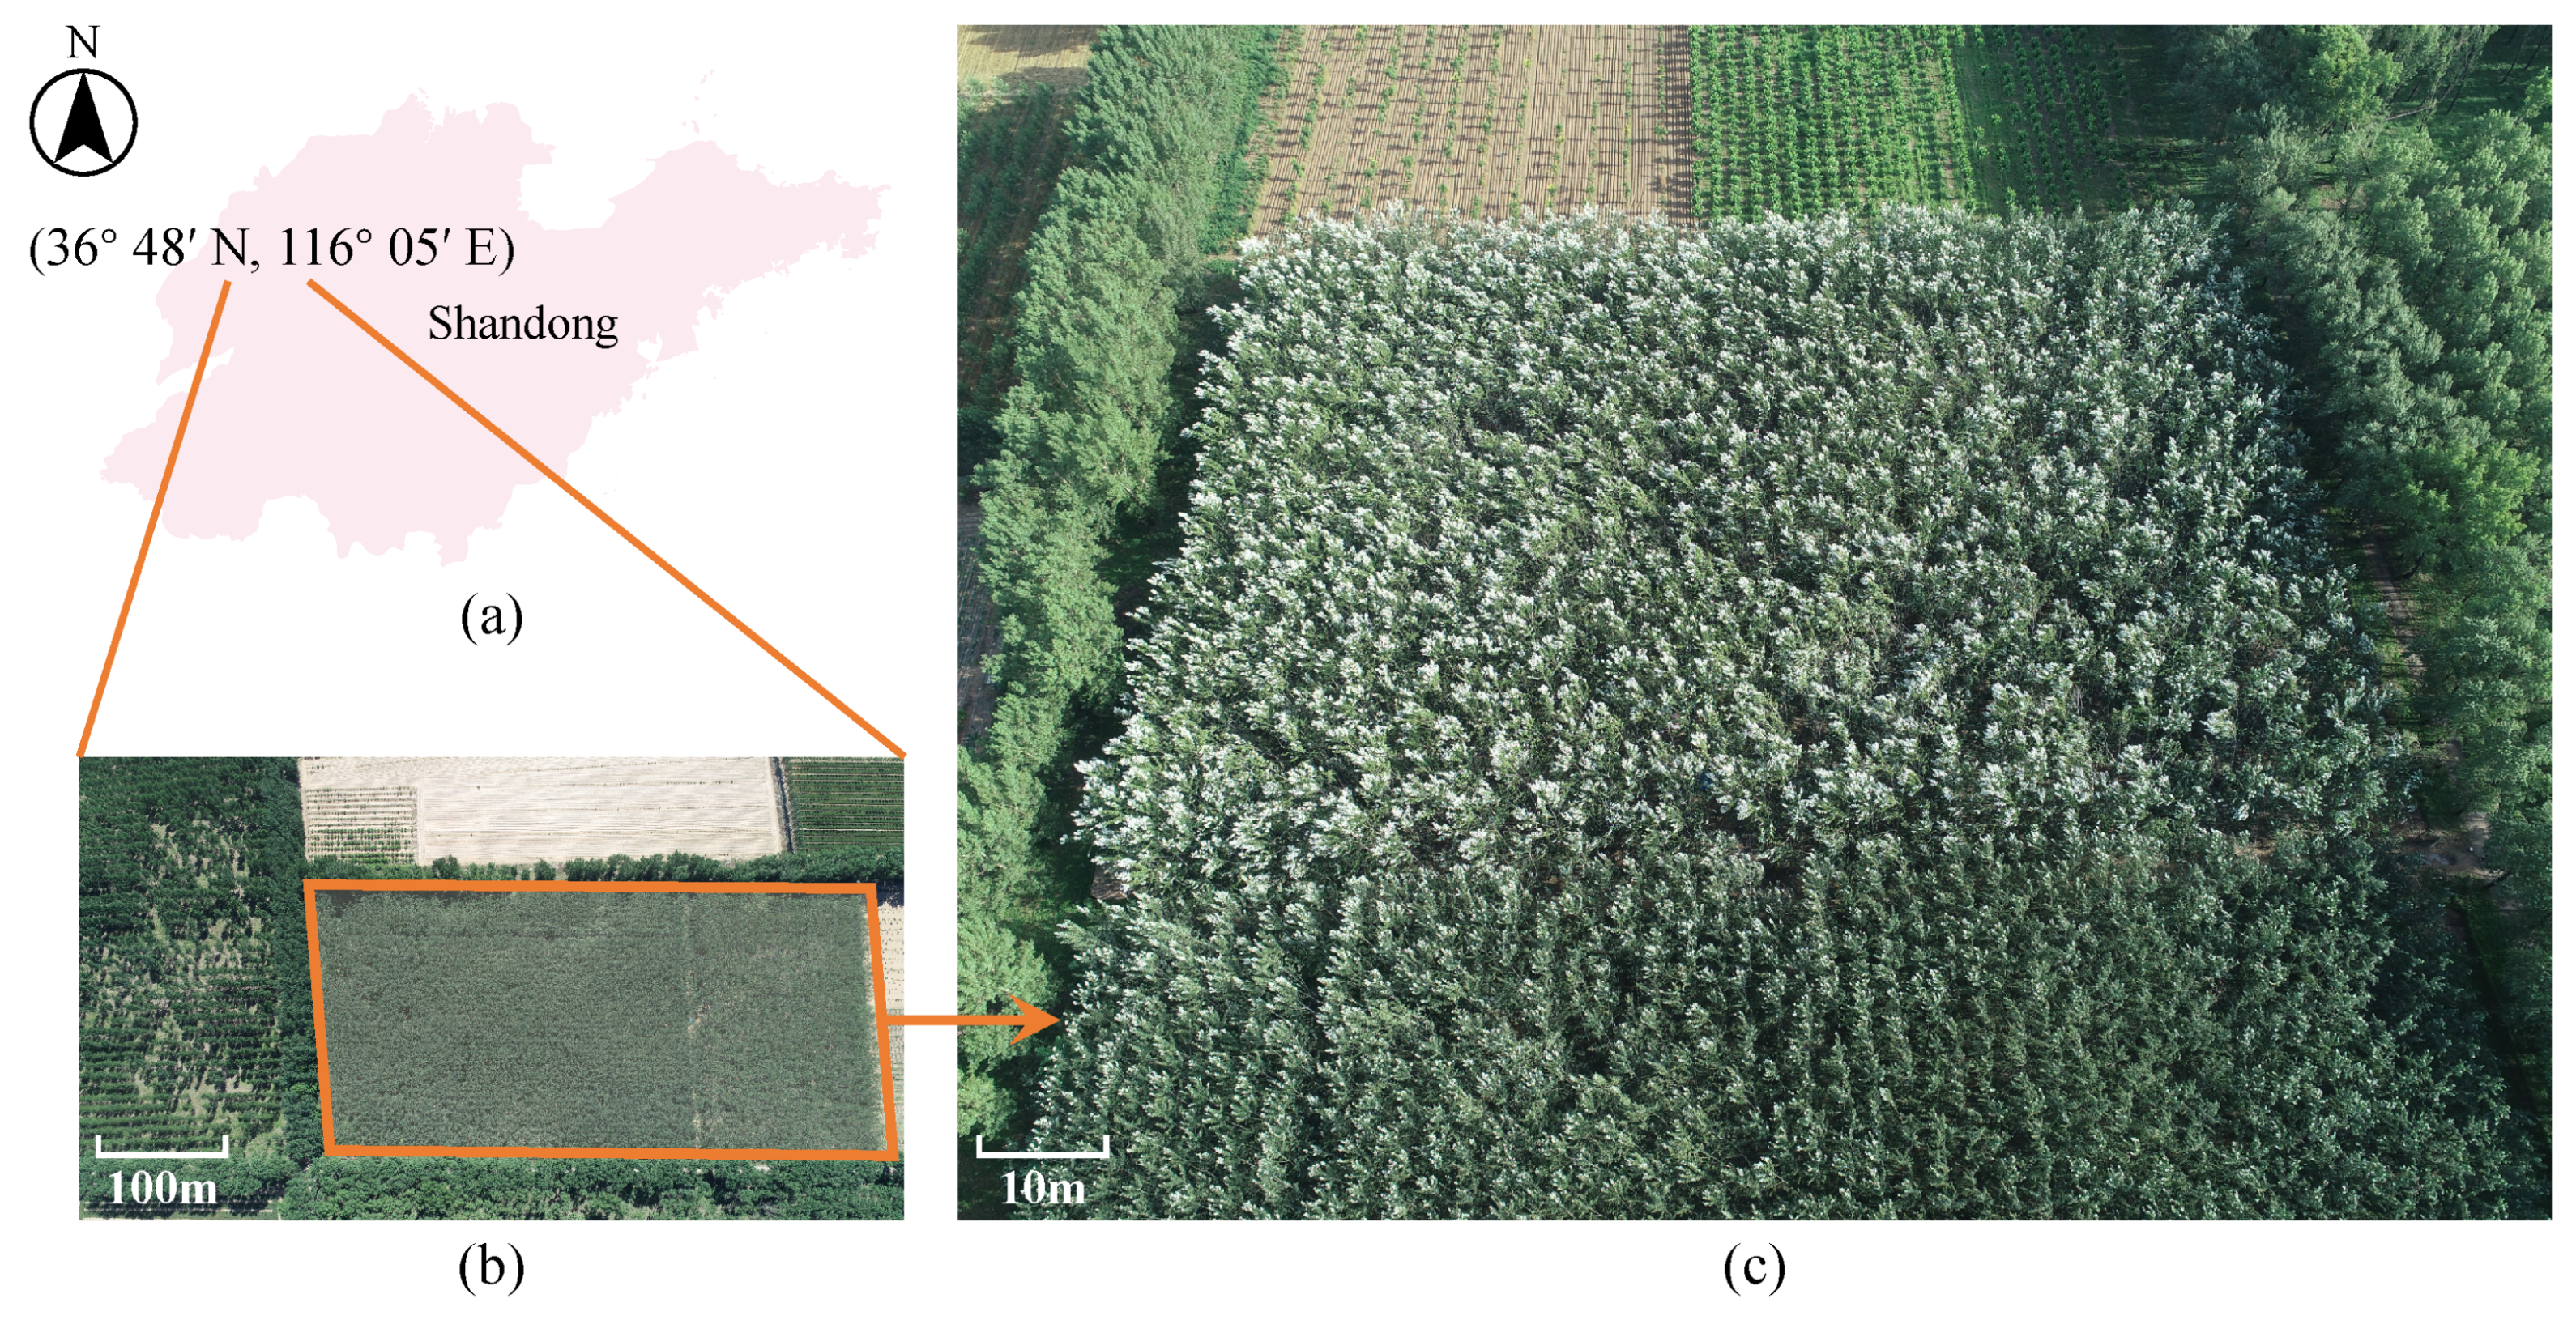
3.1. Study Area

The experimental study site (Figure 2) was situated in the artificial Populus Tomentosa plantation of Qingping State−owned Forest Farm, Gaotang County, Shandong Province, China (36°48′ N, 116°05′ E). These plantations feature uniform row spacing (4–6 m) and tree heights (15−20 m), typical of managed planted forests in northern China. The average annual evapotranspiration is 1880 mm, with an average annual temperature of 13.2 °C and an average annual rainfall of 563 mm (1981−2010), primarily concentrated in July and August. The annual sunshine hours and frost−free period are recorded as 2651.9 h and 204 days per year, respectively. Soil texture determination using the pipette method revealed that the soil horizon within the depth range of 0−140 cm at the test site exhibited sandy loam characteristics, while alternations between calcareous loam and calcareous soil were observed within the soil horizon ranging from 140 to 600 cm [41].

3.2. Dataset

The research data were collected from Chinese white poplar (Populus tomentosa) plantations, renowned for their significance as timber and protective trees in northern China. The study focused on the triploid woolly poplar asexual line B301 [(P. tomentosa × P. bolleana) × P. tomentosa], which is a fast−growing species. These plantation forests typically consist of poplar trees with a row spacing ranging from 4 to 6 m, planted at intervals of 2 m, and reaching heights predominantly between 15 and 20 m. Management practices implemented in these forests include standard measures such as irrigation, fertilization, and insect control.

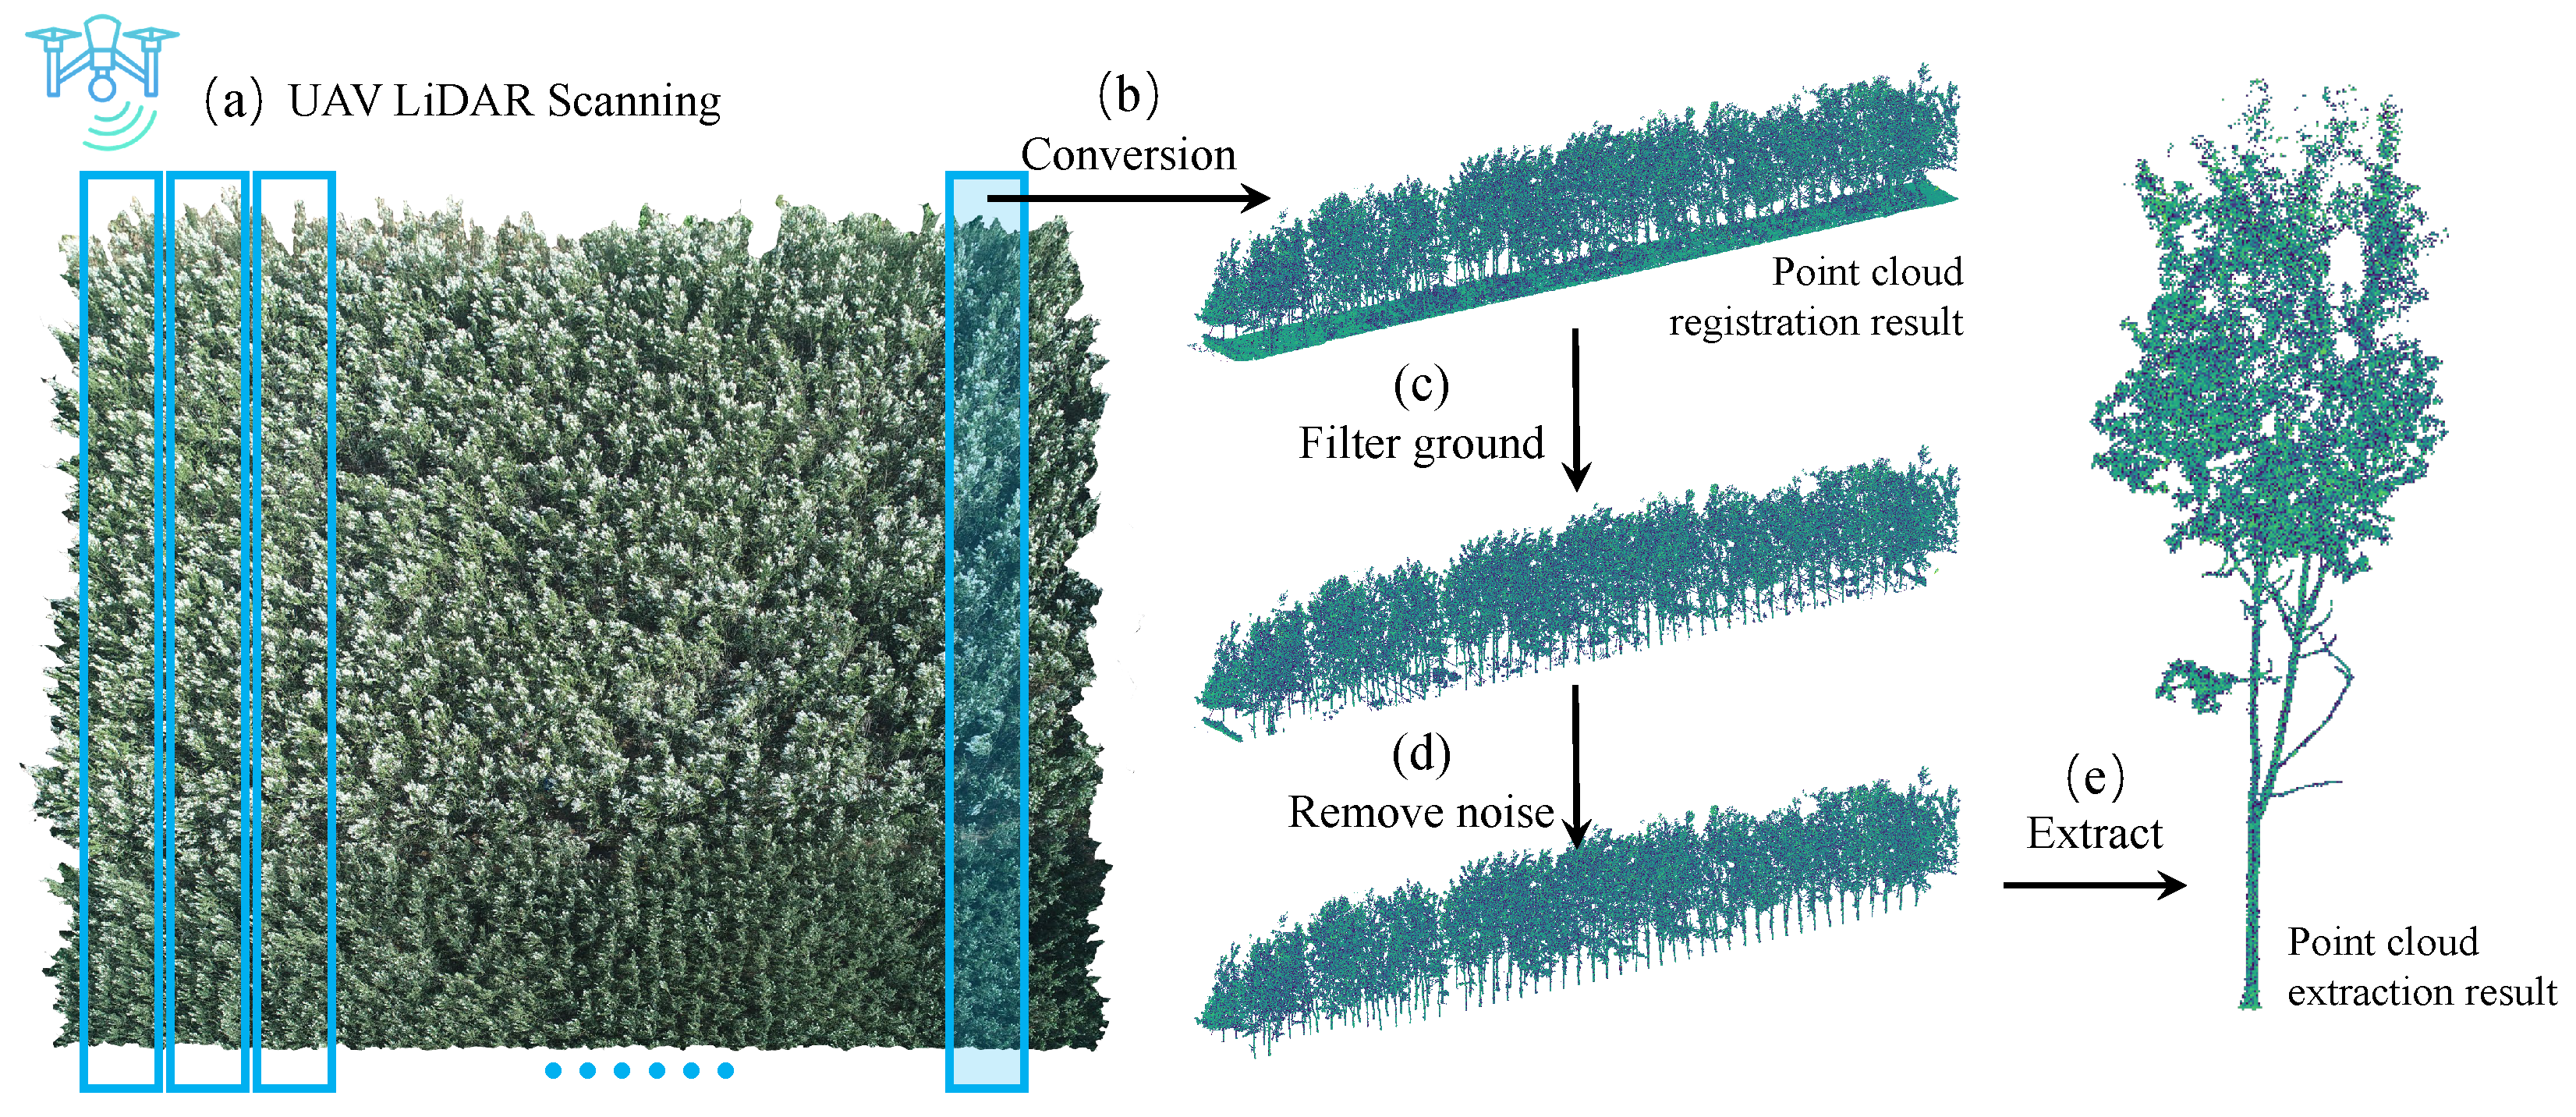
3.2.1. UAV Platform and Data Acquisition

The UAV−LiDAR system is composed based on the DJI Matrice 300 RTK platform. Flights were conducted at an altitude of 80 m with a 70% lateral overlap and 80% forward overlap, achieving a point density of 800 pts/m². The UAV maintained a cruising speed of 5 m/s under wind speeds below 6 m/s. Real−time kinematic (RTK) GNSS corrections ensured a centimeter−level positioning accuracy.
The raw LiDAR data were pre−processed to calibrate intensity values and remove systematic noise; the software aspect involves a point cloud alignment algorithm that utilizes the Point Cloud Library (PCL v1.12.1) [42] and OpenCV (v4.5.5) [43]. Point clouds were georeferenced using PPK (Post−Processed Kinematic) corrections, integrating UAV GNSS data with ground control points (GCPs) measured by a GNSS receiver (horizontal accuracy: 8 mm + 1 ppm). Ground filtering employed a cloth simulation filter (CSF) with a resolution of 0.2 m, while noise removal used statistical outlier removal (SOR) with a threshold of 1.5 standard deviations. Manual validation was performed for <5% of samples where overlapping foliage caused false positives (e.g., misclassifying thin branches as noise).
The point cloud alignment utilized the Iterative Closest Point (ICP) [44] algorithm in CloudCompare (v2.13), with a maximum iteration limit of 100 and a distance threshold of 0.1 m. Post alignment, individual tree point clouds were extracted, employing a region−growing segmentation algorithm with a curvature threshold of 0.25. Manual corrections were performed by forestry experts to resolve under−/over−segmentation cases.
Subsequently, a progressive pairwise matching of point clouds was performed utilizing algorithms such as the Iterative Closest Point (ICP). The primary objective was to ascertain the closest points in each pair of point clouds, thereby minimizing alignment errors through the determination of rotation and translation transformation matrices for corresponding points. This iterative procedure persisted until optimal alignment was achieved.
For instance, the LiDAR system simultaneously scans three rows of trees, typically comprising 30−50 trees per row (Figure 3). Subsequently, a point cloud is generated for plantation forests, often exceeding one million points. To facilitate the accurate identification of individual trees from the point cloud, ground filtering and noise removal procedures were performed while preserving the integrity of the tree trunks.
Upon careful examination of the results obtained from point cloud alignment, it becomes evident that the point cloud may exhibit characteristics suggesting its association with different trees. This phenomenon can be attributed to various factors such as occlusion caused by inter−canopy foliage, limitations in visual angles, or operational errors. The impact of these factors becomes particularly pronounced when there is canopy overlap (Figure 1b) or when trees have missing canopies due to over−segmentation (Figure 1c). The initial visualization outcomes of the processed data are illustrated through the point cloud extraction depicted in Figure 3.

3.2.2. Dataset Construction

The dataset plays a fundamental role in the training process of generative adversarial networks. Our dataset comprised 1050 manually segmented Populus Tomentosa trees, curated under expert supervision to ensure precise trunk−canopy separation. This sample size aligns with recent studies on deep learning−based point cloud completion for botanical objects, which recommend a minimum of 800–1200 samples to capture fine−grained structural variations. This large−scale dataset enabled the robust training of our network, addressing the challenges of canopy overlap and partial scanning common in dense forests. To enhance accuracy, we further augmented the data with simulated occlusion scenarios (Section 3.2.3) to improve generalization. We extracted 1050 individual Populus Tomentosa trees from the plantation point cloud. The trees were selected via stratified random sampling across 20 rows (Figure 3a), ensuring coverage of all Height Ratio (HR) categories ( 1.25 H R 5.0 ) and spatial positions (edge vs. interior). Manual semantic segmentation was performed by three forestry experts using CloudCompare, with trunk−canopy division guided by branch insertion points. Inter−annotator agreement exceeded 95%, validated through a subset of 100 trees. Manual semantic segmentation produced ground truth (GT) labels for trunk and canopy points, which were used to train MFCPopulus. The network learns to reconstruct complete trees by minimizing the Chamfer distance (Equation (4)) between generated and GT point clouds. This enables MFCPopulus to infer missing structures (e.g., occluded branches) while preserving the natural morphology.
Additionally, conventional graphical algorithms such as the shortest path algorithm were employed for point cloud segmentation. However, these methods often resulted in over− or under−segmentation, which posed challenges in maintaining consistency with natural morphological features. Furthermore, both the trunk and crown portions of each poplar tree were labeled to establish a foundation for the subsequent sampling of structural characteristics. If there are too many missing points, the completion algorithm may not be effective. In Section 4.4, we investigate the sensitivity of our MFCPopulus to input point cloud density and completeness.

3.2.3. Dataset Analysis

During the sample selection process, our objective was to encompass a wide range of growth patterns observed in plantation forests. Tree height and clear bole height (vertical distance from ground to the first living branch) serve as crucial indicators for the phenotypic determination of poplar trees, providing valuable guidance for scientific pruning and rational planting distribution, while also significantly influencing the phenological morphology of individual trees. Clear bole height, distinct from merchantable height, directly influences crown morphology and light interception efficiency, guiding pruning practices in plantation management. We defined the height ratio (HR) as the ratio between tree height and clear bole height. Within these forests, trees generally exhibit uniform growth and heights; however, variations in HR play a significant role in determining structural features such as branch characteristics. These branch characteristics have a substantial impact on tree crown morphology, which is an essential consideration in our point cloud completion efforts. Therefore, we utilized HR as the primary indicator for distinguishing tree attributes.
A total of 172 trees were randomly selected from the dataset for characterization, encompassing point cloud data representing actual trees with measured tree height and under−branch height values (Figure 4). A total of 172 trees were stratified into three spatial categories: edge trees (adjacent to open areas), interior trees (surrounded by neighbors), and gap trees (near canopy openings). Analysis revealed that edge trees exhibited 15% larger crown volumes (p < 0.01) due to reduced competition for light. MFCPopulus accounted for these variations through adaptive feature fusion, achieving a comparable reconstruction accuracy (CD loss: 0.10 ± 0.03) across all spatial groups. The visualization results revealed a concentrated range of values for both the tree height and clear bole height. Tree heights predominantly ranged between 7.5 and 20 m, while clear bole heights varied from 2.5 to 10 m, and HR values approximately spanned 1.25 to 5 units. Cultivation and management experience consistently indicates that Populus Tomentosa tends to exhibit a taller stature with higher HR values, whereas it demonstrates a wider form with lower HR values. Notably, a positive correlation exists between tree height and clear bole height, serving as a fundamental basis for subsequent classification discussions within the context of this study. Furthermore, the distribution pattern of trees across HR reflects the overall trend observed in plantation forests.

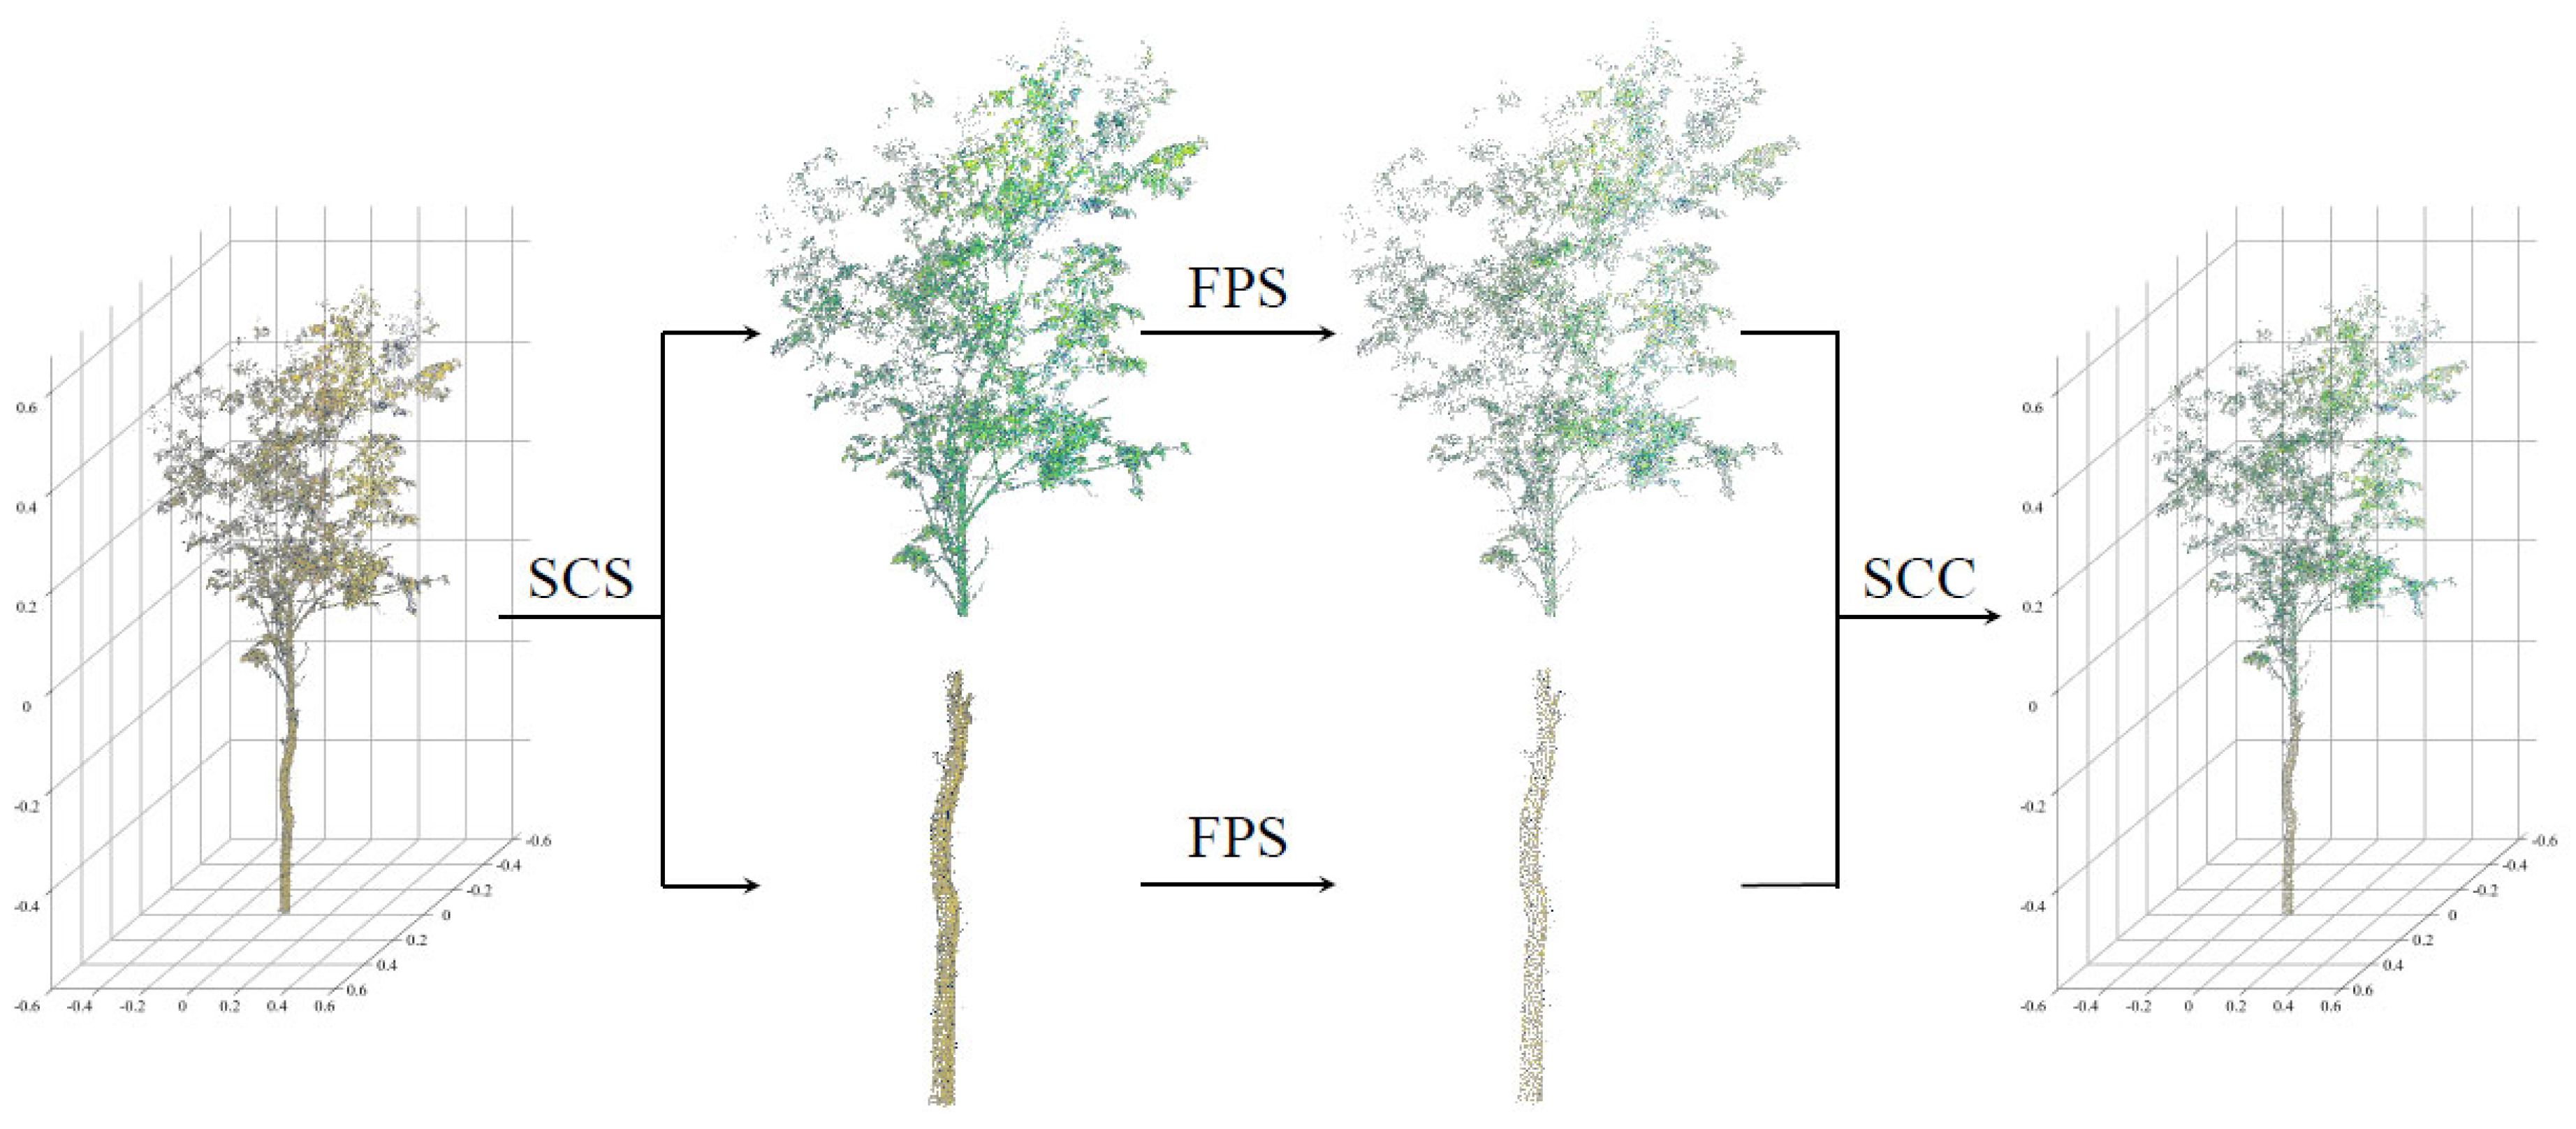
3.3. Sampling of Structural Features

We analyzed point clouds with varying densities to discern structural features across different segments of poplar trees (Figure 5). Within the point cloud feature network, we strategically sampled a limited set of points to capture shape characteristics effectively. The key aspect of sampling structural features from point clouds lies in comprehending and encapsulating the essence of the research subject.
The representation of the trunk structure using point clouds is relatively straightforward. The primary trunk morphology of Populus Tomentosa typically exhibits a straight form, with a smooth or longitudinally cracked bark. Therefore, an effective low−resolution point cloud can be utilized for its construction. On the other hand, representing a canopy structure with point clouds is more complex in nature. The leaves of Populus Tomentosa are typically triangular or heart−shaped, measuring 10−15 cm in length and 8−13 cm in width, while the crown assumes a conical, ovoid, or round shape. Analysis of the collected point cloud (Figure 3) reveals distinct leaf visibility, emphasizing the necessity for a greater number of points to accurately portray the canopy section. Consequently, during the sampling process of structural features, a sparse point cloud is generated for the trunk while a dense point cloud is obtained for the crown. Moreover, subsequent networks allocate more computational resources to the reconstructed point cloud in order to prioritize the analysis of the crown section of trees. As demonstrated in Section 4.4, the experimental results validate that this approach significantly enhances the efficiency of utilizing point clouds.
In contrast to conventional methods for normalizing point clouds, our MFCPopulus network employs a novel approach during feature extraction. It selectively samples trunk and crown point clouds in varying proportions and collectively normalizes them. Initially, the individual tree point cloud is divided into trunk and crown segments based on predefined divisions established during dataset production. Subsequently, each segment’s point cloud is diluted at different rates using a weight allocation concept where the proportion of preserved points inversely corresponds to the desired level of detail retention. For example, if the original number of trunk point clouds is denoted as E, the original number of crown point clouds as F, and the final number of samples as Q, with f representing the number of sampled crown point clouds, then the number of sampled trunk point clouds can be expressed as Qf.
f F Q f E
In the normalized point cloud, the proportion of points collected from the canopy significantly outweighs those gathered from the trunk. The Farthest Point Sampling (FPS) algorithm is employed for point cloud sampling in our MFCPopulus. All downsampling methods within the framework are based on FPS principles, which strategically select center−of−mass points from the input point set to ensure uniform coverage across the sample set. Unlike volumetric convolutional neural networks (CNNs) that utilize fixed strides, FPS utilizes local receptive fields customized to the input data and specific metrics, thereby enhancing efficiency [31]. For example, when a specified region with N points is acquired through sampling, the sample set of the point cloud is as follows:
S = s i i = 0 i = N 1
The next point p must satisfy the distance d(p, S) from p to the set S:
d ( p , S ) = max q A ( d ( q , S ) ) = max q A min 0 i < N ( d ( q , S ) )
where q is the initial Farthest Point Sampling point, which is randomly selected from the point cloud.
The farthest point p from the current sampling point is identified among the remaining unselected points by calculating the distance d(p, S) for each point and selecting the one with the greatest distance. The newly discovered sample point is then added to the set of selected sample points. This iterative process continues until the desired number of samples is obtained.
The advantage of this method lies in its capability to effectively reduce the number of point clouds while preserving crucial structures and features. By employing a distance−based selection approach for the sample points, it ensures a uniform spatial distribution of sampled points, thereby providing a more accurate representation of the original point cloud data.

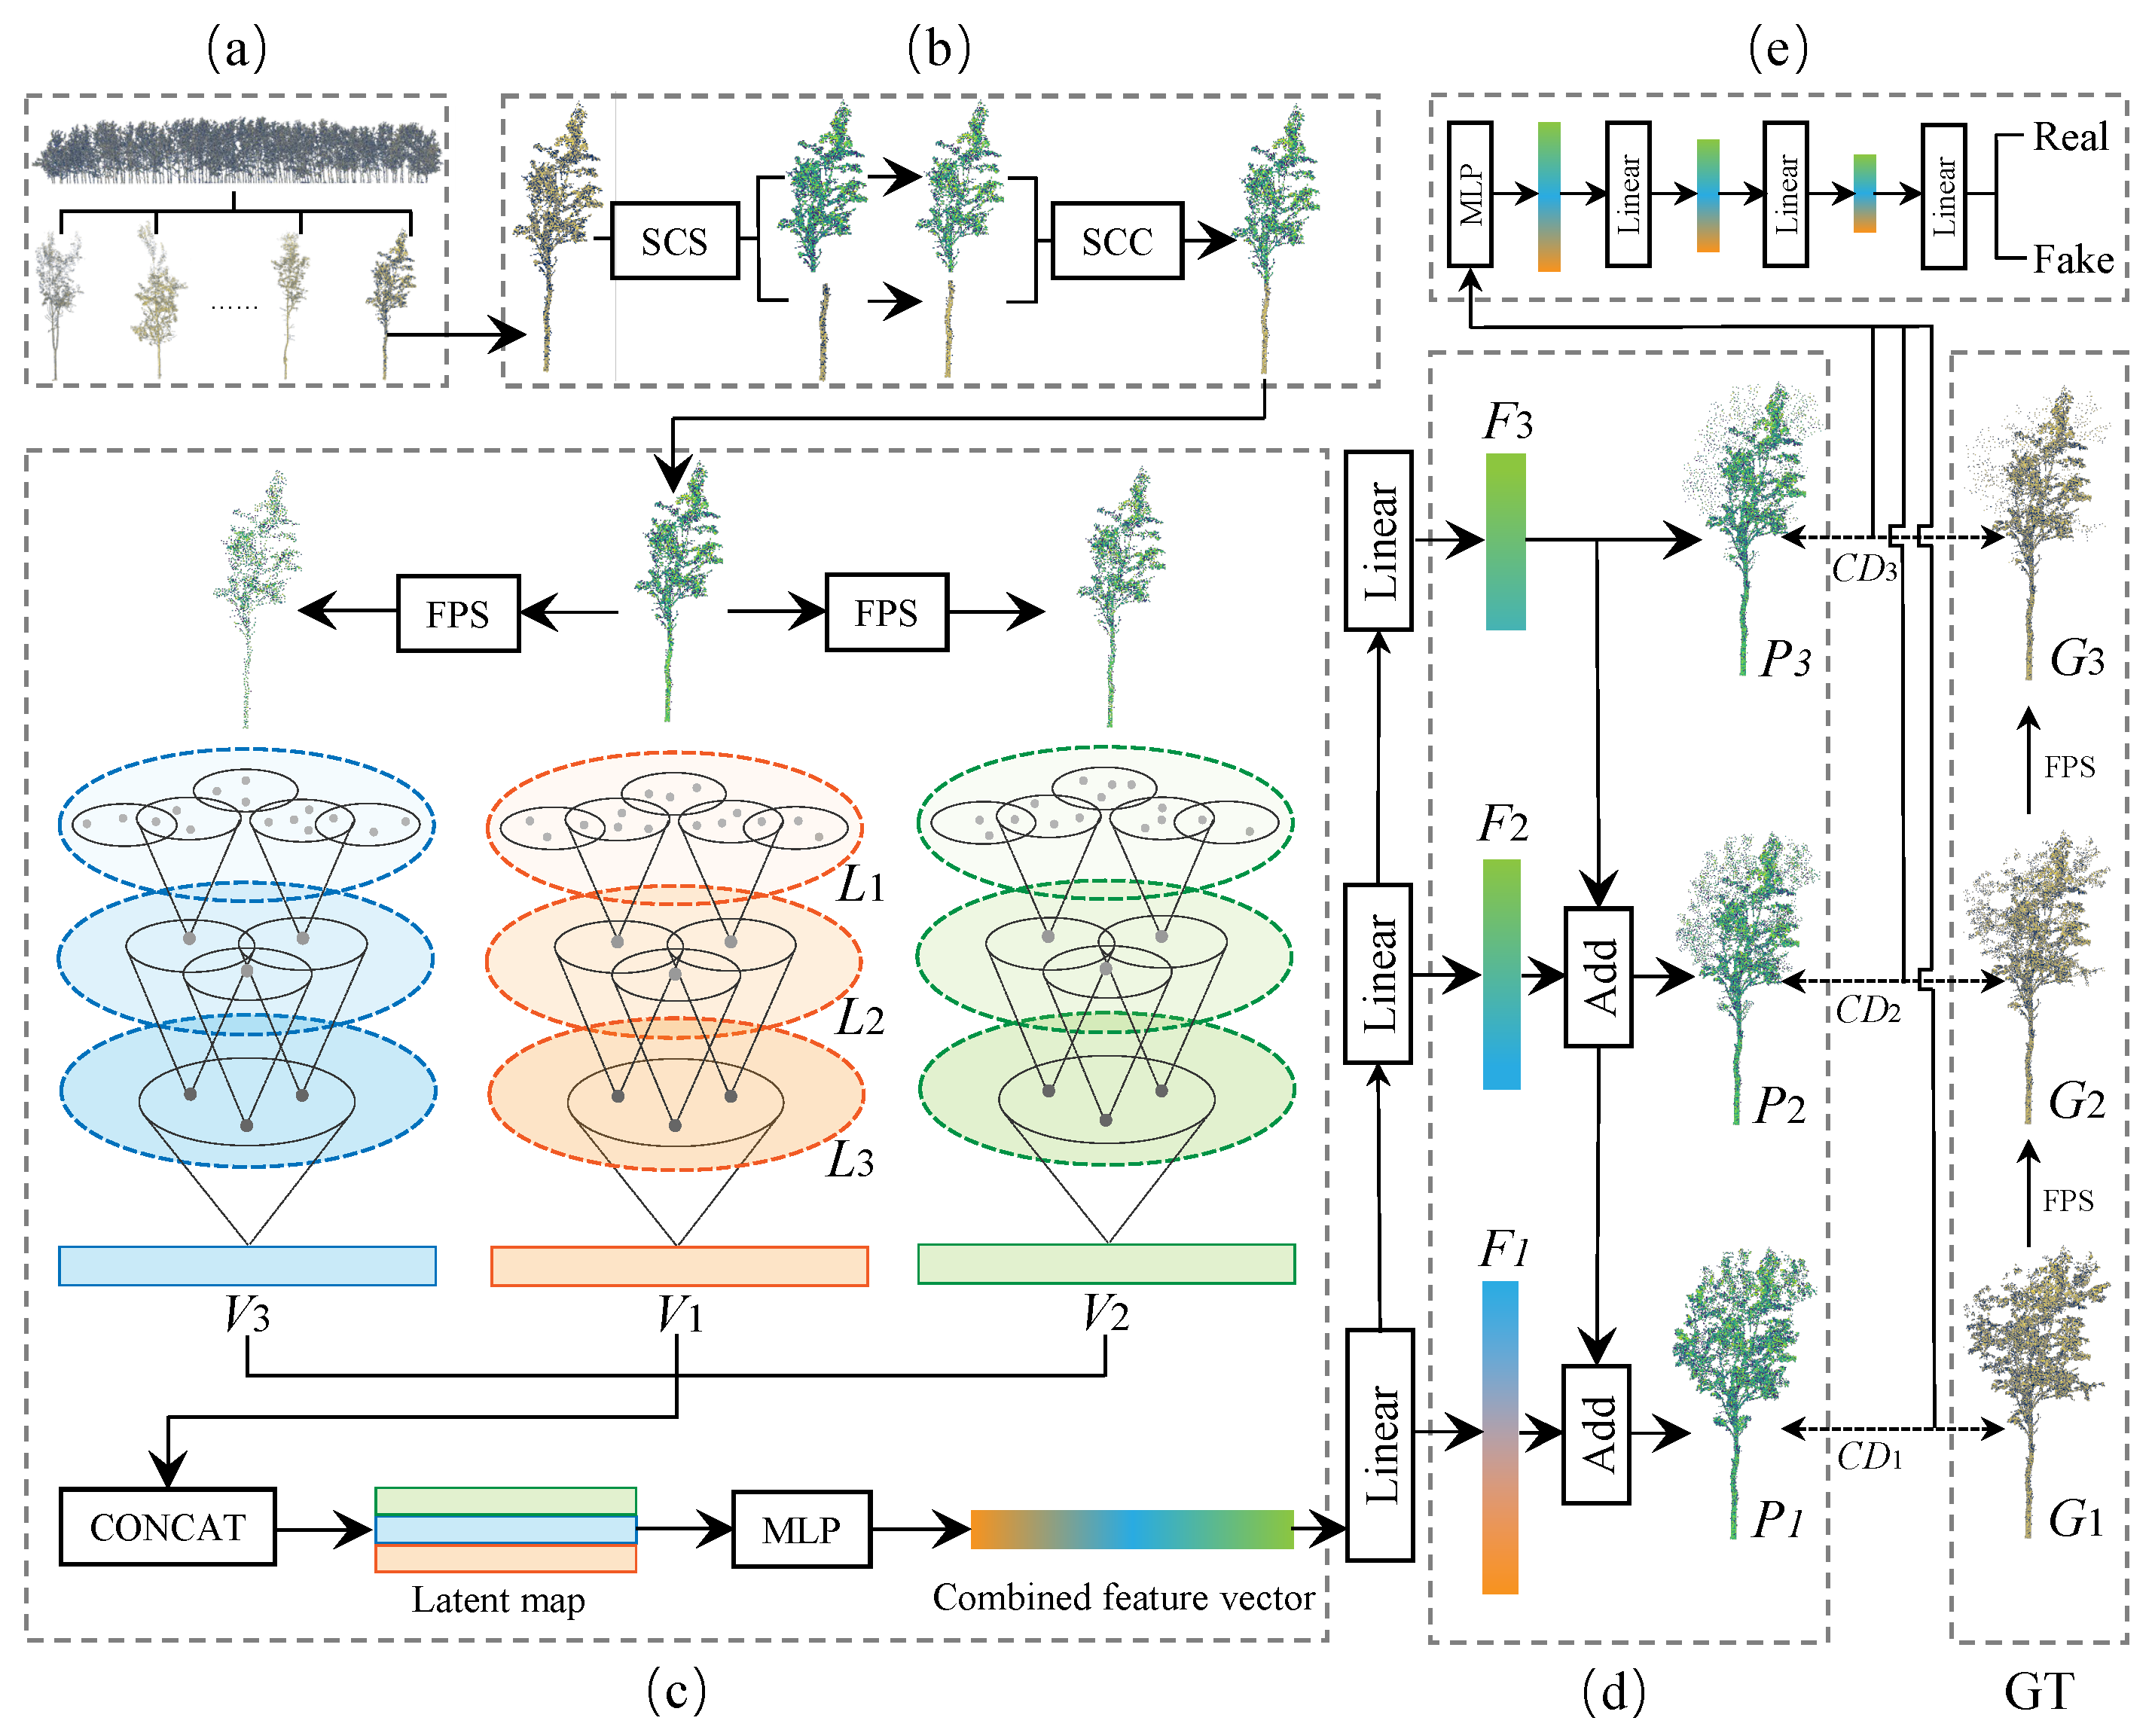
3.4. Multi−Feature Fusion Completion Network

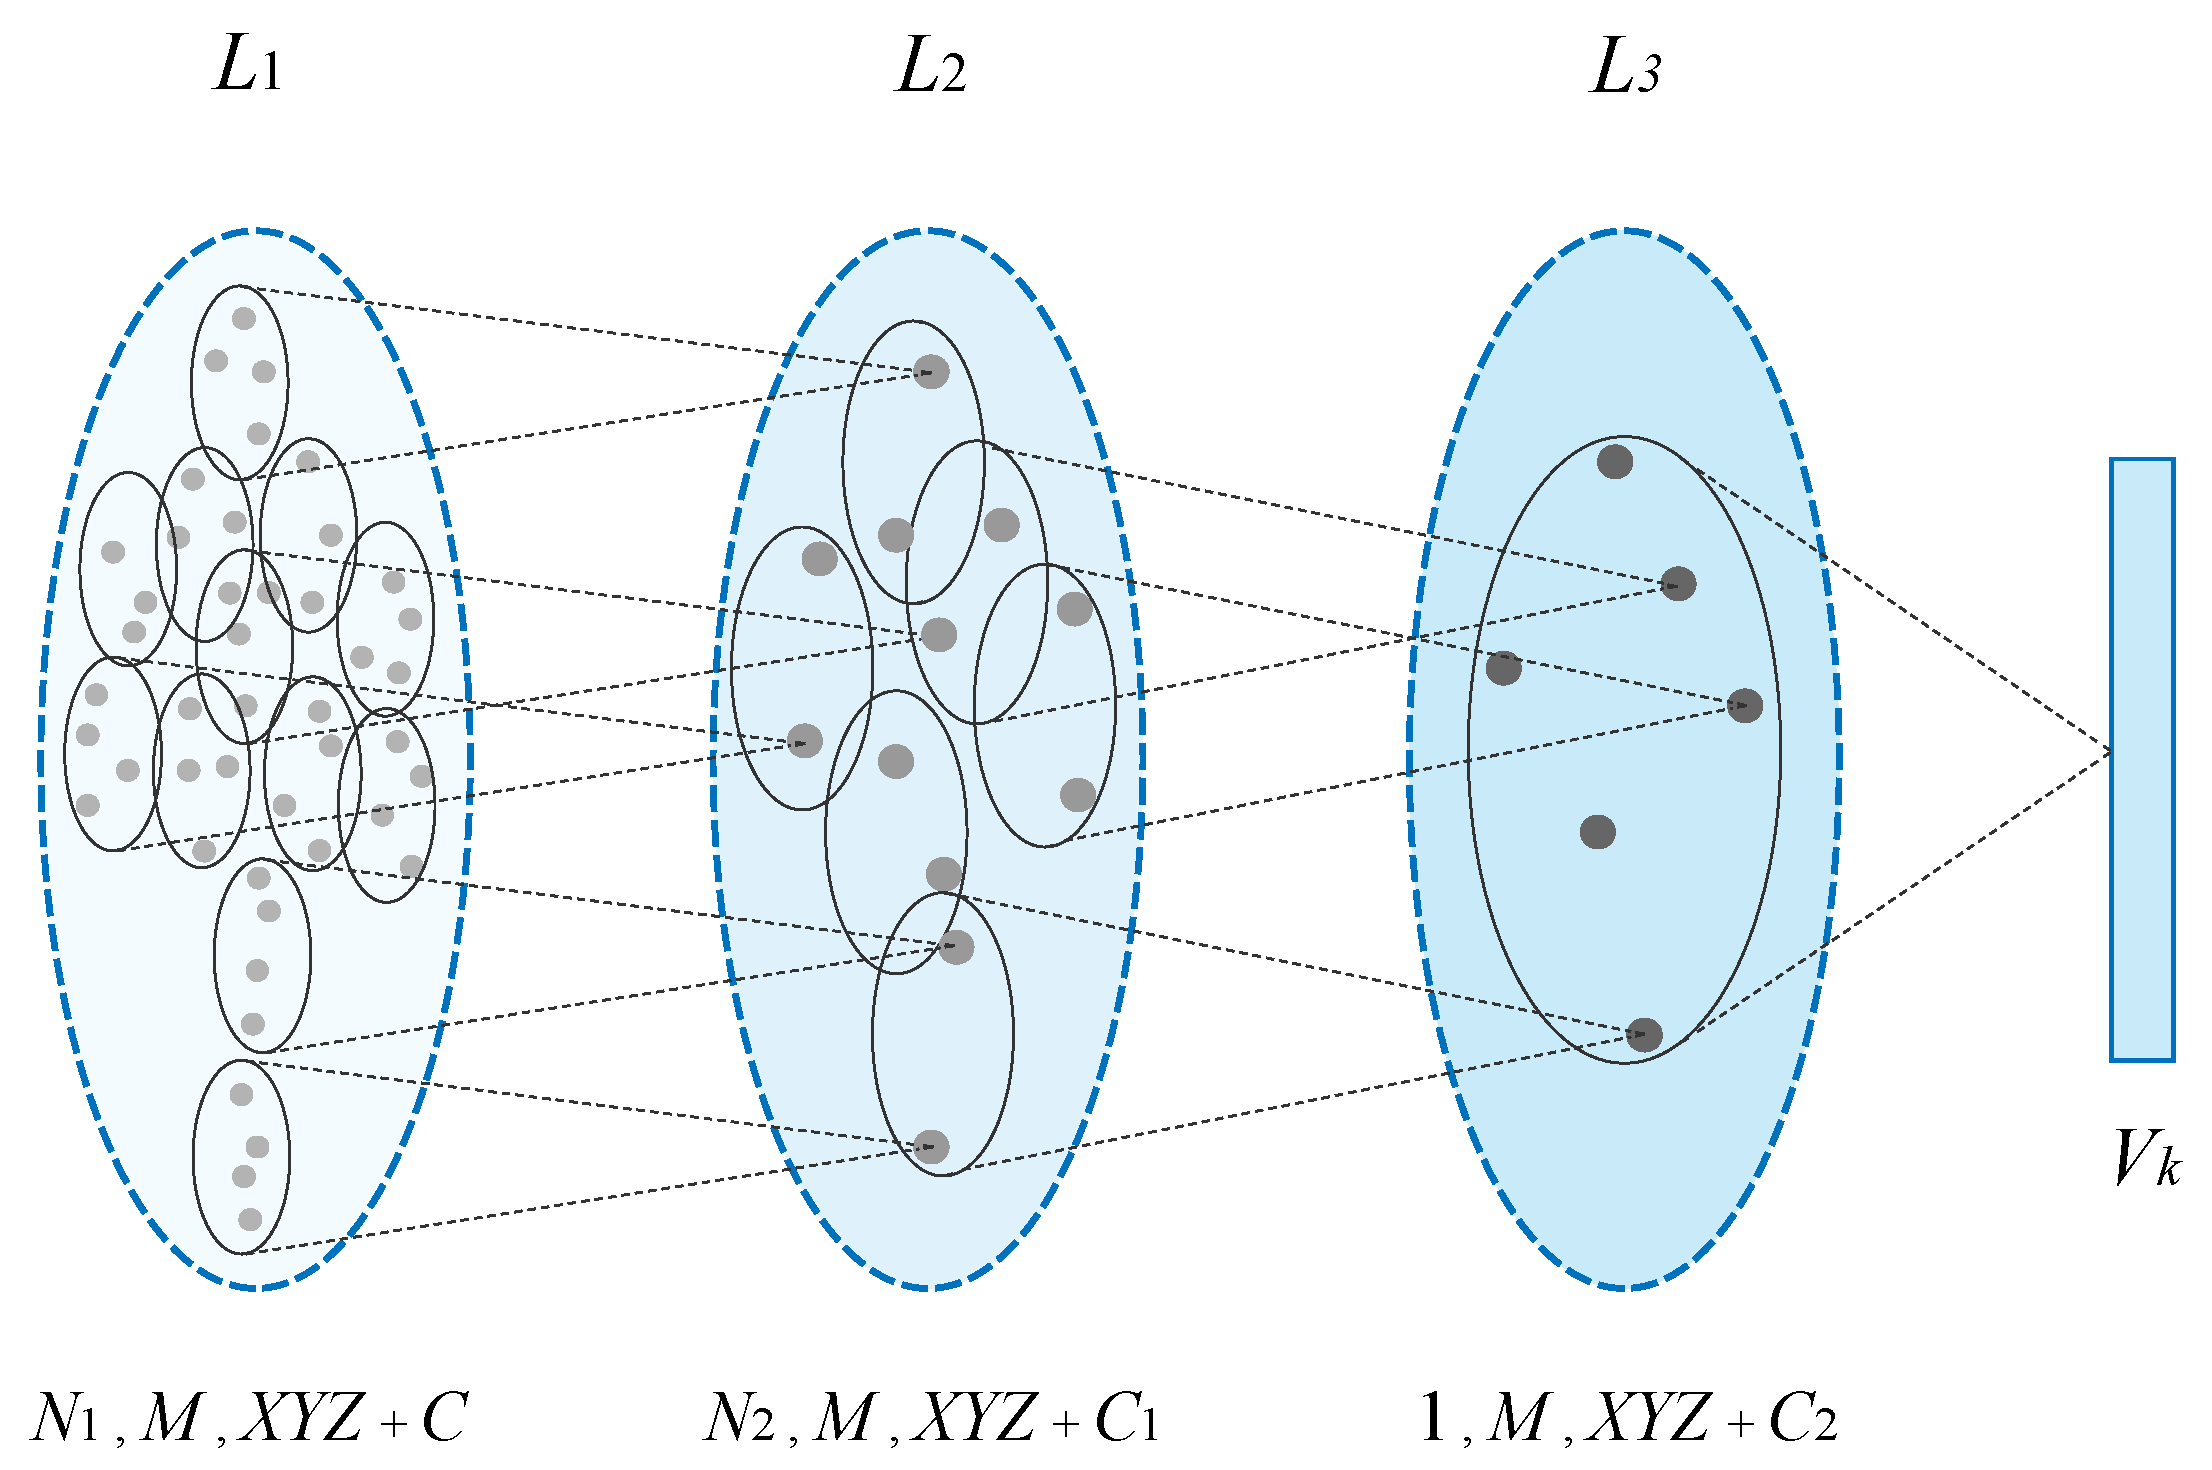
3.4.1. Multi−Scale Feature Fusion with Hierarchical Sampling

A fundamental challenge in machine learning lies in developing a generative model that can efficiently generate a wide range of new sample points within the domain of the underlying distribution, based on a given dataset [45]. Deep generative models leverage deep neural networks to capture complex data distributions [46], with generative adversarial networks (GANs) gaining significant attention for their success across various applications [47]. Feature pyramid networks (FPNs) have emerged as a prominent technique employed by convolutional networks for processing two−dimensional images [27]. Unlike traditional image pyramids that rely on multi−scale images as input, FPN operates by adjusting image resolution after input, resulting in multiple images at different scales and enhancing information extraction. In this context, we extended the design philosophy of FPN to 3D point clouds by modulating the sampling rate of point clouds, thereby unlocking richer information. We performed sampling rates of 1 and 2 FPS on the input point cloud, leading to three distinct densities: high, medium, and low as depicted in Figure 6c. The low−density point cloud emphasizes structural aspects of the model while its high−density counterpart focuses on finer details.
The utilization of the multi−sampling rate concept extends beyond the input segment, as illustrated in Figure 7. In the case of point clouds, hierarchical feature extraction occurs across three levels of sampling rates: high, medium, and low. At each level, sampling center points are selected to form sampling groups, and feature extraction is performed on each group. Subsequently, the features extracted at different sampling rates are concatenated and inputted into a Multilayer Perceptron (MLP). A detailed description of this process is provided in the following section.

3.4.2. Hierarchical Multi−Sampling

The input point cloud is defined as N × (XYZ + C), where N represents the number of points in the input point cloud, XYZ denotes the x, y, and z coordinate values of each point, and C signifies the point feature. In multi−sampling rate feature extraction, multiple layers (Li, where i = 1, 2, 3, …) are utilized. The sampling process in L1 involves selecting neighboring points around the sampling center to form a sampling group, which then undergoes feature extraction. This iterative process continues for each subsequent layer, gradually reducing both the number of sampling centers and sampling groups until they converge into an individual sampling group.

3.4.3. Sampling Centers and Groups

In Li, Nj (where j = 1, 2, 3, …) points are selected from the N input points as sampling centers, with Nj still determined using the FPS method. Each Nj yields a uniform number of M points, constituting Nj sampling groups, and each containing M points.

3.4.4. Group Feature Extraction

After forming the sampling groups, the vectors’ dimensionality is expanded individually for each group using MLP. Subsequently, feature vectors XYZ + Ch (where h = 1, 2, 3, …) are generated for each sampling group via a maximum pooling operation. The ultimate feature vector for each layer is Nj × M × (XYZ + Ch). Given the unordered nature of the input point cloud, the utilization of symmetry functions becomes indispensable. These functions, such as max pooling, average pooling, and attention sum, serve to identify salient points or informative features within the point cloud and encode the underlying rationale for their selection. The network’s final fully connected layer aggregates these learned optima into a comprehensive global descriptor of the entire shape. As demonstrated by PointNet [30], max pooling emerged as the most effective among these mentioned functions.

3.4.5. Feature Fusion

Let us consider hierarchical feature extraction with three levels as an example. In the final layer, L3, all points are treated as an individual sampling group, where N3 = 1 and M = N2. After applying MLP and maximum pooling operations, C3 is obtained. Essentially, the latent vector Vk (where k = 1, 2, 3) corresponds to three distinct latent vectors with varying sampling rates. The latent vectors are subsequently concatenated to form the latent map, which is then constructed into a combined feature vector using MLP. The aggregation operation of the symmetry function provides global information at a consistent sampling rate, which is later merged with feature vectors obtained from different sampling rates. This allows each point to capture comprehensive semantic information across various sampling rates, thereby facilitating interaction among features sampled at different rates.

3.5. Generation

The generator revolves around incrementally generating predictions by leveraging feature points under various sampling conditions. This principle draws inspiration from the feature pyramid network (FPN), which employs a horizontally connected top−down architecture to construct high−level semantic feature mappings across all scales. As shown in Figure 6d, our MFCPopulus’s generator takes the combined feature vector as input, processes it through fully−connected layers, and produces three feature layers, Fu (where u = 1, 2, 3), each predicting the point cloud at different resolutions: preliminary prediction (P1), intermediate prediction (P2), and final prediction (P3). The features from each layer are integrated through “add” operations based on the preceding layer, facilitating a multi−scale generative architecture that allows for the influence of high−level features on low−level feature representation. Moreover, this architectural design enables the propagation of local geometric information from low−resolution feature points to high−resolution predictions.

3.6. Loss Function

The loss function consists of two primary components: Chamfer distance and adversarial loss. Once the complete and dense point cloud completion result is obtained, it is crucial to compare it with the actual real point cloud result. This comparison yields a binary value (true or false), which serves to evaluate the accuracy of the generated complementary point clouds. In the domain of 3D point cloud completion, Chamfer distance (CD) stands as a widely utilized performance metric. It is computed as the average sum of distances between each point in the predicted point cloud and its nearest counterpart in the real point cloud, as well as between each point in the real point cloud and its nearest counterpart in the predicted point cloud. A smaller CD value indicates a superior outcome. The CD for the two point clouds S1 and S2 is as follows:
d CD S 1 , S 2 = 1 S 1 x S 1 min y S 2 x y 2 2 + 1 S 2 y S 2 min x S 1 y x 2 2
In our MFCPopulus, the ground truth is sampled through FPS to produce three distinct types of point clouds, each with varying resolutions, aligned with the three point cloud models generated by the system. The first GT represents a meticulous reconstruction with intricate details, the second GT embodies a moderate reconstruction, and the third GT showcases a rough reconstruction with an increased emphasis on generating the crown outline. The comprehensive loss c d is calculated based on the computational synthesis of these three point cloud types:
CD = C D 1 + C D 2 + C D 3 = d CD P 1 , G 1 + d CD P 2 , G 2 + d CD P 3 , G 3
Furthermore, the adversarial loss is defined as follows:
L ( G , D ) = log D ( d ) + log ( 1 D ( G ( p ) ) )
where G, D, d, and D(d) denote the generator, discriminator, real data, and discriminator’s assessment of real data, respectively. Moreover, G(p) and D(G(p)) represent the generated fake data and the discriminator’s evaluation of the fake data, respectively. The fusion of the Chamfer distance and adversarial loss forms the comprehensive loss function for the entire model.
The experiments were conducted on a Windows 11 operating system, utilizing an NVIDIA GeForce RTX 4060 GPU. The Anaconda IDE and PyTorch 2.0.1+cu118 development framework, based on a Python 3 environment with CUDA 11 parallel computing architecture, were employed for implementation.
The dataset was randomly divided into three subsets: a training set (60%), a validation set (20%), and a test set (20%). The point clouds requiring completion primarily comprise of individual tree trunks and sections of canopy structures that do not intersect with other trees. During the generation of point clouds for training and testing, no refinement processes were applied.

4. Results and Discussion

The input; output of PF−Net [36], SeedFormer [38], SVDFormer [39], PointAttN [40], and MFCPopulus; as well as the ground truth (GT), are depicted in Figure 8. Notably, MFCPopulus and the ground truth exhibit a closer alignment. In the subsequent section, we quantitatively validate MFCPopulus’s reduction in canopy complexity and volume with respect to biological and modeling structures.

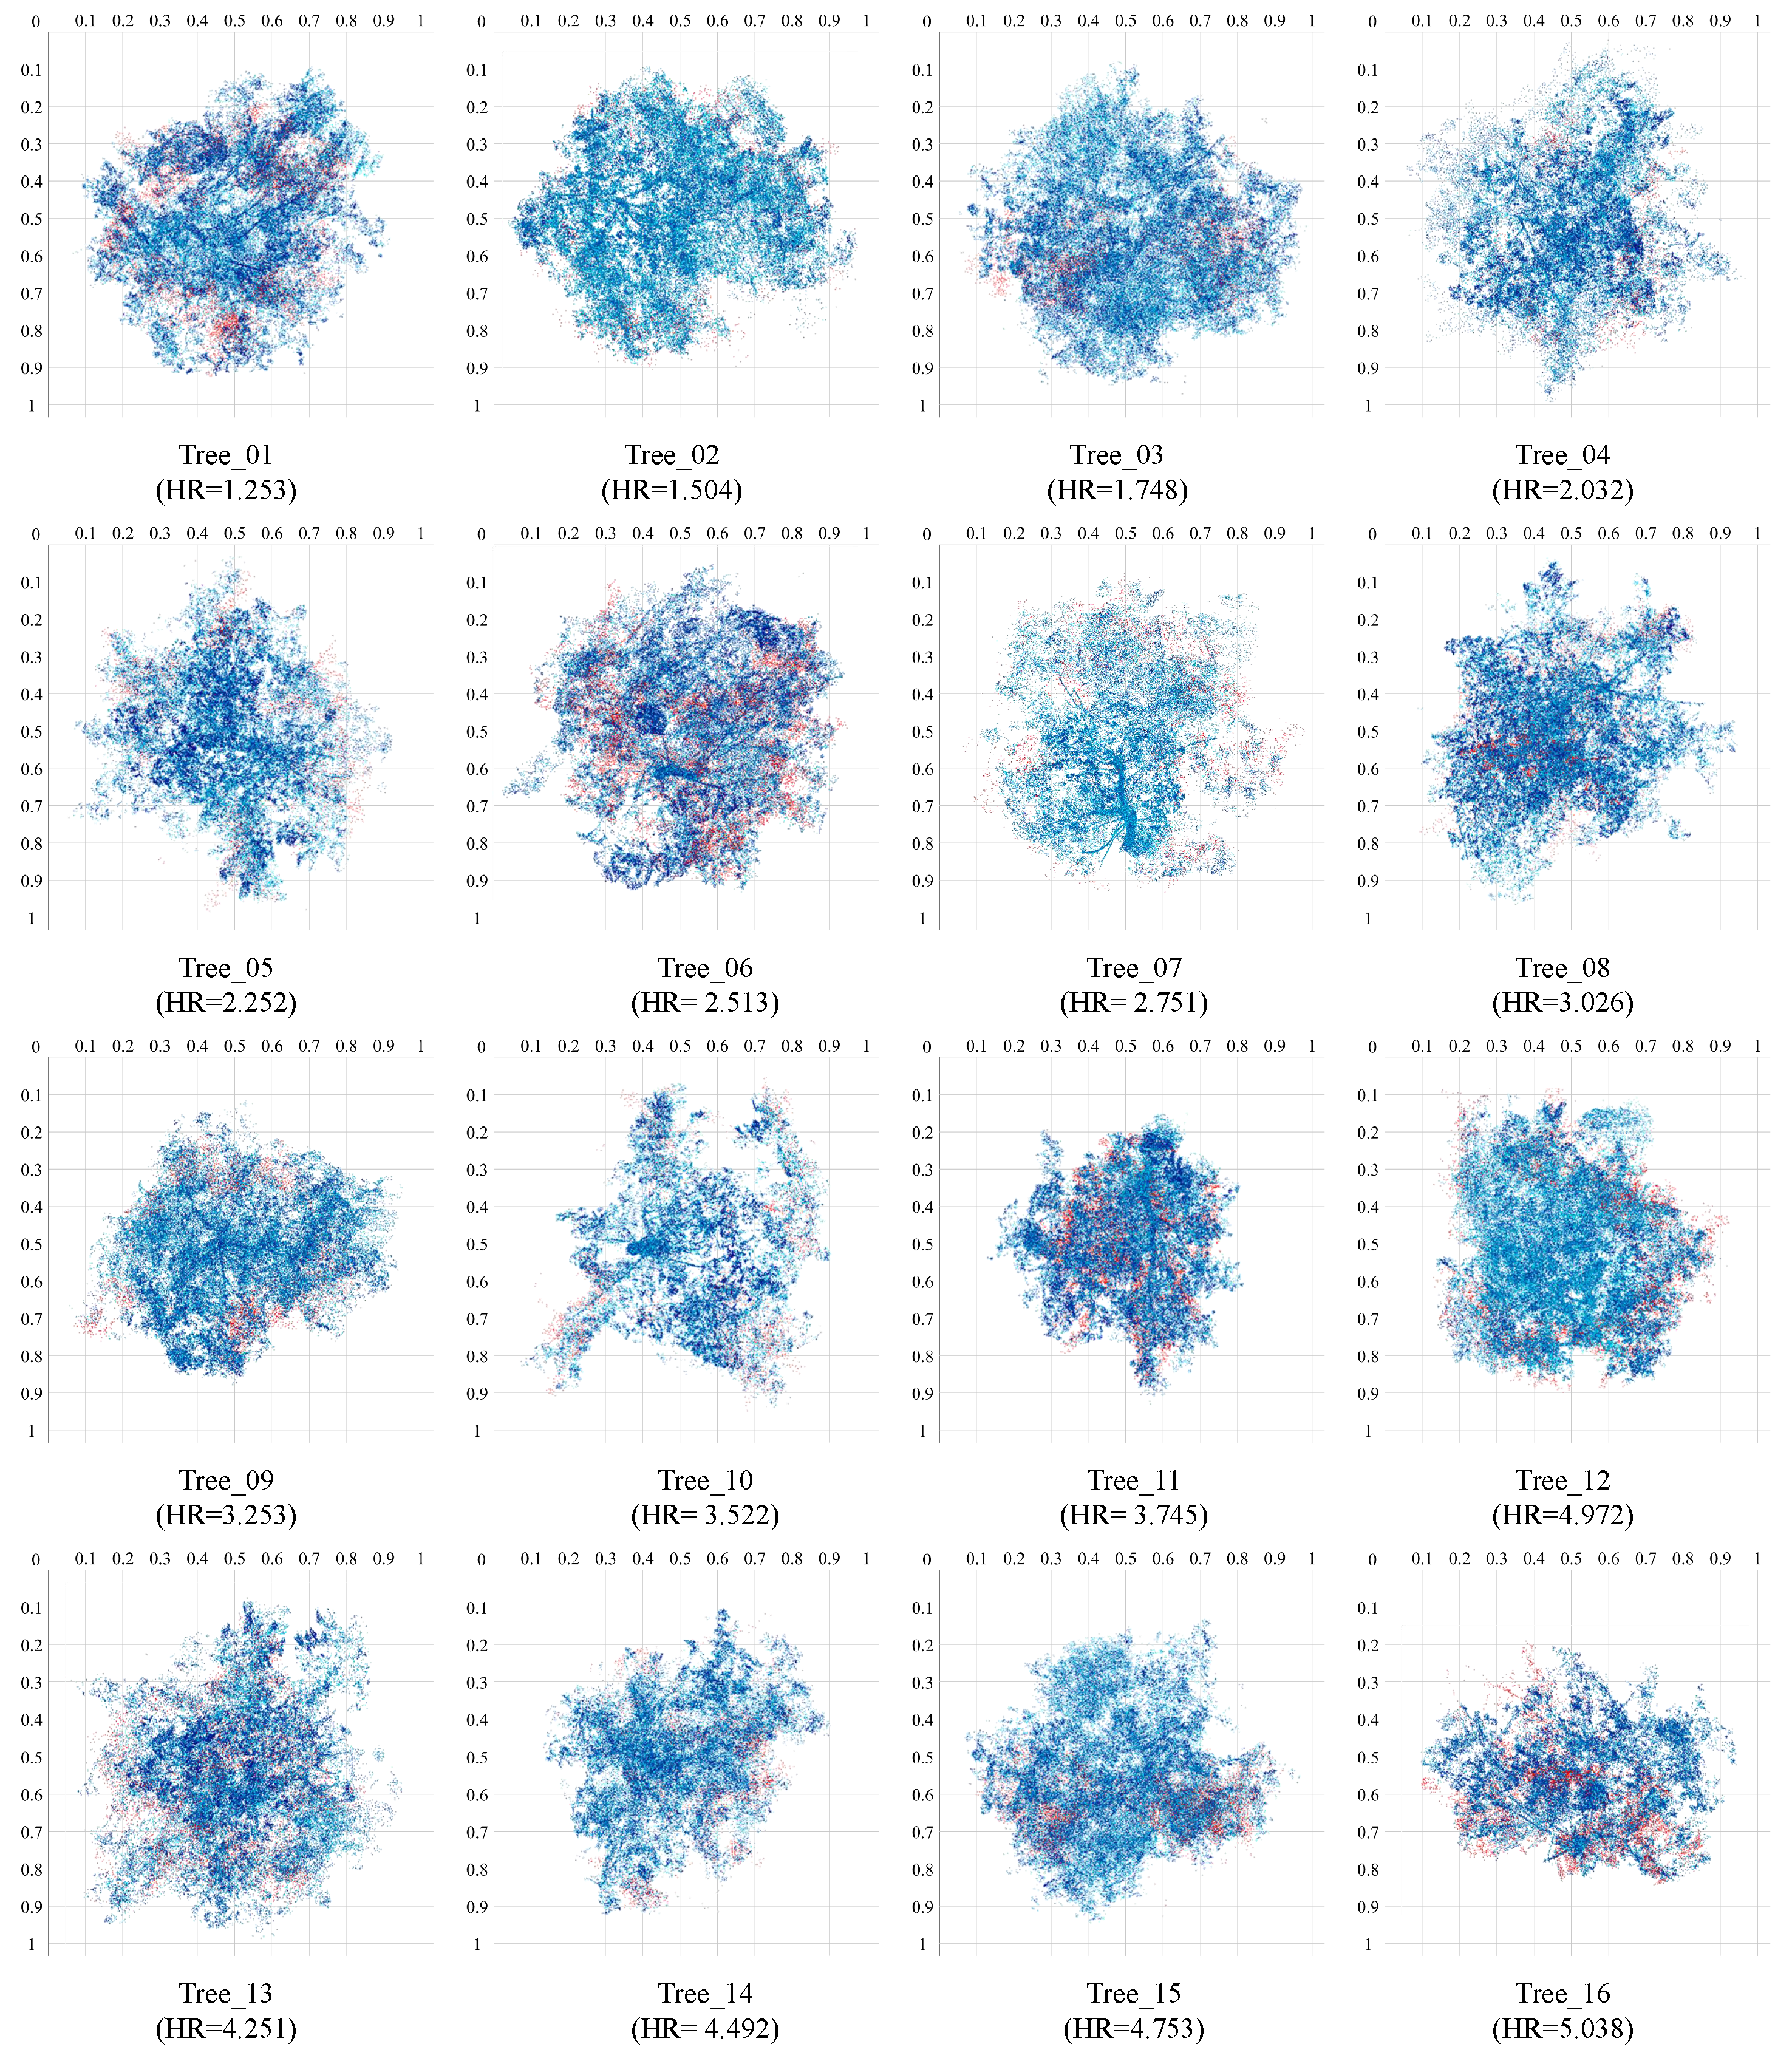
4.1. Morphological Evaluations of Structural Complexity

The structural complexity of individual trees profoundly influences the functionality of forest ecosystems [48]. This complexity is determined by various factors, including fractal branching patterns and individual crown dimensions [49]. The box−dimension (Db) has gained significant attention since its introduction in “The Fractal Geometry of Nature” [50]. Db serves as an effective measure of structural complexity [51]. Laser−scanned point cloud data have emerged as a robust method for quantifying Db and determining the structural complexity of intact trees [52]. The values of Db for individual trees are closely associated with growth competition [53], natural resource utilization [54], seed dispersal [55], and various other research aspects. Moreover, they significantly influence the overall structural complexity of a forest stand.
The calculation of Db involves analyzing the count of boxes required to enclose all ground−level tree structures within the point cloud, considering their specific sizes. Subsequently, Db is determined as the slope of the regression line obtained from a scatter plot depicting the number of boxes (expressed as log(N)) divided by the reciprocal of the logarithm of their respective box size, with the box size denoted as a ratio relative to the initial box size. The theoretical range for Db spans between 1 and 3 for an individual tree [50]. The analysis for Db was performed using Mathematica (v12.3) software, while Arseniou et al. [56] provide a code implementation based on a previous study by Sarkar et al. [57], which can be used to compute Db.
The histograms in Figure 9 present the Db values of the test samples for each major HR value set. To approximate with HR, the point cloud of mutilated trees was divided into 16 groups, each containing 15 trees. A bar graph was plotted to represent the average calculated results for each group. The smaller the discrepancy between the generated values and the ground truth, the closer is the structural complexity of the trees. It is evident that despite deviations from the ground truth, our MFCPopulus consistently exhibited minimal disparity between its Db and that of the ground truth for every test tree sample.
The results indicate a close alignment between the point clouds generated by our MFCPopulus and the ground truth in terms of structural complexity. It is worth noting that our MFCPopulus as a whole concentrates tree complexity within the range of 1.7 to 2, which is consistent with Seidel et al.’s findings suggesting that tree Db values should be significantly lower than 2.72, the Db value of the Menger sponge [56,58], known for having the highest surface−to−volume ratio. The average discrepancy in structural complexity between the reconstructed and ground truth outcomes was computed to be 0.12, indicating a reduction of more than 33% compared to previous methodologies. Moreover, our MFCPopulus demonstrated the least deviation in tree Db values compared to the ground truth’s Db range, further emphasizing its effectiveness in reducing a tree’s structural complexity. These findings underscore the practical significance and application value of our MFCPopulus.

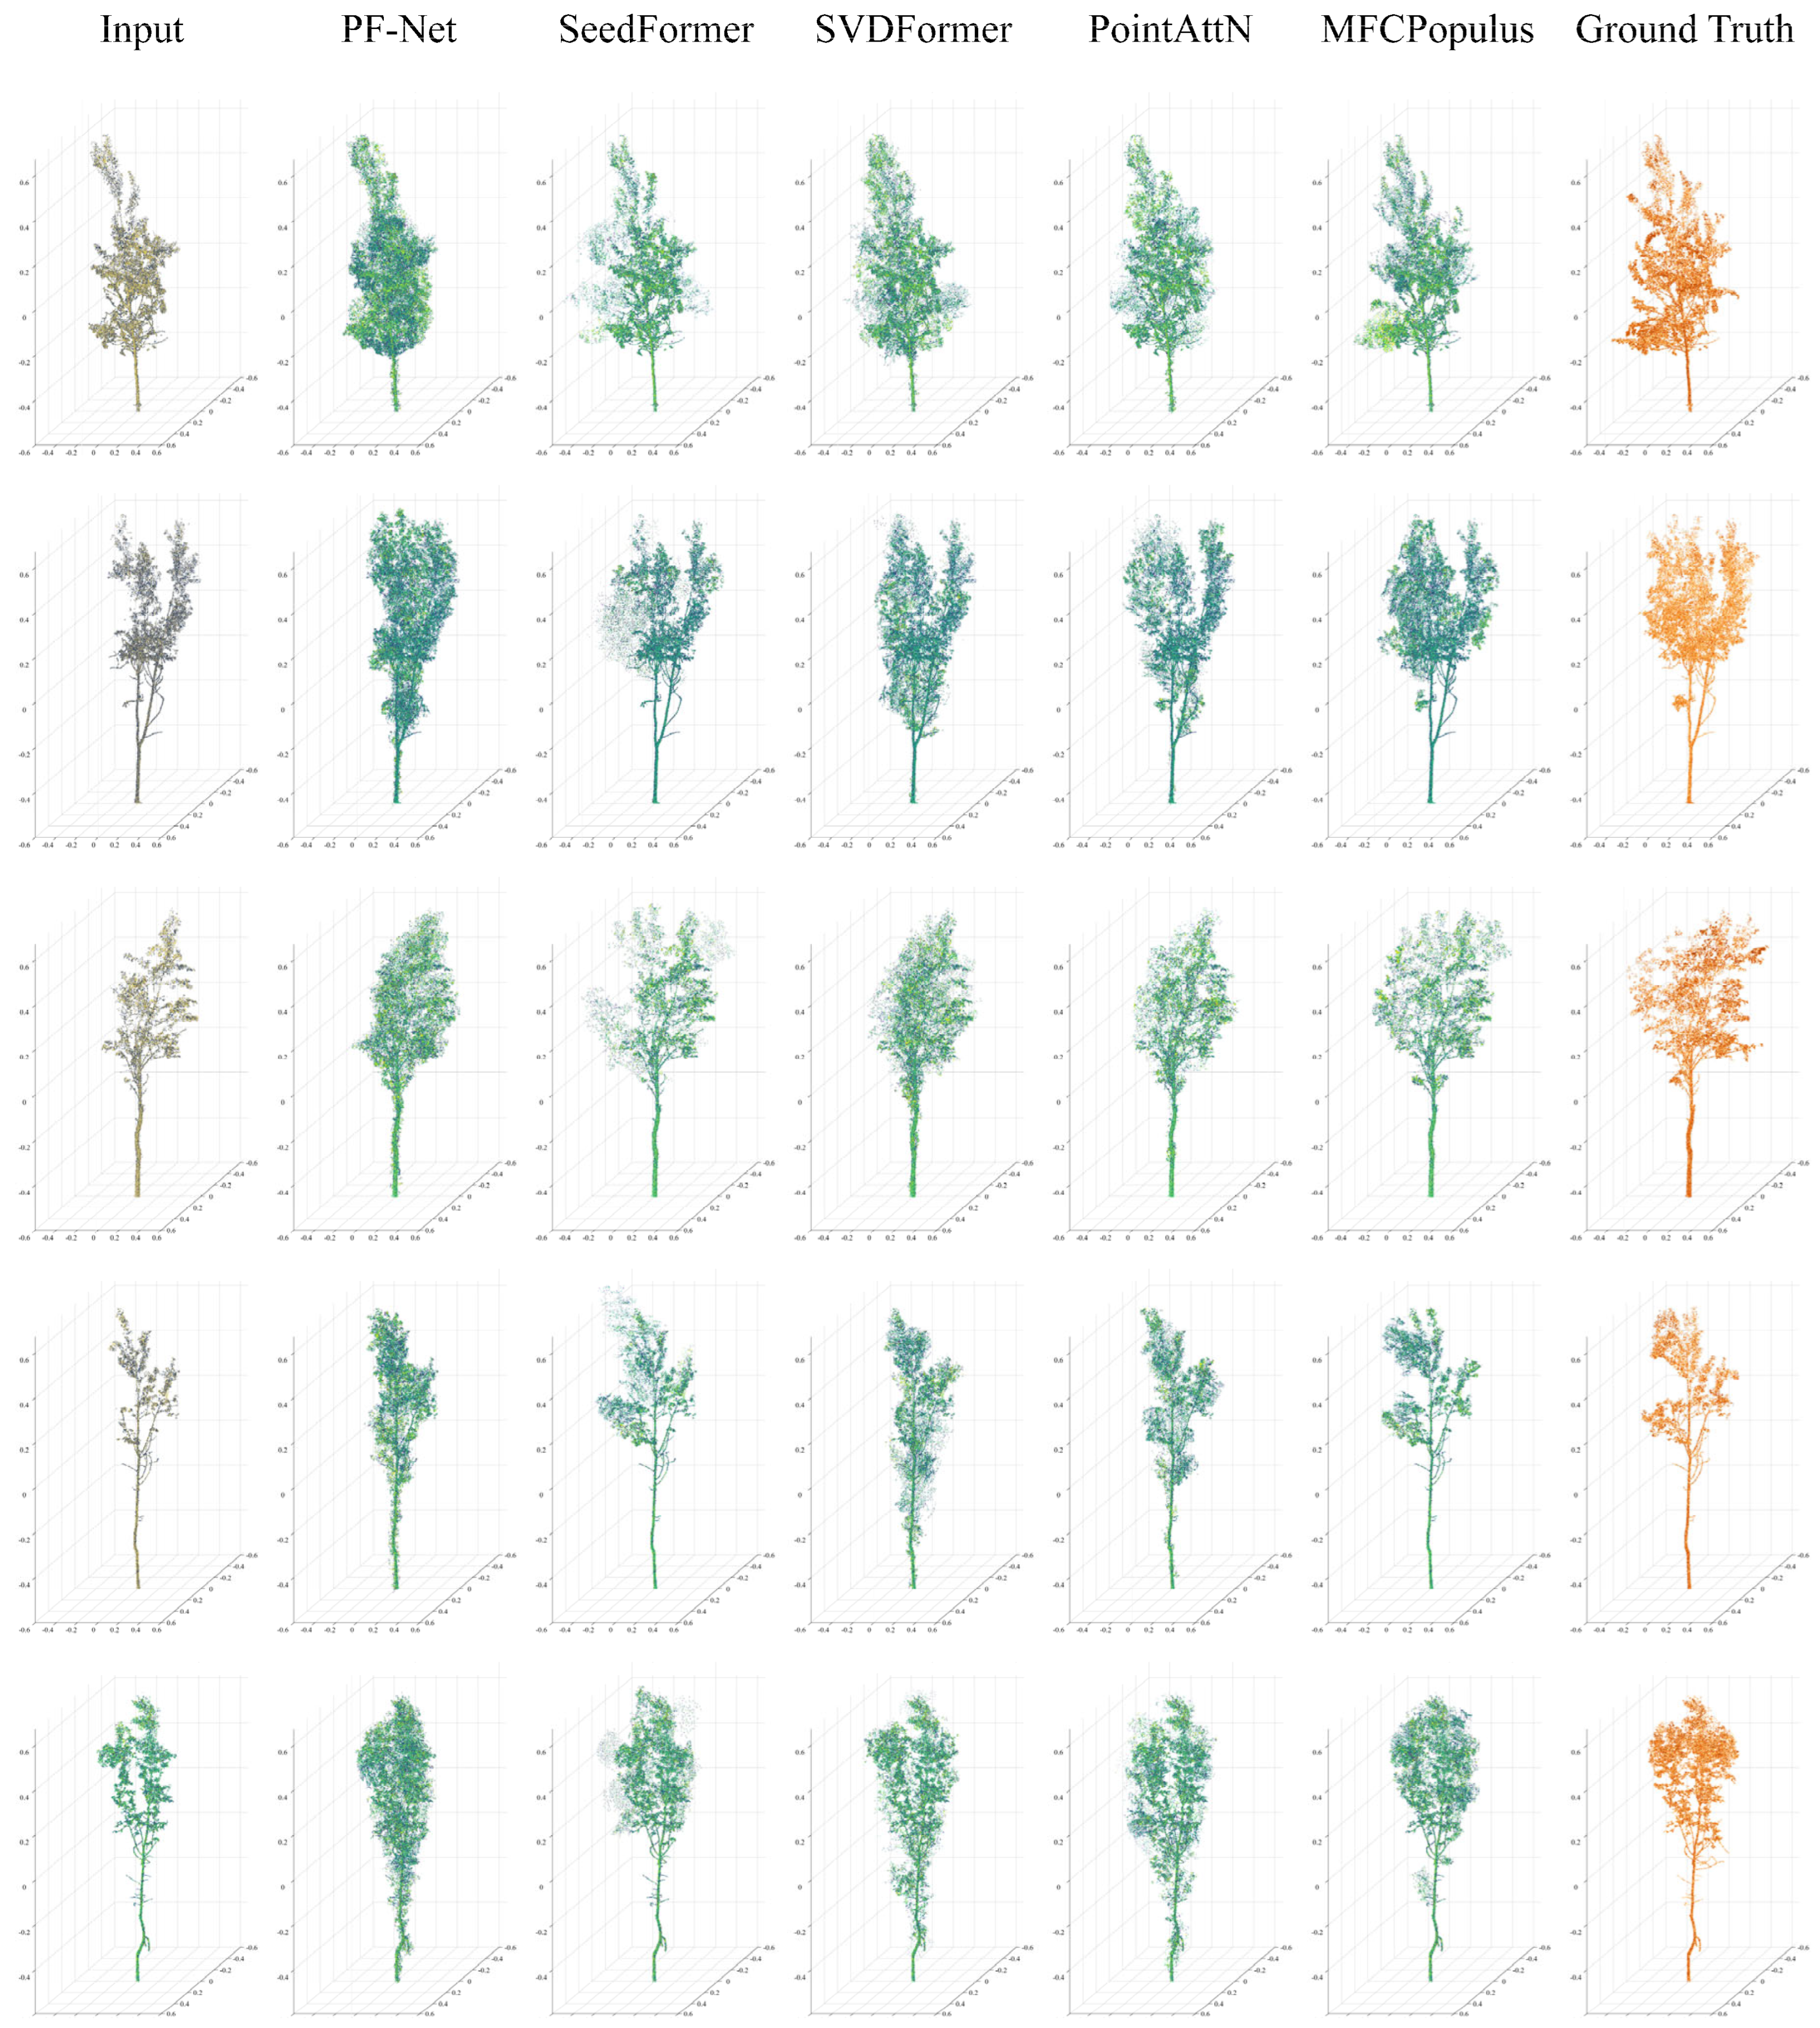
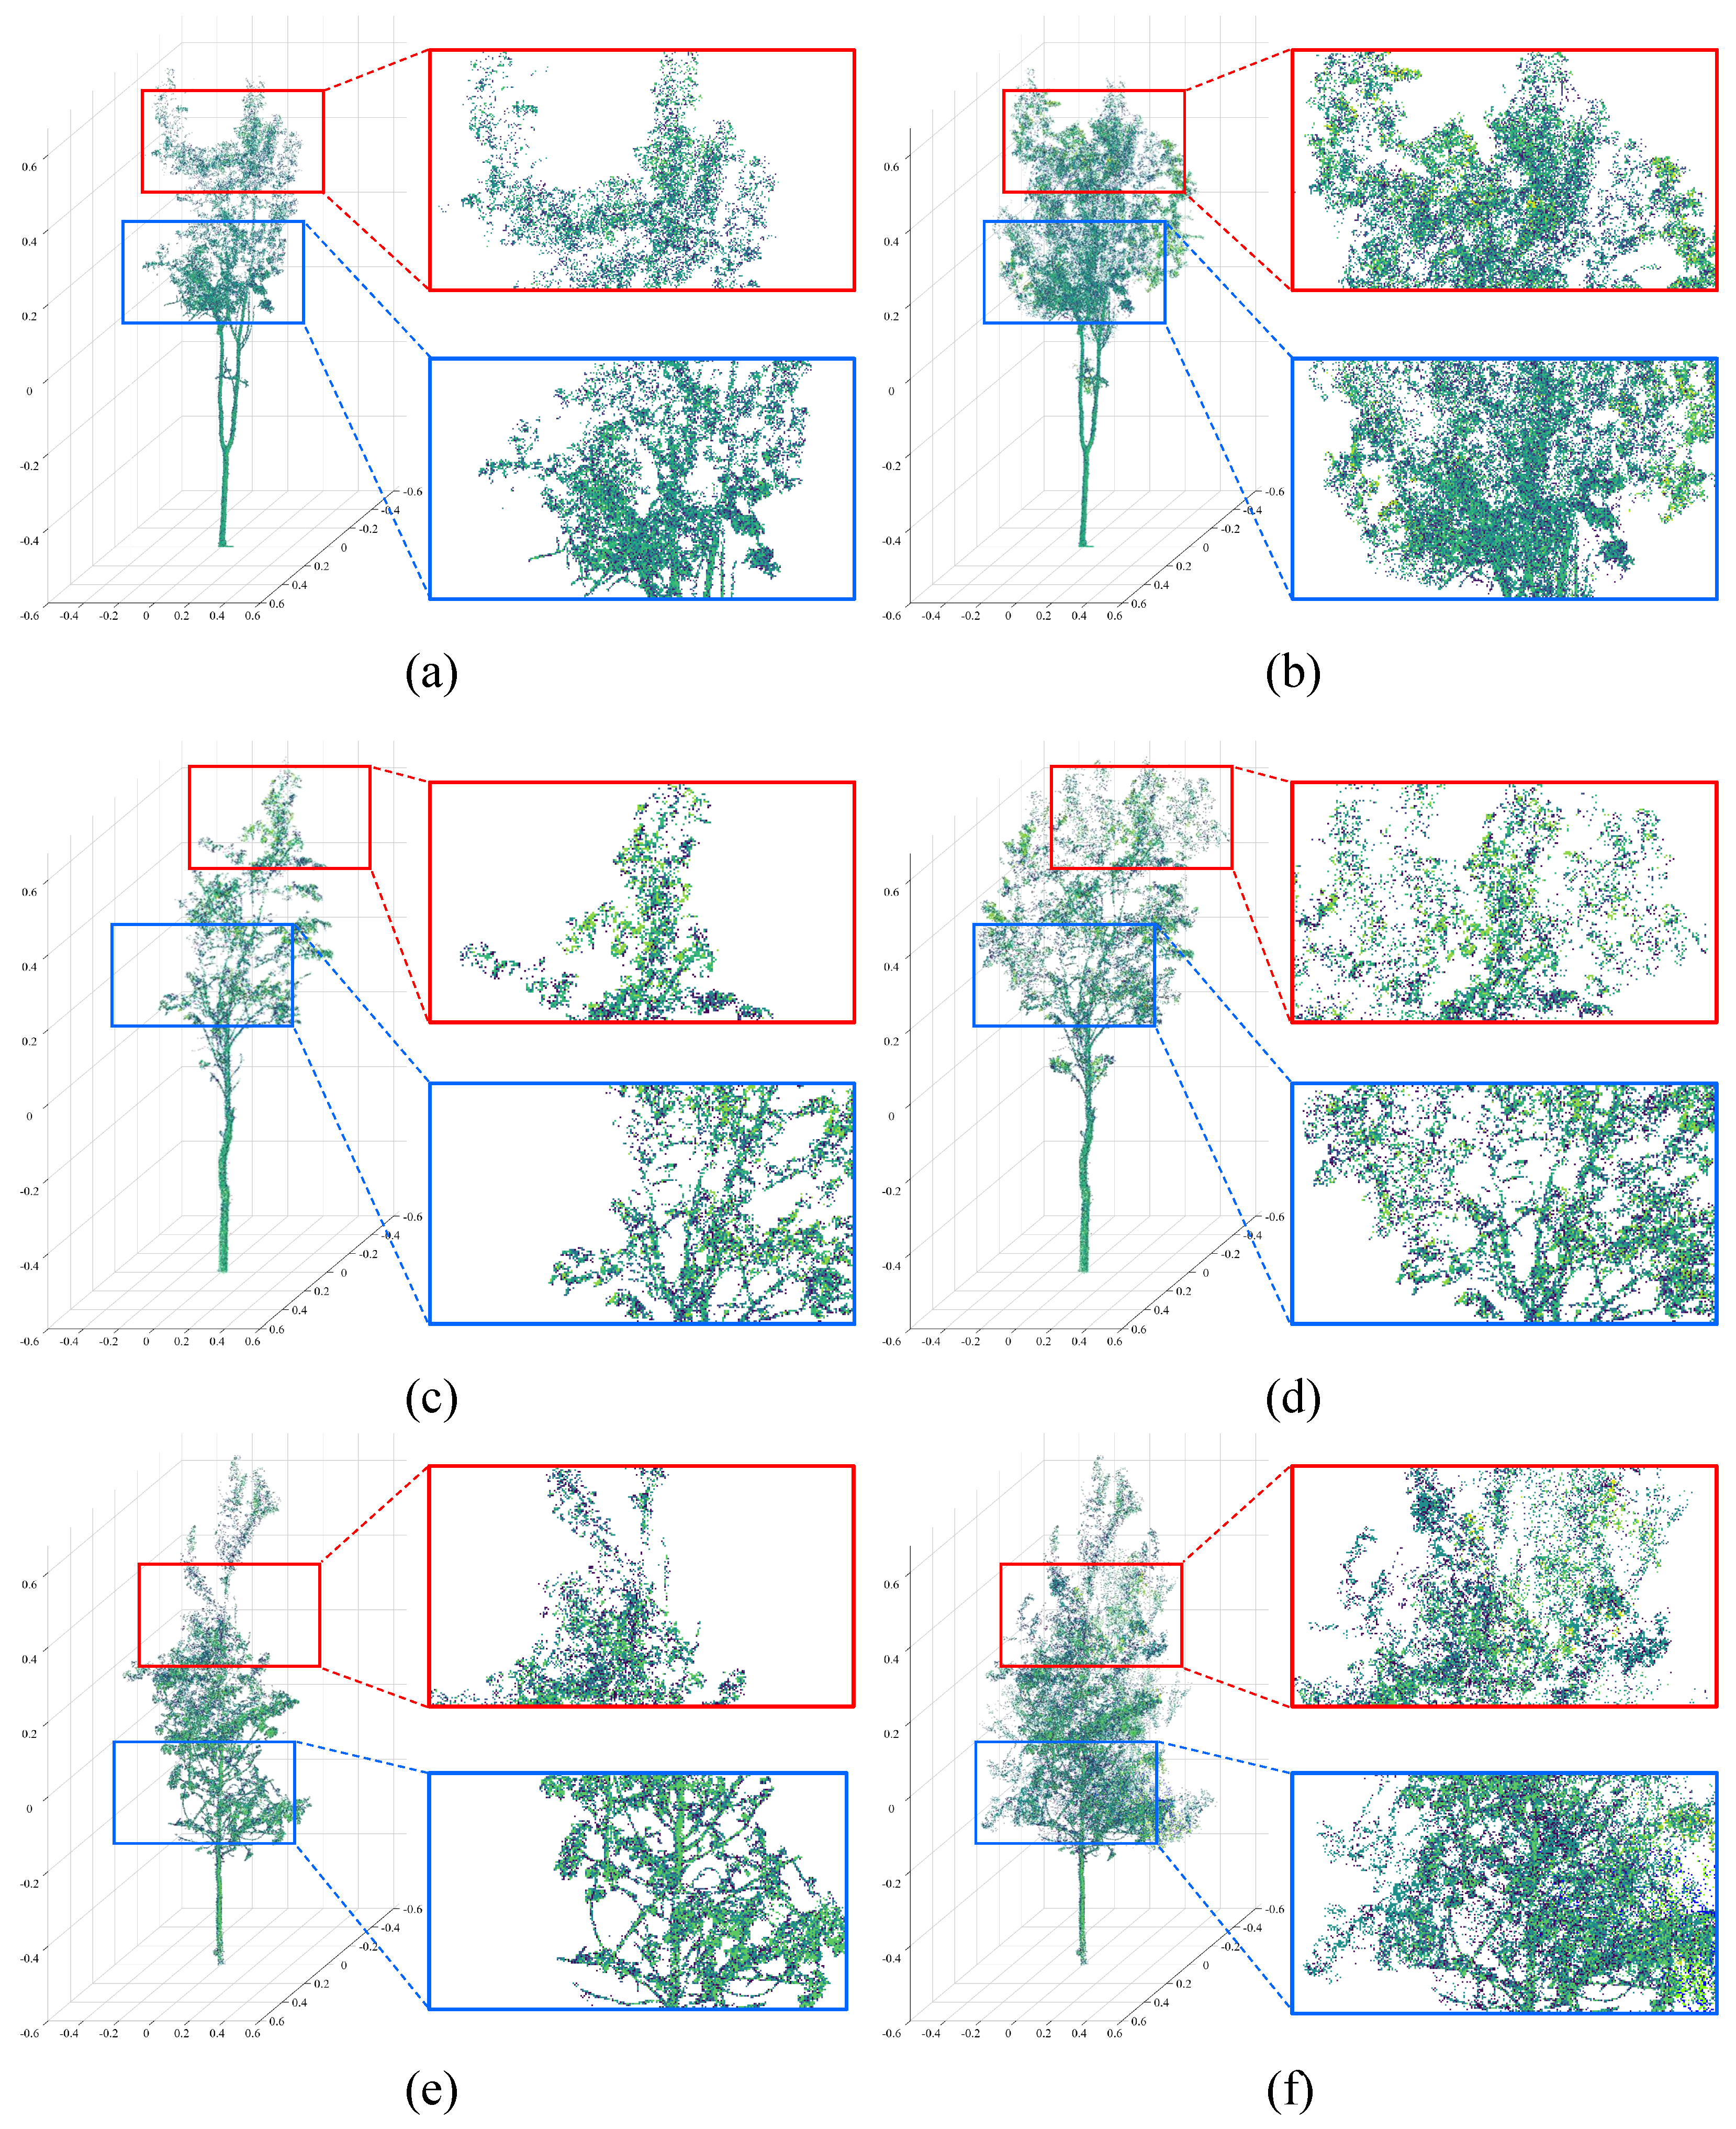
4.2. Visual Evaluations of Representations

A comparison of the results from MFCPopulus with other mainstream point cloud completion methods is presented in Figure 8. The input test point cloud selectively removes intersecting branches and retains only the accurate structure of individual trees. In the subsequent section, a quantitative analysis of the differences in point clouds is performed. Based on visual observation, it is evident that each method exhibits distinct characteristics, with MFCPopulus showing the closest resemblance to the ground truth. Upon analyzing the reconstructed region, it becomes apparent that our design’s generator structure enables MFCPopulus to predict missing points without requiring additional completion on correct input points. This distinction is particularly noticeable in PCN’s complementation results where excessive and incorrect predictions distort the generated outcomes. Further examination of reconstruction details reveals that point clouds generated by MFCPopulus tend to align with tree canopy growth trends. For instance, when encountering trunk bifurcation, rather than attempting complete bridging, MFCPopulus performs separate point cloud completions for each trunk while aligning them accurately with ground truth information. Additionally, compared to other methods which exhibit regional over−density or over−sparsity issues, MFCPopulus generates a more reasonable representation closely aligned with the ground truth by maintaining an appropriate point cloud density.
The specific details of the MFCPopulus prediction for the point cloud are depicted in Figure 10. In Figure 10a, the red section highlights the successful recovery of occluded portions within the top canopy point cloud, as observed in the reconstruction result shown in Figure 10b. Additionally, Figure 10c showcases the restoration of foliage and leaves at the intersection between the canopy and trunk, which were previously removed due to overlap with neighboring trees. This restoration is clearly demonstrated in the reconstruction result presented in Figure 10d. This particular segment of the point cloud enables precise retrieval of phenotypic characteristics for individual trees within plantation forests. Furthermore, both input (Figure 10e) and output (Figure 10f) sections exhibit preservation without any structural damage.
Furthermore, a thorough examination of the top view of the reconstruction results (Figure 11) reveals that, in the majority of cases, the MFCPopulus reconstruction results demonstrate a consistent distribution trend with respect to the ground truth. Although there are certain regions where the blue point cloud does not completely cover the red point cloud, an integrated analysis of their geometrical properties suggests that these points essentially occupy negligible volume. Consequently, this observation does not imply any failure on behalf of the MFCPopulus reconstruction results to accurately capture individual regions within the ground truth. Moreover, a subsequent numerical analysis confirms and supports the high level of reproducibility exhibited by our MFCPopulus reconstruction results.

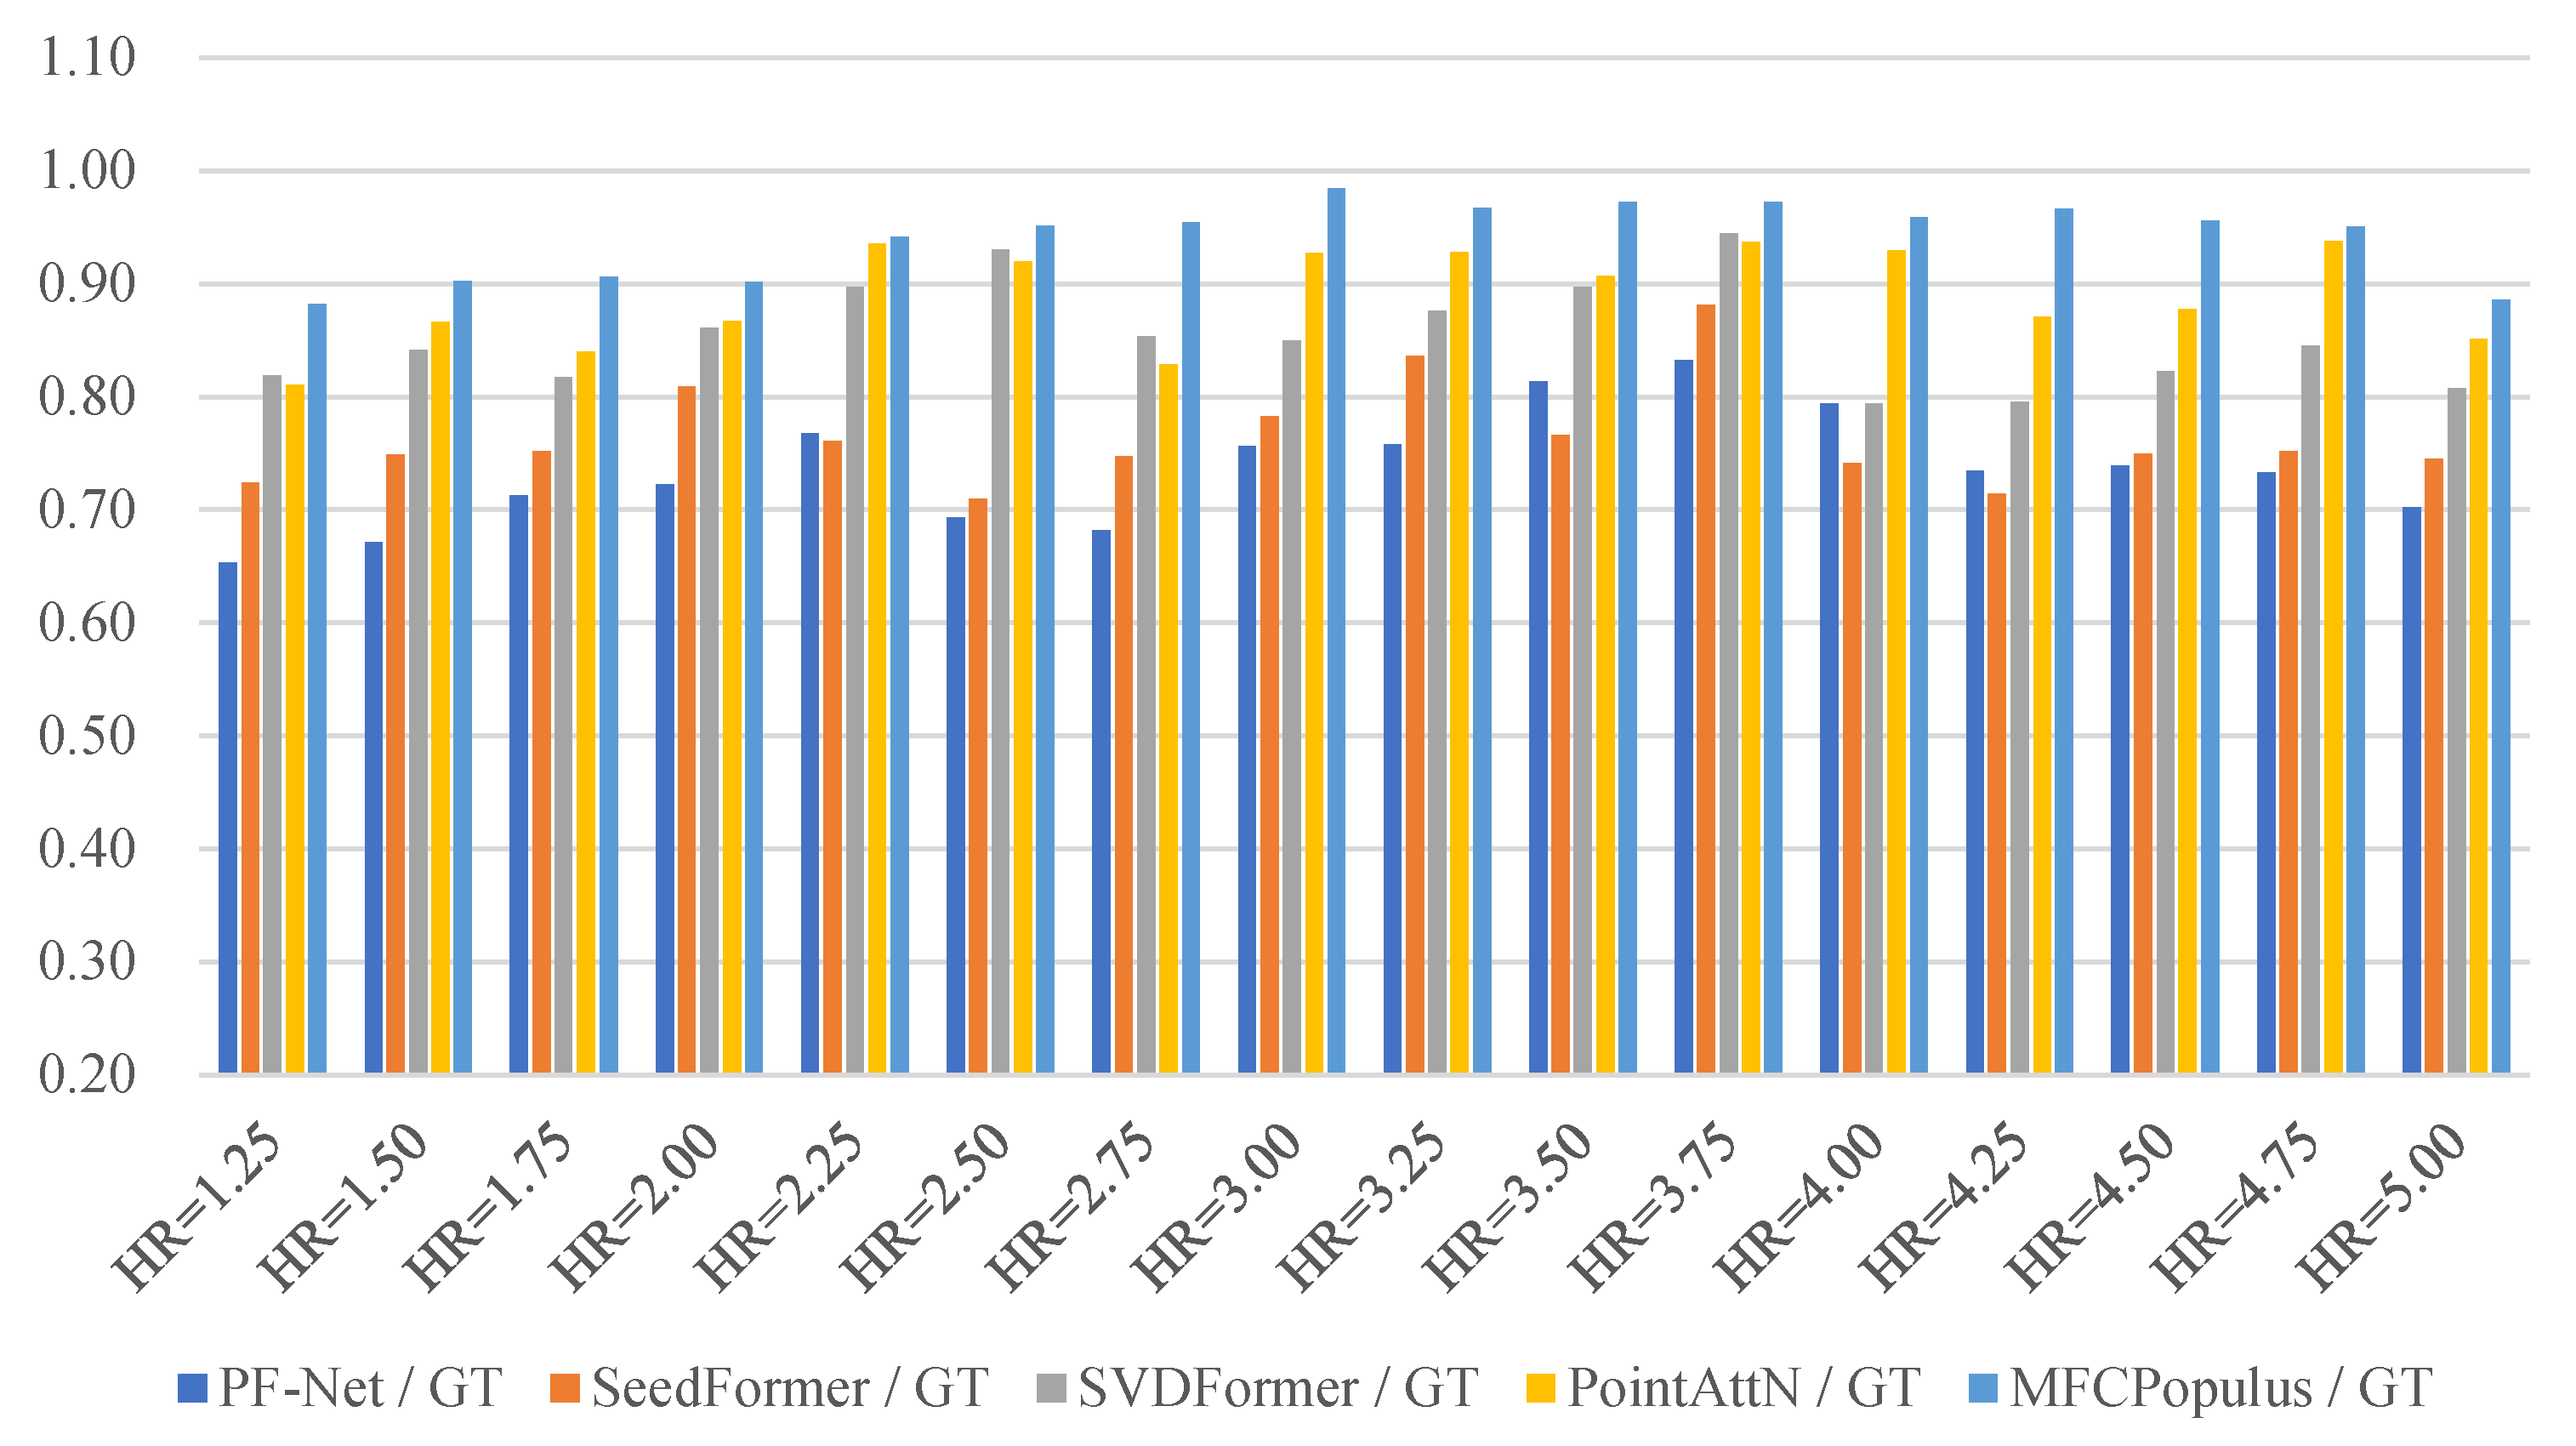
4.3. Quantitative Evaluations of Generating Differences

To assess the numerical accuracy of the MFCPopulus reconstruction results, we computed the differences between the reconstructed point clouds obtained from different methods and the ground truth point clouds using the aforementioned loss function. For our test set, we selected input samples in close proximity to various HR values, with each HR corresponding to 20 test trees. We then examined the mean and variance of difference values within each group. The experimental findings (Table 1) demonstrate that in 14 out of 16 groups for means and 15 groups for variances, MFCPopulus’s reconstruction results exhibited significant superiority over other methods; moreover, its overall mean aligned most consistently with the ground truth point cloud. The differences in loss functions between our MFCPopulus and other methods were individually calculated and averaged, revealing a significant average reduction of 23% in network loss variance. This demonstrates the remarkable stability of our MFCPopulus in generating results by effectively minimizing reconstruction variance, thereby rendering it more suitable for all types of Populus Tomentosa.

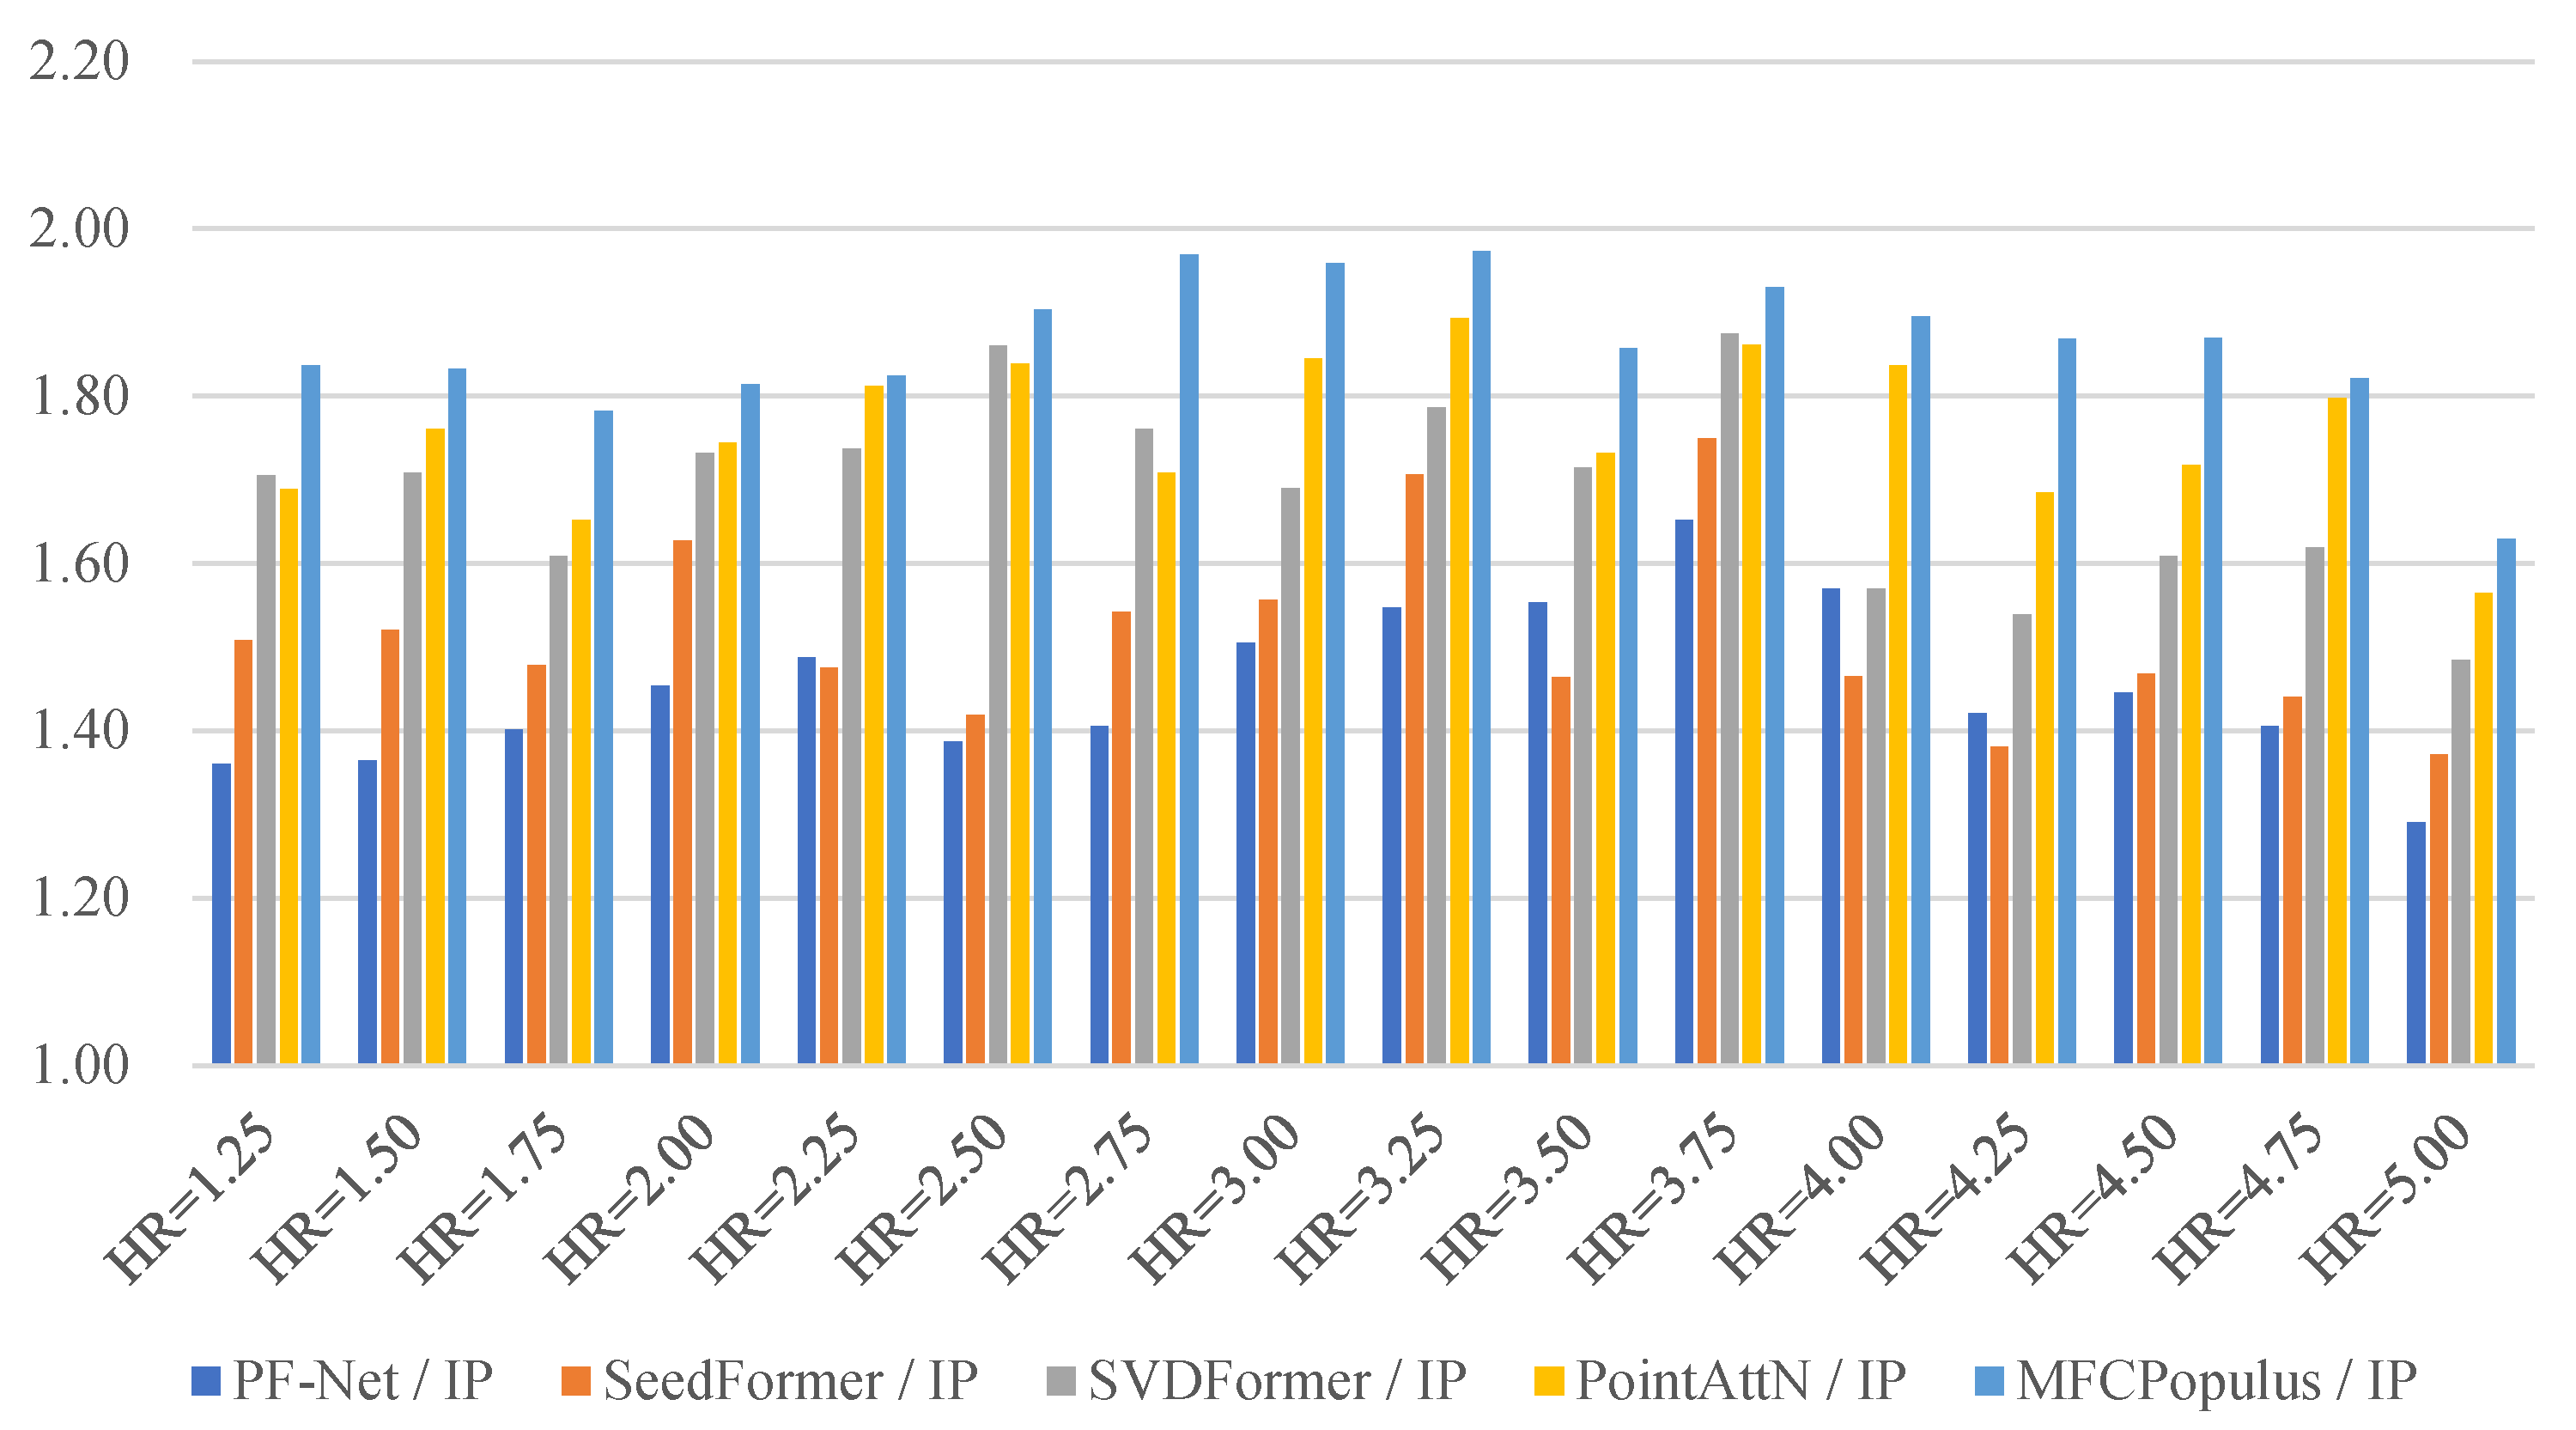
4.4. Point Cloud Utilization Efficiency Analysis

To quantitatively analyze the utilization of point cloud data by MFCPopulus, we conducted an Octree analysis of the point cloud reconstruction. Octrees are hierarchical data structures employed for representing three−dimensional space [59]. Each node in an Octree corresponds to a cubic volume element and has eight child nodes, where the volumes represented by these child nodes collectively constitute the volume of the parent node [60]. Octrees have found diverse applications in surface reconstruction [61,62,63], detailed rendering [64,65,66], and physics simulations [67,68,69]. In recent years, they have gained significant attention in point cloud deep learning research [70,71,72].
In our study, we employed the Octree structure to partition the spatial region containing individual trees into uniformly−sized cubic cells, referred to as cells. Subsequently, these cells are traversed to determine the presence of point cloud data within each one. Cells that contain data are considered valid voxels and retained, while those without data are flagged as invalid and discarded. The structural analysis of the point cloud is then quantified by counting the number of valid cells. This analysis was performed in CloudCompare using a wire Octree display mode with the display level set at 21.
In Figure 12, we show the ratio of cells in the reconstructed point cloud calculated using various methods to that of the ground truth. Similar to the previous sampling method, we randomly selected input samples with different HR values as the test set. Each HR value corresponds to 20 test samples, and the average ratio for each set was computed. Among all HR classifications, MFCPopulus’s reconstruction results exhibited a point cloud cell count closest to that of the ground truth, indicating its highest resemblance in terms of point cloud density. Moreover, when combined with previously calculated loss values, this further confirms the structural similarity between MFCPopulus reconstruction results and ground truth at an Octree level.
The ratio between the cells of the reconstructed point cloud and those of the input point cloud for the various methods previously described was calculated and is shown in Figure 13. Notably, MFCPopulus exhibits a significantly higher efficiency in utilizing and comprehensively understanding the feature information within the input point cloud, as evidenced by its nearly twofold increase in cell count compared to that of the input.
The sampling of structural features is pivotal in enhancing the network’s focus on tree canopy point clouds. We compared MFCPopulus with and without SSF, as well as other approaches. As shown in Table 2, when generating a fixed number of point clouds, the reconstructed crown point cloud volume in MFCPopulus with SSF demonstrates a significantly higher overall proportion. This suggests that the network prioritizes resource allocation for reconstructing the crown regions of trees.
It is evident that the extent of missing data significantly influences the effectiveness of completion. In the actual reconstruction process, the loss of the trunk, particularly in the lower part of branches, is infrequent. Therefore, this discussion primarily focuses on assessing how varying amounts of crown point cloud data in the input affect reconstruction outcomes. Table 3 presents MFCPopulus’ performance in reconstruction under different canopy missing ratios. The experiments demonstrate that when 50% of the crown point cloud was used as input, MFCPopulus achieved a morphological overlap with ground truth exceeding 78%.

4.5. Model Generalizability and Robustness Analysis

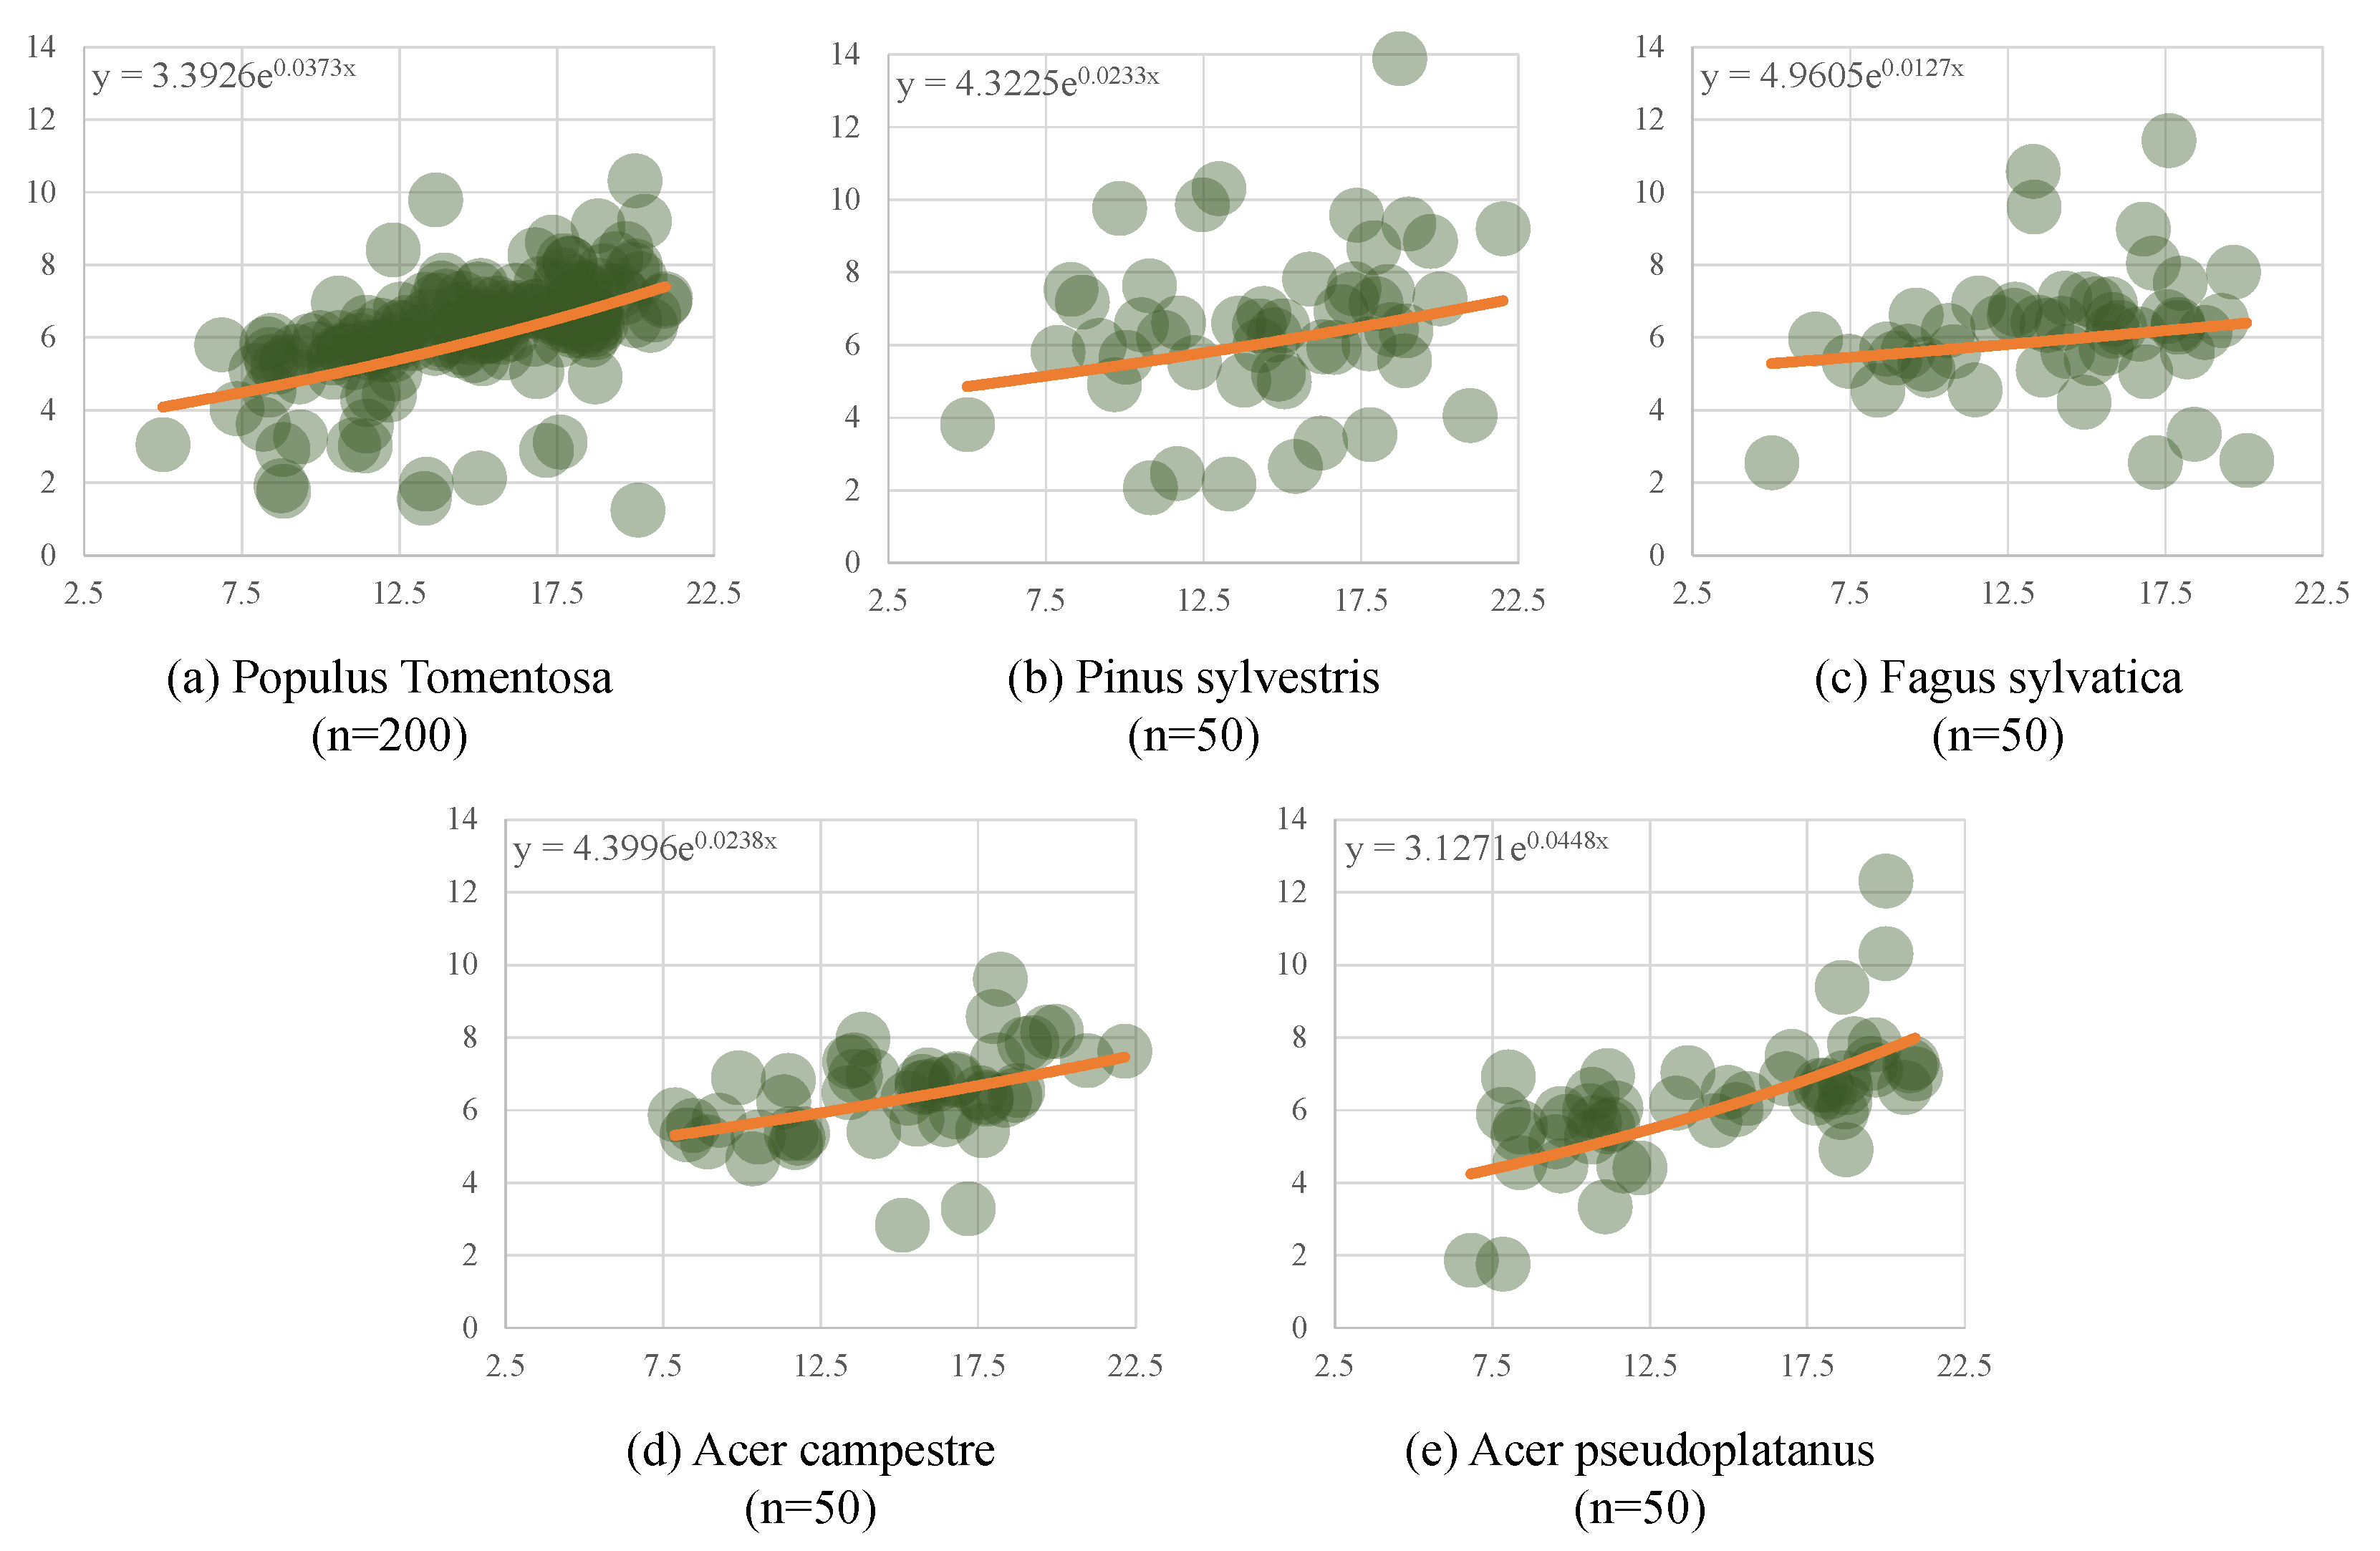
4.5.1. Cross−Species Application Scalability

While named for its specialization in Populus Tomentosa, the MFCPopulus framework exhibited high generalizability across tree species. Experiments on the FOR−species20K dataset (Figure 14) confirmed its robust performance on conifers (e.g., Pinus sylvestris) and broadleaf species (e.g., Fagus sylvatica), demonstrating that the multi−feature fusion strategy transcends genus−specific traits. We conducted experiments using the public dataset FOR−species20K [73], which encompasses the three main forest ecoregions in Europe and integrates 25 different datasets, including both open−source data and contributions from researchers primarily in Europe, as well as North America and Australia. The single−tree point cloud samples selected for this study were processed using the same methodology as MFCPopulus and trained under identical software and hardware conditions. Specifically, 50 trees with simulated damaged canopies were used for completion tasks, and their loss functions were calculated. As shown in Figure 14, compared to the test set of 200 Populus tomentosa trees, different tree species exhibited similar loss patterns at the same height distribution, consistent with the performance of MFCPopulus. Tree species with height distributions closely resembling those of Populus tomentosa showed greater applicability to the MFC network. These tests on the public dataset confirm that the MFC network can be effectively transferred and applied to various tree species, demonstrating a significant degree of general applicability.
While MFCPopulus was validated in uniformly spaced Populus plantations, its performance in mixed−species or irregularly spaced forests requires further investigation. For example, conifers with denser foliage may require adjustments to the canopy sampling rate, while competitive interactions in multi−species stands could alter trunk bifurcation patterns. Future work will integrate spacing metrics (e.g., neighborhood density index) and species−specific priors to enhance generalizability.

4.5.2. Sensitivity to Training Dataset Scale

To investigate the model’s robustness under data scarcity conditions, we systematically evaluated MFCPopulus’s performance across progressively reduced training subsets while preserving the original height−to−radius (HR) distribution ratios. As evidenced in Table 4, performance degradation remained remarkably contained even when trained on merely 30% of the original dataset (315 trees). The key metric of Chamfer distance (CD) exhibited a controlled increase from 7.807 (full dataset) to 8.921 at minimum scale, representing a modest 14.3% relative deterioration. Simultaneously, the structural complexity discrepancy metric (ΔDb) maintained biological validity with values consistently below the 0.15 threshold across all data scales.
This data−efficient behavior emerges from two synergistic architectural innovations. First, the multi−feature fusion mechanism establishes an information bottleneck that prioritizes biologically stable trunk morphology features (inherently lower−dimensional) to constrain the canopy completion process. Second, the adversarial training paradigm implements implicit phyto−mechanical regularization through its discriminator network, effectively compensating for sparse training samples by enforcing botanical growth patterns learned from the complete dataset. These design choices collectively enable MFCPopulus to maintain operational viability in data−constrained scenarios common in ecological studies, particularly when modeling rare or protected tree species with limited available samples.

5. Conclusions

We propose a generative adversarial network called MFCPopulus, designed specifically for the complementing of individual Populus Tomentosa trees through multi−feature fusion. Our MFCPopulus utilizes a generative adversarial network to extract tree features and reconstruct point cloud structures. This process incorporates feature structure sampling and multi−sampling rate feature extraction, drawing upon tree point cloud data collected from plantation forests. This method optimizes the process of reconstructing individual tree models from plantation forests and gives a novel deep learning−based method for generating point clouds in tree research. Compared to previous approaches, our MFCPopulus’s multi−sampling rate feature fusion network demonstrates superior ability to utilize point cloud information, resulting in more detailed features in the reconstructed tree canopy models. Additionally, our MFCPopulus preserves the integrity of the original point cloud, ensuring that the final completion accurately reflects the characteristics of individual trees. The experiment proved that multi−feature fusion characterization enables a more accurate representation of tree physiology, and the adversarial generated point clouds demonstrate efficacy in reconstructing the spatial structure of trees. The application of our MFCPopulus to plantation forestry provides a more precise means of studying trees, particularly concerning their physiological functions and ecological significance.

Author Contributions

Conceptualization, M.Y. and B.X.; Data curation, X.W. and Q.H.; Funding acquisition, B.X. and W.M.; Methodology, M.Y. and B.X.; Resources, B.X.; Software, H.L.; Validation, H.L., M.Y. and W.M.; Writing−original draft, H.L.; Writing−review and editing, C.X. and W.M. All authors have read and agreed to the published version of the manuscript.

Funding

This research was funded in part by the National Natural Science Foundation of China (Nos. 32271983, 62376271, U22B2034, 62262043, 62172416, and 62365014), in part by Beijing Natural Science Foundation (No. L241056), and in part by 5·5 Engineering Research & Innovation Team Project of Beijing Forestry University (No. BLRC2023C05).

Data Availability Statement

The data presented in this study were partly sourced from the following publicly available resource: https://zenodo.org/records/13255198 (accessed on 6 December 2024). Additional data supporting the conclusions of this study are available from the author upon reasonable request.

Acknowledgments

We would like to express our gratitude to the reviewers for their insightful comments and suggestions. We would also like to extend our gratitude to the students from Beijing Forestry University, including Yutong Zhang and Xingyu Shen, for their contributions to the scanning and provision of forest data.

Conflicts of Interest

The authors declare no conflicts of interest.

References

  1. Rishmawi, K.; Huang, C.; Zhan, X. Monitoring Key Forest Structure Attributes across the Conterminous United States by Integrating GEDI LiDAR Measurements and VIIRS Data. Remote Sens. 2021, 13, 442. [Google Scholar] [CrossRef]
  2. Wang, S.; Kobayashi, K.; Takanashi, S.; Liu, C.P.; Li, D.R.; Chen, S.W.; Cheng, Y.T.; Moriguchi, K.; Dannoura, M. Estimating divergent forest carbon stocks and sinks via a knife set approach. J. Environ. Manag. 2023, 330, 117114. [Google Scholar] [CrossRef] [PubMed]
  3. Saatchi, S.S.; Harris, N.L.; Brown, S.; Lefsky, M.; Mitchard, E.T.A.; Salas, W.; Zutta, B.R.; Buermann, W.; Lewis, S.L.; Hagen, S.; et al. Benchmark map of forest carbon stocks in tropical regions across three continents. Proc. Natl. Acad. Sci. USA 2011, 108, 9899–9904. [Google Scholar] [CrossRef]
  4. Wallace, L.; Hillman, S.; Reinke, K.; Hally, B. Non-destructive estimation of above-ground surface and near-surface biomass using 3D terrestrial remote sensing techniques. Methods Ecol. Evol. 2017, 8, 1607–1616. [Google Scholar] [CrossRef]
  5. Wu, Y.; Sang, M.; Wang, W. A Novel Ground Filtering Method for Point Clouds in a Forestry Area Based on Local Minimum Value and Machine Learning. Appl. Sci. 2022, 12, 9113. [Google Scholar] [CrossRef]
  6. Chen, X.; Jiang, K.; Zhu, Y.; Wang, X.; Yun, T. Individual Tree Crown Segmentation Directly from UAV-Borne LiDAR Data Using the PointNet of Deep Learning. Forests 2021, 12, 131. [Google Scholar] [CrossRef]
  7. Wang, Y.; Liu, H.; Sang, L.; Wang, J. Characterizing Forest Cover and Landscape Pattern Using Multi-Source Remote Sensing Data with Ensemble Learning. Remote Sens. 2022, 14, 5470. [Google Scholar] [CrossRef]
  8. Du, L.; Pang, Y.; Wang, Q.; Huang, C.; Bai, Y.; Chen, D.; Lu, W.; Kong, D. A LiDAR biomass index-based approach for tree- and plot-level biomass mapping over forest farms using 3D point clouds. Remote Sens. Environ. 2023, 290, 113543. [Google Scholar] [CrossRef]
  9. Wang, C.; Morgan, G.; Hodgson, M. sUAS for 3D Tree Surveying: Comparative Experiments on a Closed-Canopy Earthen Dam. Forests 2021, 12, 659. [Google Scholar] [CrossRef]
  10. Kim, J.; Cho, H. Efficient modeling of numerous trees by introducing growth volume for real-time virtual ecosystems. Comput. Animat. Virtual Worlds 2012, 23, 155–165. [Google Scholar] [CrossRef]
  11. Spadavecchia, C.; Belcore, E.; Piras, M.; Kobal, M. An Automatic Individual Tree 3D Change Detection Method for Allometric Parameters Estimation in Mixed Uneven-Aged Forest Stands from ALS Data. Remote Sens. 2022, 14, 4666. [Google Scholar] [CrossRef]
  12. Latifi, H.; Valbuena, R.; Silva, C.A. Towards complex applications of active remote sensing for ecology and conservation. Methods Ecol. Evol. 2023, 14, 1578–1586. [Google Scholar] [CrossRef]
  13. Chave, J.; Andalo, C.; Brown, S.; Cairns, M.A.; Chambers, J.Q.; Eamus, D.; Fölster, H.; Fromard, F.; Higuchi, N.; Kira, T.; et al. Tree allometry and improved estimation of carbon stocks and balance in tropical forests. Oecologia 2005, 145, 87–99. [Google Scholar] [CrossRef]
  14. Fedorov, N.; Bikbaev, I.; Shirokikh, P.; Zhigunova, S.; Tuktamyshev, I.; Mikhaylenko, O.; Martynenko, V.; Kulagin, A.; Giniyatullin, R.; Urazgildin, R.; et al. Estimation of Carbon Stocks of Birch Forests on Abandoned Arable Lands in the Cis-Ural Using Unmanned Aerial Vehicle-Mounted LiDAR Camera. Forests 2023, 14, 2392. [Google Scholar] [CrossRef]
  15. Dean, C.; Kirkpatrick, J.; Osborn, J.; Doyle, R.; Fitzgerald, N.; Roxburgh, S. Novel 3D geometry and models of the lower regions of large trees for use in carbon accounting of primary forests. AoB Plants 2018, 10, ply015. [Google Scholar] [CrossRef] [PubMed]
  16. Okura, F. 3D modeling and reconstruction of plants and trees: A cross-cutting review across computer graphics, vision, and plant phenotyping. Breed. Sci. 2022, 72, 31–47. [Google Scholar] [CrossRef]
  17. Rengarajan, R.; Schott, J.R. Modeling and Simulation of Deciduous Forest Canopy and Its Anisotropic Reflectance Properties Using the Digital Image and Remote Sensing Image Generation (DIRSIG) Tool. IEEE J. Sel. Top. Appl. Earth Obs. Remote Sens. 2017, 10, 4805–4817. [Google Scholar] [CrossRef]
  18. Mei, J.; Zhang, L.; Wu, S.; Wang, Z.; Zhang, L. 3D tree modeling from incomplete point clouds via optimization and L1-MST. Int. J. Geogr. Inf. Sci. 2017, 31, 999–1021. [Google Scholar] [CrossRef]
  19. ITAKURA, K.; HOSOI, F. Automatic individual tree detection and canopy segmentation from three-dimensional point cloud images obtained from ground-based lidar. J. Agric. Meteorol. 2018, 74, 109–113. [Google Scholar] [CrossRef]
  20. Panagiotidis, D.; Abdollahnejad, A.; Slavík, M. 3D point cloud fusion from UAV and TLS to assess temperate managed forest structures. Int. J. Appl. Earth Obs. Geoinf. 2022, 112, 102917. [Google Scholar] [CrossRef]
  21. Tai, H.; Xia, Y.; Yan, M.; Li, C.; Kong, X. Construction of Artificial Forest Point Clouds by Laser SLAM Technology and Estimation of Carbon Storage. Appl. Sci. 2022, 12, 10838. [Google Scholar] [CrossRef]
  22. Cao, W.; Wu, J.; Shi, Y.; Chen, D. Restoration of Individual Tree Missing Point Cloud Based on Local Features of Point Cloud. Remote Sens. 2022, 14, 1346. [Google Scholar] [CrossRef]
  23. Xu, D.; Chen, G.; Jing, W. A Single-Tree Point Cloud Completion Approach of Feature Fusion for Agricultural Robots. Electronics 2023, 12, 1296. [Google Scholar] [CrossRef]
  24. Yang, T.; Ye, J.; Zhou, S.; Xu, A.; Yin, J. 3D reconstruction method for tree seedlings based on point cloud self-registration. Comput. Electron. Agric. 2022, 200, 107210. [Google Scholar] [CrossRef]
  25. Wang, G.; Laga, H.; Xie, N.; Jia, J.; Tabia, H. The Shape Space of 3D Botanical Tree Models. ACM Trans. Graph. 2018, 37, 1–18. [Google Scholar] [CrossRef]
  26. Tang, S.; Ao, Z.; Li, Y.; Huang, H.; Xie, L.; Wang, R.; Wang, W.; Guo, R. TreeNet3D: A large scale tree benchmark for 3D tree modeling, carbon storage estimation and tree segmentation. Int. J. Appl. Earth Obs. Geoinf. 2024, 130, 103903. [Google Scholar] [CrossRef]
  27. Lin, T.Y.; Dollar, P.; Girshick, R.; He, K.; Hariharan, B.; Belongie, S. Feature Pyramid Networks for Object Detection. In Proceedings of the IEEE Conference on Computer Vision and Pattern Recognition, Honolulu, HI, USA, 21–26 July 2017. [Google Scholar] [CrossRef]
  28. Han, X.; Li, Z.; Huang, H.; Kalogerakis, E.; Yu, Y. High-Resolution Shape Completion Using Deep Neural Networks for Global Structure and Local Geometry Inference. In Proceedings of the IEEE International Conference on Computer Vision (ICCV), Venice, Italy, 22–29 October 2017. [Google Scholar] [CrossRef]
  29. Nazir, D.; Afzal, M.Z.; Pagani, A.; Liwicki, M.; Stricker, D. Contrastive Learning for 3D Point Clouds Classification and Shape Completion. Sensors 2021, 21, 7392. [Google Scholar] [CrossRef]
  30. Charles, R.Q.; Su, H.; Kaichun, M.; Guibas, L.J. PointNet: Deep Learning on Point Sets for 3D Classification and Segmentation. In Proceedings of the IEEE Conference on Computer Vision and Pattern Recognition (CVPR), Honolulu, HI, USA, 21–26 July 2017. [Google Scholar] [CrossRef]
  31. Qi, C.; Yi, L.; Su, H.; Guibas, L.J. PointNet++: Deep Hierarchical Feature Learning on Point Sets in a Metric Space. In Proceedings of the 31st Conference on Neural Information Processing Systems, Long Beach, CA, USA, 4–9 December 2017. [Google Scholar]
  32. Achlioptas, P.; Diamanti, O.; Mitliagkas, I.; Guibas, L. Learning representations and generative models for 3d point clouds. In Proceedings of the International Conference on Machine Learning, PMLR, Stockholm, Sweden, 10–15 July 2018; pp. 40–49. [Google Scholar]
  33. Yang, Y.; Feng, C.; Shen, Y.; Tian, D. FoldingNet: Point Cloud Auto-Encoder via Deep Grid Deformation. In Proceedings of the IEEE/CVF Conference on Computer Vision and Pattern Recognition, Salt Lake City, UT, USA, 18–22 June 2018. [Google Scholar] [CrossRef]
  34. Yuan, W.; Khot, T.; Held, D.; Mertz, C.; Hebert, M. PCN: Point Completion Network. In Proceedings of the International Conference on 3D Vision, Verona, Italy, 5–8 September 2018. [Google Scholar] [CrossRef]
  35. Sarmad, M.; Lee, H.; Kim, Y. RL-GAN-Net: A Reinforcement Learning Agent Controlled GAN Network for Real-Time Point Cloud Shape Completion. In Proceedings of the 2019 IEEE/CVF Conference on Computer Vision and Pattern Recognition, Long Beach, CA, USA, 15–20 June 2019. [Google Scholar] [CrossRef]
  36. Huang, Z.; Yu, Y.; Xu, J.; Ni, F.; Le, X. PF-Net: Point Fractal Network for 3D Point Cloud Completion. In Proceedings of the IEEE/CVF Conference on Computer Vision and Pattern Recognition, Seattle, WA, USA, 14–19 June 2020. [Google Scholar] [CrossRef]
  37. Vaswani, A.; Shazeer, N.; Parmar, N.; Uszkoreit, J.; Jones, L.; Gomez, A.N.; Kaiser, L.; Polosukhin, I. Attention is All you Need. In Proceedings of the Advances in Neural Information Processing Systems, Long Beach, CA, USA, 4–9 December 2017. [Google Scholar]
  38. Zhou, H.; Cao, Y.; Chu, W.; Zhu, J.; Lu, T.; Tai, Y.; Wang, C. SeedFormer: Patch Seeds Based Point Cloud Completion with Upsample Transformer. In Lecture Notes in Computer Science; Springer: Berlin/Heidelberg, Germany, 2022; pp. 416–432. [Google Scholar] [CrossRef]
  39. Zhu, Z.; Chen, H.; He, X.; Wang, W.; Qin, J.; Wei, M. SVDFormer: Complementing Point Cloud via Self-view Augmentation and Self-structure Dual-generator. In Proceedings of the 2023 IEEE/CVF International Conference on Computer Vision (ICCV), Paris, France, 1–6 October 2023; pp. 14462–14472. [Google Scholar] [CrossRef]
  40. Wang, J.; Cui, Y.; Guo, D.; Li, J.; Liu, Q.; Shen, C. PointAttN: You Only Need Attention for Point Cloud Completion. Proc. AAAI Conf. Artif. Intell. 2024, 38, 5472–5480. [Google Scholar] [CrossRef]
  41. Liu, J.; Li, D.; Fernández, J.E.; Coleman, M.; Hu, W.; Di, N.; Zou, S.; Liu, Y.; Xi, B.; Clothier, B. Variations in water-balance components and carbon stocks in poplar plantations with differing water inputs over a whole rotation: Implications for sustainable forest management under climate change. Agric. For. Meteorol. 2022, 320, 108958. [Google Scholar] [CrossRef]
  42. Rusu, R.B.; Cousins, S. 3D is here: Point Cloud Library (PCL). In Proceedings of the 2011 IEEE International Conference on Robotics and Automation, Shanghai, China, 9–13 May 2011. [Google Scholar] [CrossRef]
  43. Kaehler, A.; Bradski, G. Learning OpenCV 3: Computer Vision in C++ with the OpenCV Library; O’Reilly Media: Sebastopol, CA, USA, 2016. [Google Scholar]
  44. Besl, P.; McKay, N.D. A method for registration of 3-D shapes. IEEE Trans. Pattern Anal. Mach. Intell. 1992, 14, 239–256. [Google Scholar] [CrossRef]
  45. Maindonald, J. Pattern Recognition and Machine Learning. J. Stat. Softw. 2015, 17, 1–3. [Google Scholar] [CrossRef]
  46. Li, C.L.; Zaheer, M.; Zhang, Y.; Póczos, B.; Salakhutdinov, R. Point Cloud GAN. In Proceedings of the International Conference on Learning Representations, Vancouver, BC, Canada, 30 April–3 May 2018. [Google Scholar]
  47. Goodfellow, I.; Pouget-Abadie, J.; Mirza, M.; Xu, B.; Warde-Farley, D.; Ozair, S.; Courville, A.; Bengio, Y. Generative Adversarial Nets. J. Jpn. Soc. Fuzzy Theory Intell. Inform. 2017, 177. [Google Scholar] [CrossRef]
  48. West, G.B.; Enquist, B.J.; Brown, J.H. A general quantitative theory of forest structure and dynamics. Proc. Natl. Acad. Sci. USA 2009, 106, 7040–7045. [Google Scholar] [CrossRef] [PubMed]
  49. Seidel, D.; Ehbrecht, M.; Dorji, Y.; Jambay, J.; Ammer, C.; Annighöfer, P. Identifying architectural characteristics that determine tree structural complexity. Trees 2019, 33, 911–919. [Google Scholar] [CrossRef]
  50. Mandelbrot, B.B. The Fractal Geometry of Nature; W.H. Freeman Company: New York, NY, USA, 1977. [Google Scholar]
  51. Sugihara, G.; May, R.M. Applications of fractals in ecology. Trends Ecol. Evol. 1990, 5, 79–86. [Google Scholar] [CrossRef]
  52. Seidel, D. A holistic approach to determine tree structural complexity based on laser scanning data and fractal analysis. Ecol. Evol. 2018, 8, 128–134. [Google Scholar] [CrossRef]
  53. Dorji, Y.; Annighöfer, P.; Ammer, C.; Seidel, D. Response of Beech (Fagus sylvatica L.) Trees to Competition—New Insights from Using Fractal Analysis. Remote Sens. 2019, 11, 2656. [Google Scholar] [CrossRef]
  54. Dorji, Y.; Isasa, E.; Pierick, K.; Cabral, J.; Tobgay, T.; Annighöfer, P.; Schuldt, B.; Seidel, D. Insights into the relationship between hydraulic safety, hydraulic efficiency and tree structural complexity from terrestrial laser scanning and fractal analysis. Trees 2024, 38, 221–239. [Google Scholar] [CrossRef]
  55. Dorji, Y.; Schuldt, B.; Neudam, L.; Dorji, R.; Middleby, K.; Isasa, E.; Körber, K.; Ammer, C.; Annighöfer, P.; Seidel, D. Three-dimensional quantification of tree architecture from mobile laser scanning and geometry analysis. Trees 2021, 35, 1385–1398. [Google Scholar] [CrossRef]
  56. Arseniou, G.; MacFarlane, D.W.; Seidel, D. Measuring the Contribution of Leaves to the Structural Complexity of Urban Tree Crowns with Terrestrial Laser Scanning. Remote Sens. 2021, 13, 2773. [Google Scholar] [CrossRef]
  57. Sarkar, N.; Chaudhuri, B. An efficient differential box-counting approach to compute fractal dimension of image. IEEE Trans. Syst. Man Cybern. 1994, 24, 115–120. [Google Scholar] [CrossRef]
  58. Seidel, D.; Annighöfer, P.; Stiers, M.; Zemp, C.D.; Burkardt, K.; Ehbrecht, M.; Willim, K.; Kreft, H.; Hölscher, D.; Ammer, C. How a measure of tree structural complexity relates to architectural benefit-to-cost ratio, light availability, and growth of trees. Ecol. Evol. 2019, 9, 7134–7142. [Google Scholar] [CrossRef] [PubMed]
  59. Koh, N.; Jayaraman, P.K.; Zheng, J. Truncated octree and its applications. Vis. Comput. 2022, 38, 1167–1179. [Google Scholar] [CrossRef]
  60. Meagher, D. Geometric modeling using octree encoding. Comput. Graph. Image Process. 1982, 19, 129–147. [Google Scholar] [CrossRef]
  61. Kazhdan, M.; Hoppe, H. Screened poisson surface reconstruction. ACM Trans. Graph. 2013, 32, 1–13. [Google Scholar] [CrossRef]
  62. Wang, P.S.; Liu, Y.; Tong, X. Dual Octree Graph Networks for Learning Adaptive Volumetric Shape Representations. ACM Trans. Graph. 2022, 41, 1–15. [Google Scholar] [CrossRef]
  63. Mi, Z.; Luo, Y.; Tao, W. SSRNet: Scalable 3D Surface Reconstruction Network. In Proceedings of the IEEE/CVF Conference on Computer Vision and Pattern Recognition, Seattle, WA, USA, 14–19 June 2020. [Google Scholar] [CrossRef]
  64. Zhang, Y. The D-FCM partitioned D-BSP tree for massive point cloud data access and rendering. ISPRS J. Photogramm. Remote Sens. 2016, 120, 25–36. [Google Scholar] [CrossRef]
  65. Roth, T.; Weier, M.; Bauszat, P.; Hinkenjann, A.; Li, Y. Hash-Based Hierarchical Caching and Layered Filtering for Interactive Previews in Global Illumination Rendering. Computers 2020, 9, 17. [Google Scholar] [CrossRef]
  66. Max, N.; Duff, T.; Mildenhall, B.; Yan, Y. Approximations for the distribution of microflake normals. Vis. Comput. 2018, 34, 443–457. [Google Scholar] [CrossRef]
  67. Schauer, J.; Nüchter, A. Collision detection between point clouds using an efficient k-d tree implementation. Adv. Eng. Inform. 2015, 29, 440–458. [Google Scholar] [CrossRef]
  68. Teunissen, J.; Ebert, U. Afivo: A framework for quadtree/octree AMR with shared-memory parallelization and geometric multigrid methods. Comput. Phys. Commun. 2018, 233, 156–166. [Google Scholar] [CrossRef]
  69. Xu, S.; Gao, B.; Lofquist, A.; Fernando, M.; Hsu, M.C.; Sundar, H.; Ganapathysubramanian, B. An octree-based immersogeometric approach for modeling inertial migration of particles in channels. Comput. Fluids 2021, 214, 104764. [Google Scholar] [CrossRef]
  70. Que, Z.; Lu, G.; Xu, D. VoxelContext-Net: An Octree based Framework for Point Cloud Compression. In Proceedings of the IEEE/CVF Conference on Computer Vision and Pattern Recognition, Virtual, 19–25 June 2021. [Google Scholar] [CrossRef]
  71. Gouda, M.; Mirza, J.; Weiß, J.; Ribeiro Castro, A.; El-Basyouny, K. Octree-based point cloud simulation to assess the readiness of highway infrastructure for autonomous vehicles. Comput.-Aided Civ. Infrastruct. Eng. 2021, 36, 922–940. [Google Scholar] [CrossRef]
  72. Wang, P.S. OctFormer: Octree-based Transformers for 3D Point Clouds. ACM Trans. Graph. 2023, 42, 1–11. [Google Scholar] [CrossRef]
  73. Puliti, S.; Lines, E.R.; Müllerová, J.; Frey, J.; Schindler, Z.; Straker, A.; Allen, M.J.; Winiwarter, L.; Rehush, N.; Hristova, H.; et al. Benchmarking tree species classification from proximally-sensed laser scanning data: Introducing the FOR-species20K dataset. arXiv 2024, arXiv:2408.06507. [Google Scholar]
Figure 1. The extraction of individual tree point clouds from larger scanned datasets remains a formidable challenge in current research. Manually delineating the boundaries of each tree’s canopy poses a significant challenge, primarily due to (a) overlapping canopies that result in boundary ambiguity. Even after manual segmentation, issues such as (b) under−segmentation, where point clouds from adjacent trees become mixed together, and (c) over−segmentation, where certain portions of the tree canopy are overlooked, persist commonly. Moreover, limitations imposed by the scanning range of UAV LiDAR necessitate (d) cropping canopies near the scan boundary and (e) lead to substantial data loss.
Forests 16 00635 g001
Figure 2. The study site is located in the North Plain of China. (a) Location of Qingping State−owned Old City Forestry (36°48’ N, 116°05’ E) in Gaotang County, Liaocheng City, Shandong Province, China. (b) Aerial photograph of the forest field with the study area boxed out. (c) Aerial photograph of the study subject Populus Tomentosa.
Forests 16 00635 g002
Figure 3. The process of acquiring experimental data from the point cloud of a Populus Tomentosa plantation forest. (a) UAV LiDAR scanning of three−row plantation blocks. (be) Processing workflow for 1050 manually segmented trees, including ground filtering, noise removal, and trunk−canopy separation.
Forests 16 00635 g003
Figure 4. Distribution patterns of Populus Tomentosa height and clear bole height in the experimental site were examined: the relationship between total tree height and clear bole height (ground to first living branch). The height ratio (HR) reflects crown−to−bole proportion, a key determinant of plantation management strategies. The larger dot area on the graph indicates a higher HR value for each sample, thereby providing a foundation for subsequent classification discussions.
Forests 16 00635 g004
Figure 5. Structural feature sampling of individual tree. The point cloud segmented from the plantation forest underwent structural characteristics split (SCS), with separate processing of the crown and trunk using high and low Farthest Point Sampling (FPS) techniques, respectively. Subsequently, the processed structural features were outputted through structural characteristics collocation (SCC).
Forests 16 00635 g005
Figure 6. The architecture of MFCPopulus. (a) Point cloud data are acquired from a simulated Populus Tomentosa forest, as detailed in Section 3.2. (b) Structural characteristics split (SCS) and structural characteristics collocation (SCC) are employed to sample the canopy and trunk point clouds, respectively, as described in Section 3.3. (c) Farthest Point Sampling (FPS) generates three point clouds at varying sampling rates, which are integrated into multilayer features through hierarchical layers Li (Section 3.4) to produce the latent vector Vi. (d) The generation process (Section 3.5) outputs reconstruction results across three feature layers Fi, culminating in the final predictions Pi. The ground truth (GT) is produced as Gi following the FPS. (e) The discriminator (Section 3.6) utilizes a comprehensive loss function CDi to distinguish between the reconstructed results and the GT, where i = 1 ,   2 ,   3 .
Forests 16 00635 g006
Figure 7. Multi−sampling feature fusion process. Take three−layer fusion as an example. Li (i = 1, 2, 3) denotes the multi−sampling rate’s hierarchical layer, Nj (j = 1, 2, 3) denotes the number of sampling centers, M denotes the number of sampling groups, Ch (h = 1, 2, 3) denotes the point feature, and Vk (k = 1, 2, 3) denotes the corresponding latent vector of the point cloud at high, medium, and low sampling rates. N3 = 1, C3 = Vk when three hierarchical multi−sampling feature fusion is performed.
Forests 16 00635 g007
Figure 8. Comparison of MFCPopulus with other methods for individual tree crown reconstruction. From left to right: input, PF−Net [37], SeedFormer [39], SVDFormer [40], PointAttN [41], MFCPopulus, and ground truth (GT). It can be seen intuitively that the five methods have different tendencies to process the input point cloud, with our MFCPopulus and ground truth being more closely aligned in terms of the tree’s external profile.
Forests 16 00635 g008
Figure 9. The Db values of the ground truth (GT), MFCPopulus (MFC), and other methods are compared. PFN, SF, SVDF, and PAN represent PF−Net, SeedFormer, SVDFormer, and PointAttN, respectively. The height ratio (HR) was divided into 16 sets, with 15 trees sampled from each set to calculate the mean value. A smaller difference between generated values and ground truth indicates a closer match in the structural complexity of the trees.
Forests 16 00635 g009
Figure 10. Detailed display of Populus Tomentosa reconstruction by MFCPopulus. The point clouds (ac) in the left column represent the input data, while their corresponding complementary outputs are represented by point clouds (df) in the right column.
Forests 16 00635 g010
Figure 11. The top−down perspective of the reconstruction results demonstrates the high degree of spatial alignment between the MFCPopulus reconstruction and the ground truth. Sixteen trees were sampled within the primary distribution of HR to illustrate the disparity between the MFCPopulus reconstruction outcomes (depicted by blue points) and the ground truth (represented by red points) across each HR interval. A reduced number of red dots, or a consistent pattern in the arrangement of red and blue dots, signifies an improved reconstruction.
Forests 16 00635 g011
Figure 12. A reconstruction of the accurate ratio of effective point cloud cells in relation to the ground truth (GT) for a comprehensive evaluation. The closer the ratio approaches 1, the higher the quality of the point cloud reconstruction.
Forests 16 00635 g012
Figure 13. The effective point cloud cell ratio of the complete point cloud to the input (IP) is reconstructed, as it serves as an indicator of the method’s utilization efficiency. A higher ratio signifies a greater extent of utilization of the input point cloud by the method.
Forests 16 00635 g013
Figure 14. Generalizability of MFCPopulus across broadleaf and coniferous species in the FOR−species20K dataset. Scatter plots show height vs. reconstruction loss for (a) Populus Tomentosa (broadleaf), (b) Pinus sylvestris (conifer), (c) Fagus sylvatica (broadleaf), (d) Acer campestre (broadleaf), and (e) Acer pseudoplatanus (broadleaf). The x−axis represents tree height in meters, while the y−axis indicates the loss difference scaled by a factor of 1000. The variable n denotes the number of trees used for testing. Specifically, the samples for Populus Tomentosa in (a) were derived from a self−compiled dataset from our previous study, whereas the tree species in (be) were obtained from the public FOR−species20K dataset [73]. Consistent with MFCPopulus, the same dataset processing and training procedures were employed.
Forests 16 00635 g014
Table 1. A comparison of the mean and variance in loss calculations across different height ratio (HR) distributions was conducted. For each HR, 20 approximate test samples were selected for evaluation, scaled by a factor of 1000. The mean values across all categories were computed and are presented in the final row of the table. The loss values corresponding to the methods with smaller loss differences at the same HR level are highlighted in bold.
HRPF−NetSeedFormerSVDFormerPointAttNMFCPopulus
1.2515.246/4.39214.308/2.49610.556/1.83010.395/1.7499.595/1.197
1.5011.932/2.87910.060/2.4758.911/1.5099.722/1.1078.238/1.071
1.7513.251/3.62512.371/2.8259.267/2.4488.302/2.4708.297/2.158
2.0014.761/3.77111.584/2.24312.344/1.71310.230/1.2139.787/1.308
2.2510.667/3.77010.134/1.4158.401/1.7766.762/1.0025.953/0.961
2.509.810/1.6418.052/1.1449.438/1.2217.516/0.9736.165/0.369
2.759.834/2.08510.749/2.2298.699/2.3838.695/1.8097.403/1.097
3.0010.103/2.3689.870/1.5538.399/1.4549.703/1.4626.221/0.907
3.258.902/1.9255.236/2.2495.692/2.0315.972/1.5744.670/1.216
3.508.242/2.1496.690/1.8026.824/1.0886.045/1.0695.492/0.687
3.759.580/1.8019.531/1.6597.137/1.43412.908/1.8168.472/1.229
4.0013.139/3.37010.221/2.4487.333/2.6036.871/1.9895.498/1.357
4.2511.006/3.65411.288/2.5059.118/1.1448.644/0.9336.430/0.769
4.5015.171/3.48313.961/1.50110.991/2.42210.412/1.06210.229/0.900
4.7514.645/1.40112.582/1.58112.320/1.59711.601/1.24410.794/1.042
5.0017.501/3.61713.995/1.68012.721/1.31210.305/1.95811.663/1.077
Mean12.11210.6659.2599.0057.807
Table 2. The proportion of the reconstructing point cloud volume in the reconstruction results of each method is presented. SSF denotes the sampling of structural features. At the same HR level, the proportion corresponding to the method with a higher point cloud reconstruction ratio is highlighted in bold.
MethodsProportion of Crown Point Cloud Volume (%)
HR = 1.5 HR = 2.5 HR = 3.5 HR = 4.5 Mean
PF−Net66.277.662.956.865.9
SeedFormer79.873.073.474.975.3
SVDFormer87.580.776.779.081.0
PointAttN86.481.072.487.581.8
MFCPopulus (with out SSF)93.192.087.385.689.5
MFCPopulus (with SSF)97.494.693.592.594.5
Table 3. The performance of our MFCPopulus reconstruction effect under varying canopy missing ratios. Here, MFCPopulus/GT indicates the proportion of the output point cloud that overlaps with the ground truth.
Missing RatioMFCPopulus/GT
HR = 1.5 HR = 2.5 HR = 3.5 HR = 4.5 Mean
90%0.9750.9540.9300.9270.947
80%0.9630.9540.9380.9260.945
70%0.8470.8350.8440.8230.837
60%0.8670.8540.7270.7940.811
50%0.8490.7510.7810.7750.789
40%0.5340.4380.5870.4480.502
30%0.3710.2660.3450.2520.309
Table 4. Performance comparison under reduced training dataset scales. The number in parentheses following “Dataset Scale” indicates the precise count of trees included in the dataset.
Dataset ScaleCD Loss (×1000)ΔDbCanopy Coverage Ratio (%)
100% (1050)7.8070.1294.5
50% (525)8.4390.1491.2
30% (315)8.9210.1589.0
Disclaimer/Publisher’s Note: The statements, opinions and data contained in all publications are solely those of the individual author(s) and contributor(s) and not of MDPI and/or the editor(s). MDPI and/or the editor(s) disclaim responsibility for any injury to people or property resulting from any ideas, methods, instructions or products referred to in the content.

