
Physiological and Biochemical Measurements Reveal How Styrax japonica Seedlings Response to Flooding Stress


Abstract
1. Introduction
2. Materials and Methods
2.1. Experimental Location and Materials
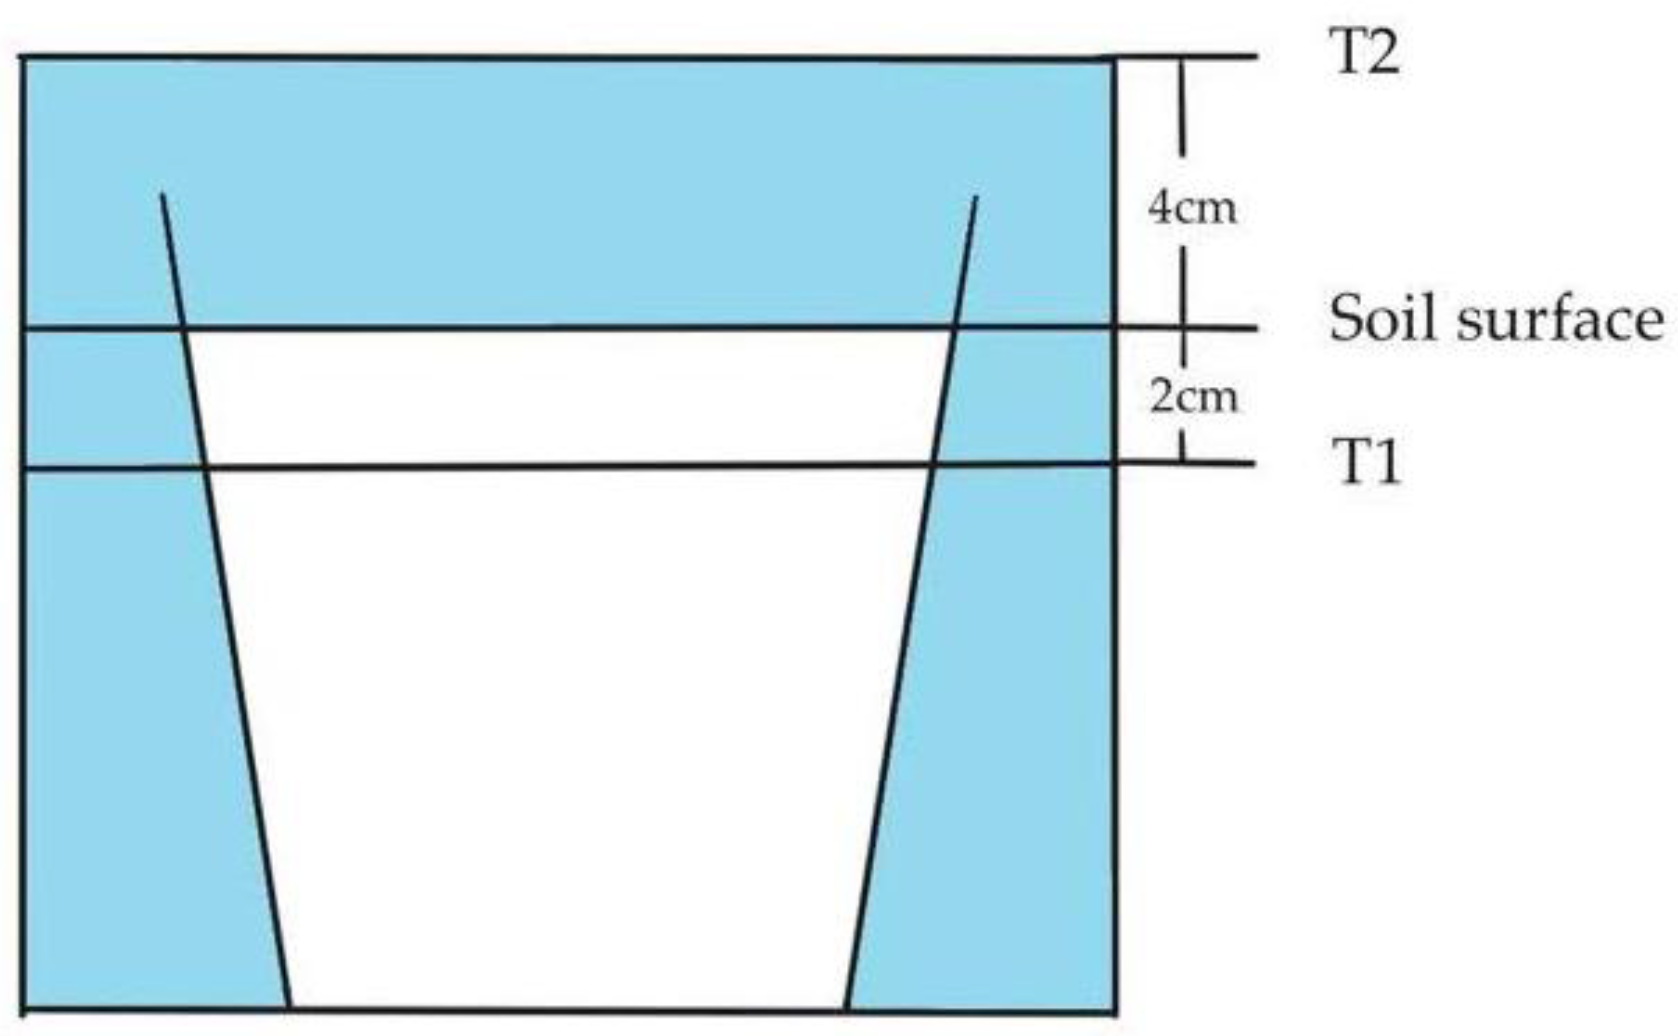
2.2. Experimental Design
2.3. Measurement of Indicators
2.4. Data Analysis
3. Results and Analysis
3.1. Root Activity
3.2. Lipid Peroxidation Products
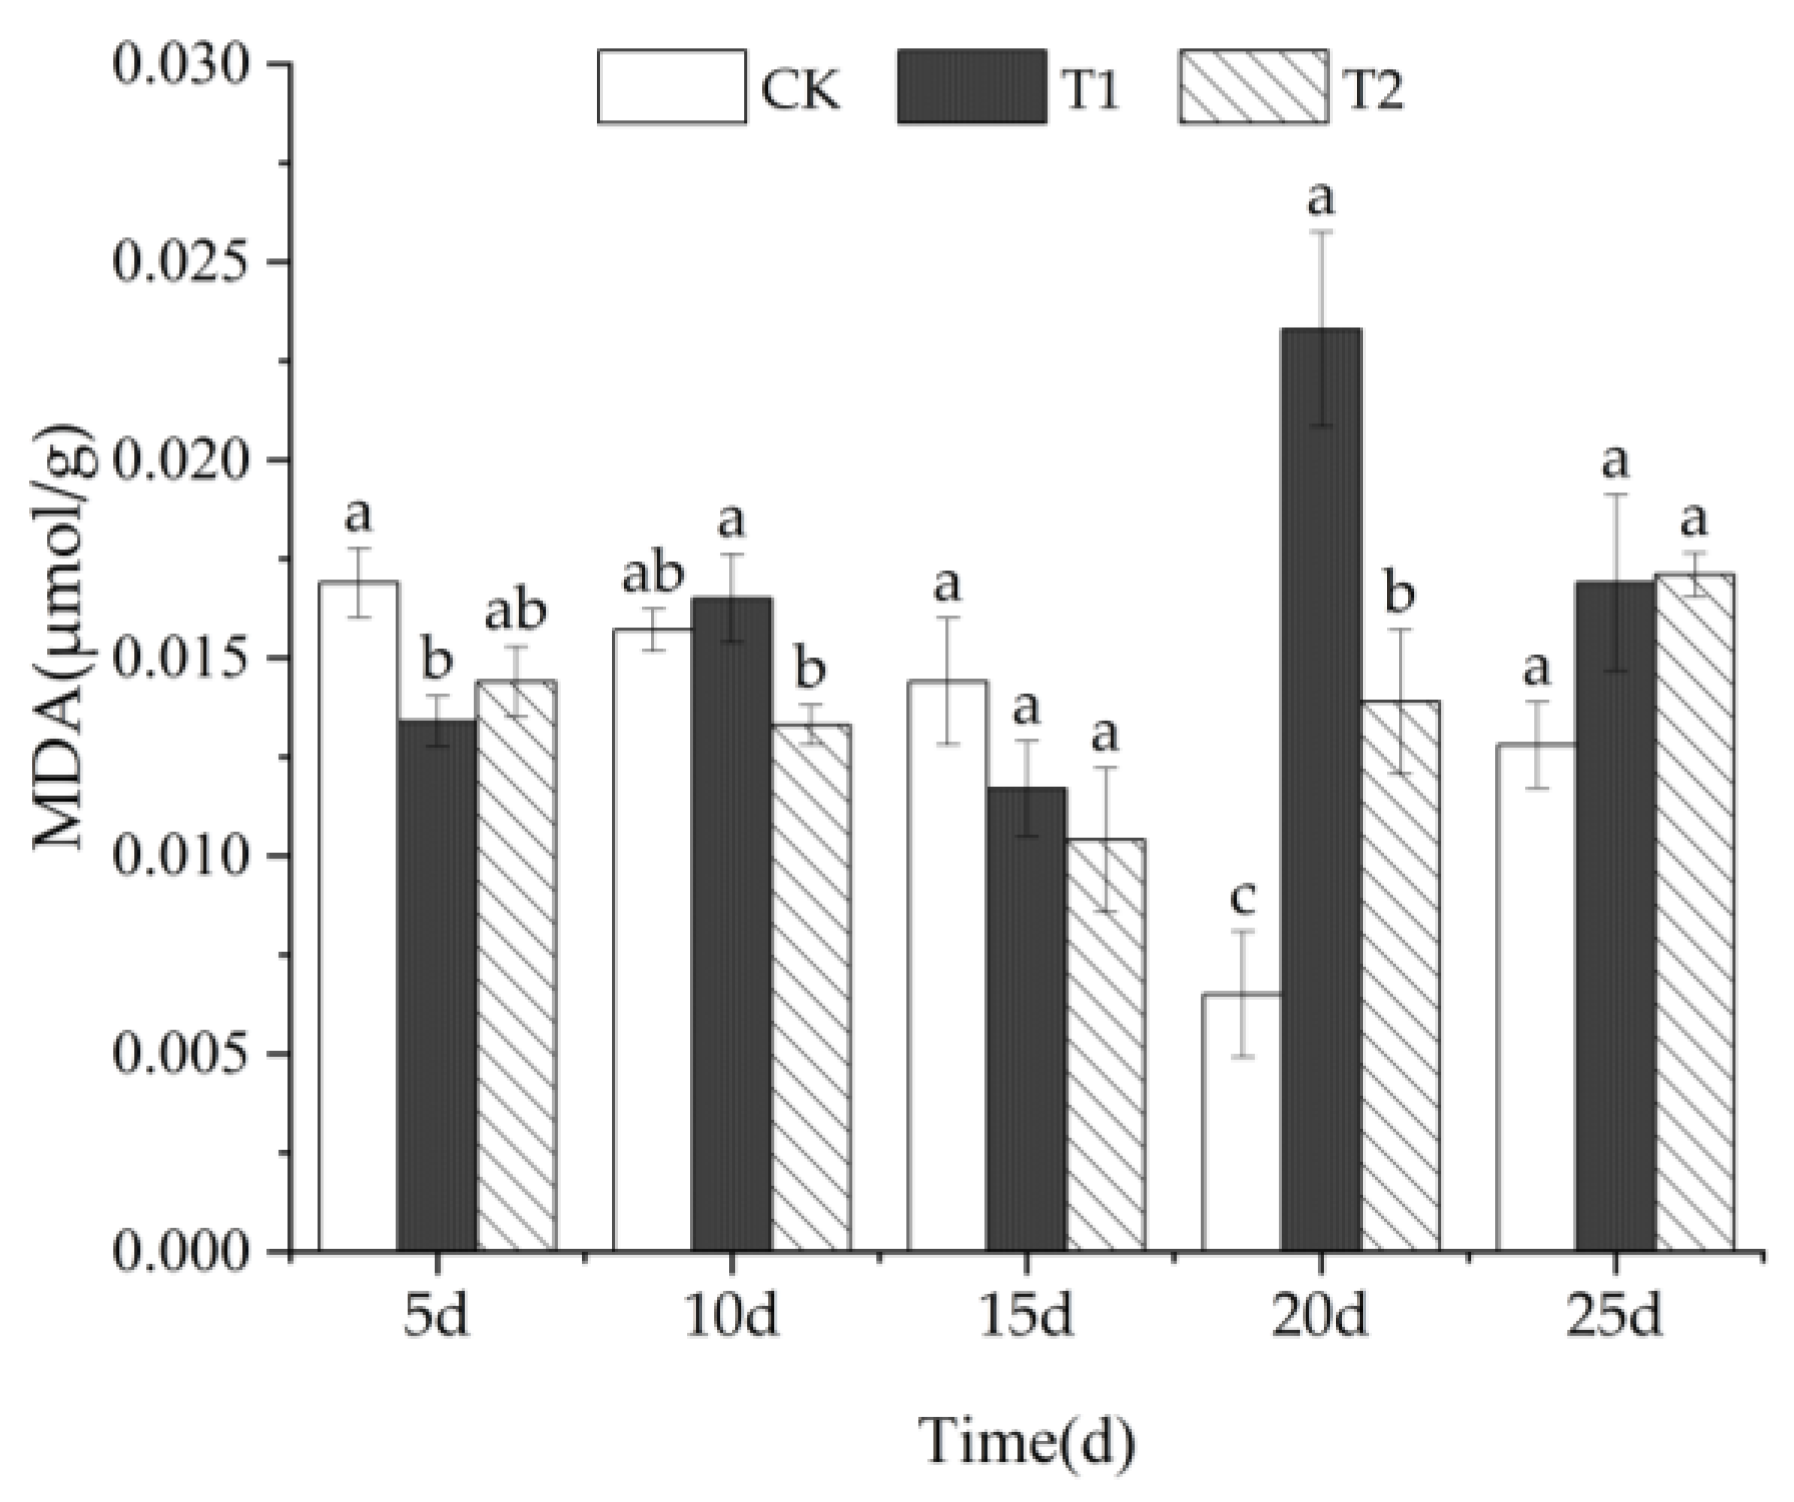
3.2.1. MDA Content
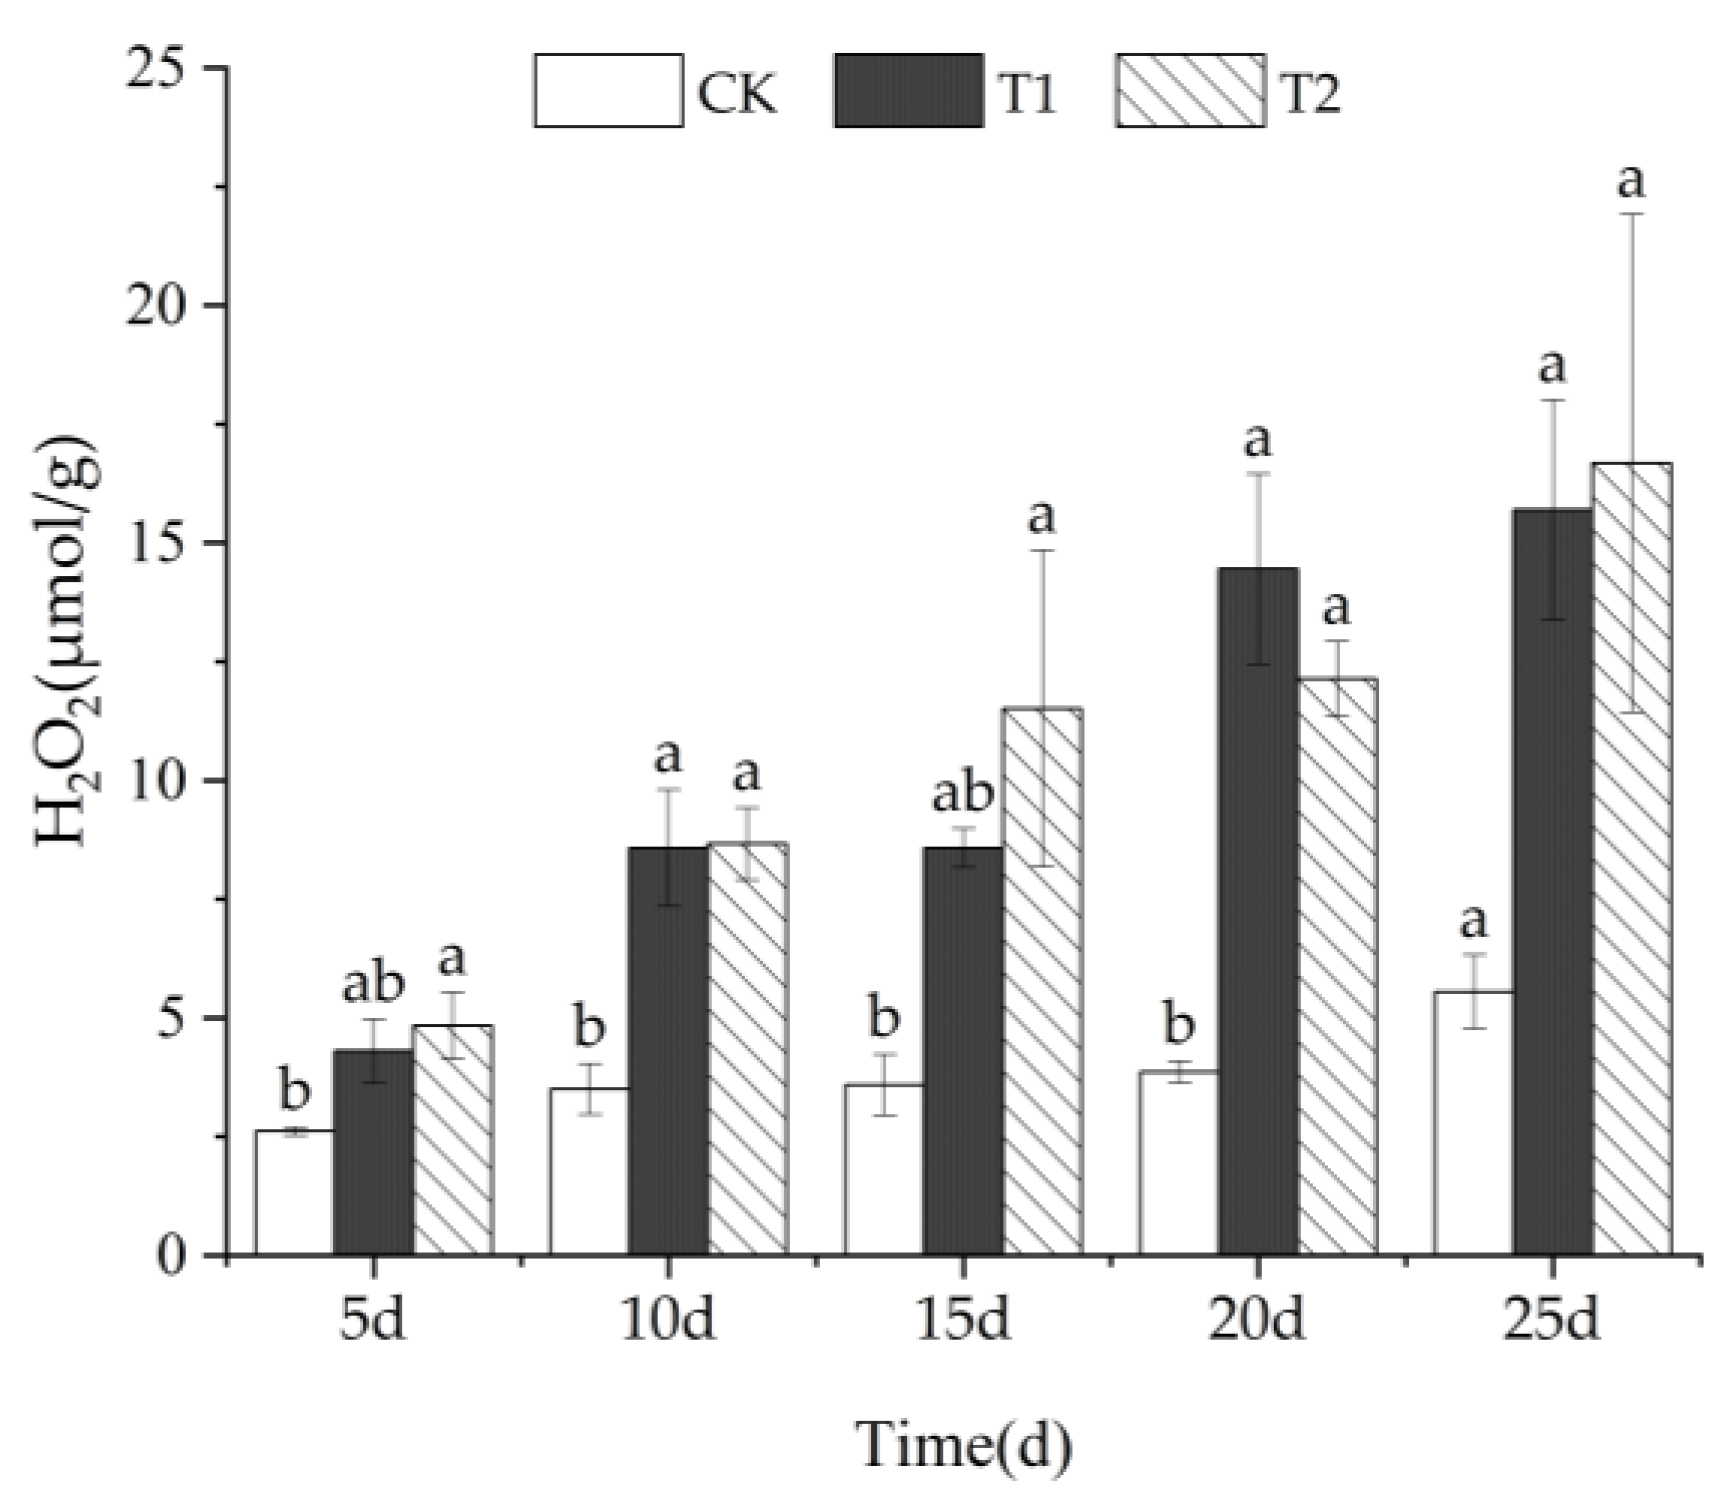
3.2.2. H2O2 Content
3.3. Antioxidant Enzyme Activity
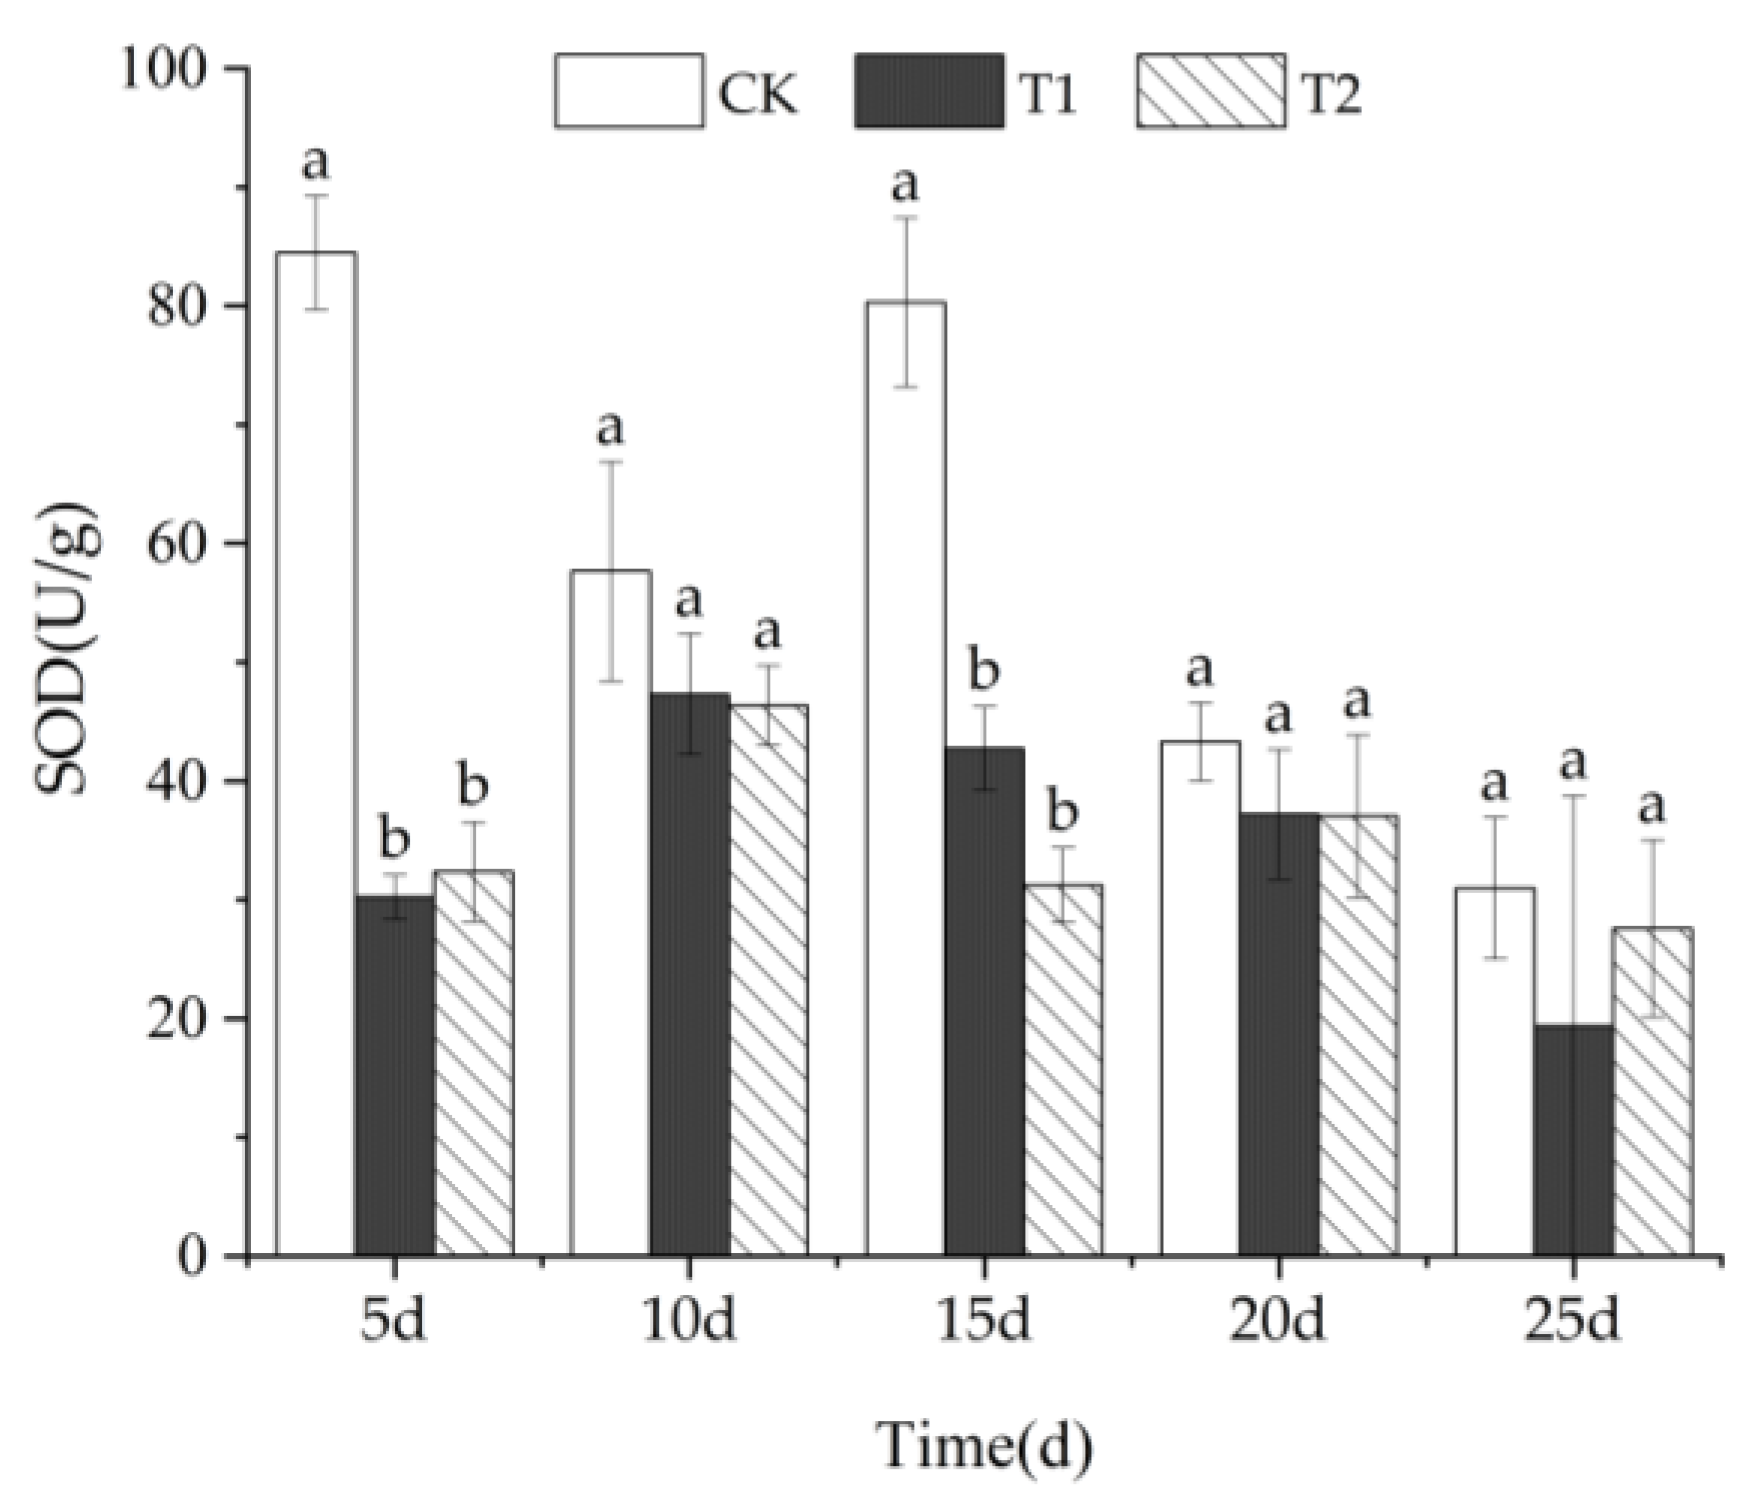
3.3.1. SOD Activity
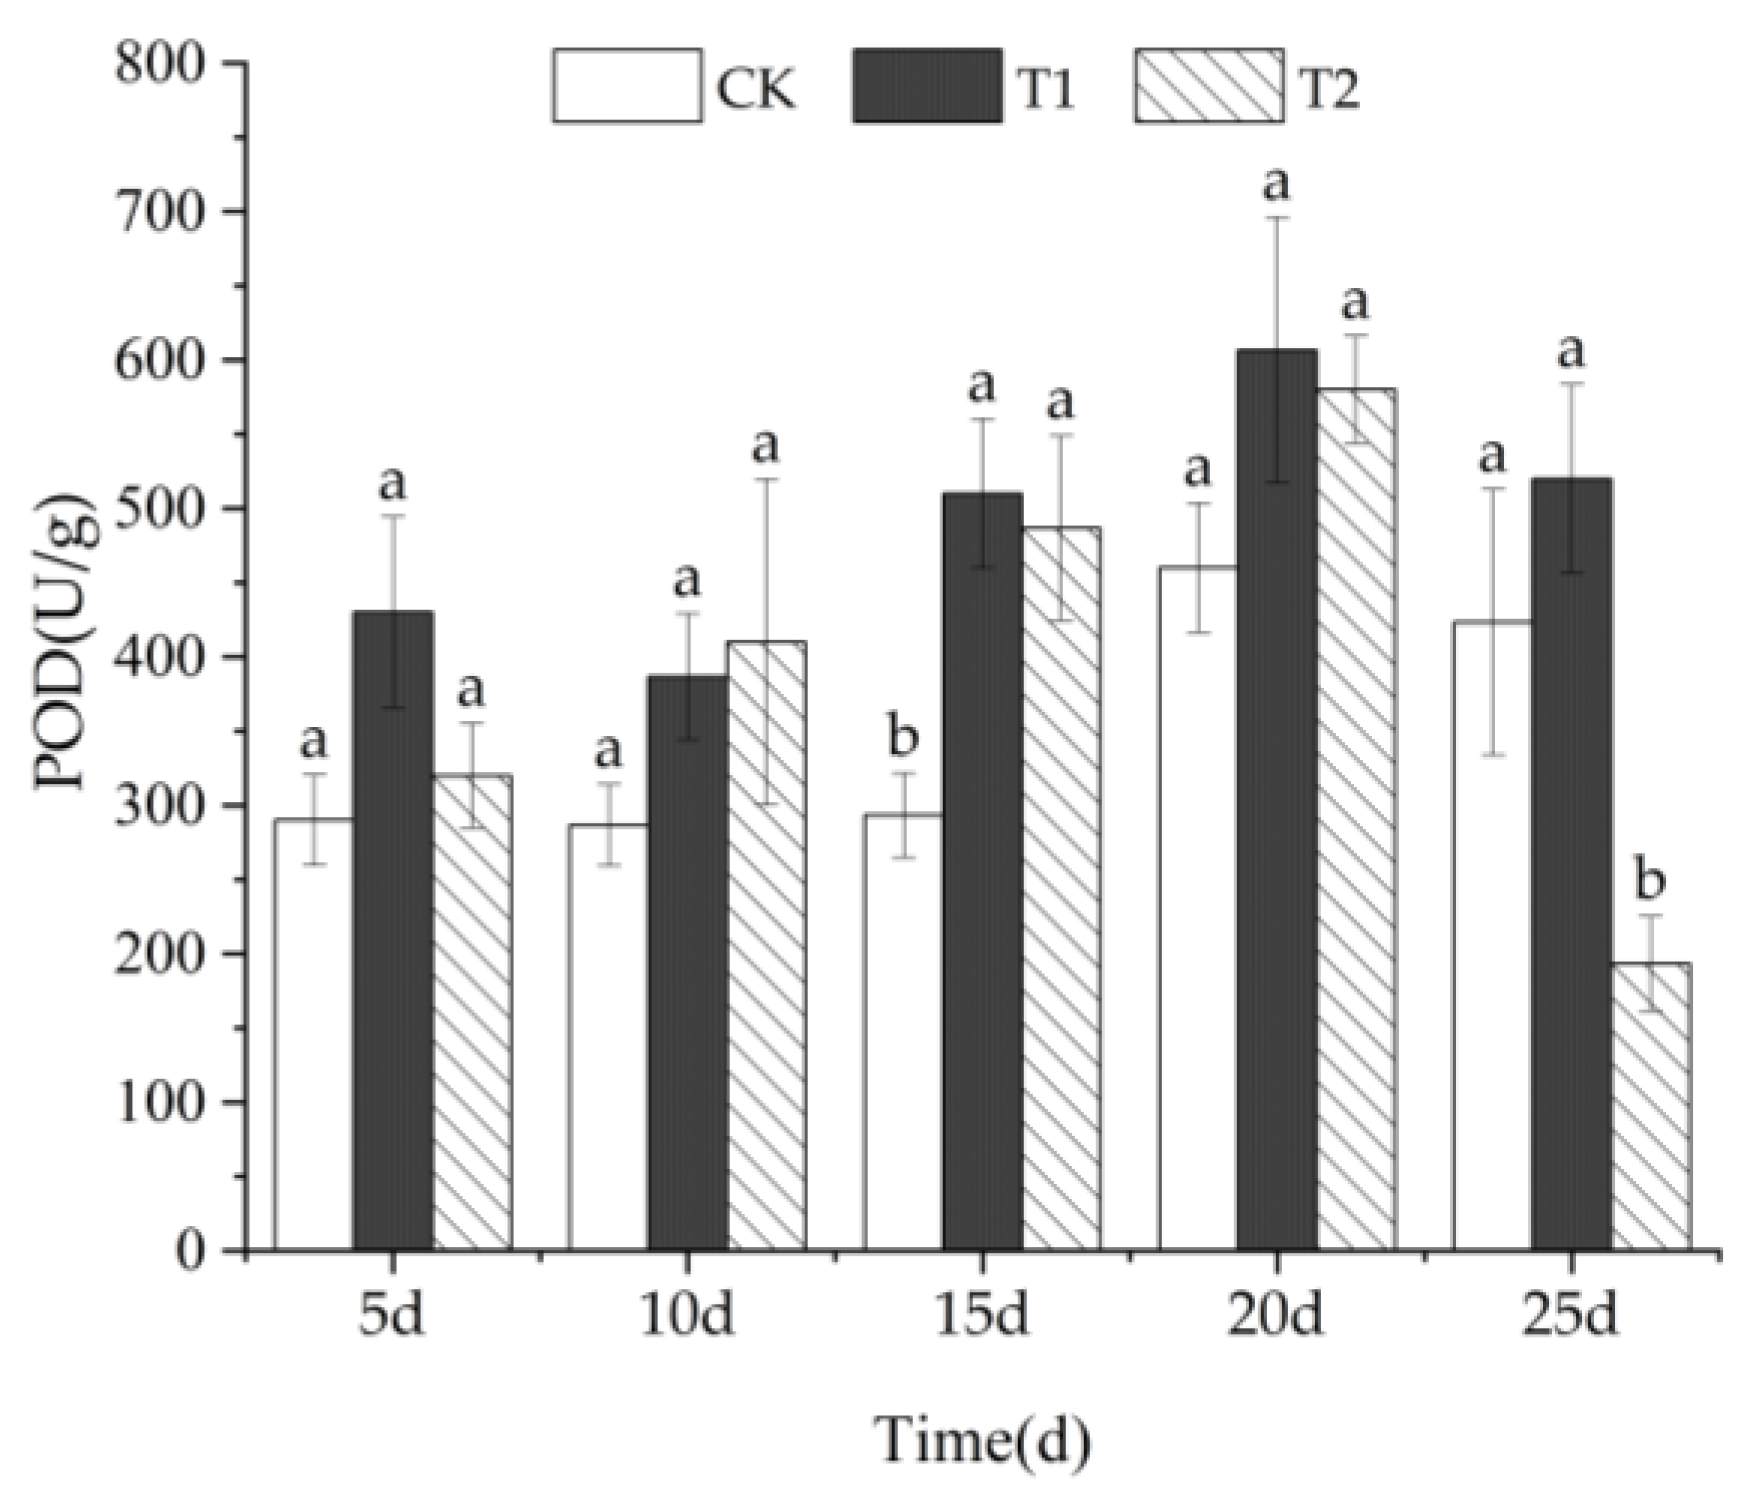
3.3.2. POD Activity
3.3.3. CAT Activity
3.4. Anaerobic Respiratory Enzyme Activity
3.4.1. LDH Activity
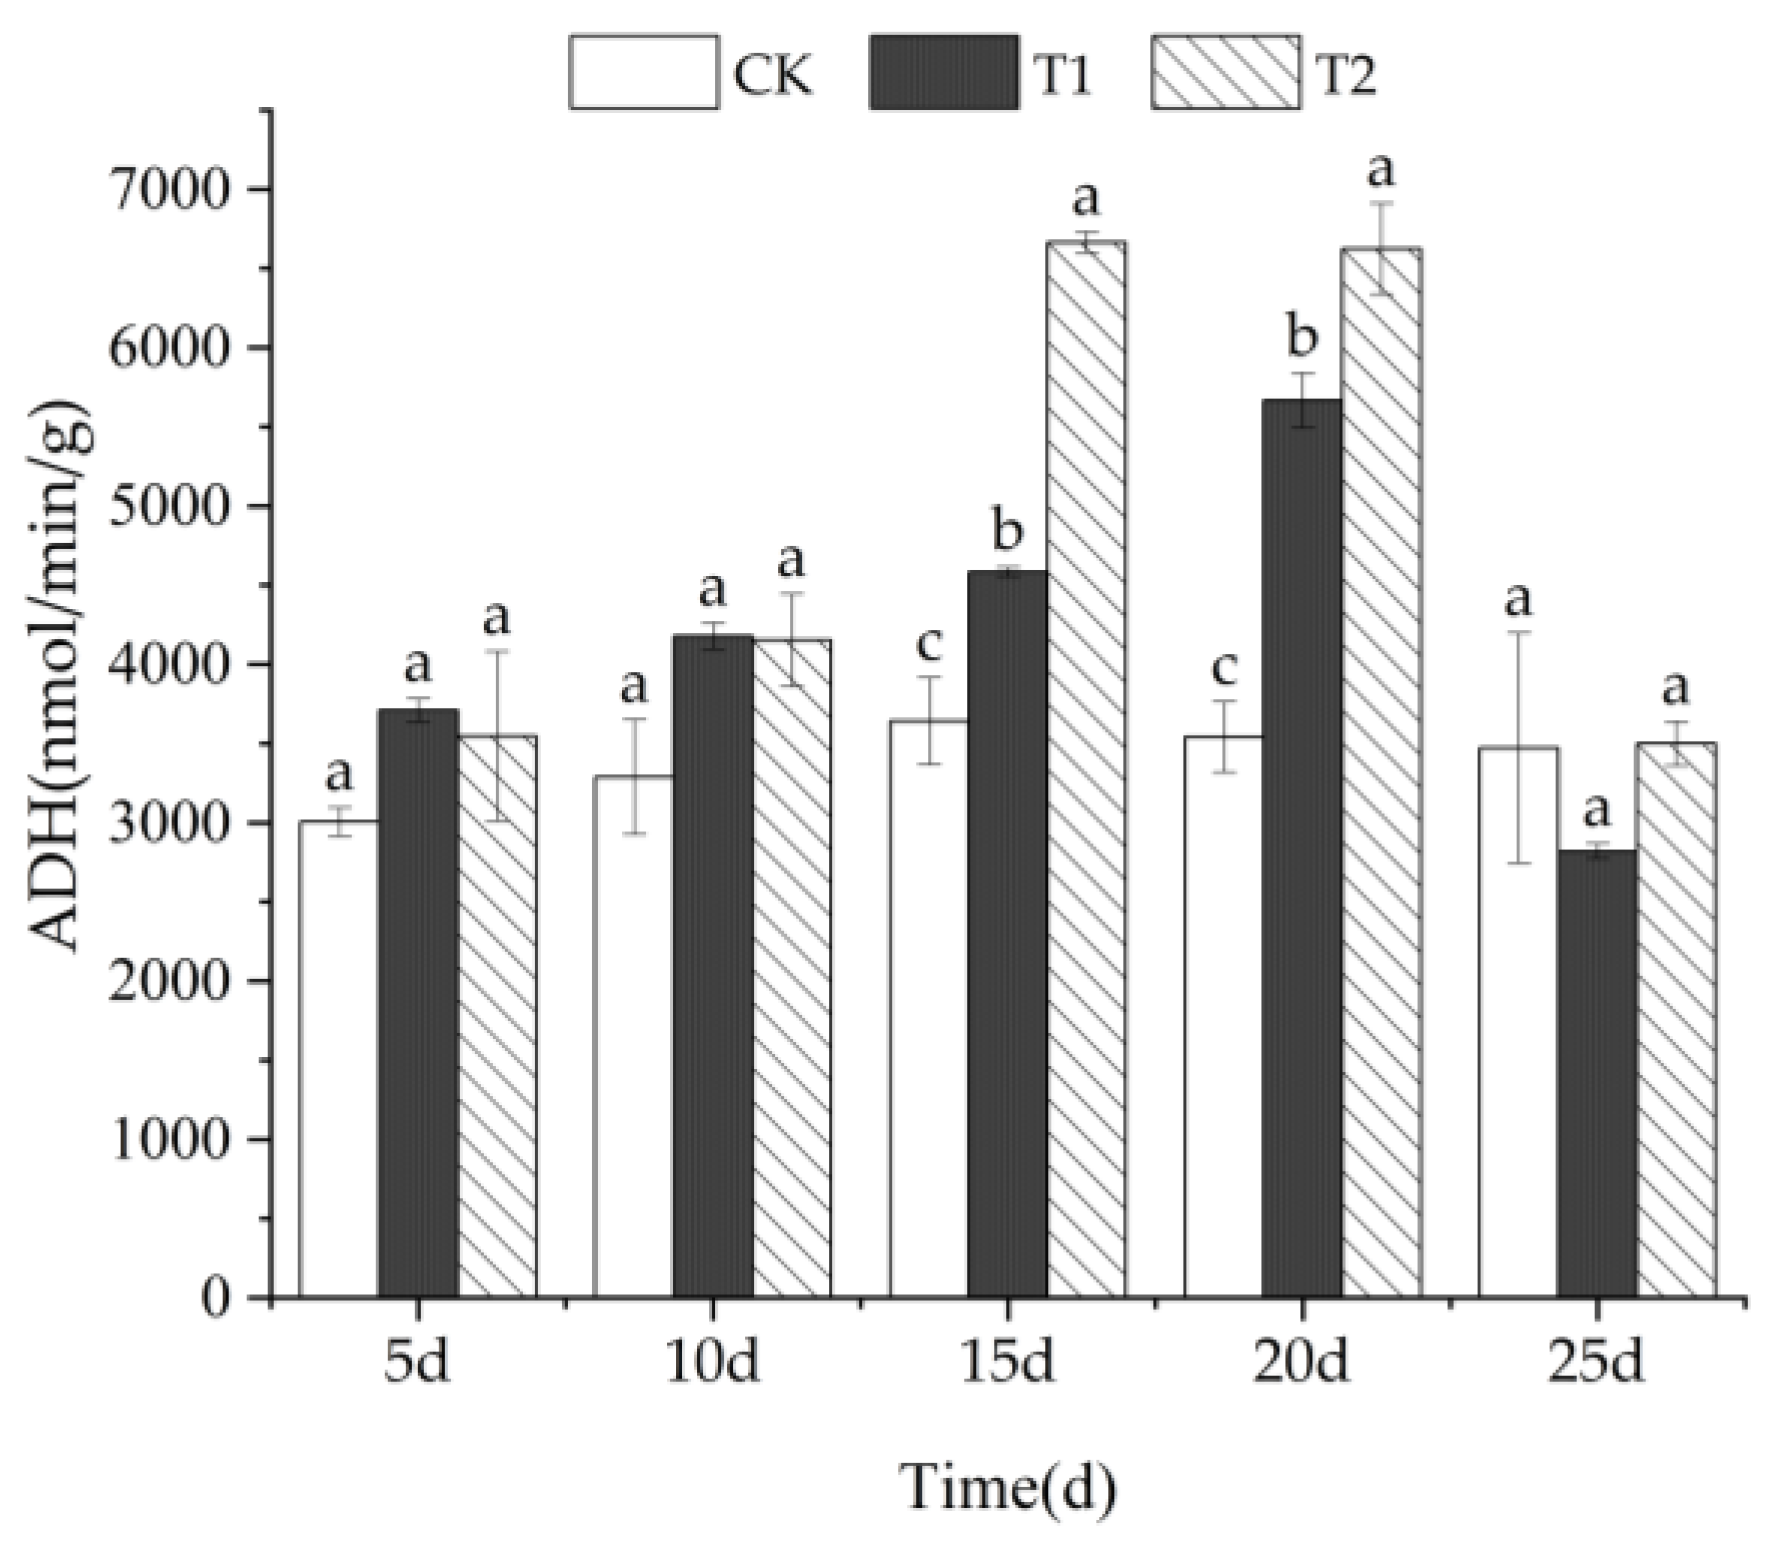
3.4.2. ADH Activity
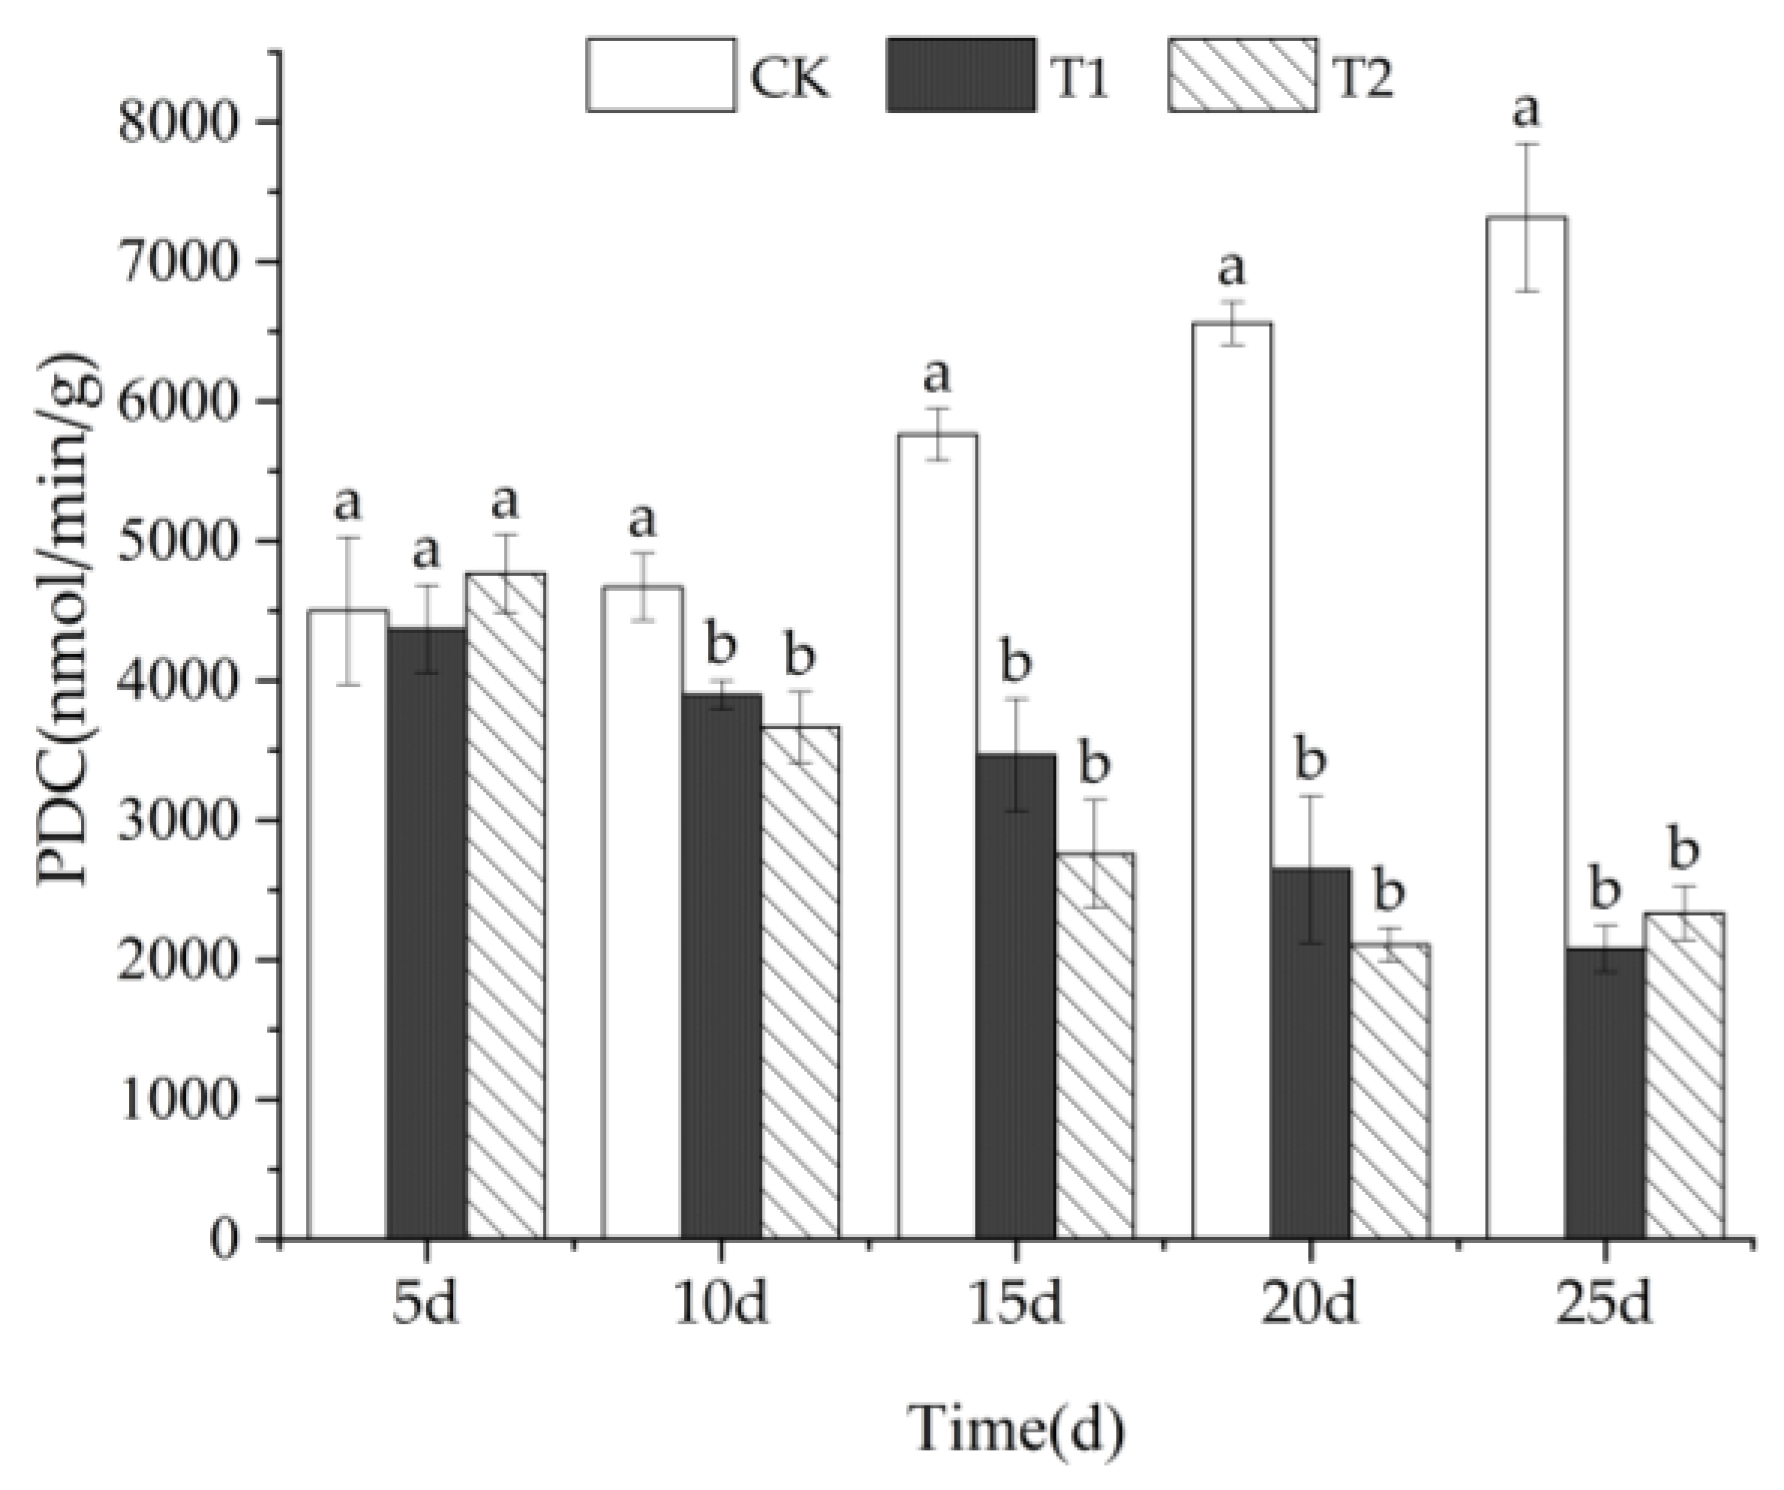
3.4.3. PDC Activity
3.5. PCA Analysis
3.5.1. Analysis Process
3.5.2. Analysis Results
3.5.3. Dynamic Changes in the Temporal Dimension
4. Discussion
5. Conclusions and Outlook
Author Contributions
Funding
Data Availability Statement
Conflicts of Interest
List of Abbreviations and Their Full Forms
| S. japonica | Styrax japonica |
| CK | control group |
| T1 | treatment 1 |
| T2 | treatment 2 |
| MDA | malondialdehyde |
| H2O2 | hydrogen peroxide |
| SOD | superoxide dismutase |
| POD | peroxidase |
| CAT | catalase |
| LDH | lactate dehydrogenase |
| ADH | alcohol dehydrogenase |
| PDC | pyruvate decarboxylase |
| PCA | principal component analysis |
References
- Li, W.; Zhang, C.; Jiang, X.; Liu, Q.; Liu, Q.; Wang, K. De novo transcriptomic analysis and development of EST–SSRs for Styrax japonicus. Forests 2018, 9, 748. [Google Scholar] [CrossRef]
- Chen, C.; Chen, H.; Ni, M.; Yu, F. A study on petal morphological and physiological characteristics of Styrax japonicus during the flowering period. Agronomy 2021, 11, 1498. [Google Scholar] [CrossRef]
- Kim, M.R.; Moon, H.T.; Lee, D.G.; Woo, E.R. A new lignan glycoside from the stem bark of Styrax japonica S. et Z. Arch. Pharmacal Res. 2007, 30, 425–430. [Google Scholar] [CrossRef]
- Voesenek, L.A.; Bailey-Serres, J. Flood adaptive traits and processes: An overview. New Phytol. 2015, 206, 57–73. [Google Scholar] [CrossRef]
- Gui, G.; Zhang, Q.; Hu, W.; Liu, F. Application of multiomics analysis to plant flooding response. Front. Plant Sci. 2024, 15, 1389379. [Google Scholar] [CrossRef] [PubMed]
- Jia, W.; Ma, M.; Chen, J.; Wu, S. Plant morphological, physiological and anatomical adaption to flooding stress and the underlying molecular mechanisms. Int. J. Mol. Sci. 2021, 22, 1088. [Google Scholar] [CrossRef]
- Jia, L.; Qin, X.; Lyu, D.; Qin, S.; Zhang, P. ROS production and scavenging in three cherry rootstocks under short-term waterlogging conditions. Sci. Hortic. 2019, 257, 108647. [Google Scholar] [CrossRef]
- Singh, R.; Singh, S.; Parihar, P.; Mishra, R.K.; Tripathi, D.K.; Singh, V.P.; Chauhan, D.K.; Prasad, S.M. Reactive oxygen species (ROS): Beneficial companions of plants’ developmental processes. Front. Plant Sci. 2016, 7, 1299. [Google Scholar] [CrossRef]
- Gill, S.S.; Tuteja, N. Reactive oxygen species and antioxidant machinery in abiotic stress tolerance in crop plants. Plant Physiol. Biochem. 2010, 48, 909–930. [Google Scholar] [CrossRef]
- Lukić, N.; Trifković, T.; Kojić, D.; Kukavica, B. Modulations of the antioxidants defence system in two maize hybrids during flooding stress. J. Plant Res. 2021, 134, 237–248. [Google Scholar] [CrossRef]
- Sharma, P.; Jha, A.B.; Dubey, R.S.; Pessarakli, M. Reactive oxygen species, oxidative damage, and antioxidative defense mechanism in plants under stressful conditions. J. Bot. 2012, 2012, 217037. [Google Scholar] [CrossRef]
- Zimmermann, P.; Zentgraf, U. The correlation between oxidative stress and leaf senescence during plant development. Cell. Mol. Biol. Lett. 2005, 10, 515. [Google Scholar] [CrossRef]
- Černý, M.; Habánová, H.; Berka, M.; Luklová, M.; Brzobohatý, B. Hydrogen peroxide: Its role in plant biology and crosstalk with signalling networks. Int. J. Mol. Sci. 2018, 19, 2812. [Google Scholar] [CrossRef]
- Ayala, A.; Muñoz, M.F.; Argüelles, S. Lipid peroxidation: Production, metabolism, and signaling mechanisms of malondialdehyde and 4-hydroxy-2-nonenal. Oxidative Med. Cell. Longev. 2014, 2014, 360438. [Google Scholar] [CrossRef] [PubMed]
- Mirzaee, M.; Moieni, A.; Ghanati, F. Effects of drought stress on the lipid peroxidation and antioxidant enzyme activities in two canola (Brassica napus L.) cultivars. J. Agric. Sci. Technol. 2013, 15, 593–602. [Google Scholar]
- Zhang, J.; Kirkham, M.B. Drought-stress-induced changes in activities of superoxide dismutase, catalase, and peroxidase in wheat species. Plant Cell Physiol. 1994, 35, 785–791. [Google Scholar] [CrossRef]
- Alscher, R.G.; Erturk, N.; Heath, L.S. Role of superoxide dismutases (SODs) in controlling oxidative stress in plants. J. Exp. Bot. 2002, 53, 1331–1341. [Google Scholar] [CrossRef]
- Ventura, I.; Brunello, L.; Iacopino, S.; Valeri, M.C.; Novi, G.; Dornbusch, T.; Perata, P.; Loreti, E. Arabidopsis phenotyping reveals the importance of alcohol dehydrogenase and pyruvate decarboxylase for aerobic plant growth. Sci. Rep. 2020, 10, 16669. [Google Scholar] [CrossRef]
- Turner, T.L.; Zhang, G.C.; Kim, S.R.; Subramaniam, V.; Steffen, D.; Skory, C.D.; Jang, J.Y.; Yu, B.J.; Jin, Y.S. Lactic acid production from xylose by engineered Saccharomyces cerevisiae without PDC or ADH deletion. Appl. Microbiol. Biotechnol. 2015, 99, 8023–8033. [Google Scholar] [CrossRef]
- Luo, J.; Yu, W.; Xiao, Y.; Zhang, Y.; Peng, F. Strawberry FaSnRK1α regulates anaerobic respiratory metabolism under waterlogging. Int. J. Mol. Sci. 2022, 23, 4914. [Google Scholar] [CrossRef]
- Zhao, Q.; Feng, Y.; Shao, Y.; Huang, J.; Chen, Z. Response mechanism of Cynodon dactylon to flooding stress based on integrating metabonomics and transcriptomics analysis. Environ. Exp. Bot. 2024, 225, 105846. [Google Scholar] [CrossRef]
- Bailey-Serres, J.; Lee, S.C.; Brinton, E. Waterproofing crops: Effective flooding survival strategies. Plant Physiol. 2012, 160, 1698–1709. [Google Scholar] [CrossRef]
- Van Bodegom, P.M.; Sorrell, B.K.; Oosthoek, A.; Bakker, C.; Aerts, R. Separating the effects of partial submergence and soil oxygen demand on plant physiology. Ecology 2008, 89, 193–204. [Google Scholar] [CrossRef]
- Liu, R.; Yang, C.; Zhang, G.; Zhang, L.; Yang, F.; Guo, W. Root recovery development and activity of cotton plants after waterlogging. Agron. J. 2015, 107, 2038–2046. [Google Scholar] [CrossRef]
- Fujita, S.; Noguchi, K.; Tange, T. Different waterlogging depths affect spatial distribution of fine root growth for Pinus thunbergii seedlings. Front. Plant Sci. 2021, 12, 614764. [Google Scholar] [CrossRef]
- El-Yazel, M.A.S.; EI-Shewy, A.A.; Matter, F.M.A. Impact of water logging condition on seedling of five timber tree species. Hortic. Int. J 2022, 6, 37–45. [Google Scholar] [CrossRef]
- Chen, Y.; Su, W.Y.; Ren, C.J.; Lin, Y.L.; Wang, W.Q.; Zhang, H.Q.; Yin, X.R.; Liu, X.F. Restricted responses of AcMYB68 and AcERF74/75 enhanced waterlogging tolerance in kiwifruit. Plant J. 2024, 119, 1059–1072. [Google Scholar] [CrossRef] [PubMed]
- Colmer, T.D.; Voesenek, L.A.C.J. Flooding tolerance: Suites of plant traits in variable environments. Funct. Plant Biol. 2009, 36, 665–681. [Google Scholar] [CrossRef]
- Rasmussen, A.; Hu, Y.; Depaepe, T.; Vandenbussche, F.; Boyer, F.D.; Van Der Straeten, D.; Geelen, D. Ethylene controls adventitious root initiation sites in Arabidopsis hypocotyls independently of strigolactones. J. Plant Growth Regul. 2017, 36, 897–911. [Google Scholar] [CrossRef]
- Gong, X.; Xu, Y.; Li, H.; Chen, X.; Song, Z. Antioxidant activation, cell wall reinforcement, and reactive oxygen species regulation promote resistance to waterlogging stress in hot pepper (Capsicum annuum L.). BMC Plant Biol. 2022, 22, 425. [Google Scholar] [CrossRef]
- Bailey-Serres, J.; Fukao, T.; Gibbs, D.J.; Holdsworth, M.J.; Lee, S.C.; Licausi, F.; Perata, P.; Voesenek, L.A.C.J.; van Dongen, J.T. Making sense of low oxygen sensing. Trends Plant Sci. 2012, 17, 129–138. [Google Scholar] [CrossRef] [PubMed]
- Kreuzwieser, J.; Rennenberg, H. Molecular and physiological responses of trees to waterlogging stress. Plant Cell Environ. 2014, 37, 2245–2259. [Google Scholar] [CrossRef] [PubMed]
- Smethurst, C.F.; Shabala, S. Screening methods for waterlogging tolerance in lucerne: Comparative analysis of waterlogging effects on chlorophyll fluorescence, photosynthesis, biomass and chlorophyll content. Funct. Plant Biol. 2003, 30, 335–343. [Google Scholar] [CrossRef] [PubMed]
- Ashraf, M.A. Waterlogging stress in plants: A review. Afr. J. Agric. Res. 2012, 7, 1976–1981. [Google Scholar] [CrossRef]
- Mittler, R. Oxidative stress, antioxidants and stress tolerance. Trends Plant Sci. 2002, 7, 405–410. [Google Scholar] [CrossRef]
- Anee, T.I.; Nahar, K.; Rahman, A.; Mahmud, J.A.; Bhuiyan, T.F.; Alam, M.U.; Fujita, M.; Hasanuzzaman, M. Oxidative damage and antioxidant defense in Sesamum indicum after different waterlogging durations. Plants 2019, 8, 196. [Google Scholar] [CrossRef]
- El-Enany, A.E.; Al-Anazi, A.D.; Dief, N.; Al-Taisan, W.A.A. Role of antioxidant enzymes in amelioration of water deficit and waterlogging stresses on Vigna sinensis plants. J. Biol. Earth Sci. 2013, 3, B144–B153. [Google Scholar]
- Wang, X.; Liu, H.; Yu, F.; Hu, B.; Jia, Y.; Sha, H.; Zhao, H. Differential activity of the antioxidant defence system and alterations in the accumulation of osmolyte and reactive oxygen species under drought stress and recovery in rice (Oryza sativa L.) tillering. Sci. Rep. 2019, 9, 8543. [Google Scholar] [CrossRef]
- Ahmad, P.; Sarwat, M.; Sharma, S. Reactive oxygen species, antioxidants and signaling in plants. J. Plant Biol. 2008, 51, 167–173. [Google Scholar] [CrossRef]
- Bin, T.; Xu, S.Z.; Zou, X.L.; Zheng, Y.L.; Qiu, F.Z. Changes of antioxidative enzymes and lipid peroxidation in leaves and roots of waterlogging-tolerant and waterlogging-sensitive maize genotypes at seedling stage. Agric. Sci. China 2010, 9, 651–661. [Google Scholar] [CrossRef]
- Miao, L.F.; Yang, F.; Han, C.Y.; Pu, Y.J.; Ding, Y.; Zhang, L.J. Sex-specific responses to winter flooding, spring waterlogging and post-flooding recovery in Populus deltoides. Sci. Rep. 2017, 7, 2534. [Google Scholar] [CrossRef]
- Garnczarska, M. Hypoxic induction of alcohol and lactate dehydrogenases in lupine seedlings. Acta Physiol. Plant. 2002, 24, 265–272. [Google Scholar] [CrossRef]
- Jain, V.; Singla, N.K.; Jain, S.; Gupta, K. Activities of enzymes of fermentation pathways in the leaves and roots of contrasting cultivars of sorghum (Sorghum bicolor L.) during flooding. Physiol. Mol. Biol. Plants 2010, 16, 241–247. [Google Scholar] [CrossRef] [PubMed]
- Bailey-Serres, J.; Voesenek, L.A.C.J. Flooding stress: Acclimations and genetic diversity. Annu. Rev. Plant Biol. 2008, 59, 313–339. [Google Scholar] [CrossRef]


| Principal Component | Explained Variance | Cumulative Variance |
|---|---|---|
| PC1 | 0.457616 | 0.457616 |
| PC2 | 0.157731 | 0.615348 |
| PC3 | 0.10985 | 0.725198 |
| PC4 | 0.092654 | 0.817852 |
| PC5 | 0.077278 | 0.89513 |
| PC6 | 0.043128 | 0.938258 |
| PC7 | 0.03111 | 0.969368 |
| PC8 | 0.029685 | 0.999053 |
| PC9 | 0.000947 | 1 |
Disclaimer/Publisher’s Note: The statements, opinions and data contained in all publications are solely those of the individual author(s) and contributor(s) and not of MDPI and/or the editor(s). MDPI and/or the editor(s) disclaim responsibility for any injury to people or property resulting from any ideas, methods, instructions or products referred to in the content. |
© 2025 by the authors. Licensee MDPI, Basel, Switzerland. This article is an open access article distributed under the terms and conditions of the Creative Commons Attribution (CC BY) license (https://creativecommons.org/licenses/by/4.0/).
Share and Cite
Zhang, G.; Dong, J.; Han, C.; Liu, Z.; Liu, J.; Yu, F. Physiological and Biochemical Measurements Reveal How Styrax japonica Seedlings Response to Flooding Stress. Forests 2025, 16, 634. https://doi.org/10.3390/f16040634
Zhang G, Dong J, Han C, Liu Z, Liu J, Yu F. Physiological and Biochemical Measurements Reveal How Styrax japonica Seedlings Response to Flooding Stress. Forests. 2025; 16(4):634. https://doi.org/10.3390/f16040634
Chicago/Turabian StyleZhang, Gaoyuan, Jinghan Dong, Chao Han, Zemao Liu, Jianbing Liu, and Fangyuan Yu. 2025. "Physiological and Biochemical Measurements Reveal How Styrax japonica Seedlings Response to Flooding Stress" Forests 16, no. 4: 634. https://doi.org/10.3390/f16040634
APA StyleZhang, G., Dong, J., Han, C., Liu, Z., Liu, J., & Yu, F. (2025). Physiological and Biochemical Measurements Reveal How Styrax japonica Seedlings Response to Flooding Stress. Forests, 16(4), 634. https://doi.org/10.3390/f16040634