Article

Revealing the Bacteriome in Crop–Livestock–Forest Integration Systems in the Cerrado of MATOPIBA, Brazil

by
Michelli Inácio Gonçalves Funnicelli
1,2,
Natália Sarmanho Monteiro Lima
1,2,3,
Camila Cesário Fernandes Sartini
1,4,
Eliana Gertrudes de Macedo Lemos
1,2,3,4,
Raimundo Bezerra de Araújo Neto
5,
Henrique Antunes de Souza
5,
José Oscar Lustosa de Oliveira Junior
5,
Edvaldo Sagrilo
5,
Flavio Favaro Blanco
5,
Hosana Aguiar de Freitas Andrade
6,
Daiane Conceição de Sousa
7,
Maria Laiane do Nascimento Silva
8,
Luiz Fernando Carvalho Leite
5,
Paulo Sarmanho da Costa Lima
5 and
Daniel Guariz Pinheiro
1,2,*
1
Department of Agricultural, Livestock and Environmental Biotechnology, Faculty of Agricultural and Veterinary Sciences, São Paulo State University (UNESP), Jaboticabal 14884-900, SP, Brazil
2
Graduate Program in Agricultural and Livestock Microbiology, Faculty of Agricultural and Veterinary Sciences, São Paulo State University (UNESP), Jaboticabal 14884-900, SP, Brazil
3
Molecular Biology Laboratory, Institute for Research in Bioenergy (IPBEN), Faculty of Agricultural and Veterinary Sciences, São Paulo State University (UNESP), Jaboticabal 14884-900, SP, Brazil
4
Centralized Multiuser Laboratory for Large-Scale DNA Sequencing and Gene Expression Analysis (LMSeq), Faculty of Agricultural and Veterinary Sciences, São Paulo State University (UNESP), Jaboticabal 14884-900, SP, Brazil
5
Brazilian Agricultural Research Corporation, Embrapa Mid-North, Teresina 64008-780, PI, Brazil
6
Center of Agricultural Sciences, Federal University of Piauí (UFPI), Teresina 64049-550, PI, Brazil
7
Agroforestry Science Training Center, Federal University of Southern Bahia (UFSB), Itabuna 45600-000, BA, Brazil
8
Casa Apis, Teresina 64605-440, PI, Brazil
*
Author to whom correspondence should be addressed.
Forests 2025, 16(4), 626; https://doi.org/10.3390/f16040626
Submission received: 29 November 2024 / Revised: 26 February 2025 / Accepted: 3 March 2025 / Published: 2 April 2025
(This article belongs to the Section Forest Soil)

Abstract

:
Sustainable agriculture relies on effective soil management, making it crucial to assess soil health, especially in areas of agricultural expansion, such as the Cerrado in the MATOPIBA region. Sustainable strategies, such as integrated production systems (crop–livestock–forestry), are essential to mitigate these impacts. However, little is known about the effects of these systems on soil microbial communities. The objective of this study was to evaluate bacterial communities associated with soils under different integrated production systems in the MATOPIBA region. Soil samples from the 0–10 cm depth layer were collected from the following land use systems: (i) native Cerrado vegetation (NCV), (ii) native Babassu forest (NPV), (iii) no-tillage soybean—regional standard system (NT-S), (iv) crop–forest integration (CFI), (v) crop–livestock integration (CLI), and (vi) livestock–forest integration (LFI). We measured chemical properties and bacterial communities using next-generation sequencing (NGS) of the V3-V4 hypervariable region of the 16S rRNA gene. The results revealed that the integration systems (CFI, CLI, and LFI) resulted in changes in soil chemical properties, which contributed to the modulation of the bacterial communities. The most abundant taxa in integrated production systems shows a positive correlation with soil pH and phosphorus content. Members of the Nitrosomonadaceae and Sphingomonadaceae families are more related to integrated production systems containing a forestry component (CFI and LFI), while Bacillaceae are more evident in crop–livestock integration systems (CLI).

1. Introduction

The latest agricultural frontier in Brazil is in the North and Northeast regions of the country. The most relevant agricultural expansion area in these regions is known as MATOPIBA (the two first letters of the names of the states of Maranhão, Tocantins, Piauí, and Bahia), which includes 337 municipalities and spans 73 million ha [1]. The region is considered a strategic driver of the Brazilian economy and has been attracting farmers from various regions [2]. This zone has specific characteristics, such as low altitudes, high temperatures, and, in some parts, restrictive rainfall patterns [3]. The soils are highly weathered and acidic, sandy, and gravelly, with low buffering capacity, low soil organic matter (SOM), phosphorus, potassium, and micronutrients concentrations [3,4].
These edaphoclimatic conditions lead to low nutrient and water retention in these soils. A sustainable approach to address these limitations includes adopting cropping systems such as no-till, integrated systems, and agroforestry. These practices reduce soil disturbance, increase soil organic matter (SOM), enrich nutrients, diversify crops, and protect the soil, all of which improve soil health and enhance resilience against the region’s challenging tropical climate.
Conservation-based agricultural systems play a vital role in agricultural frontier regions. Practices such as no-till, crop rotation, crop succession, intercropping, and cover cropping are accessible to farmers and, when combined with integrated production systems like crop–livestock–forestry integration (CLFI), enhance productivity, optimize soil and water use, and provide greater production stability [4,5].
CLFI systems offer various modalities, including crop–livestock integration (CLI), crop–forestry integration (CFI), or livestock–forestry integration (LFI). In the MATOPIBA region, soybeans and maize are the primary crops used, while cattle grazing on Urochloa or Megathyrsus grasses are common for the livestock component. Eucalyptus is the predominant forest component [6].
Systems that combine well-managed crops and pastures with trees and livestock can significantly improve soil chemical quality [7], enhance carbon sequestration [8], and boost crop productivity [7] These practices have also led to increased biomass and biological activity in MATOPIBA soils [9].
Sustainability is understood as “that which meets the needs of the present without compromising future generations to meet their own needs”. Thus, the use of integrated crop–livestock–forestry (CLFI) systems in Brazilian farms emerges as a viable alternative for ecosystem sustainability, that is, a balance between farming production and environmental preservation. Adopting CLFI systems and their modalities has been gaining ground on Brazilian farms. However, scientific information about CLFI in MATOPIBA region is still scarce, which may be a result of the complexity and long duration of integrated systems, combined with the fact that CLFI research is in its infancy and there are a relatively small number of technicians working with these systems in different regions of the country [10]. However, Macedo et al. (2010) [11] observed that tropical biodiversity allows for a vast possibility of combinations within integrated systems to achieve sustainability.
The main benefits of integrated systems include increased soil organic matter (SOM) and reduced greenhouse gas emissions (GHGs) [12,13,14], increased nutrient cycling and use efficiency [15,16] and maintenance or increase in soil biodiversity [17].
Studying soil microbiomes is essential for understanding the biological, chemical, and physical dynamics of soil, particularly in linking microbial diversity to the vegetation cover of an area. The composition of microbial species and the ecological roles of bacteria are influenced by soil texture, chemical composition, pH, precipitation, and temperature [18]. Additionally, an increase in soil nutrients supports plant health, which in turn affects soil properties and promotes the selection of specific bacterial communities in the rhizosphere, each fulfilling distinct ecosystem functions [19]. Understanding which bacterial genera thrive in various planting systems can provide valuable insights for soil management and inform decision-making.
In this study, we tested two hypotheses: (i) different land use types lead to changes in soil chemical properties, which in turn affect bacterial communities; and (ii) incorporating a forest component into integrated production systems influences bacterial communities in MATOPIBA soils. To explore these hypotheses, we analyzed soil bacterial community structures under various land use types and integrated production systems in Brazil’s MATOPIBA region.

2. Materials and Methods
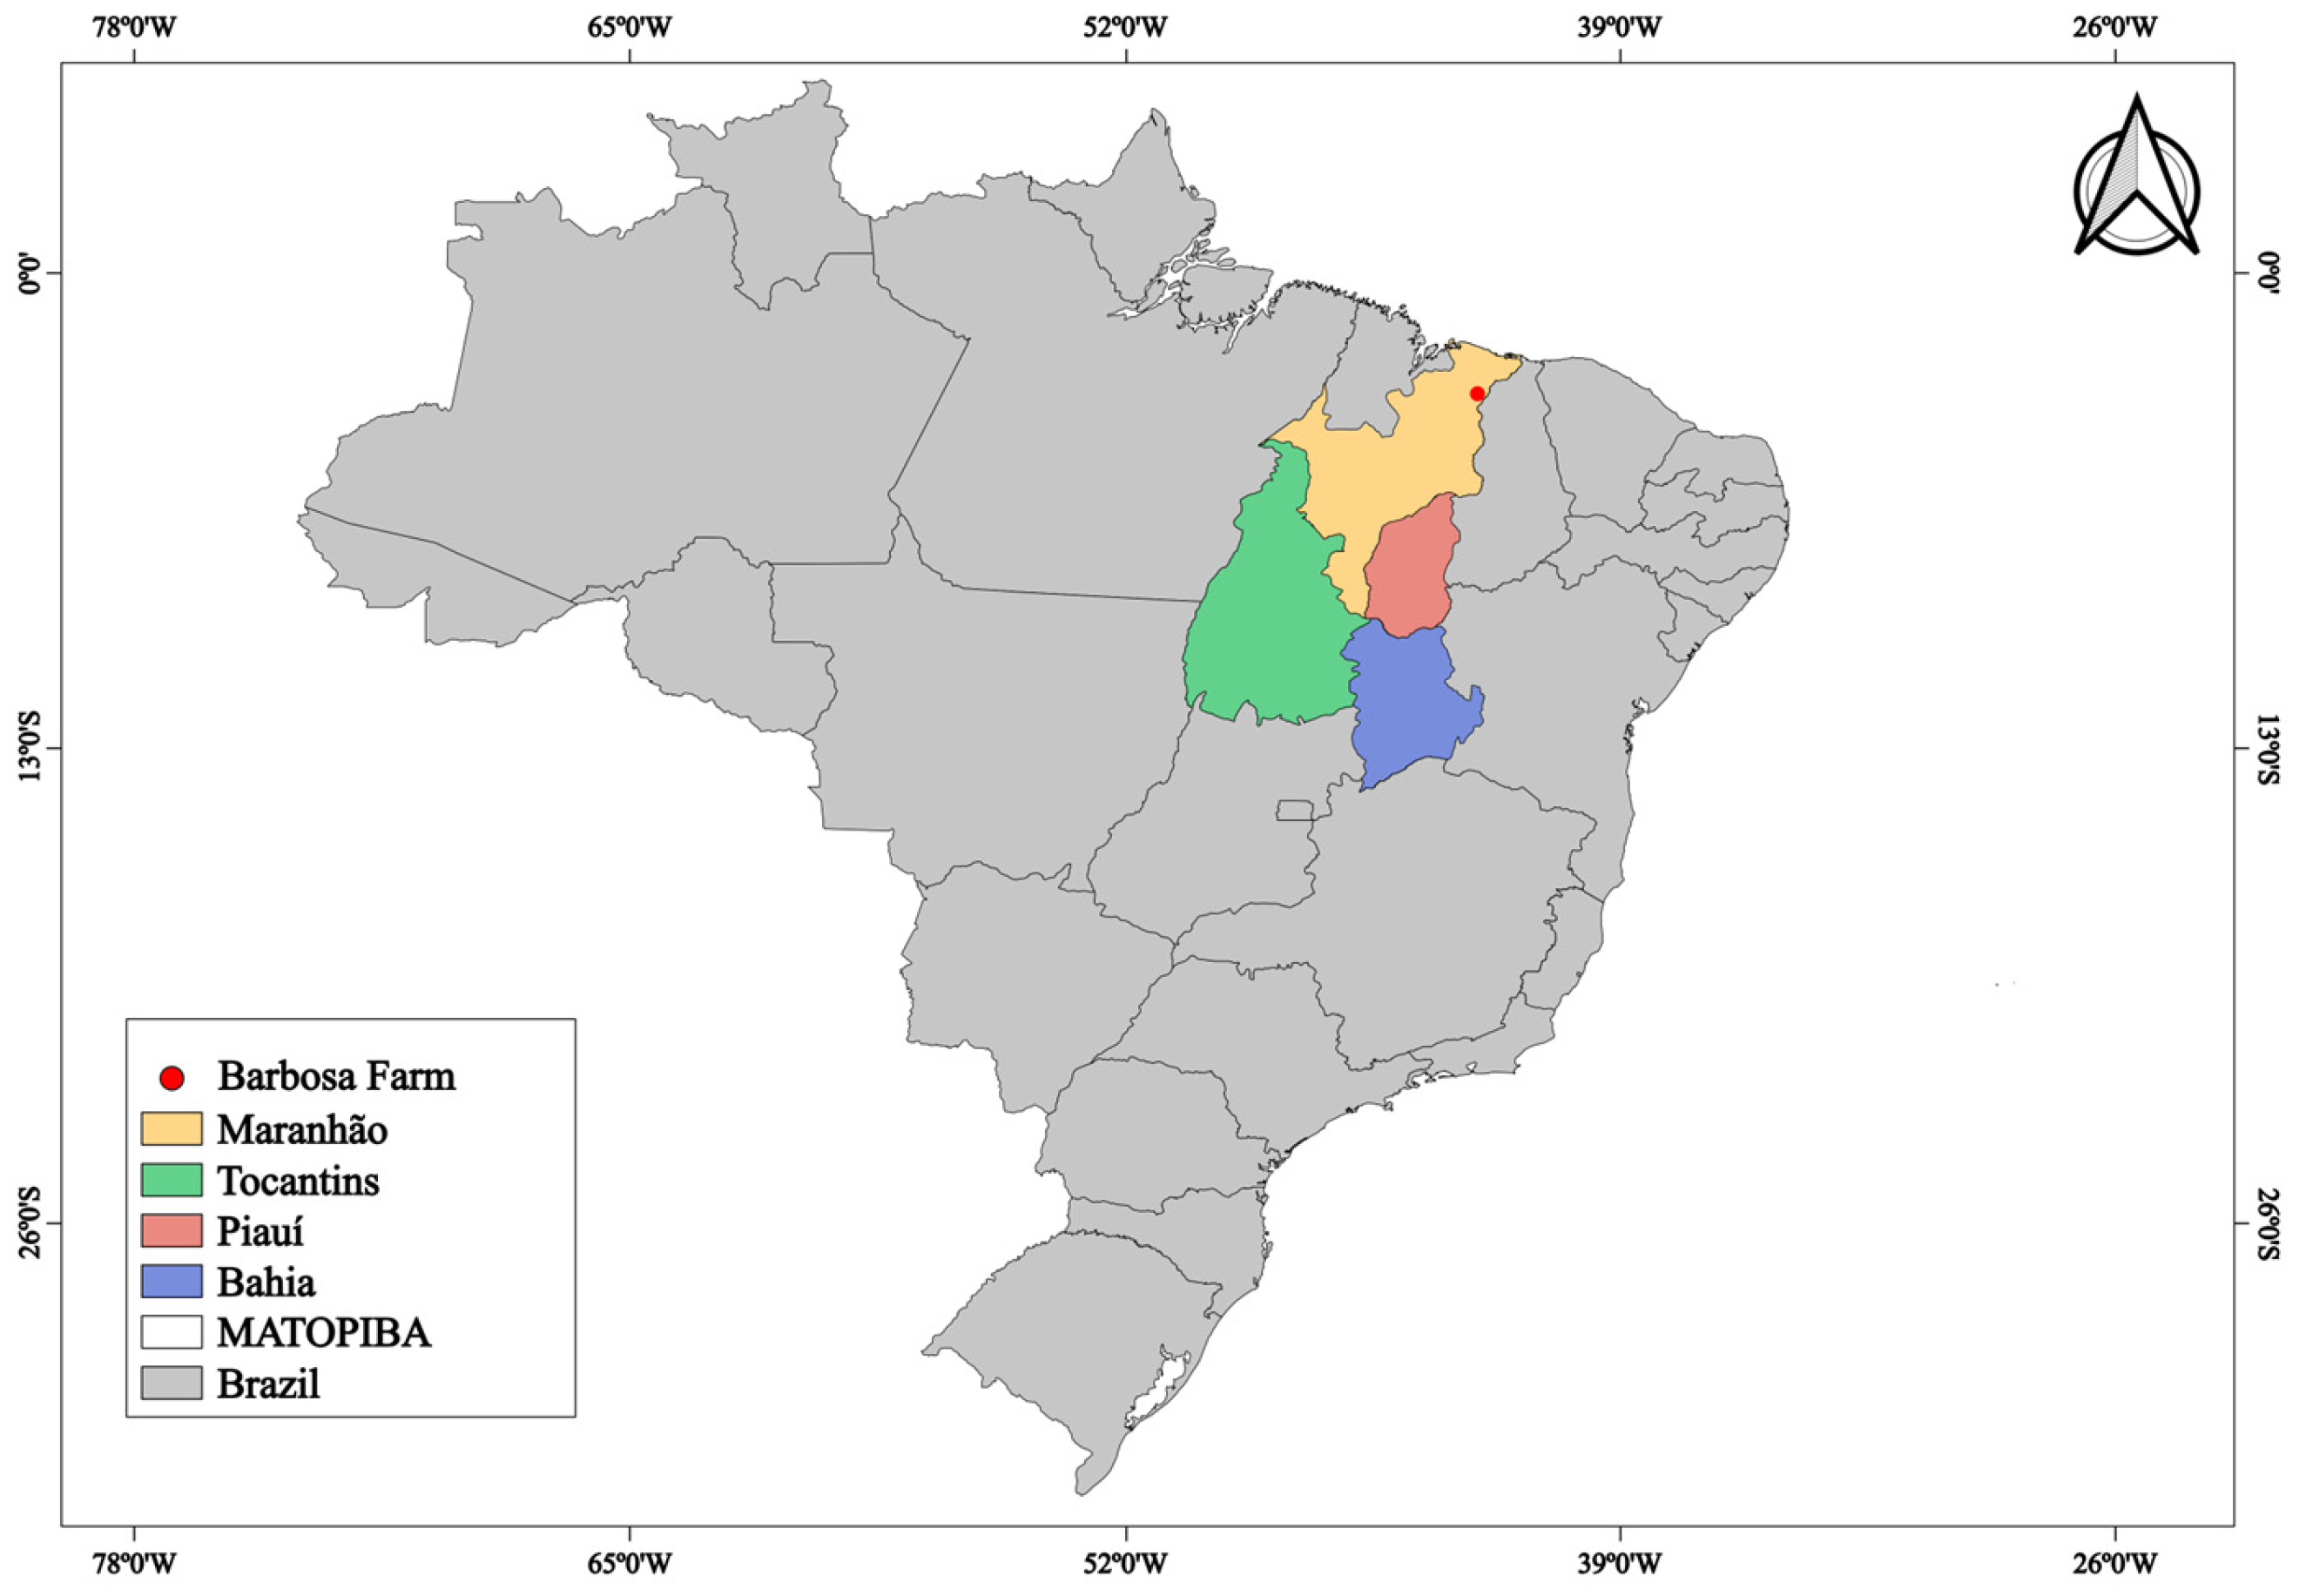
This study was conducted at Barbosa farm, located in Brejo, Maranhão, Brazil, at the geographic coordinates 03°42′44″ S and 42°55′44″ W (Figure 1). According to the Köppen classification, the region has a hot, humid tropical climate (Aw), with an average annual temperature exceeding 27 °C and an average annual rainfall of 1835 mm. Rainy seasons typically occur from January to June, while dry seasons extend from July to December, with annual relative humidity ranging from 73% to 79% [20]. The area’s altitude varies due to its undulating to gently rolling terrain. The experimental site, part of the Cerrado biome, features soil classified as typical dystrocohesive Yellow Argisol with a sandy loam texture and a cohesive horizon [21]. Annual precipitation and air temperature for the agricultural study year are shown in Figure S1.
Six distinct land use areas were evaluated: (i) crop–livestock integration—CLI; (ii) livestock–forest integration—LFI; (iii) crop–forest integration—CFI; (iv) no-till soybean, with millet as a cover crop in the off-season (NT-S); (v) an area of native Cerrado vegetation (NCV); and (vii) an area of native Babassu palm vegetation (NPV) (Table 1).

2.1. Soil Sampling

Soil sampling was carried out in July 2022, during the transition period from the rainy to the dry season. Soil samples were collected at the 0–10 cm layer. In each land use, 10 sampling points were selected, distributed along a zigzag transect, with an average distance of 10 m between each point. Once collected, individual soil samplings were pooled to form a composite representative sample of each area.

2.2. Determination of Soil Physical–Chemical Parameters

After sampling, the soil was air-dried and sieved through a 2 mm mesh for analysis. Soil chemical properties included: pH measured in both CaCl2 and H2O (1:2.5 soil-to-solution ratio); organic carbon, quantified through wet digestion with potassium dichromate, was converted to organic matter (OM) by multiplying values by 1.724. The elements K, P, Cu, Fe, Mn, Zn, and Na were extracted using Melich-1 (0.0125 mol L−1 H2SO4 and 0.050 mol L−1 HCl). Concentrations of K and Na were determined by flame photometry, P by colorimetry, and Ca, Mg, Al, Cu, Fe, Mn, and Zn by atomic absorption after extraction with 1 mol L−1 potassium chloride. Al3+ was determined by titration, while potential acidity (H + Al) was extracted with 0.5 mol L−1 calcium acetate and measured by titration. Sulfur was analyzed by measuring the turbidity from sulfate precipitation using barium chloride. The clay fraction (<0.002 mm) was determined by the pipette method; sand content was estimated by sieving, and silt (0.05–0.002 mm) was calculated by difference. Sand was further divided into coarse (0.5–2.0 mm) and fine fractions (<0.002 mm).

2.3. DNA Extraction

Total soil DNA extraction was performed from 0.25 g of composite soil samples obtained from each system. The extractor used was the Power Soil DNA Extraction kit (MoBio Labs, Inc. Solana Beach, CA, USA), following the manufacturer ’s instructions.

2.4. Library Preparation and Sequencing

Total DNA from soil samples under various management practices was used to amplify the V3-V4 region of the 16S rRNA gene. This two-step PCR process followed the manufacturer’s protocol for Nextera XT® DNA Library Preparation Kit (Illumina®, San Diego, CA, USA), with the first step targeting the gene region (PCR-1) and the second adding Illumina adapters and barcodes (PCR-2). The primers for amplifying the V3-V4 region were 341f (5′-CCTACGGGNGGCWGCAG-3′) and 805r (5′-GACTACHVGGGTATCTAATCC-3′) [24]. Sequencing of the V3-V4 region was conducted with the Nano Reagent v2 kit (Illumina®, San Diego, CA, USA) using 600 cycles (2 × 300 bp) according to the manufacturer’s guidelines.

2.5. Metataxonomic Data

Quality checks on the demultiplexed FASTQ files from paired-end sequencing of the 16S rRNA gene were conducted using fastqc v0.11.9 [25]. Primer sequences were removed with atropos v1.1.31 [26], low-quality reads were filtered out with fastp v0.23.2 [27], and remaining reads were merged with Flash v1.2.11 [28] at a minimum 10 bp overlap. ASVs (amplicon sequence variants) were inferred and quantified using the DADA2 v1.22.0 pipeline [29] in R v4.1.2 [30]. Merged reads, averaging 411 bp, were filtered (“dada2::filterAndTrim”) using parameters “truncLen = 400, maxEE = 2, maxN = 0”. Error rates were estimated via the LOESS model (“dada2::learnErrors”), sequence redundancy was removed (“dada2::derepFastq”), and sequences were corrected for errors and chimeras removed (“dada2::removeBimeraDenovo”). Taxonomy assignment was conducted using the SILVA database (v.138.1) [31] and the Naive Bayesian classifier (“dada2::assignTaxonomy”) [32]. ASV sequences were grouped into OTUs (97% identity) using the UPGMA clustering method (“DECIPHER::IdClusters”, v. 2.22.0 [33]), with low-abundance OTUs (≤1 sequence, occurring in only one sample) filtered out.

2.6. Microbiome and Statistical Analyses

2.6.1. Alpha and Beta Diversity

Sample reads were normalized to sequencing depth using rarefaction (phyloseq::rarefy_even_depth) (v.1.38.0) to standardize library sizes. Diversity analyses were performed using the phyloseq (v.1.38.0) [34] and microeco (v.1.5.0) [35] R packages. Alpha diversity was assessed with richness indices (observed OTUs), Shannon, and InvSimpson indices. Beta diversity was calculated by transforming sample counts with the Hellinger method (“vegan::decostand”) (v. 2.6.4) [36]. Principal coordinate analysis (PCoA) was conducted to examine microbial community composition across management systems, based on Bray–Curtis dissimilarity (“stats::cmdscale”) (v. 4.1.2) [30].

2.6.2. Taxonomic Composition

Taxonomic composition of bacterial communities was calculated using “microeco::cal_abund” (v.1.5.0) and visualized with ggplot2 (v.3.5.0) [37]. An UpSet plot was created to examine the distribution of bacterial genera across different soil management systems, using the UpSet package (v.1.4.0) [38].

2.6.3. Differentially Abundant Taxa

Differentially abundant (DA) taxa among systems were identified with the NOISeq-sim algorithm (v.2.38.0) [39] using parameters: k = NULL, norm = “tmm”, pnr = 0.2, lc = 1, replicates = “no”. NOISeq is a non-parametric method designed to identify differentially expressed features. In the absence of replicates, as applied here, the algorithm simulates technical replicates (but not biological replicates) using a multinomial distribution, resulting in a highly conservative approach to identifying differentially abundant taxa [40].
DA taxa were those with an adjusted probability (q) value ≥ 0.99. Correlations between DA taxa and soil physicochemical properties were determined via the Pearson correlation coefficient (r) analysis (“rstatix::cor_test”) (v.0.7.2) [41], with significant correlations identified at r ≥ 0.8 or r ≤ −0.8 and p ≤ 0.05.

3. Results

The values for pH, P, K+, Ca2+, Mg2+, and Zn2+ are higher in the areas under agricultural management, compared to native forests (Cerrado and Babassu forest), possibly influenced by the application of correctives and fertilizers (Table 2). It is important to highlight that clay contents are similar across the areas, which allows for the comparison between the land use systems using the differences in management as a basis. However, soil organic matter contents were higher in the Babassu forests and in the LFI system.

3.1. Sequencing and Data Processing

High-throughput sequencing of bacterial communities across different soil management systems yielded a total of 2,356,988 paired-end reads from the V3-V4 region of the 16S rRNA gene. These reads were distributed among six libraries, one for each management type, with an average of approximately 392,831 (±85,400) amplicons per library. After filtering for short reads, trimming low-quality regions, and removing sequences from mitochondria and chloroplasts, a total of 564,561 sequences remained, each with an average length of 411 bp. From these sequences, 11,627 ASVs were identified and clustered at 97% similarity, resulting in 8584 OTUs. Following rarefaction to match the smallest library (60,360 sequences) and removal of unique-count OTUs, 6653 OTUs remained.

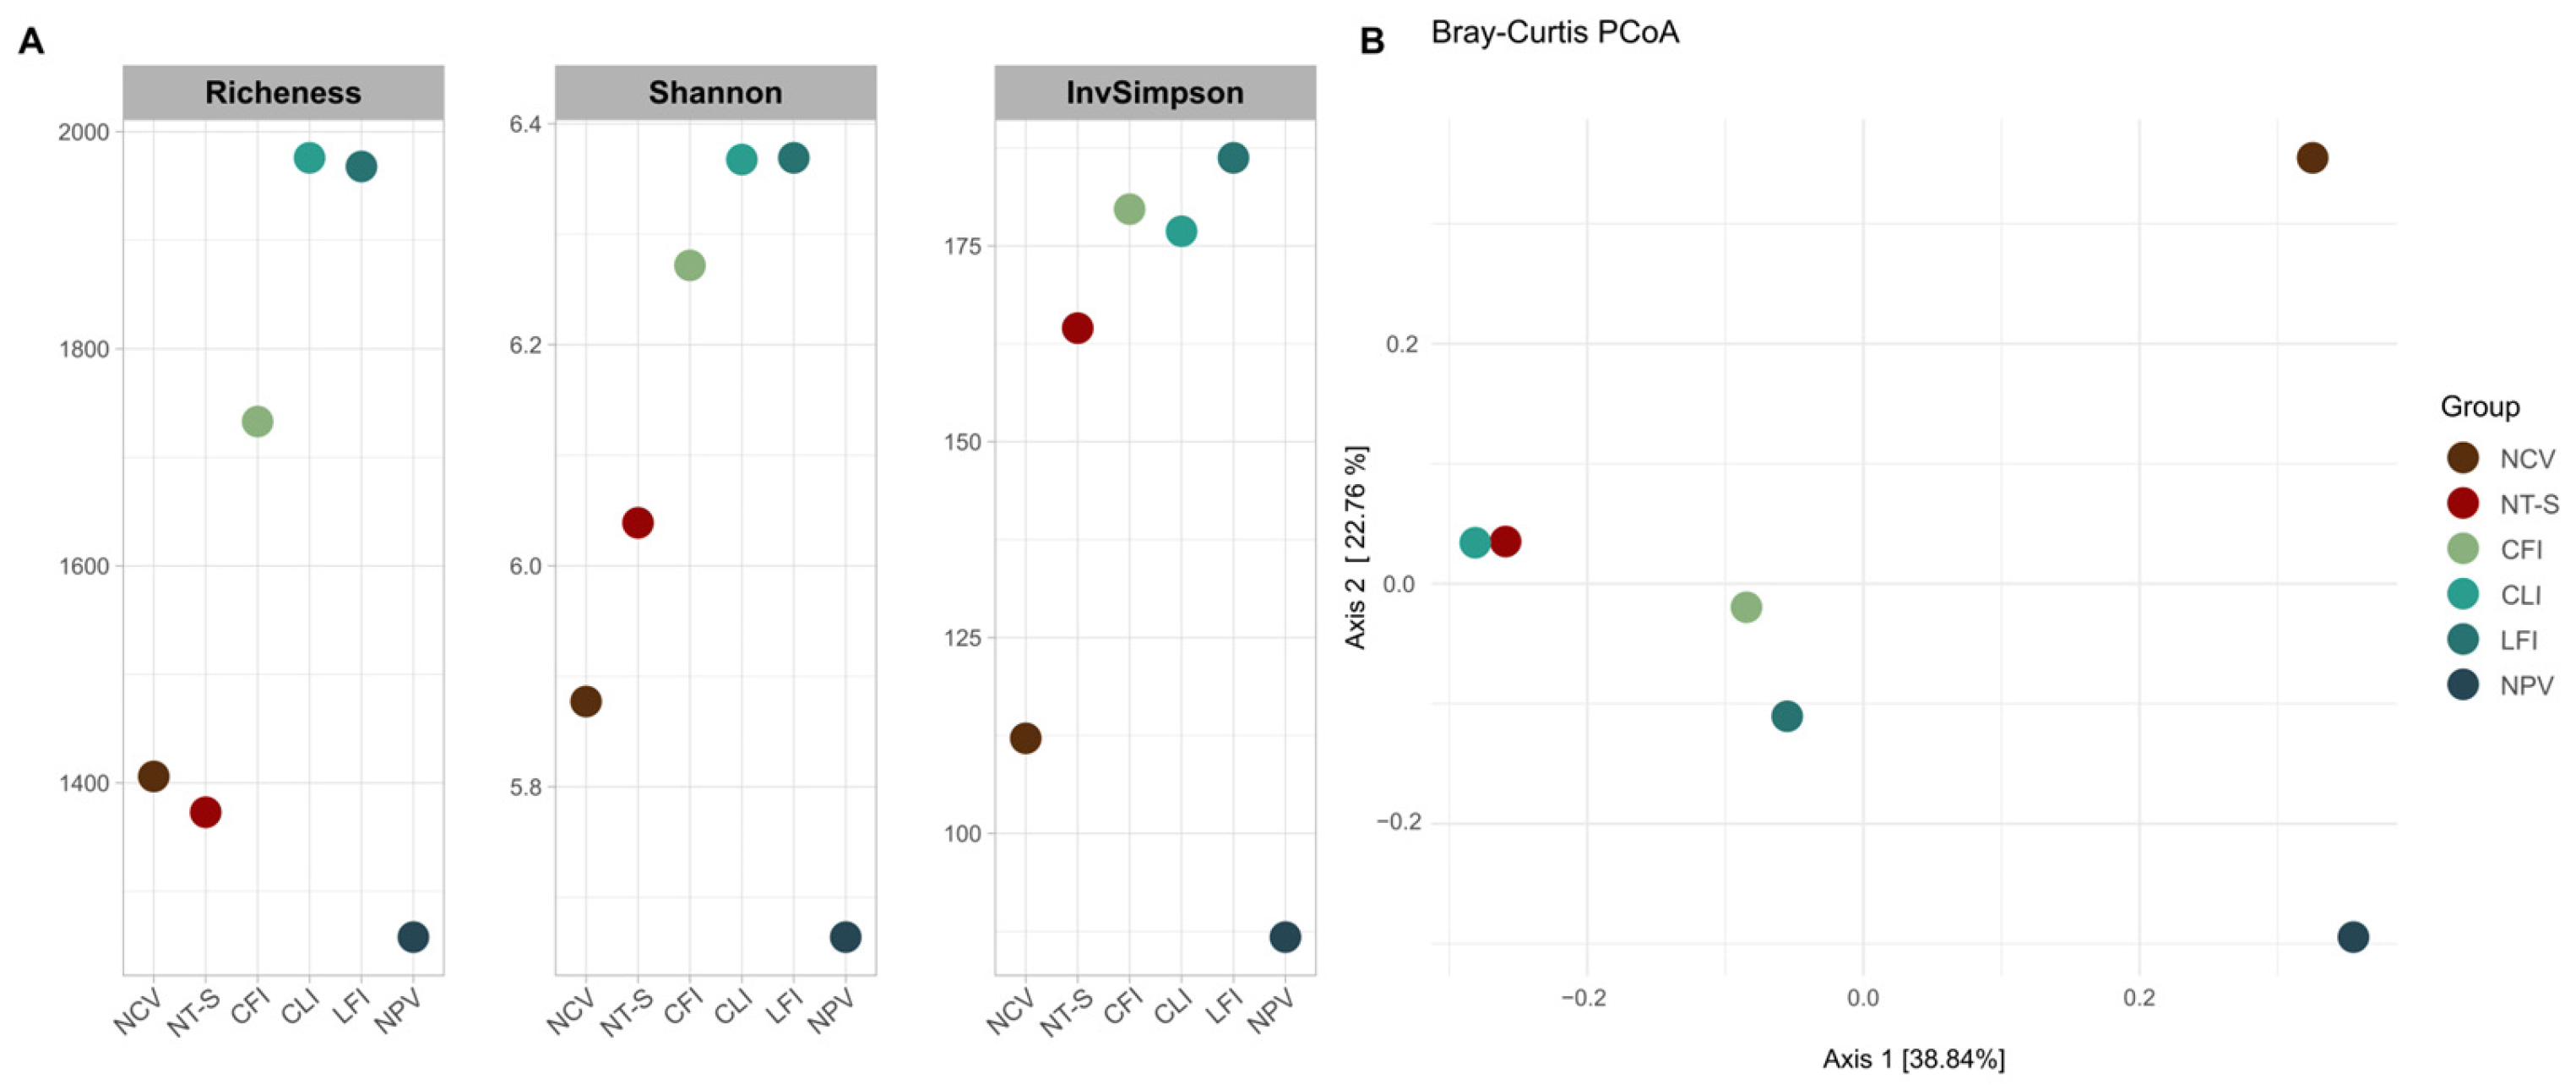
3.2. Structure and Diversity of Bacterial Communities

The rarefaction curve (Figure S2), based on observed OTUs, reached a saturation plateau, indicating that the sequencing depth was sufficient to capture the microbial diversity in each sample.
Bacterial diversity was higher in soils from integration systems than in other production systems (Figure 2A). Richness was slightly higher in NCV soil compared to NT-S soil, but Shannon and InvSimpson indices were higher for NT-S soil than for NCV. Among all systems, NPV had the lowest diversity measures (Figure 2A).
The PCoA analysis shows that soil samples from NCV and NPV areas are more distinct from other samples. Samples from integration systems are closer together, with CLI particularly showing proximity to NT-S soil. Differences among soil management systems accounted for 61.6% of the variance (Figure 2B).

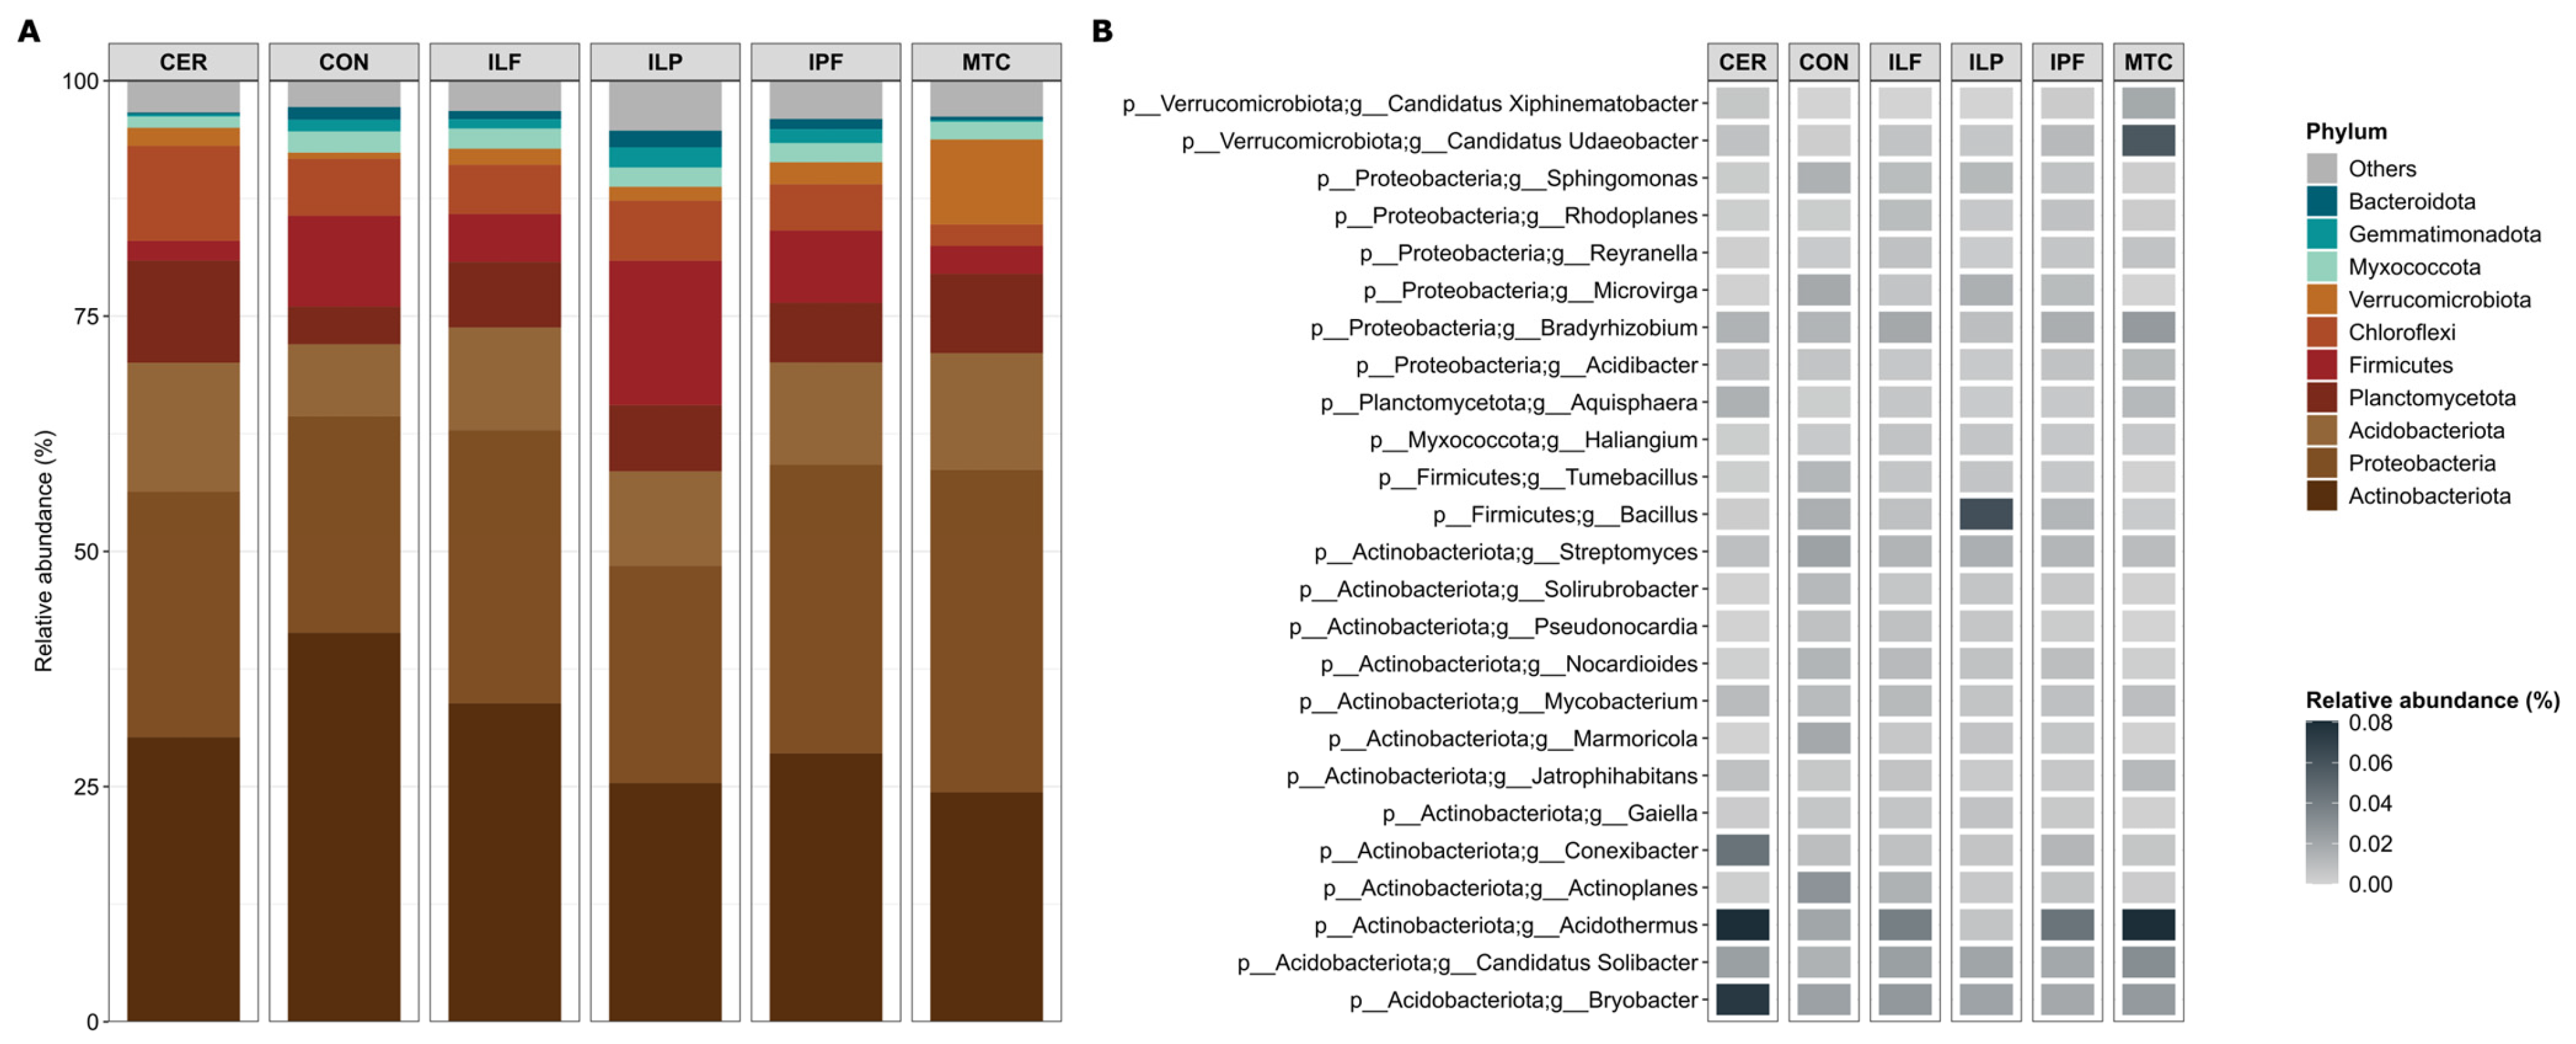
3.3. Taxonomic Composition of Bacterial Communities Associated with Different Management Systems

The bacterial communities were classified into 32 phyla, 78 classes, 162 orders, 211 families, and 348 genera, with 40 identified species. At the phylum level, the ten most abundant phyla accounted for an average of 98.8% of the total. Actinobacteria and Proteobacteria were the most dominant, representing 30.6% and 27.7% of the community, respectively (Figure 3A). Meanwhile, less abundant phyla, including Acidobacteriota, Planctomycetota, Firmicutes, Chloroflexi, Verrucomicrobiota, Myxococcota, Gemmatimonadota, and Bacteroidota, collectively contributed to 40.5% of the total abundance, with relative abundances ranging from 10.9% to 0.9% on average (Figure 3A; Table S1).
At the genus level, among the 25 most abundant (Figure 3B), Bacillus is notably abundant in CLI, while Conexibacter and Bryobacter are more prevalent in NCV. Acidothermus shows greater abundance in NCV and NPV soils. The complete distribution of OTUs across taxonomic levels can be found in the Supplementary Material (Table S1).
The OTU intersection analysis across various soil management systems revealed that most OTUs are specific to either a conventional cultivation or an integrated system (Figure 4). Among the 116 OTUs shared across all production systems, 32 were classified, with Acidothermus (OTU_142 and OTU_205), Actinoplanes (OTU_165), Bryobacter (OTU_78), Bradyrhizobium (OTU_178), and Candidatus Solibacter (OTU_179) having a total relative abundance exceeding 5% (Table S2).
The CLI management system hosts 1125 unique genera, making it the system with the highest exclusive genus diversity. The three integrated systems share 47 OTUs, of which 31 are unclassified at the genus level, and 16 are classified, including the genera Aeromicrobium (OTU_514), Bacillus (OTU_575), Candidatus Koribacter (OTU_1186), Cellulosimicrobium (OTU_1157), Devosia (OTU_378), Dokdonella (OTU_3341), Pedosphaeraceae Ellin517 (OTU_1767), Flavisolibacter (OTU_844), Geodermatophilus (OTU_919), Lysinibacillus (OTU_772), Nitrosomonadaceae MND1 (OTU_198), Nocardioides (OTU_164), Pseudarthrobacter (OTU_251), Pyrinomonadaceae RB41 (OTU_276), and Thermoanaerobaculaceae Subgroup 10 (OTU_921 and OTU_815).

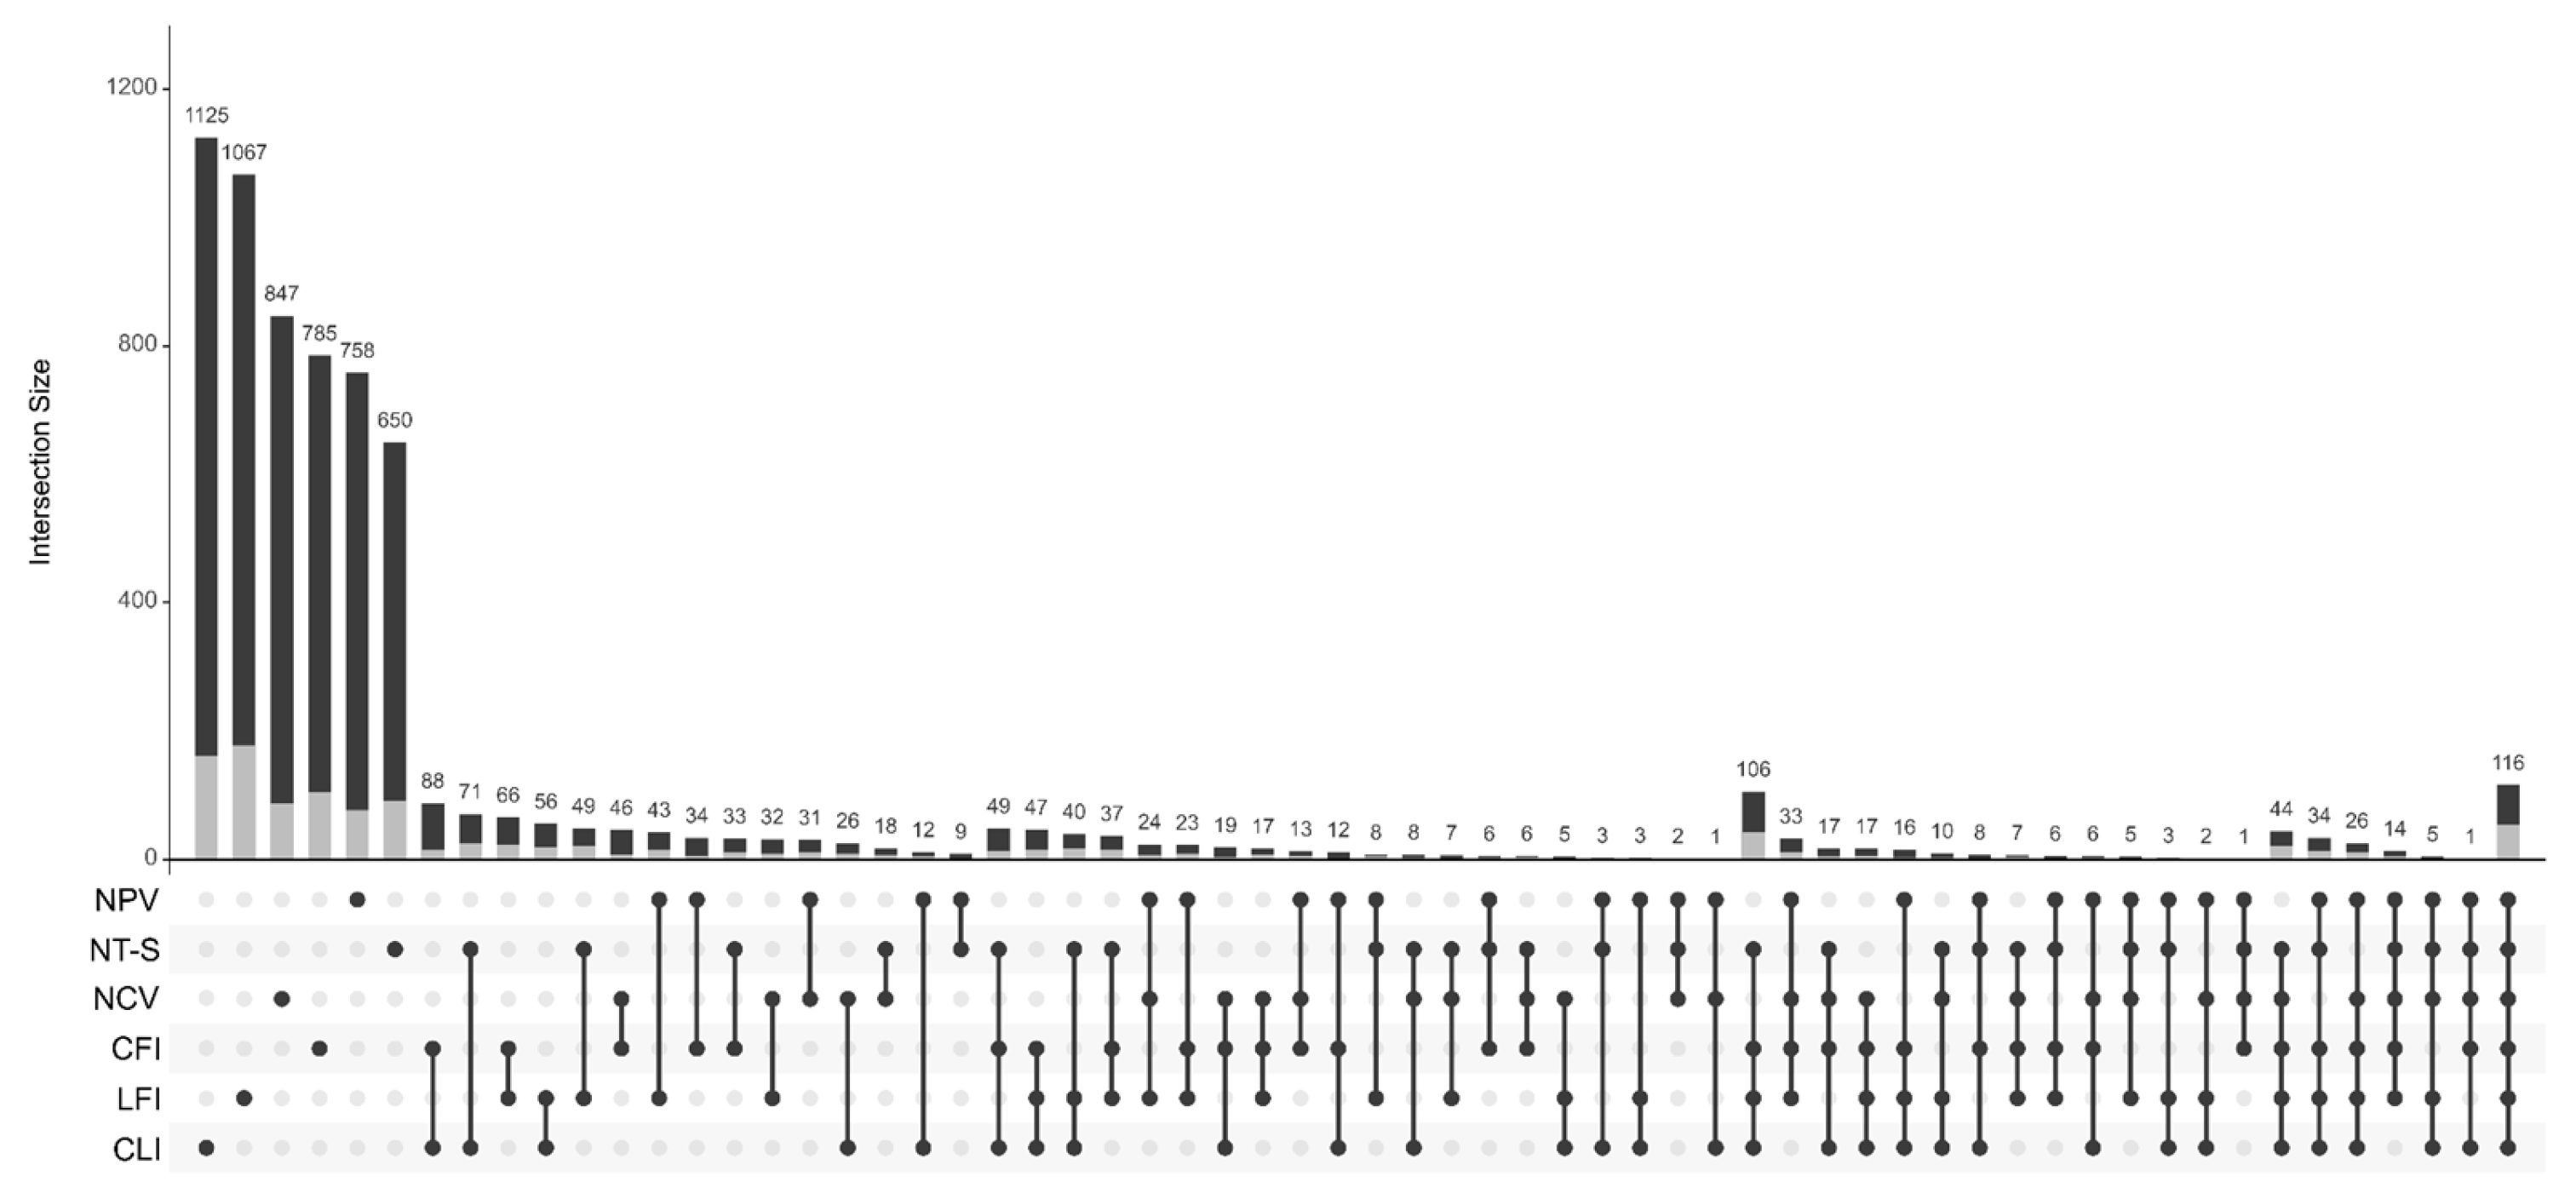
3.4. Differential Abundance of Taxa

The analysis of differentially abundant (DA) taxa in the different soil management systems resulted in the identification of a total of 181 taxa. Figure 5 presents the comparison matrix between the systems. All DA taxa are available in Table S3.
The analysis of differentially abundant taxa shows that samples from the various production systems form two distinct groups based on abundance: one group represents systems in human-altered (anthropized) environments, while the other is associated with systems in natural environments (Figure 6A).
The heatmap (Figure 6B) shows variations in abundance across the production systems. However, the 50 most abundant taxa do not exhibit a pattern unique to any single production system. Generally, the NCV and NPV systems show contrasting trends, with certain abundant taxa in NCV appearing with lower abundance in NPV. Despite being clustered together, these systems differ in terms of community composition. Within the group of integrated and conventional management systems (anthropized environments), there is a more heterogeneous profile, with some more abundant taxa in one system than in another. Overall, taxa abundance in these systems is higher when compared to NCV and NPV.

4. Discussion

Soil physicochemical properties greatly impact microbial communities, with pH being a key factor in determining microbial composition and functional diversity [42,43]. The NCV and NPV systems showed lower pH levels and reduced concentrations of phosphorus (P), basic cations, and zinc (Zn) compared to other systems. These elements are essential nutrients for both soil microorganisms and plants, supporting energy generation and nutrient cycling [42]. The observed differences in pH and nutrient levels are largely due to the application of lime and fertilizers, which helps replenish nutrients removed by crops. Furthermore, agricultural practices such as intercropping and crop rotation, frequently used in CLI, CFI, and LFI systems, enhance nutrient cycling [44,45,46,47,48]. This suggests that integration systems offer more favorable conditions for sustaining a diverse microbial community.
Our data showed a clear link between pH, Zn, P, and the abundance of 27 taxa (Figure 6B: from the top of the chart to the bottom), revealing a negative correlation between these elements and microbial abundance, except for family Micropepsaceae, which was positively associated with phosphorus and zinc. This indicates that as pH or P levels rise, the abundance of most of these taxa decreases. We also observed a slight increase in P in soils managed with integrated production systems (CLI, LFI, and CFI), which enhanced phosphorus availability compared to conventional management systems [7,49].
The results indicate that integrated production systems support greater bacterial diversity than no-tillage soybean (NT-S) areas and native soils, such as those in the Cerrado and Babassu forests. Among the integrated systems, CLI and LFI evidenced greater bacterial diversity and richness compared to CFI, indicating that the livestock component effectively contributed to the increase in these parameters. Other studies show that low-intensity grazing modulated the microbial composition by increasing the predominance of bacteria over fungi [50]. Grazing also induces the increase in bacterial diversity [51] and bacterial species richness, as demonstrated by Solari et al. (2021) [52] in CLI systems in the Cerrado of Central Brazil. These findings align with previous studies by Mendes et al. (2015) [53] and Merloti et al. (2019) [54], which reported higher bacterial diversity in agricultural fields compared to native forests. Their studies also noted that agricultural soils generally have lower pH and higher aluminum (Al) content, factors that likely influence microbial composition and structure, resulting in increased bacterial diversity.
Overall, the bacterial community was dominated by the phyla Actinobacteriota and Proteobacteria, consistent with findings by Costa et al. (2024) [9] in soybean soil and rhizospheres under no-till and crop–livestock integration in the same region. Actinobacteria comprises bacterial genera with potential for biological control, as plant growth promoters and for the production of extracellular hydrolytic enzymes [55]. This phylum showed greatest abundance in samples collected in the no-tillage soybean (NT-S) and CFI, possibly influenced by liming [56] and the decomposition of agricultural residues [57].
The soil samples collected in the CLI system, in addition to presenting the highest bacterial diversity similar to LFI, promoted an increase in the relative abundance of Firmicutes. This may be a consequence of the increased SOM content [58] and the activation of enzymes in the decomposition process [59]. Furthermore, Firmicutes can thrive in extreme conditions such as high temperatures [60], commonly observed in the region of our study. However, the abundance of Firmicutes in the LFI system is reduced compared to the CLI system. This suggests that the presence of the eucalyptus component may contribute to the decrease in the abundance of this phylum, which reinforces the need to search for other tree species capable of increasing the abundance of Bacillus.
In this study, integration systems particularly showed an enrichment of genera within the Nitrosomonadaceae and Sphingomonadaceae families. Previous research has identified MND1 from Nitrosomonadaceae as a key nitrifying bacterium in nitrogen cycling [61,62]. Other genera within this family, such as mle1-7, IS-44, and GOUTA6, were also more abundant in integration systems, with GOUTA6 notably enriched in LFI and even more so in NPV. The Sphingomonadaceae family is likely involved in using organic compounds from humic substance degradation [61]. Additionally, the Bacillaceae family, particularly Bacillus in the CLI system, plays multiple ecological roles in nutrient cycling and plant interactions [63].
Differently from the anthropized environments, the abundance of Acidothermus was highest in the natural ecosystems NCV and NPV (8%). Acidothermus is considered a cellulolytic bacteria in soils with endocellulase activity [64], decomposing cellulose in SOM under low pH conditions [65]. In our study, the areas under NCV and NPV presented lower pH values compared to the anthropized systems. Moreover, trees in these areas provided greater deposition of organic matter with high concentrations of cellulose and lignin, delaying the decomposition process of residues [66]. Cellulose content in native trees under Cerrado conditions can be higher than in exotic species such as eucalyptus [67]. Therefore, NCV and NPV met favorable conditions for the highest abundance of Acidothermus.
The influence of soil fertility and integrated systems in the abundance of Bradyrhizobium was also evidenced by our data. The great abundance values in NPV (2.5%) and NCV (1.4%) compared to ILP (0.9%) may be a consequence of low soil P concentration in the natural ecosystems (Table 2), since soil P is negatively correlated with the genus Bradyrhizobium and is one of the main environmental factors affecting its occurrence [68]. On the other hand, despite the high soil P values, the great abundance of Bradyrhizobium in CFI (1.9%) and LFI (1.6%) was possibly influenced by the presence of eucalyptus in these systems. The positive effects of the presence of eucalyptus trees on Bradyrhizobium abundance were also demonstrated by Huo et al. (2024) [68]. High Bradyrhizobium abundance also in NT-S (1.3%) compared to CLI was possibly influenced by yearly inoculation of seeds with Bradyrhizobium japonicum over 17 years of soybean cultivation in this area. Similarly, the genus Azospirillum, a nitrogen-fixing rhizobacteria from the Rhodospirillaceae family, was found to be more abundant in no-tillage soybean soil [69]. Analysis of dendrogram groupings revealed distinct clusters based on land use: annual crop areas (NT-S and CLI) formed one group; eucalyptus forest areas (CFI and LFI) formed another; and native forest areas (NCV and NPV) formed a third. Although NT-S and CLI are grouped together, notable differences exist, particularly in the soybean rhizosphere, as highlighted by Costa et al. (2024) [9]. These findings suggest that microbial communities adjust to different land use systems, offering insights that could guide management practices and crop selection to promote soil health.
Changes in land use for agribusiness expansion in the Cerrado biome can heighten this region’s vulnerability to negative impacts, including productivity and nutrient loss and increased greenhouse gas (GHG) emissions [70,71]. This study provides new insights into the impact of integrated production systems on the MATOPIBA region’s soil microbiome, showing that these systems enhance bacterial diversity, improve soil chemical properties, and boost nutrient availability.

5. Conclusions

This study highlights the significant potential of integrated production systems (CLI, CFI, and LFI) to enhance agricultural sustainability in the MATOPIBA region. These systems positively influence soil microbiota, increasing diversity and enriching key bacterial families, such as Nitrosomonadaceae and Bacillaceae, which are essential for nutrient cycling and ecological balance.
Our analysis also indicates that integrated systems improve soil chemical properties, such as pH and phosphorus levels, fostering soil resilience. Compared to no-till soybean systems and native vegetation, integrated systems demonstrate superior environmental benefits, including carbon sequestration and reduced greenhouse gas emissions. However, their large-scale adoption faces challenges, such as management complexity and the need for long-term assessments.
In conclusion, integrated systems represent a promising pathway for balancing agricultural productivity and environmental conservation, offering a scalable model for sustainable land use in the Cerrado biome.

Supplementary Materials

The following supporting information can be downloaded at: https://www.mdpi.com/article/10.3390/f16040626/s1, Table S1: Relative abundance by taxonomic level present in the different integrated production systems (CFI, CLI, and LFI), conventional management (NT-S), native forest with characteristic Cerrado vegetation (NCV), and a natural forest formed by Babassu trees (NPV). Table S2: Information on unique OTUs or those occurring in multiple systems, obtained from UpSet. The table presents the OTUs that are unique to a single site or shared, highlighting the distribution and frequency of these OTUs in different systems. Table S3: Differentially abundant bacterial taxa. Only probability (q) values ≤ 0.01 were considered differentially abundant. The relative abundance values in each condition are presented in the columns with the suffix “ab” and the z-score values, which were used to plot the most abundant taxa, are presented with the suffix “z-score”. Figure S1. Average rainfall and temperature values for the year 2022 in the Chapadinha region, Maranhão, Brazil. Source: INMET (2022). Figure S2. The rarefaction curve illustrates the relationship between sequencing depth and the number of bacterial ASVs detected for each sample, rarefied at 60,000 reads. The curve reaches a plateau, indicating that the sequencing depth was sufficient to capture most of the bacterial diversity in all samples.

Author Contributions

Conceptualization, R.B.d.A.N., H.A.d.S. and P.S.d.C.L.; Data curation, M.I.G.F., R.B.d.A.N., J.O.L.d.O.J., E.S., F.F.B., H.A.d.F.A., D.C.d.S., M.L.d.N.S., L.F.C.L., P.S.d.C.L. and D.G.P.; Formal analysis, M.I.G.F., N.S.M.L., C.C.F.S., P.S.d.C.L. and D.G.P.; Funding acquisition, E.G.d.M.L., H.A.d.S. and P.S.d.C.L.; Investigation, M.I.G.F., H.A.d.S. and P.S.d.C.L.; Methodology, M.I.G.F., N.S.M.L., C.C.F.S., H.A.d.S., J.O.L.d.O.J., E.S., F.F.B., L.F.C.L., P.S.d.C.L. and D.G.P.; Project administration, R.B.d.A.N., H.A.d.S., J.O.L.d.O.J., E.S. and P.S.d.C.L.; Resources, E.G.d.M.L., R.B.d.A.N., H.A.d.S., J.O.L.d.O.J., E.S., F.F.B. and P.S.d.C.L.; Supervision, R.B.d.A.N., H.A.d.S., J.O.L.d.O.J., E.S., L.F.C.L. and P.S.d.C.L.; Validation, M.I.G.F., N.S.M.L. and D.G.P.; Visualization, D.G.P.; Writing—original draft, M.I.G.F., N.S.M.L., H.A.d.F.A. and D.C.d.S.; Writing—review and editing, E.G.d.M.L., R.B.d.A.N., H.A.d.S., J.O.L.d.O.J., E.S., F.F.B., M.L.d.N.S., L.F.C.L., P.S.d.C.L. and D.G.P. All authors have read and agreed to the published version of the manuscript.

Funding

This study was funded in part by the Coordination for the Improvement of Higher Education Personnel—Brazil (CAPES)—Financial Code 001. This study was also supported by grants from the Brazilian Agricultural Research Corporation (Embrapa)—SEG #20.18.03.054.00.00 and #20.18.03.054.00.03.005.

Data Availability Statement

Raw sequencing data can be accessed from the NCBI public database—Sequence Read Archive (SRA), under accession number: PRJNA1176020.

Acknowledgments

The authors would like to thank the Coordination for the Improvement of Higher Education Personnel (CAPES) and the Brazilian Agricultural Research Corporation (Embrapa) for all the support for carrying out this research.

Conflicts of Interest

Authors Raimundo Bezerra de Araújo Neto, Henrique Antunes de Souza, José Oscar Lustosa de Oliveira Junior, Edvaldo Sagrilo, Flavio Favaro Blanco, Luiz Fernando Carvalho Leite, and Paulo Sarmanho da Costa Lima were employed by the company Brazilian Agricultural Research Corporation. The remaining authors declare that the research was conducted in the absence of any commercial or financial relationships that could be construed as a potential conflict of interest.

References

  1. Lima, M.; Silva Junior, C.A.D.; Rausch, L.; Gibbs, H.K.; Johann, J.A. Demystifying Sustainable Soy in Brazil. Land Use Policy 2019, 82, 349–352. [Google Scholar] [CrossRef]
  2. Pires, G.F.; Abrahão, G.M.; Brumatti, L.M.; Oliveira, L.J.C.; Costa, M.H.; Liddicoat, S.; Kato, E.; Ladle, R.J. Increased Climate Risk in Brazilian Double Cropping Agriculture Systems: Implications for Land Use in Northern Brazil. Agric. For. Meteorol. 2016, 228–229, 286–298. [Google Scholar] [CrossRef]
  3. de Almeida, R.E.M.; de Souza, H.A.; Evangelista, B.A.; Uhlmann, A.; Ramos, M.R.; Sagrilo, E.; dos Santos Dias, T.S.; de Sousa Paz Oliveira, L.R.; Costa, N.R. Challenges to Managing Soil Health in the Newest Agricultural Frontier in Brazil. In ASA, CSSA, and SSSA Books; Mendes, I.C., Cherubin, M.R., Eds.; Wiley: Hoboken, NJ, USA, 2024; pp. 327–374. ISBN 978-0-89118-743-1. [Google Scholar]
  4. Lustosa Filho, J.; Souza, H.; Almeida, R.; Leite, L. Conservação e Manejo Da Fertilidade Do Solo No Cerrado Do Matopiba. In Cerrado: Capital Natural e Serviços Ambientais; Paco Editorial: Jundiaí, Brazil, 2021; pp. 75–97. [Google Scholar]
  5. Souza, H.A.; Sagrilo, E.; Oliveira Junior, J.O.L.; Leite, L.F.C.; Vogado, R.F.; Santos, S.F.C.B.; Clark, M.V.G.; Barbosa, L.R.; Brito, L.C.R. Integração Lavoura-Pecuária-Floresta Com Componente Soja No Maranhão: Resultados de Pesquisa Em Unidades de Referência Tecnológica. In Soja Sustentável No Leste Maranhense: Realidade e Perspectivas; da Silva Cruz, A.P., Sander, N.L., de Oliveira, A.B., Ferreira, I.G.M., Eds.; CRV: Curitiba, Brazil, 2023; Volume 1, pp. 37–54. [Google Scholar]
  6. Teixeira Neto, M.L.; Carvalho, G.M.C.; de Araujo Neto, R.B.; de Azevedo, D.M.P.; da Frota, M.N.L.; das Chagas Monteiro, F.; de Souza, H.A.; de Alcantara, R.M.C.M.; de Andrade Junior, A.S.; Cardoso, M.J.; et al. Integração Lavoura-Pecuária-Floresta (ILPF) Nos Cerrados Do Piauí e Do Maranhão: Estratégia de Produção Para Quatro Safras Ao Ano Só Com Chuvas. In Solos Sustentáveis para a Agricultura No Nordeste; de Souza, H.A., Leite, L.F.C., Medeiros, J.C., Eds.; Embrapa: Brasília, Brazil, 2021. [Google Scholar]
  7. Silva, A.A.; Lacerda, J.J.D.J.; de Araújo-Neto, R.B.; Sagrilo, E.; Lustosa-Filho, J.F.; de Andrade, H.A.; de Souza, H.A. Integrated Agroforestry System Affects the Dynamics of Inorganic Phosphorus Fractions in the Savanna of Brazilian Northeast. Can. J. Soil Sci. 2024, 104, 181–190. [Google Scholar] [CrossRef]
  8. Vogado, R.F.; de Souza, H.A.; Sagrilo, E.; de Brito, L.D.C.R.; Matias, S.S.R.; Neto, M.L.T.; de Oliveira Junior, J.O.L.; de Andrade, H.A.F.; Leite, L.F.C. Soil Organic Carbon Stocks and Fractions Under Integrated Systems and Pasture in the Cerrado of Northeast Brazil. Catena 2024, 243, 108196. [Google Scholar] [CrossRef]
  9. Costa, R.M.; Araujo, E.M.B.; Silva, D.E.O.; Rocha, S.M.B.; Bonifacio, A.; Sousa, R.S.; de Araujo Pereira, A.P.; de Medeiros, E.V.; Sagrilo, E.; de Oliveira Junior, J.O.L.; et al. Seasonal Responses of Soil Microbial Biomass C and Enzymatic Activity Comparing No-Tillage and Integrated Crop-Livestock Systems. Eur. J. Soil Biol. 2024, 121, 103628. [Google Scholar] [CrossRef]
  10. Bernardino, F.D.S.; Garcia, R. Sistemas Silvipastoris. Pesqui. Florest. Bras. 2009, 60, 77–87. [Google Scholar]
  11. Macedo, R.; Vale, A.; Venturin, N. Eucalipto Em Sistemas Agroflorestais: Lavras; Editora da UFLA: Lavras, Brazil, 2010. [Google Scholar]
  12. Salton, J.C.; Mielniczuk, J.; Bayer, C.; Fabrício, A.C.; Macedo, M.C.M.; Broch, D.L. Teor e Dinâmica Do Carbono No Solo Em Sistemas de Integração Lavoura-Pecuária. Pesqui. Agropecuária Bras. 2011, 46, 1349–1356. [Google Scholar] [CrossRef]
  13. Carvalho, J.L.N.; Avanzi, J.C.; Silva, M.L.N.; de Mello, C.R.; Cerri, C.E.P. Potencial de Sequestro de Carbono Em Diferentes Biomas Do Brasil. Rev. Bras. Ciência Solo 2010, 34, 277–290. [Google Scholar] [CrossRef]
  14. Salton, J.C.; Mercante, F.M.; Tomazi, M.; Zanatta, J.A.; Concenço, G.; Silva, W.M.; Retore, M. Integrated Crop-Livestock System in Tropical Brazil: Toward a Sustainable Production System. Agric. Ecosyst. Environ. 2014, 190, 70–79. [Google Scholar] [CrossRef]
  15. Leite, L.F.C.; de Freitas, R.D.C.A.; Sagrilo, E.; Galvão, S.R.D.S. Decomposição e Liberação de Nutrientes de Resíduos Vegetais Depositados Sobre Latossolo Amarelo No Cerrado Maranhense. Rev. Ciência Agronômica 2010, 41, 29–35. [Google Scholar]
  16. Costa, S.; Souza, E.; Anghinoni, I.; Carvalho, P.; Martins, A.; Kunrath, T.; Cecagno, D.; Balerini, F. Impact of an Integrated No-till Crop–Livestock System on Phosphorus Distribution, Availability and Stock. Agric. Ecosyst. Environ. 2014, 190, 43–51. [Google Scholar] [CrossRef]
  17. Marchão, R.L.; Lavelle, P.; Celini, L.; Balbino, L.C.; Vilela, L.; Becquer, T. Soil Macrofauna under Integrated Crop-Livestock Systems in a Brazilian Cerrado Ferralsol. Pesqui. Agropecuária Bras. 2009, 44, 1011–1020. [Google Scholar] [CrossRef]
  18. Malewski, T.; Borowik, P.; Golińska, P.; Okorski, A.; Olejarski, I.; Oszako, T. Organic Inputs Positively Alter the Bacteriome of Post-Agricultural Soils. Forests 2023, 14, 1711. [Google Scholar] [CrossRef]
  19. Raimi, A.R.; Ezeokoli, O.T.; Adeleke, R.A. Soil Nutrient Management Influences Diversity, Community Association and Functional Structure of Rhizosphere Bacteriome Under Vegetable Crop Production. Front. Microbiol. 2023, 14, 1229873. [Google Scholar] [CrossRef]
  20. Passos, M.L.V.; Zambrzycki, G.C.; Pereira, R.S. Balanço Hídrico Climatológico e Classificação Climática Para o Município de Balsas-MA. Sci. Agrar. 2017, 18, 83–89. [Google Scholar] [CrossRef]
  21. Dantas, J.S.; Marques Júnior, J.; Martins Filho, M.V.; Resende, J.M.D.A.; Camargo, L.A.; Barbosa, R.S. Gênese de Solos Coesos Do Leste Maranhense: Relação Solo-Paisagem. Rev. Bras. Ciênc. Solo 2014, 38, 1039–1050. [Google Scholar] [CrossRef]
  22. de Sousa, D.M.G.; Lobato, E. Cerrado: Correção Do Solo e Adubação, 2nd ed.; Embrapa Informação Tecnológica; Embrapa Cerrados: Brasília, DF, Brazil, 2004. [Google Scholar]
  23. Furley, P.A. The Nature and Diversity of Neotropical Savanna Vegetation with Particular Reference to the Brazilian Cerrados. Glob. Ecol. Biogeogr. 1999, 8, 223–241. [Google Scholar] [CrossRef]
  24. Klindworth, A.; Pruesse, E.; Schweer, T.; Peplies, J.; Quast, C.; Horn, M.; Glöckner, F.O. Evaluation of General 16S Ribosomal RNA Gene PCR Primers for Classical and Next-Generation Sequencing-Based Diversity Studies. Nucleic Acids Res. 2013, 41, e1. [Google Scholar] [CrossRef]
  25. Andrews, S. FastQC: A Quality Control Tool for High Throughput Sequence Data; Babraham Bioinformatics: Babraham, UK, 2010. [Google Scholar]
  26. Didion, J.P.; Martin, M.; Collins, F.S. Atropos: Specific, Sensitive, and Speedy Trimming of Sequencing Reads. PeerJ 2017, 5, e3720. [Google Scholar] [CrossRef]
  27. Chen, S.; Zhou, Y.; Chen, Y.; Gu, J. Fastp: An Ultra-Fast All-in-One FASTQ Preprocessor. Bioinformatics 2018, 34, i884–i890. [Google Scholar] [CrossRef]
  28. Magoč, T.; Salzberg, S.L. FLASH: Fast Length Adjustment of Short Reads to Improve Genome Assemblies. Bioinformatics 2011, 27, 2957–2963. [Google Scholar] [CrossRef] [PubMed]
  29. Callahan, B.J.; McMurdie, P.J.; Rosen, M.J.; Han, A.W.; Johnson, A.J.A.; Holmes, S.P. DADA2: High-Resolution Sample Inference from Illumina Amplicon Data. Nat. Methods 2016, 13, 581–583. [Google Scholar] [CrossRef] [PubMed]
  30. R Core Team. R: A Language and Environment for Statistical Computing; R Foundation for Statistical Computing: Vienna, Austria, 2021. [Google Scholar]
  31. Quast, C.; Pruesse, E.; Yilmaz, P.; Gerken, J.; Schweer, T.; Yarza, P.; Peplies, J.; Glöckner, F.O. The SILVA Ribosomal RNA Gene Database Project: Improved Data Processing and Web-Based Tools. Nucleic Acids Res. 2012, 41, D590–D596. [Google Scholar] [CrossRef]
  32. Wang, Q.; Garrity, G.M.; Tiedje, J.M.; Cole, J.R. Naïve Bayesian Classifier for Rapid Assignment of rRNA Sequences into the New Bacterial Taxonomy. Appl. Environ. Microbiol. 2007, 73, 5261–5267. [Google Scholar] [CrossRef] [PubMed]
  33. Wright, E.S. Using DECIPHER V2.0 to Analyze Big Biological Sequence Data in R. R J. 2016, 8, 352–359. [Google Scholar] [CrossRef]
  34. McMurdie, P.J.; Holmes, S. Phyloseq: An R Package for Reproducible Interactive Analysis and Graphics of Microbiome Census Data. PLoS ONE 2013, 8, e61217. [Google Scholar] [CrossRef]
  35. Liu, C.; Cui, Y.; Li, X.; Yao, M. Microeco: An R Package for Data Mining in Microbial Community Ecology. FEMS Microbiol. Ecol. 2021, 97, fiaa255. [Google Scholar] [CrossRef]
  36. Oksanen, J. Vegan: Community Ecology Package. 2010. Available online: https://cran.r-project.org/web/packages/vegan/index.html (accessed on 2 March 2025).
  37. Wickham, H. Ggplot2: Elegant Graphics for Data Analysis; Springer: New York, NY, USA, 2016; ISBN 978-3-319-24277-4. [Google Scholar]
  38. Conway, J.R.; Lex, A.; Gehlenborg, N. UpSetR: An R Package for the Visualization of Intersecting Sets and Their Properties. Bioinformatics 2017, 33, 2938–2940. [Google Scholar] [CrossRef]
  39. Tarazona, S.; Furió-Tarí, P.; Turrà, D.; Pietro, A.D.; Nueda, M.J.; Ferrer, A.; Conesa, A. Data Quality Aware Analysis of Differential Expression in RNA-Seq with NOISeq R/Bioc Package. Nucleic Acids Res. 2015, 43, e140. [Google Scholar] [CrossRef]
  40. Tarazona, S.; García-Alcalde, F.; Dopazo, J.; Ferrer, A.; Conesa, A. Differential Expression in RNA-Seq: A Matter of Depth. Genome Res. 2011, 21, 2213–2223. [Google Scholar] [CrossRef]
  41. Kassambara, A. Rstatix: Pipe-Friendly Framework for Basic Statistical Tests. 2023. Available online: https://cran.r-project.org/web/packages/rstatix/index.html (accessed on 2 March 2025).
  42. Philippot, L.; Chenu, C.; Kappler, A.; Rillig, M.C.; Fierer, N. The Interplay Between Microbial Communities and Soil Properties. Nat. Rev. Microbiol. 2024, 22, 226–239. [Google Scholar] [CrossRef] [PubMed]
  43. Muneer, M.A.; Hou, W.; Li, J.; Huang, X.; Ur Rehman Kayani, M.; Cai, Y.; Yang, W.; Wu, L.; Ji, B.; Zheng, C. Soil pH: A Key Edaphic Factor Regulating Distribution and Functions of Bacterial Community Along Vertical Soil Profiles in Red Soil of Pomelo Orchard. BMC Microbiol. 2022, 22, 38. [Google Scholar] [CrossRef] [PubMed]
  44. de Brito, L.D.C.R.; Souza, H.A.D.; Araújo Neto, R.B.D.; Azevedo, D.M.P.D.; Sagrilo, E.; Vogado, R.F.; Carvalho, S.P.; Ferreira, A.C.D.M.; Cavigelli, M.A. Improved Soil Fertility, Plant Nutrition and Grain Yield of Soybean and Millet Following Maize Intercropped with Forage Grasses and Crotalaria in the Brazilian Savanna. Crop Pasture Sci. 2023, 74, 438–448. [Google Scholar] [CrossRef]
  45. de, C.R.; de Brito, L.; de Souza, H.A.; Deon, D.S.; de Souza, I.M.; dos Santos, S.F.D.C.B.; Sobral, A.H.S. Greenhouse Gas Emissions and Chemical and Physical Soil Attributes of Off-Season Agricultural Production Systems in The Savannah of Maranhão State, Brazil. Eng. Agrícola 2023, 43, e20220181. [Google Scholar]
  46. dos Santos, S.F.D.C.B.; de Souza, H.A.; de Araújo Neto, R.B.; Sagrilo, E.; Ferreira, A.C.M.; Carvalho, S.P.; de Brito, L.D.C.R.; Leite, L.F.C. Soil Microbiological Attributes and Soybean Grain Yield in Succession to Corn Intercropped with Forage in the Maranhão Eastern Cerrado. Int. J. Plant Prod. 2021, 15, 669–677. [Google Scholar] [CrossRef]
  47. Silva, A.A.; Lacerda, J.J.D.J.; Carvalho, S.P.; Ferreira, R.D.S.; Brito, R.R.D.; Vogado, R.F.; Araújo Neto, R.B.D.; Sagrilo, E.; Cavigelli, M.A.; Souza, H.A.D. Chemical and Biological Attributes of Soil and Soybean (Glycine max) Yield in Integrated Systems in the Cerrado of North-East Brazil. Soil Res. 2024, 62, SR23120. [Google Scholar] [CrossRef]
  48. Souza, I.M.D.; Sagrilo, E.; de Oliveira Júnior, J.O.L.; Araújo, M.D.M.; Muniz, L.C.; Costa, J.B.; Pompeu, R.C.F.F.; de Sousa, D.C.; de Andrade, H.A.F.; de Oliveira Neto, E.D.; et al. Soil Chemical Quality in Integrated Production Systems with the Presence of Native and Exotic Tree Components in the Brazilian Eastern Amazon. Forests 2024, 15, 1078. [Google Scholar] [CrossRef]
  49. Damian, J.M.; Firmano, R.F.; Cherubin, M.R.; Pavinato, P.S.; De Marchi Soares, T.; Paustian, K.; Cerri, C.E.P. Changes in Soil Phosphorus Pool Induced by Pastureland Intensification and Diversification in Brazil. Sci. Total Environ. 2020, 703, 135463. [Google Scholar] [CrossRef]
  50. Xun, W.; Yan, R.; Ren, Y.; Jin, D.; Xiong, W.; Zhang, G.; Cui, Z.; Xin, X.; Zhang, R. Grazing-Induced Microbiome Alterations Drive Soil Organic Carbon Turnover and Productivity in Meadow Steppe. Microbiome 2018, 6, 170. [Google Scholar] [CrossRef]
  51. Wu, Y.; Chen, D.; Delgado-Baquerizo, M.; Liu, S.; Wang, B.; Wu, J.; Hu, S.; Bai, Y. Long-Term Regional Evidence of the Effects of Livestock Grazing on Soil Microbial Community Structure and Functions in Surface and Deep Soil Layers. Soil Biol. Biochem. 2022, 168, 108629. [Google Scholar] [CrossRef]
  52. Selari, P.J.R.G.; Olchanheski, L.R.; Ferreira, A.J.; Paim, T.D.P.; Calgaro Junior, G.; Claudio, F.L.; Alves, E.M.; Santos, D.D.C.; Araújo, W.L.; Silva, F.G. Short-Term Effect in Soil Microbial Community of Two Strategies of Recovering Degraded Area in Brazilian Savanna: A Pilot Case Study. Front. Microbiol. 2021, 12, 661410. [Google Scholar] [CrossRef] [PubMed]
  53. Mendes, L.W.; Tsai, S.M.; Navarrete, A.A.; De Hollander, M.; Van Veen, J.A.; Kuramae, E.E. Soil-Borne Microbiome: Linking Diversity to Function. Microb. Ecol. 2015, 70, 255–265. [Google Scholar] [CrossRef] [PubMed]
  54. Merloti, L.F.; Mendes, L.W.; Pedrinho, A.; De Souza, L.F.; Ferrari, B.M.; Tsai, S.M. Forest-to-Agriculture Conversion in Amazon Drives Soil Microbial Communities and N-Cycle. Soil Biol. Biochem. 2019, 137, 107567. [Google Scholar] [CrossRef]
  55. Barka, E.A.; Vatsa, P.; Sanchez, L.; Gaveau-Vaillant, N.; Jacquard, C.; Klenk, H.-P.; Clément, C.; Ouhdouch, Y.; Van Wezel, G.P. Taxonomy, Physiology, and Natural Products of Actinobacteria. Microbiol. Mol. Biol. Rev. 2016, 80, 1–43. [Google Scholar] [CrossRef]
  56. Madegwa, Y.M.; Uchida, Y. Liming Improves the Stability of Soil Microbial Community Structures Against the Application of Digestate Made from Dairy Wastes. J. Environ. Manag. 2021, 297, 113356. [Google Scholar] [CrossRef]
  57. Bhatti, A.A.; Haq, S.; Bhat, R.A. Actinomycetes Benefaction Role in Soil and Plant Health. Microb. Pathog. 2017, 111, 458–467. [Google Scholar] [CrossRef]
  58. Cleveland, C.C.; Nemergut, D.R.; Schmidt, S.K.; Townsend, A.R. Increases in Soil Respiration Following Labile Carbon Additions Linked to Rapid Shifts in Soil Microbial Community Composition. Biogeochemistry 2007, 82, 229–240. [Google Scholar] [CrossRef]
  59. Francioli, D.; Schulz, E.; Lentendu, G.; Wubet, T.; Buscot, F.; Reitz, T. Mineral vs. Organic Amendments: Microbial Community Structure, Activity and Abundance of Agriculturally Relevant Microbes Are Driven by Long-Term Fertilization Strategies. Front. Microbiol. 2016, 7, 1446. [Google Scholar] [CrossRef]
  60. Reid, R.P.; Oehlert, A.M.; Suosaari, E.P.; Demergasso, C.; Chong, G.; Escudero, L.V.; Piggot, A.M.; Lascu, I.; Palma, A.T. Electrical Conductivity as a Driver of Biological and Geological Spatial Heterogeneity in the Puquios, Salar de Llamara, Atacama Desert, Chile. Sci. Rep. 2021, 11, 12769. [Google Scholar] [CrossRef]
  61. McDonald, M.D.; Lewis, K.L.; Blazier, J.C.; Gentry, T.J. Semi-Arid Soil Bacterial Communities Are Refined by Altered Plant Selection Pressure Under Conservation Management Practices. Appl. Soil Ecol. 2024, 194, 105191. [Google Scholar] [CrossRef]
  62. Chinta, Y.D.; Araki, H. Responses of Bulk and Rhizosphere Soil Microbiomes to Different Cover Crop Inputs and Their Connection and Contribution to Soil Fertility and Plant Growth. Pedobiologia 2023, 101, 150907. [Google Scholar] [CrossRef]
  63. Saxena, A.K.; Kumar, M.; Chakdar, H.; Anuroopa, N.; Bagyaraj, D.J. Bacillus Species in Soil as a Natural Resource for Plant Health and Nutrition. J. Appl. Microbiol. 2020, 128, 1583–1594. [Google Scholar] [CrossRef] [PubMed]
  64. Talia, P.; Sede, S.M.; Campos, E.; Rorig, M.; Principi, D.; Tosto, D.; Hopp, H.E.; Grasso, D.; Cataldi, A. Biodiversity Characterization of Cellulolytic Bacteria Present on Native Chaco Soil by Comparison of Ribosomal RNA Genes. Res. Microbiol. 2012, 163, 221–232. [Google Scholar] [CrossRef] [PubMed]
  65. Wang, J.L.; Liu, K.L.; Zhao, X.Q.; Gao, G.-F.; Wu, Y.H.; Shen, R.F. Microbial Keystone Taxa Drive Crop Productivity Through Shifting Aboveground-Belowground Mineral Element Flows. Sci. Total Environ. 2022, 811, 152342. [Google Scholar] [CrossRef]
  66. de Sousa, C.E.S.; Amaral Júnior, F.P.; Cardoso, A.D.S.; Ruggieri, A.C.; Van Cleef, F.D.O.S.; de Pádua, F.T.; Almeida, J.C.D.C. Effects of Integrating Legumes or Trees on Soil C Stock and Organic Matter Dynamics in Tropical Grasslands. Appl. Soil Ecol. 2024, 202, 105560. [Google Scholar] [CrossRef]
  67. Moretti, M.S.; Becker, B.; Kiffer, W.P.; da Penha, L.O.; Callisto, M. Eucalyptus Leaves Are Preferred to Cerrado Native Species but Do Not Constitute a Better Food Resource to Stream Shredders. J. Arid Environ. 2020, 181, 104221. [Google Scholar] [CrossRef]
  68. Huo, C.; Zhang, J.; Yang, X.; Li, X.; Su, Y.; Chen, Z. Dry Season Irrigation Promotes Nutrient Cycling by Reorganizing Eucalyptus Rhizosphere Microbiome. Sci. Total Environ. 2024, 954, 176307. [Google Scholar] [CrossRef]
  69. Steenhoudt, O.; Vanderleyden, J. Azospirillum, a Free-Living Nitrogen-Fixing Bacterium Closely Associated with Grasses: Genetic, Biochemical and Ecological Aspects. FEMS Microbiol. Rev. 2000, 24, 487–506. [Google Scholar] [CrossRef]
  70. Gomes, L.; Simões, S.; Dalla Nora, E.; de Sousa-Neto, E.; Forti, M.; Ometto, J. Agricultural Expansion in the Brazilian Cerrado: Increased Soil and Nutrient Losses and Decreased Agricultural Productivity. Land 2019, 8, 12. [Google Scholar] [CrossRef]
  71. Oliveira, D.M.S.; Santos, R.S.; Chizzotti, F.H.M.; Bretas, I.L.; Franco, A.L.C.; Lima, R.P.; Freitas, D.A.F.; Cherubin, M.R.; Cerri, C.E.P. Crop, Livestock, and Forestry Integration to Reconcile Soil Health, Food Production, and Climate Change Mitigation in the Brazilian Cerrado: A Review. Geoderma Reg. 2024, 37, e00796. [Google Scholar] [CrossRef]
Figure 1. Study site in the MATOPIBA region (Cerrado Biome), Barbosa Farm, Brejo, Maranhão, Brazil.
Forests 16 00626 g001
Figure 2. Richness (observed) and diversity indices (Shannon and InvSimpson) (A) measured for each cropping system. Principal coordinate analysis (PCoA) based on Bray–Curtis distance matrices (OTUs matrix with Hellinger transformation) (B), at Barbosa farm, Brejo, Maranhão, Brazil, 2022. Distances between points in the ordination plot reflect differences in community structure among microbial communities from native Cerrado vegetation (NCV), no-till soybean (NT-S), crop–forest integration (CFI), crop–forestry integration (CLI), livestock–forestry integration (LFI), and native Babassu palm vegetation (NPV) soils. Variation in microbial community structure is explained by each axis and is presented in brackets in the graph.
Forests 16 00626 g002
Figure 3. Relative abundance of the 10 most abundant bacterial phyla (A), minor phyla are combined in the “Others” category at Barbosa farm, Brejo, Maranhão, Brazil, 2022. Relative abundance of the 25 identified bacterial genera that were most abundant considering the sum of the abundances in the six soil management systems (B).
Forests 16 00626 g003
Figure 4. UpSet plot composed of OTUs present in the different production systems at Barbosa farm, Brejo, Maranhão, Brazil, 2022. Circles indicate the system. Lines connecting the circles indicate sharing between systems. Stacked bars indicate the size of the intersection (number of OTUs) for each set, where light gray bars represent OTUs with identification up to the genus level, while the black portion indicates OTUs not classified to genus.
Forests 16 00626 g004
Figure 5. Distribution matrix of differentially abundant taxa by production system at Barbosa farm, Brejo, Maranhão, Brazil, 2022. Number of differentially abundant taxa between treatments (row × column).
Forests 16 00626 g005
Figure 6. Differentially abundant (DA) taxa at Barbosa farm, Brejo, Maranhão, Brazil, 2022. (A) Dendrogram of sample clustering based on the Bray–Curtis distance of differentially abundant (DA) taxa, samples were clustered using the average linkage method. (B) Heatmap of the top 50 taxa plus 4 additional important taxa associated with the nitrogen cycle, with probability (q) ≥ 0.99. Different letters indicate differences in comparisons between production systems, while the colors indicate the abundance of the taxa expressed in the Z-score scale (brown and green gradients represent abundance below the average and abundance above the average), i.e., abundances greater than the average are indicated in green while those lower than the average are indicated in brown. The heatmap on the right represents the correlation between the taxa and soil physicochemical parameters (black and red gradients represent negative and positive correlation values, respectively). The asterisk indicates a strong correlation (r ≥ 0.8 or r ≤ −0.8) with statistical significance (p ≤ 0.05).
Forests 16 00626 g006
Table 1. Management history of land use systems evaluated in the study area in 2022, Brejo, Maranhão, Brazil.
DescriptionHistory
Livestock–forestry integration (LFI)Native forest clearance took place in 2016, followed by conventional soil preparation with the application of 5 t ha−1 of calcitic limestone, which was incorporated using a 28” plough, then scarified and leveled. The next year, the area was converted to rice cultivation (Oryza sativa) with fertilization rates of 250 kg ha−1 of N, 500 kg ha−1 of P2O5, and 300 kg ha−1 of K2O. In 2018, eucalyptus (Eucalyptus globulus) was planted in an east–west orientation in triple rows spaced 4 m apart, with 3 m between plants, creating a 30 m gap between tree rows over a length of 160 m. In the spaces between the eucalyptus rows, a mixed cropping of maize (Zea mays) and Tamani grass (Megathyrsus maximus—BRS Tamani hybrid) was grown. No additional soil preparation was conducted from 2019 onward. In 2020, the maize and Tamani grass intercropping was replanted, and after the maize harvest, cattle were introduced at a stocking rate of 2.5 AU ha−1, with Tamani grass maintained through 2022. Maize fertilization followed the technical recommendations [22].
No-till soybean (NT-S)This area has been under no-till soybean cultivation (Glycine max) on millet straw (Pennisetum glaucum L.) for 17 years. In 2003, native Cerrado vegetation was cleared, and mechanized agriculture began, involving conventional soil preparation with intensive tillage, application of correctives, and 2 t ha−1 of calcitic limestone. In 2004, conservation soil management practices were introduced, reducing tillage and planting soybeans. By 2005, a no-till system (NT-S) was established and continues today, with a soybean/millet rotation. Soybean seeds are inoculated with Bradyrhizobium japonicum before planting.
For the 2022 season, soybean management included (i) desiccation of millet straw with 2 L ha−1 of glyphosate and 1 L ha−1 of 2,4-D amine; (ii) planting fertilization with 150 kg ha−1 of monoammonium phosphate (MAP) and 170 kg ha−1 of potassium chloride (KCl), plus 38 kg ha−1 of MIB 77 (containing 3% S, 1.8% B, 0.8% Cu, 0.1% Mo, 2% Mn, and 9% Zn); and (iii) an additional 100 kg ha−1 of ammonium sulfate applied 10 days post-emergence, following technical guidelines [22]. Micronutrients were applied as foliar sprays during crop growth, with pest, disease, and weed control performed chemically as needed. After each soybean harvest, millet seeds were broadcasted at a rate of 20 kg ha−1 of seed without additional fertilization.
Crop–forestry integration (CFI)The area was cleared in 2004, and upland rice was planted in the following year. From 2006 to 2010, soybeans were cultivated in a monoculture system. Between 2011 and 2016, the land was managed under a crop–livestock integration (CLI) system, with intercropped maize and brachiaria and a soybean/millet rotation for five years. In 2017, a crop–forest integration (CFI) system was introduced, adding three rows of eucalyptus trees spaced 3 m × 4 m within rows and 30 m between rows, where annual crops were cultivated. At the end of 2016, the entire area received 3 t ha−1 of dolomitic limestone (effective calcium carbonate equivalent—ECCE—of 88%) before planting eucalyptus and annual crops, followed by plowing and harrowing for incorporation.
In early February 2017, maize was intercropped with forage grasses in the eucalyptus rows, fertilized with 260 kg ha−1 of NPK 13-33-08 in the planting furrow and two subsequent topdressings: first with 280 kg ha−1 of NPK 08-00-36 at the 2–4 leaf stage, and then 150 kg ha−1 of polymerized urea at the 4–6 leaf stage. From 2018 to 2021, soybeans were cultivated in the eucalyptus rows without soil disturbance, with millet seeds (ADR300) broadcast as a cover crop in the off-season after soybean harvest, using 20 kg ha−1 of seed without additional fertilization. Soybean base fertilization followed technical recommendations [22] and matched the amounts used in the no-till area. At the end of 2021, 3 t ha−1 of dolomitic limestone (ECCE of 88%) was again broadcast across the area. In 2022, pigeon pea (Cajanus cajan cv. Mandarin) was planted in the eucalyptus rows, also without soil disturbance.
Crop–livestock integration (CLI)The CLI system involves intercropping maize with brachiaria (Urochloa brizantha cv. Marandu), followed by grazing cattle during the off-season at a stocking rate of 2.5 AU ha−1. This is followed by four years of alternating soybean and millet cultivation, completing a five-year cycle. This approach is applied across the farm as a rotational system in soybean-growing areas.
The evaluated area has a similar management history to the soybean no-till system (NT-S) until 2011. In 2012, the soil was plowed and harrowed, with 3.8 t ha−1 of calcitic limestone applied. In 2017, the CLI system (maize + brachiaria) was adopted, with cattle grazing during the off-season at 2.5 AU ha−1. From 2018 to 2020, the area was managed with a no-till system (soybean and millet). In 2021, subsoiling to 0.30 m was carried out, and maize intercropped with brachiaria was reintroduced. When cattle entered, the dry mass of brachiaria was 7780 kg ha−1, and when they left, it was 3550 kg ha−1.
In subsequent years, the area continued under no-till management with soybean and millet. Fertilization for soybeans and maize followed technical guidelines [22], with soybean fertilization similar to the NT-S area and maize fertilization comparable to the CFI area.
Native Cerrado vegetation (NCV)Native forest of Cerrado vegetation (area with Cerrado phytophysiognomy stricto sensu [23], with sporadic fires (almost annual) during the dry season.
Native Babassu palm vegetation (NPV)Native Babassu forest vegetation, with a predominance of the Babassu palm tree (Attaleaspeciosa).
Table 2. Physical and chemical parameters of soils under different management systems: NCV = native Cerrado vegetation; NPV = native Babassu palm vegetation; NT-S = no-till soybean; CFI = crop–forestry integration; CLI = crop–livestock integration; LFI = livestock–forestry integration. Barbosa Farm, Brejo, Maranhão, Brazil, 2022.
ParametersNCVNT-SCFICLILFINPV
pH (CaCl2)4.445.344.95.435.394.68
pH (H2O)5.406.005.806.406.205.50
Organic matter (dag Kg−1)3.323.783.092.286.297.06
Potential soil acidity: H + Al (cmolc dm−3)6.683.484.412.756.299.56
Sum of bases (cmolc dm−3)1.062.792.042.044.603.76
Cation exchange capacity (cmolc dm−3)7.746.276.464.7910.8913.32
Base saturation (V%)144432434228
Aluminum Saturation (m%)2202023
Al3+ (cmolc dm−3)0.3000.05000.10
B (mg dm−3)0.280.400.610.330.290.47
Ca2+ (cmolc dm−3)0.541.861.321.103.242.72
Cu2+ (mg dm−3)0.060.070.070.080.050.05
Fe2+ (mg dm−3)100.11118.1564.0548.1627.3263.27
K+ (cmolc dm−3)0.030.080.060.390.180.06
Mg2+ (cmolc dm−3)0.490.850.670.551.180.98
Mn2+ (mg dm−3)0.200.600.480.421.301.43
P (mg dm−3)5.0624.0428.4632.834.094.26
S-SO42− (mg dm−3)5.947.376.326.227.467.37
Zn2+ (mg dm−3)0.321.772.272.521.110.52
Clay (%)15.9916.1912.7111.7917.9417.22
Silt (%)9.078.8810.648.6412.313.64
Total sand (%)74.9474.9376.6479.5769.7769.14
Coarse sand (%)34.1238.9130.2230.7130.5427.62
Fine sand (%)40.8236.0246.4248.8639.2341.52
Disclaimer/Publisher’s Note: The statements, opinions and data contained in all publications are solely those of the individual author(s) and contributor(s) and not of MDPI and/or the editor(s). MDPI and/or the editor(s) disclaim responsibility for any injury to people or property resulting from any ideas, methods, instructions or products referred to in the content.

