

Spatial Divergence of Forestry Green Total Factor Productivity in China Under the Constraint of Carbon Emissions


Abstract
1. Introduction
2. Materials and Methods
2.1. Construction of the Indicator System and Sources of Driving Factors
2.1.1. Input–Output Factors
2.1.2. Driving Factors
2.1.3. Data Sources
2.2. Methods
2.2.1. DDF-GML Models with Non-Desired Outputs
2.2.2. Dagum Gini Coefficient
2.2.3. Geo-Detector
3. Results
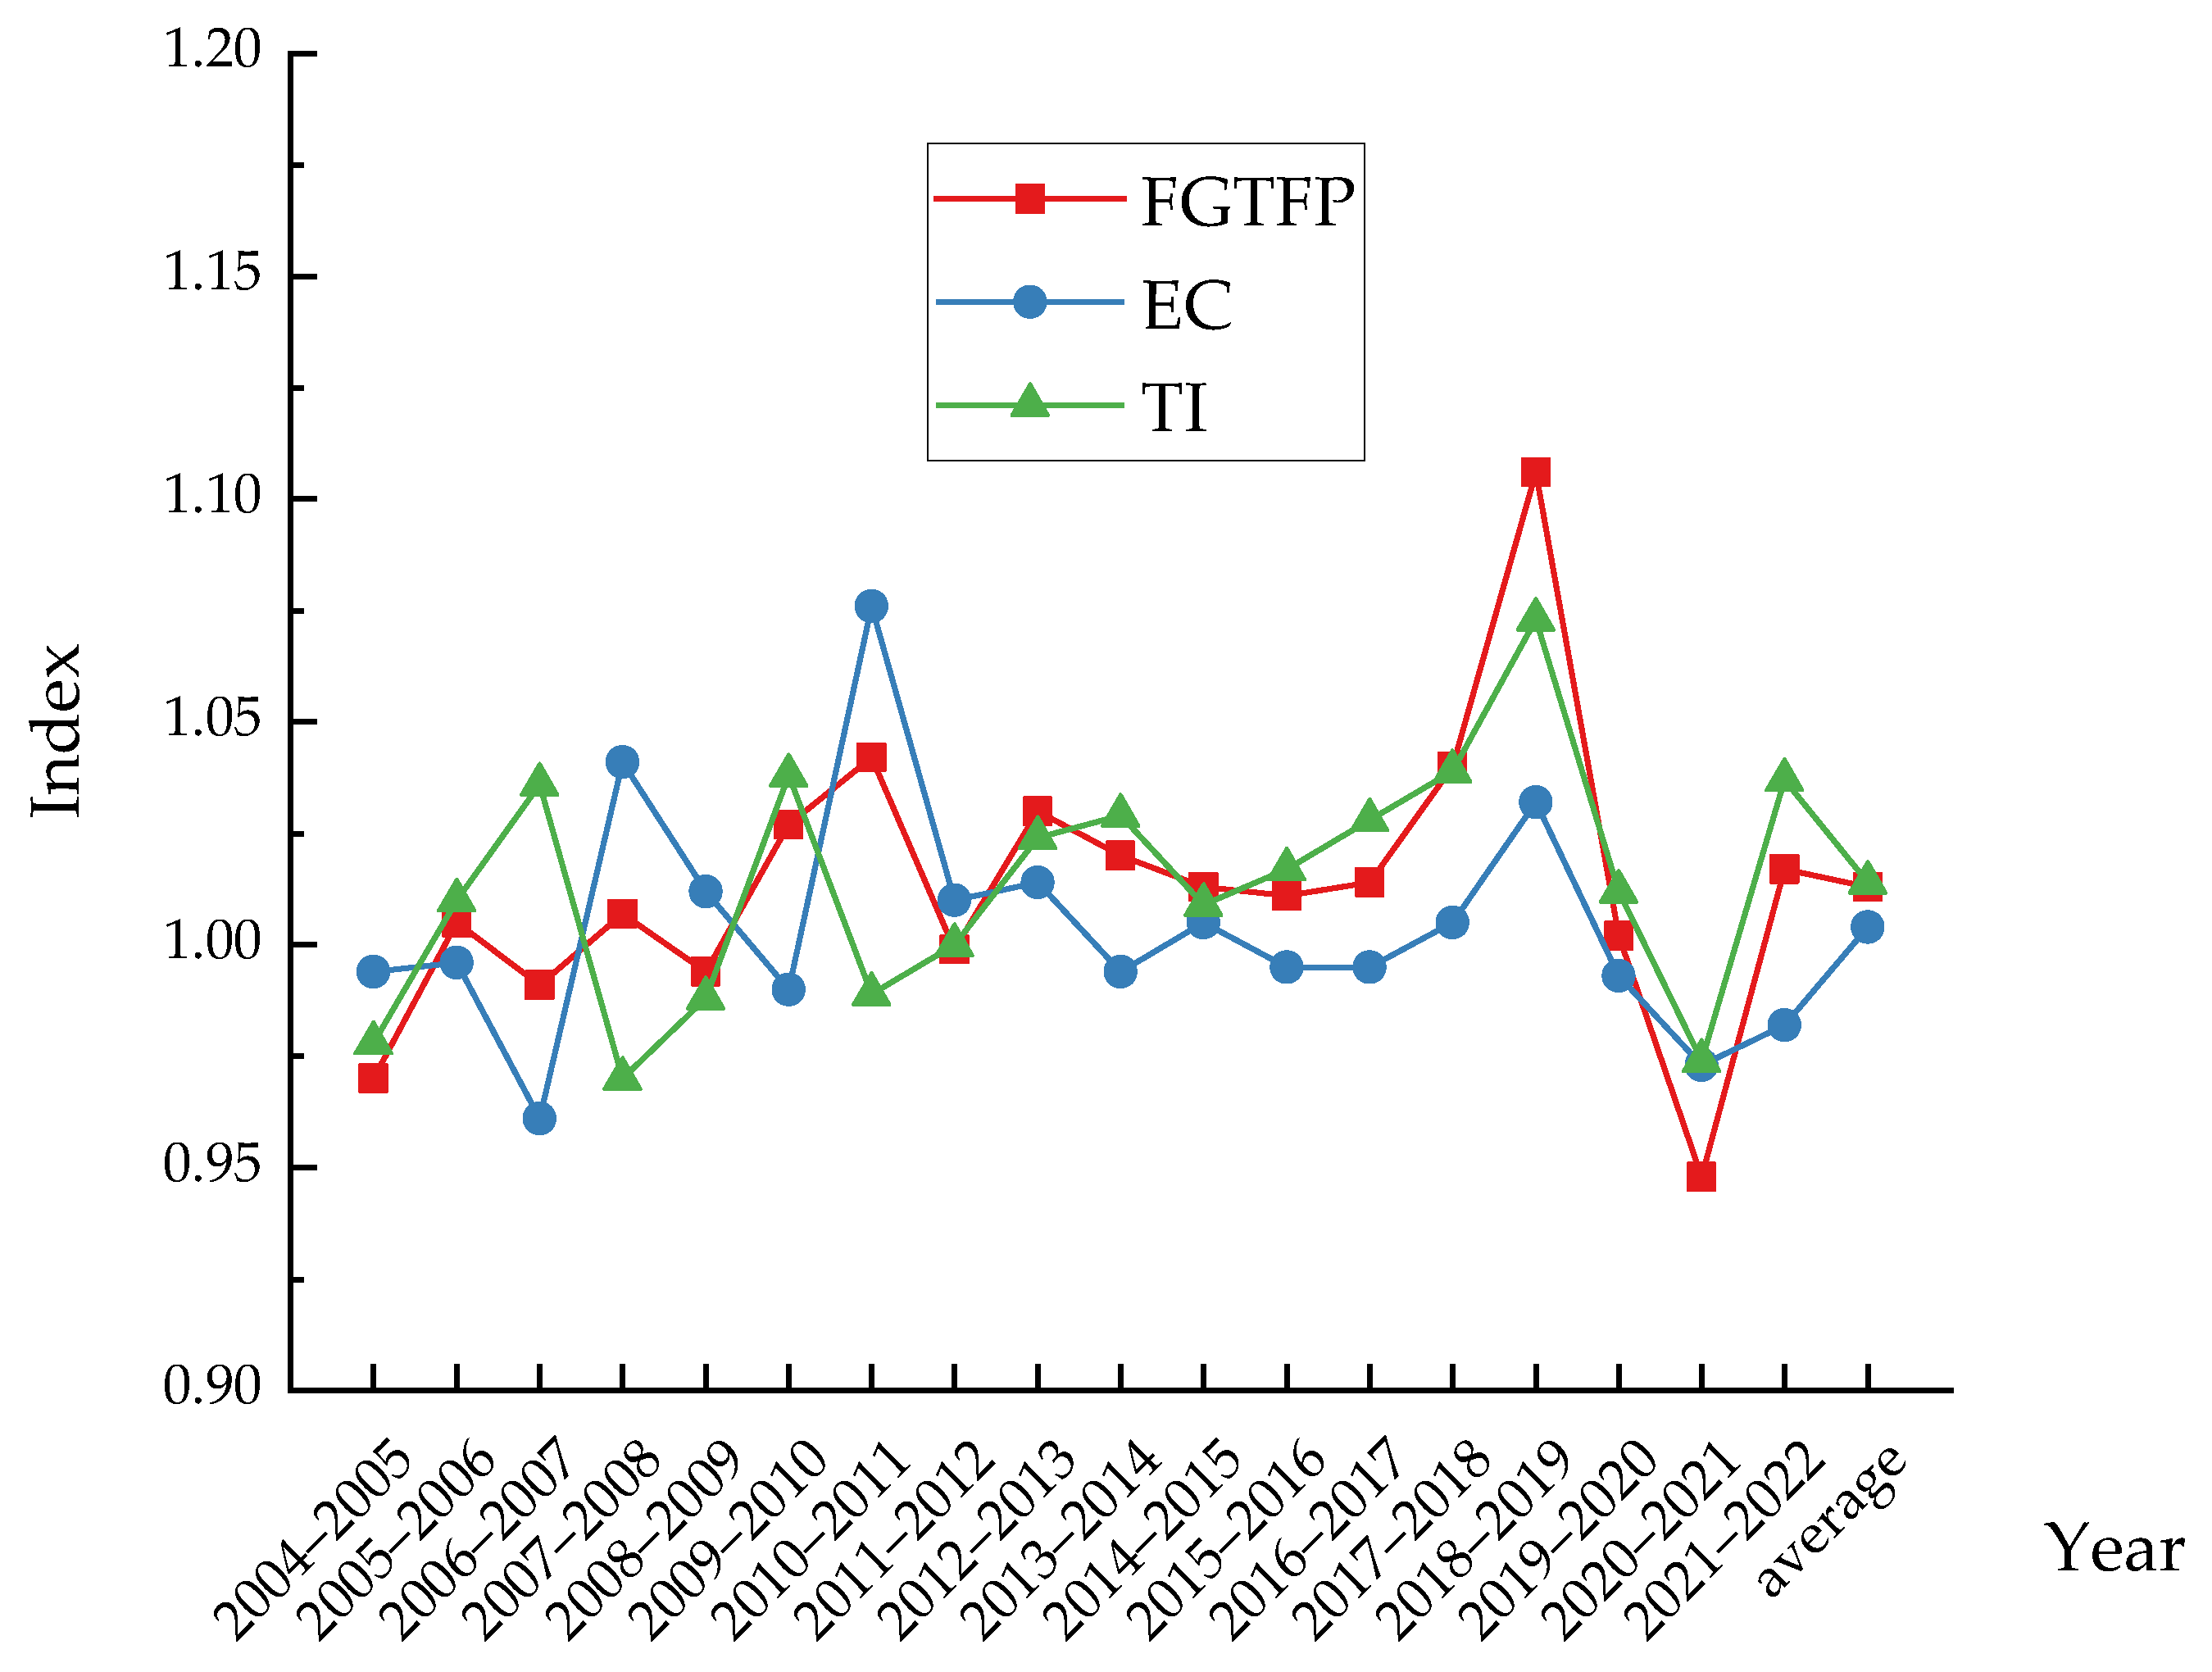
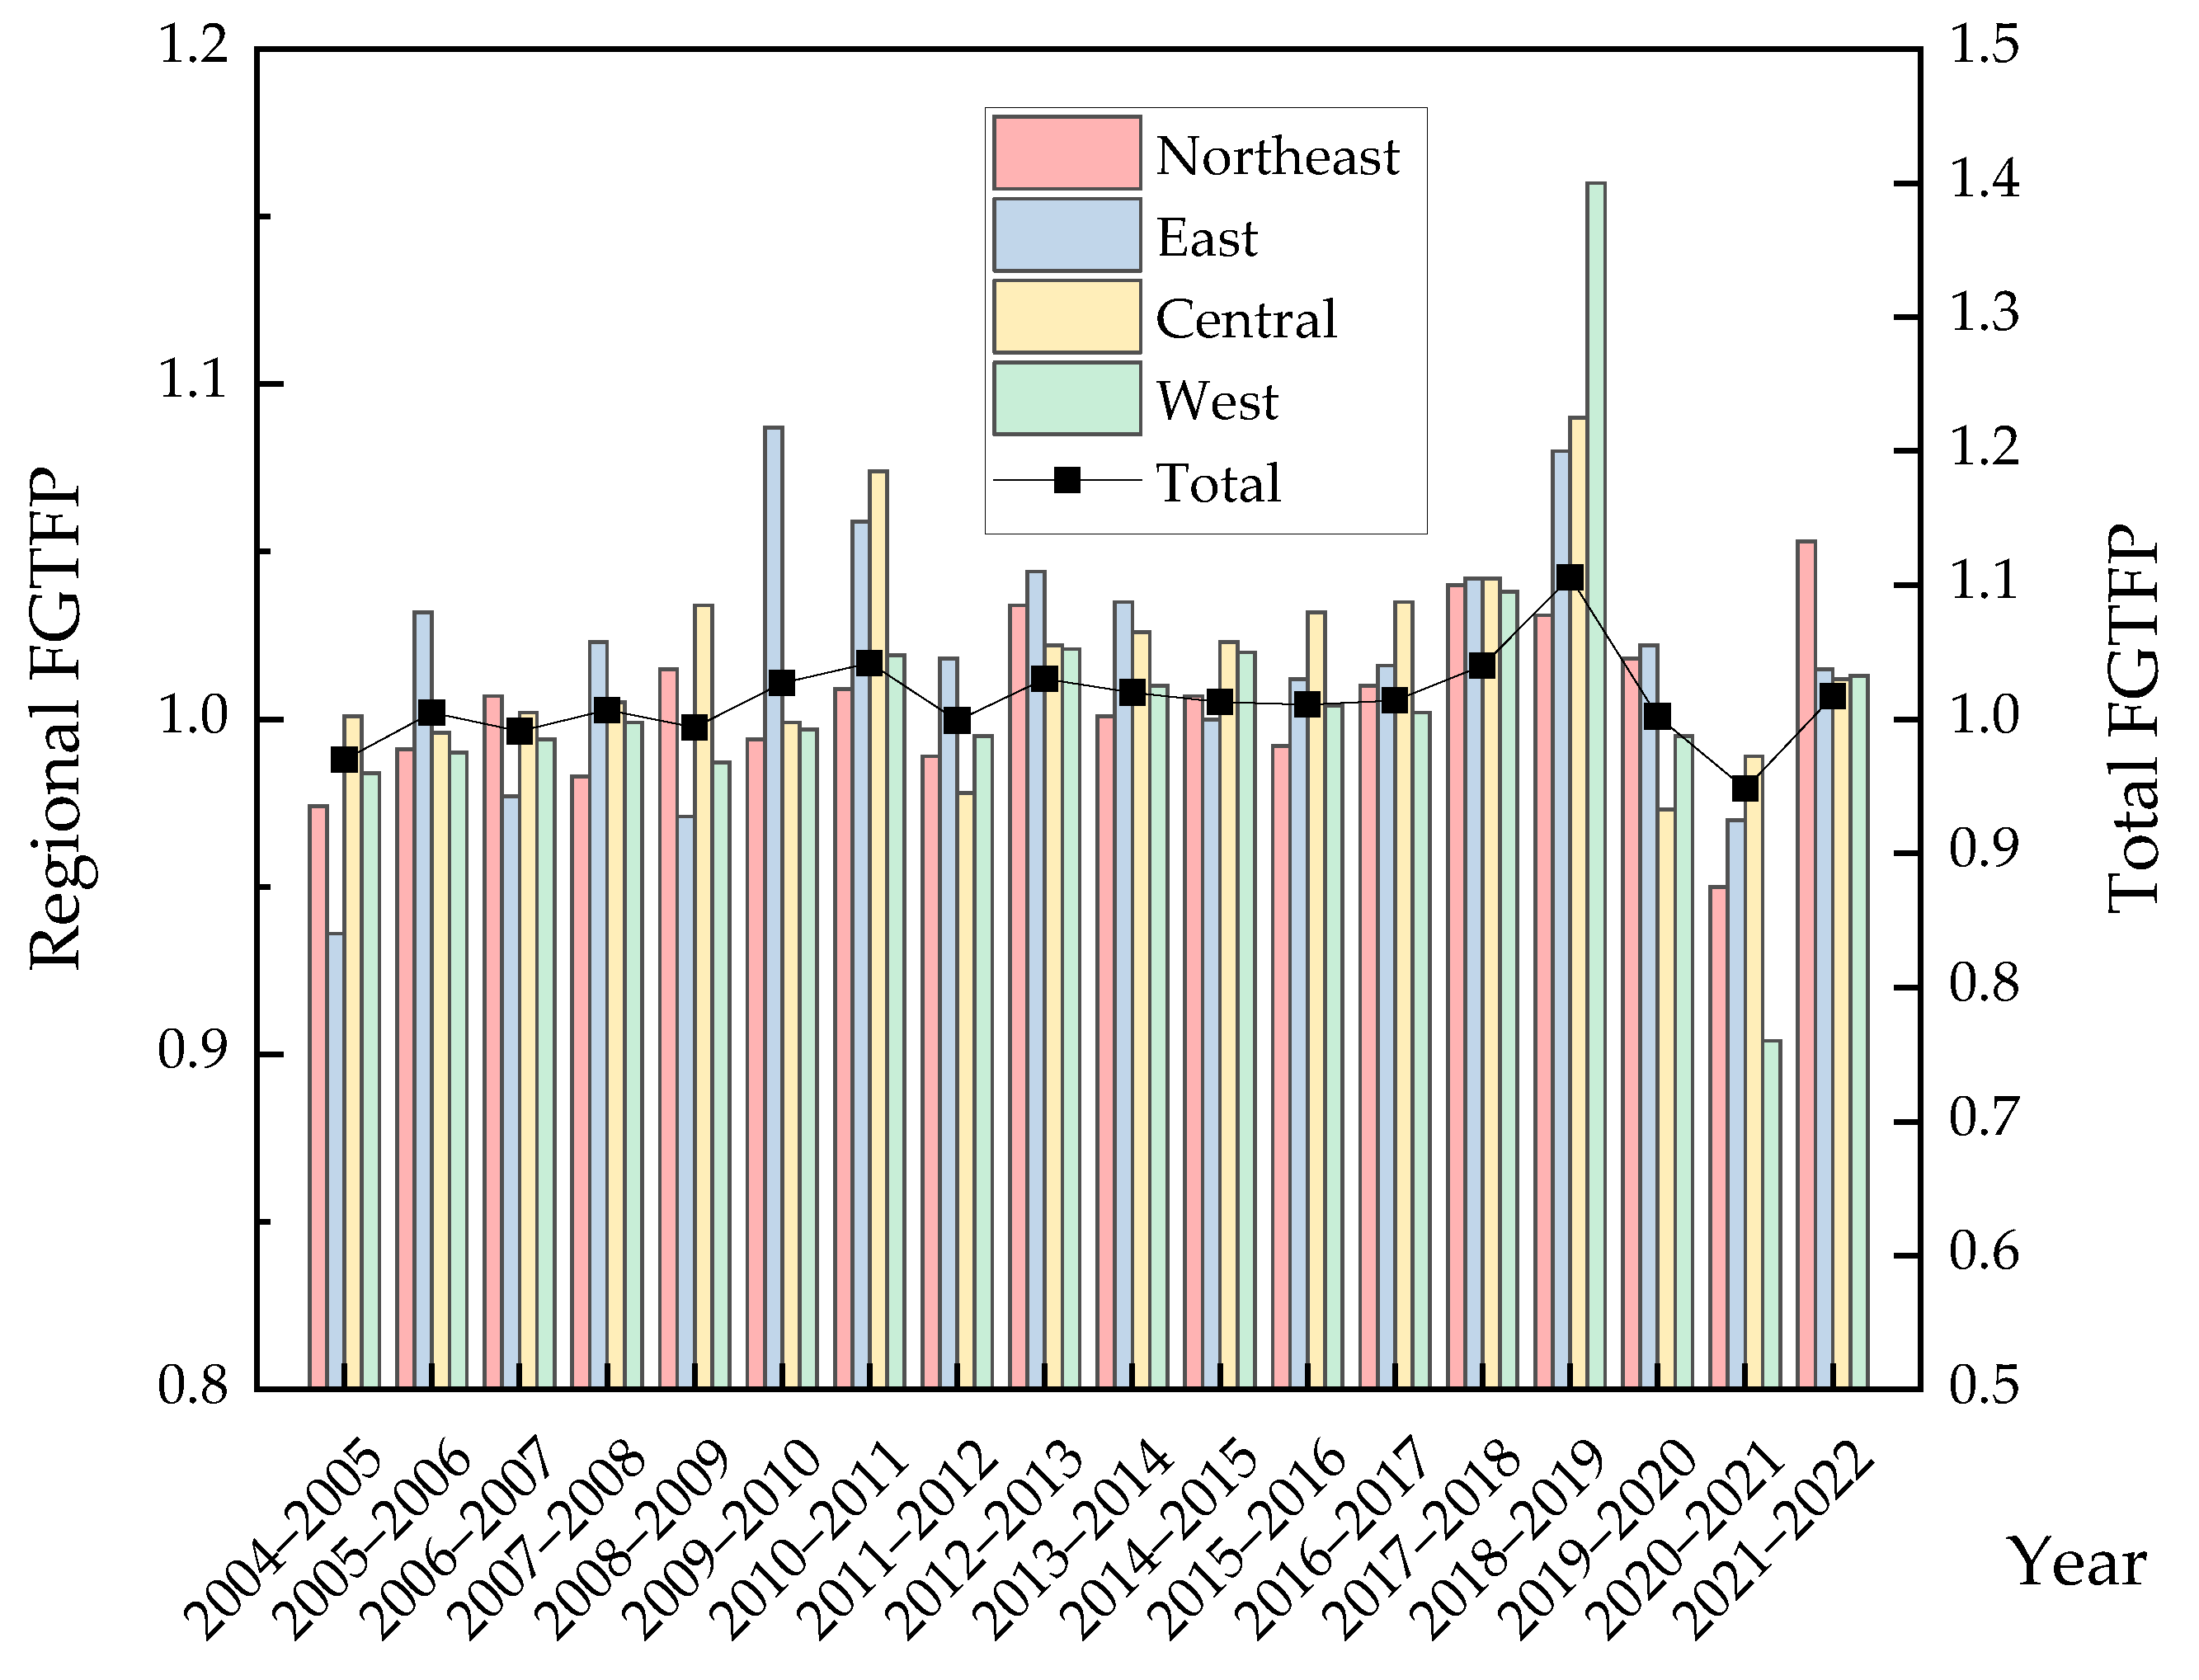
3.1. Analysis of FGTFP
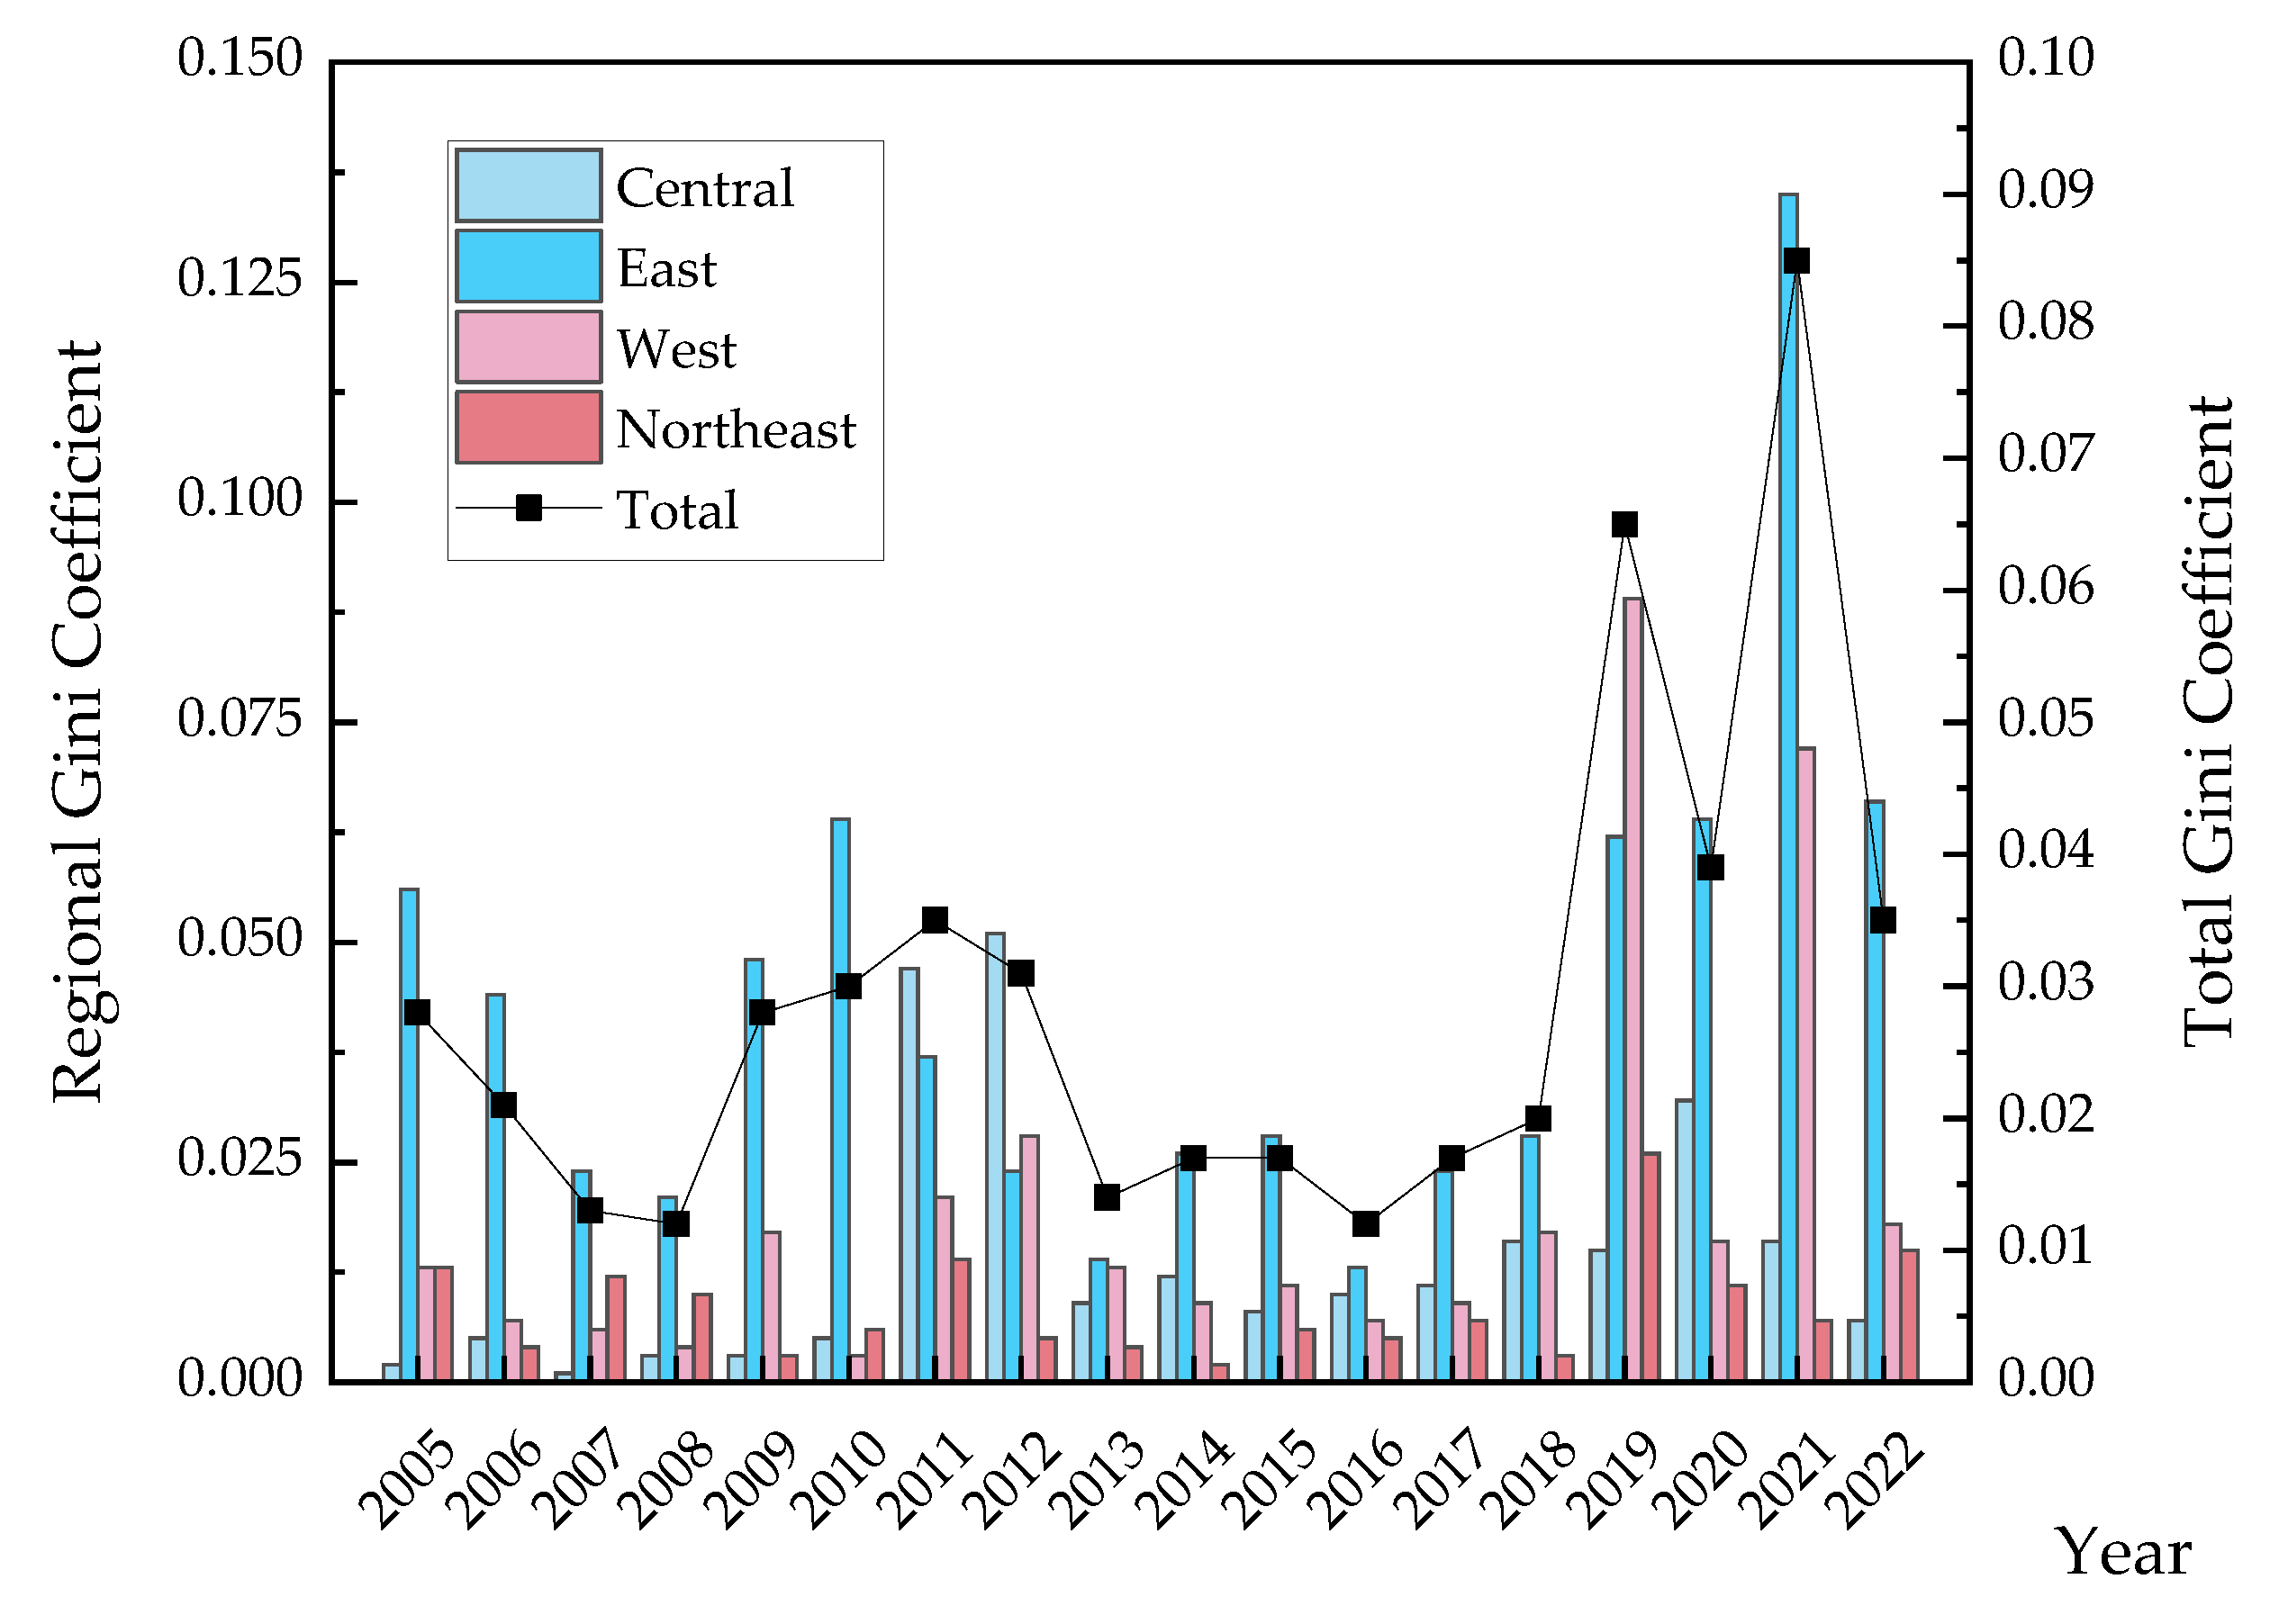
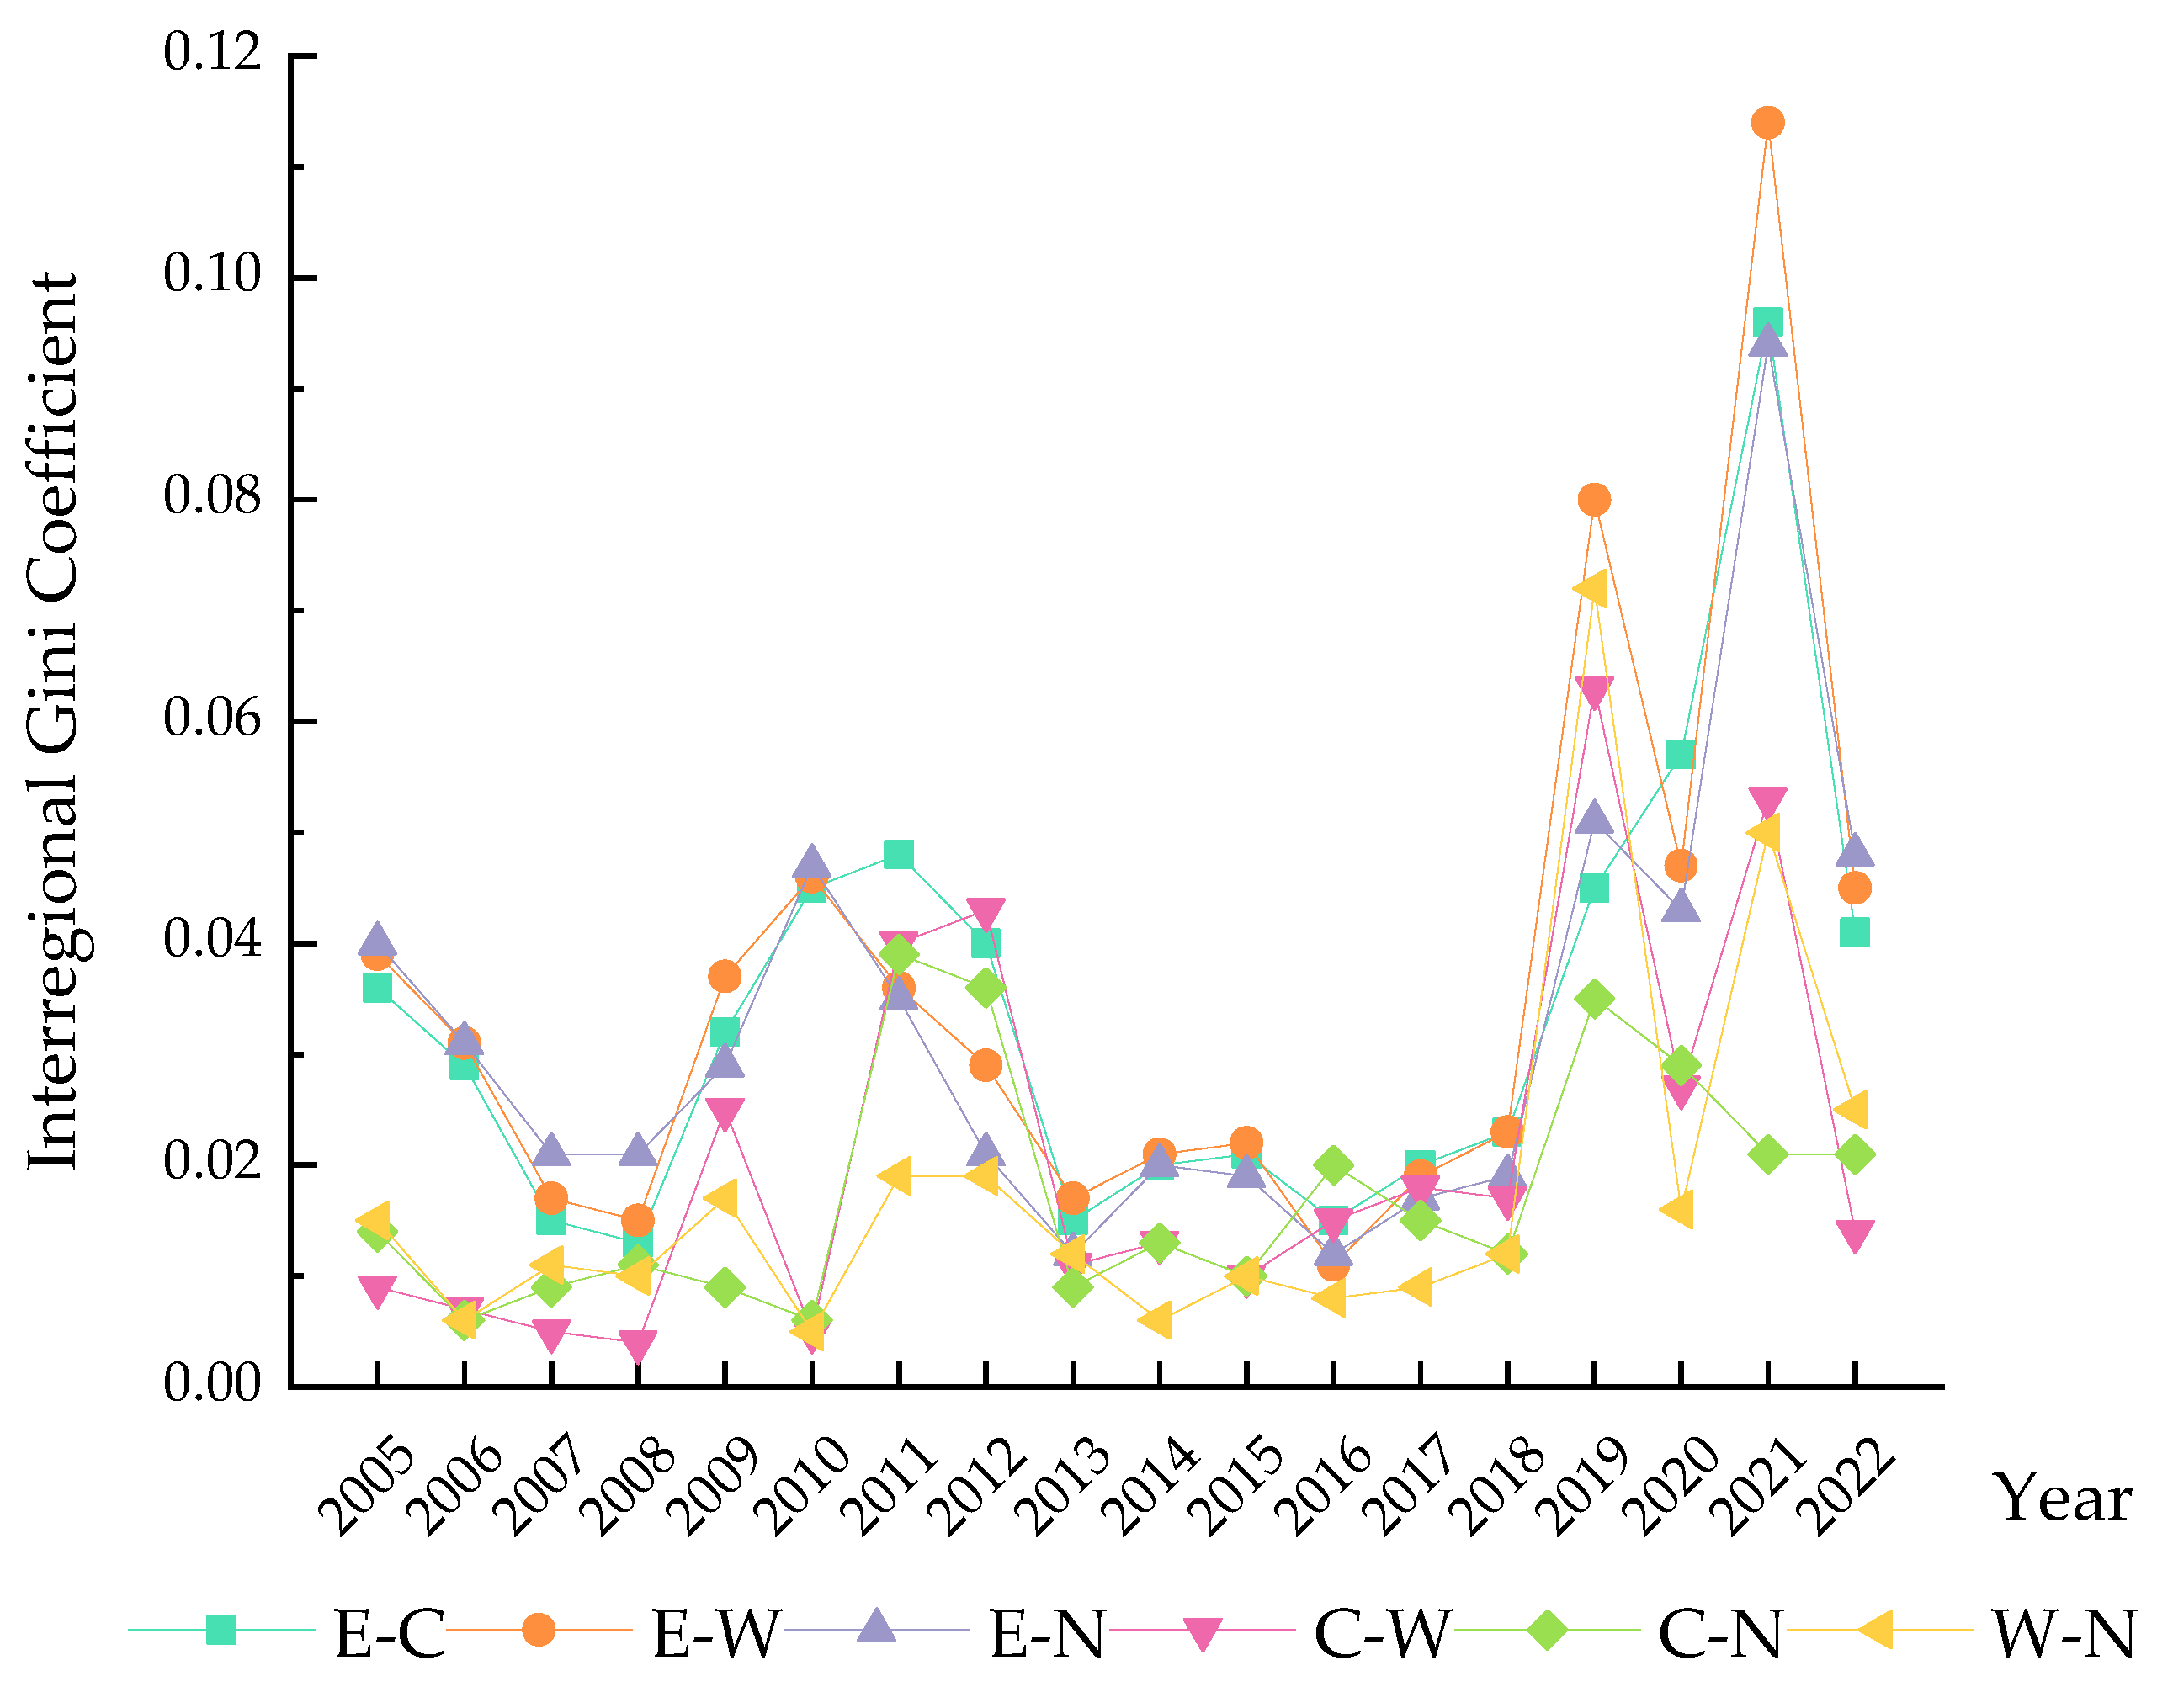
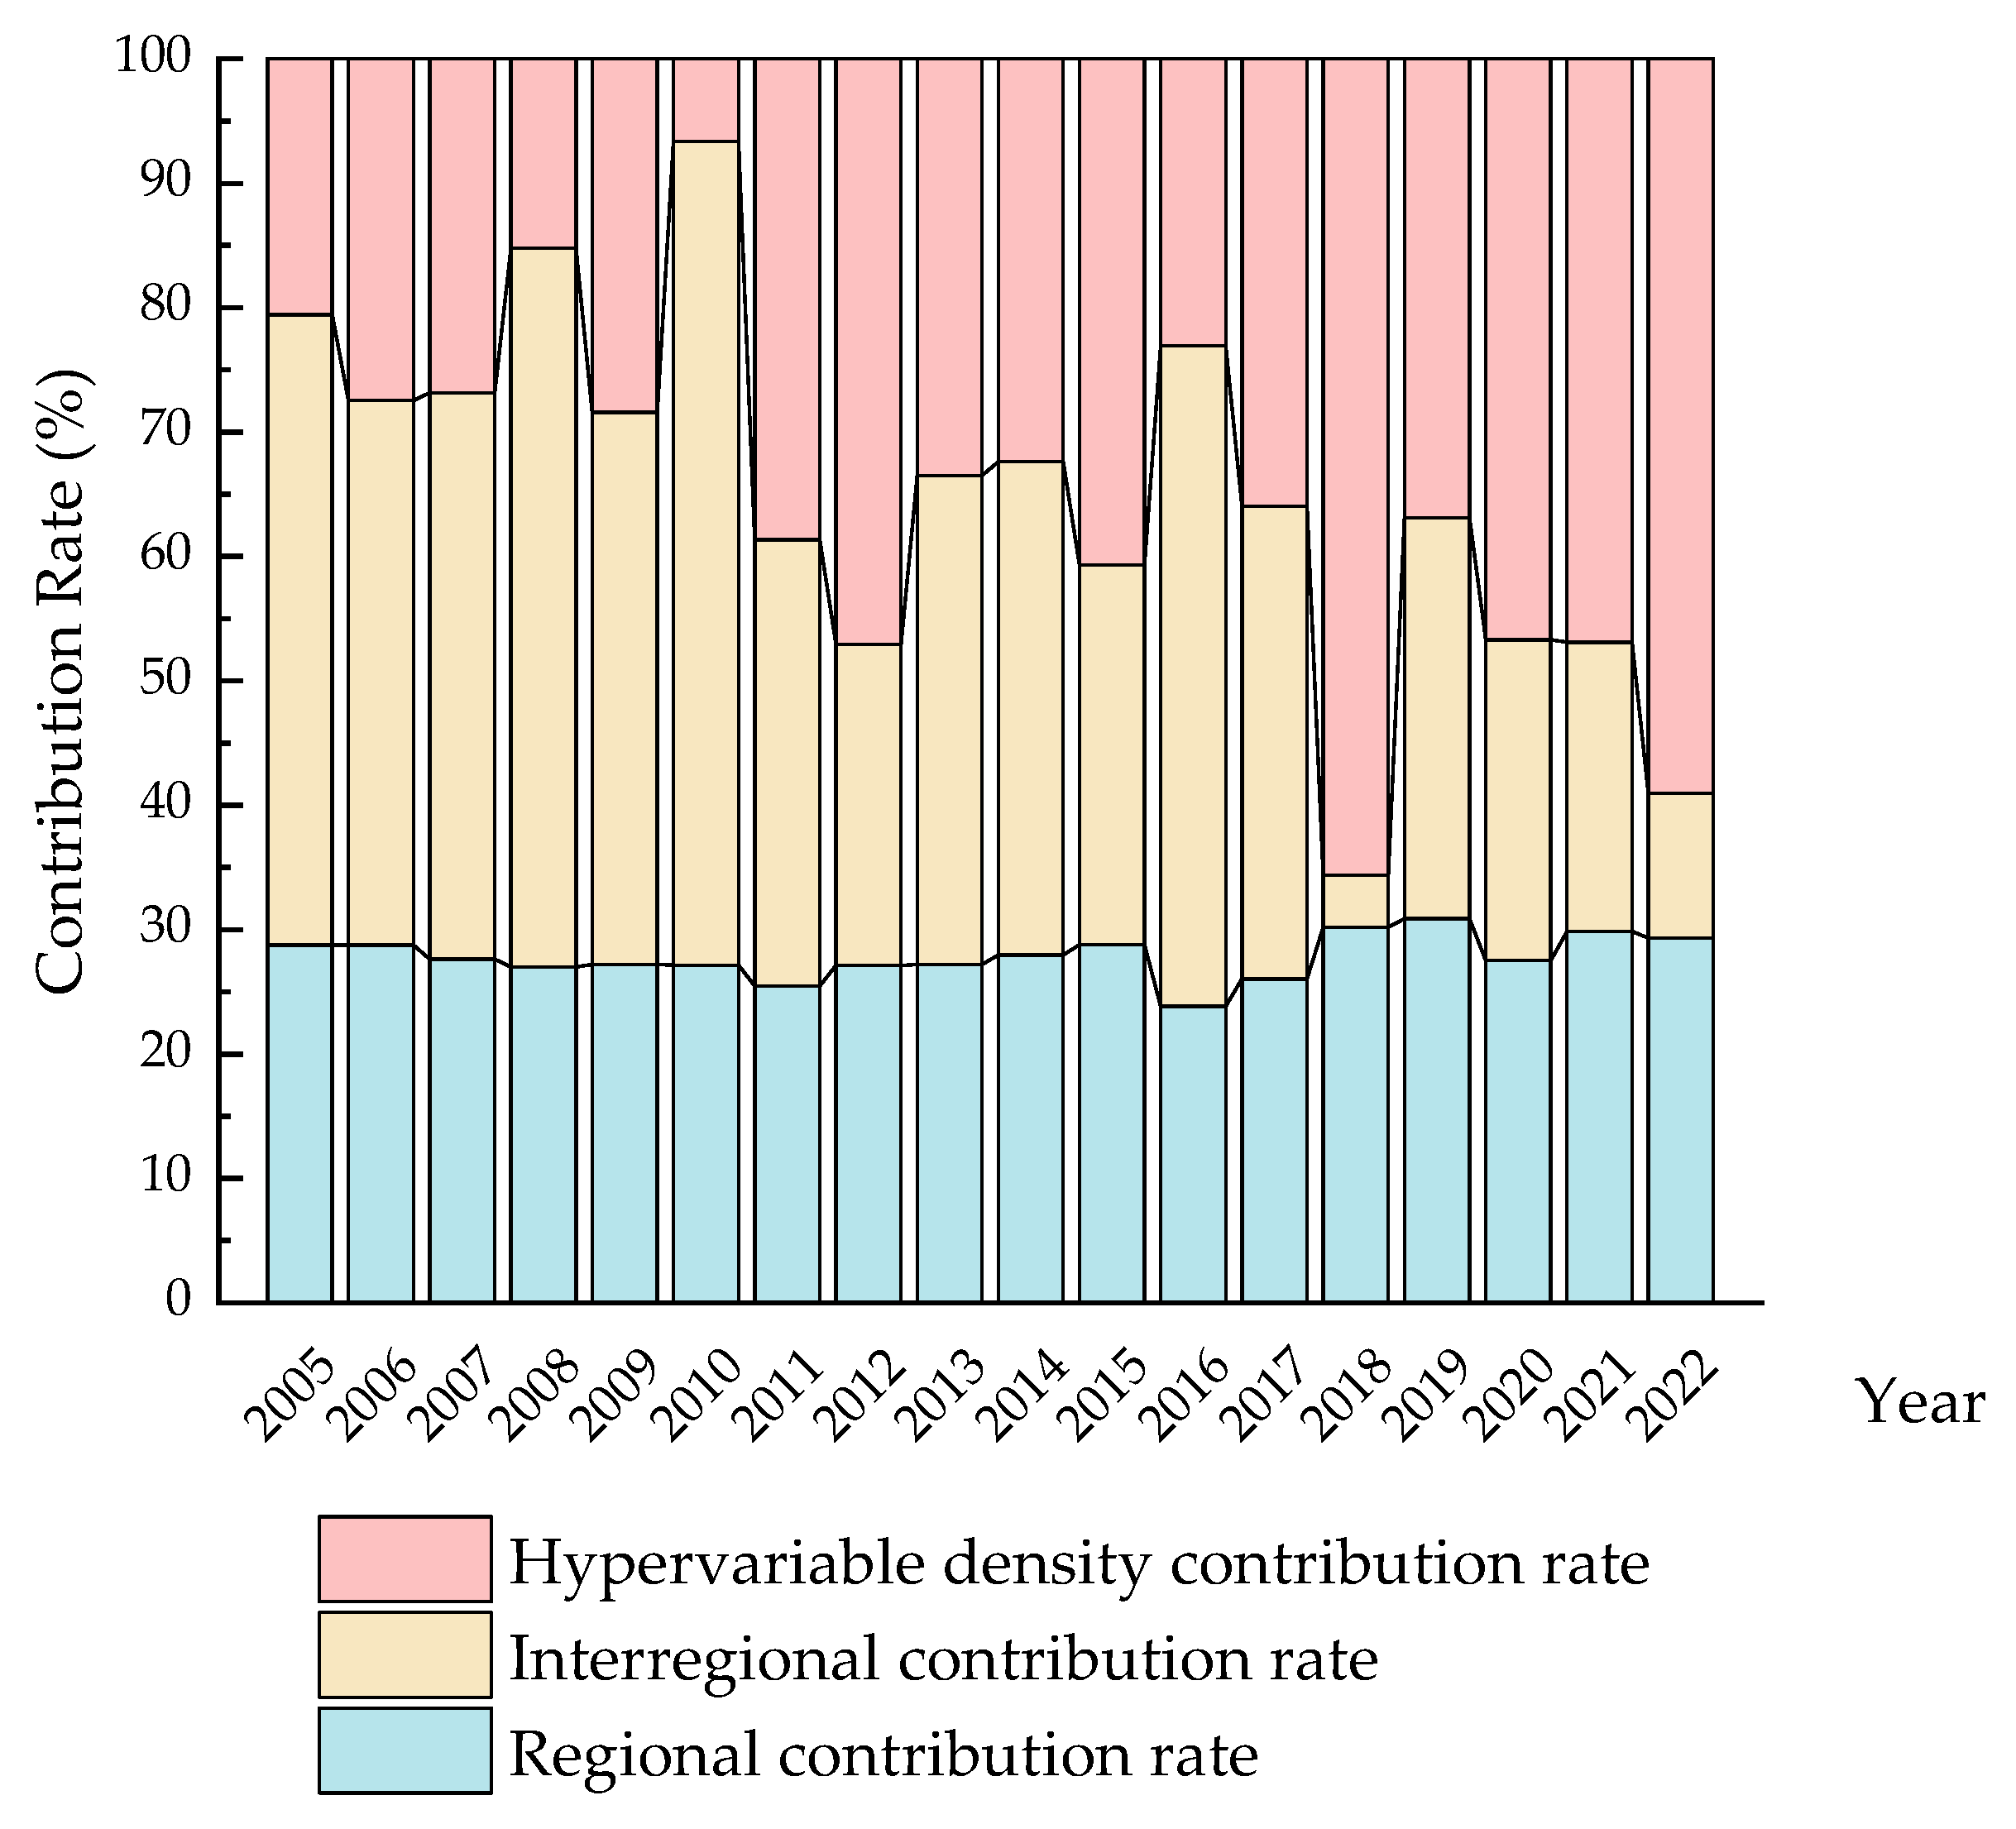
3.2. Spatial Divergence and Sources of FGTFP
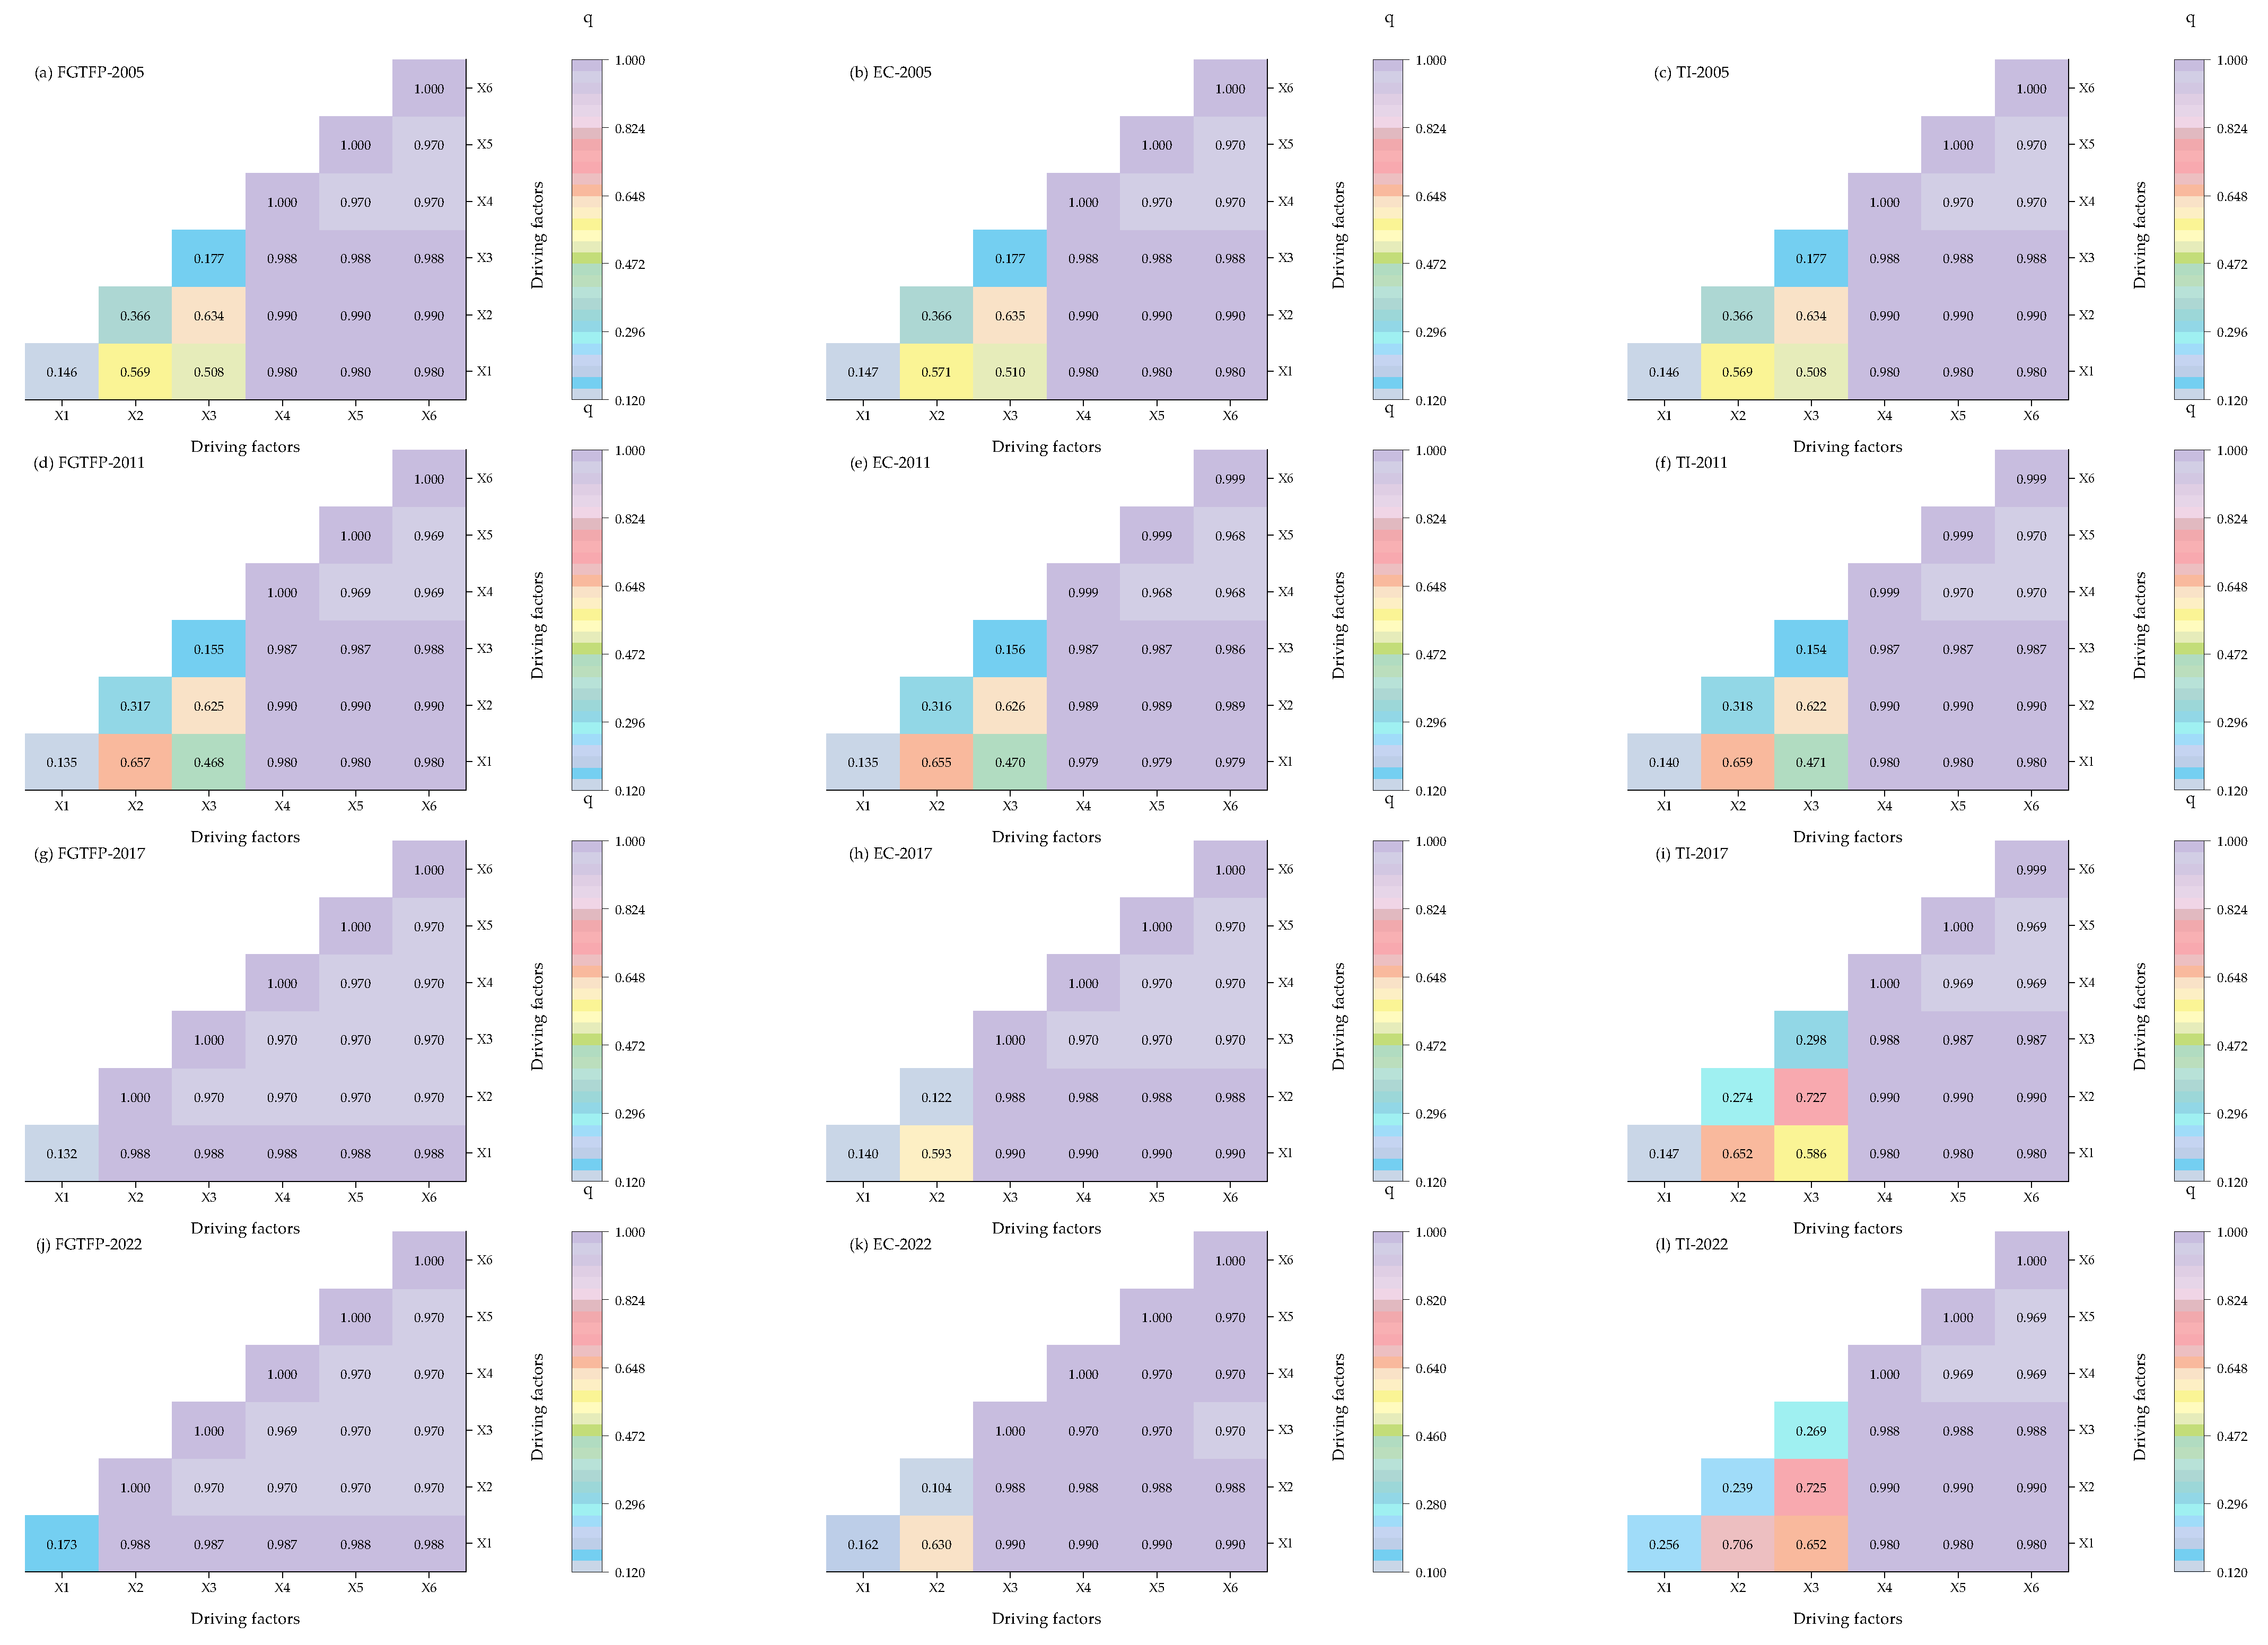
3.3. Driving Factors of Spatial Divergence of FGTFP in China
4. Discussion
5. Conclusions
Author Contributions
Funding
Data Availability Statement
Conflicts of Interest
Abbreviations
| FGTFP | Forestry Green Total Factor Productivity |
| FTFP | Forestry Total Factor Productivity |
| GTFP | Green Total Factor Productivity |
| EC | Efficiency Change |
| TI | Technological Improvement |
References
- Xu, E.; Wang, W.; Nie, Y.; Yang, H. Regional distribution and potential forecast of China’s forestry carbon contributions. China Pop. Res. Environ. 2020, 30, 36–45. [Google Scholar]
- Ning, Y.; Shen, W.; Song, C.; Zhao, R. Studying on the promotion strategies of high-quality development of forestry industry. Issues Agric. Econ. 2021, 42, 117–122. [Google Scholar] [CrossRef]
- Wang, Y.; Wang, Y.; Yang, J.; Zhao, T.; Zhang, D. Impact of specialized and diversified agglomeration of forestry industry on forestry total factor productivity. Issues For. Econ. 2022, 42, 142–150. [Google Scholar] [CrossRef]
- Huang, S.; Ma, D.; Fu, Y.; Yang, J. Changes and influencing factors of total factor productivity of forestry in ecologically vulnerable areas: On the basis of the ten-year tracking investigation of 500 peasant households in Gansu Province. Sci. Silvae Sin. 2024, 60, 153–164. [Google Scholar] [CrossRef]
- Guan, J.; Cao, Y.; Zhu, Z. Spatial linkage network structure of China’s forestry total factor productivity and its influence factors. Commer. Res. 2019, 62, 73–81. [Google Scholar] [CrossRef]
- Wei, X.; Zhang, M. An empirical analysis on the mechanism of forestry industrial agglomeration affecting forestry total factor productivity in China based on the dynamic spatial econometric model. World For. Res. 2019, 32, 67–72. [Google Scholar] [CrossRef]
- Liu, Q.; Jiang, H. Forestry total factor productivity and its influencing factors from the perspective of sustainable development: Evidence from Guangdong. Rural Econ. 2014, 32, 39–43. [Google Scholar]
- Jiang, Y.; Li, R.; Jiang, S. The impact of technological progress bias and factor allocation on total factor productivity in forestry in China. Sci. Technol. Man. Res. 2024, 44, 70–80. [Google Scholar] [CrossRef]
- Cao, L.; Jiang, C.; Xiao, Q.; Xu, T.; Lan, S.; He, J.; Peng, S. Forestry Subsidies, Forestry Regulatory Policies, and Total Factor Productivity in Forestry—Plot-Scale Micro-Survey Data from A Heterogeneous Forest Types Perspective. Forests 2024, 15, 692. [Google Scholar] [CrossRef]
- Shi, C.; Jie, C.; Shi, F.; Wen, Y. Estimation of the technical efficiency and the decomposition of TFP of Chinese forestry: Basing on SFA-Malmquist method. Sci. Silvae Sin. 2017, 53, 126–135. [Google Scholar] [CrossRef]
- Huang, S.; Ma, D. Measurement and convergence analysis of total factor productivity of family forestry in northwest China. J. Arid Land Res. Environ. 2021, 35, 21–27. [Google Scholar] [CrossRef]
- Shah, W.U.H.; Hao, G.; Yan, H.; Shen, J.; Yasmeen, R. Forestry Resource Efficiency, Total Factor Productivity Change, and Regional Technological Heterogeneity in China. Forests 2024, 15, 152. [Google Scholar] [CrossRef]
- Liu, Q.; Jiang, H. Estimation of total factor productivity of forestry in China. Stat. Decis. 2017, 33, 146–149. [Google Scholar] [CrossRef]
- Dai, S.; Tang, D.; Li, Y.; Lu, H. Digital trade, trade openness, FDI, and green total factor productivity. Int. Rev. Financ. Anal. 2025, 97, 103777. [Google Scholar] [CrossRef]
- Hu, J.; Deng, Y. Resource misallocation and unbalanced growth in green total factor productivity in Chinese agriculture. J. Environ. Plan. Manag. 2023, 68, 49–83. [Google Scholar] [CrossRef]
- Yue, H.; Zhou, Z.; Liu, H. How does green finance influence industrial green total factor productivity? Empirical research from China. Energy Rep. 2024, 11, 914–924. [Google Scholar] [CrossRef]
- Liu, T.; Li, J. Temporal-spatial differentiation of forestry green total factor productivity in China and its influencing factors. World For. Res. 2020, 33, 56–61. [Google Scholar] [CrossRef]
- Chen, C.; Ye, F.; Xiao, H.; Xie, W.; Liu, B.; Wang, L. The digital economy, spatial spillovers and forestry green total factor productivity. J. Clean. Prod. 2023, 405, 136890. [Google Scholar] [CrossRef]
- Lv, J.; Sun, J.; Cai, X. Spatial-Temporal Evolution of Green Total Factor Productivity of Forestry in China. J. Agric. For. Econ. Manag. 2022, 21, 320–330. [Google Scholar] [CrossRef]
- Krugman, P. Increasing returns and economic geography. J. Political Econ. 1991, 99, 483–499. [Google Scholar] [CrossRef]
- Huang, X.; Feng, C.; Qin, J.; Wang, X.; Zhang, T. Measuring China’s agricultural green total factor productivity and its drivers during 1998–2019. Sci. Total Environ. 2022, 829, 154477. [Google Scholar] [CrossRef] [PubMed]
- Luo, X.; Li, Z.; Li, R.; Xue, L. Temporal and regional variation of forestry production effienciency in China. J. Arid Land Res. Environ. 2017, 31, 95–100. [Google Scholar] [CrossRef]
- Dagum, C. A new approach to the decomposition of the Gini income inequality ratio. In Income Inequality, Poverty, and Economic Welfare. Studies in Empirical Economics; Physica-Verlag HD: Berlin/Heidelberg, Germany, 1997; Volume 22, pp. 515–531. [Google Scholar] [CrossRef]
- He, Y.; Zhang, Y.; Deng, J. Path to sustainable development: The effect of China’s innovative industrial clusters pilot policy on prefecture-level cities’ green total factor productivity. J. Clean. Prod. 2024, 478, 143988. [Google Scholar] [CrossRef]
- Wang, R.; Deng, X.; Gao, Y.; Chen, J. Does regional economic development drive sustainable grain production growth in China? Evidence from spatiotemporal perspective on low-carbon total factor productivity. Socio Econ. Plan. Sci. 2025, 98, 102129. [Google Scholar] [CrossRef]
- Han, H.; Qiu, J.; Wu, F. Regional differences and dynamic evolution of agricultural water resources green total factor productivity in China under technological heterogeneity. J. Arid Land Res. Environ. 2025, 39, 60–70. [Google Scholar] [CrossRef]
- Huang, X.; Zhang, T.; Wang, X.; Zheng, J.; Xu, G.; Wu, X. Regional differences of agricultural total factor carbon efficiency in China. Humanit. Soc. Sci. Commun. 2024, 11, 1–12. [Google Scholar] [CrossRef]
- Study on Dynamic Evolution Characteristics and Driving Factors of Total Factor Productivity in China’s Forestry Primary Sector of the Economy. Available online: https://link.cnki.net/urlid/53.1193.F.20241017.1527.004 (accessed on 15 January 2025).
- Xiang, H.; Chen, Z.; Liao, W.; Ai, J.; Zhang, M. Analysis on driving mechanism of forestry development and influencing factors of technical efficiency in collective forest regions in south China. For. Econ. 2021, 43, 5–21. [Google Scholar] [CrossRef]
- Wang, J.; Xu, C. Geodetector: Principle and prospective. Acta Geogr. Sin. 2017, 72, 116–134. [Google Scholar] [CrossRef]
- Hang, X.; Ren, X.; Ma, T.; Hu, Y.; Li, B.; Zhang, F.; Xie, J. Comparative application of geographical detector and Tobit model in analysis of grain production efficiency in the western Guangdong region and its influencing factors. J. Agric. Res. Environ. 2020, 37, 818–828. [Google Scholar] [CrossRef]
- Mu, J.; Qiao, B.; Yu, G. Spatial and temporal patterns of agricultural low-carbon productivity and its influence effects in the counties of Tarim River Basin, Xinjiang. Arid. Land Geogr. 2023, 46, 968–981. [Google Scholar] [CrossRef]
- Liu, C.; Fan, G.; Mao, G.; He, P. Spatio-temporal variation and influencing factors of grain production efficiency in Huaihe Eco-Economic Belt in recent 20 years. J. Nat. Res. 2023, 38, 707–720. [Google Scholar] [CrossRef]
- Ma, Y.; Chen, T.; Zhao, X. Regional differences and influencing factors of redundancy of production factors in processing tomato from the perspective of production efficiency. J. Chin. Agric. Mech. 2023, 44, 222–229. [Google Scholar] [CrossRef]
- Li, Z.; Yang, G. Research on spatial-temporal differentiation and driving force of digital production efficiency of manufacturing industry in Pan-Guangdong-Hong Kong-Macao Greater Bay Area. J. Stat. Inf. 2023, 38, 67–77. [Google Scholar]
- Huang, H.; Wang, Z. Spatial-temporal differences and influencing factors of agricultural land eco-efficiency in Jiangxi Province: Based on the dual perspective of non-point source pollution and carbon emission. Res. Environ. Yangtze Basin 2020, 29, 412–423. [Google Scholar] [CrossRef]
- Yang, Z.; Fan, M.; Shao, S.; Yang, L. Does carbon intensity constraint policy improve industrial green production performance in China? A quasi-DID analysis. Energy Econ. 2017, 68, 271–282. [Google Scholar] [CrossRef]
- Yang, Z.; Shao, S.; Fan, M.; Yang, L. Wage distortion and green technological progress: A directed technological progress perspective. Ecol. Econ. 2021, 181, 106912. [Google Scholar] [CrossRef]
- Oh, D.H. A global Malmquist-Luenberger productivity index. J. Product. Anal. 2010, 34, 183–197. [Google Scholar] [CrossRef]
- Wang, J.; Hu, Y. Environmental health risk detection with GeogDetector. Environ. Model. Softw. 2012, 16, 114–115. [Google Scholar] [CrossRef]
- Li, Y.; Tao, L. An analysis of spatial differentiation of tourism development level in border cities of Yunnan Province and influencing factors based on Geo-detector. World Reg. Stud. 2022, 31, 624–636. [Google Scholar] [CrossRef]
- Yu, G.; Li, J.; Sun, J.; Shen, P.; Yangchun, B. Research on BMI influencing factors of urban male adolescents in China based on geographical detector. Geogr. Res. 2019, 38, 2288–2301. [Google Scholar] [CrossRef]
- Tan, S. Measurement and influencing factors of the total green factor productivity of forestry in China. J. Cent. S. Univ. For. Technol. 2022, 42, 202–210. [Google Scholar] [CrossRef]
- Yuan, M.; Sun, H. Green Total Factor Productivity, Regional Gaps and Timing Evolution of the National High-Tech Zones. Stat. Decis. 2024, 40, 118–123. [Google Scholar] [CrossRef]
- Shi, Y.; Liu, Y. Regional Differences of Spatial Spillovers Green Agricultura Total Factor Productivity of China State Farms. N. Hortic. 2023, 47, 147–153. [Google Scholar] [CrossRef]
- Ma, Y.; Yan, X.; Wang, W. Temporal-Spatial Pattern and Convergence Trend of Green Total Factor Productivity in Chinese Logistics Industry. J. Syst. Sci. Math. Sci. 2023, 43, 2211–2231. [Google Scholar] [CrossRef]
- Zhao, X.; Jia, Z.; Ding, L. Spatial heterogeneity of green total factor productivity of China’s marine economy from a multidimensional perspective. Res. Sci. 2023, 45, 609–622. [Google Scholar] [CrossRef]
- Study on Agglomeration Evolution and Influencing Factors of Green Total Factor Productivity in Chinese Animal Husbandry. Available online: https://link.cnki.net/urlid/11.2114.S.20250121.1043.032 (accessed on 15 January 2025).
- Temporal and Spatial Differences in Green Total Factor Productivity and the Influencing Factors in China’s Power Industry. Available online: https://link.cnki.net/urlid/11.1895.X.20250207.1450.028 (accessed on 15 January 2025).
- Shah, W.U.H.; Hao, G.; Yan, H.; Lu, Y.; Yasmeen, R. The Impact of Climate Change on China’s Forestry Efficiency and Total Factor Productivity Change. Forests 2023, 14, 2464. [Google Scholar] [CrossRef]
- Chen, H.; Ma, Z.; Xiao, H.; Li, J.; Chen, W. The Impact of Digital Economy Empowerment on Green Total Factor Productivity in Forestry. Forests 2023, 14, 1729. [Google Scholar] [CrossRef]
- Impact of the Implementation of ‘Shan-Shui Initiative’ on Forestry Green Total Factor Productivity: A Case Study of the Qiantang River Source Area in Zhejiang Province. Available online: https://link.cnki.net/urlid/11.1908.S.20241126.1702.010 (accessed on 15 January 2025).


| Index | Variables | Unit | |
|---|---|---|---|
| Input | Forest area | hm2 | |
| Number of employees in the forestry sector at year-end | People | ||
| Investment in forestry fixed assets | CNY ten thousand | ||
| Output | Desired output | Total output value of the forestry industry | CNY ten thousand |
| Forest stock | Ten thousand m3 | ||
| Non-desired output | Carbon dioxide emissions from forestry production | Ten thousand tCO2e | |
| Factor | Variables | Abbreviation | Unit | |
|---|---|---|---|---|
| Green energy transition factors | Energy consumption | X1 | Ten thousand tons | |
| Clean energy structure | X2 | % | ||
| Forestry industry structure | X3 | % | ||
| External environmental factors | Natural | Forest coverage | X4 | % |
| Economic | GDP per capita | X5 | CNY/people | |
| Social | Number of employees in energy-intensive industries | X6 | Ten thousand people | |
| Year | FGTFP | EC | TI | East | Northeast | Central | West |
|---|---|---|---|---|---|---|---|
| 2004–2005 | 0.970 | 0.994 | 0.978 | 0.936 | 0.974 | 1.001 | 0.984 |
| 2005–2006 | 1.005 | 0.996 | 1.010 | 1.032 | 0.991 | 0.996 | 0.990 |
| 2006–2007 | 0.991 | 0.961 | 1.036 | 0.977 | 1.007 | 1.002 | 0.994 |
| 2007–2008 | 1.007 | 1.041 | 0.970 | 1.023 | 0.983 | 1.005 | 0.999 |
| 2008–2009 | 0.994 | 1.012 | 0.988 | 0.971 | 1.015 | 1.034 | 0.987 |
| 2009–2010 | 1.027 | 0.990 | 1.038 | 1.087 | 0.994 | 0.999 | 0.997 |
| 2010–2011 | 1.042 | 1.076 | 0.989 | 1.059 | 1.009 | 1.074 | 1.019 |
| 2011–2012 | 0.999 | 1.010 | 1.000 | 1.018 | 0.989 | 0.978 | 0.995 |
| 2012–2013 | 1.030 | 1.014 | 1.024 | 1.044 | 1.034 | 1.022 | 1.021 |
| 2013–2014 | 1.020 | 0.994 | 1.029 | 1.035 | 1.001 | 1.026 | 1.010 |
| 2014–2015 | 1.013 | 1.005 | 1.009 | 1.000 | 1.007 | 1.023 | 1.020 |
| 2015–2016 | 1.011 | 0.995 | 1.017 | 1.012 | 0.992 | 1.032 | 1.004 |
| 2016–2017 | 1.014 | 0.995 | 1.028 | 1.016 | 1.010 | 1.035 | 1.002 |
| 2017–2018 | 1.040 | 1.005 | 1.039 | 1.042 | 1.040 | 1.042 | 1.038 |
| 2018–2019 | 1.106 | 1.032 | 1.073 | 1.080 | 1.031 | 1.090 | 1.160 |
| 2019–2020 | 1.002 | 0.993 | 1.012 | 1.022 | 1.018 | 0.973 | 0.995 |
| 2020–2021 | 0.948 | 0.973 | 0.974 | 0.970 | 0.950 | 0.989 | 0.904 |
| 2021–2022 | 1.017 | 0.982 | 1.037 | 1.015 | 1.053 | 1.012 | 1.013 |
| Average | 1.013 | 1.004 | 1.014 | 1.019 | 1.005 | 1.018 | 1.007 |
| Regions | FGTFP | Rankings | EC | Rankings | TI | Rankings |
|---|---|---|---|---|---|---|
| Beijing | 1.006 | 20 | 0.994 | 29 | 1.014 | 16 |
| Tianjin | 0.990 | 30 | 0.994 | 30 | 1.011 | 19 |
| Hebei | 1.015 | 16 | 1.001 | 14 | 1.024 | 5 |
| Shanxi | 1.005 | 21 | 1.021 | 2 | 1.016 | 12 |
| Inner Mongolia | 0.992 | 29 | 0.995 | 28 | 0.999 | 30 |
| Liaoning | 1.010 | 18 | 1.005 | 9 | 1.013 | 18 |
| Jilin | 1.002 | 25 | 1.000 | 16 | 1.002 | 27 |
| Heilongjiang | 1.004 | 22 | 1.001 | 15 | 1.005 | 21 |
| Shanghai | 1.028 | 4 | 1.000 | 16 | 1.028 | 4 |
| Jiangsu | 1.036 | 1 | 1.000 | 16 | 1.036 | 1 |
| Zhejiang | 1.030 | 2 | 1.000 | 16 | 1.030 | 3 |
| Anhui | 1.028 | 3 | 1.017 | 4 | 1.016 | 13 |
| Fujian | 1.015 | 15 | 1.000 | 16 | 1.015 | 14 |
| Jiangxi | 1.023 | 7 | 1.006 | 7 | 1.019 | 9 |
| Shandong | 1.026 | 5 | 0.997 | 27 | 1.031 | 2 |
| Henan | 1.016 | 13 | 1.006 | 8 | 1.017 | 11 |
| Hubei | 1.019 | 11 | 1.008 | 6 | 1.013 | 17 |
| Hunan | 1.019 | 10 | 1.005 | 10 | 1.015 | 15 |
| Guangdong | 1.023 | 6 | 1.000 | 24 | 1.024 | 6 |
| Guangxi | 1.021 | 8 | 1.000 | 16 | 1.021 | 7 |
| Hainan | 1.018 | 12 | 0.999 | 25 | 1.021 | 8 |
| Chongqing | 1.014 | 17 | 1.014 | 5 | 1.005 | 22 |
| Sichuan | 1.004 | 23 | 1.000 | 16 | 1.004 | 23 |
| Guizhou | 1.016 | 14 | 1.019 | 3 | 1.004 | 24 |
| Yunnan | 1.000 | 27 | 1.000 | 16 | 1.000 | 29 |
| Shaanxi | 1.003 | 24 | 1.001 | 13 | 1.002 | 26 |
| Gansu | 1.000 | 28 | 0.997 | 26 | 1.003 | 25 |
| Qinghai | 1.001 | 26 | 1.002 | 12 | 1.002 | 28 |
| Ningxia | 1.019 | 9 | 1.028 | 1 | 1.018 | 10 |
| Xinjiang | 1.009 | 19 | 1.004 | 11 | 1.007 | 20 |
| Eastern average | 1.019 | - | 0.998 | - | 1.024 | - |
| Northeastern average | 1.005 | - | 1.002 | - | 1.007 | - |
| Central average | 1.018 | - | 1.010 | - | 1.016 | - |
| Western average | 1.007 | - | 1.006 | - | 1.006 | - |
| National average | 1.013 | - | 1.004 | - | 1.014 | - |
| Year | Total | Regional Gini Coefficient | Interregional Gini Coefficient | Contribution (%) | ||||||||||
|---|---|---|---|---|---|---|---|---|---|---|---|---|---|---|
| East (E) | Central (C) | West (W) | Northeast (N) | E-C | E-W | E-N | C-W | C-N | W-N | Regional | Interregional | Hypervariable Density | ||
| 2005 | 0.028 | 0.056 | 0.002 | 0.013 | 0.013 | 0.036 | 0.039 | 0.040 | 0.009 | 0.014 | 0.015 | 28.767 | 50.674 | 20.559 |
| 2006 | 0.021 | 0.044 | 0.005 | 0.007 | 0.004 | 0.029 | 0.031 | 0.031 | 0.007 | 0.006 | 0.006 | 28.769 | 43.778 | 27.453 |
| 2007 | 0.013 | 0.024 | 0.001 | 0.006 | 0.012 | 0.015 | 0.017 | 0.021 | 0.005 | 0.009 | 0.011 | 27.633 | 45.531 | 26.836 |
| 2008 | 0.012 | 0.021 | 0.003 | 0.004 | 0.010 | 0.013 | 0.015 | 0.021 | 0.004 | 0.011 | 0.010 | 27.008 | 57.786 | 15.206 |
| 2009 | 0.028 | 0.048 | 0.003 | 0.017 | 0.003 | 0.032 | 0.037 | 0.029 | 0.025 | 0.009 | 0.017 | 27.198 | 44.382 | 28.420 |
| 2010 | 0.030 | 0.064 | 0.005 | 0.003 | 0.006 | 0.045 | 0.046 | 0.047 | 0.005 | 0.006 | 0.005 | 27.163 | 66.194 | 6.642 |
| 2011 | 0.035 | 0.037 | 0.047 | 0.021 | 0.014 | 0.048 | 0.036 | 0.035 | 0.040 | 0.039 | 0.019 | 25.475 | 35.862 | 38.664 |
| 2012 | 0.031 | 0.024 | 0.051 | 0.028 | 0.005 | 0.040 | 0.029 | 0.021 | 0.043 | 0.036 | 0.019 | 27.130 | 25.813 | 47.057 |
| 2013 | 0.014 | 0.014 | 0.009 | 0.013 | 0.004 | 0.015 | 0.017 | 0.012 | 0.011 | 0.009 | 0.012 | 27.217 | 39.306 | 33.477 |
| 2014 | 0.017 | 0.026 | 0.012 | 0.009 | 0.002 | 0.020 | 0.021 | 0.020 | 0.013 | 0.013 | 0.006 | 27.960 | 39.669 | 32.371 |
| 2015 | 0.017 | 0.028 | 0.008 | 0.011 | 0.006 | 0.021 | 0.022 | 0.019 | 0.010 | 0.010 | 0.010 | 28.784 | 30.557 | 40.659 |
| 2016 | 0.012 | 0.013 | 0.010 | 0.007 | 0.005 | 0.015 | 0.011 | 0.012 | 0.015 | 0.020 | 0.008 | 23.853 | 53.059 | 23.089 |
| 2017 | 0.017 | 0.024 | 0.011 | 0.009 | 0.007 | 0.020 | 0.019 | 0.017 | 0.018 | 0.015 | 0.009 | 26.055 | 37.990 | 35.955 |
| 2018 | 0.020 | 0.028 | 0.016 | 0.017 | 0.003 | 0.023 | 0.023 | 0.019 | 0.017 | 0.012 | 0.012 | 30.193 | 4.160 | 65.647 |
| 2019 | 0.065 | 0.062 | 0.015 | 0.089 | 0.026 | 0.045 | 0.080 | 0.051 | 0.063 | 0.035 | 0.072 | 30.885 | 32.230 | 36.885 |
| 2020 | 0.039 | 0.064 | 0.032 | 0.016 | 0.011 | 0.057 | 0.047 | 0.043 | 0.027 | 0.029 | 0.016 | 27.521 | 25.787 | 46.692 |
| 2021 | 0.085 | 0.135 | 0.016 | 0.072 | 0.007 | 0.096 | 0.114 | 0.094 | 0.053 | 0.021 | 0.050 | 29.859 | 23.238 | 46.902 |
| 2022 | 0.035 | 0.066 | 0.007 | 0.018 | 0.015 | 0.041 | 0.045 | 0.048 | 0.014 | 0.021 | 0.025 | 29.319 | 11.650 | 59.031 |
| Average | 0.029 | 0.043 | 0.014 | 0.020 | 0.009 | 0.034 | 0.036 | 0.032 | 0.021 | 0.018 | 0.018 | 27.822 | 37.093 | 35.086 |
Disclaimer/Publisher’s Note: The statements, opinions and data contained in all publications are solely those of the individual author(s) and contributor(s) and not of MDPI and/or the editor(s). MDPI and/or the editor(s) disclaim responsibility for any injury to people or property resulting from any ideas, methods, instructions or products referred to in the content. |
© 2025 by the authors. Licensee MDPI, Basel, Switzerland. This article is an open access article distributed under the terms and conditions of the Creative Commons Attribution (CC BY) license (https://creativecommons.org/licenses/by/4.0/).
Share and Cite
Huang, A.; Xue, Z.; Liu, Y.; Lin, R.; Huang, Y. Spatial Divergence of Forestry Green Total Factor Productivity in China Under the Constraint of Carbon Emissions. Forests 2025, 16, 625. https://doi.org/10.3390/f16040625
Huang A, Xue Z, Liu Y, Lin R, Huang Y. Spatial Divergence of Forestry Green Total Factor Productivity in China Under the Constraint of Carbon Emissions. Forests. 2025; 16(4):625. https://doi.org/10.3390/f16040625
Chicago/Turabian StyleHuang, Ansheng, Zexi Xue, Ya Liu, Ruoxuan Lin, and Yan Huang. 2025. "Spatial Divergence of Forestry Green Total Factor Productivity in China Under the Constraint of Carbon Emissions" Forests 16, no. 4: 625. https://doi.org/10.3390/f16040625
APA StyleHuang, A., Xue, Z., Liu, Y., Lin, R., & Huang, Y. (2025). Spatial Divergence of Forestry Green Total Factor Productivity in China Under the Constraint of Carbon Emissions. Forests, 16(4), 625. https://doi.org/10.3390/f16040625