Article

Global Warming Drives Shifts in the Suitable Habitats of Subalpine Shrublands in the Hengduan Mountains Region in China

1
Research Center for Engineering Ecology and Nonlinear Science, North China Electric Power University, Beijing 102206, China
2
Theoretical Ecology and Engineering Ecology Research Group, School of Life Sciences, Shandong University, Qingdao 250100, China
3
Energy Conversion Group, Energy and Sustainability Research Institute Groningen, Faculty of Science and Engineering, University of Groningen, Nijenborgh 6, 9747 AG Groningen, The Netherlands
*
Author to whom correspondence should be addressed.
Forests 2025, 16(4), 624; https://doi.org/10.3390/f16040624
Submission received: 7 February 2025 / Revised: 27 March 2025 / Accepted: 1 April 2025 / Published: 2 April 2025
(This article belongs to the Section Forest Meteorology and Climate Change)

Abstract

:
Subalpine shrubland is an important vegetation type in the Hengduan Mountains region of China, and its distribution has been substantially influenced by global warming. In this research, four subalpine shrub communities in the Hengduan Mountains were selected: Rhododendron heliolepis Franch. scrub, Rhododendron flavidum Franch. scrub, Quercus monimotricha (Hand.-Mazz.) Hand.-Mazz. scrub, and Pinus yunnanensis var. pygmaea (Hsueh ex C. Y. Cheng, W. C. Cheng & L. K. Fu) Hsueh scrub. A MaxEnt model was used to assess the suitable habitats and their primary drivers of four subalpine shrublands in China under different climate scenarios. Our results indicate the following: (1) The suitable habitat areas of the four subalpine shrublands exhibit a predominant distribution within the Hengduan Mountains region, with small populations in the Himalayas and Wumeng Mountain. Temperature and precipitation are identified as the primary drivers influencing the suitable habitat areas of the four subalpine shrublands, and the temperature factor is more influential than the precipitation factor. Furthermore, the contribution rate of slope to Quercus monimotricha scrub is 19.2%, which cannot be disregarded. (2) Under future climate scenarios, the total suitable habitats of the four subalpine shrublands show an expanding trend. However, the highly suitable areas of three shrublands (Rhododendron flavidum scrub, Quercus monimotricha scrub, and Pinus yunnanensis var. pygmaea scrub) show a contracting trend under the high-carbon-emission scenario (SSP585). (3) Driven by global warming, the suitable habitat areas of Rhododendron heliolepis scrub, Rhododendron flavidum scrub, and Pinus yunnanensis var. pygmaea scrub shift toward higher elevations in the northwest, while the distribution of Quercus monimotricha scrub varies under different carbon emission scenarios, with a much smaller shift range than the other three scrubs. Our study contributes valuable insights into the spatiotemporal dynamics of subalpine shrublands in China under climate change, providing scientific guidance for biodiversity conservation and ecosystem restoration.

1. Introduction

Subalpine vegetation plays an important role in biodiversity conservation and the maintenance of ecosystem functions in terrestrial ecosystems [1,2,3,4]. The distribution of subalpine vegetation is strongly affected by global warming, which will result in the migration of subalpine vegetation to higher elevations and latitudes [5,6,7]. In particular, global warming may have a greater impact on woody vegetation than on herbaceous plants [8]. This will challenge biodiversity conservation and the maintenance of ecosystem functions [9,10].
Subalpine shrublands are distributed at the upper limit of montane cold–temperate coniferous forests, situated within an ecotone [11]. They are capable of adapting to the alpine climate characterized by low temperatures, aridity, and prolonged snow cover. Shrubland occurrence increased by 12% and shrubland cover by 10% in Mediterranean high-mountain ecosystems of the Central Apennine Mountain Range (Italy) over a period of almost 60 years (1954–2012) [12]. A study in the treeline ecotone area of the Qinghai–Tibet Plateau has predicted that Juniperus tibetica Komarov will migrate to higher-elevation and higher-altitude areas [13]. Therefore, exploring the potential habitat of subalpine shrublands under global warming can provide a scientific basis for vegetation protection and the management of subalpine ecosystems.
Located in the southeast of the Tibetan Plateau, the Hengduan Mountains are recognized as a climate change-sensitive area and an important refuge [14,15,16]. This is also one of the areas with the richest subalpine species diversity [17,18]. The subalpine shrublands in the Hengduan Mountains play a positive role as ecosystem engineers, improving microenvironments and promoting the growth and survival of forest understory seedlings [2,19]. Currently, there is limited research on the suitable habitats of subalpine shrublands in the Hengduan Mountains region. Studying the response of subalpine shrublands in the Hengduan Mountains to global warming not only is crucial for biodiversity conservation and ecosystem services in this region, but also provides a scientific basis for mitigation and adaptation strategies against climate change on a global scale.
Species distribution modeling (SDM) is an important numerical tool to study the suitable habitats of species, which combines the observation data of species abundance or occurrence with environmental estimation [20]. By using known species distribution data and corresponding environmental variables, SDM simulates the geographical range of species and identifies the drivers behind their distribution [21,22,23]. The Maximum Entropy Model (MaxEnt) is the most widely applied SDM model to predict species distribution [24,25,26]. It operates efficiently across different temporal and spatial scales and demonstrates exceptional performance even when data on species distribution points are limited [27].
We focus on four main subalpine shrublands distributed in the Hengduan Mountains, including Rhododendron heliolepis Franch. (R. heliolepis) scrubs, Rhododendron flavidum Franch. (R. flavidum) scrubs, Quercus monimotricha (Hand.-Mazz.) Hand.-Mazz. (Q. monimotricha) scrubs, and Pinus yunnanensis var. pygmaea (Hsueh ex C. Y. Cheng, W. C. Cheng & L. K. Fu) Hsueh (P. yunnanensis var. pygmaea) scrubs. We employ the MaxEnt model to explore potential suitable habitats and identify the primary drivers of them under different climate scenarios. The objectives of this study are as follows: (1) clarifying the current suitable habitat ranges of the four subalpine shrublands in China and identifying the primary drivers that influence their distribution; (2) comparing the differences in suitable habitat changes for these scrubs under future climate scenarios; and (3) ascertaining the migration trends of these scrubs. The findings hold substantial implications for subalpine vegetation restoration, biodiversity conservation, and ecosystem stability.

2. Materials and Methods

2.1. Collection and Processing of Data

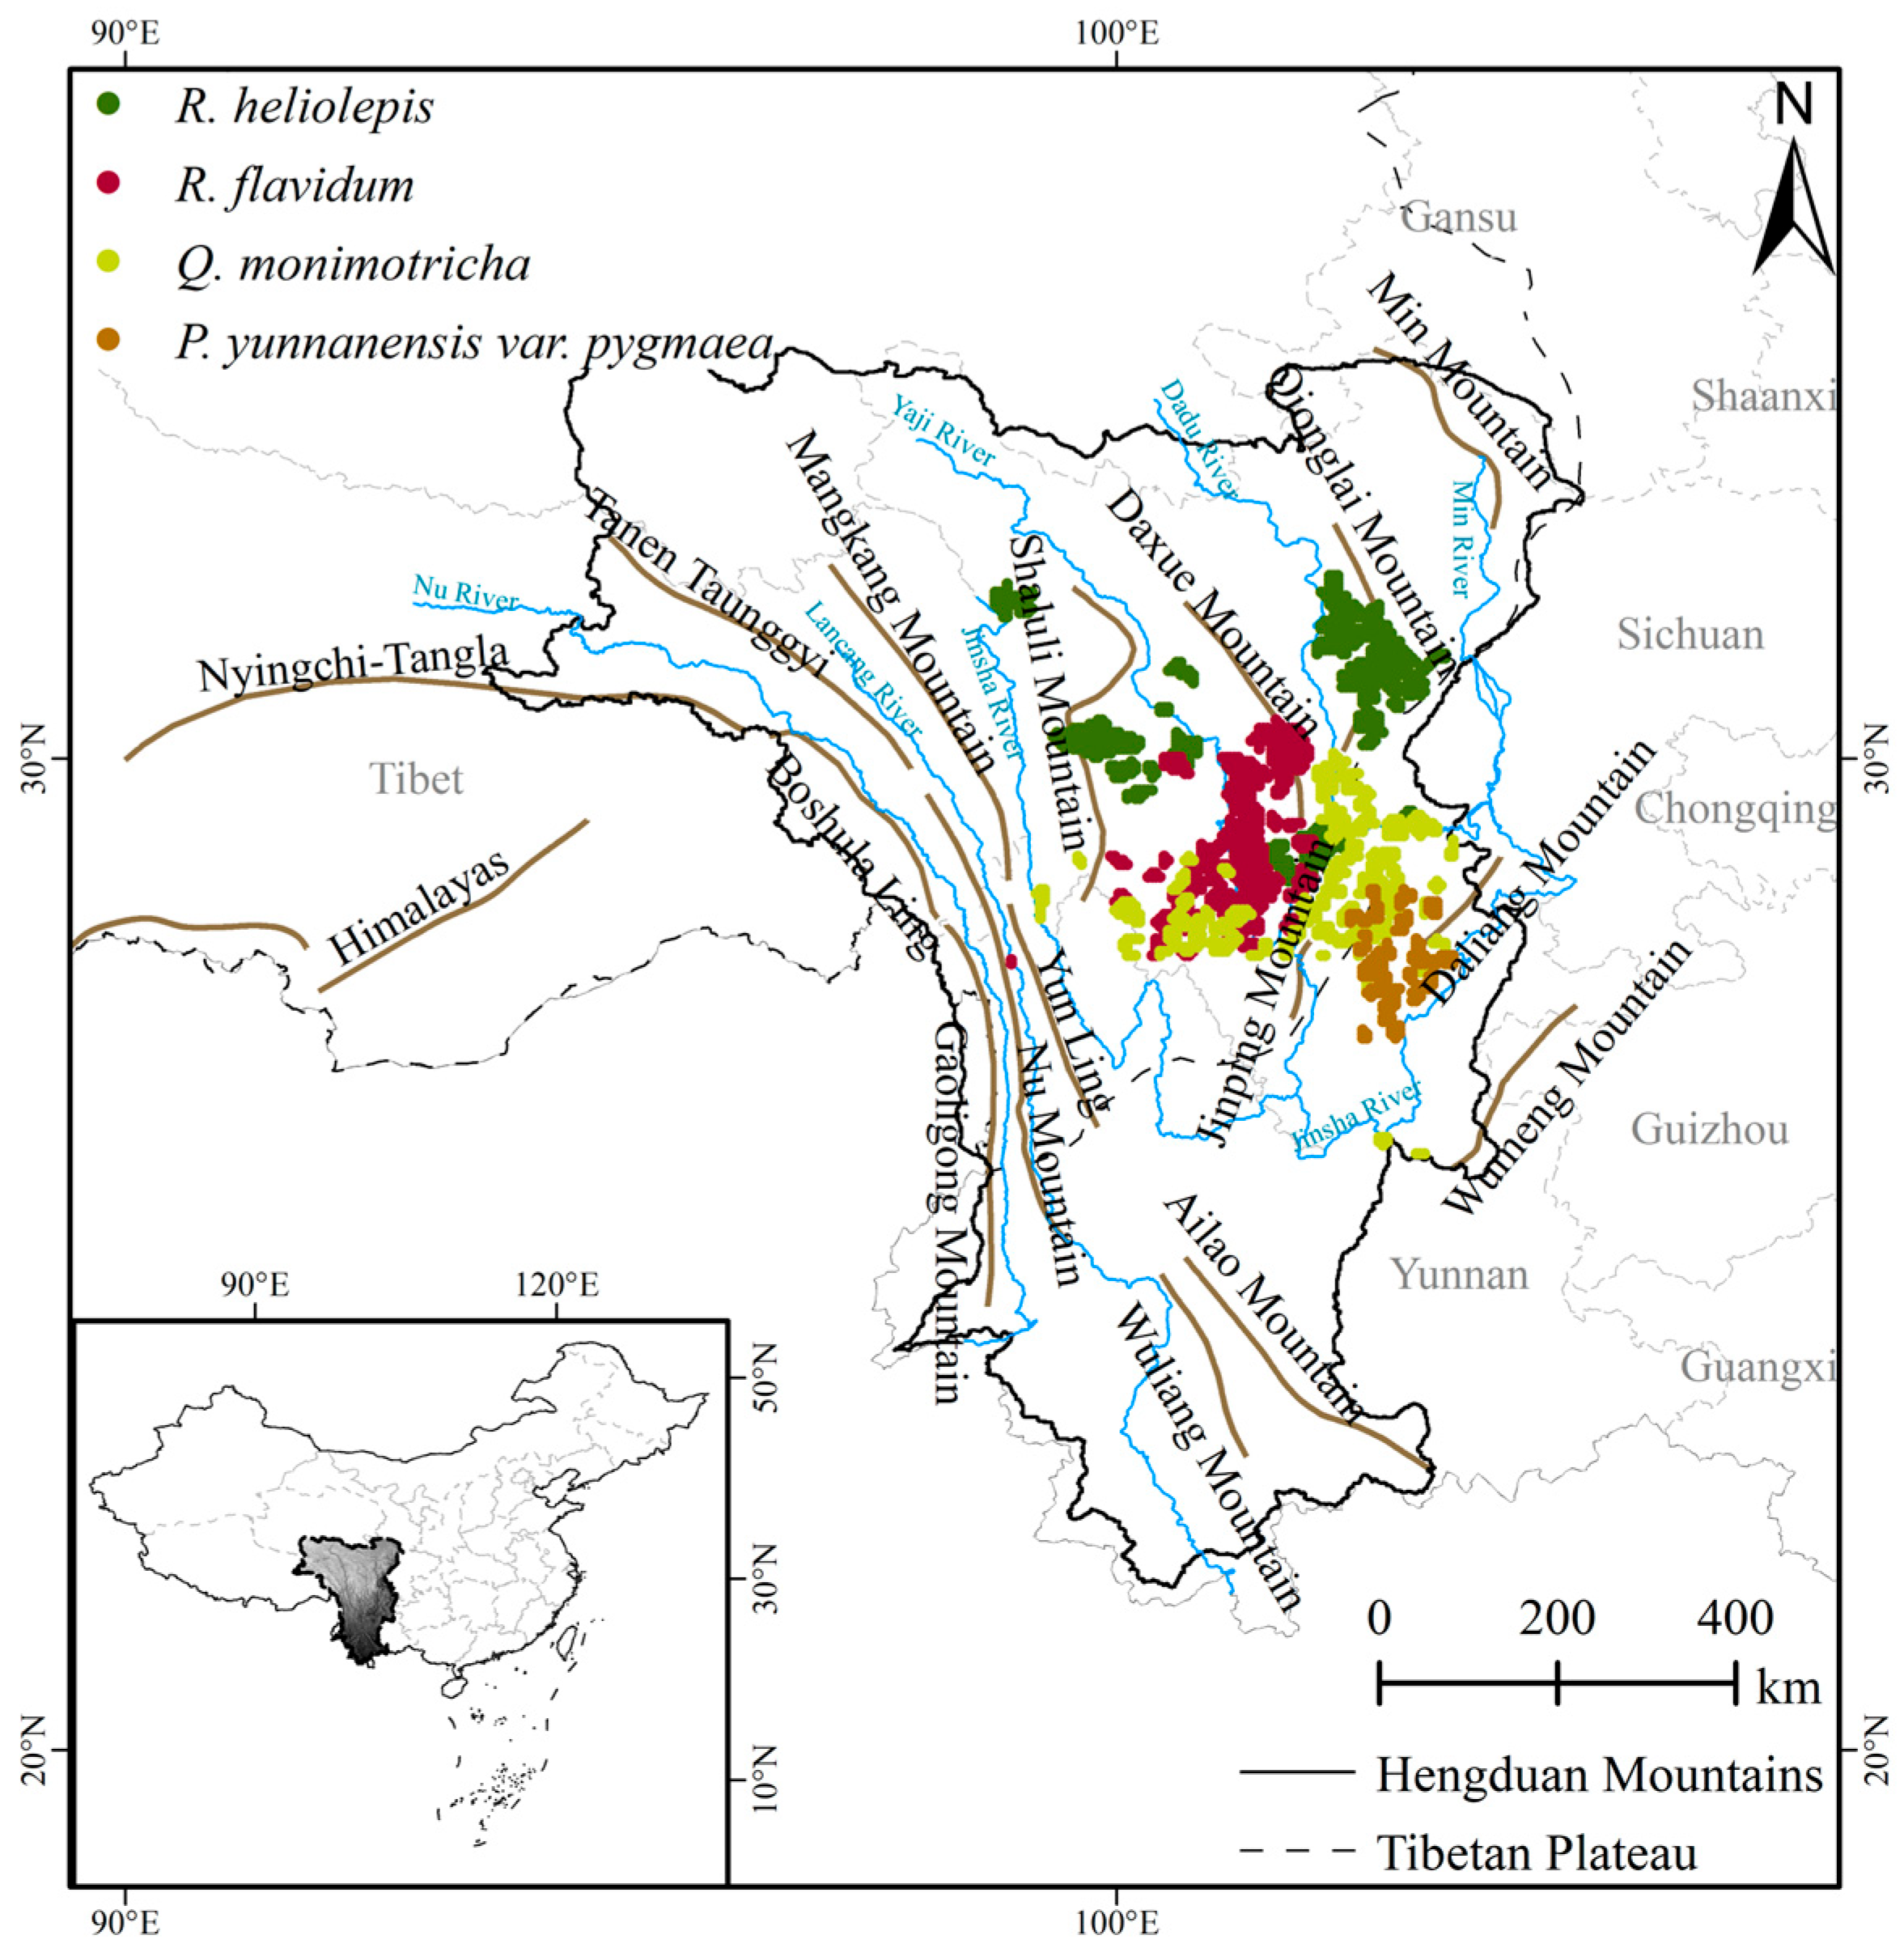
2.1.1. Vegetation Occurrence Data

As native vegetation types, R. heliolepis scrub, R. flavidum scrub, Q. monimotricha scrub, and P. yunnanensis var. pygmaea scrub are distributed in the Hengduan Mountains region. As the dominant shrub between R. heliolepis scrub and R. flavidum scrub, R. heliolepis reaches a height of approximately 2 m, while R. flavidum ranges from 0.4 to 0.8 m in height; both belong to the evergreen broadleaf Rhododendron species. As a dominant species, Q. monimotricha, reaching a height of approximately 1 m, is an evergreen sclerophyllous oak capable of withstanding cold, arid climates and nutrient-poor soils [28]. As the dominant species of P. yunnanensis var. pygmaea scrub, P. yunnanensis var. pygmaea exhibits an indistinct main trunk, with multiple stems branching from the base, reaching a height of 0.4 to 2.0 m, and assumes a shrub-like growth form [29].
Occurrence data of four communities (R. heliolepis scrub, R. flavidum scrub, Q. monimotricha scrub, and P. yunnanensis var. pygmaea scrub) were obtained from the “Vegetation Atlas of China (1:1,000,000)” published by Science Press in 2001 [30], with a spatial resolution of 1 km. ArcGIS 10.8.1 was used for the spatial registration, vectorization, and rasterization of the dataset to generate latitude and longitude data for the communities. The ENMtools package [31] was used for filtering, ensuring that only one occurrence point was retained per 5 km × 5 km grid to mitigate spatial autocorrelation among sample points. After screening, 764, 732, 630, and 216 effective distribution points were retained for R. heliolepis scrub, R. flavidum scrub, Q. monimotricha scrub, and P. yunnanensis var. pygmaea scrub, respectively (Figure 1). These data were saved in Excel in the order of vegetation name, longitude, and latitude and exported in “*.CSV” format for the construction of MaxEnt models.

2.1.2. Environmental Variable Data

In this study, a total of 24 environmental factors were selected, comprising 19 bioclimatic factors, 2 topographic factors, and 3 soil factors. Additionally, a human activity factor, representing a key component of global change [32], was incorporated. Bioclimatic data for the current period (1970–2000) and future scenarios (2021–2040, 2061–2080), along with elevation data, were obtained from the WorldClim dataset at a 5 km spatial resolution [33]. Slope and aspect data were extracted from the elevation data using the “3D Analyst tools” in ArcGIS 10.8.1. Soil data were derived from the Harmonized World Soil Database version 1.2 [34], with a spatial resolution of 1 km. Human activity data were derived from the human footprint (hf) dataset of the Socioeconomic Data and Applications Center [35], with a spatial resolution of 1km. Using ArcGIS 10.8.1, all variables were extracted by a mask, resampled, and projected, with their spatial resolution standardized to 5 km.
The Beijing Climate Center Climate System Model version 2 (BCC-CSM2-MR) was selected as a future climate model, which is published by CMIP6. The BCC-CSM2-MR is renowned for its exceptional performance in simulating China’s climate [36]. Three Shared Socioeconomic Pathways (SSP126, SSP370, and SSP585) were selected for this study due to their extensive application in research on the distribution of suitable habitats [37,38]. SSP126 represents a low-radiative-forcing scenario, SSP370 represents a medium- to high-radiative-forcing scenario, and SSP585 represents a high-radiative-forcing scenario, each corresponding to low-to-high carbon emissions, respectively [27]. For the prediction of future scenarios, we assumed that topography, soils, and the human footprint would remain unchanged in the future, because topography will not change greatly, and the contribution rates of soils and the human footprint in our study were relatively low.
Considering the strong correlations among environmental variables, which may cause model overfitting, we eliminated some variables that exhibited strong correlations with others [39]. Firstly, a total of 25 environmental variables and distribution data were imported into MaxEnt 3.4.1 software for simulation, and the contribution of each variable to the model prediction was obtained and factors without a contribution rate eliminated. Then, the Spearman correlation coefficients of the variables were computed using SPSS 27 software; in instances where the absolute correlation coefficient between two environmental variables exceeded 0.75, the environmental variable with the lowest contribution rate was selected for removal [32,40,41]. The number of retained environmental variables (Table 1) for the suitable habitats of R. heliolepis scrub, R. flavidum scrub, Q. monimotricha scrub, and P. yunnanensis var. pygmaea scrub (Table 1) was 10, 11, 9, and 12, respectively. In subsequent modeling, only the retained environmental variables are used.

2.2. Classification of Suitable Habitats and Identification of Primary Drivers

The retained vegetation distribution data and corresponding environmental data of R. heliolepis scrub, R. flavidum scrub, Q. monimotricha scrub, and P. yunnanensis var. pygmaea scrub were imported into the Maxent model to calculate their potential habitats. Of the distribution point data, 75% was assigned as training data, while the remaining 25% was designated as test data, with the maximum number of iterations set to 1000 and all other settings maintained at their default values; the average of 10 repetitions was used as the simulation result [42,43]. To visualize the modeling results, the “reclassfy” tool of ArcGIS 10.8.1 was used. We used natural breaks to divide the simulation results into four levels [44]: unsuitable habitat (0–0.1), generally suitable habitat (0.1–0.3), moderately suitable habitat (0.3–0.5), and highly suitable habitat (0.5–1). The suitable areas of four subalpine shrublands were studied on the basis of generally, moderately, and highly suitable habitats.
The jackknife test option was used to obtain the percentage contribution of each environmental variable, and response curves were obtained to analyze the range of environmental variables that are suitable for the growth of the four subalpine shrublands. When the cumulative contribution of variables is greater than 85%, these variables are identified as the primary drivers affecting the distribution [32,45]. In general, when an environmental variable has a probability value of 0.5 or more, it indicates that the environmental conditions are suitable for the growth of the four subalpine shrublands [42]. In order to better demonstrate the influence of environmental factors on the suitable habitats of the four subalpine shrublands, we selected the response interval with an existence probability p > 0.5 as the selection condition, drew the response curve of the primary drivers, and analyzed the optimal environmental variable range for the survival of each shrubland.

2.3. Calculation of Contraction and Expansion, Centroid, and Elevation Shift in Suitable Habitats

The “raster to polygon” tool of ArcGIS software was employed to compute the area of suitable zones under each scenario based on the reclassified raster data of current and future suitable habitats. The difference between the area of current suitable zones and the area of future suitable zones was then compared with the area of current suitable zones to obtain the ratio of contraction or expansion of suitable zones under each scenario. The “analyst tools” of ArcGIS software were used to facilitate the investigation of spatial variability in suitable areas for current and future climate scenarios, with results presented as areas of no change, of loss, and of gain, thereby obtaining the geographical extent of contraction and expansion of suitable zones under each scenario.
On the basis of the suitable habitat areas in all scenarios, the centroid and mean elevation of the four scrubs under each scenario were calculated using the “spatial statistics” tools and “spatial analyst” tools of ArcGIS software. The centroid position and elevation of suitable areas under future scenarios were compared with those of current suitable areas to identify horizontal and vertical trends in community shifts.

3. Results

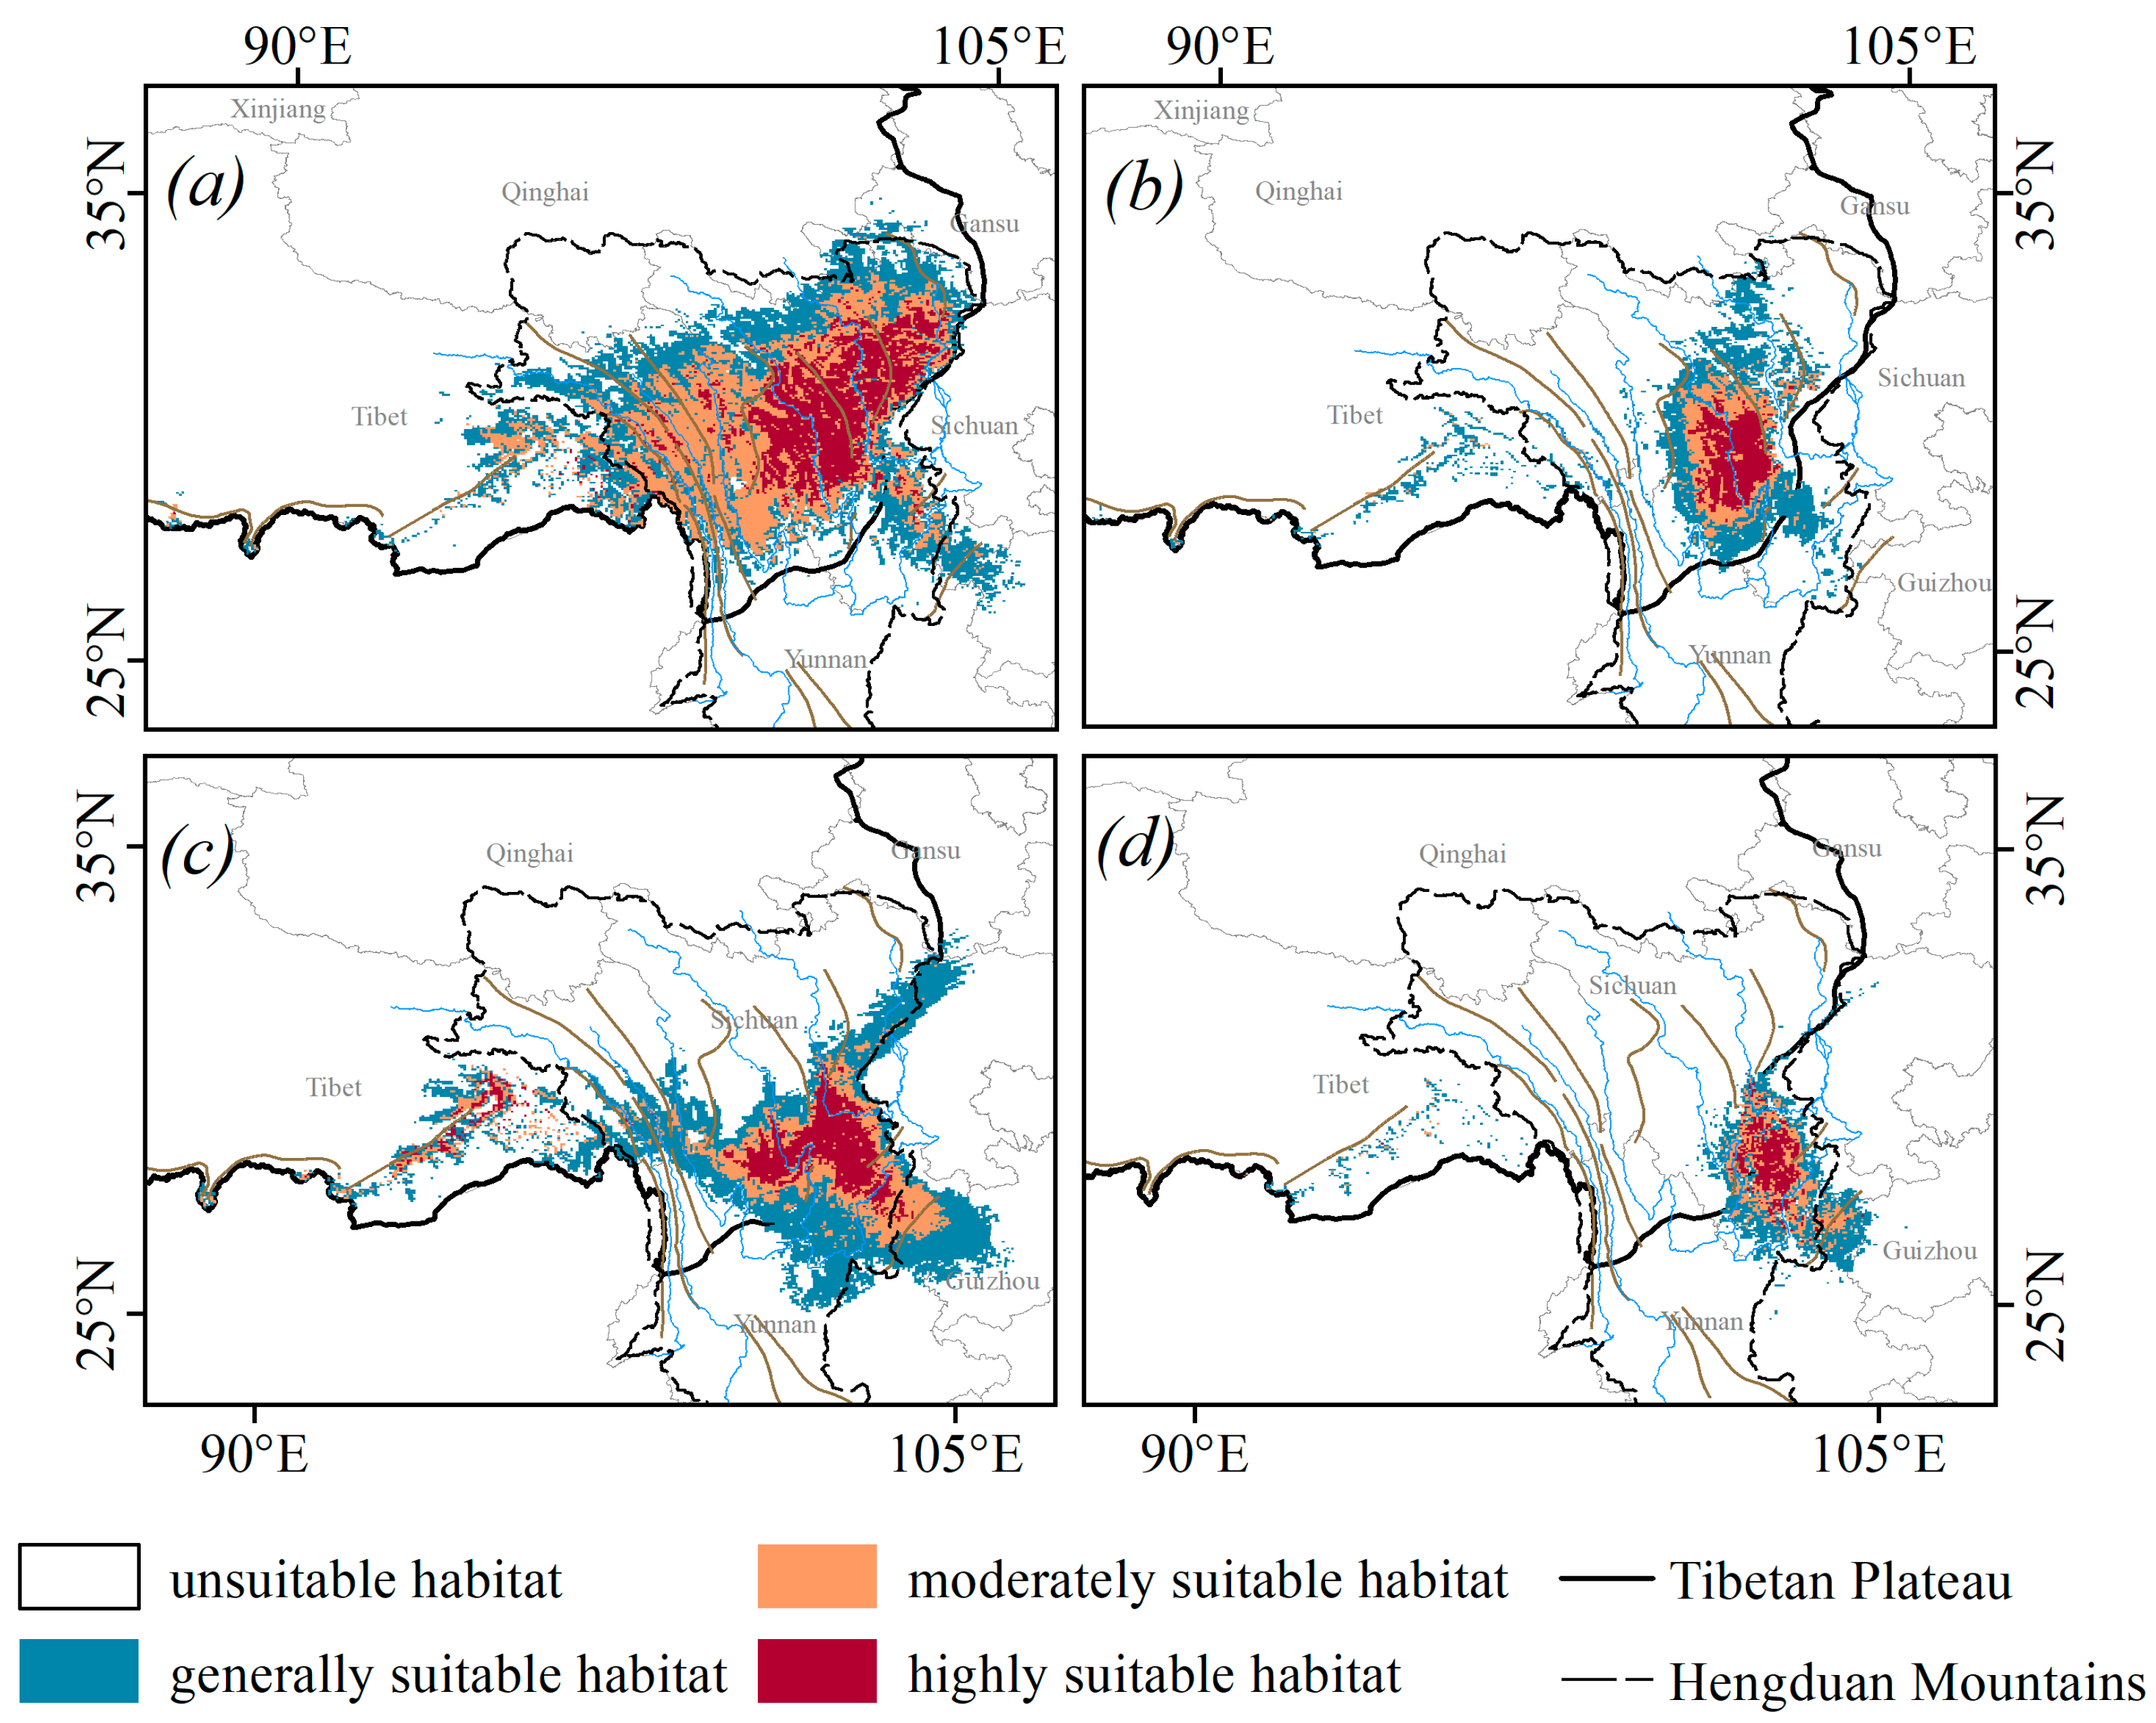
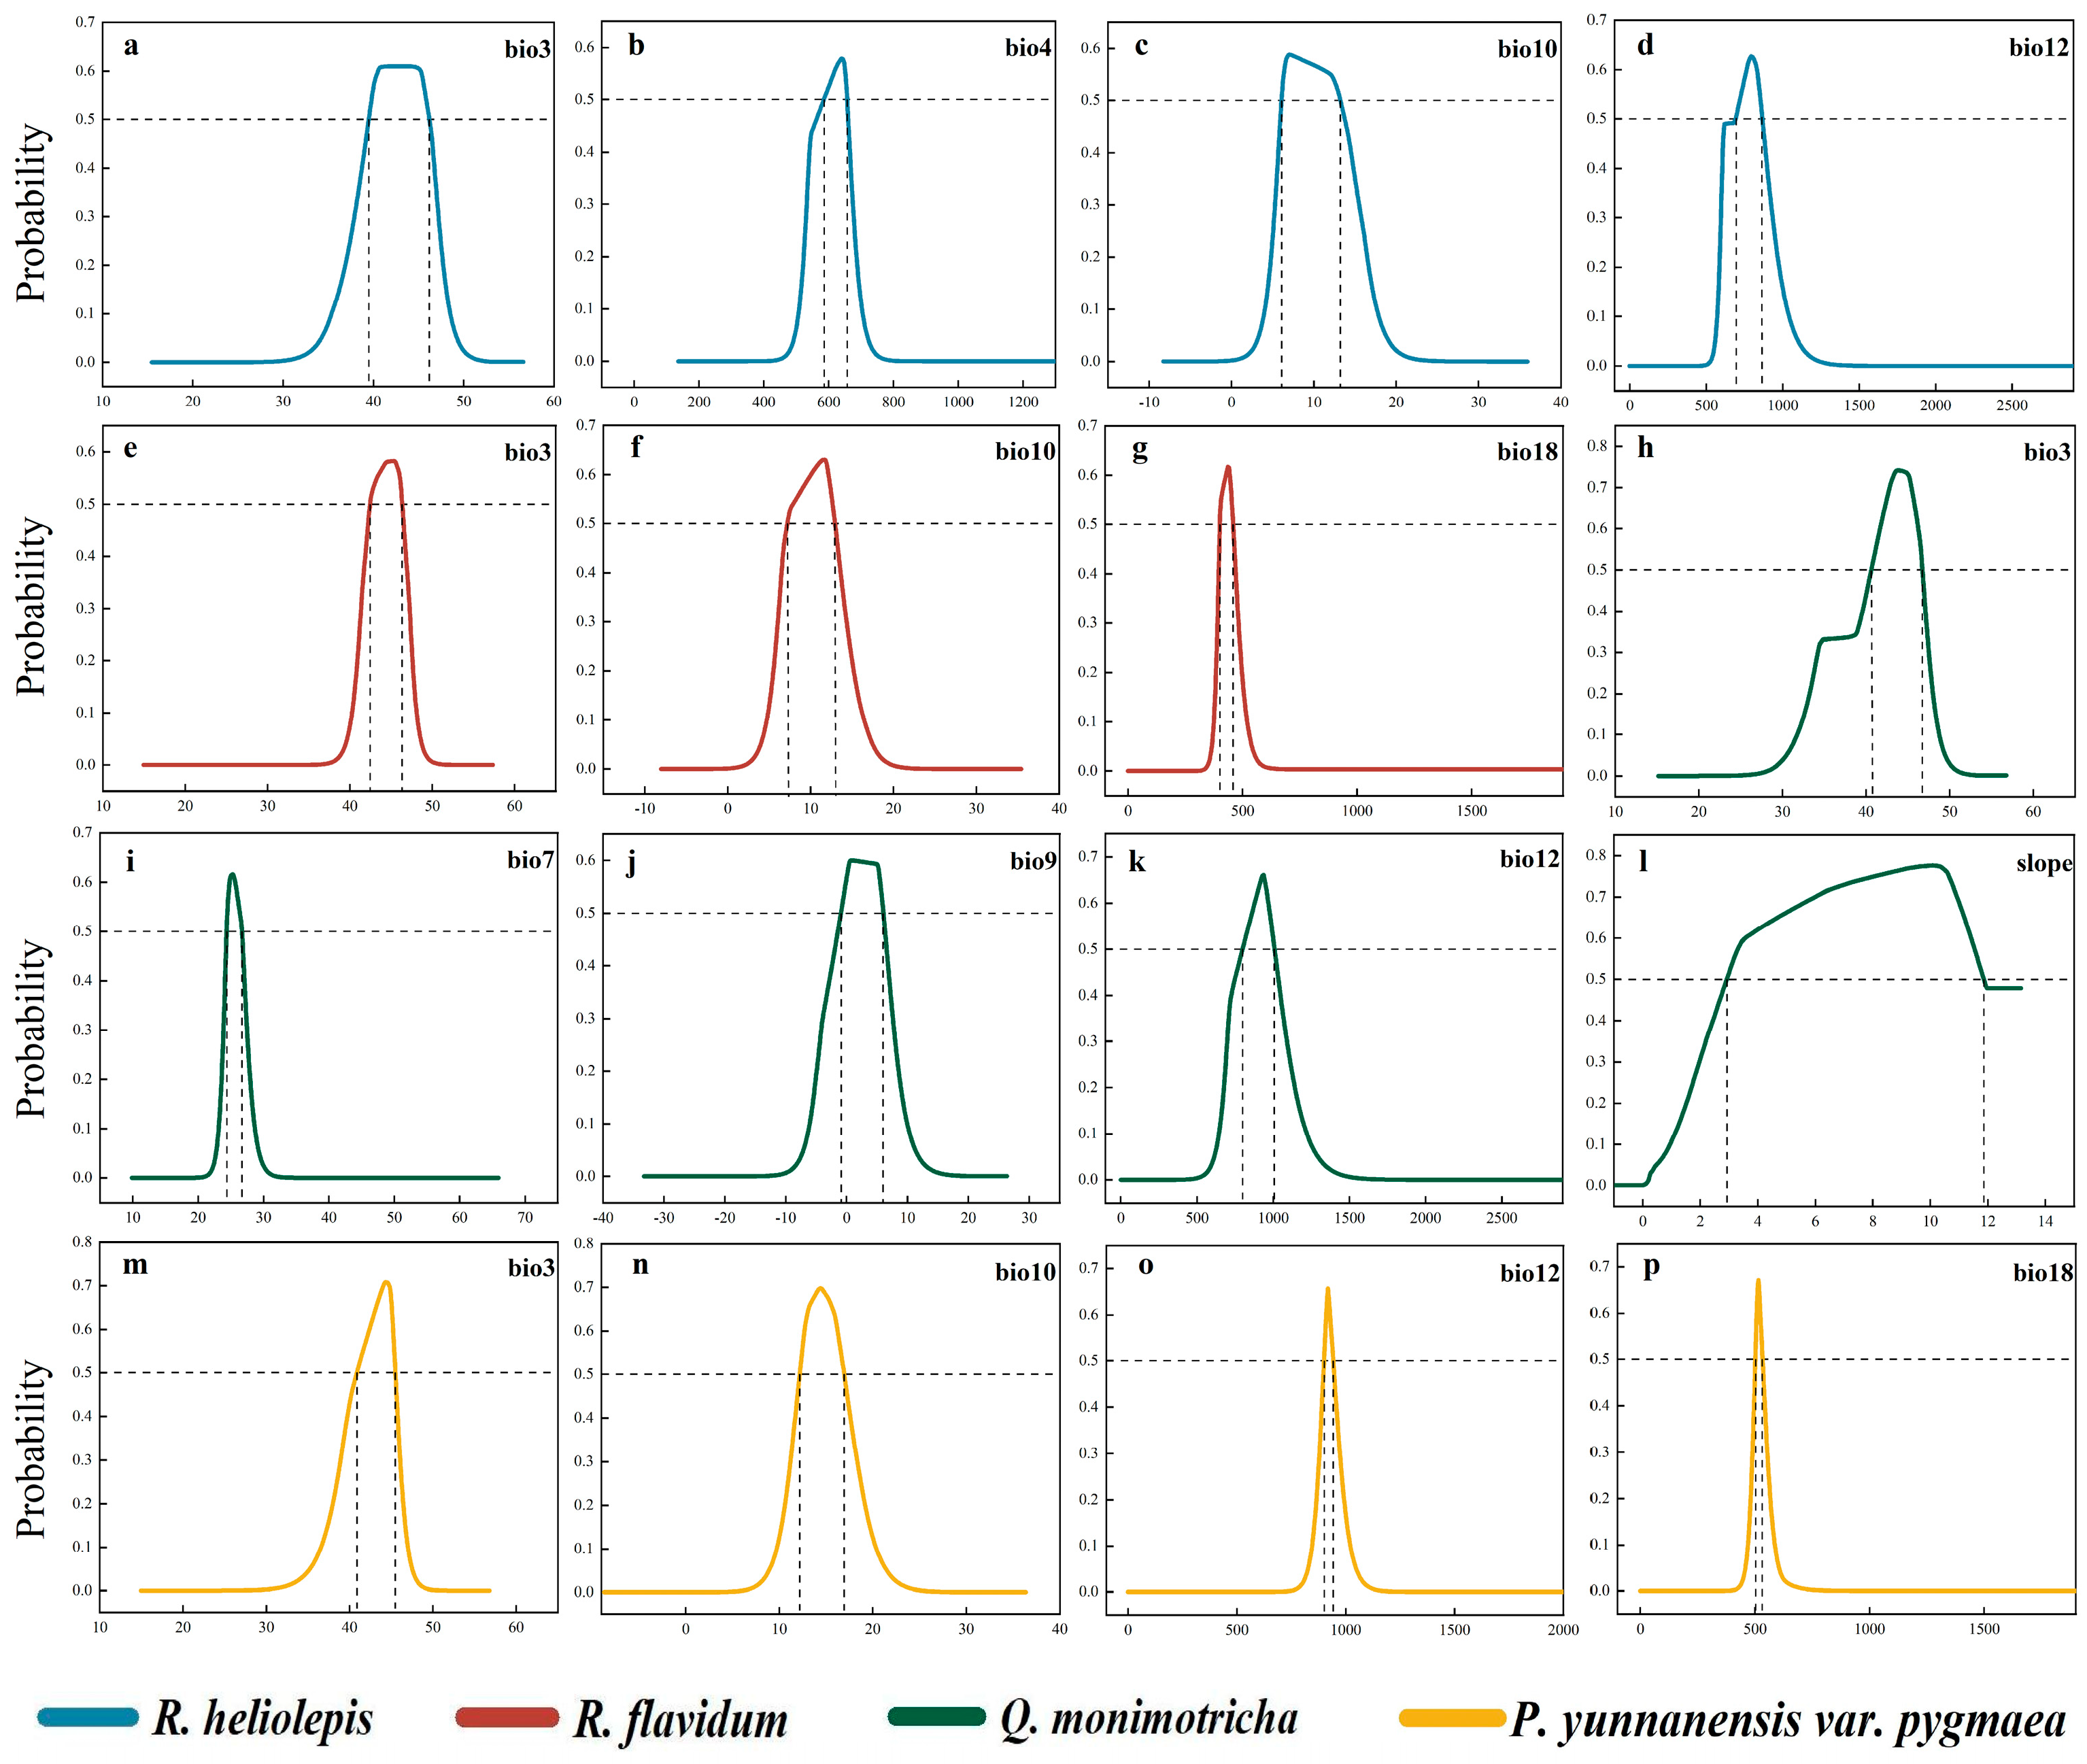
3.1. Suitable Habitat and Primary Drivers

The current suitable areas of the four subalpine shrublands were concentrated in the Hengduan Mountains region, with a small amount in the Himalayas and Wumeng Mountain. The suitable habitat of R. heliolepis scrub (Figure 2a) was mainly distributed from the eastern Himalayas to the Min Mountain, and the suitable areas covered 4.55% of China’s total land area. Among them, the generally, moderately, and highly suitable areas accounted for 1.88%, 1.74%, and 0.93%, respectively. The suitable habitats of R. flavidum scrub (Figure 2b) were mainly distributed from the Shaluli Mountain to the Qionglai Mountain, and the suitable areas accounted for 1.60% of China’s total land area. Among them, the generally, moderately, and highly suitable areas accounted for 0.96%, 0.36%, and 0.28%, respectively. The suitable habitats of Q. monimotricha scrub (Figure 2c) were mainly distributed in the eastern Himalayas, from the Shaluli Mountain to the Wumeng Mountain, and the suitable areas covered 3.14% of China’s total land area. Among them, the generally, moderately, and highly suitable areas accounted for 1.94%, 0.71%, and 0.49%, respectively. The suitable habitats of P. yunnanensis var. pygmaea scrub (Figure 2d) were mainly distributed from the Daxue Mountain to the Wumeng Mountain, and the suitable areas accounted for 0.99% of China’s total land area. Among them, the generally, moderately, and highly suitable areas accounted for 0.53%, 0.28%, and 0.17%, respectively.
Among all the environmental variables that were included in the calculation of the suitable habitats of the four subalpine shrublands, climate played a dominant role, and topography, soil, and human activities had less influence on them (Figure 3). Climatic factors were the primary drivers for the suitable habitats of R. heliolepis scrub, R. flavidum scrub, and P. yunnanensis var. pygmaea scrub, contributing 93.5%, 93.4%, and 86.2%, respectively. Among them, temperature accounted for 60.8%, 62.5%, and 44.7%, while precipitation accounted for 32.0%, 30.9%, and 41.5%, respectively. Climatic factors and slope were the primary drivers for the suitable habitats of Q. monimotricha scrub, contributing 68.7% and 19%, respectively. Among them, temperature and precipitation accounted for 45.7% and 23%, respectively.
Four variables were identified as primary drivers for the suitable habitats of R. heliolepis scrub, which were annual precipitation (32.6%), isothermality (26.9%), the mean temperature of the warmest quarter (20.3%), and temperature seasonality (13.6%) (Figure 3a). The suitable ranges for them were 695.46–862.08 mm, 39.49–46.20, 6.08–13.20 °C, and 586.37–656.76, respectively (Figure 4a–d). Three variables were identified as primary drivers for the suitable habitats of R. flavidum scrub, which were isothermality (47.9%), the precipitation of the warmest quarter (30.9%), and the mean temperature of the warmest quarter (14.6%) (Figure 3b). Their suitable ranges were 42.45–46.31, 400.84–457.64 mm, and 7.21–12.90 °C, respectively (Figure 4e–g). Five variables were identified as primary drivers for the suitable habitats of Q. monimotricha scrub, which were the temperature annual range (23.8%), annual precipitation (23.0%), slope (19.2%), isothermality (11.9%), and the mean temperature of the driest quarter (10.0%) (Figure 3c). Their suitable ranges were 24.39–26.68 °C, 798.25–1007.34 mm, 2.92°–11.86°, 40.62–46.70, and –0.93–5.99 °C, respectively (Figure 4h–l). Four variables were identified as primary drivers for the suitable habitats of P. yunnanensis var. pygmaea scrub, which were annual precipitation (29.9%), isothermality (28.6%), the mean temperature of the warmest quarter (16.1%), and the precipitation of the warmest quarter (11.6%) (Figure 3d). Their suitable ranges were 901.20–941.49 mm, 40.88–45.48, 12.19–16.93 °C, and 502.85–531.66 mm, respectively (Figure 4m–p).

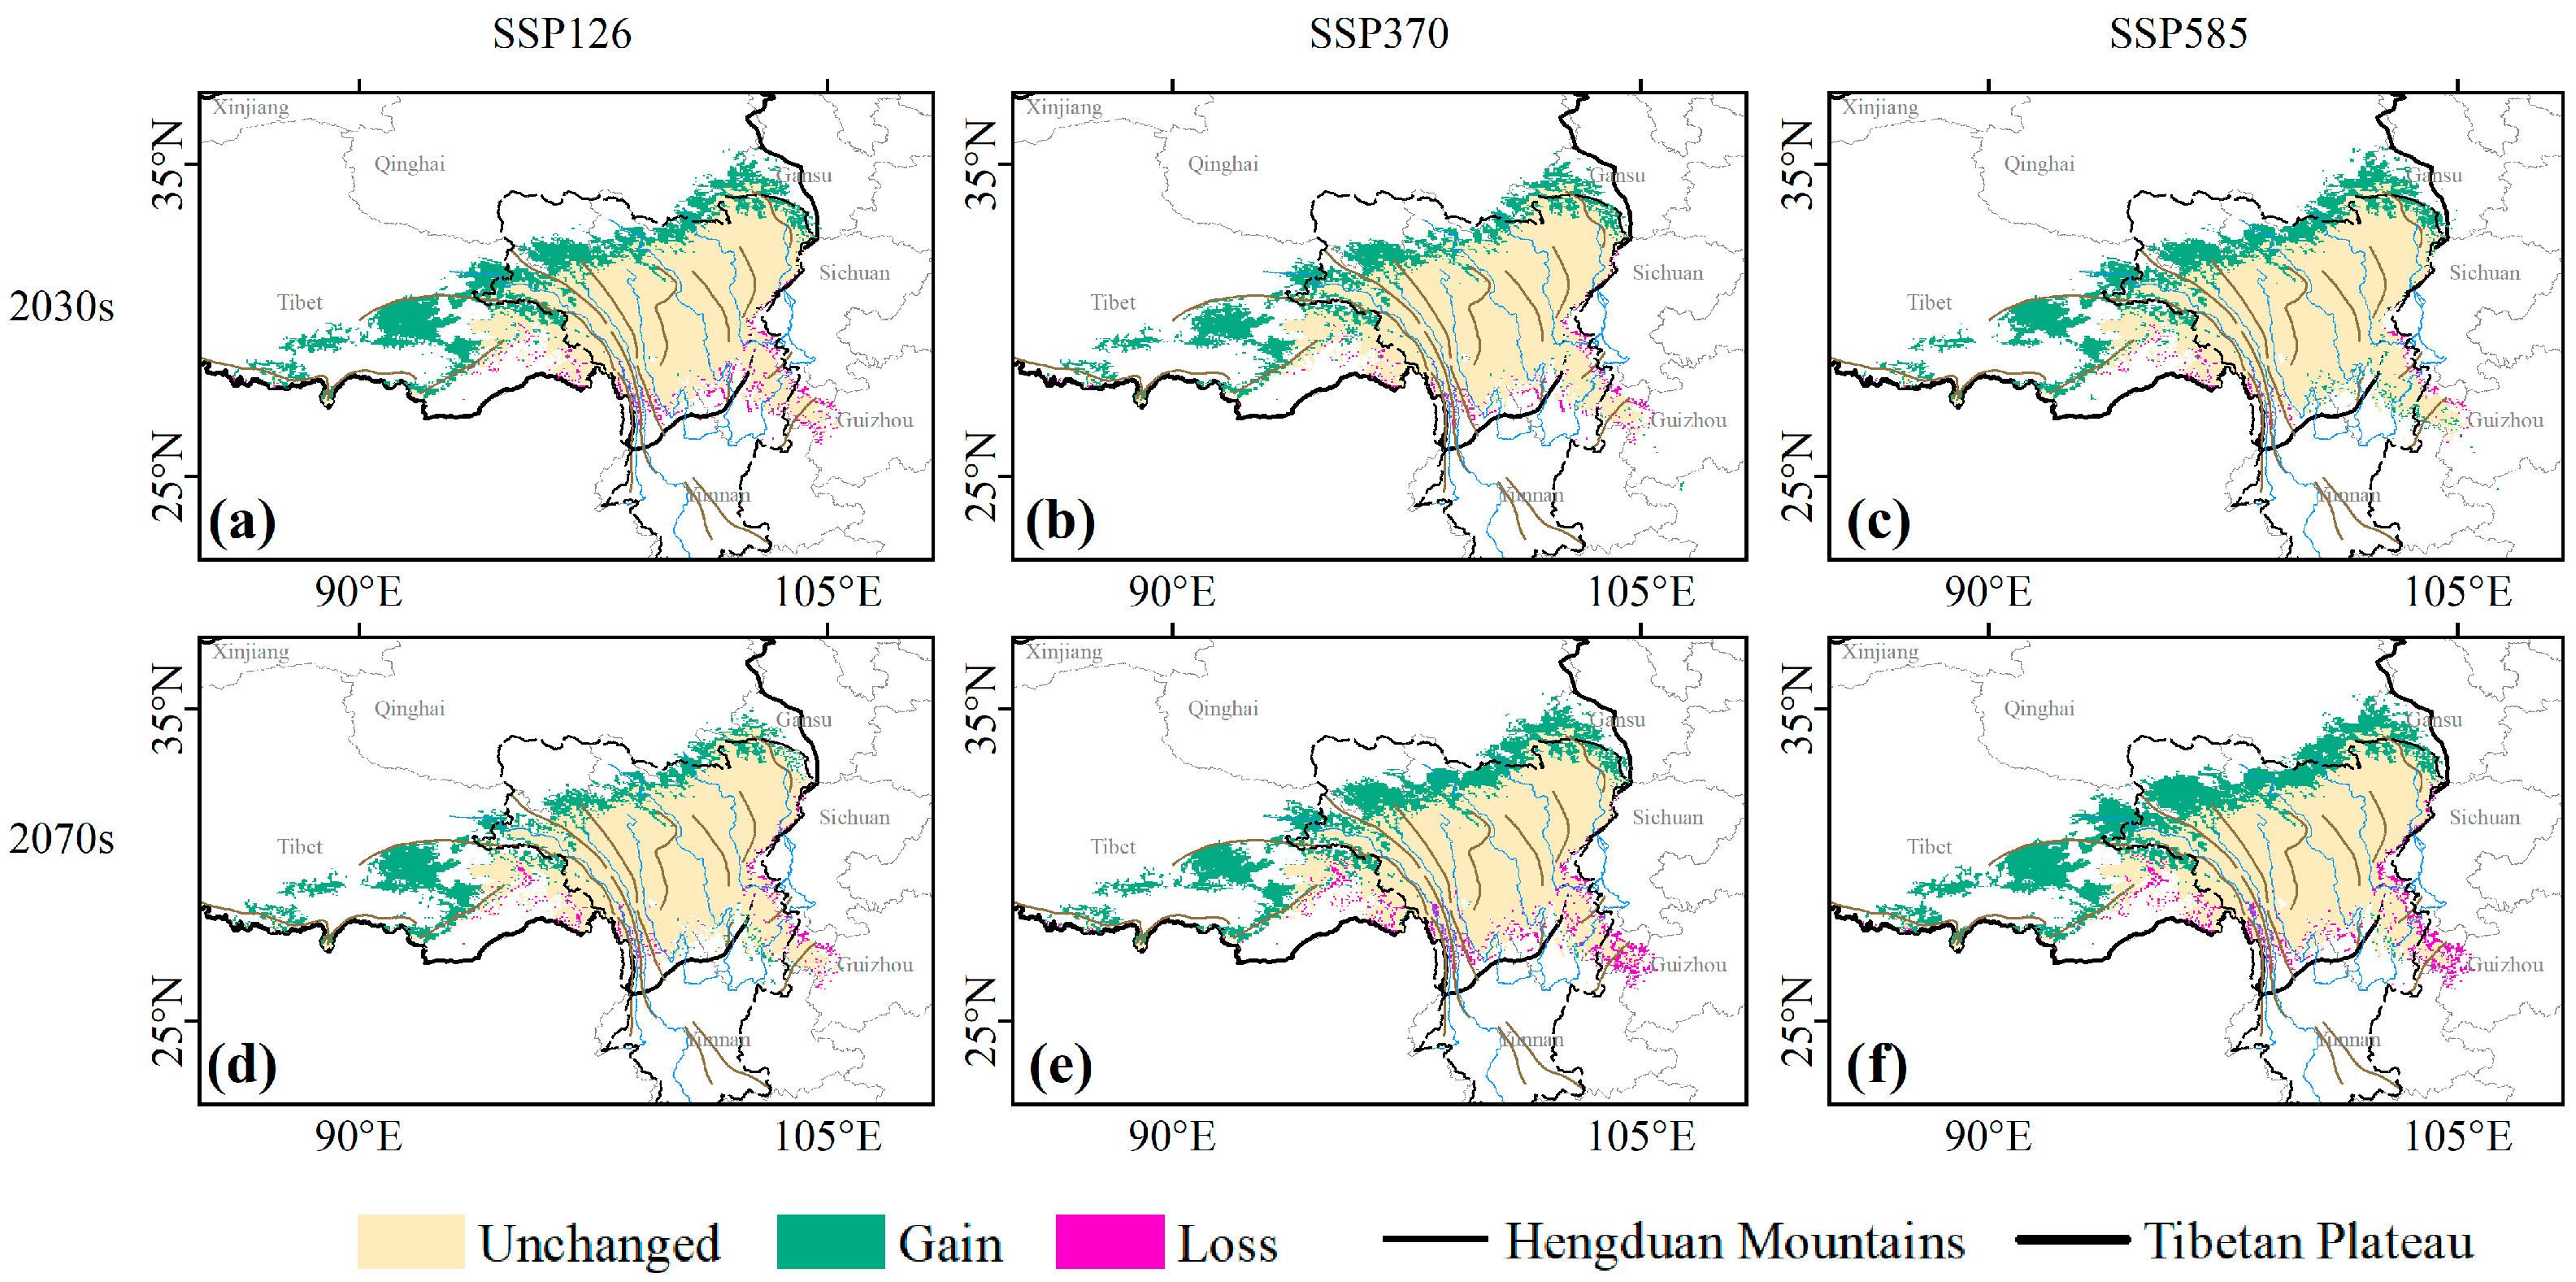
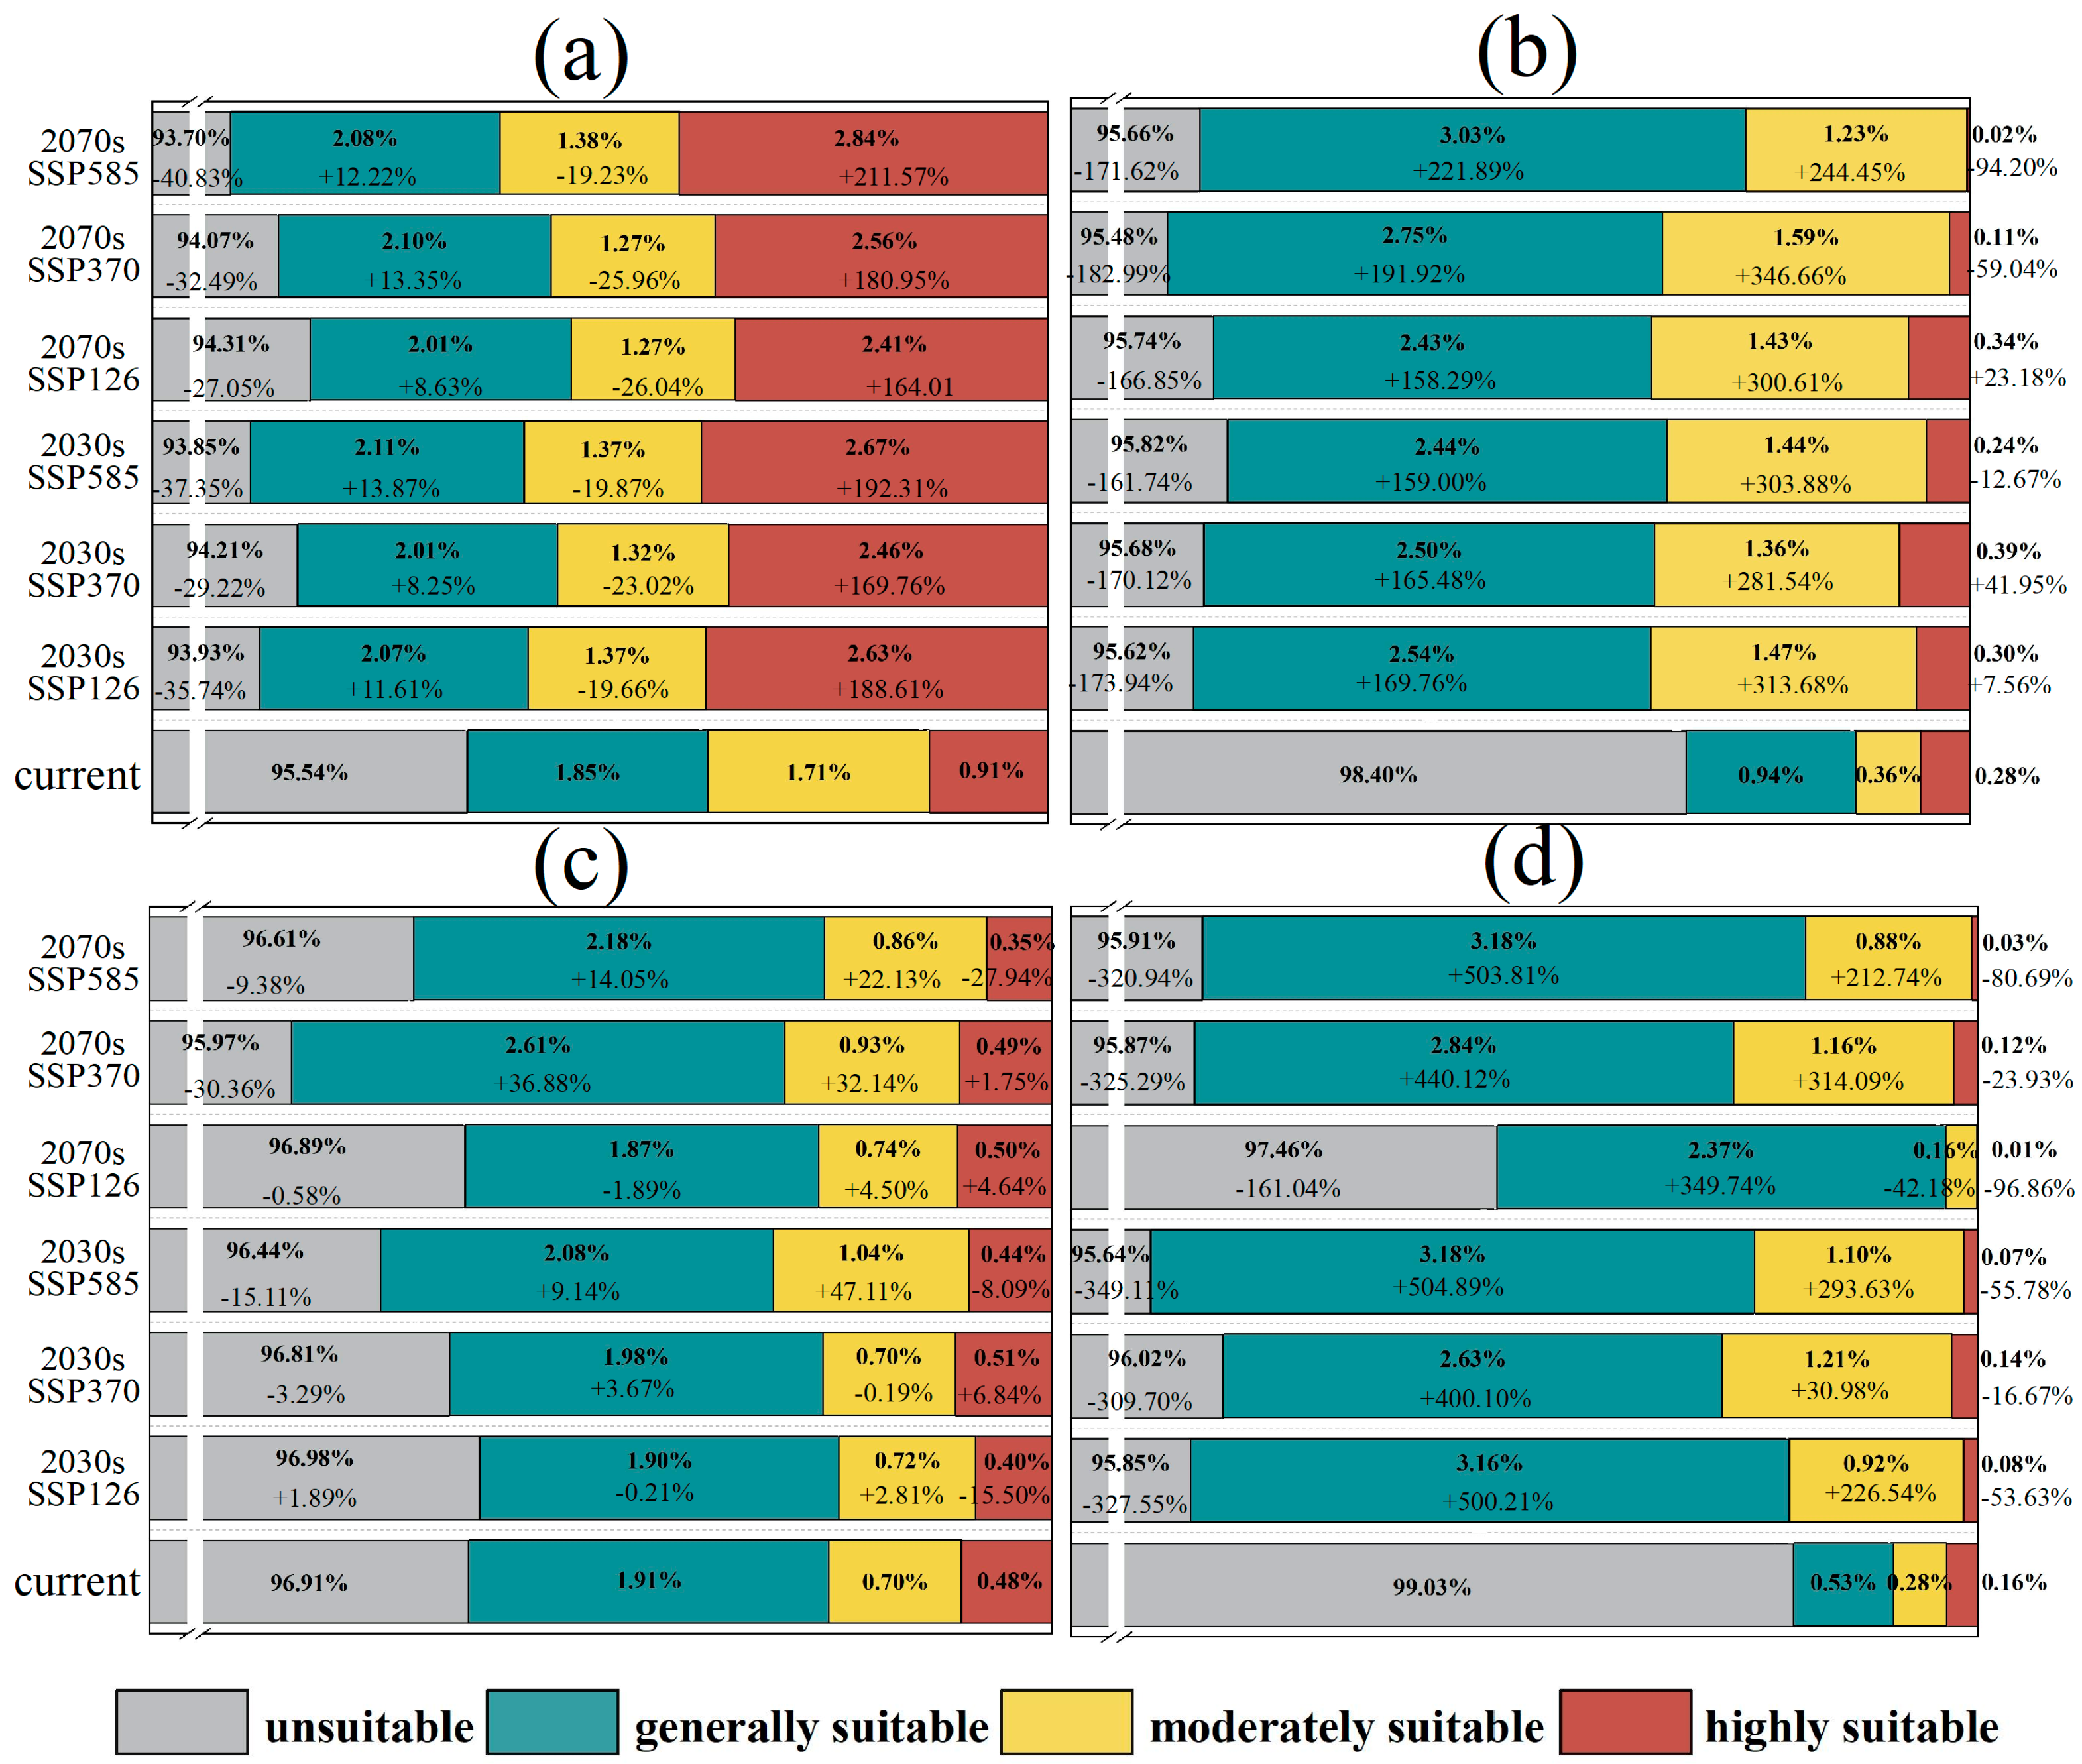
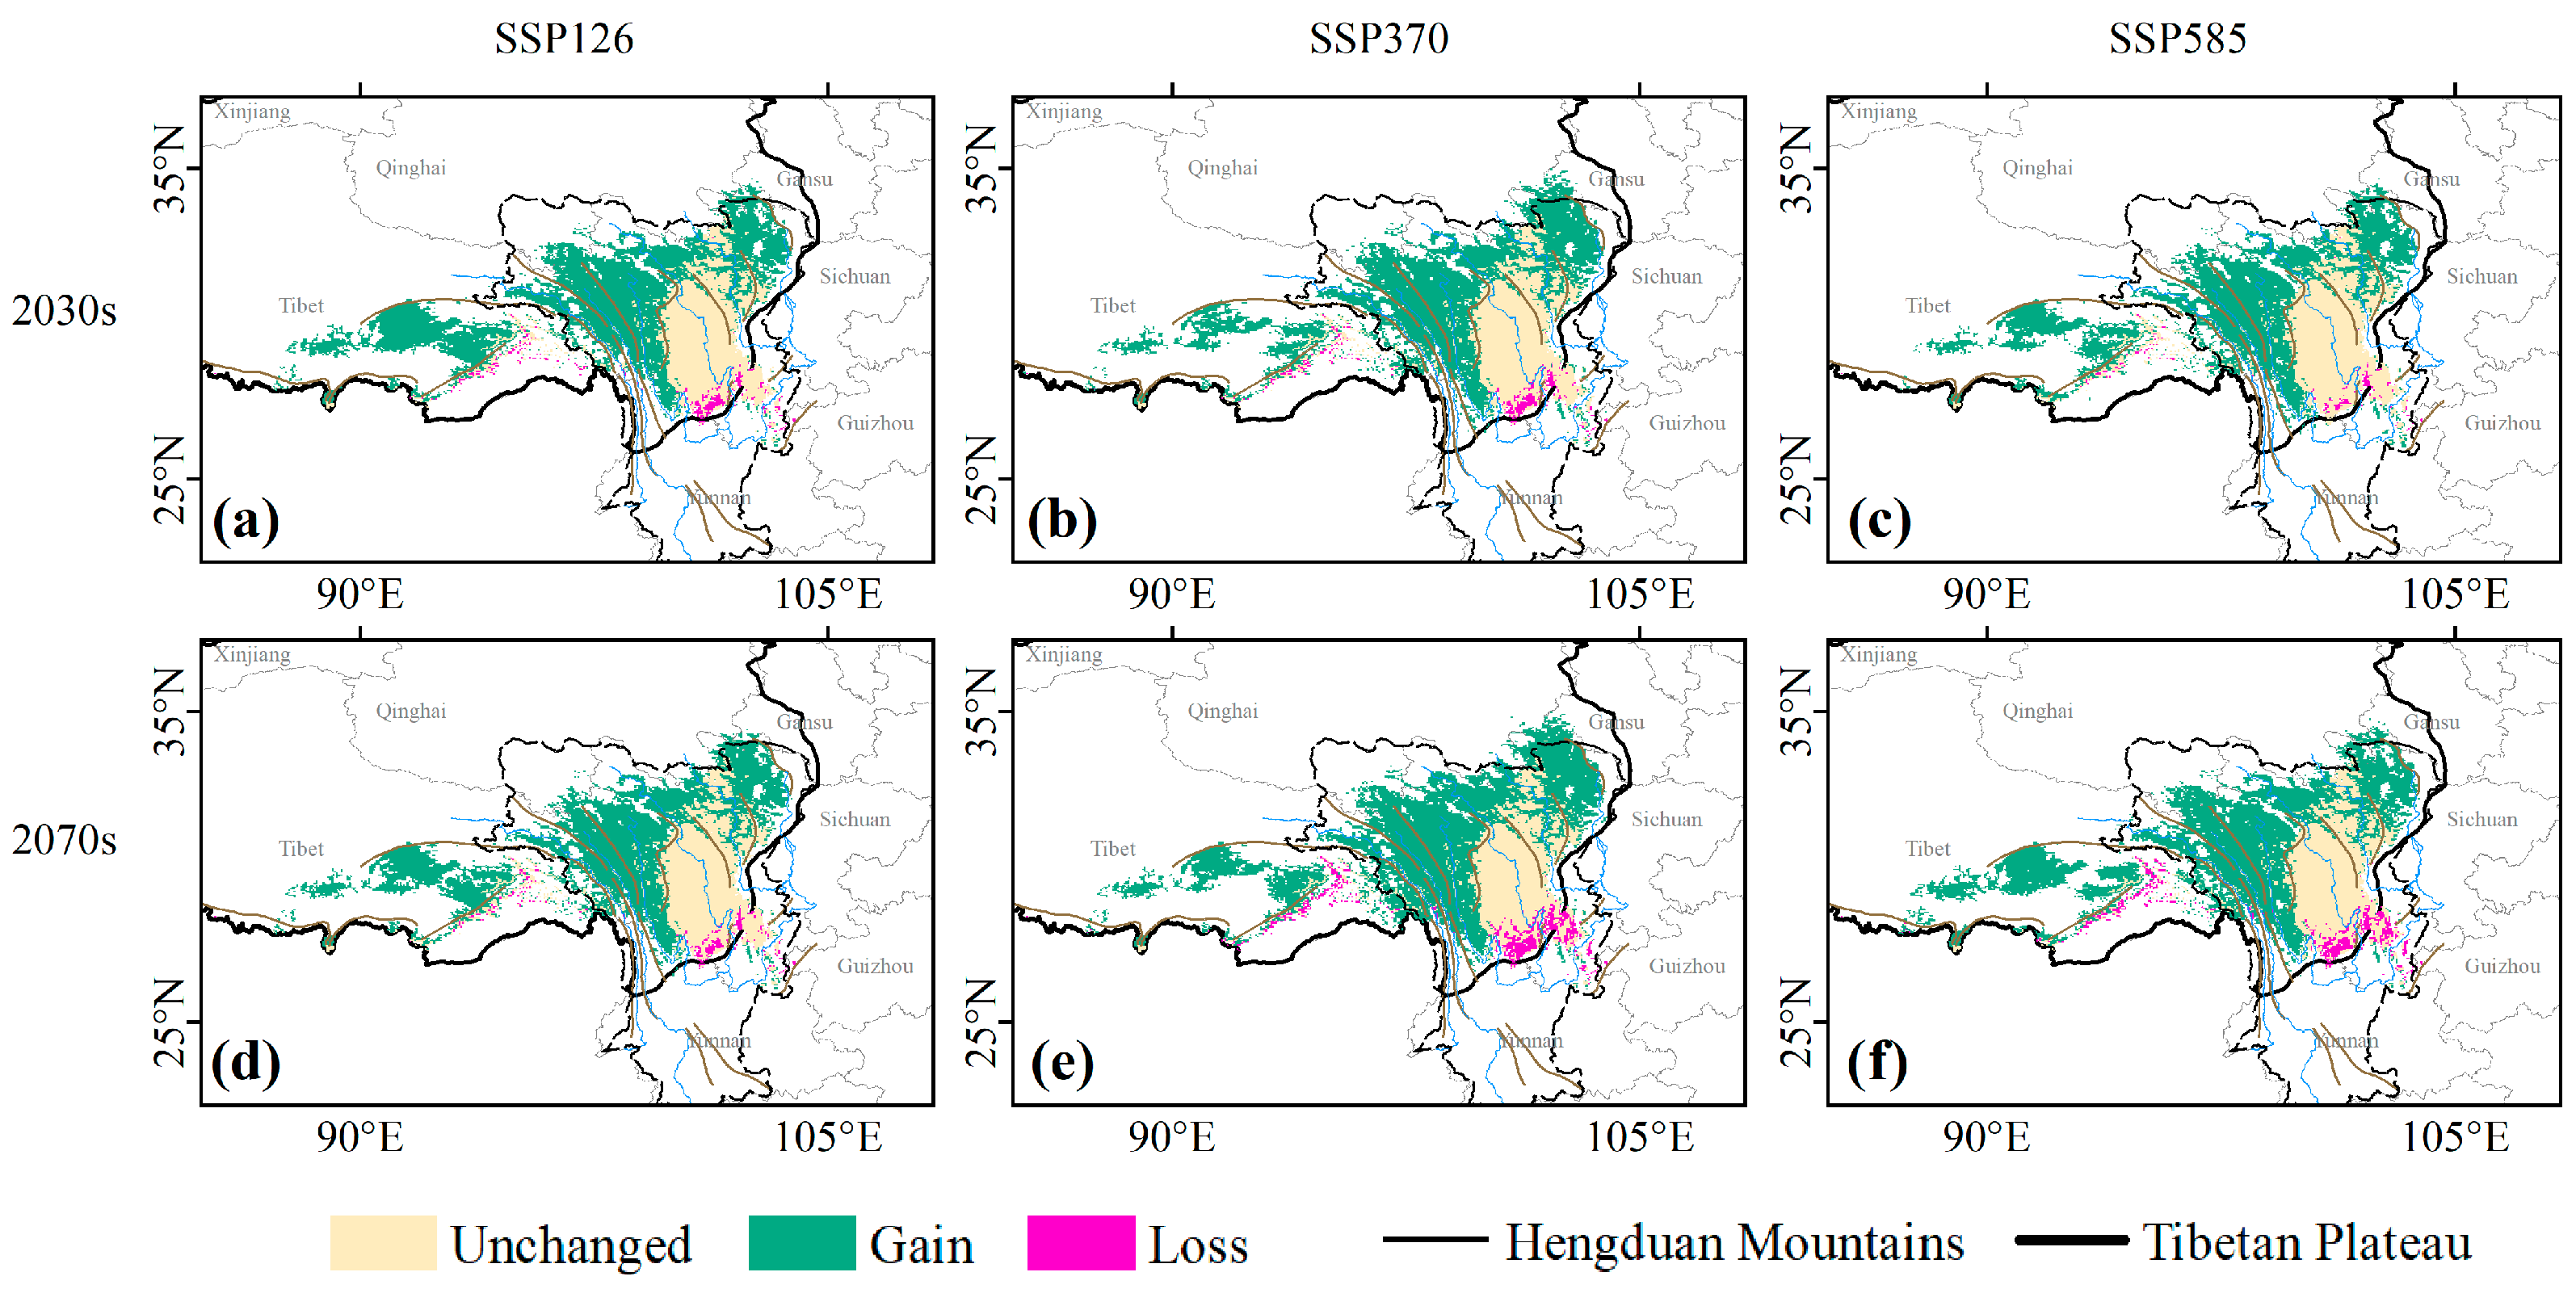
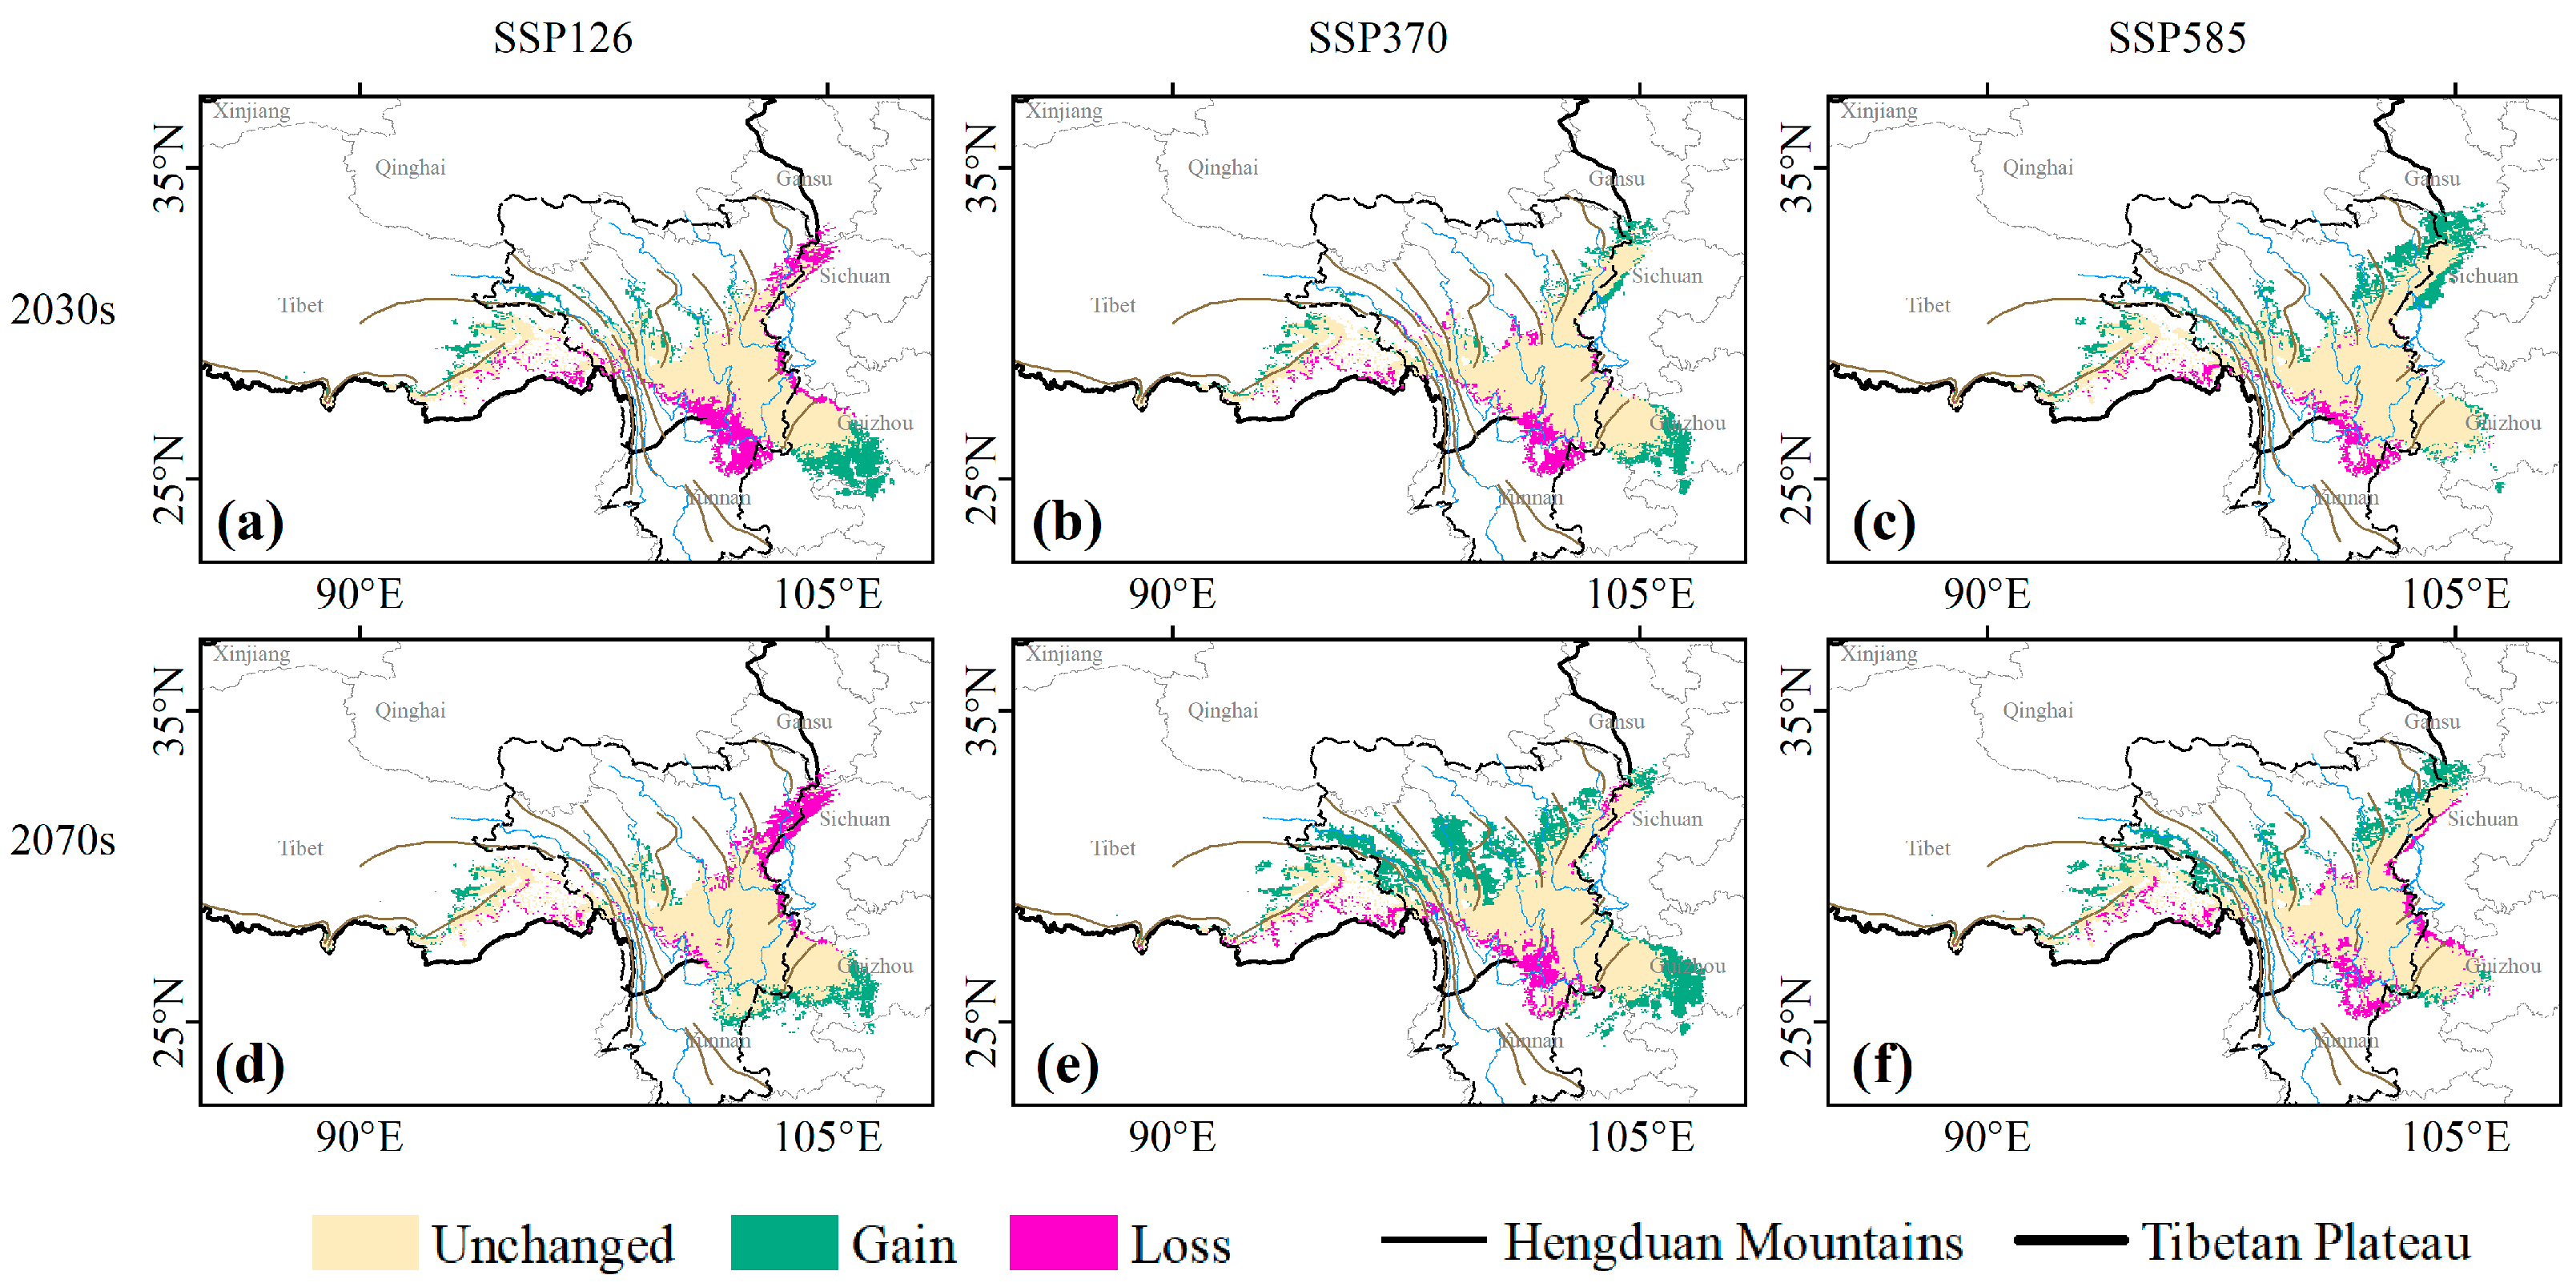
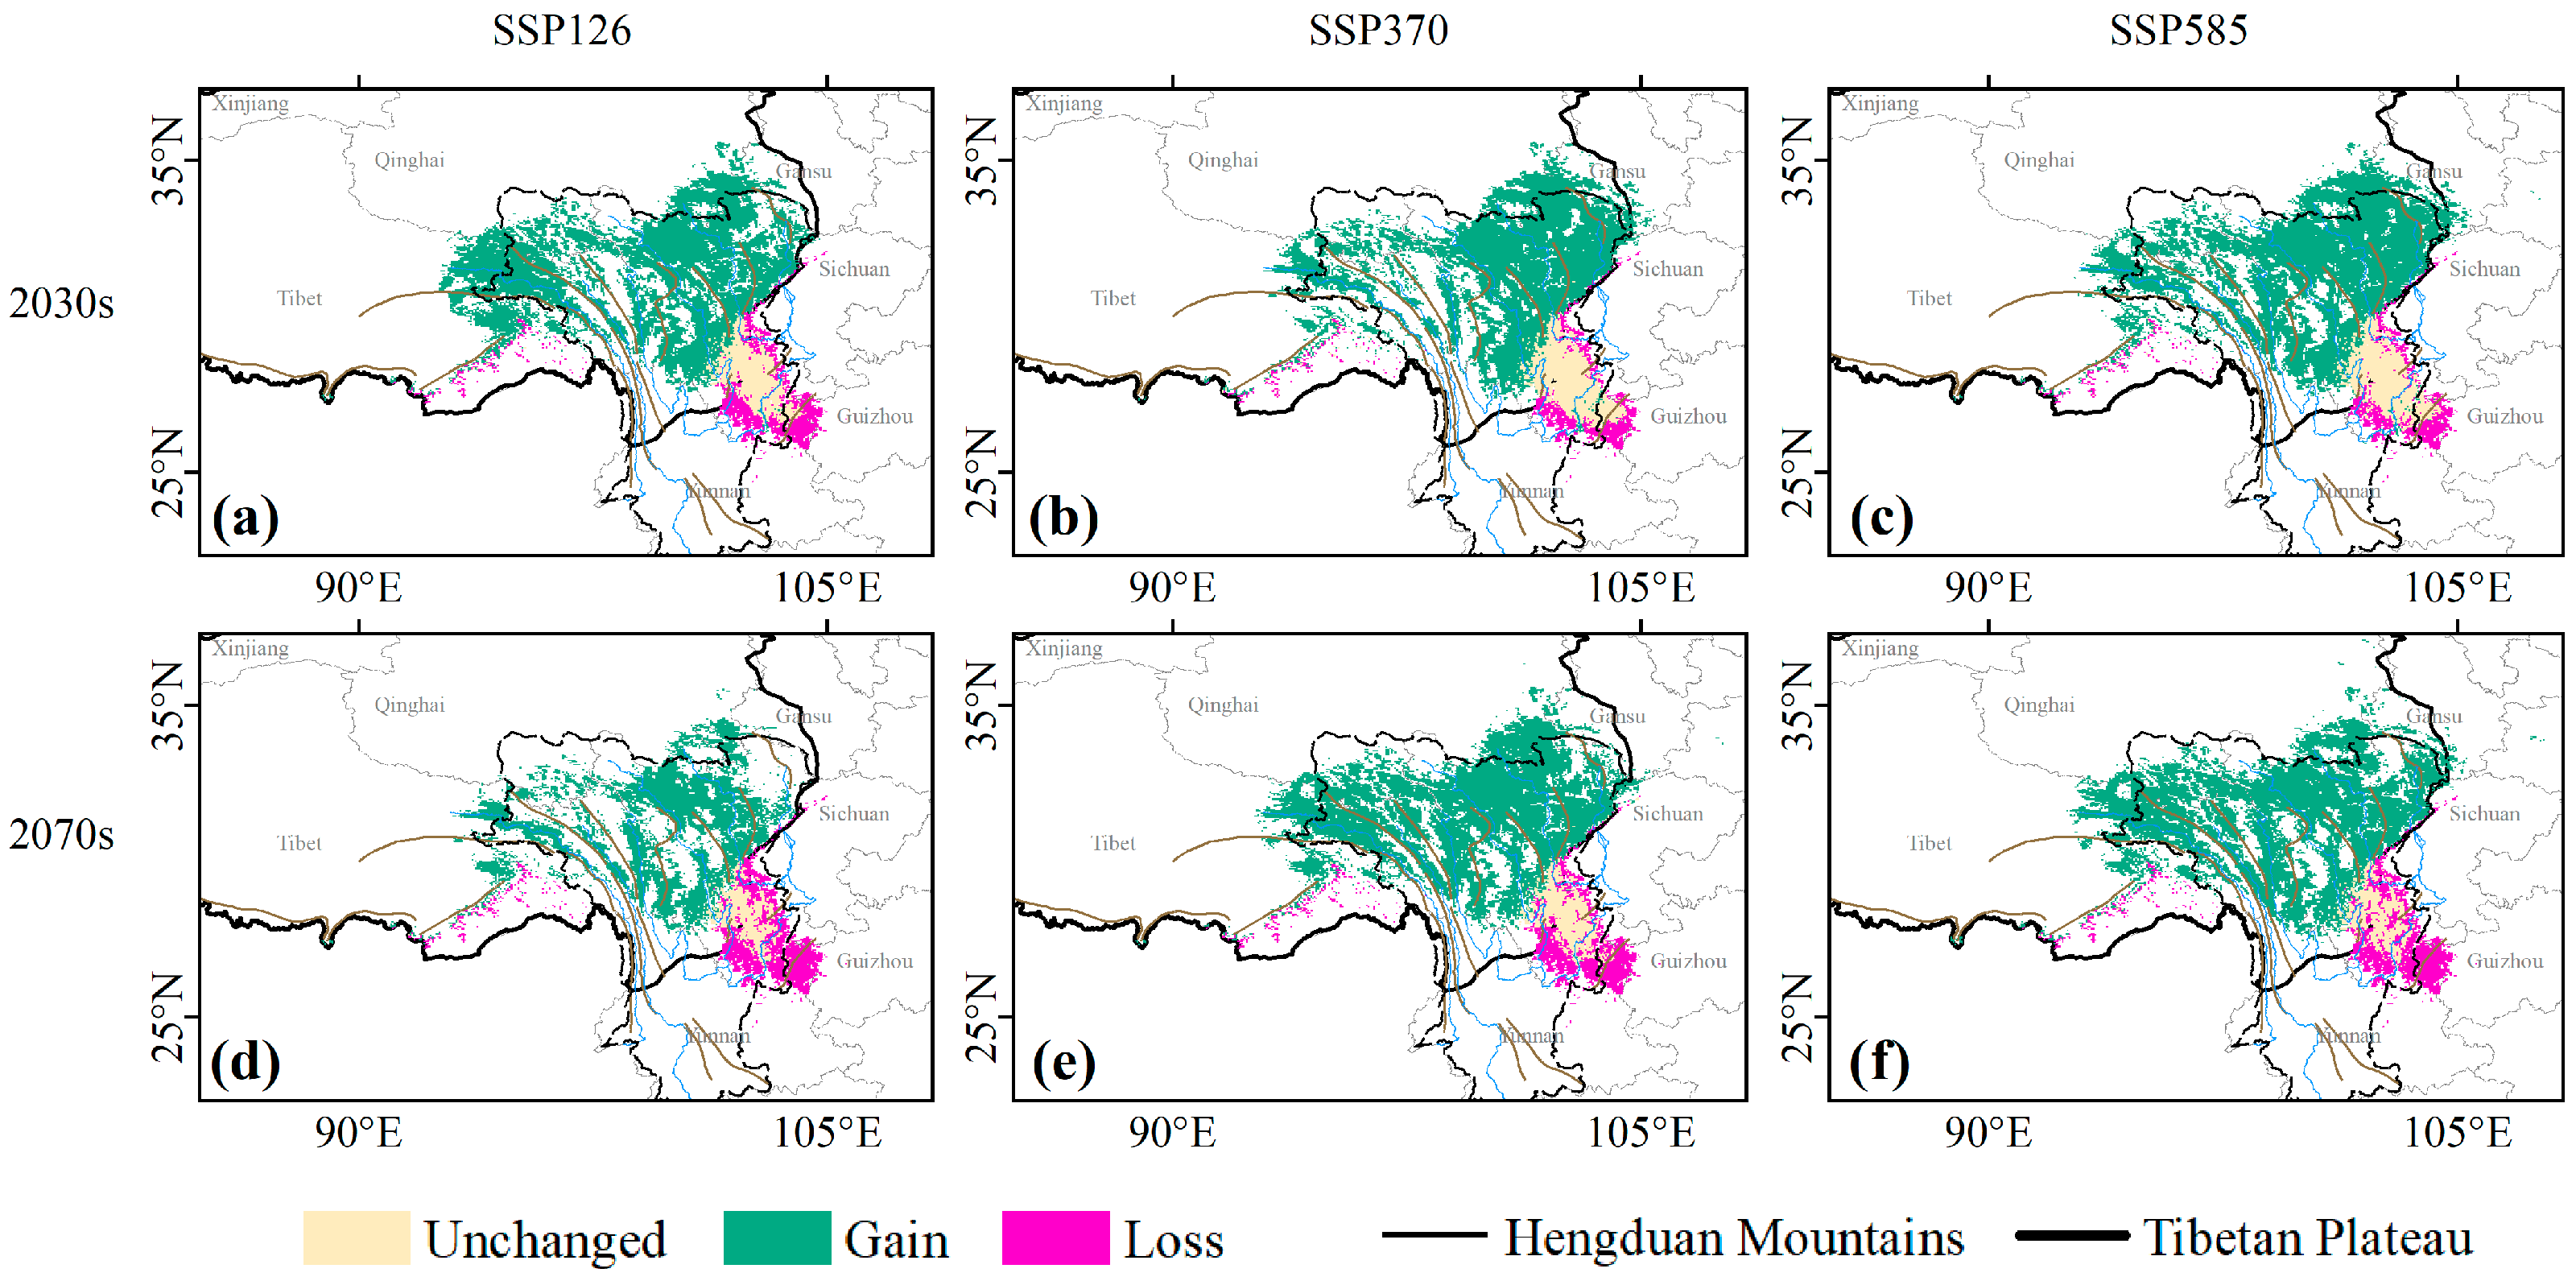
3.2. Contraction and Expansion of Suitable Habitats

Under future climate scenarios, the potential suitable areas of the four subalpine shrublands exhibited different changes compared to the current situation. Their total suitable habitat ranges showed an expansion trend under the low-, medium-, and high-carbon-emission scenarios. The highly suitable areas of some shrublands would contract severely under specific conditions.
The total suitable areas of R. heliolepis scrub do not change substantially compared to in the current scenario. The expansion areas were concentrated at the northern and western edges of the suitable zones, the Himalayas, and the Nyingchi-Tangla Mountain. The contraction areas were concentrated at the southeastern edges of the suitable zones (Figure 5). Under the three scenarios, the total suitable habitats of R. heliolepis scrub would expand, primarily due to the expansion of both highly and generally suitable areas, with the expansion ratio ranging from 27.05% to 40.83% (Figure 6a). The highly suitable habitats of R. heliolepis scrub would expand under all three scenarios, and the expansion ratio ranges from 164.01% to 211.57%, with the most expansion under the high-carbon-emission scenario (SSP585).
The total suitable areas of R. flavidum scrub change greatly compared to in the current scenario. The expansion areas were concentrated in western and northern parts of the Hengduan Mountains, the northern Himalayas, and the Nyingchi-Tangla Mountain. The contraction areas were concentrated in the southern slopes of the Himalayas and the Jinping Mountain (Figure 7). Under the three carbon emission scenarios, the total suitable habitats of R. flavidum scrub would expand, primarily driven by the expansion of both generally and moderately suitable areas, with the expansion ratio ranging from 161.74% to 182.99% (Figure 6b). The highly suitable habitats would expand slightly under the low-carbon-emission scenario (SSP126), whereas they would contract under the high-carbon-emission scenario (SSP585). By the 2070s, the highly suitable habitats would contract by 94.20%.
The total suitable areas of Q. monimotricha scrub do not change substantially compared to in the current scenario. The expansion areas were concentrated along the southeastern edge of the suitable habitats as well as along the riverbanks in the northwestern area of the suitable habitats. The contraction areas were concentrated at the northeastern and southwestern edges of the suitable habitats under the low-carbon-emission scenario (SSP126), and the southwestern edge of the suitable habitats under the medium (SSP370)- and high (SSP585)-carbon-emission scenarios (Figure 8). Under the three scenarios, the total suitable habitats of Q. monimotricha scrub would expand, primarily due to the expansion of both generally and moderately suitable areas, with the expansion ratio ranging from 0.58% to 30.36% (Figure 6c). The highly suitable habitats of Q. monimotricha scrub would expand slightly under the medium-carbon-emission scenario (SSP370) and would contract under the high-carbon-emission scenario (SSP585). By the 2070s, the highly suitable habitats would contract by 27.94%.
The total suitable areas of P. yunnanensis var. pygmaea scrub change greatly compared to in the current scenario. The expansion areas were concentrated in the northern Hengduan Mountains region, the Nyingchi-Tangla Mountain, and the northern slopes of the Himalayas. The contraction areas were concentrated in the Jinping Mountain and the Wumeng Mountain (Figure 9). Under the three scenarios, the total suitable habitats of P. yunnanensis var. pygmaea scrub would expand, primarily driven by the expansion of both generally and moderately suitable areas, with the expansion ratio ranging from 161.04% to 349.11% (Figure 6d). The highly suitable habitats of P. yunnanensis var. pygmaea scrub would contract under all three scenarios, with more severe contraction observed under both low (SSP126)- and high (SSP585)-carbon-emission scenarios compared to the medium (SSP370)-carbon-emission scenario. The contraction ratios would range from 53.63% to 96.86% under the low- and high-carbon-emission scenarios.

3.3. Centroid Migration and Elevation Shift of Suitable Habitats

In future climate scenarios, all four subalpine shrublands would migrate to varying degrees. As a consequence of global warming, three subalpine shrublands (R. heliolepis scrub, R. flavidum scrub, and P. yunnanensis var. pygmaea scrub) exhibited a trend of migration toward the northwest and higher elevations in all three scenarios, while the fourth subalpine shrubland (Q. monimotricha scrub) demonstrated a trend of small-scale migration toward different directions in different scenarios.
The current centroid of suitable habitats for R. heliolepis scrub (Figure 10a) was located in the eastern area of the Shaluli Mountain. Under the three carbon emission scenarios (SSP126, SSP370, SSP585), the centroid exhibited northwestward migration to the eastern side of the Mangkang Mountains. Vertically, the suitable area of R. heliolepis scrub shifted toward higher elevations in all three scenarios. Under the high-carbon-emission (SSP585) scenario in the 2070s, the suitable habitats of R. heliolepis scrub were projected to migrate the most, both horizontally and vertically.
The current centroid of suitable habitats for R. flavidum scrub (Figure 10b) was located in the eastern area of the Shaluli Mountain. Under the three carbon emission scenarios, the centroid exhibited northwestward migration to the western Shaluli Mountain (SSP126, SSP370) and the western Mangkang Mountain (SSP585) by 2070s. Vertically, the suitable zones of R. flavidum scrub shifted toward higher elevations in all three scenarios. Under the high-carbon-emission (SSP585) scenario in the 2070s, the suitable habitats of R. flavidum were projected to migrate the most, both horizontally and vertically.
The current centroid of suitable habitats for Q. monimotricha scrub (Figure 10c) was located on the northwest side of the Jinping Mountain. In the low-carbon-emission scenario (SSP126), the centroid exhibited slightly southwestward migration. In the medium-carbon-emission scenario (SSP370), the centroid first migrated slightly northeastward (2030s) and then northwestward (2070s) to the eastern side of the Shaluli Mountain. In the high-carbon-emission scenario (SSP585), the centroid migrated northwestward to the eastern side of the Shaluli Mountain. Vertically, the suitable habitats of Q. monimotricha scrub shifted toward lower elevations in the medium-carbon-emission scenario in the 2030s and toward higher elevations in all other scenarios. Under the high-carbon-emission (SSP585) scenario in the 2070s, the suitable habitats of Q. monimotricha scrub were projected to migrate the most, both horizontally and vertically.
The current centroid of suitable habitats for P. yunnanensis var. pygmaea scrub (Figure 10d) is located on the southeast side of the Jinping Mountain. Under the three carbon emission scenarios, the centroid exhibited northwestward migration to the western side of the Mangkang Mountain (SSP126) and the western side of the Shaluli Mountain (SSP370 and SSP585) by the 2070s. Vertically, the suitable zones of P. yunnanensis var. pygmaea scrub shifted toward higher elevations in all three scenarios. Under the low-carbon-emission (SSP126) scenario, the suitable habitats of P. yunnanensis var. pygmaea scrub showed the greatest horizontal migration, with vertical migration slightly less than that observed under the high-carbon-emission (SSP585) scenario in the 2070s.

4. Discussion

The MaxEnt model has been extensively applied to simulate the distribution of various species with demonstrated success [46,47,48]. The performance of this model is typically assessed by the area under the Receiver Operating Characteristic (ROC) curve (AUC) value, with higher AUC values indicating greater predictive accuracy [49]. An AUC value exceeding 0.9 is considered to indicate highly accurate predictions [44]. This study used the MaxEnt model to predict the suitable habitats of four subalpine shrublands under different climatic conditions. The AUC values obtained are all above 0.96, demonstrating an exceptionally high level of predictive accuracy, thereby validating the reliability of the model outcomes.
Temperature and precipitation are known to affect the distribution of subalpine vegetation [50,51], with temperature exerting a more prominent influence [52,53]. Our results also showed that temperature contributes more. The effect of temperature on the distribution of the four subalpine shrublands demonstrates a degree of variability across these communities. Combined with the mean elevation of the community adaptability distribution, we found that communities with a higher-elevation distribution were more sensitive to temperature. This influence decreases with descending elevation, potentially due to rising temperatures and, consequently, reduced vegetation sensitivity to temperature at lower elevations [54,55]. Furthermore, isothermality (bio3) is identified as the primary temperature factor influencing the suitable distribution of R. heliolepis scrub, R. flavidum scrub, and P. yunnanensis var. pygmaea scrub. Conversely, the temperature annual range (bio7) is found to be the primary temperature factor influencing the geographic distribution of Q. monimotricha scrub, aligning with previous research findings [56,57,58]. Isothermality (bio3) quantifies the degree to which diurnal temperature variations are relative to seasonal/annual oscillations; as the isothermal index increases, vegetation can perform more effective photosynthesis during higher daytime temperatures and reduce respiration during colder nights [59]. An increase in the temperature annual range (bio7) can render the quercus plant more vulnerable to the detrimental impacts of disease, pests, and fires [56].
While temperature is the most prominent factor influencing the suitable habitats of subalpine shrublands, our research results demonstrate that precipitation variables also exert an influence. The impact of precipitation on the distribution of the four subalpine shrublands displays a degree of variability among these communities. Our results indicate that annual precipitation (bio12) is the precipitation factor with the highest contribution rate for the distribution of R. heliolepis scrub, Q. monimotricha scrub, and P. yunnanensis var. pygmaea scrub, while precipitation during the warmest quarter (bio18) is the most influential precipitation factor for the distribution of R. flavidum scrub. Adequate rainfall is essential for overcoming water stress induced by temperature [60]. Ranjitkar et al. also posit that precipitation at different times of the year is a crucial factor determining vegetation suitability [61]. Therefore, the impact of precipitation factors on the suitable habitats of subalpine vegetation cannot be neglected.
Although temperature and precipitation are the primary drivers for the suitable habitats of subalpine shrublands, topography also exerts some influence. As an integrated spatial and physical characteristic indicator, topography exerts an important impact on the structure and function of vegetation [62,63]. This study incorporated two topographic variables (slope and aspect) into the analysis. Seedling growth is strongly influenced by aspect in the treeline ecotone of the Southern Rocky Mountains [64]. Slope affects soil moisture [65], which in turn has a substantial impact on vegetation dynamics. Xiong et al. (2024) also indicated that slope modulates the response of vegetation to climate change through the regulation of precipitation, with this response trend initially increasing and then decreasing as slope increases [66]. Our study found that aspect had a minimal impact on the distribution of the four scrubs, while slope was an important driver of the distribution of Q. monimotricha scrub, contributing 19.2%. As slope increased, the probability of Q. monimotricha scrub presence tended to increase and then decrease. Consequently, the impacts of topography should also be given attention.
It is evident that global warming will result in alterations to the distribution range of vegetation [67,68]. A study in the Central Apennines of Italy found that shrubs have been invading alpine and subalpine herbaceous communities over the past few decades [69]; however, a predictive study in the Pyrenees suggested that subalpine shrublands are at risk of decline [70]. Nevertheless, our findings support the former trend, indicating that the suitable habitats of the four subalpine shrublands are expected to expand under the influence of global warming. This could be attributed to temperature being the primary driver influencing the distribution of these four subalpine shrublands, with low temperatures being the main climatic constraint on their expansion [71]. Warming has alleviated this restriction of the cold on their growth [72,73]. In addition, we also note the adverse effects of global warming on some highly suitable areas of subalpine vegetation. Under the high-carbon-emission scenario (SSP585), the highly suitable areas of R. flavidum scrub show a severe shrinkage trend and almost disappear by the 2070s. The highly suitable areas of P. yunnanensis var. pygmaea scrub show a shrinking trend under all scenarios, and almost disappear under low-carbon-emission (SSP126) and high-carbon-emission (SSP585) scenarios by the 2070s, which is consistent with the results of Feng et al. (2023) [74]. This may be attributed to alterations in temperature and precipitation, leading to a reduction in suitability for the primary optimal habitats of R. flavidum scrub and P. yunnanensis var. pygmaea scrub, transforming them into general- or moderate-suitability zones. This shows that under global warming, R. flavidum scrub and P. yunnanensis var. pygmaea scrub are more vulnerable. Rhododendron flavidum has been listed as a vulnerable (VU) species in the International Union for Conservation of Nature Red List (IUCN), which confirms the correctness of our research findings. Additionally, P. yunnanensis var. pygmaea scrub faces similar existential risks to R. flavidum scrub, and we should implement conservation measures to prevent their extinction.
Species migration is highly correlated with global warming [75,76,77]. Studies have shown that global warming will drive the migration of mountain plants to higher elevations and latitudes [78,79]. Our results showed that under the three emission scenarios, the suitable habitats of R. heliolepis scrub, R. flavidum scrub, and P. yunnanensis var. pygmaea scrub all showed a trend of migration to high elevations in the northwest. The suitable habitats of Q. monimotricha scrub showed a slight migration trend to high elevations in the northwest or southwest. However, under the medium-carbon-emission scenario in the 2030s, the suitable habitats of Q. monimotricha scrub showed a tendency to migrate to lower elevations, a phenomenon that has also been observed in previous studies [80]. Similar downhill shifts can be expected to occur where future climate change scenarios project increases in water availability that outpace evaporative demand [81]. As species migrate to high elevations, the greater the degree of migration, the more vulnerable they are. This is because, on the one hand, the niche at the top of a mountain is narrow, and the migration of vegetation to high-elevation mountainous areas will increase interspecific competition [82]; on the other hand, warming is faster at high elevation [83], so if species cannot migrate quickly to adapt to climate change, they may be at risk of extinction [84,85]. The migration range of Q. monimotricha scrub was much smaller than that of R. heliolepis scrub, R. flavidum scrub, and P. yunnanensis var. pygmaea scrub. Seed dispersal and initial population establishment stages are very important for vegetation migration [86]. It is suggested that auxiliary migration and auxiliary colonization should be adopted to help R. heliolepis scrub, R. flavidum scrub, and P. yunnanensis var. pygmaea scrub migrate smoothly to match the speed of climate change [87,88,89].

5. Conclusions

The Hengduan Mountains serve as a biodiversity hotspot, with subalpine shrublands representing a vital vegetation type that is crucial for maintaining ecosystem diversity and stability in the area. This study focused on the suitable habitats of four subalpine shrublands in the Hengduan Mountains: R. heliolepis scrub, R. flavidum scrub, Q. monimotricha scrub, and P. yunnanensis var. pygmaea scrub. We used the MaxEnt model to study suitable habitats and their primary drivers under climate change. The conclusions are as follows: (1) Climatic factors are the primary drivers for the distribution of subalpine shrublands, with temperature contributing more than precipitation. Furthermore, the influence of slope on Q. monimotricha scrub cannot be disregarded. (2) The contemporary suitable habitats of the four subalpine shrublands were concentrated in the Hengduan Mountains, with a small amount in the Himalayas and Wumeng Mountain. (3) Under the future climate scenarios, the total suitable habitat range of these scrubs exhibited an expansion trend. However, the highly suitable areas for R. flavidum scrub and P. yunnanensis var. pygmaea scrub exhibited severe contraction under some scenarios. Except for Q. monimotricha scrub, whose suitable habitats showed slight shifts in different directions under different scenarios, the suitable habitats of the other three scrubs would shift toward higher-elevation regions in the northwest. Among them, the suitable habitats of P. yunnanensis var. pygmaea scrub exhibited the largest migration range. (4) The suitable habitats of R. heliolepis scrub showed potential for expansion, while the suitable habitats of Q. monimotricha scrub remained relatively stable. In contrast, the suitable habitats of R. flavidum scrub and P. yunnanensis var. pygmaea scrub are likely to face unfavorable prospects. It is recommended to establish protected areas and adopt auxiliary migration and auxiliary colonization methods to ensure that vegetation can migrate and spread smoothly and prevent the extinction and further narrowing of the suitable habitats of R. flavidum scrub and P. yunnanensis var. pygmaea scrub. Our study offers a scientific foundation for the conservation of subalpine shrublands in the Hengduan Mountains, with profound implications for biodiversity preservation and ecosystem rehabilitation.

Author Contributions

Conceptualization, H.Z.; methodology, H.Z.; software, Y.Y.; validation, H.Z., X.J. and Z.W.; formal analysis, Y.Y.; investigation, H.Z. and Y.Y.; resources, H.Z.; data curation, Y.Y.; writing—original draft preparation, H.Z. and Y.Y.; writing—review and editing, H.Z., Y.Y., X.J., Z.W. and Z.L.; visualization, Y.Y.; supervision, H.Z.; project administration, H.Z. and Z.L.; funding acquisition, H.Z. All authors have read and agreed to the published version of the manuscript.

Funding

This research was funded by the National Water Pollution Control and Treatment Science and Technology Major Project (2017ZX07101) and the Discipline Construction Program of Huayong Zhang, Distinguished Professor of Shandong University, School of Life Sciences (61200082363001).

Data Availability Statement

All links to input data are reported in the manuscript, and all output data are available upon request to the authors.

Conflicts of Interest

The authors declare no conflict of interest.

References

  1. Mori, A.S.; Isbell, F.; Cadotte, M.W. Assessing the Importance of Species and Their Assemblages for the Biodiversity-Ecosystem Multifunctionality Relationship. Ecology 2023, 104, e4104. [Google Scholar] [CrossRef] [PubMed]
  2. Chen, J.G.; He, X.F.; Wang, S.W.; Yang, Y.; Sun, H. Cushion and Shrub Ecosystem Engineers Contribute Differently to Diversity and Functions in Alpine Ecosystems. J. Veg. Sci. 2019, 30, 362–374. [Google Scholar] [CrossRef]
  3. Luo, Y.H.; Cadotte, M.W.; Liu, J.; Burgess, K.S.; Tan, S.L.; Ye, L.; Zou, J.; Chen, Z.; Jiang, X.; Li, J.; et al. Multitrophic Diversity and Biotic Associations Influence Subalpine Forest Ecosystem Multifunctionality. Ecology 2022, 103, e3745. [Google Scholar] [CrossRef] [PubMed]
  4. Batllori, E.; Camarero, J.J.; Ninot, J.M.; Gutiérrez, E. Seedling Recruitment, Survival and Facilitation in Alpine Pinus Uncinata Tree Line Ecotones. Implications and Potential Responses to Climate Warming. Glob. Ecol. Biogeogr. 2009, 18, 460–472. [Google Scholar] [CrossRef]
  5. He, X.; Burgess, K.S.; Gao, L.-M.; Li, D.-Z. Distributional Responses to Climate Change for Alpine Species of Cyananthus and Primula Endemic to the Himalaya-Hengduan Mountains. Plant Divers. 2019, 41, 26–32. [Google Scholar] [CrossRef]
  6. Liu, J.Y.; Zou, H.X.; Bachelot, B.; Dong, T.; Zhu, Z.F.; Liao, Y.; Plenković-Moraj, A.; Wu, Y. Predicting the Responses of Subalpine Forest Landscape Dynamics to Climate Change on the Eastern Tibetan Plateau. Glob. Change Biol. 2021, 27, 4352–4366. [Google Scholar] [CrossRef]
  7. Liang, Q.L.; Xu, X.T.; Mao, K.S.; Wang, M.C.; Wang, K.; Xi, Z.X.; Liu, J.Q. Shifts in Plant Distributions in Response to Climate Warming in a Biodiversity Hotspot, the Hengduan Mountains. J. Biogeogr. 2018, 45, 1334–1344. [Google Scholar] [CrossRef]
  8. Lin, D.; Xia, J.; Wan, S. Climate Warming and Biomass Accumulation of Terrestrial Plants: A Meta-Analysis. New Phytol. 2010, 188, 187–198. [Google Scholar]
  9. Thomas, C.D.; Cameron, A.; Green, R.E.; Bakkenes, M.; Beaumont, L.J.; Collingham, Y.C.; Erasmus, B.F.N.; de Siqueira, M.F.; Grainger, A.; Hannah, L.; et al. Extinction Risk from Climate Change. Nature 2004, 427, 145–148. [Google Scholar] [CrossRef]
  10. Raxworthy, C.J.; Pearson, R.G.; Rabibisoa, N.; Rakotondrazafy, A.M.; Ramanamanjato, J.B.; Raselimanana, A.P.; Wu, S.; Nussbaum, R.A.; Stone, D.A. Extinction Vulnerability of Tropical Montane Endemism from Warming and Upslope Displacement: A Preliminary Appraisal for the Highest Massif in Madagascar. Glob. Change Biol. 2008, 14, 1703–1720. [Google Scholar] [CrossRef]
  11. Hill, R.A.; Granica, K.; Smith, G.M.; Schardt, M. Representation of an Alpine Treeline Ecotone in SPOT 5 HRG Data. Remote Sens. Environ. 2007, 110, 458–467. [Google Scholar] [CrossRef]
  12. De Toma, A.; Carboni, M.; Bazzichetto, M.; Malavasi, M.; Cutini, M. Dynamics of Dwarf Shrubs in Mediterranean High-Mountain Ecosystems. J. Veg. Sci. 2022, 33, e13143. [Google Scholar] [CrossRef]
  13. Zhang, H.; Zhao, B.; Huang, T.; Chen, H.; Yue, J.; Tian, Y. Responses of the Distribution Pattern of the Suitable Habitat of Juniperus Tibetica Komarov to Climate Change on the Qinghai-Tibet Plateau. Forests 2023, 14, 434. [Google Scholar] [CrossRef]
  14. Yu, H.; Miao, S.; Xie, G.; Guo, X.; Chen, Z.; Favre, A. Contrasting Floristic Diversity of the Hengduan Mountains, the Himalayas and the Qinghai-Tibet Plateau Sensu Stricto in China. Front. Ecol. Evol. 2020, 8, 136. [Google Scholar] [CrossRef]
  15. Kuang, X.; Jiao, J.J. Review on Climate Change on the Tibetan Plateau during the Last Half Century. J. Geophys. Res. Atmos. 2016, 121, 3979–4007. [Google Scholar] [CrossRef]
  16. Fang, O.; Zhang, Q.-B. Tree Resilience to Drought Increases in the Tibetan Plateau. Glob. Change Biol. 2019, 25, 245–253. [Google Scholar] [CrossRef]
  17. Huang, Y.-J.; Zhu, H.; Su, T.; Spicer, R.A.; Hu, J.-J.; Jia, L.-B.; Zhou, Z.-K. Rise of Herbaceous Diversity at the Southeastern Margin of the Tibetan Plateau: First Insight from Fossils. J. Syst. Evol. 2022, 60, 1109–1123. [Google Scholar] [CrossRef]
  18. Kramer, A.; Herzschuh, U.; Mischke, S.; Zhang, C. Holocene Treeline Shifts and Monsoon Variability in the Hengduan Mountains (Southeastern Tibetan Plateau), Implications from Palynological Investigations. Palaeogeogr. Palaeoclimatol. Palaeoecol. 2010, 286, 23–41. [Google Scholar] [CrossRef]
  19. Chen, J.G.; Yang, Y.; Wang, S.W.; Sun, H.; Schöb, C. Shrub Facilitation Promotes Selective Tree Establishment beyond the Climatic Treeline. Sci. Total Environ. 2020, 708, 134618. [Google Scholar] [CrossRef]
  20. Elith, J.; Leathwick, J.R. Species Distribution Models: Ecological Explanation and Prediction Across Space and Time. Annu. Rev. Ecol. Evol. Syst. 2009, 40, 677–697. [Google Scholar] [CrossRef]
  21. Sillero, N. What Does Ecological Modelling Model? A Proposed Classification of Ecological Niche Models Based on Their Underlying Methods. Ecol. Model. 2011, 222, 1343–1346. [Google Scholar] [CrossRef]
  22. Miller, J. Species Distribution Modeling. Geogr. Compass 2010, 4, 490–509. [Google Scholar] [CrossRef]
  23. Guisan, A.; Thuiller, W. Predicting Species Distribution: Offering More than Simple Habitat Models. Ecol. Lett. 2005, 8, 993–1009. [Google Scholar] [CrossRef]
  24. Archibald, C.L.; Summers, D.M.; Graham, E.M.; Bryan, B.A. Habitat Suitability Maps for Australian Flora and Fauna under CMIP6 Climate Scenarios. GigaScience 2024, 13, giae002. [Google Scholar] [CrossRef]
  25. Förderer, E.-M.; Rödder, D.; Langer, M.R. Global Diversity Patterns of Larger Benthic Foraminifera under Future Climate Change. Glob. Change Biol. 2023, 29, 969–981. [Google Scholar] [CrossRef]
  26. Dai, J.; Roberts, D.A.; Stow, D.A.; An, L.; Hall, S.J.; Yabiku, S.T.; Kyriakidis, P.C. Mapping Understory Invasive Plant Species with Field and Remotely Sensed Data in Chitwan, Nepal. Remote Sens. Environ. 2020, 250, 112037. [Google Scholar] [CrossRef]
  27. Luo, J.; Ma, Y.; Liu, Y.; Zhu, D.; Guo, X. Predicting Polygonum Capitatum Distribution in China across Climate Scenarios Using MaxEnt Modeling. Sci. Rep. 2024, 14, 20020. [Google Scholar] [CrossRef]
  28. Yang, Q.-S.; Chen, W.-Y.; Xia, K.; Zhou, Z.-K. Climatic Envelope of Evergreen Sclerophyllous Oaks and Their Present Distribution in the Eastern Himalaya and Hengduan Mountains. J. Syst. Evol. 2009, 47, 183–190. [Google Scholar] [CrossRef]
  29. Chen, J.; Zhang, S.; Luo, T.; Zheng, W.; Yang, W.; Li, J.; Wang, Y.; Wang, S. Distribution Pattern of Pinus yunnanensis and P. yunnanensis var. pygmaea and Related Key Ecological Factors. J. Northeast For. Univ. 2021, 49, 8–14. [Google Scholar] [CrossRef]
  30. Hou, X.Y. Vegetation Atlas of China; Scientific Press: Beijing, China, 2001. [Google Scholar]
  31. Warren, D.L.; Matzke, N.J.; Cardillo, M.; Baumgartner, J.B.; Beaumont, L.J.; Turelli, M.; Glor, R.E.; Huron, N.A.; Simões, M.; Iglesias, T.L.; et al. ENMTools 1.0: An R Package for Comparative Ecological Biogeography. Ecography 2021, 44, 504–511. [Google Scholar] [CrossRef]
  32. Xu, L.; Fan, Y.; Zheng, J.; Guan, J.; Lin, J.; Wu, J.; Liu, L.; Wu, R.; Liu, Y. Impacts of Climate Change and Human Activity on the Potential Distribution of Aconitum Leucostomum in China. Sci. Total Environ. 2024, 912, 168829. [Google Scholar] [CrossRef] [PubMed]
  33. WorldClim. Available online: https://www.worldclim.org/ (accessed on 10 June 2024).
  34. Harmonized World Soil Database v1.2. Available online: https://www.fao.org/soils-portal/soil-survey/soil-maps-and-databases/harmonized-world-soil-database-v12/en/ (accessed on 13 June 2024).
  35. Last of the Wild Project, Version 3 (LWP-3): 1993 Human Footprint, 2018 Release. Available online: https://www.earthdata.nasa.gov/data/catalog/ (accessed on 15 June 2024).
  36. Wu, T.; Lu, Y.; Fang, Y.; Xin, X.; Li, L.; Li, W.; Jie, W.; Zhang, J.; Liu, Y.; Zhang, L.; et al. The Beijing Climate Center Climate System Model (BCC-CSM): The Main Progress from CMIP5 to CMIP6. Geosci. Model Dev. 2019, 12, 1573–1600. [Google Scholar] [CrossRef]
  37. Huang, B.; Chen, S.; Xu, L.; Jiang, H.; Chen, X.; He, H.; Chen, T. Predicting the Potential Geographical Distribution of Zingiber Striolatum Diels (Zingiberaceae), a Medicine Food Homology Plant in China. Sci. Rep. 2024, 14, 22206. [Google Scholar] [CrossRef]
  38. Zhang, Y.; Tang, J.; Ren, G.; Zhao, K.; Wang, X. Global Potential Distribution Prediction of Xanthium Italicum Based on Maxent Model. Sci. Rep. 2021, 11, 16545. [Google Scholar] [CrossRef]
  39. Zhang, K.; Zhang, Y.; Tao, J. Predicting the Potential Distribution of Paeonia Veitchii (Paeoniaceae) in China by Incorporating Climate Change into a Maxent Model. Forests 2019, 10, 190. [Google Scholar] [CrossRef]
  40. Yang, X.-Q.; Kushwaha, S.P.S.; Saran, S.; Xu, J.; Roy, P.S. Maxent Modeling for Predicting the Potential Distribution of Medicinal Plant, Justicia Adhatoda L. in Lesser Himalayan Foothills. Ecol. Eng. 2013, 51, 83–87. [Google Scholar] [CrossRef]
  41. Yan, H.; Feng, L.; Zhao, Y.; Feng, L.; Zhu, C.; Qu, Y.; Wang, H. Predicting the Potential Distribution of an Invasive Species, Erigeron Canadensis L., in China with a Maximum Entropy Model. Glob. Ecol. Conserv. 2020, 21, e00822. [Google Scholar] [CrossRef]
  42. Zhang, L.; Jiang, B.; Meng, Y.; Jia, Y.; Xu, Q.; Pan, Y. The Influence of Climate Change on the Distribution of Hibiscus Mutabilis in China: MaxEnt Model-Based Prediction. Plants 2024, 13, 1744. [Google Scholar] [CrossRef]
  43. Li, J.; Fan, G.; He, Y. Predicting the Current and Future Distribution of Three Coptis Herbs in China under Climate Change Conditions, Using the MaxEnt Model and Chemical Analysis. Sci. Total Environ. 2020, 698, 134141. [Google Scholar] [CrossRef]
  44. He, Y.; Ma, J.; Chen, G. Potential Geographical Distribution and Its Multi-Factor Analysis of Pinus Massoniana in China Based on the Maxent Model. Ecol. Indic. 2023, 154, 110790. [Google Scholar] [CrossRef]
  45. Phillips, S.J.; Anderson, R.P.; Schapire, R.E. Maximum Entropy Modeling of Species Geographic Distributions. Ecol. Model. 2006, 190, 231–259. [Google Scholar] [CrossRef]
  46. Wani, I.A.; Khan, S.; Verma, S.; Al-Misned, F.A.; Shafik, H.M.; El-Serehy, H.A. Predicting Habitat Suitability and Niche Dynamics of Dactylorhiza Hatagirea and Rheum Webbianum in the Himalaya under Projected Climate Change. Sci. Rep. 2022, 12, 13205. [Google Scholar] [CrossRef]
  47. Wei, L.; Wang, G.; Xie, C.; Gao, Z.; Huang, Q.; Jim, C.Y. Predicting Suitable Habitat for the Endangered Tree Ormosia Microphylla in China. Sci. Rep. 2024, 14, 10330. [Google Scholar] [CrossRef]
  48. Hosseini, N.; Ghorbanpour, M.; Mostafavi, H. Habitat Potential Modelling and the Effect of Climate Change on the Current and Future Distribution of Three Thymus Species in Iran Using MaxEnt. Sci. Rep. 2024, 14, 3641. [Google Scholar] [CrossRef]
  49. Zhang, Z.; Wang, C.; Gong, G.; Chen, Y.; Ma, S.; Wu, Y.; Wang, H.; Li, Y.; Duan, H. Biodiversity Conservation and Management of Lake Wetlands Based on the Spatiotemporal Evolution Patterns of Crane Habitats. J. Environ. Manage. 2024, 353, 120257. [Google Scholar] [CrossRef]
  50. Yu, F.; Groen, T.A.; Wang, T.; Skidmore, A.K.; Huang, J.; Ma, K. Climatic Niche Breadth Can Explain Variation in Geographical Range Size of Alpine and Subalpine Plants. Int. J. Geogr. Inf. Sci. 2017, 31, 190–212. [Google Scholar]
  51. Li, K.-J.; Liu, X.-F.; Zhang, J.-H.; Zhou, X.-L.; Yang, L.; Shen, S.-K. Complexity Responses of Rhododendron Species to Climate Change in China Reveal Their Urgent Need for Protection. For. Ecosyst. 2023, 10, 100124. [Google Scholar] [CrossRef]
  52. Zhao, Y.; Zhang, Y.; Yan, Y.; Wen, Y.; Zhang, D. Geographic Distribution and Impacts of Climate Change on the Suitable Habitats of Two Alpine Rhododendron in Southwest China. Glob. Ecol. Conserv. 2024, 54, e03176. [Google Scholar] [CrossRef]
  53. He, Z.; Du, J.; Zhao, W.; Yang, J.; Chen, L.; Zhu, X.; Chang, X.; Liu, H. Assessing Temperature Sensitivity of Subalpine Shrub Phenology in Semi-Arid Mountain Regions of China. Agric. For. Meteorol. 2015, 213, 42–52. [Google Scholar] [CrossRef]
  54. Sun, M.R.; Sun, P.S.; Liu, N.; Zhang, L.; Yu, Z.; Feng, Q.; Smettem, K.; Liu, S. Alternating Dominant Effects of Temperature and Precipitation along Elevational Gradient on the Alpine and Subalpine Vegetation Activities in Southwestern China. For. Ecol. Manag. 2024, 554, 121668. [Google Scholar] [CrossRef]
  55. Bunting, E.L.; Munson, S.M.; Villarreal, M.L. Climate Legacy and Lag Effects on Dryland Plant Communities in the Southwestern U.S. Ecol. Indic. 2017, 74, 216–229. [Google Scholar] [CrossRef]
  56. Mirhashemi, H.; Heydari, M.; Ahmadi, K.; Karami, O.; Kavgaci, A.; Matsui, T.; Heung, B. Species Distribution Models of Brant’s Oak (Quercus Brantii Lindl.): The Impact of Spatial Database on Predicting the Impacts of Climate Change. Ecol. Eng. 2023, 194, 107038. [Google Scholar] [CrossRef]
  57. Ouyang, X.; Lin, H.; Bai, S.; Chen, J.; Chen, A. Simulation the Potential Distribution of Dendrolimus Houi and Its Hosts, Pinus Yunnanensis and Cryptomeria Fortunei, under Climate Change in China. Front. Plant Sci. 2022, 13, 1054710. [Google Scholar] [CrossRef]
  58. Yu, F.; Wang, T.; Groen, T.A.; Skidmore, A.K.; Yang, X.; Ma, K.; Wu, Z. Climate and Land Use Changes Will Degrade the Distribution of Rhododendrons in China. Sci. Total Environ. 2019, 659, 515–528. [Google Scholar] [CrossRef]
  59. Luo, W.; Sun, C.; Yang, S.; Chen, W.; Sun, Y.; Li, Z.; Liu, J.; Tao, W.; Tao, J. Contrasting Range Changes and Drivers of Four Forest Foundation Species under Future Climate Change in China. Sci. Total Environ. 2024, 942, 173784. [Google Scholar] [CrossRef]
  60. Breshears, D.D.; Cobb, N.S.; Rich, P.M.; Price, K.P.; Allen, C.D.; Balice, R.G.; Romme, W.H.; Kastens, J.H.; Floyd, M.L.; Belnap, J.; et al. Regional Vegetation Die-off in Response to Global-Change-Type Drought. Proc. Natl. Acad. Sci. USA 2005, 102, 15144–15148. [Google Scholar] [CrossRef]
  61. Ranjitkar, S.; Kindt, R.; Sujakhu, N.M.; Hart, R.; Guo, W.; Yang, X.; Shrestha, K.K.; Xu, J.; Luedeling, E. Separation of the Bioclimatic Spaces of Himalayan Tree Rhododendron Species Predicted by Ensemble Suitability Models. Glob. Ecol. Conserv. 2014, 1, 2–12. [Google Scholar] [CrossRef]
  62. Xun, Q.L.; An, S.Z.; Lu, M.Z. Climate Change and Topographic Differences Influence Grassland Vegetation Greening across Environmental Gradients. Front. Environ. Sci. 2024, 11, 1324742. [Google Scholar] [CrossRef]
  63. Hassan, S.S.; Goheer, M.A.; Farah, H.; Nadeem, M.; Muazzam, A.; Munir, J.A.; Fatima, S. Monitoring the Effects of Climate Change and Topography on Vegetation Health in Tharparkar, Pakistan. J. Water Clim. Change 2024, 15, 3472–3486. [Google Scholar] [CrossRef]
  64. Elliott, G.P.; Kipfmueller, K.F. Multi-Scale Influences of Slope Aspect and Spatial Pattern on Ecotonal Dynamics at Upper Treeline in the Southern Rocky Mountains, U.S.A. Arct. Antarct. Alp. Res. 2010, 42, 45–56. [Google Scholar] [CrossRef]
  65. Fu, B.; Wang, J.; Chen, L.; Qiu, Y. The Effects of Land Use on Soil Moisture Variation in the Danangou Catchment of the Loess Plateau, China. CATENA 2003, 54, 197–213. [Google Scholar] [CrossRef]
  66. Xiong, X.T.; Li, C.H.; Chen, J.H. Topographic regulatory role of vegetation response to climate change. Acta Geogr. Sin. 2023, 78, 2256–2270. [Google Scholar] [CrossRef]
  67. Zhu, Z.; Piao, S.; Myneni, R.B.; Huang, M.; Zeng, Z.; Canadell, J.G.; Ciais, P.; Sitch, S.; Friedlingstein, P.; Arneth, A.; et al. Greening of the Earth and Its Drivers. Nat. Clim. Change 2016, 6, 791–795. [Google Scholar] [CrossRef]
  68. Fang, T.; Shao, Y.; Oswald, T.; Lineaweaver, W.C.; Zhang, F. Effect of Sildenafil on Peripheral Nerve Regeneration. Ann. Plast. Surg. 2013, 70, 62–65. [Google Scholar] [CrossRef]
  69. De Toma, A.; Malavasi, M.; Marzialetti, F.; Cutini, M. Unveiling Spatial Patterns and Trajectories of Shrub Dynamics in Mediterranean Alpine Ecosystems. Plant Ecol. 2025, 226, 149–160. [Google Scholar] [CrossRef]
  70. Pérez-García, N.; Font, X.; Ferré, A.; Carreras, J. Drastic Reduction in the Potential Habitats for Alpine and Subalpine Vegetation in the Pyrenees Due to Twenty-First-Century Climate Change. Reg. Environ. Change 2013, 13, 1157–1169. [Google Scholar] [CrossRef]
  71. Myers-Smith, I.H.; Forbes, B.C.; Wilmking, M.; Hallinger, M.; Lantz, T.; Blok, D.; Tape, K.D.; Macias-Fauria, M.; Sass-Klaassen, U.; Lévesque, E.; et al. Shrub Expansion in Tundra Ecosystems: Dynamics, Impacts and Research Priorities. Environ. Res. Lett. 2011, 6, 045509. [Google Scholar] [CrossRef]
  72. Hallinger, M.; Manthey, M.; Wilmking, M. Establishing a Missing Link: Warm Summers and Winter Snow Cover Promote Shrub Expansion into Alpine Tundra in Scandinavia. New Phytol. 2010, 186, 890–899. [Google Scholar] [CrossRef]
  73. Albrecht, E.C.; Dobbert, S.; Pape, R.; Löffler, J. Complex Environmental Control of Growth in a Dominant Mediterranean-Alpine Shrub Species. J. Ecol. 2024, 112, 1516–1532. [Google Scholar] [CrossRef]
  74. Feng, J.; Wang, B.; Xian, M.; Zhou, S.; Huang, C.; Cui, X. Prediction of Future Potential Distributions of Pinus Yunnanensis Varieties under Climate Change. Front. For. Glob. Change 2023, 6, 1308416. [Google Scholar] [CrossRef]
  75. Bertrand, R.; Lenoir, J.; Piedallu, C.; Riofrío-Dillon, G.; de Ruffray, P.; Vidal, C.; Pierrat, J.-C.; Gégout, J.-C. Changes in Plant Community Composition Lag behind Climate Warming in Lowland Forests. Nature 2011, 479, 517–520. [Google Scholar] [CrossRef] [PubMed]
  76. Li, J.; Chang, H.; Liu, T.; Zhang, C. The Potential Geographical Distribution of Haloxylon across Central Asia under Climate Change in the 21st Century. Agric. For. Meteorol. 2019, 275, 243–254. [Google Scholar] [CrossRef]
  77. Lamprecht, A.; Semenchuk, P.R.; Steinbauer, K.; Winkler, M.; Pauli, H. Climate Change Leads to Accelerated Transformation of High-Elevation Vegetation in the Central Alps. New Phytol. 2018, 220, 447–459. [Google Scholar] [CrossRef]
  78. Walther, G.-R.; Beißner, S.; Burga, C.A. Trends in the Upward Shift of Alpine Plants. J. Veg. Sci. 2005, 16, 541–548. [Google Scholar] [CrossRef]
  79. Pauli, H.; Gottfried, M.; Dullinger, S.; Abdaladze, O.; Akhalkatsi, M.; Alonso, J.L.B.; Coldea, G.; Dick, J.; Erschbamer, B.; Calzado, R.F.; et al. Recent Plant Diversity Changes on Europe’s Mountain Summits. Science 2012, 336, 353–355. [Google Scholar] [CrossRef]
  80. Lenoir, J.; Svenning, J.-C. Climate-Related Range Shifts—A Global Multidimensional Synthesis and New Research Directions. Ecography 2015, 38, 15–28. [Google Scholar] [CrossRef]
  81. Crimmins, S.M.; Dobrowski, S.Z.; Greenberg, J.A.; Abatzoglou, J.T.; Mynsberge, A.R. Changes in Climatic Water Balance Drive Downhill Shifts in Plant Species’ Optimum Elevations. Science 2011, 331, 324–327. [Google Scholar] [CrossRef]
  82. Zheng, X.Y.; Babst, F.; Camarero, J.J.; Li, X.X.; Lu, X.M.; Gao, S.; Sigdel, S.R.; Wang, Y.; Zhu, H.; Liang, E. Density-Dependent Species Interactions Modulate Alpine Treeline Shifts. Ecol. Lett. 2024, 27, e14403. [Google Scholar] [CrossRef]
  83. Pepin, N.; Bradley, R.S.; Diaz, H.F.; Baraer, M.; Caceres, E.B.; Forsythe, N.; Fowler, H.; Greenwood, G.; Hashmi, M.Z.; Liu, X.D.; et al. Elevation-Dependent Warming in Mountain Regions of the World. Nat. Clim. Change 2015, 5, 424–430. [Google Scholar] [CrossRef]
  84. Rumpf, S.B.; Hülber, K.; Wessely, J.; Willner, W.; Moser, D.; Gattringer, A.; Klonner, G.; Zimmermann, N.E.; Dullinger, S. Extinction Debts and Colonization Credits of Non-Forest Plants in the European Alps. Nat. Commun. 2019, 10, 4293. [Google Scholar] [CrossRef]
  85. Neilson, R.P.; Pitelka, L.F.; Solomon, A.M.; Nathan, R.; Midgley, G.F.; Fragoso, J.M.V.; Lischke, H.; Thompson, K. Forecasting Regional to Global Plant Migration in Response to Climate Change. BioScience 2005, 55, 749–759. [Google Scholar] [CrossRef]
  86. Hampe, A. Plants on the Move: The Role of Seed Dispersal and Initial Population Establishment for Climate-Driven Range Expansions. Acta Oecologica 2011, 37, 666–673. [Google Scholar] [CrossRef]
  87. Williams, M.I.; Dumroese, R.K. Preparing for Climate Change: Forestry and Assisted Migration. J. For. 2013, 111, 287–297. [Google Scholar] [CrossRef]
  88. Vitt, P.; Havens, K.; Kramer, A.T.; Sollenberger, D.; Yates, E. Assisted Migration of Plants: Changes in Latitudes, Changes in Attitudes. Biol. Conserv. 2010, 143, 18–27. [Google Scholar] [CrossRef]
  89. Lazarus, E.D.; McGill, B.J. Pushing the Pace of Tree Species Migration. PLoS ONE 2014, 9, e105380. [Google Scholar] [CrossRef]
Figure 1. The original occurrence records of four subalpine shrublands in China.
Forests 16 00624 g001
Figure 2. The suitable habitats of four subalpine shrublands under the current climate. (a) Rhododendron heliolepis scrub, (b) Rhododendron flavidum scrub, (c) Quercus monimotricha scrub, and (d) Pinus yunnanensis var. pygmaea scrub.
Forests 16 00624 g002
Figure 3. Percent contribution rate of environmental variables of four subalpine shrublands. (a) Rhododendron heliolepis scrub, (b) Rhododendron flavidum scrub, (c) Quercus monimotricha scrub, and (d) Pinus yunnanensis var. pygmaea scrub. (bio2 represents mean diurnal range, bio3 represents isothermality, bio4 represents temperature seasonality, bio7 represents temperature annual range, bio9 represents mean temperature of driest quarter, bio10 represents mean temperature of warmest quarter, bio12 represents annual precipitation, bio14 represents precipitation of driest month, bio15 represents precipitation seasonality, bio18 represents precipitation of warmest quarter, bio19 represents precipitation of coldest quarter, Awc represents available water storage capacity, t-pH represents topsoil pH (H2O), t-texture represents topsoil texture, aspect represents aspect, slope represents slope, and Hf represents human footprint).
Forests 16 00624 g003
Figure 4. Response curves of primary drivers for four subalpine shrublands. The ordinate is the existence probability, and the abscissa is the value of environmental variables. bio3 represents isothermality (a,e,h,m), bio4 represents temperature seasonality (b), bio7 represents temperature annual range (i), bio9 represents mean temperature of driest quarter (j), bio10 represents mean temperature of warmest quarter (c,f,n), bio12 represents annual precipitation (d,k,o), bio18 represents precipitation of warmest quarter (g,p), and slope represents slope (l).
Forests 16 00624 g004
Figure 5. Changes in suitable habitats for Rhododendron heliolepis scrub under three scenarios (SSP126, SSP370, SSP585). “Gain” represents areas where suitable habitats have increased, “Loss” represents areas where suitable habitats have decreased, and “Unchanged” represents areas where suitable habitats remain unchanged. (af) represent the geographic extent of the gain and loss of suitable habitats for R. heliolepis scrub from the current scenario to the SSP126 scenario in the 2030s (averaged over 2021–2040), the SSP370 scenario in the 2030s, the SSP585 scenario in the 2030s, the SSP126 scenario in the 2070s (averaged over 2061–2080), the SSP370 scenario in the 2070s, and the SSP585 scenario in the 2070s, respectively.
Forests 16 00624 g005
Figure 6. The area and contraction or expansion ratios of suitable habitats for the four subalpine shrublands. (a) Rhododendron heliolepis, (b) Rhododendron flavidum, (c) Quercus monimotricha, and (d) Pinus yunnanensis var. pygmaea. “+” represents the expansion ratio, and “−” represents the contraction ratio.
Forests 16 00624 g006
Figure 7. Change in suitable habitats for Rhododendron flavidum scrub under three scenarios (SSP126, SSP370, SSP585). “Gain” represents areas where suitable habitats have increased, “Loss” represents areas where suitable habitats have decreased, and “Unchanged” represents areas where suitable habitats remain unchanged. (af) represent the geographic extent of the gain and loss of suitable habitats for R. flavidum scrub from the current scenario to the SSP126 scenario in the 2030s (averaged over 2021–2040), the SSP370 scenario in the 2030s, the SSP585 scenario in the 2030s, the SSP126 scenario in the 2070s (averaged over 2061–2080), the SSP370 scenario in the 2070s, and the SSP585 scenario in the 2070s, respectively.
Forests 16 00624 g007
Figure 8. Change in suitable habitats for Quercus monimotricha scrub under three scenarios (SSP126, SSP370, SSP585). “Gain” represents areas where suitable habitats have increased, “Loss” represents areas where suitable habitats have decreased, and “Unchanged” represents areas where suitable habitats remain unchanged. (af) represent the geographic extent of the gain and loss of suitable habitats for Q. monimotricha scrub from the current scenario to the SSP126 scenario in the 2030s (averaged over 2021–2040), the SSP370 scenario in the 2030s, the SSP585 scenario in the 2030s, the SSP126 scenario in the 2070s (averaged over 2061–2080), the SSP370 scenario in the 2070s, and the SSP585 scenario in the 2070s, respectively.
Forests 16 00624 g008
Figure 9. Change in suitable habitats for Pinus yunnanensis var. pygmaea scrub under three scenarios (SSP126, SSP370, SSP585). “Gain” represents areas where suitable habitats have increased, “Loss” represents areas where suitable habitats have decreased, and “Unchanged” represents areas where suitable habitats remain unchanged. (af) represent the geographic extent of the gain and loss of suitable habitats for P. yunnanensis var. pygmaea scrub from the current scenario to the SSP126 scenario in the 2030s (averaged over 2021–2040), the SSP370 scenario in the 2030s, the SSP585 scenario in the 2030s, the SSP126 scenario in the 2070s (averaged over 2061–2080), the SSP370 scenario in the 2070s, and the SSP585 scenario in the 2070s, respectively.
Forests 16 00624 g009
Figure 10. Horizontal migration trends of the centroids of suitable habitats and changes in the mean elevation of suitable habitats for Rhododendron heliolepis scrub (a), Rhododendron flavidum scrub (b), Quercus monimotricha scrub (c), and Pinus yunnanensis var. pygmaea scrub (d).
Forests 16 00624 g010
Table 1. Environmental variables involved in modeling.
VariablesDescriptionVegetation Type
bio2 (°C)Mean diurnal range
bio3 (%)Isothermality△▲○◆
bio4Temperature seasonality△▲○
bio7 (°C)Temperature annual range○◆
bio9 (°C)Mean temperature of driest quarter▲○
bio10 (°C)Mean temperature of warmest quarter△▲◆
bio12 (mm)Annual precipitation▲○◆
bio14 (mm)Precipitation of driest month△▲
bio15Precipitation seasonality○◆
bio18 (mm)Precipitation of warmest quarter△◆
bio19 (mm)Precipitation of coldest quarter○◆
Awc (mm/m)Available water storage capacity△▲
t-pH (−log (H+))Topsoil pH (H2O)△◆
t-textureTopsoil texture△▲◆
Aspect (°)Aspect
Slope (°)Slope△▲○◆
HfHuman footprint△▲○◆
Rhododendron heliolepis Franch. scrub (▲), Rhododendron flavidum Franch. scrub (△), Quercus monimotricha (Hand.-Mazz.) Hand.-Mazz. scrub (○), and Pinus yunnanensis var. pygmaea (Hsueh ex C. Y. Cheng, W. C. Cheng & L. K. Fu) Hsueh scrub (◆).
Disclaimer/Publisher’s Note: The statements, opinions and data contained in all publications are solely those of the individual author(s) and contributor(s) and not of MDPI and/or the editor(s). MDPI and/or the editor(s) disclaim responsibility for any injury to people or property resulting from any ideas, methods, instructions or products referred to in the content.

