Abstract
Net primary productivity (NPP) is a key indicator for assessing carbon fixation capacity. Understanding the mechanisms of carbon sequestration capacity of forest ecosystems is critical in the context of global climate change. Research on the influencing factors and driving mechanisms of NPP in forest areas of China is still insufficient, especially the lack of systematic analysis on the role of climate and phenology. Forest cover in China has been increasing in recent decades due to natural forest expansion and planted forests. It is significant to clarify the underlying drivers of the forest NPP in China. To address this issue, we collected annual NPP, biomass, phenology, temperature, and precipitation data in China from 2002 to 2021, then applied the general linear mixed effect model (GLMM) and Bayesian structural equation models to conduct a comprehensive analysis of the influencing factors of NPP. The results have shown that influencing factors all exert a significant positive influence on NPP through bivariate relationship analysis. The GLMM revealed that forest NPP was significantly positively affected by biomass, aridity index, temperature, and phenology. Among these, the aridity index (AI) (58.39%) and temperature (27.21%) were identified as having the highest contributions to NPP. The direct and indirect effects on NPP were evaluated using Bayesian structural equation models (SEMs), and the interactions between the factors and their comprehensive regulatory mechanisms on NPP were revealed. This study is crucial for understanding the impact of climate change on regulating forest carbon sequestration and providing strategies for effective forest management.
1. Introduction
The net primary productivity (NPP) of forest is vital for assessing the quality of terrestrial ecosystems and plays an indispensable role in regulating the global carbon balance [1,2]. Net primary productivity (NPP) refers to the net amount of organic matter accumulated by green plants through photosynthesis, which is the difference between gross primary production (GPP) and plant respiration, which serves as a significant indicator of forests carbon sequestration capacity [3,4]. The photosynthesis rate of forest ecosystems is regulated by phenological changes [5]. Phenological events affect the duration and efficiency of photosynthesis, thereby determining the carbon assimilation capacity of the forest [6,7]. The length of the phenological period is controlled by climatic conditions, especially the variations of temperature and precipitation [8,9,10]. Moreover, the accumulation of biomass will also regulate the length of the phenological period. Climate change has a profound impact on forest NPP, especially the increase in frequency and intensity of extreme drought events [11,12,13]. Biomass, climate, and phenology are the influencing factors of NPP; nevertheless, the current research on the processes and mechanisms by which these factors jointly regulate China’s forest NPP is still insufficient; in particular, the specific ways in which climate factors affect NPP through phenology, biomass, and phenology are still unclear.
Phenological indicators, including several key stages of the growing season—Greenup, MidGreenup, Maturity, Peak, Senescence, Greendown and Dormancy [14]—play a key role in determining each symbol and duration of photosynthesis in the vegetation canopy, thus driving the process of carbon storage in ecosystems [15,16]. As global temperatures rise, notable changes in vegetation phenology have been observed, which has an impact on vegetation carbon sink capacity [17,18]. A trend of advancing Greenup timing and a delay in the termination of the vegetation growing season can extend the length of the vegetation growing season. NPP also shows a significant increasing trend correspondingly [19,20]. However, advancements in spring phenology may result in increased water stress in the later growing season, with restricting carbon sequestration exhibiting a negative relationship between phenology and NPP [21]. For example, NPP increased with a later start of the growing season and decreased with an earlier end of the growing season in central Asia [22]. Meanwhile, on the Qinghai–Tibet Plateau, an advancement in the start of the growing season demonstrated a significant negative correlation with spring NPP, and a delayed end of the growing season was strongly associated with enhanced autumn NPP [19]. There are variations in the results of these regional studies, with some regions showing positive effects and others negative ones. Therefore, the overall driving patterns of NPP in forest areas of China remain insufficiently understood and necessitate further comprehensive research.
Biomass is also a key plant growth-promoting factor of productivity [23]. It reflects the maturity and growth rate of the forest, and a high biomass usually means that more leaf area and materials are available for photosynthesis, thus increasing carbon fixation [24,25,26]. As a major component of terrestrial ecosystems, forests have extremely large biomass accumulation and high biological productivity [27]. Studies have shown that higher forest biomass typically corresponds to greater NPP [28,29,30], indicating that forests with higher biomass tend to exhibit great carbon fixation capacity [31,32]. However, while the majority of studies emphasize a positive effect of biomass on productivity, previous research has found a significant negative correlation [33]. Moreover, in drought-prone areas, water stress can restrict the physiological functions of high biomass forests, such as photosynthetic efficiency, thereby limiting carbon assimilation and reducing NPP [34]. This highlights that the relationship between biomass and forest productivity is complex and environment-dependent.
Climate conditions affect NPP by directly or indirectly affecting the growth and rhythms of plants through their effects on temperature and precipitation patterns [35,36]. In recent years, analytical findings have demonstrated that climate change has caused significant fluctuations in NPP [37]. Rising temperatures and changes in precipitation patterns may lead to the advancing or delayed trend of phenological events, thereby affecting the growth cycle and the duration of phenological periods [38,39,40]. This, in turn, regulates photosynthesis and biomass accumulation, directly affecting plant growth and carbon accumulation. Nevertheless, in regions with low humidity, biomass accumulation may not directly accelerate increased NPP because the importance of water supply as a factor limiting NPP will increase [41]. The mechanisms by which the interactions of climatic factors (such as the combined effects of temperature and humidity) jointly affect these productivity-linked ecological processes are still unclear. This highlights the necessity of addressing further exploration to provide more evidence and understanding of the complex relationship between biomass, NPP, and climatic factors, particularly under the influence of climate change.
Therefore, this study applied remote sensing data to investigate the response of forest NPP in China to climate change, phenology, and biomass from 2002 to 2021. The whole forestland selected in this study covers the entire China forest area and different climate zones, which reveals how climate factors act on phenology and biomass, thereby affecting the productivity and carbon sequestration capacity of forest ecosystems. The specific objectives of this study are as follows: (1) analyze the relationship between China forest NPP and biomass, climate factors (temperature and aridity index), and phenology; (2) investigate the relative importance of each factor affecting NPP; (3) quantitatively evaluate the direct and indirect effects on NPP, to explore climate factors regulating forest biomass accumulation and thus NPP by changing the plant phenology. Answers to these research questions are crucial to a deep understanding of the impact of climate change on the role of forests in carbon sequestration, and they are also the key research points that need to be investigated in terms of current forest ecology.
2. Materials and Methods
2.1. Study Area
China is the third largest country in the world, located on the west coast of the Pacific Ocean in eastern Asia [42]. The study focused on forest areas of China that are distributed between 18° and 53° north latitude, covering subtropical forests extending from the Greater Khingan Range in northeast to south China.
2.2. Phenological, Biomass, and Climate Variables
Phenology is a biological phenomenon affected by environmental factors and reflects the plant growth and development of species under different climatic conditions, involving multiple indicators [43]. Phenology in this study is calculated as the difference between Dormancy (the date when the two-band Enhanced Vegetation Index (EVI2) last exceeded 15% of its amplitude) and Greenup (the date when EVI2 first exceeded 15% of its amplitude). EVI2 is used to quantify land surface greenness dynamics. Greenup occurs when new growth exceeds senescence, and Dormancy occurs when trees suspend growth and reduce activity to survive adverse winter conditions [44]. Since Greenup typically appears in early spring (e.g., February to May) and Dormancy occurs in the late autumn or early winter of the previous year (e.g., October to December), the Dormancy date corresponds to the end of the previous growing season. Biomass carbon represents the amount of carbon in living organisms. Usually, plant biomass carbon accounts for 45% to 50% of biomass. Biomass carbon is a part of biomass and mainly refers to the carbon element in living organisms. In plant communities, plant biomass carbon is the main source of biomass carbon, and its content accounts for a considerable proportion of biomass, which is of great significance for understanding the global carbon cycle and carbon storage in ecosystems. Biomass carbon refers to the sum of above-ground biomass carbon (AGBC) and below-ground biomass carbon (BGBC).
French geographer Émile De Martonn developed an aridity–humidity index to quantify dryness, given as the ratio of mean annual precipitation (MAP) and mean annual temperature (MAT), adding a constant of 10 based on the observed data [45,46,47], with a classification of <5: arid; 5–10: semi-arid; 10–20: semi-humid; 20–30: humid; >30: perhumid (Figure 1e and Figure S1E). The equation is shown in Equation (1):
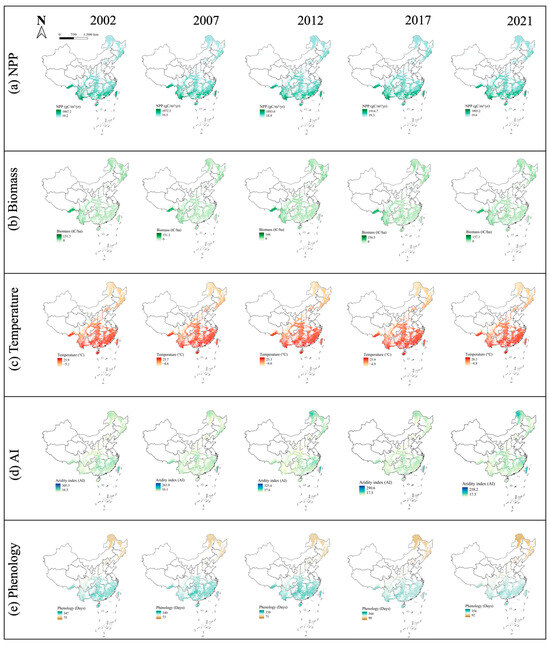
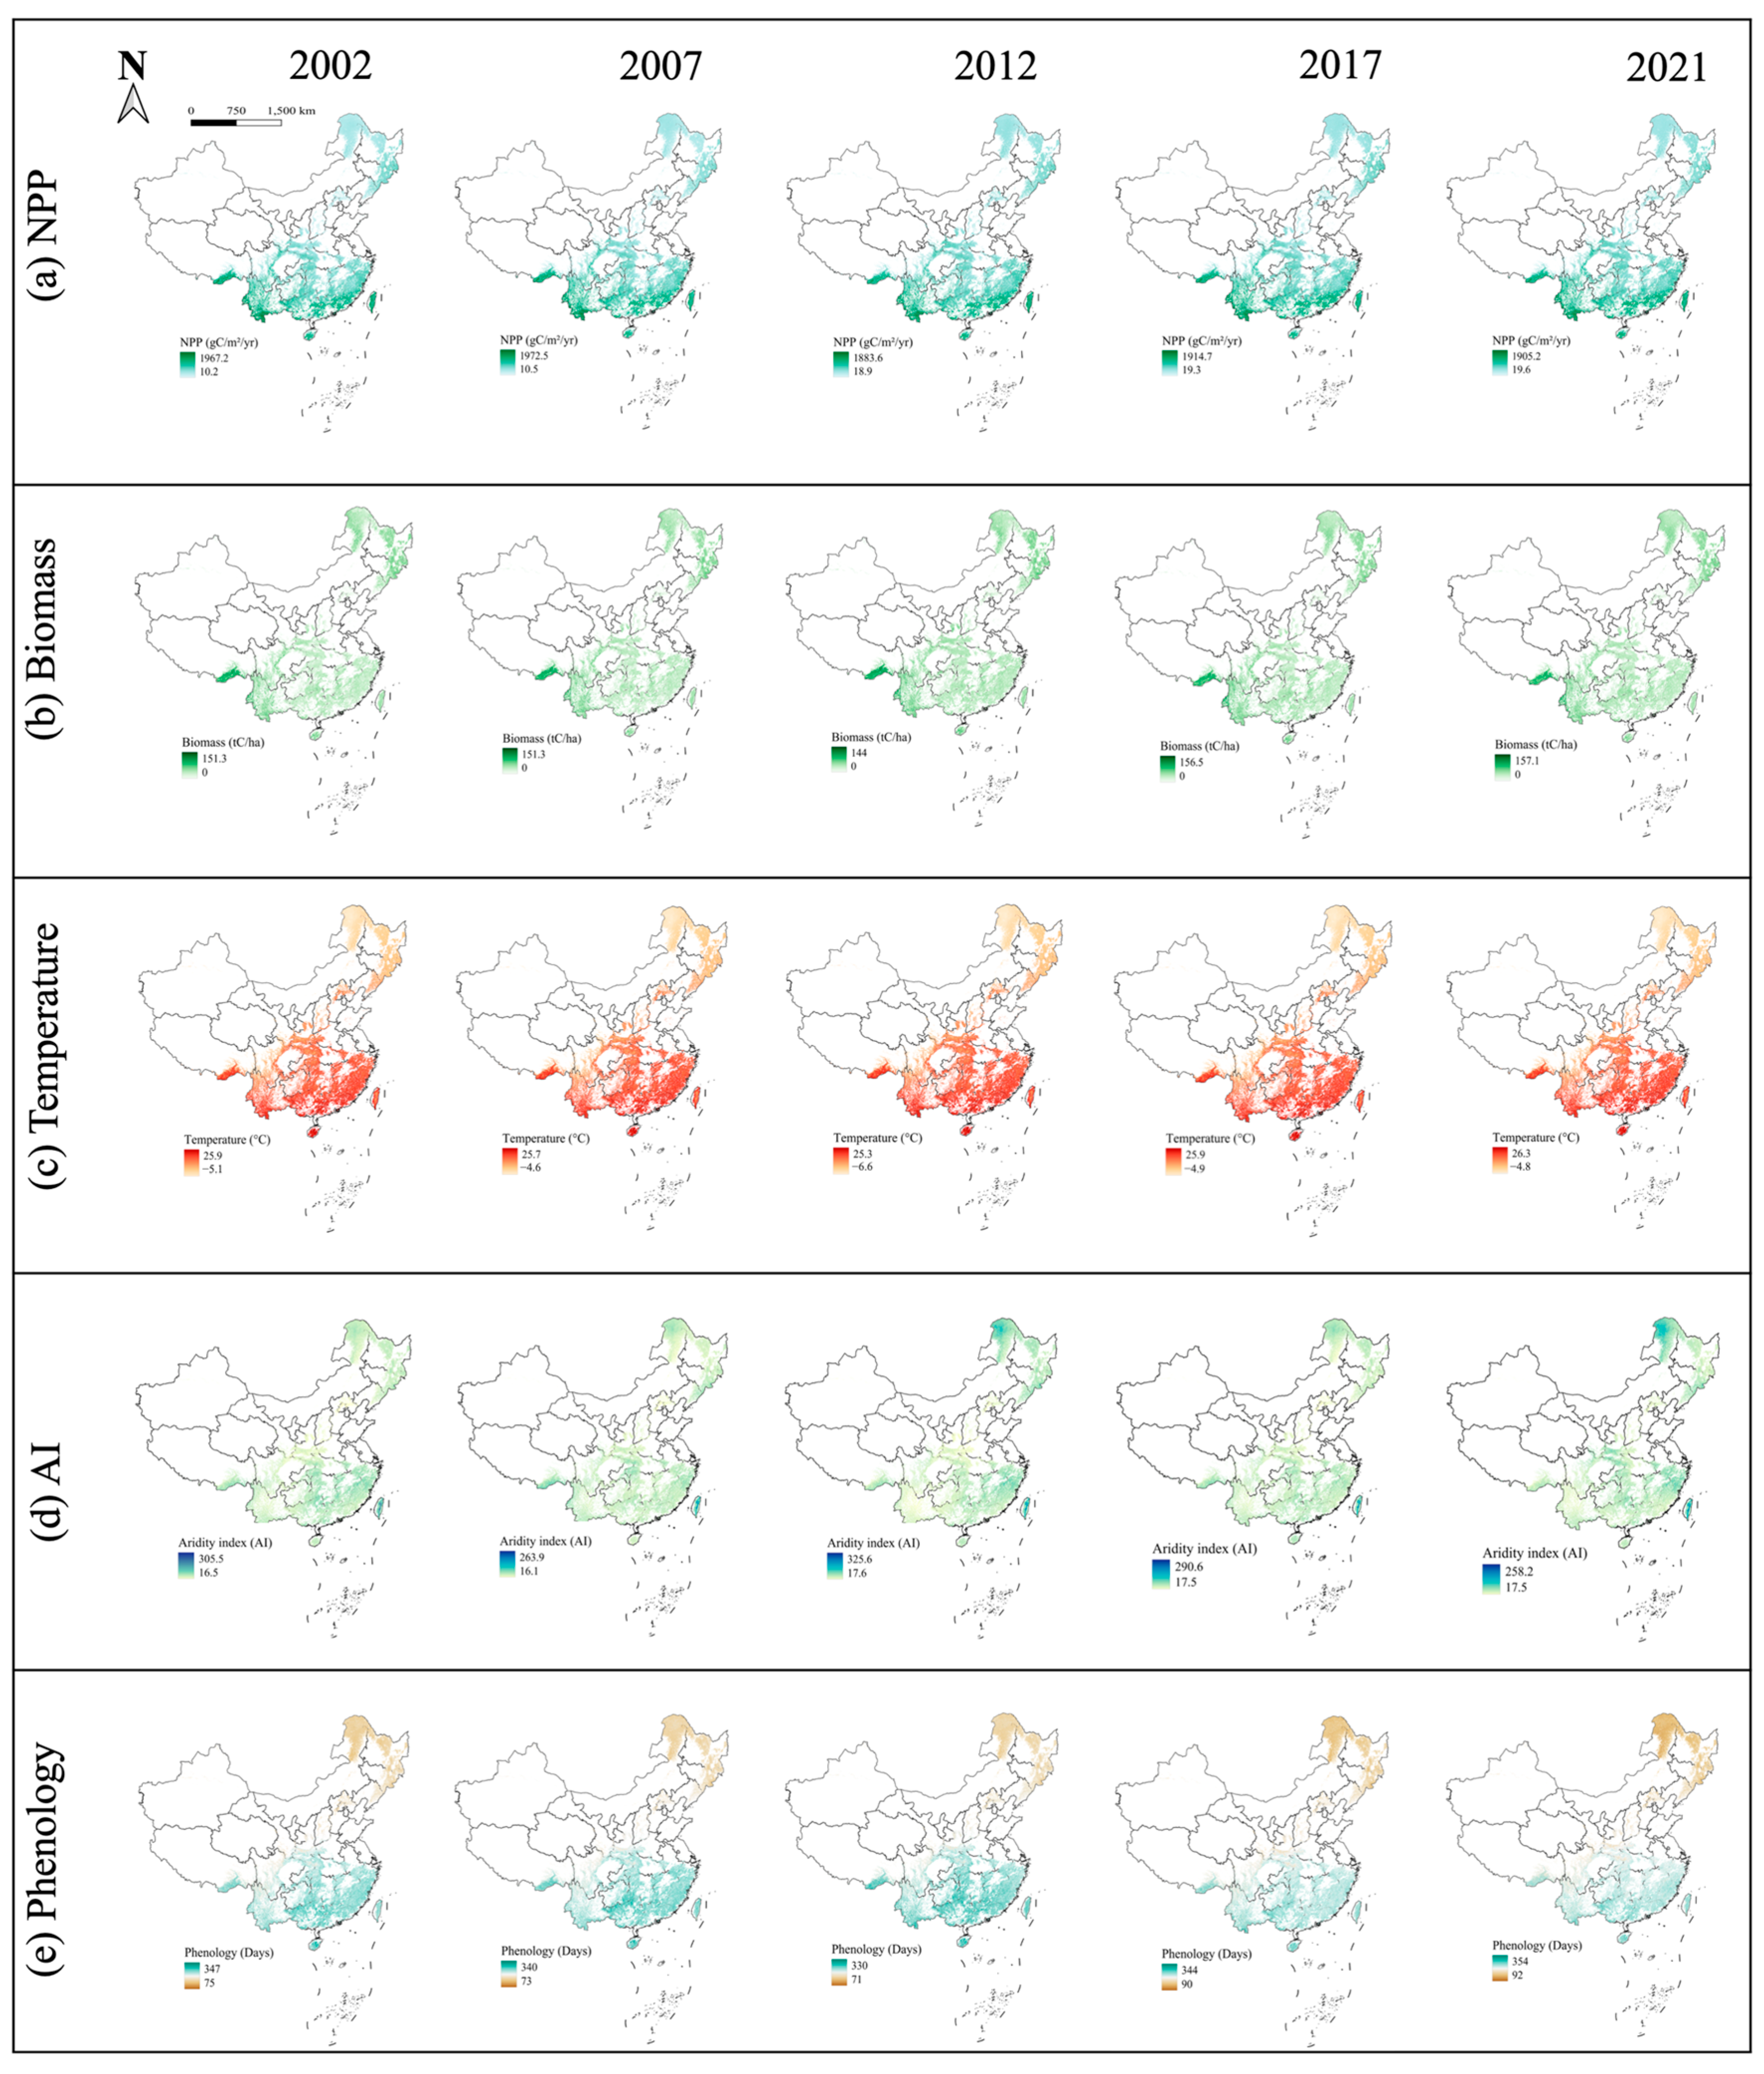
Figure 1.
Spatial variation of China forest NPP: (a), Biomass (b), Temperature (c), AI (d), and Phenology (e) in China.
2.3. Data Collection
NPP data come from the Moderate Resolution Imaging Spectroradiometer (MODIS) Net Primary Production (NPP) product (MOD17A3HGF) (https://lpdaac.usgs.gov/products/mod17a3hgfv061/, accessed on 8 December 2024), which is extracted from the Google Earth Engine (GEE) platform. This product has a spatial resolution of 500 m and provides annual NPP data based on the annual sum of the MODIS 8-day cycle GPP Net Photosynthesis (PSN) data (MOD17A2H) on the Terra satellite (Figure 1a, Figure S1A). The PSN value is obtained by subtracting maintenance respiration (MR) from GPP [48].
Biomass data obtained from the Chinese forest aboveground biomass carbon (AGBC) and belowground biomass carbon (BGBC) datasets were provided by the National Cryosphere Desert Data Center (http://www.ncdc.ac.cn) (https://cstr.cn/31253.11.sciencedb.07122, accessed on 6 December 2024) [49]. This dataset is based on an integration of remote sensing observations and field measurements, using regression analysis and machine-learning techniques to provide information on biomass carbon changes at a spatial resolution of 1 km (Figure 1b, Figure S1B). It effectively integrates remote sensing data with field measurements to ensure the accuracy and temporal and spatial consistency of biomass carbon changes.
The temperature were extracted from the National Earth Science Data Center (https://www.geodata.cn/main/ https://www.geodata.cn/data/datadetails.html?dataguid=67669514169502&docId=4, accessed on 6 December 2024), which were calculated and synthesized the annual average temperature and aridity index (AI) with a resolution of 1 km based on their monthly datasets (Figure 1c,d; Figure S1C,D). The unit of temperature is °C.
Phenology data were derived from MCD12Q2 Version 6, and the 2-band Enhanced Vegetation Index (EVI2) time series data calculated based on the MODIS Nadir Bidirectional Reflectance Distribution Function (Figure 1e; Figure S1E;). Specifically, bands representing the Greenup time and Dormancy time in the vegetation growth cycle were adopted [14].
More than 5000 random observation points were selected from remote sensing images of each factor for data collection, covering all forest areas in China, including different forest types and climate zones.
2.4. Generalized Linear Mixed Model
To assess the relative importance of biotic and climatic variables on NPP, the generalized linear mixed model (GLMM) was applied. GLMM is a statistical model for dealing with both fixed effects and random effects. The function in the R package (lme4) was performed in R version 4.3.3 [50], which provides functions for fitting and analyzing mixed models. It combines characteristics of the generalized linear model (GLM) and the linear mixed effects model (LME) [51]. It is fitted by REML, and Satterthwaite’s method is used for t-tests, as well as for assessing convergence of the model using the REML criterion value of the model. Biomass, temperature, aridity index (AI), and phenology are treated as fixed effects in the model. Moreover, latitude and year numbers were identified as random effects because spatial and temporal autocorrelation can exist. Before conducting all analyses, the productivity data were log-transformed, and all explanatory variables were standardized to have a mean of 0 and a standard deviation of 1 to enhance the interpretability of the regression coefficients [51]. Additionally, Pearson correlation analysis was performed to examine the correlations between all individual variables (Figure S2). Therefore, four models to assess the driving factors of NPP were developed (Table 1): (1) a null model without fixed effects, (2) a biotic model incorporating related variables as fixed effects, (3) an abiotic model including environment factors as fixed effects, and (4) a full model incorporating both biotic and abiotic variables as fixed effects. Models were evaluated using the Akaike Information Criterion (AIC), a widely used metric for model selection, where lower AIC values indicate better-fitting models. Furthermore, we employed the “glmm.hp” package to determine the individual R2 and the relative importance of each factor, while the “MuMIn” package was used to compute both marginal and conditional R2 values [51,52]. To assess potential multicollinearity among predictor variables, we calculated the Variance Inflation Factor (VIF). The results (all VIF values < 3) indicate that multicollinearity is negligible, ensuring that the estimates in our model remain statistically reliable and independent.

Table 1.
Four models were compared. The fixed effects include biomass, temperature, aridity index (AI), and phenology. The random effects include latitude and year.
2.5. Bayesian SEM
Bayesian structural equation models (SEMs) are applied to evaluate whether and how direct and indirect pathways act as NPP driving factors. A pathway diagram is created based on the cascade relationship. We defined three equations to characterize the relationships between the variables. Phenology is jointly influenced by AI and temperature because it is closely related to climate factors such as temperature and water supply [52]. A high aridity index (AI) is usually associated with longer drought periods, which may lead to delayed or advanced phenology [53]. Biomass is concurrently affected by AI, temperature, and phenology. Temperature and moisture directly affect the water absorption and photosynthesis rate of plants, which in turn affect biomass [54]. Changes in phenology affect the growth cycle of plants, thereby affecting the accumulation of biomass [52]. NPP is simultaneously influenced by all effects (biomass, AI, temperature, and phenology). The Bayesian SEM is operated using the ‘brms’ package performed in R software [50].
3. Results
3.1. Relationship Between Biomass, Climate, Phenology, and NPP
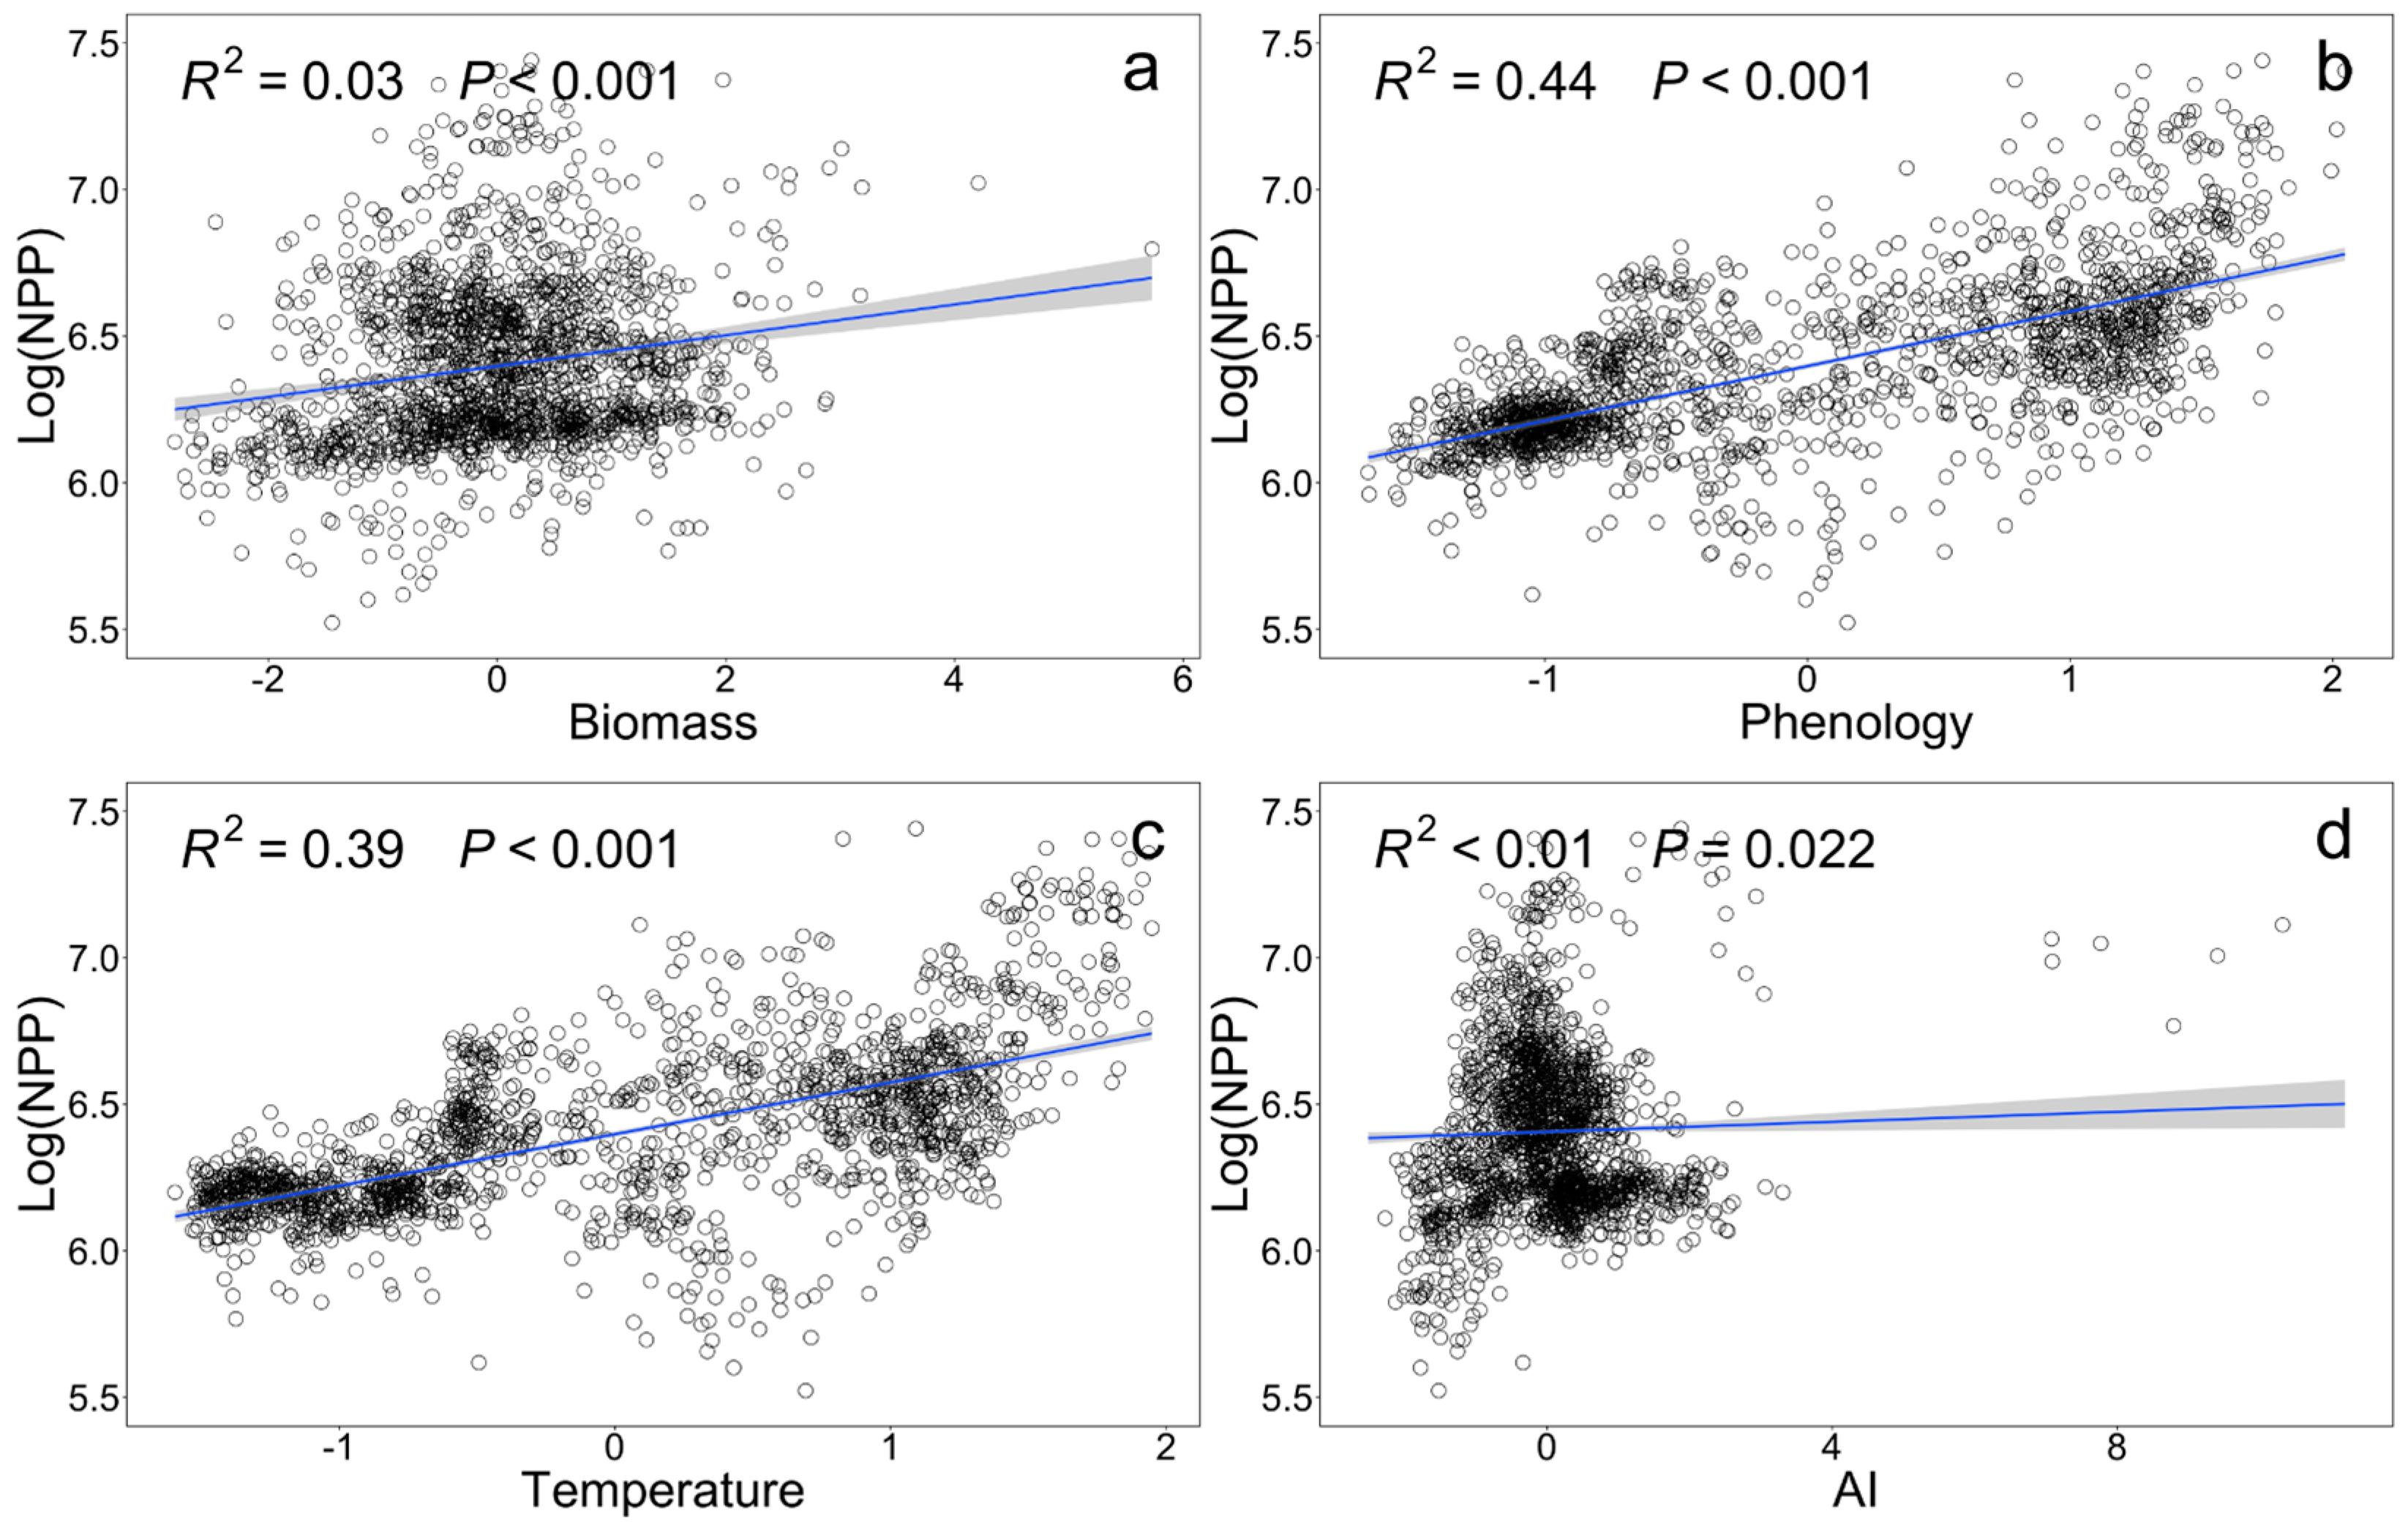
Bivariate relationships between driving factors and forest productivity were evaluated. Phenology, biomass, temperature, and aridity index (AI) all has significant positive effects on NPP. Specifically, biomass had the greatest impact on NPP (β = 0.045, P < 0.001; Figure 2a), followed by phenology (β = 0.184, P < 0.001, Figure 2b), temperature (β = 0.177, P< 0.001, Figure 2c), and aridity index (AI) (β = 0.009, P < 0.001; Figure 2d).
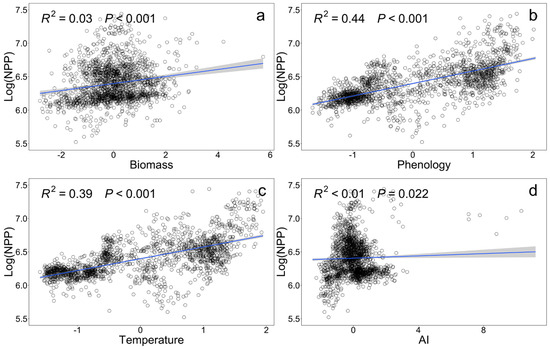
Figure 2.
Bivariate relationships between log-transformed net primary productivity (NPP) and various explanatory variables. (a) Biomass; (b) Phenology; (c) Temperature; (d) Aridity index (AI). The solid line represents the fitted straight line obtained under the linear regression model, and the blue area represents the 95% confidence interval of the model. R2 and P are the adjusted R2 and significance of the whole regression model, respectively.
3.2. Hierarchical Partitioning Analysis Based on Mixed Effects Model
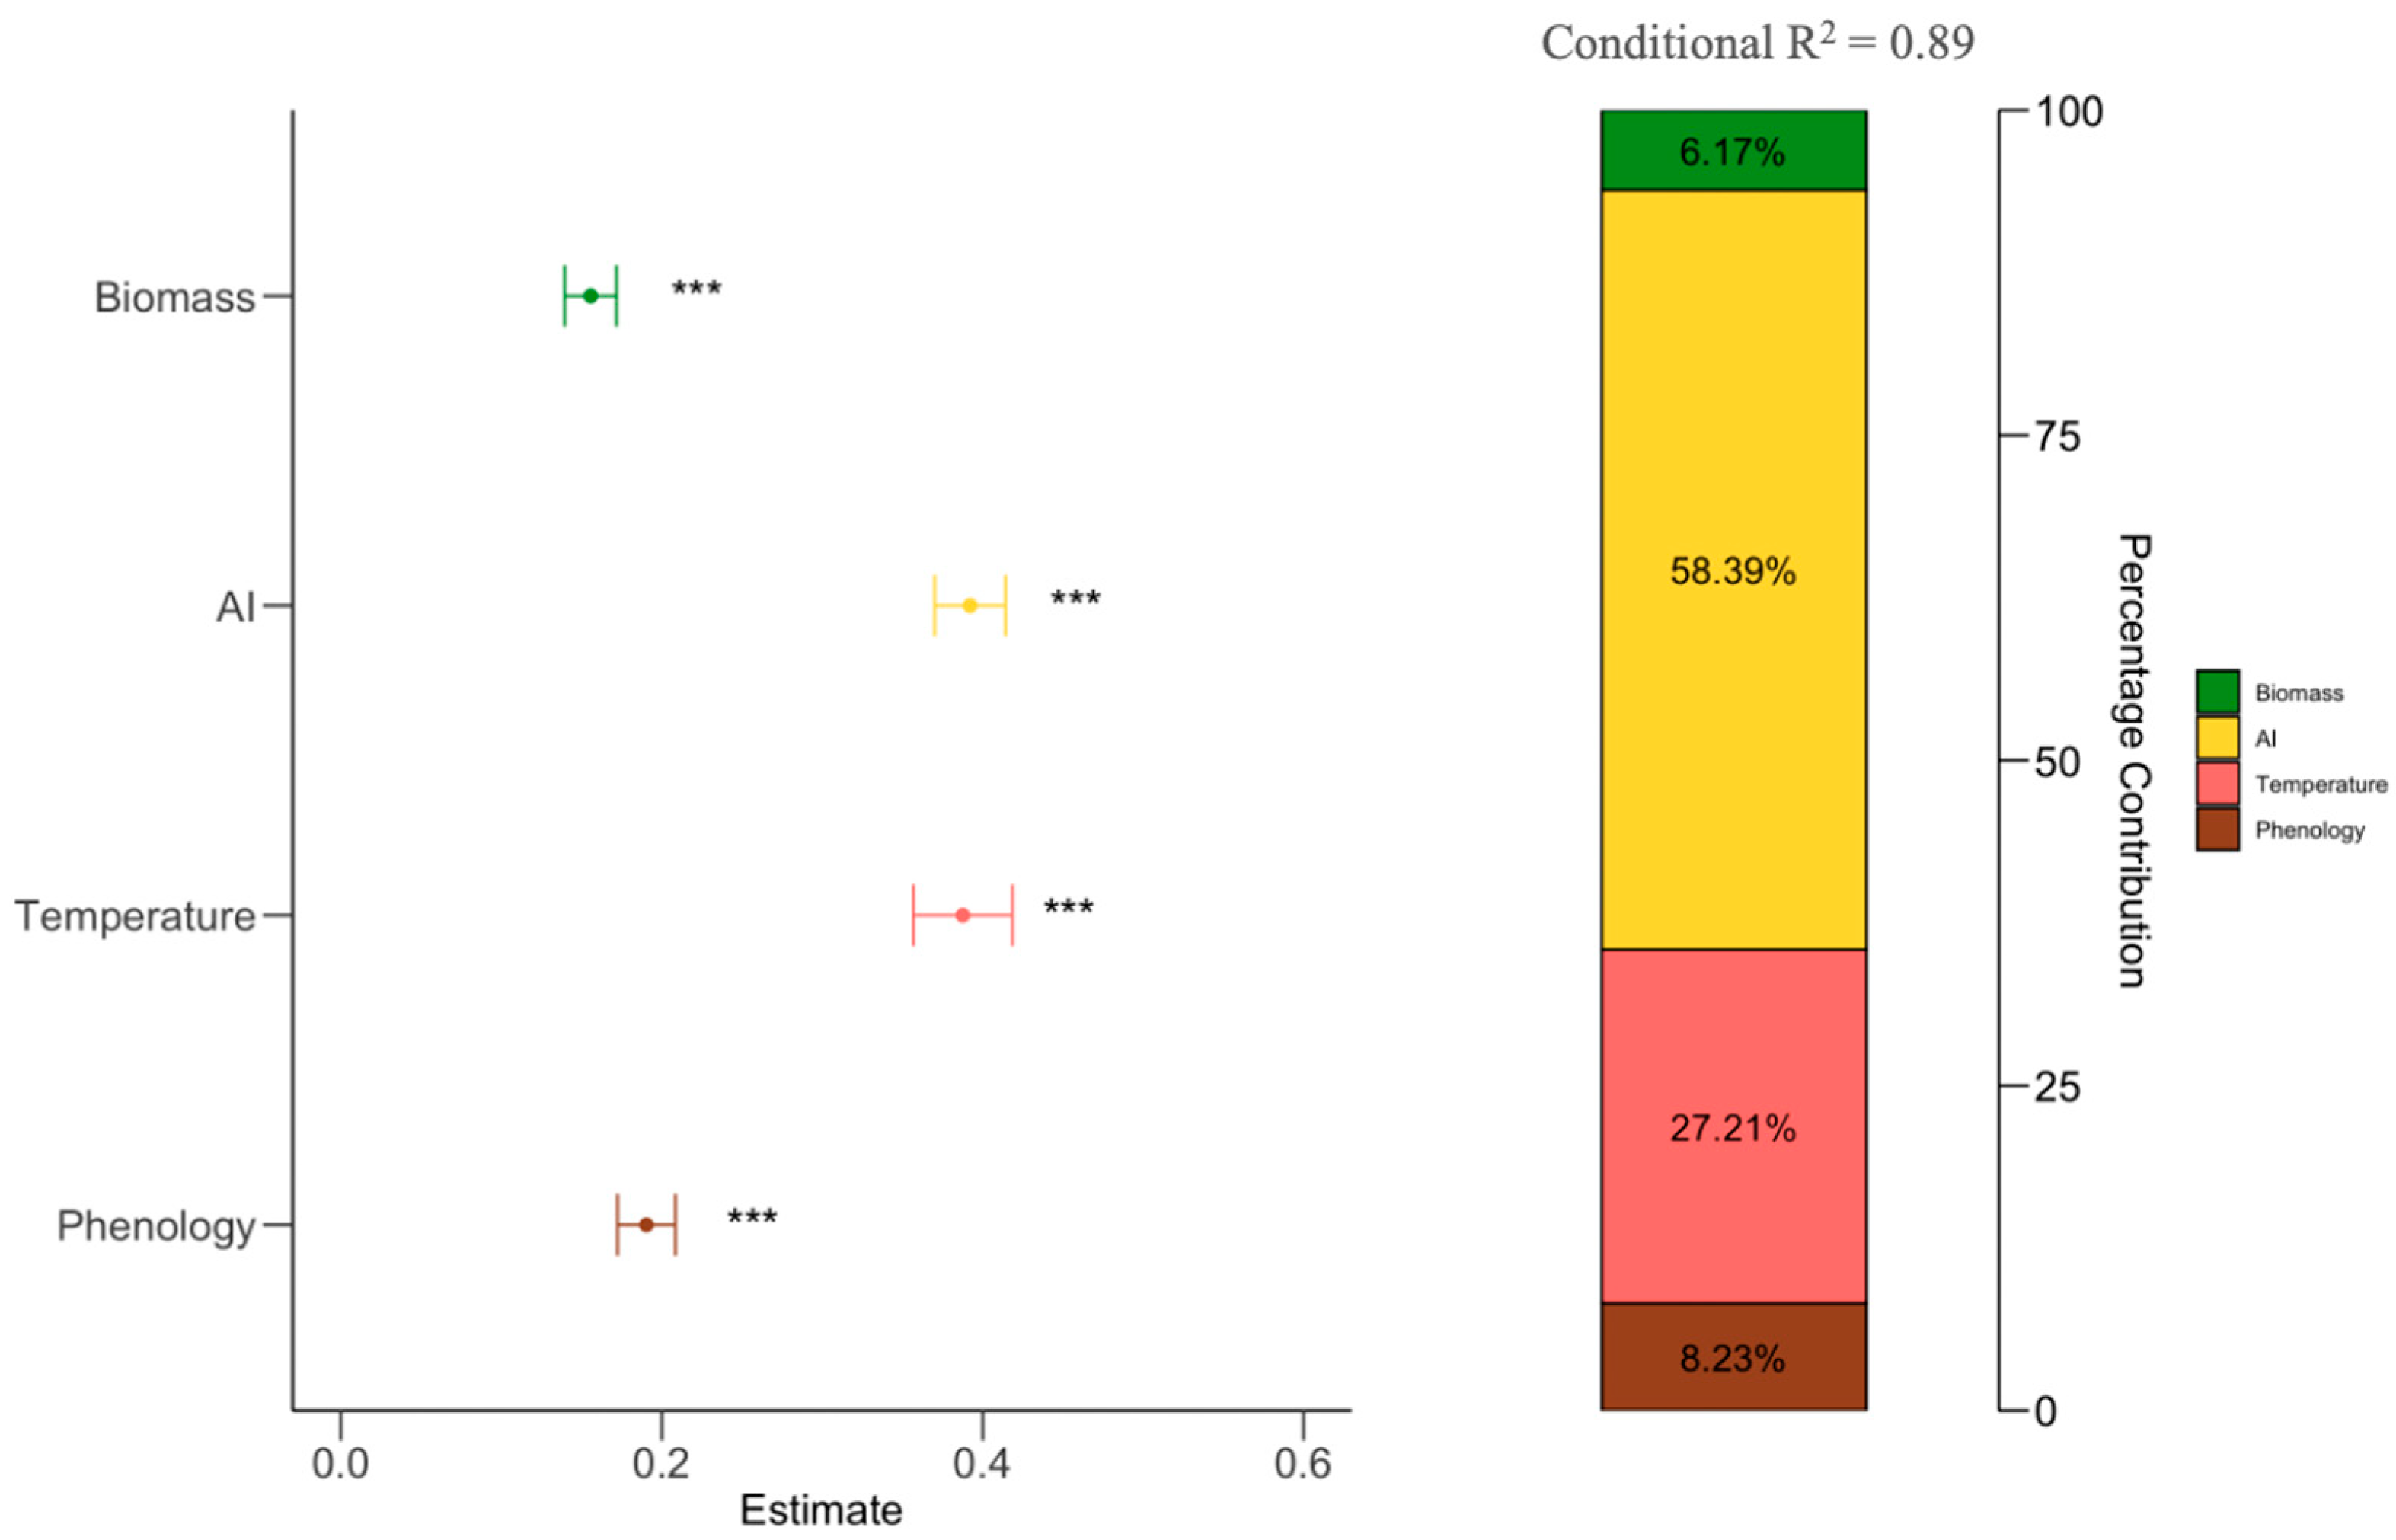
Results from forest plots showed aridity index (AI) (β = 0.398, P < 0.001), temperature (β = 0.364, P < 0.001), phenology (β = 0.019, P < 0.001), and biomass (β = 0.018, P < 0.001) have significant positive effects on NPP. The hierarchical partitioning shows factors influencing NPP through columns. Aridity index (AI) and temperature are shows as having the most contributions (58.39% and 27.21%), followed by phenology (8.23%) and biomass (6.17%) (Figure 3).
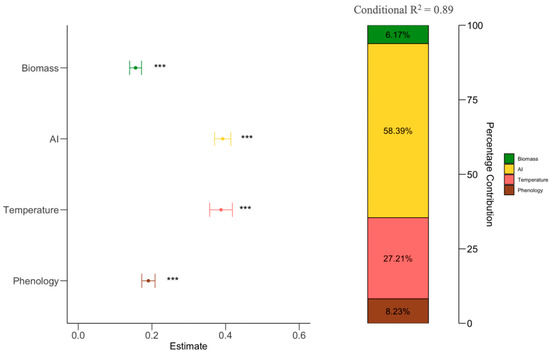
Figure 3.
Linear mixed model results on the effects of phenology, biomass, temperature, and aridity index (AI) on NPP. Stacked bars showing the contribution of each influencing factor (right) and the estimated effects of driving factors on NPP (left). Circles and lines represent the estimated standardized regression coefficients and their 95% confidence intervals, ***, P < 0.05.
3.3. Direct and Indirect Effects of Biomass, Climate, and Phenology on NPP
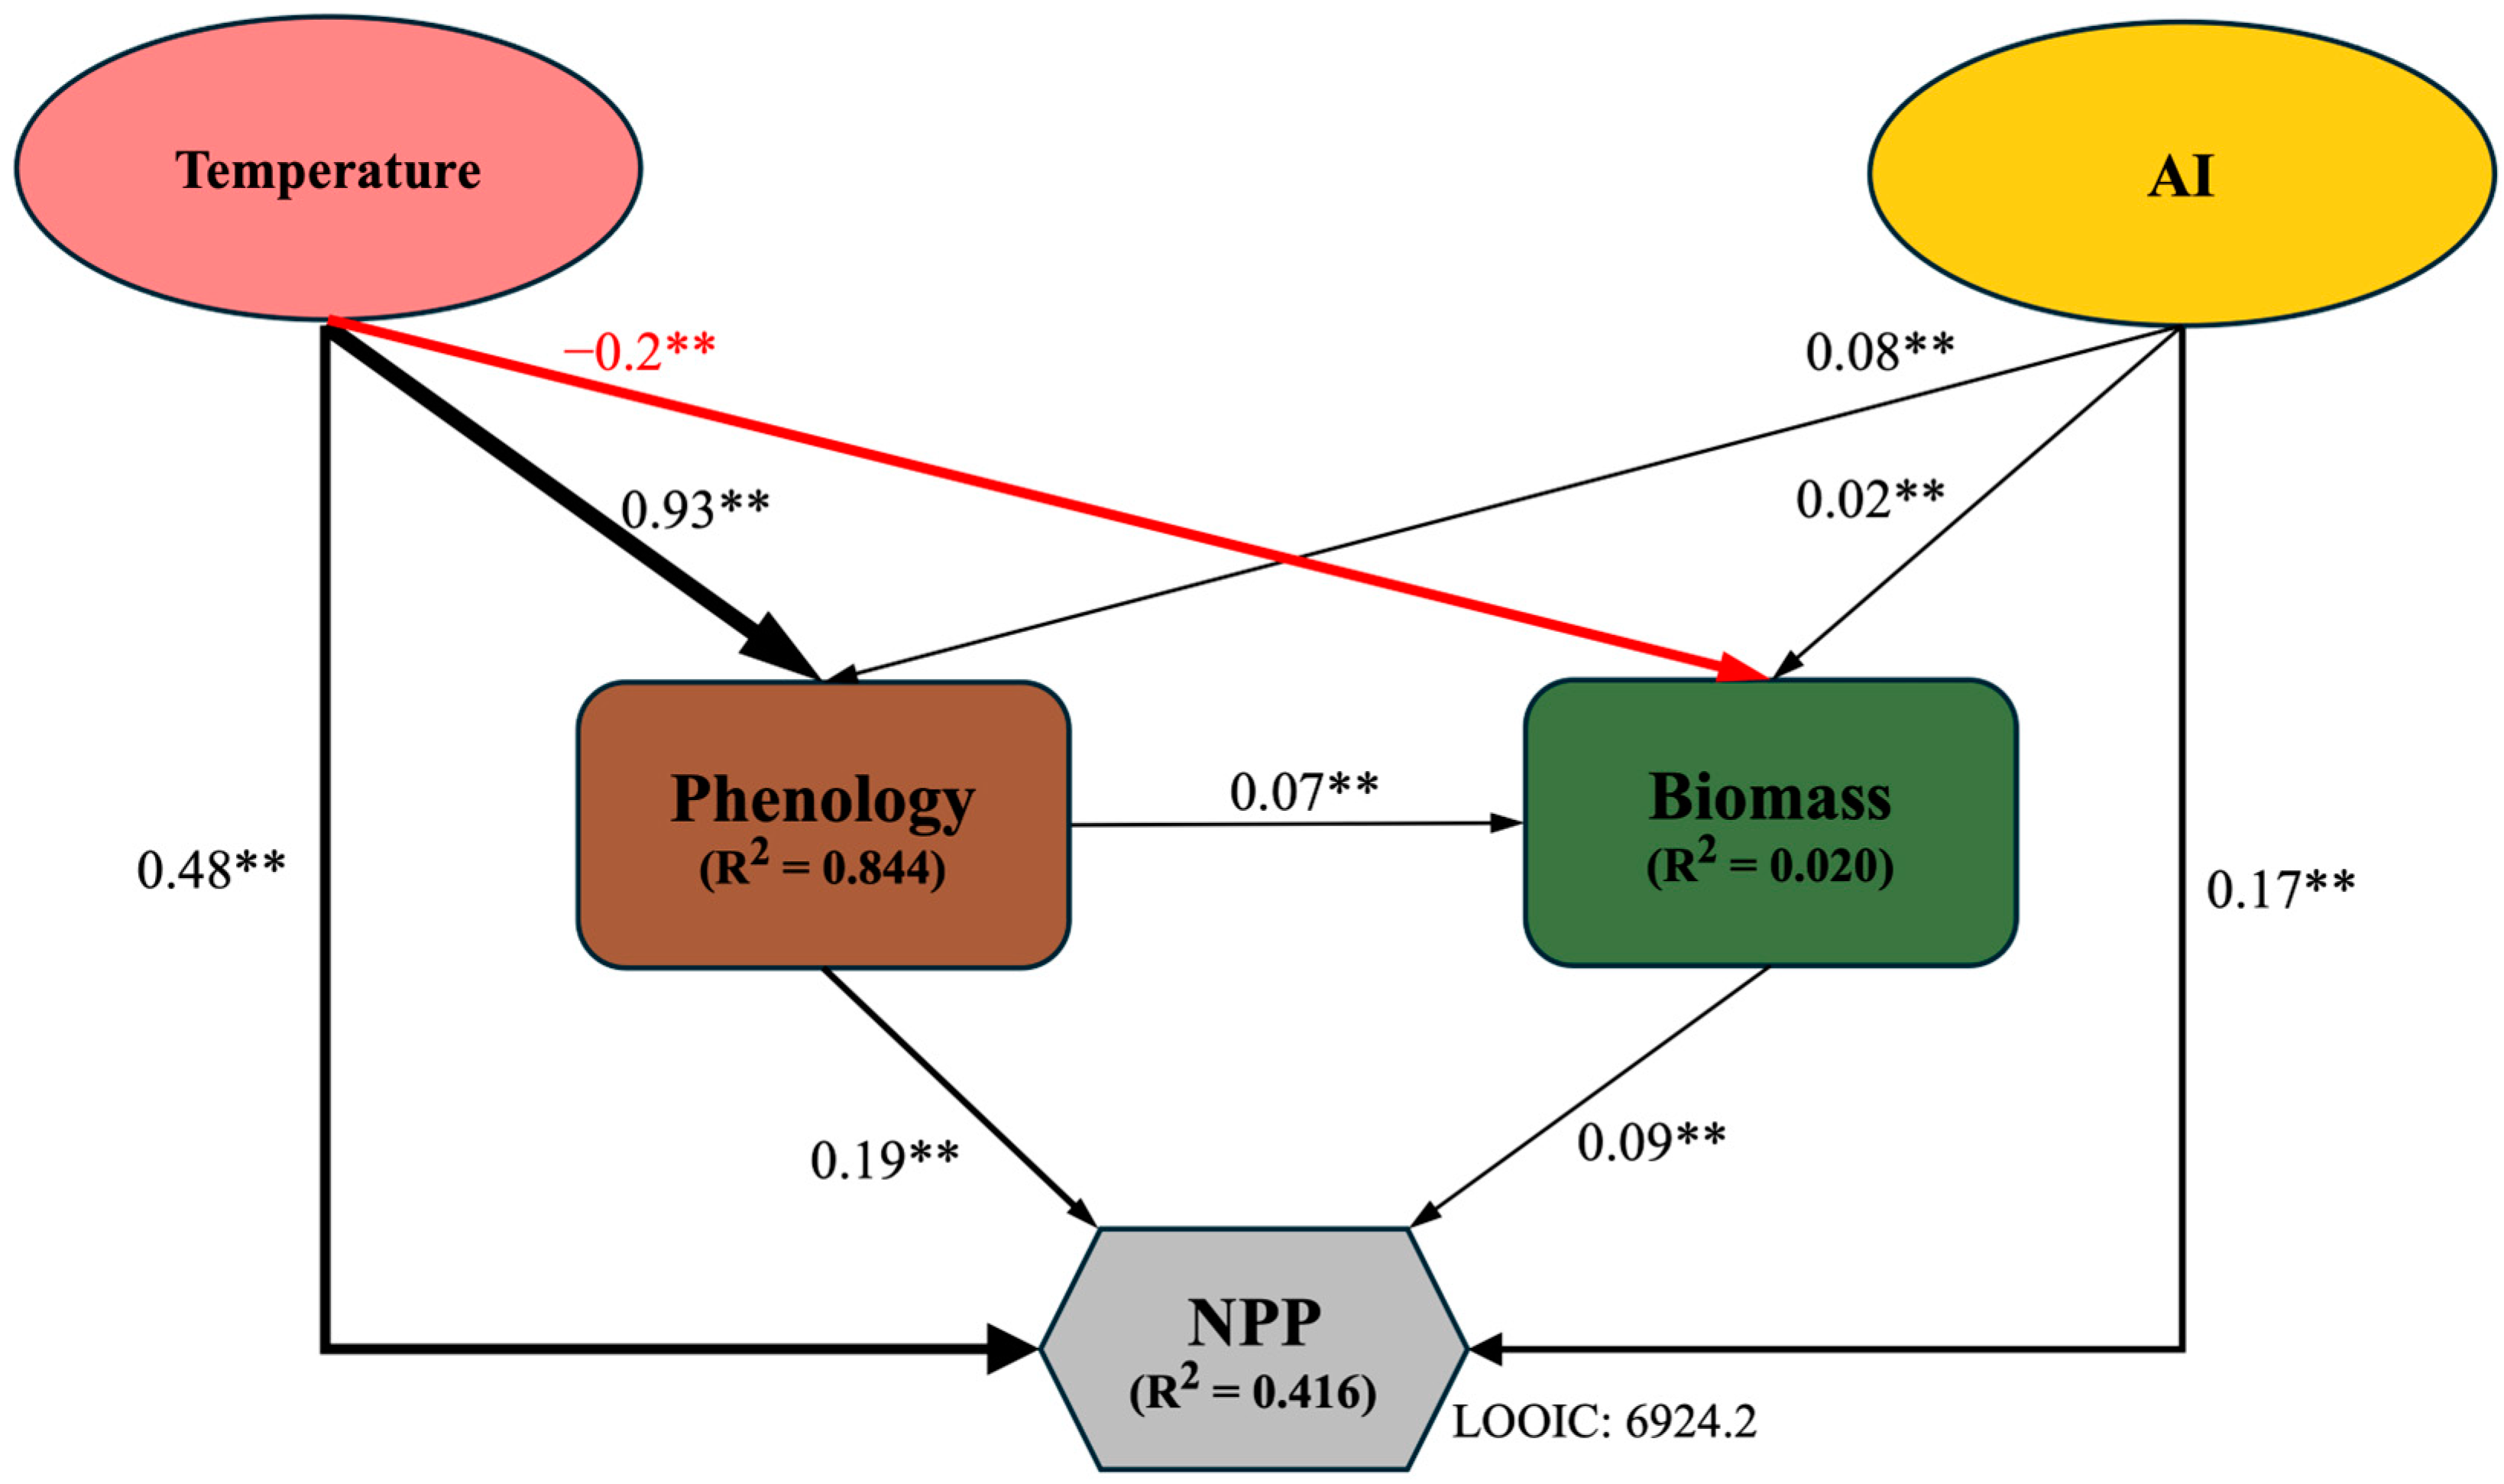
The results of structural equation model analysis showed that biomass, temperature, aridity index (AI), and phenology jointly explained 41.6% of NPP and had a direct impact on their productivity. Temperature and aridity index indirectly affect overall NPP through phenology and biomass; meanwhile, phenology has an indirect impact on NPP through biomass (Figure 4).

Figure 4.
Bayesian SEM regarding the impact of direct and indirect drivers on NPP. Solid black and red lines represent significant positive and negative paths, respectively (**, p < 0.01). LOOIC (Leave-One-Out Information Criterion) is used to assess the predictive performance of the models. Values adjacent to arrow lines represent standardized path coefficients, with arrow widths proportional to the coefficient.
4. Discussion
This study investigated the combined effects of climate, phenology, and biomass on forest net primary productivity (NPP). The results highlighted that certain climatic factors, especially water availability, as represented by the aridity index, have a major control on NPP, since phenology regulates forest productivity by determining the length of the growing season. The duration of the phenological cycle was controlled by the aridity index and temperature, highlighting the synergistic role of climatic and biotic factors in shaping NPP.
4.1. Response of NPP to Phenology in the Forest Region of China
Through this study, we found that the increased phenological phrase duration of forest contributes to increased NPP in forest regions of China. The main mechanism is regulating the photosynthetic efficiency and the growing season length. Current studies have shown that the extension of the growing season increases the photosynthetic time and thus promotes the increase of NPP [55,56]. Studies have also shown that an extension of the growing season increases soil organic matter decomposition and nutrient release, which in turn increases tree growth and carbon fixation [57,58,59]. As enzymatic reactions, photosynthesis is regulated by temperature. It is generally believed that rising temperatures can enhance photosynthesis, thereby promoting productivity [60]. The photosynthetic rate exhibits a high increase before reaching its optimum temperature, driven by the progressive enhancement of enzymatic activation and electron transport efficiency [61]. In addition, the variations of phenology among different tree species have a great impact on NPP [62,63]. For example, the phenology of evergreen and deciduous trees varies considerably, which directly affects the length of time they can photosynthesize throughout the year [64]. Even in evergreen forests, dominant tree species exhibit high rates of photosynthesis and large accumulations of carbon compared to other coexisting species [65,66]. The response of phenology to the extension of the growing season contributes to increased NPP, driven by multiple interacting factors, but its mechanisms are complicated. Future research should further explore these mechanisms through region-specific analyses to obtain deeper insights. For instance, high-elevation forests generally experience lower thermal optima, whereas subtropical forests may exhibit more plastic phenological responses to interannual climatic variability [67]. Differences in species composition, canopy structure, and physiological traits influence how forests respond to changing environmental conditions [68]. Although a detailed breakdown of NPP variations by forest type is beyond the scope of this study, future work incorporating forest-type-specific analyses across different climate zones could provide further insights into climate change.
4.2. Importance of Biomass Affecting Forest Net Primary Production
The significant positive effect of biomass on NPP is consistent with the assumption of the vegetation quantity hypothesis [69]. Areas with higher initial vegetation quantity can convert more energy and thus lead to higher productivity [70]. A higher leaf area index contributes to enhanced light energy capture, thereby increasing total carbon assimilation. There was a significant positive correlation between productivity and vegetation biomass, especially in the early stages of ecosystem succession [70]. Meanwhile, forest stands are closed in late succession and the light use efficiency is reduced, leading to a negative relation between vegetation biomass productivity [71,72]. However, Chisholm et al. [73] assessed multiple large forest plots around the world (mainly in late successional forests) and showed that forest productivity increased with biomass. This is owing to closed forest canopies not having occurred in these forests in the late stage of succession. Hence, the density of the canopy is relatively low, resulting in high light transmittance in canopies. The optimization of the light environment provides good growth conditions, thus maintaining high productivity [74]. Meanwhile, research also suggests that the leaf arrangement becomes increasingly important in NPP enhancement after reaching the maximum leaf area [75]. Forest regions in China are dominated by secondary forests, and most forests have not reached the late successional stage [76,77]. Model simulations suggest that China’s forest carbon sequestration rate is projected to peak around 2020, with total carbon storage continuing to increase until 2050 [78]. This indicates that many secondary forests are still in their mid-successional stage and have not yet reached a phase where productivity declines. Even in late succession, existing forest gaps facilitate light penetration, promoting leaf-area heterogeneity and enhancing productivity [61].
4.3. Climate-Driven Vegetation Productivity
According to the results, aridity index (AI) and temperature showed the strongest contributions, indicating that these factors play a crucial role in forest productivity. The aridity index (AI), with the greatest contribution, highlights the dominant role of moisture in regulating the productivity of forest ecosystems, mainly by accelerating plant physiological processes, such as plant water use and enzyme activity [79,80]. Furthermore, under specific environmental conditions, such as extreme drought years, the impact of aridity on NPP is significant and direct. This strong impact can be because, under extreme drought conditions, water availability is greatly limited, affecting plant biomass accumulation and phenological cycles, thereby significantly inhibiting the accumulation of NPP [81,82]. Thus, there is a strong positive correlation between water supply and NPP, which is that higher water availability is positively correlated with NPP in arid regions and that NPP in humid regions shows a decreasing trend after drought events [83,84].
Photosynthesis is greatly affected by temperature. Within a moderate range, photosynthetic rates in most plants respond reversibly to temperature fluctuations. However, exposure to extreme high or low temperatures can cause irreversible damage to the photosynthetic machinery [85,86]. Beyond its direct influence on photosynthesis, temperature also plays a crucial role in phenological transitions, particularly through accumulated temperature. Rising temperatures generally advance spring phenology, with earlier leaf unfolding being a well-documented response to warming [87,88]. However, when the accumulated temperature remains insufficient, dormancy-breaking requirements may not be met, delaying leaf emergence and consequently limiting plant productivity [89].
Water availability and accumulated growing degree days are key drivers of phenological transitions in temperate and subtropical forests. Growing degree days play a critical role in regulating budburst and leaf expansion timing, with species-specific temperature thresholds leading to variations in phenological responses [17,90]. Future analyses that incorporate fine-scale climatic variables such as intraseasonal variations and growing degree days thresholds can further elucidate these mechanisms.
There are significant differences in the regulatory mechanisms of temperature on photosynthesis and ecosystem respiration. Moderate warming can promote photosynthesis and increase enzyme activity and carbon assimilation capacity, but after exceeding a certain threshold high temperature will inhibit photosynthesis and photosynthetic electron transport and limit carbon dioxide supply due to stomatal closure [91]. Therefore, the temperature response of photosynthesis shows nonlinear changes, and productivity may not continue to increase under high temperature conditions or may even decrease. Compared with photosynthesis, respiration is more sensitive to temperature, usually showing an exponential growth relationship [92]. Under higher temperature conditions, the enhanced rate of respiration may exceed the enhanced rate of photosynthesis, resulting in carbon loss. Future studies can further quantify the long-term effects of temperature on NPP and its components (gross primary production and ecosystem respiration) to improve the understanding of changes in ecosystem carbon budget.
5. Conclusions
This study comprehensively assessed the effects of temperature, phenology, aridity index, and biomass on the net primary productivity (NPP) of the forest area in China. The results showed that climatic factors, especially the aridity index (AI), had dominant impacts on NPP. AI effectively represents water availability, which is essential for tree growth. Phenological events are promoted when there is sufficient temperature accumulation, which can stimulate unfolding leaves and leads to the initiation of photosynthesis. However, the contributions of these processes to productivity are ultimately governed by AI, as water availability is a fundamental mechanism linking forest net primary productivity. Our findings highlight that drought conditions, as quantified by AI, resemble an integrated measure of moisture availability, emphasizing the proviral role of water supply in supporting vegetation productivity. By elucidating these complex interactions, our study provides a comprehensive framework for understanding how climate, phenology, and biomass collectively regulate NPP, unraveling the critical role of climate conditions in shaping forest NPP. Especially in the context of global warming, these findings are important for the adaptation and management of forest resources. Given the ongoing expansion of China forest cover, our study suggests that water availability should be a key factor in species selection and site suitability assessments, ensuring that afforestation efforts align with projected climate conditions to maximize carbon sequestration potential. Additionally, shifting water availability may lead to drought-induced reductions in NPP or excessive soil moisture stress, necessitating adaptive forest management strategies such as improved irrigation practices and forest thinning. Furthermore, our results provide a predictive framework for assessing NPP responses to climate change, which can be integrated into Earth system models (ESMs) to refine projections of forest carbon dynamics under future climate scenarios.
Supplementary Materials
The following supporting information can be downloaded at: https://www.mdpi.com/article/10.3390/f16040612/s1, Figure S1: Interannual variations of year average NPP (A), Biomass (B), Temperature (C), Aridity Index (D), Phenology (E) from 2002 to 2021; Figure S2: Correlation analysis of NPP and influencing factors.
Author Contributions
Q.C., conceptualization, data collection, formal analysis, visualization, writing—original draft, writing—review and editing; X.X., formal analysis, visualization; Z.H., formal analysis; S.R., methodology, writing—reviewing and editing; B.W., supervision, writing—reviewing and editing. All authors have read and agreed to the published version of the manuscript.
Funding
This study was funded by the Capacity Enhancement Project for Integrated Monitoring and Assessment of Typical Tropical Ecosystems in Southern Hainan (HX2024-11).
Data Availability Statement
The original NPP data extracted from https://doi.org/10.5067/MODIS/MOD17A3HGF.061 (accessed on 8 December 2024). The original phenology data are extracted from https://doi.org/10.5067/MODIS/MCD12Q2.061 (accessed on 8 December 2024). The original biomass data presented in the study are openly available from the National Cryosphere Desert Data Center (https://cstr.cn/31253.11.sciencedb.07122 (accessed on 6 December 2024). The original temperature and precipitation data presented in the study are openly available from the National Earth Science Data Center https://www.geodata.cn/main/ (accessed on 6 December 2024).
Conflicts of Interest
The authors declare no conflicts of interest.
References
- Field, C.B.; Behrenfeld, M.J.; Randerson, J.T.; Falkowski, P. Primary Production of the Biosphere: Integrating Terrestrial and Oceanic Components. Science 1998, 281, 237–240. [Google Scholar] [CrossRef]
- Liu, C.; Dong, X.; Liu, Y. Changes of NPP and their relationship to climate factors based on the transformation of different scales in Gansu, China. Catena 2015, 125, 190–199. [Google Scholar] [CrossRef]
- Díaz, S. Ecosystem Function Measurement, Terrestrial Communities. In Encyclopedia of Biodiversity, 2nd ed.; Elsevier: Amsterdam, The Netherlands, 2013; pp. 72–89. [Google Scholar] [CrossRef]
- Tian, L.; Tao, Y.; Joanna, S.; Mäkelä, A.; Li, M. How forest age impacts on net primary productivity: Insights from future multi-scenarios. For. Ecosyst. 2024, 11, 100228. [Google Scholar] [CrossRef]
- Richardson, A.D.; Black, T.A.; Ciais, P.; Delbart, N.; Friedl, M.A.; Gobron, N.; Hollinger, D.Y.; Kljun, N.; Migliavacca, M.; Montagnani, L.; et al. Influence of spring and autumn phenological transitions on forest ecosystem productivity. Philos. Trans. R. Soc. B Biol. Sci. 2010, 365, 3227–3246. [Google Scholar] [CrossRef]
- Gu, H.; Qiao, Y.; Xi, Z.; Rossi, S.; Smith, N.G.; Liu, J.; Chen, L. Warming-induced increase in carbon uptake is linked to earlier spring phenology in temperate and boreal forests. Nat. Commun. 2022, 13, 3698. [Google Scholar] [CrossRef]
- D’Odorico, P.; Gonsamo, A.; Gough, C.M.; Bohrer, G.; Morison, J.; Wilkinson, M.; Hanson, P.J.; Gianelle, D.; Fuentes, J.D.; Buchmann, N. The match and mismatch between photosynthesis and land surface phenology of deciduous forests. Agric. For. Meteorol. 2015, 214–215, 25–38. [Google Scholar] [CrossRef]
- Ren, S.; Vitasse, Y.; Chen, X.; Peichl, M.; An, S. Assessing the relative importance of sunshine, temperature, precipitation, and spring phenology in regulating leaf senescence timing of herbaceous species in China. Agric. For. Meteorol. 2022, 313, 108770. [Google Scholar] [CrossRef]
- Shen, M.; Wang, S.; Jiang, N.; Sun, J.; Cao, R.; Ling, X.; Fang, B.; Zhang, L.; Zhang, L.; Xu, X.; et al. Plant phenology changes and drivers on the Qinghai–Tibetan Plateau. Nat. Rev. Earth Environ. 2022, 3, 633–651. [Google Scholar] [CrossRef]
- Badeck, F.W.; Bondeau, A.; Böttcher, K.; Doktor, D.; Lucht, W.; Schaber, J.; Sitch, S. Responses of spring phenology to climate change. New Phytol. 2004, 162, 295–309. [Google Scholar] [CrossRef]
- Gao, Y.; Zhu, D.; Wang, Z.; Lin, Z.; Zhang, Y.; Wang, K. Projected Increasing Negative Impact of Extreme Events on Gross Primary Productivity During the 21st Century in CMIP6 Models. Earths Future 2024, 12, e2024EF004798. [Google Scholar] [CrossRef]
- Liu, Y.; Zhou, R.; Wen, Z.; Khalifa, M.; Zheng, C.; Ren, H.; Zhang, Z.; Wang, Z. Assessing the impacts of drought on net primary productivity of global land biomes in different climate zones. Ecol. Indic. 2021, 130, 108146. [Google Scholar] [CrossRef]
- Gong, H.; Cao, L.; Duan, Y.; Jiao, F.; Xu, X.; Zhang, M.; Wang, K.; Liu, H. Multiple effects of climate changes and human activities on NPP increase in the Three-north Shelter Forest Program area. For. Ecol. Manag. 2023, 529, 120732. [Google Scholar] [CrossRef]
- Friedl, M.; Gray, J.; Sulla-Menashe, D. MODIS/Terra+Aqua Land Cover Dynamics Yearly L3 Global 500m SIN Grid V061; NASA EOSDIS Land Processes Distributed Active Archive Center: Sioux Falls, SD, USA, 2022. [Google Scholar]
- Leinonen, I.; Kramer, K. Applications of Phenological Models to Predict the Future Carbon Sequestration Potential of Boreal Forests. Clim. Change 2002, 55, 99–113. [Google Scholar] [CrossRef]
- Gu, L.; Post, W.M.; Baldocchi, D.; Andy Black, T.; Verma, S.B.; Vesala, T.; Wofsy, S.C. Phenology of Vegetation Photosynthesis. In Phenology: An Integrative Environmental Science; Springer: Dordrecht, The Netherlands, 2003; pp. 467–485. [Google Scholar] [CrossRef]
- Piao, S.; Liu, Q.; Chen, A.; Janssens, I.A.; Fu, Y.; Dai, J.; Liu, L.; Lian, X.U.; Shen, M.; Zhu, X. Plant phenology and global climate change: Current progresses and challenges. Glob. Change Biol. 2019, 25, 1922–1940. [Google Scholar] [CrossRef] [PubMed]
- Yin, H.; Ma, X.; Liao, X.; Ye, H.; Yu, W.; Li, Y.; Wei, J.; Yuan, J.; Liu, Q. Linking Vegetation Phenology to Net Ecosystem Productivity: Climate Change Impacts in the Northern Hemisphere Using Satellite Data. Remote Sens. 2024, 16, 4101. [Google Scholar] [CrossRef]
- Wang, S.; Zhang, B.; Yang, Q.; Chen, G.; Yang, B.; Lu, L.; Shen, M.; Peng, Y. Responses of net primary productivity to phenological dynamics in the Tibetan Plateau, China. Agric. For. Meteorol. 2017, 232, 235–246. [Google Scholar] [CrossRef]
- Zhou, X.; Geng, X.; Yin, G.; Hänninen, H.; Hao, F.; Zhang, X.; Fu, Y.H. Legacy effect of spring phenology on vegetation growth in temperate China. Agric. For. Meteorol. 2020, 281, 107845. [Google Scholar] [CrossRef]
- Yu, Z.; Lu, C.; Cao, P.; Tian, H.; Hessl, A.; Pederson, N. Earlier leaf-flushing suppressed ecosystem productivity by draining soil water in the Mongolian Plateau. Agric. For. Meteorol. 2018, 250–251, 1–8. [Google Scholar] [CrossRef]
- Wu, L.; Ma, X.; Dou, X.; Zhu, J.; Zhao, C. Impacts of climate change on vegetation phenology and net primary productivity in arid Central Asia. Sci. Total Environ. 2021, 796, 149055. [Google Scholar] [CrossRef]
- Gentine, P.; Green, J.K.; Guérin, M.; Humphrey, V.; Seneviratne, S.I.; Zhang, Y.; Zhou, S. Coupling between the terrestrial carbon and water cycles—A review. Environ. Res. Lett. 2019, 14, 083003. [Google Scholar] [CrossRef]
- Norby, R.J.; Loader, N.J.; Mayoral, C.; Ullah, S.; Curioni, G.; Smith, A.R.; Reay, M.K.; Van Wijngaarden, K.; Amjad, M.S.; Brettle, D.; et al. Enhanced woody biomass production in a mature temperate forest under elevated CO2. Nat. Clim. Chang. 2024, 14, 983–988. [Google Scholar] [CrossRef]
- Maschler, J.; Bialic-Murphy, L.; Wan, J.; Andresen, L.C.; Zohner, C.M.; Reich, P.B.; Lüscher, A.; Schneider, M.K.; Müller, C.; Moser, G.; et al. Links across ecological scales: Plant biomass responses to elevated CO2. Glob. Change Biol. 2022, 28, 6115–6134. [Google Scholar] [CrossRef]
- Qu, Y.; Jiang, Y.; Chen, H.; Hu, Y.; Jiang, Y.; Wang, Z.; Chhin, S.; Zhang, J.; Sun, L.; Zhang, X. Does the peak time of stand leaf area equal the biological maturity age of forests? For. Ecol. Manag. 2023, 538, 120988. [Google Scholar] [CrossRef]
- Xu, L.; Saatchi, S.S.; Yang, Y.; Yu, Y.; Pongratz, J.; Bloom, A.A.; Bowman, K.; Worden, J.; Liu, J.; Yin, Y.; et al. Changes in global terrestrial live biomass over the 21st century. Sci. Adv. 2021, 7, eabe9829. [Google Scholar] [CrossRef] [PubMed]
- Malhi, Y.; Doughty, C.E.; Goldsmith, G.R.; Metcalfe, D.B.; Girardin, C.A.; Marthews, T.R.; del Aguila-Pasquel, J.; Aragão, L.E.; Araujo-Murakami, A.; Brando, P.; et al. The linkages between photosynthesis, productivity, growth and biomass in lowland Amazonian forests. Glob. Change Biol. 2015, 21, 2283–2295. [Google Scholar] [CrossRef] [PubMed]
- Clark, D.A.; Brown, S.; Kicklighter, D.W.; Chambers, J.Q.; Thomlinson, J.R.; Ni, J. Measuring Net Primary Production in Forests: Concepts and Field Methods. Ecol. Appl. 2001, 11, 356–370. [Google Scholar] [CrossRef]
- Goulden, M.L.; McMillan, A.M.S.; Winston, G.C.; Rocha, A.V.; Manies, K.L.; Harden, J.W.; Bond-Lamberty, B.P. Patterns of NPP, GPP, respiration, and NEP during boreal forest succession. Glob. Change Biol. 2011, 17, 855–871. [Google Scholar] [CrossRef]
- Noormets, A.; Epron, D.; Domec, J.C.; McNulty, S.G.; Fox, T.; Sun, G.; King, J.S. Effects of forest management on productivity and carbon sequestration: A review and hypothesis. For. Ecol. Manag. 2015, 355, 124–140. [Google Scholar] [CrossRef]
- Malhi, Y. The productivity, metabolism and carbon cycle of tropical forest vegetation. J. Ecol. 2012, 100, 65–75. [Google Scholar] [CrossRef]
- Keeling, H.C.; Phillips, O.L. The global relationship between forest productivity and biomass. Glob. Ecol. Biogeogr. 2007, 16, 618–631. [Google Scholar] [CrossRef]
- Zhou, G.; Wang, Y.; Jiang, Y.; Yang, Z. Estimating biomass and net primary production from forest inventory data: A case study of China’s Larix forests. For. Ecol. Manag. 2002, 169, 149–157. [Google Scholar] [CrossRef]
- Xue, Y.; Bai, X.; Zhao, C.; Tan, Q.; Li, Y.; Luo, G.; Wu, L.; Chen, F.; Li, C.; Ran, C.; et al. Spring photosynthetic phenology of Chinese vegetation in response to climate change and its impact on net primary productivity. Agric. For. Meteorol. 2023, 342, 109734. [Google Scholar] [CrossRef]
- Chen, X.; Zhang, Y. Impacts of climate, phenology, elevation and their interactions on the net primary productivity of vegetation in Yunnan, China under global warming. Ecol. Indic. 2023, 154, 110533. [Google Scholar] [CrossRef]
- Gao, Q.; Li, Y.; Wan, Y.; Qin, X.; Jiangcun, W.; Liu, Y. Dynamics of alpine grassland NPP and its response to climate change in Northern Tibet. Clim. Change 2009, 97, 515–528. [Google Scholar] [CrossRef]
- Yang, Y.; Fan, F. Land surface phenology and its response to climate change in the Guangdong-Hong Kong-Macao Greater Bay Area during 2001–2020. Ecol Indic 2023, 154, 110728. [Google Scholar] [CrossRef]
- Piao, S.; Wang, X.; Park, T.; Chen, C.; Lian, X.U.; He, Y.; Bjerke, J.W.; Chen, A.; Ciais, P.; Tømmervik, H.; et al. Characteristics, drivers and feedbacks of global greening. Nat. Rev. Earth Environ. 2019, 1, 14–27. [Google Scholar] [CrossRef]
- Fernández-Martínez, M.; Vicca, S.; Janssens, I.A.; Campioli, M.; Peñuelas, J. Nutrient availability and climate as the main determinants of the ratio of biomass to NPP in woody and non-woody forest compartments. Trees 2016, 30, 775–783. [Google Scholar] [CrossRef]
- Girardin, M.P.; Hogg, E.H.; Bernier, P.Y.; Kurz, W.A.; Guo, X.J.; Cyr, G. Negative impacts of high temperatures on growth of black spruce forests intensify with the anticipated climate warming. Glob. Change Biol. 2016, 22, 627–643. [Google Scholar] [CrossRef] [PubMed]
- Sun, Q.; Miao, C.; Duan, Q. Extreme climate events and agricultural climate indices in China: CMIP5 model evaluation and projections. Int. J. Climatol. 2016, 36, 43–61. [Google Scholar] [CrossRef]
- Meng, F.; Felton, A.J.; Mao, J.; Cong, N.; Smith, W.K.; Körner, C.; Hu, Z.; Hong, S.; Knott, J.; Yan, Y.; et al. Consistent time allocation fraction to vegetation green-up versus senescence across northern ecosystems despite recent climate change. Sci. Adv. 2024, 10, eadn2487. [Google Scholar] [CrossRef]
- Yu, Z.; Sun, P.; Liu, S.; Wang, J.; Everman, A. Sensitivity of large-scale vegetation greenup and dormancy dates to climate change in the north−south transect of eastern China. Int. J. Remote Sens. 2013, 34, 7312–7328. [Google Scholar] [CrossRef]
- Martonne, M.E. Aresime et indice d’ aritile. Compt. Rend. Acad. Sci. 1926, 182, 1395–1398. Available online: https://cir.nii.ac.jp/crid/1572824500352580096.bib?lang=en (accessed on 6 December 2024).
- Quan, C.; Han, S.; Utescher, T.; Zhang, C.; Liu, Y.-S.(C.). Validation of temperature–precipitation based aridity index: Paleoclimatic implications. Palaeogeogr. Palaeoclim. Palaeoecol. 2013, 386, 86–95. [Google Scholar] [CrossRef]
- Baltas, E. Spatial distribution of climatic indices in northern Greece. Meteorol. Appl. 2007, 14, 69–78. [Google Scholar] [CrossRef]
- Running, S.; Zhao, M. MODIS/Terra Net Primary Production Gap-Filled Yearly L4 Global 500m SIN Grid V061; NASA EOSDIS Land Processes Distributed Active Archive Center: Sioux Falls, SD, USA, 2021. [Google Scholar]
- Chen, Y.; Feng, X.; Fu, B.; Ma, H.; Zohner, C.M.; Crowther, T.W.; Huang, Y.; Wu, X.; Wei, F. Maps with 1 km resolution reveal increases in above- and belowground forest biomass carbon pools in China over the past 20 years. Earth Syst. Sci. Data 2023, 15, 897–910. [Google Scholar] [CrossRef]
- Bürkner, P.-C. brms: An R Package for Bayesian Multilevel Models Using Stan. J. Stat. Softw. 2017, 80, 1–28. [Google Scholar] [CrossRef]
- Gao, Z.; Pan, Y.; Song, K.; Yang, Y.; Zhuge, M.; Wu, T.; Xia, T.; Hu, Y.; Da, L.; Cieraad, E. Response and sensitivity of urban plants with different seed dispersal modes. Nat. Cities 2024, 2, 28–37. [Google Scholar] [CrossRef]
- Chuine, I. Why does phenology drive species distribution? Philos. Trans. R. Soc. B Biol. Sci. 2010, 365, 3149–3160. [Google Scholar] [CrossRef]
- Chen, X.; Chen, H.Y.H. Plant diversity loss reduces soil respiration across terrestrial ecosystems. Glob. Change Biol. 2019, 25, 1482–1492. [Google Scholar] [CrossRef]
- Wang, J.; Hua, H.; Guo, J.; Huang, X.; Zhang, X.; Yang, Y.; Wang, D.; Guo, X.; Zhang, R.; Smith, N.G.; et al. Late spring frost delays tree spring phenology by reducing photosynthetic productivity. Nat. Clim. Chang. 2025, 15, 201–209. [Google Scholar] [CrossRef]
- Piao, S.; Friedlingstein, P.; Ciais, P.; Viovy, N.; Demarty, J. Growing season extension and its impact on terrestrial carbon cycle in the Northern Hemisphere over the past 2 decades. Glob. Biogeochem. Cycles 2007, 21, 1–11. [Google Scholar] [CrossRef]
- McDonald, K.C.; Kimball, J.S.; Njoku, E.; Zimmermann, R.; Zhao, M. Variability in Springtime Thaw in the Terrestrial High Latitudes: Monitoring a Major Control on the Biospheric Assimilation of Atmospheric CO2 with Spaceborne Microwave Remote Sensing. Earth Interact. 2004, 8, 1–23. [Google Scholar] [CrossRef]
- Henderson, G.S. Soil Organic Matter: A Link Between Forest Management and Productivity. In Carbon Forms and Functions in Forest Soils; Soil Science Society of America: Madison, WI, USA, 2006; pp. 419–435. [Google Scholar] [CrossRef]
- Paul, E.A. The nature and dynamics of soil organic matter: Plant inputs, microbial transformations, and organic matter stabilization. Soil. Biol. Biochem. 2016, 98, 109–126. [Google Scholar] [CrossRef]
- Euskirchen, E.S.; McGuire, A.D.; Kicklighter, D.W.; Zhuang, Q.; Clein, J.S.; Dargaville, R.J.; Dye, D.G.; Kimball, J.S.; McDonald, K.C.; Melillo, J.M.; et al. Importance of recent shifts in soil thermal dynamics on growing season length, productivity, and carbon sequestration in terrestrial high-latitude ecosystems. Glob. Change Biol. 2006, 12, 731–750. [Google Scholar] [CrossRef]
- Mathur, S.; Agrawal, D.; Jajoo, A. Photosynthesis: Response to high temperature stress. J. Photochem. Photobiol. B 2014, 137, 116–126. [Google Scholar] [CrossRef]
- Dusenge, M.E.; Duarte, A.G.; Way, D.A. Plant carbon metabolism and climate change: Elevated CO2 and temperature impacts on photosynthesis, photorespiration and respiration. New Phytol. 2019, 221, 32–49. [Google Scholar] [CrossRef]
- Jackson, R.B.; Lechowicz, M.J.; Li, X.; Mooney, H.A. Phenology, Growth, and Allocation in Global Terrestrial Productivity. In Terrestrial Global Productivity; Elsevier: Amsterdam, The Netherlands, 2001; pp. 61–82. [Google Scholar] [CrossRef]
- Han, Q. Remote sensing-based quantification of spatial variation in canopy phenology of four dominant tree species in Europe. J. Appl. Remote Sens. 2013, 7, 073485. [Google Scholar] [CrossRef]
- Klein, T.; Vitasse, Y.; Hoch, G. Coordination between growth, phenology and carbon storage in three coexisting deciduous tree species in a temperate forest. Tree Physiol. 2016, 36, 847–855. [Google Scholar] [CrossRef]
- Raich, J.W.; Russell, A.E.; Kitayama, K.; Parton, W.J.; Vitousek, P.M. Temperature Influences Carbon Accumulation in Moist Tropical Forests. Ecology 2006, 87, 76–87. [Google Scholar] [CrossRef] [PubMed]
- Smith, B.; Prentice, I.C.; Sykes, M.T. Representation of vegetation dynamics in the modelling of terrestrial ecosystems: Comparing two contrasting approaches within European climate space. Glob. Ecol. Biogeogr. 2001, 10, 621–637. [Google Scholar] [CrossRef]
- Dusenge, M.E.; Wittemann, M.; Mujawamariya, M.; Ntawuhiganayo, E.B.; Zibera, E.; Ntirugulirwa, B.; Way, D.A.; Nsabimana, D.; Uddling, J.; Wallin, G. Limited thermal acclimation of photosynthesis in tropical montane tree species. Glob. Change Biol. 2021, 27, 4860–4878. [Google Scholar] [CrossRef]
- De Frenne, P.; Lenoir, J.; Luoto, M.; Scheffers, B.R.; Zellweger, F.; Aalto, J.; Ashcroft, M.B.; Christiansen, D.M.; Decocq, G.; De Pauw, K.; et al. Forest microclimates and climate change: Importance, drivers and future research agenda. Glob. Change Biol. 2021, 27, 2279–2297. [Google Scholar] [CrossRef]
- Prado-Junior, J.A.; Schiavini, I.; Vale, V.S.; Arantes, C.S.; van der Sande, M.T.; Lohbeck, M.; Poorter, L. Conservative species drive biomass productivity in tropical dry forests. J. Ecol. 2016, 104, 817–827. [Google Scholar] [CrossRef]
- Lohbeck, M.; Poorter, L.; Martínez-Ramos, M.; Bongers, F. Biomass is the main driver of changes in ecosystem process rates during tropical forest succession. Ecology 2015, 96, 1242–1252. [Google Scholar] [CrossRef] [PubMed]
- Rozendaal, D.M.A.; Chazdon, R.L. Demographic drivers of tree biomass change during secondary succession in northeastern Costa Rica. Ecol. Appl. 2015, 25, 506–516. [Google Scholar] [CrossRef]
- Ameray, A.; Bergeron, Y.; Valeria, O.; Girona, M.M.; Cavard, X. Forest Carbon Management: A Review of Silvicultural Practices and Management Strategies Across Boreal, Temperate and Tropical Forests. Curr. For. Rep. 2021, 7, 245–266. [Google Scholar] [CrossRef]
- Chisholm, R.A.; Muller-Landau, H.C.; Abdul Rahman, K.; Bebber, D.P.; Bin, Y.; Bohlman, S.A.; Bourg, N.A.; Brinks, J.; Bunyavejchewin, S.; Butt, N.; et al. Scale-dependent relationships between tree species richness and ecosystem function in forests. J. Ecol. 2013, 101, 1214–1224. [Google Scholar] [CrossRef]
- Gough, C.M.; Curtis, P.S.; Hardiman, B.S.; Scheuermann, C.M.; Bond-Lamberty, B. Disturbance, complexity, and succession of net ecosystem production in North America’s temperate deciduous forests. Ecosphere 2016, 7, e01375. [Google Scholar] [CrossRef]
- Dong, L.; Jin, X.; Pukkala, T.; Li, F.; Liu, Z. How to manage mixed secondary forest in a sustainable way? Eur. J. For. Res. 2019, 138, 789–801. [Google Scholar] [CrossRef]
- Zhang, S.; Xu, H.; Liu, A.; Qi, S.; Hu, B.; Huang, M.; Luo, J. Mapping of secondary forest age in China using stacked generalization and Landsat time series. Sci. Data 2024, 11, 302. [Google Scholar] [CrossRef]
- Hardiman, B.S.; Gough, C.M.; Halperin, A.; Hofmeister, K.L.; Nave, L.E.; Bohrer, G.; Curtis, P.S. Maintaining high rates of carbon storage in old forests: A mechanism linking canopy structure to forest function. For. Ecol. Manag. 2013, 298, 111–119. [Google Scholar] [CrossRef]
- He, N.; Wen, D.; Zhu, J.; Tang, X.; Xu, L.; Zhang, L.; Hu, H.; Huang, M.; Yu, G. Vegetation carbon sequestration in Chinese forests from 2010 to 2050. Glob. Change Biol. 2017, 23, 1575–1584. [Google Scholar] [CrossRef]
- Niu, S.; Chen, W.; Liáng, L.L.; Sierra, C.A.; Xia, J.; Wang, S.; Heskel, M.; Patel, K.F.; Bond-Lamberty, B.; Wang, J.; et al. Temperature responses of ecosystem respiration. Nat. Rev. Earth Environ. 2024, 5, 559–571. [Google Scholar] [CrossRef]
- Chen, N.; Zhang, Y.; Song, C.; Xu, M.; Zhang, T.; Li, M.; Cong, N.; Zu, J.; Zheng, Z.; Ma, G.; et al. The chained effects of earlier vegetation activities and summer droughts on ecosystem productivity on the Tibetan Plateau. Agric. For. Meteorol. 2022, 321, 108975. [Google Scholar] [CrossRef]
- Yuan, M.; Zhu, Q.; Zhang, J.; Liu, J.; Chen, H.; Peng, C.; Li, P.; Li, M.; Wang, M.; Zhao, P. Global response of terrestrial gross primary productivity to climate extremes. Sci. Total Environ. 2021, 750, 142337. [Google Scholar] [CrossRef]
- Zhao, M.; Running, S.W. Drought-Induced Reduction in Global Terrestrial Net Primary Production from 2000 Through 2009. Science 2010, 329, 940–943. [Google Scholar] [CrossRef] [PubMed]
- Chen, T.; Werf, G.R.; Jeu, R.A.M.; Wang, G.; Dolman, A.J. A global analysis of the impact of drought on net primary productivity. Hydrol. Earth Syst. Sci. 2013, 17, 3885–3894. [Google Scholar] [CrossRef]
- Saxe, H.; Cannell, M.G.R.; Johnsen, Ø.; Ryan, M.G.; Vourlitis, G. Tree and forest functioning in response to global warming. New Phytol. 2001, 149, 369–399. [Google Scholar] [CrossRef]
- Öquist, G. Effects of low temperature on photosynthesis. Plant Cell Environ. 1983, 6, 281–300. [Google Scholar] [CrossRef]
- Berry, J.; Bjorkman, O. Photosynthetic Response and Adaptation to Temperature in Higher Plants. Annu. Rev. Plant Physiol. 1980, 31, 491–543. [Google Scholar] [CrossRef]
- Walther, G.R.; Post, E.; Convey, P.; Menzel, A.; Parmesan, C.; Beebee, T.J.; Fromentin, J.M.; Hoegh-Guldberg, O.; Bairlein, F. Ecological responses to recent climate change. Nature 2002, 416, 389–395. [Google Scholar] [CrossRef]
- Toledo, M.; Poorter, L.; Peña-Claros, M.; Alarcón, A.; Balcázar, J.; Leaño, C.; Licona, J.C.; Llanque, O.; Vroomans, V.; Zuidema, P.; et al. Climate is a stronger driver of tree and forest growth rates than soil and disturbance. J. Ecol. 2011, 99, 254–264. [Google Scholar] [CrossRef]
- Zhang, H.; Chuine, I.; Regnier, P.; Ciais, P.; Yuan, W. Deciphering the multiple effects of climate warming on the temporal shift of leaf unfolding. Nat. Clim. Chang. 2022, 12, 193–199. [Google Scholar] [CrossRef]
- James, M.D.M.; Morison, I.L. Plant Growth and Climate Change; Wiley: Hoboken, NJ, USA, 2006. [Google Scholar] [CrossRef]
- Pankasem, N.; Hsu, P.; Lopez, B.N.K.; Franks, P.J.; Schroeder, J.I. Warming triggers stomatal opening by enhancement of photosynthesis and ensuing guard cell CO2 sensing, whereas higher temperatures induce a photosynthesis-uncoupled response. New Phytol. 2024, 244, 1847–1863. [Google Scholar] [CrossRef] [PubMed]
- Crous, K.Y.; Uddling, J.; De Kauwe, M.G. Temperature responses of photosynthesis and respiration in evergreen trees from boreal to tropical latitudes. New Phytol. 2022, 234, 353–374. [Google Scholar] [CrossRef] [PubMed]
Disclaimer/Publisher’s Note: The statements, opinions and data contained in all publications are solely those of the individual author(s) and contributor(s) and not of MDPI and/or the editor(s). MDPI and/or the editor(s) disclaim responsibility for any injury to people or property resulting from any ideas, methods, instructions or products referred to in the content. |
© 2025 by the authors. Licensee MDPI, Basel, Switzerland. This article is an open access article distributed under the terms and conditions of the Creative Commons Attribution (CC BY) license (https://creativecommons.org/licenses/by/4.0/).