Article

Size Composition, Stability, and Distribution of Metal Nutrient Elements of Soil Aggregates of Eucalyptus Plantations with Different Thinning Intensities

1
Guangxi Key Laboratory of Forest Ecology and Conservation, College of Forestry, Guangxi University, Nanning 530004, China
2
Guangxi Colleges and Key Laboratory for Cultivation and Utilization of Subtropical Forest Plantation, College of Forestry, Guangxi University, Nanning 530004, China
*
Author to whom correspondence should be addressed.
Forests 2025, 16(4), 609; https://doi.org/10.3390/f16040609
Submission received: 30 January 2025 / Revised: 23 March 2025 / Accepted: 26 March 2025 / Published: 30 March 2025
(This article belongs to the Section Forest Soil)

Abstract

:
Eucalyptus plantations suffer from soil degradation and reduced productivity due to short rotation cycles and multiple generations of replanting. This study investigated the effects of different thinning intensities (CK, 30%, 45%, and 60%) on the size composition, stability, and distribution of metal nutrient elements (K, Ca, Mg, Fe, Mn, Cu, and Zn) of soil aggregates in Eucalyptus plantations by collecting 0–20 cm soil samples and using the dry-sieving method to separate soil aggregates into four sizes (>2 mm, 1–2 mm, 0.25–1 mm, and <0.25 mm). Our findings were as follows: (1) The majority of aggregates comprised larger sizes, predominantly exceeding 2 mm in diameter, which were the most abundant. (2) Compared with unthinned stands (CK) and stands that were thinned by 30%, those thinned by 45% and 60% demonstrated enhanced soil aggregate stability. (3) The stands that were thinned by 30% had the highest Mg and Fe content, whereas those that were thinned by 45% contained the highest levels of Ca, Mn, Cu, and Zn. Larger aggregates (>2 mm) harbored the greatest quantities of metal nutrients, whereas smaller aggregates (<0.25 mm) stored the least. (4) The primary determinants of the metal nutrient content were the soil’s pH and organic carbon levels. (5) The distribution of aggregate sizes played a pivotal role in influencing the nutrient reserves within the aggregates. Overall, this study demonstrated that the thinning intensity not only impacts the stability of soil aggregates in Eucalyptus plantations, but also influences the accumulation of metal nutrient elements within these aggregates, which confirms the significance of macroaggregates as a reservoir for metal nutrient elements. To preserve and enhance soil macroaggregates, it is recommended to implement measures such as reducing the amount of mechanical disturbance, increasing the amount of organic matter, optimizing the stand structure, mitigating water erosion risks, and promoting biological activity while conducting regular assessments of the aggregate stability.

1. Introduction

Eucalyptus trees are widely planted in south China due to their strong adaptability, fast growth, versatile use, and high economic value. However, current management practices in Eucalyptus plantations in China primarily focus on economic benefits, with short harvesting cycles [1]. Eucalyptus plantations face soil fertility decline mainly due to imbalanced fertilization, soil structural damage from slash-and-burn clearing and comprehensive tillage, insufficient nutrient cycling caused by short rotation periods, scarce litter input coupled with intensified surface erosion during rainy seasons, and insufficient soil recovery time—all accelerating land productivity depletion [2]. Therefore, maintaining the nutrient-carrying capacity of Eucalyptus forest lands, controlling soil and nutrient loss, and improving the soil’s structure and function are crucial.
Soil aggregates are the basic units of soil structure, significantly impacting the soil quality and fertility of plantations [3,4,5]. Tree species [6], forest ages [7], and management practices [8,9] have varying effects on soil aggregates in plantations. Compared with secondary forests, red pine plantations show a decrease in macroaggregates and an increase in microaggregates [10]. Studies have indicated that the soil aggregate stability in natural forests is usually higher than in plantations, mainly due to differences in organic matter content and soil structure [11,12]. A higher forest age generally enhances the proportion of soil macroaggregates, which correlates with increased organic matter input [13,14,15]. Mixed forests generally exhibit higher soil aggregate stability, whereas, in plantations, aggregate stability indicators also correlate positively with soil organic matter [16,17,18]. Human disturbances such as changes in land use reduce the soil aggregate stability [19,20], but appropriate afforestation can improve it because of an increased proportion of soil macroaggregates [21]. Additionally, soil aggregates act as nutrient storage units. The nutrient storage in soil aggregates is influenced by the tree species [22]; larger aggregates are typically rich in organic carbon and nutrients [23,24]. The current research on soil aggregates in plantations primarily focuses on carbon, nitrogen, and phosphorus [23,25], with limited studies on metal nutrient elements. Organic matter and inorganic colloids (such as montmorillonite, illite, and iron oxides) in soil aggregates are rich in metal elements, playing essential roles in aggregate formation and nutrient maintenance [26,27,28,29,30,31]. Nevertheless, research on the distribution and reserves of metal nutrients in soil aggregates of plantations remains scarce.
Thinning is a key measure for maintaining productivity in artificial Eucalyptus forests. Proper thinning not only promotes tree growth [32], improves the habitat [33], and adjusts the species composition [34] but also enables early utilization [35] and improves forest health [36,37,38]. Moderate thinning operations in Eucalyptus plantations have been proven to significantly enhance the soil’s water use efficiency, potentially due to reduced rainfall interception and weakened transpiration [29]. Thinning can also effectively increase the light intensity within the forest, promoting an increase in soil temperature [36]. High-intensity thinning in Chinese fir plantations significantly increases the soil’s porosity and moisture content, thereby optimizing the soil structure and enhancing its water-holding capacity. Thinning also stimulates the growth of fine roots of trees and increases the fine root biomass, which aids in the accumulation of essential nutrients such as N, P, and K and the enhancement of organic matter content in the soil [37]. Thinning improves nutrient utilization in understory soil, as the wooden residues with a high carbon-to-nitrogen ratio in thinned residues compensate for the loss of some organic matter in the thinned forests [38]. Thinning can enhance biological nitrogen fixation and increase the active nitrogen content [39]. The buffering capacity provided by the regeneration of understory vegetation can mitigate soil acidification [40]. These changes in environmental factors further affect enzyme activities in the soil by enhancing acid phosphatase and urease activities [41], for example, but potentially decreasing the invertase activity [42]. Under thinning conditions, the competition for water and available nitrogen sources between trees and soil microorganisms decreases, leading to increased available nitrogen content, promoting microbial proliferation, and enhancing the soil microbial biomass [43]. Thinning also affects the diversity and structure of the microbial communities in soil [44]. These changes are not only closely related to nutrient cycling within the soil but are also jointly influenced by seasonal variations and regional characteristics, exhibiting diverse response patterns and complex ecological interactions.
Currently, research on the effects of thinning on soil aggregates is limited. Thinning typically reduces the forest density. Pine plantations with different densities show that the forest density significantly affects the fractal dimension of soil aggregates [45]. The number of 0.25–2 mm aggregates in original beech forests is significantly higher than in unthinned pine forests. Large aggregates decrease with unthinned pines, accompanied by a decrease in the organic carbon content [46]. In a study conducted in the Three Gorges Reservoir area of China, water-stable aggregates in the 0.25–2 mm size range constituted the highest proportion across all intensities of thinning treatment, with the soil’s organic carbon being primarily concentrated in macroaggregates [47]. Different thinning intensities also led to variations in the stability and nutrient status of soil aggregates. An increased density leads to lower aggregate stability indices, with lower-density forests exhibiting better soil aggregate stability. For instance, in the Dahurian larch forests of the Greater Khingan Mountains, a 30% thinning intensity showed superior soil aggregate stability compared with 10% and 20% thinning intensities [48]. However, high-intensity harvesting may have negative impacts. A study on pure Korean pine forests in North China found that under light density management, the mean weight diameter (MWD) and geometric mean diameter (GMD) were the highest, whereas under heavy management, they were the lowest. The MWD and GMD can reflect the quality of the soil structure, with larger values indicating better soil structure stability. Therefore, it can be inferred that stands under light density management will have better soil aggregate stability than those under heavy density management. Furthermore, moderate density management resulted in the highest organic carbon, total nitrogen, and total phosphorus content in soil aggregates [49]. Although numerous studies on the effects of thinning on the size [50], proportion [51], stability [52], organic carbon, and nutrient distribution [49] of soil aggregates in plantations have been conducted, the impacts on the metal nutrient element content and reserves remain unclear. Therefore, understanding the effects of thinning on soil aggregates is crucial for scientifically evaluating nutrient cycling and soil fertility in plantation forests.
This study selected four thinning intensities (no thinning, 30%, 45%, and 60%) in Eucalyptus plantations to investigate (1) the soil aggregate composition and stability in stands with different thinning intensities; (2) the distribution of metal nutrient content and reserves in soil aggregates under different thinning intensities; and (3) the relationships between the stand, soil, aggregate factors, and nutrient features. We hypothesized that the thinning intensity not only impacts the stability of soil aggregates in Eucalyptus plantations but also influences the accumulation of metal nutrient elements within these aggregates.

2. Materials and Methods

2.1. Study Area

The experimental site is located at Xinqiao Substation of Qipo Forest Farm, Guangxi Zhuang Autonomous Region, China, situated between 108°43′ E and 108°44′ E and 23°37′ N and 23°38′ N. The area has a humid subtropical monsoon climate with abundant summer rainfall, ample sunshine, moderate temperatures, and a long summer and short winter. Frost is rare, and snowfall does not occur. The average annual temperature is 21.4 °C, with a maximum summer temperature of 39.0 °C and a minimum winter temperature of −2.2 °C. The annual average rainfall reaches about 1300.0 mm, with an average relative humidity of 80.0%. The area accumulates over 300 days per year with a daily average temperature above 10 °C, totaling 7200 °C in accumulated temperature. The soils predominantly consist of Acrisol [53] soils derived from granite, with a soil depth ranging from 80 to 90 cm. These soils have undergone prolonged and intense leaching processes, resulting in low available nutrient content and pH levels between 4.0 and 5.0. Due to their susceptibility to weathering, primary minerals are thoroughly decomposed under leaching effects and gradually transformed into secondary minerals. Leaching also leads to distinct stratification within the soil profile. However, long-term and frequent forest management activities have caused obscured boundaries between these layers. The understory vegetation in the experimental forests is diverse, with predominantly herbaceous species, including Misscanthus floridulus, Microlepia hancei, and Pteris semipinnata. Shrubs include Cunninghamia lanceolata, Rubus cochinchinensis, Magnolia sumatrana, Mytilaria laosensis, and Maesa japonica.

2.2. Experimental Methods

2.2.1. Plot Setup

Eucalyptus urophylla × E. grandis DH32-28 plantations were established in June 2008 with a planting density of 1380 trees/ha. In June 2013, sprout management was conducted after clear-cutting, retaining one sprout per stump. Annual fertilization of 0.5 kg NPK compound fertilizer per tree was applied every June. Thinning was carried out in March 2018 using the low thinning method, targeting slow-growing, small-diameter, and poorly formed trees in the lower canopy, while ensuring a uniform retention spacing. This study included thinning intensities of 30% (retaining 966 trees/ha), 45% (retaining 759 trees/ha), 60% (retaining 552 trees/ha), and a control (CK, 1380 trees/ha). The intensity gradients of 30%, 45%, and 60% were chosen to cover a range of impacts from low to high and to comprehensively assess the combined effects of different thinning intensities on tree growth, biodiversity, and ecological functions. Each thinning treatment was replicated three times, with one 20 m × 20 m plot being established in uphill, mid-slope, and downhill positions, totaling 12 plots. The plot details are summarized in Table 1. Surveys and soil sampling were conducted in July 2023.

2.2.2. Sample Collection

Within each plot, three sampling points were established diagonally, from top to bottom, with one sample being taken at each end of the diagonal and one at the intersection. Soil profiles were excavated using a shovel, and undisturbed soil samples from the surface layer (0–20 cm) were collected using soil core samplers (100 cm3) to measure physical properties such as bulk density and moisture content. Additionally, PVC tubes (20 cm high, 10 cm diameter) were vertically inserted into the soil to collect soil samples from a 0 to 20 cm depth for the soil aggregate analysis using the dry-sieving method. Another portion of soil samples (500 g) was collected, air-dried under natural conditions, ground, and sieved through a 0.25 mm sieve for chemical nutrient analysis.

2.2.3. Sample Analysis

(1)
Analysis of physical and chemical properties of soil and aggregates
The physical and chemical properties of the soil and aggregates were determined according to the “Methods of Soil Agricultural Chemistry Analysis” [54]. The soil moisture content was measured by the drying method, bulk density, macroporosity, microporosity, and total porosity using the soil core sampler method. The total organic carbon in the soil and aggregates was determined using the potassium dichromate oxidation method, total nitrogen by the Kjeldahl method, total phosphorus using the concentrated sulfuric acid–potassium persulfate digestion–molybdenum antimony colorimetric method, nitrate nitrogen by the phenol disulfonic acid colorimetric method, ammonium nitrogen using the indophenol blue colorimetric method, and available phosphorus by the sodium bicarbonate extraction–molybdenum antimony colorimetric method. The physicochemical characteristics of the soil and aggregates are presented in Table 2 and Table 3, respectively.
(2)
Soil aggregate size composition
The dry-sieving method was used to determine the size distribution and stability of the aggregates [55]. The air-dried soil sample was poured into a set of soil sieves. The sieves were arranged with decreasing pore sizes from top to bottom: 2.00 mm, 1.00 mm, 0.25 mm, and a bottom sieve collecting aggregates smaller than 0.25 mm. The sieving was carried out using a mechanical shaker with a constant vibration frequency, amplitude, and time, ensuring that soil particles of different sizes fell onto the corresponding sieve surfaces. This resulted in the separation of aggregates into sizes of >2 mm, 0.25–1 mm, 1–2 mm, and <0.25 mm. The mass of each fraction was then weighed and recorded.
(3)
Soil aggregate stability
The mean weight diameter (MWD) and geometric mean diameter (GMD) were selected as the evaluation indices for the soil aggregate stability [56]. The calculation formulas are as follows:
M W D = i = 1 n X ¯ i W i
G M D = e x p i = 1 n W i l n X ¯ i / i = 1 n W i
In these formulas, X ¯ i represents the average diameter (mm) of each aggregate size, while W i represents the mass percentage (%) of each aggregate size.
(4)
Determination of metal nutrient elements
Soil aggregate samples were dried to a constant weight in an oven at 65 °C and then grounded and sieved through a 100-mesh screen for the metal nutrient element analysis. The K content was determined using the hydrofluoric acid–perchloric acid digestion method [39]. The content of Ca, Mg, Fe, Mn, Cu, and Zn were determined by means of the hydrofluoric acid–nitric acid–perchloric acid digestion method [54]. The calculation formula for the storage of each metal nutrient element in the soil aggregates [43] is as follows:
R e s e r v e   o f   a   m e t a l   n u t r i e n t   e l e m e n t g   o r   m g / m 2 = i = 1 n W i × C i   ×   B d × H × 10
In this formula, Ci represents the metal nutrient element content (g/kg or mg/kg) of the i-th aggregate size, Bd denotes the soil bulk density (g/cm3), and H represents the soil layer thickness (cm), which was 20 cm in this study.
The calculation formula for the contribution rate of each aggregate size to the reserve of seven elements is provided in reference [57].
C o n t r i b u t i o n   r a t e   o f   a n   a g g r e g a t e   s i z e   t o   a n   e l e m e n t % = R e s e r v e   o f   t h i s   e l e m e n t   i n   t h e   a g g r e g a t e   s i z e R e s e r v e   o f   t h i s   e l e m e n t   i n   t h e   s o i l   l a y e r × 100
The relative proportion (%) was used to compare the differences in the reserves of various metal nutrient elements within the same sample. The calculation formula is as follows:
P r o p o r t i o n   o f   a n   e l e m e n t   r e s e r v e   ( % ) = R e s e r v e   o f   t h i s   e l e m e n t   i n   t h e   s a m p l e T o t a l   r e s e r v e   o f   7   e l e m e n t s   i n   t h e   s a m p l e × 100

2.2.4. Data Statistics and Analysis

Data on stand factors and the soil’s physicochemical properties, aggregate composition, aggregate stability, aggregate metal nutrient element contents, and storage were organized using Excel 2010. A one-way ANOVA was performed on these data using SPSS 20.0. Duncan’s multiple comparison test was applied to assess differences in metal nutrient element content and storage under different thinning intensities and aggregate sizes. Selected stand factors (tree height, diameter at breast height, and tree density) related to aggregate formation and stability, soil factors (bulk density, porosity, moisture content, organic carbon, and pH), and aggregate factors (size, size proportion, stability indices, moisture content, organic carbon, and pH) were chosen as candidate factors for the redundancy analysis (RDA). Factors with high explanatory power and statistical significance were selected from these for plotting in the RDA, which was performed using Canoco 5.0 to generate diagrams.

3. Results

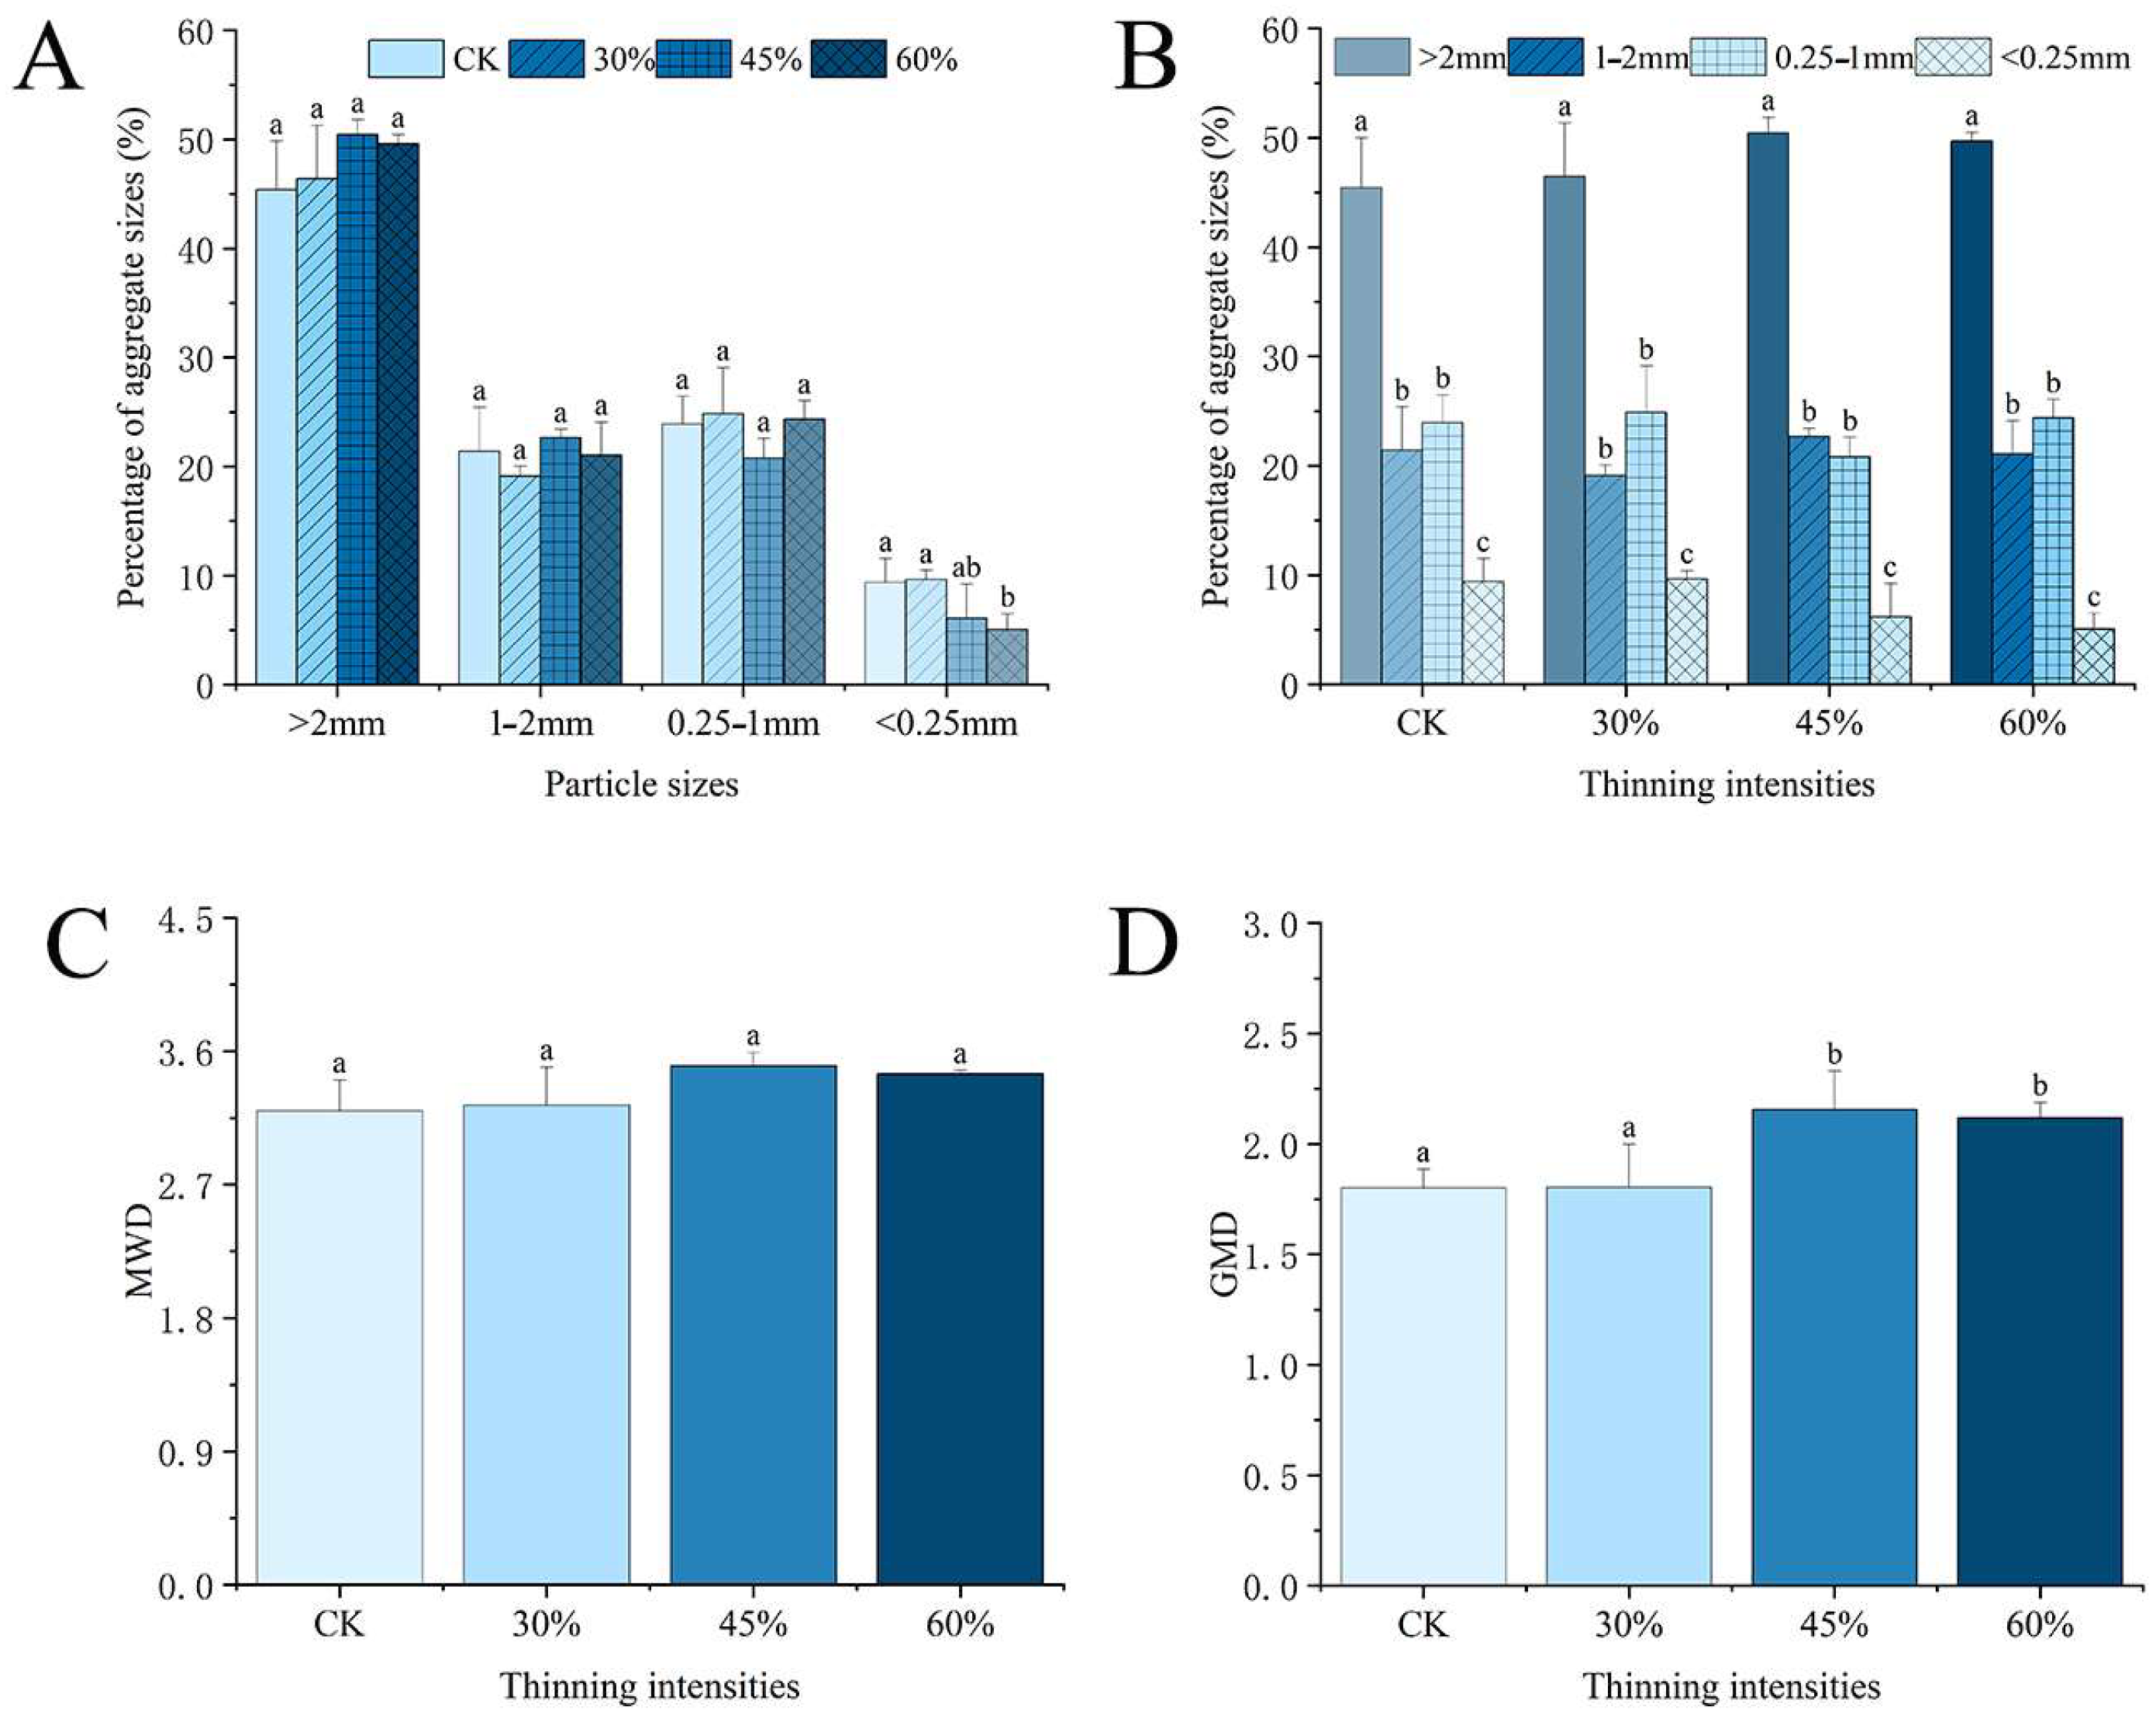
3.1. Composition and Stability of Soil Aggregates

Except for the significantly higher proportion of <0.25 mm aggregates in the control (CK) and 30% thinning stands compared with the 60% thinning stands, there were no significant differences in the proportions of other aggregate sizes among the differently thinned stand types (Figure 1A). There were significant differences in the proportions of aggregates with different sizes within each thinned stand type (Figure 1B). For all stands, the proportion of >2 mm aggregates was significantly higher than that of other aggregate sizes, while the proportion of <0.25 mm aggregates was significantly lower. The proportions of the other two aggregate sizes fell between these two extremes. In summary, the thinning intensity had no significant effect on the size composition of the soil aggregates. However, large aggregates with a size of >0.25 mm, especially those with a size of 2 mm, dominated in all stands.
The MWD index of the soil aggregates ranged from 3.201 to 3.502, while the GWD index ranged from 1.807 to 2.163. For both indices, the order from highest to lowest was 45% > 60% > 30% > CK. There was no significant difference in the MWD index of the soil aggregates between stands with different thinning intensities (Figure 1C), but there was a significant difference in the GWD index (Figure 1D). The difference in GWD index was not significant between the 45% and 60% thinning stands, nor was it between the 30% thinning and CK stands. However, the former two were significantly higher than the latter two. Based on our comprehensive analysis of the two indices, the stability of soil aggregates in stands with 45% and 60% thinning was higher than that in the CK and 30% thinning stands.

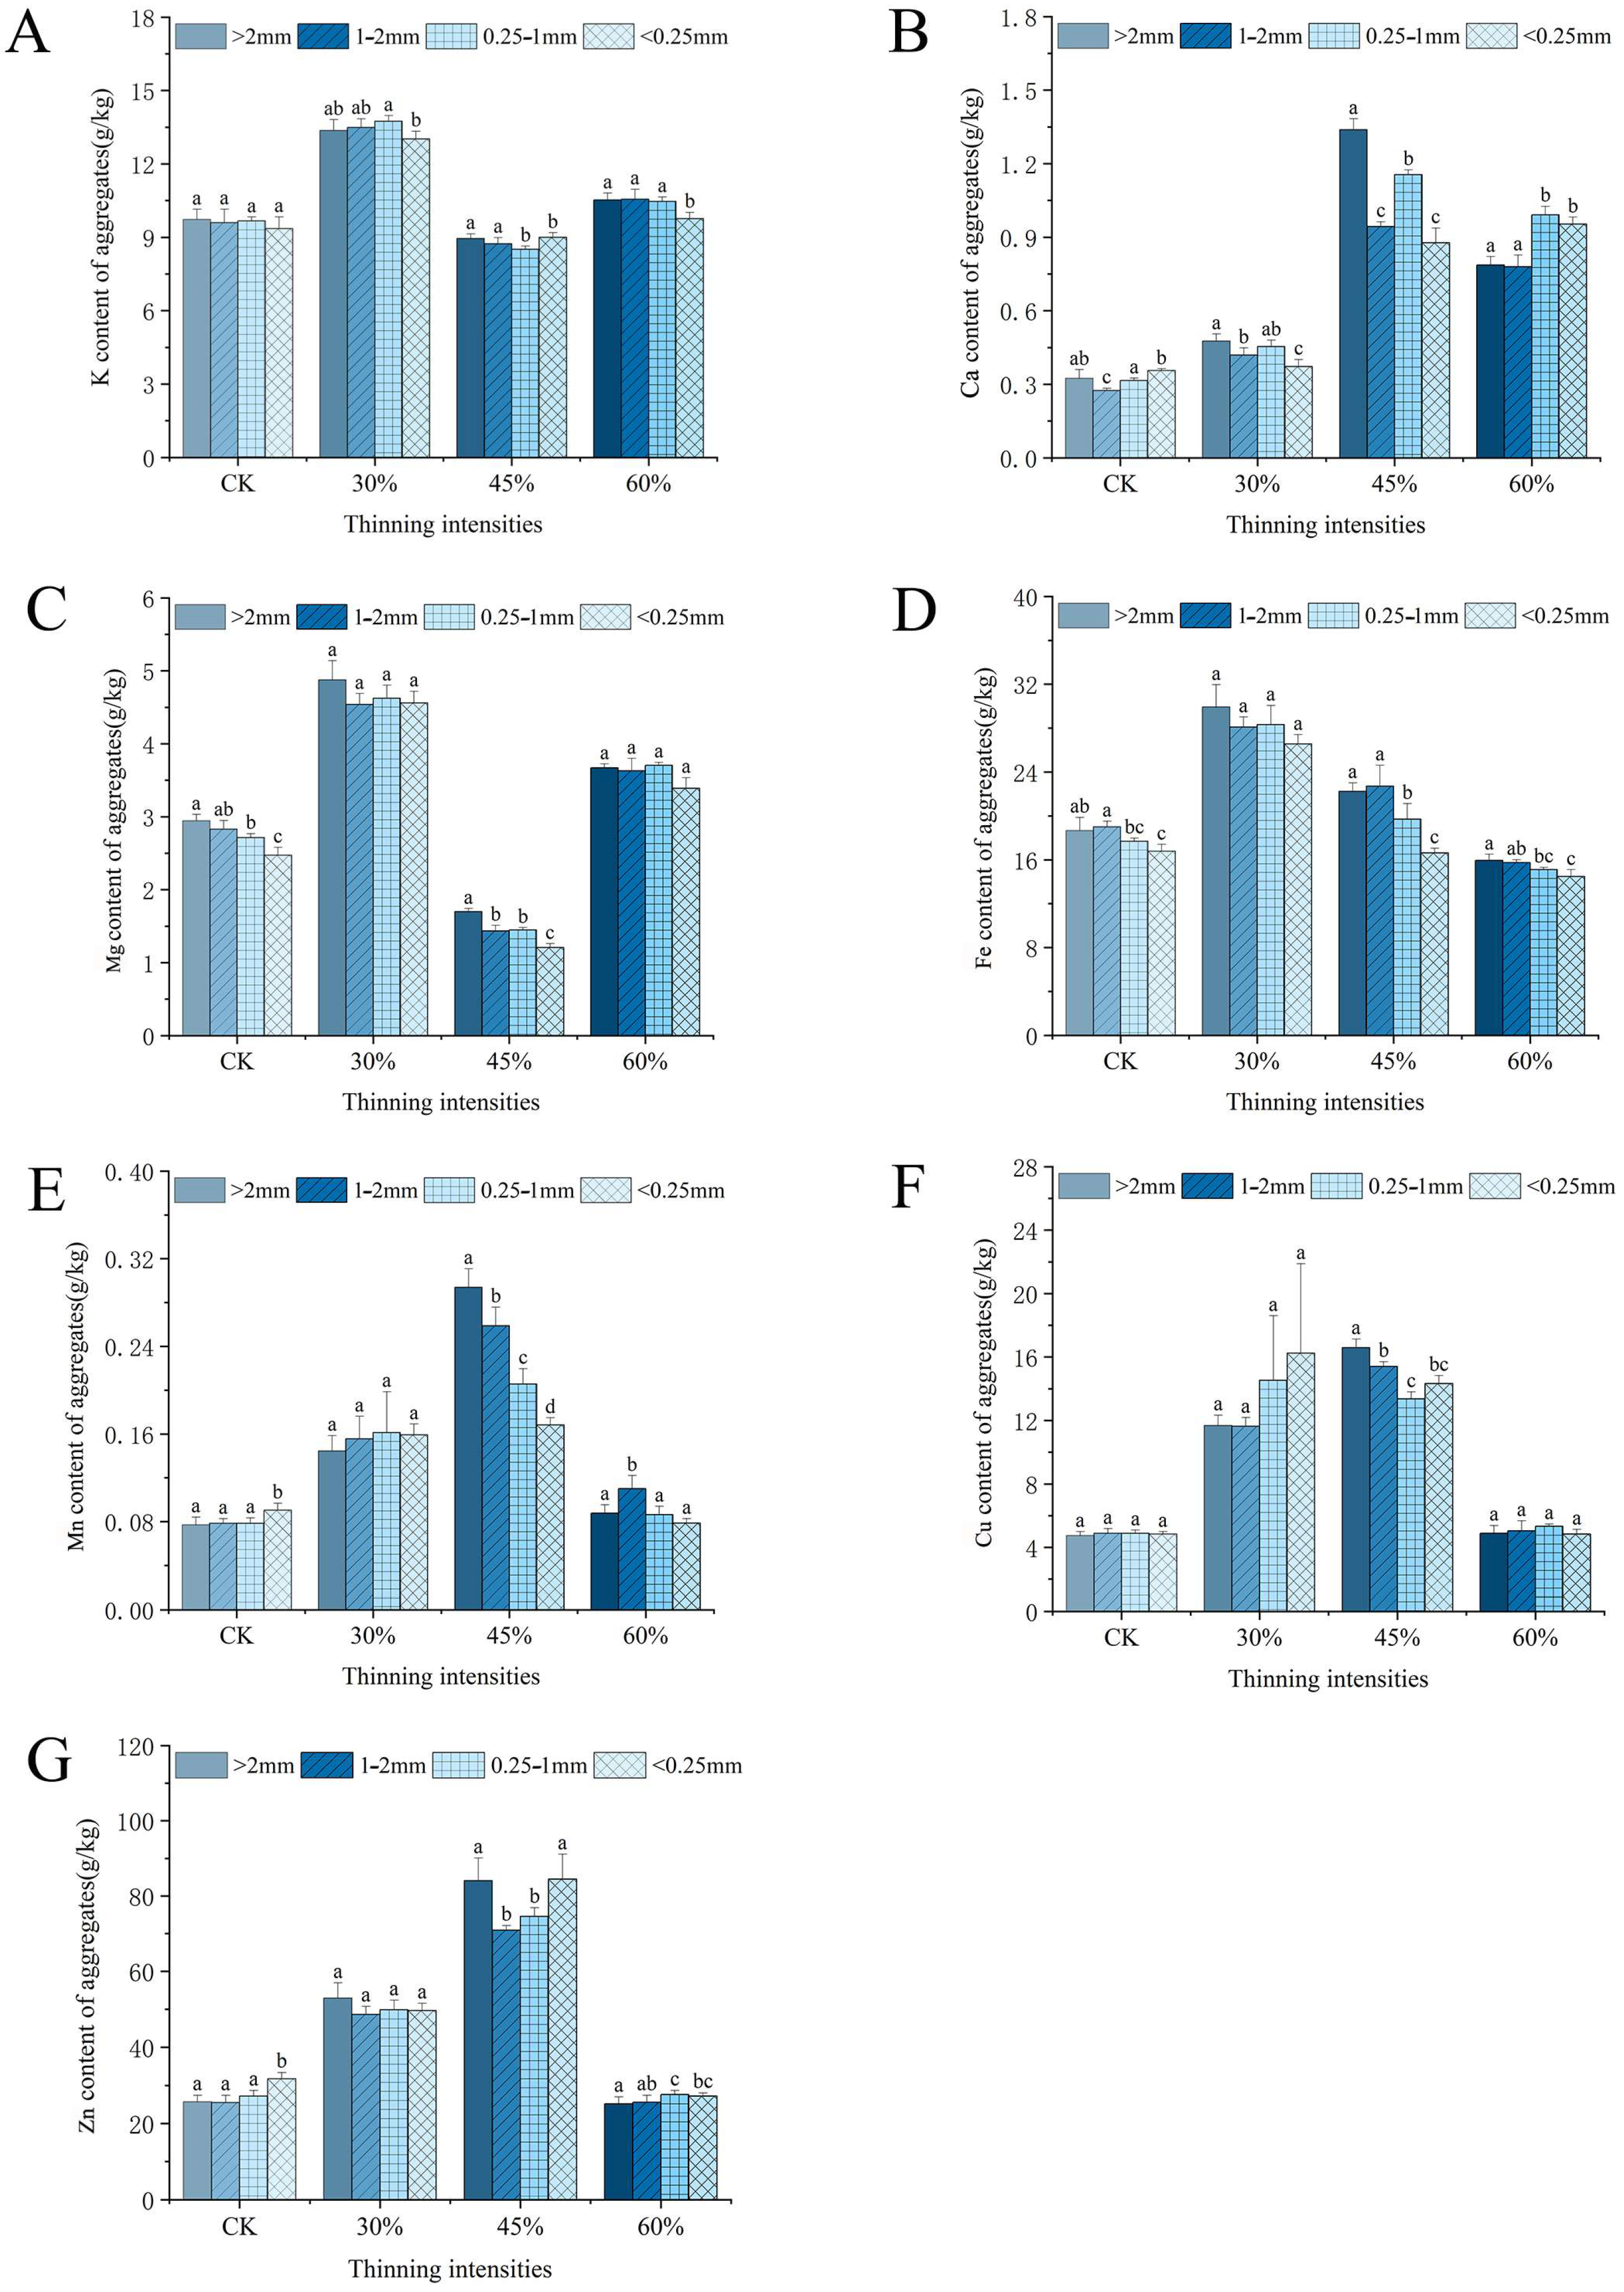
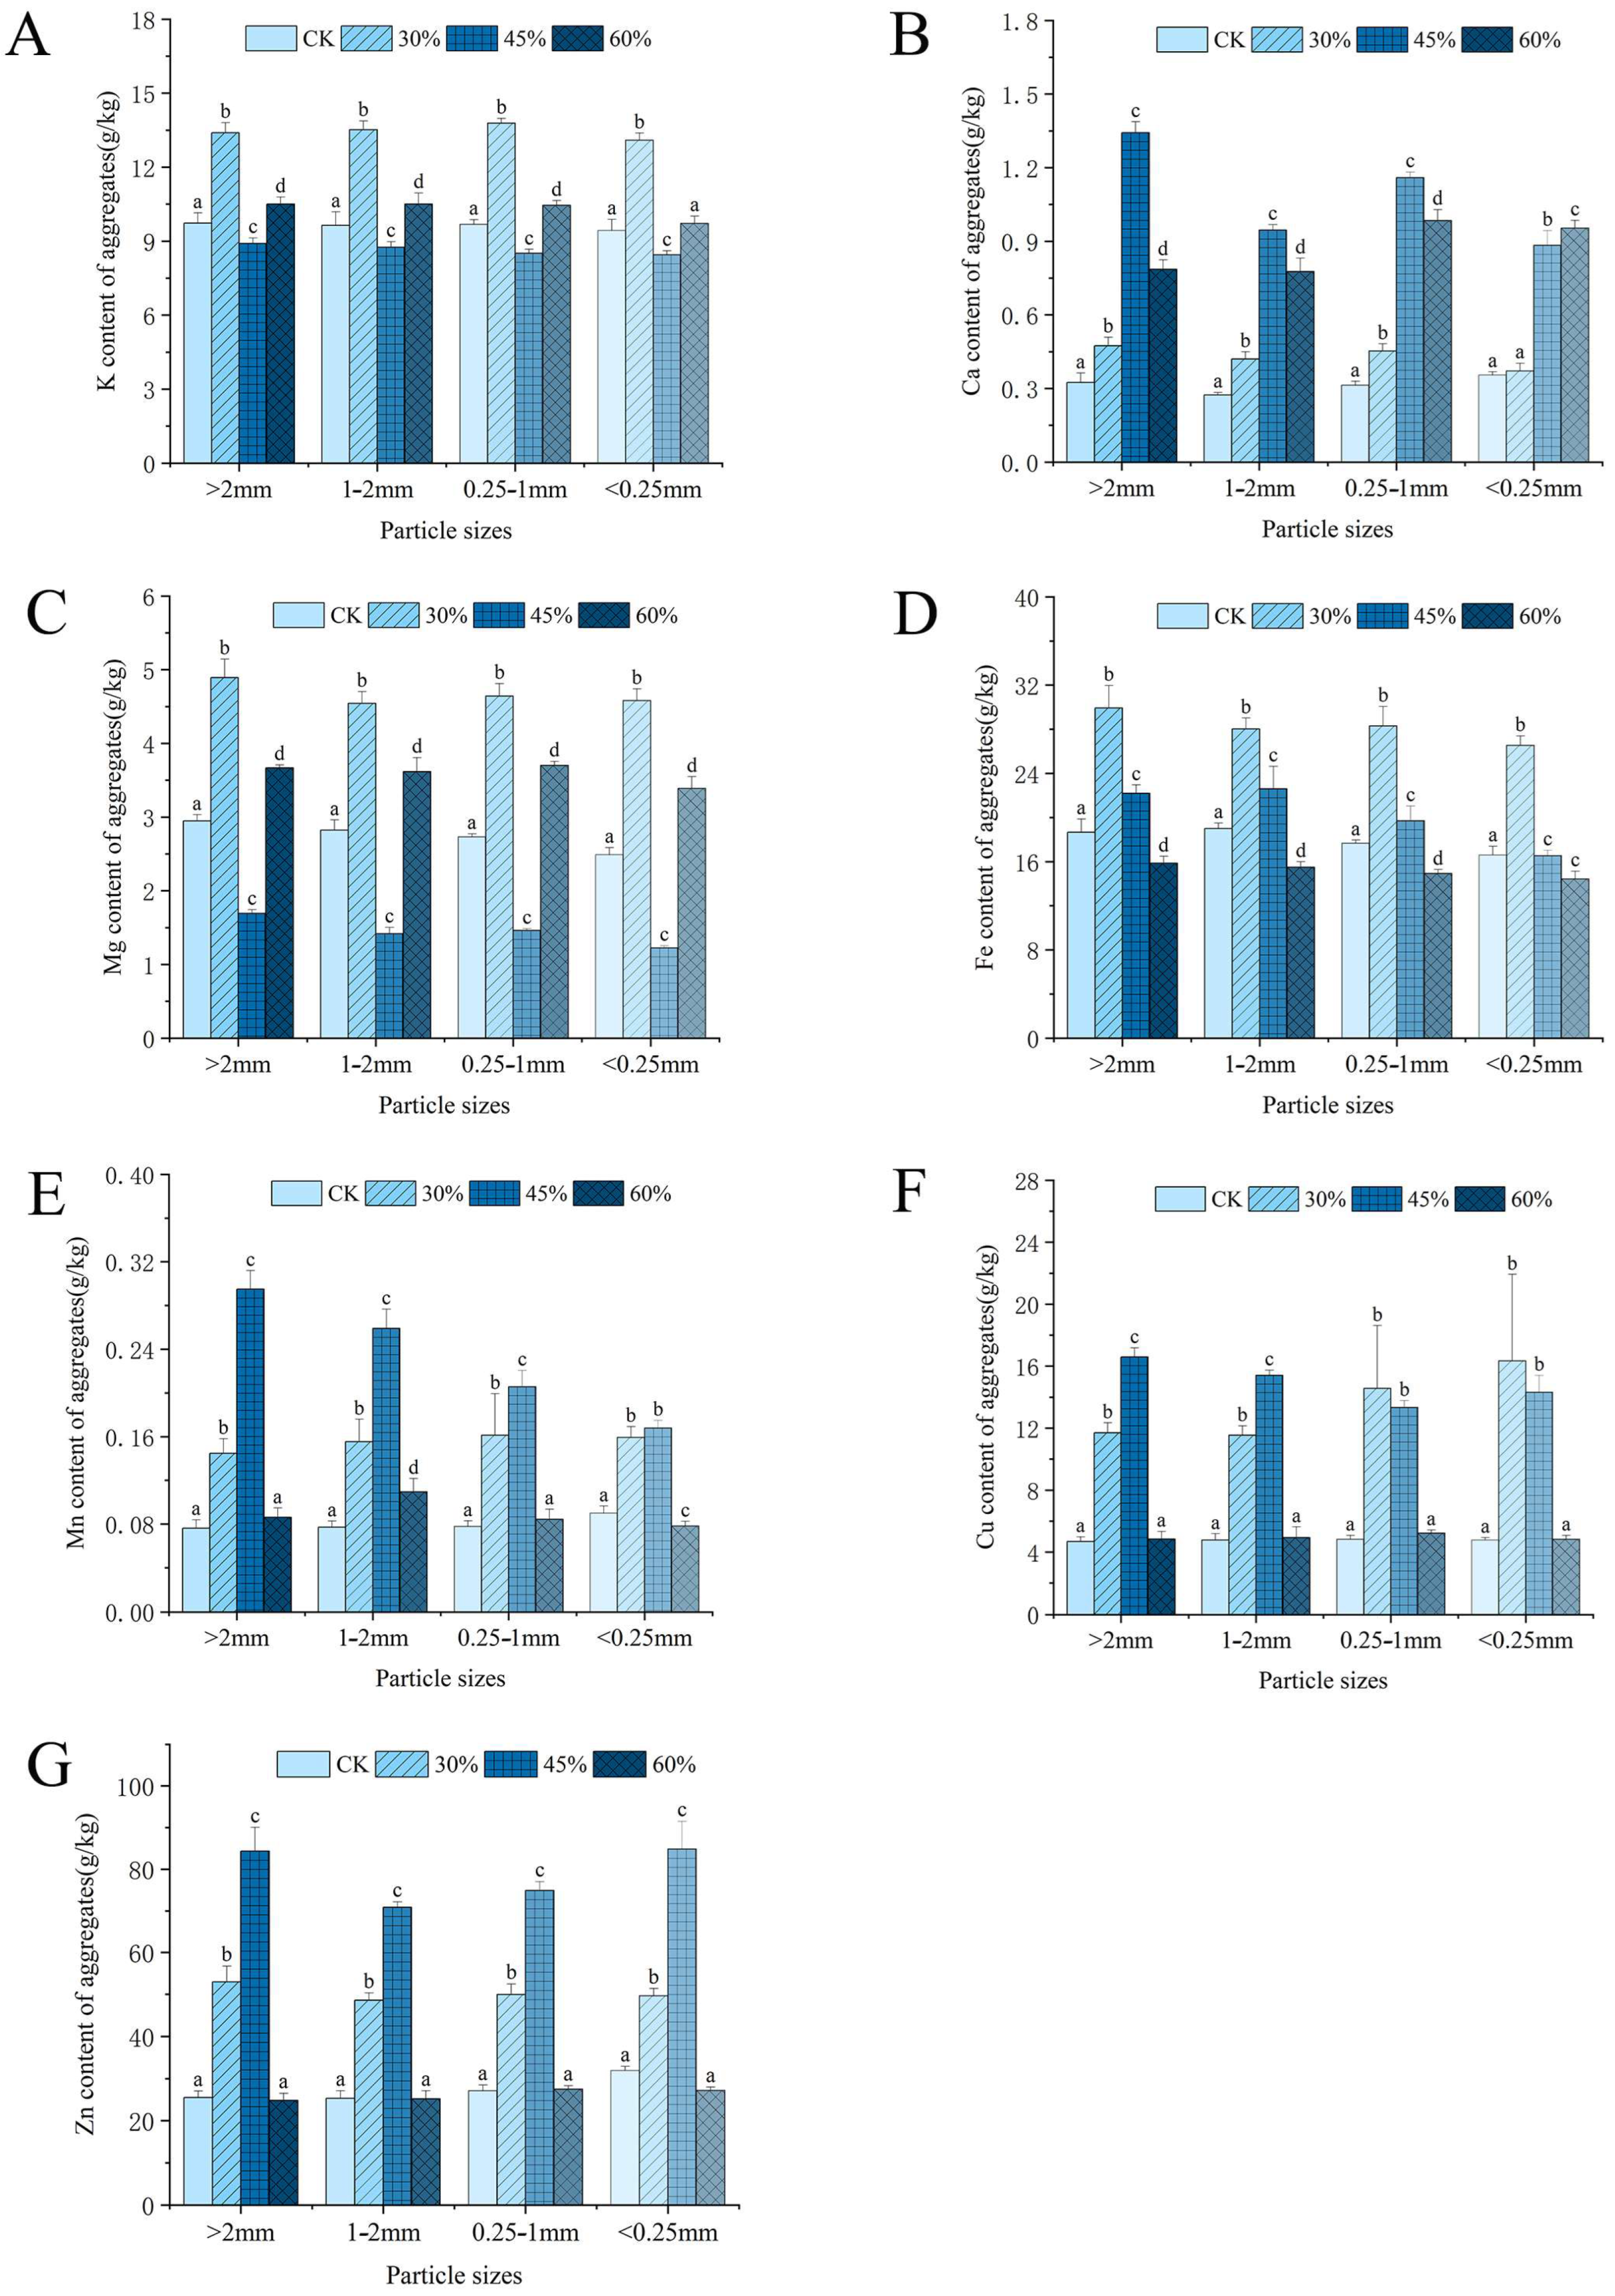
3.2. Metal Nutrient Element Content in Soil Aggregates

The content of K, Ca, Mg, Fe, Mn, Cu, and Zn in the soil aggregates was significantly affected by the thinning intensity and aggregate size. Generally, stands that were thinned by 30% and 45% exhibited higher levels of these elements, with the distribution of these elements varying across different aggregate sizes, as depicted in Figure 2 and Figure 3. Specifically, the K content peaked in stands that were thinned by 30% and reached its lowest levels in aggregates that were smaller than 0.25 mm. Similarly, higher Ca content was observed in stands that were thinned by 45% and 60%, with lower levels being noted in aggregates that were smaller than 0.25 mm. The Mg content also displayed its highest levels in stands that were thinned by 30%, with a preponderance in aggregates that were larger than 2 mm. The Fe content demonstrated its highest levels in stands that were thinned by 30%, showing a decreasing trend as the aggregate size decreased. The Mn content exhibited its highest levels in stands that were thinned by 45%, also displaying a decline with smaller aggregate sizes. The Cu content showed higher levels in stands that were thinned by 45% and 30%, with notable differences between different aggregate sizes within the same stand types. The Zn content likewise demonstrated its highest levels in stands that were thinned by 45%, with variations being observed between various aggregate sizes within the same stand types.

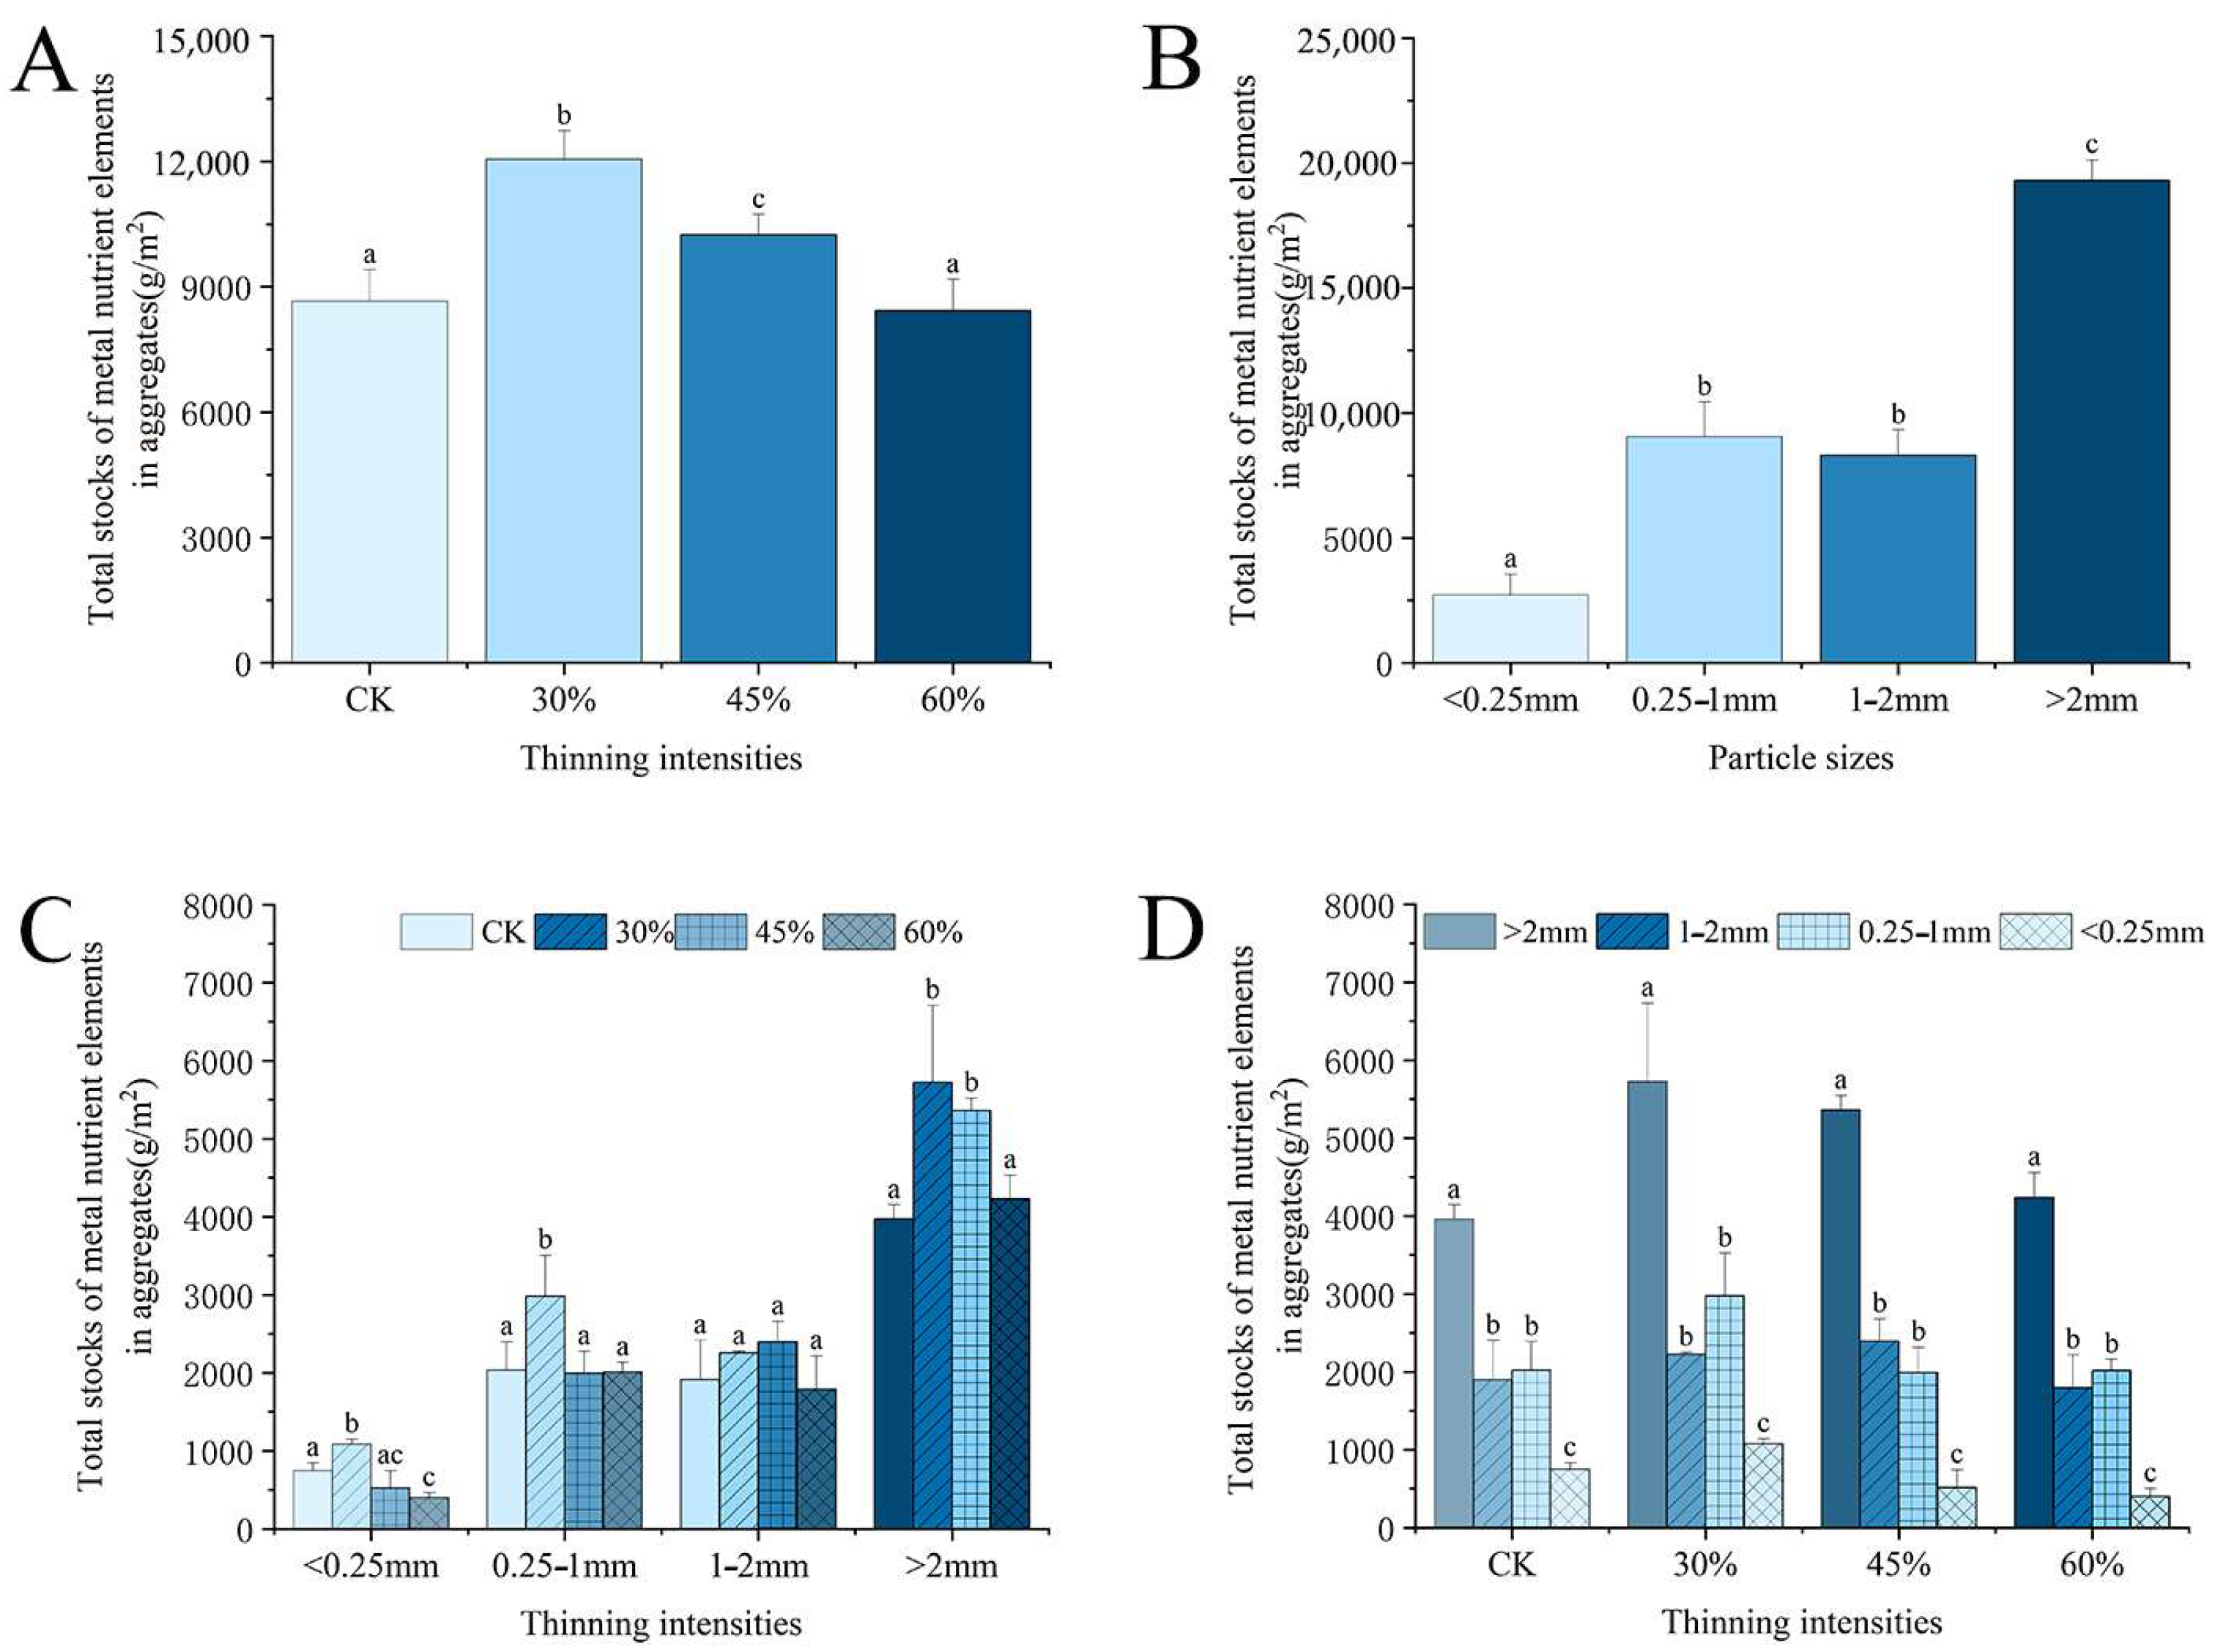
3.3. Metal Nutrient Element Reserves in Soil Aggregates

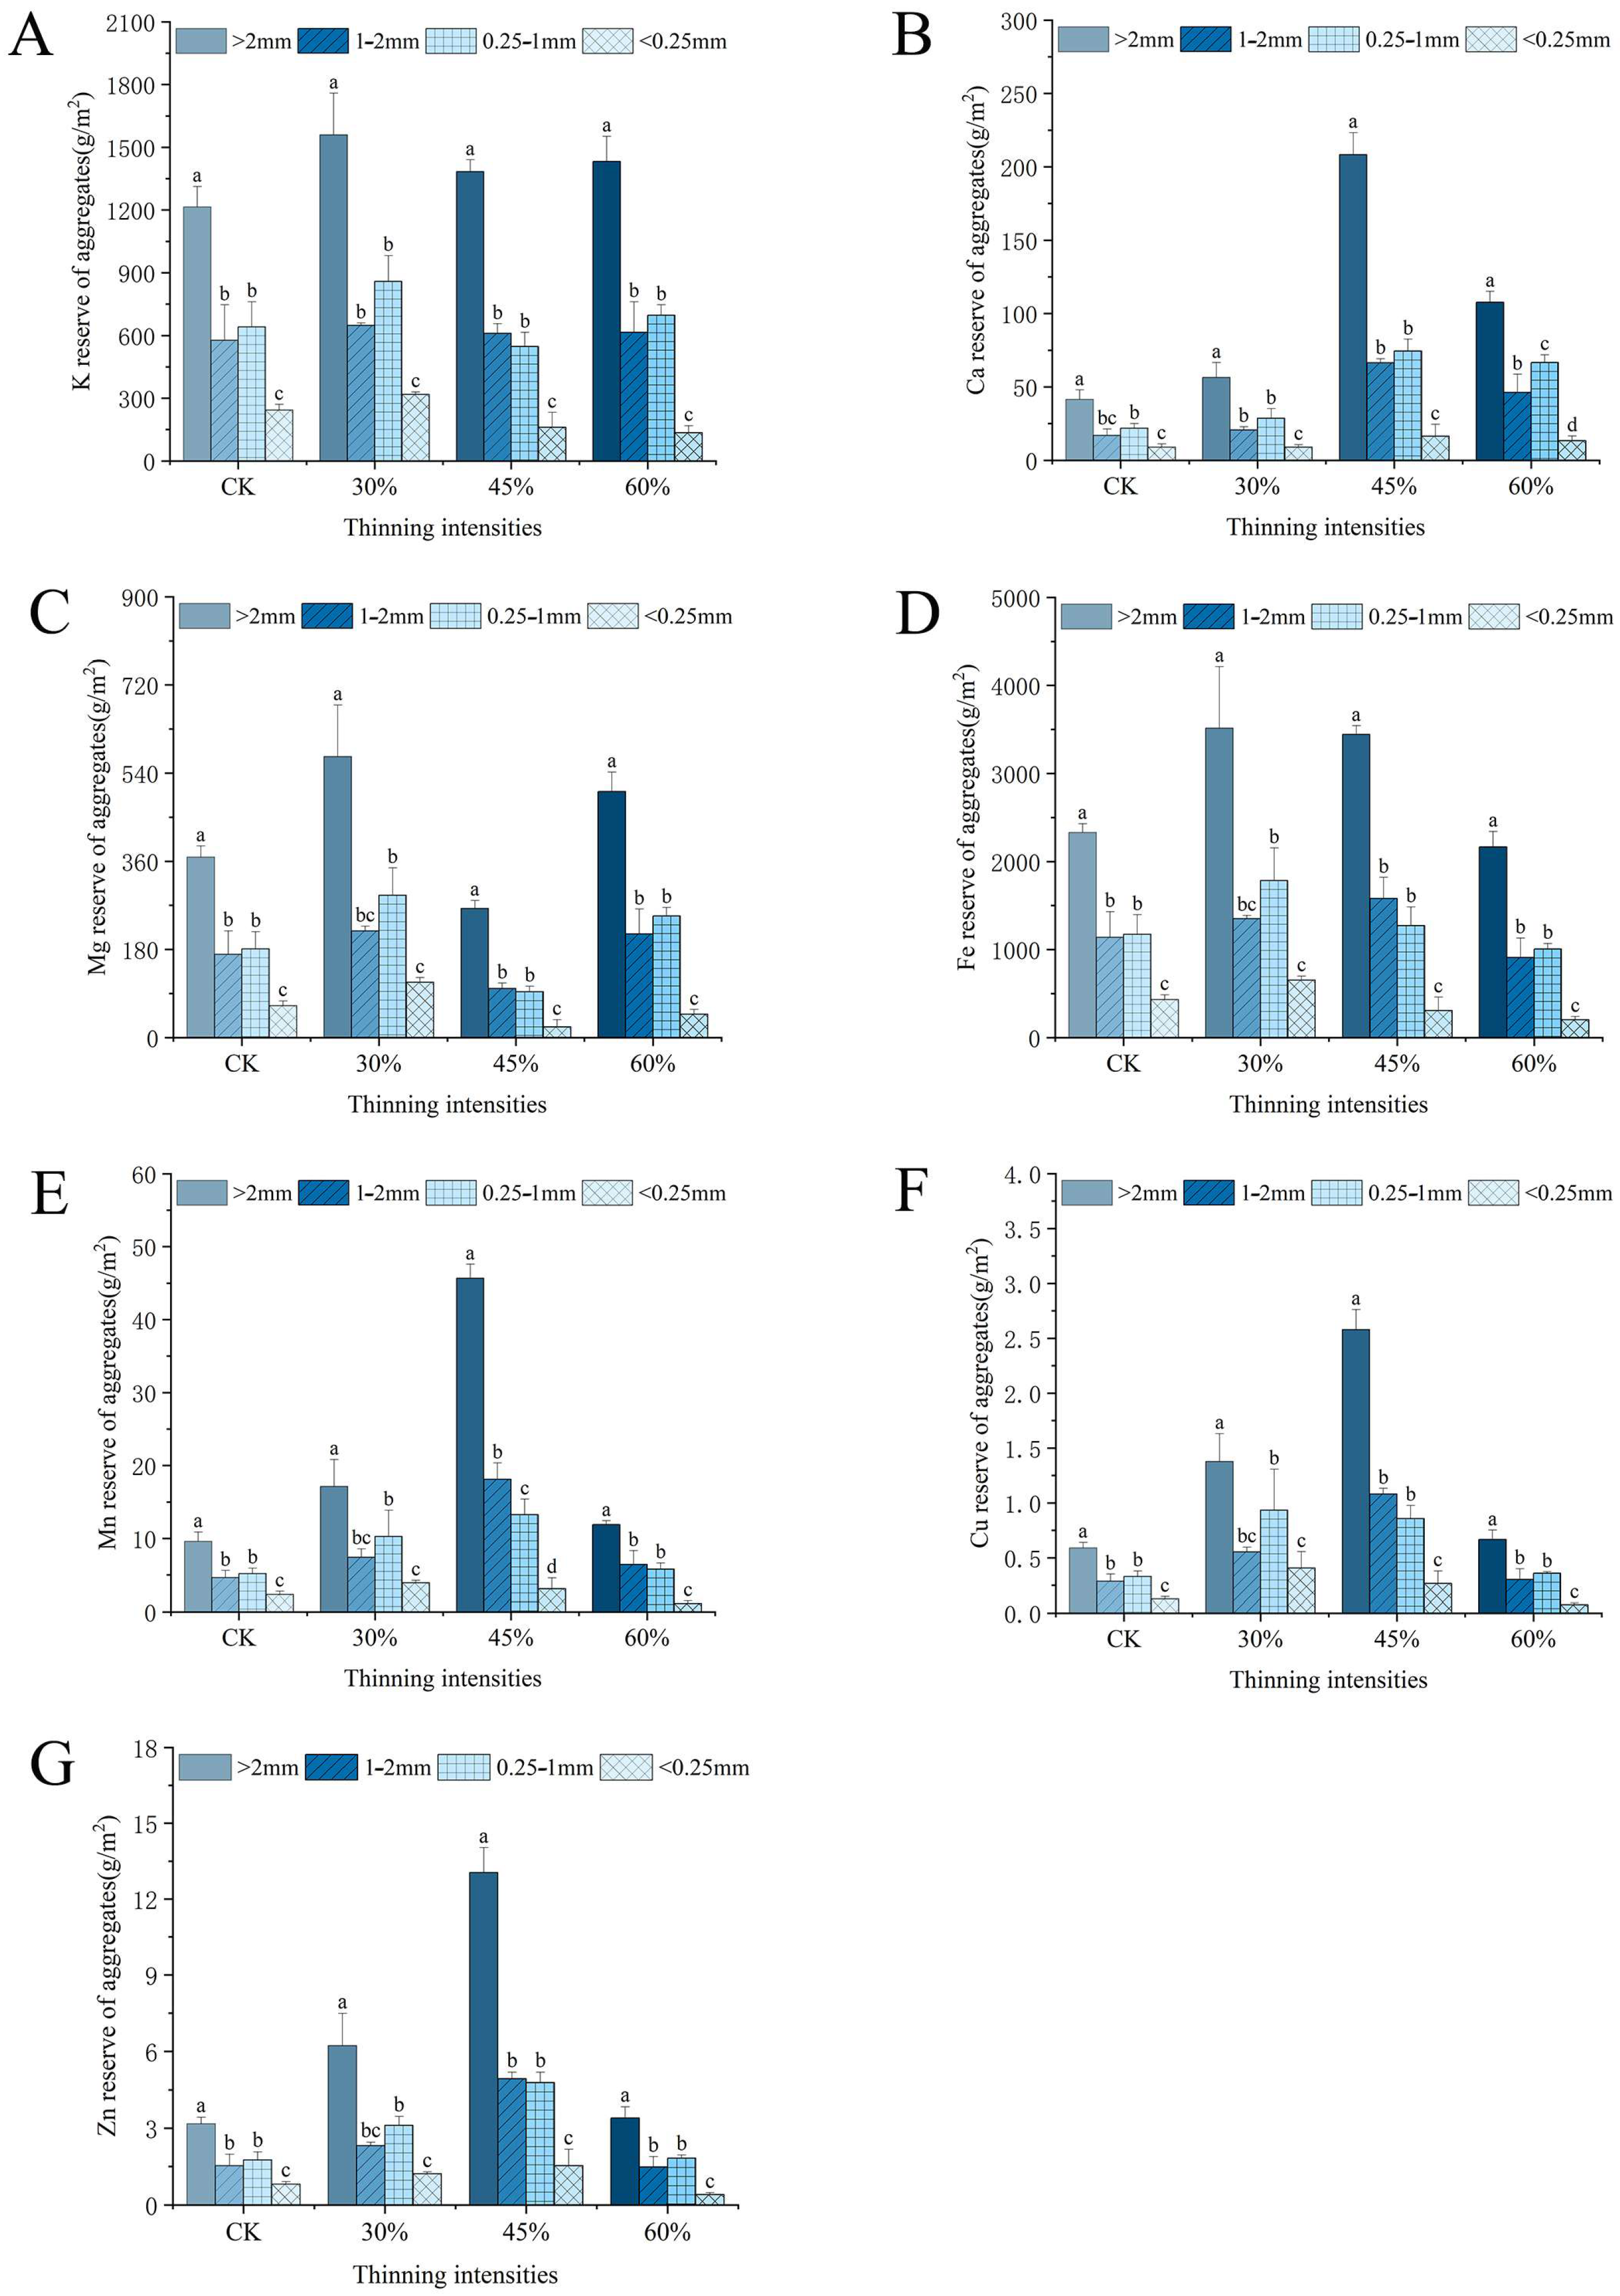
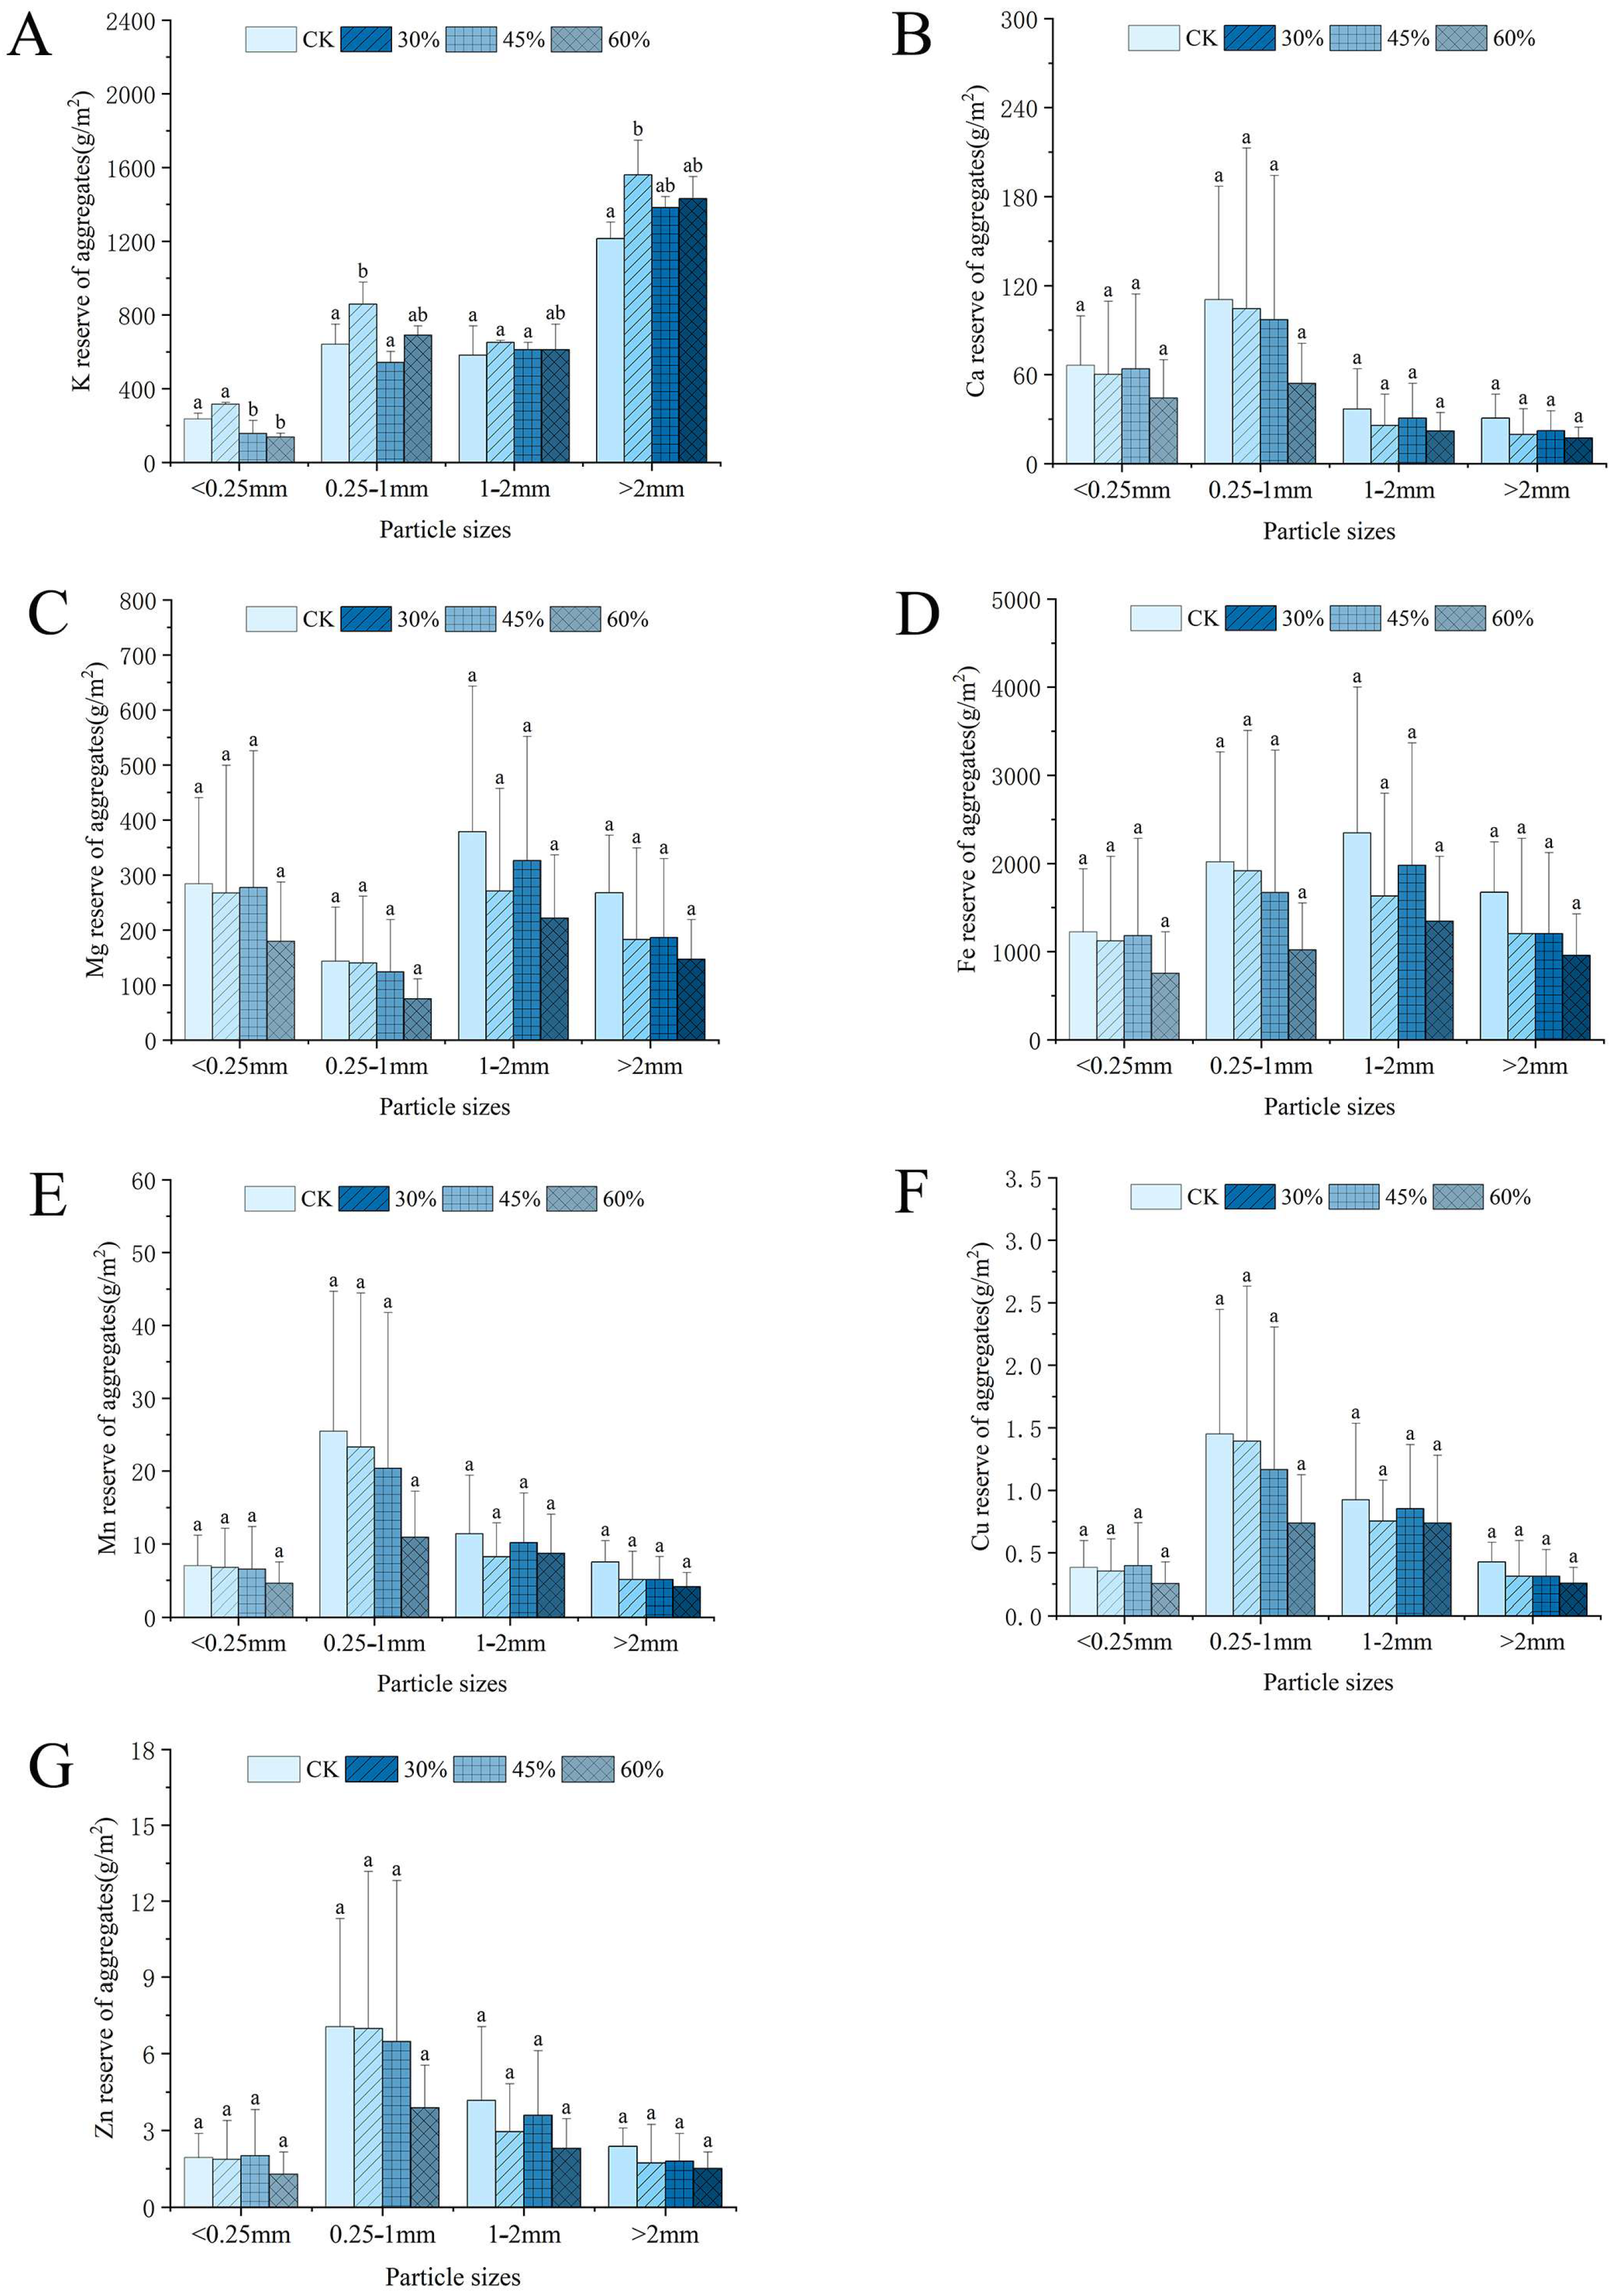
3.3.1. Reserves of Each Metal Nutrient Element

The reserves of metal nutrient elements (K, Ca, Mg, Fe, Mn, Cu, and Zn) in the soil aggregates were significantly influenced by the thinning intensity and aggregate size. Generally, soil aggregates from stands with a 30% thinning intensity and >2 mm size exhibited superior nutrient reserves, as illustrated in Figure 4, Figure 5 and Figure 6. Specifically, the K reserves in aggregates from stands that were thinned by 30% were notably higher across all aggregate sizes, with the highest reserves being observed in aggregates that were larger than 2 mm, while aggregates below 0.25 mm showed the lowest K reserves. Ca reserves, on the other hand, showed no significant differences between different stand types but tended to decrease slightly as the thinning intensity increased, with aggregates that were larger than 2 mm consistently exhibiting the highest Ca reserves. The Mg reserves did not significantly differ between stand types but generally decreased with increasing thinning intensities, with aggregates larger than 2 mm showing significantly higher Mg reserves. Similarly, the Fe, Mn, Cu, and Zn reserves did not differ significantly between stand types, but they all decreased with increasing thinning intensities, with aggregates larger than 2 mm consistently displaying higher reserves of these elements.

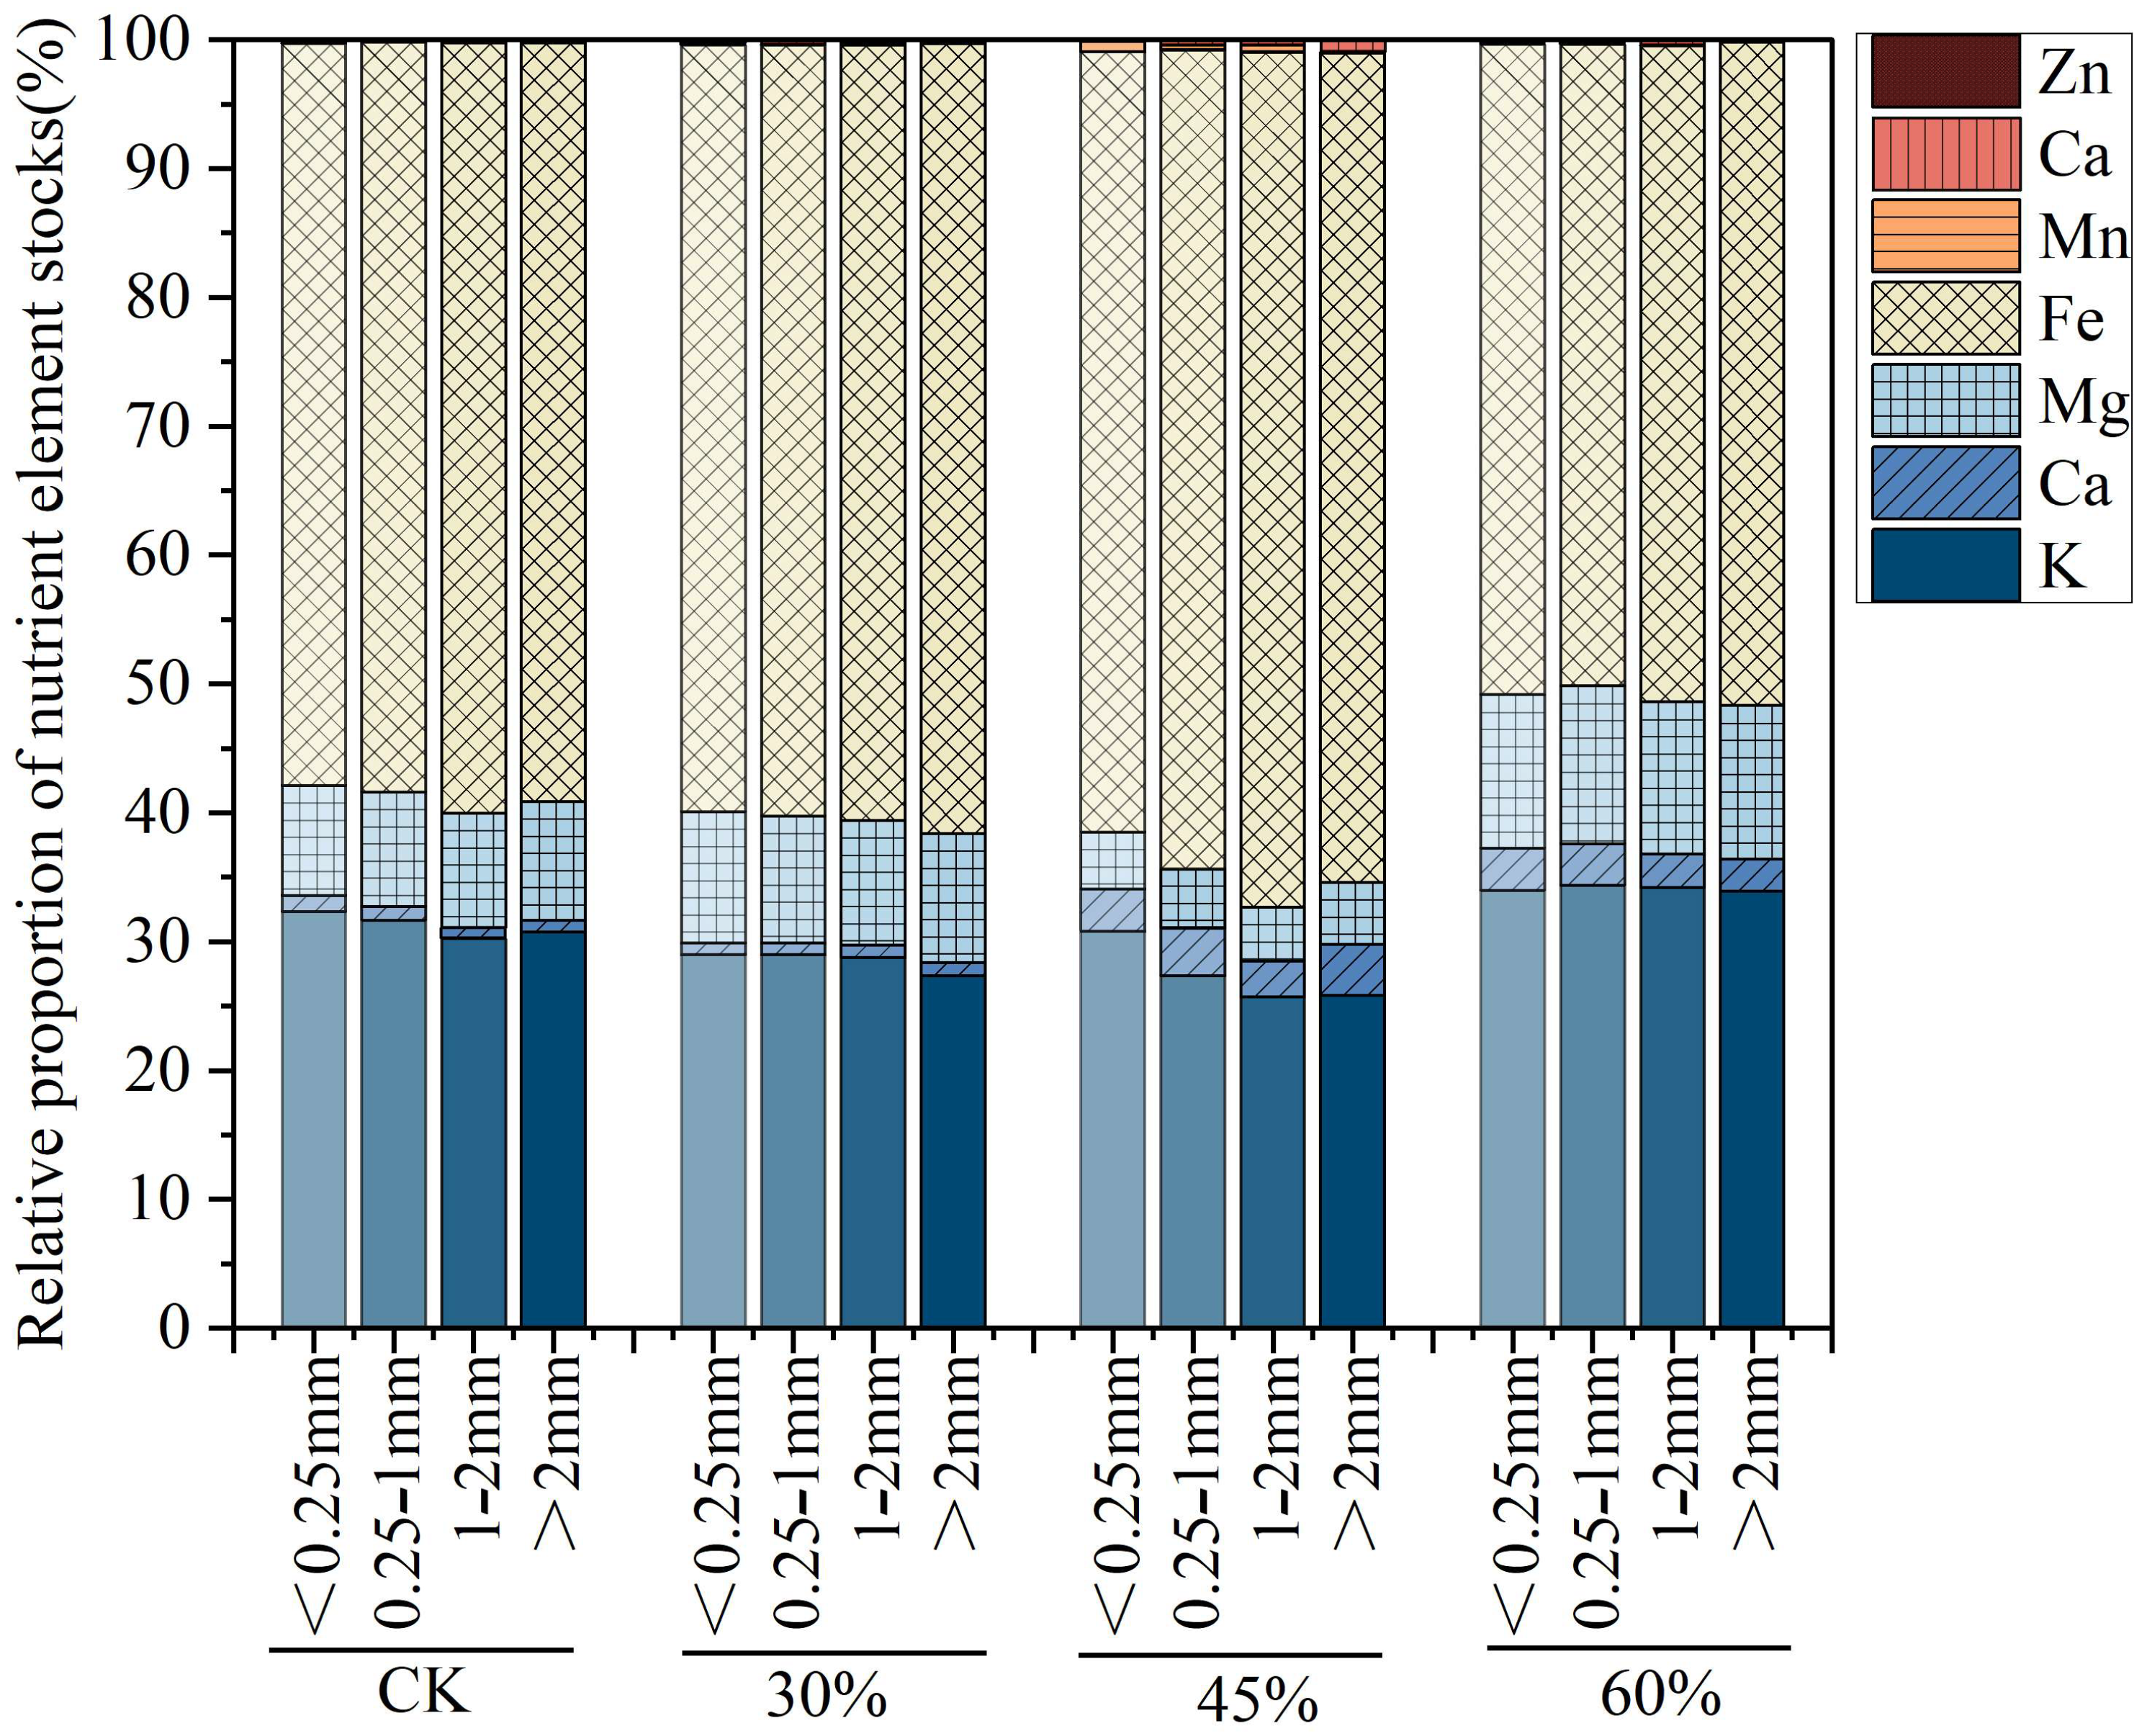
3.3.2. Relative Proportions of Metal Nutrient Element Reserves

In stands with different thinning intensities, the reserves of Fe, K, Ca, and Mg constituted the main proportion of the total reserves (Figure 7). The Fe reserves were the highest, with a relative decrease being observed in the 60% thinning stands. The K reserves showed an increase in the 60% thinning stands. Mg exhibited relatively higher reserves in the 60% thinning stands compared with their lower reserves in the 45% thinning stands. The Ca reserves were comparatively lower but increased in the 45% and 60% thinning stands.

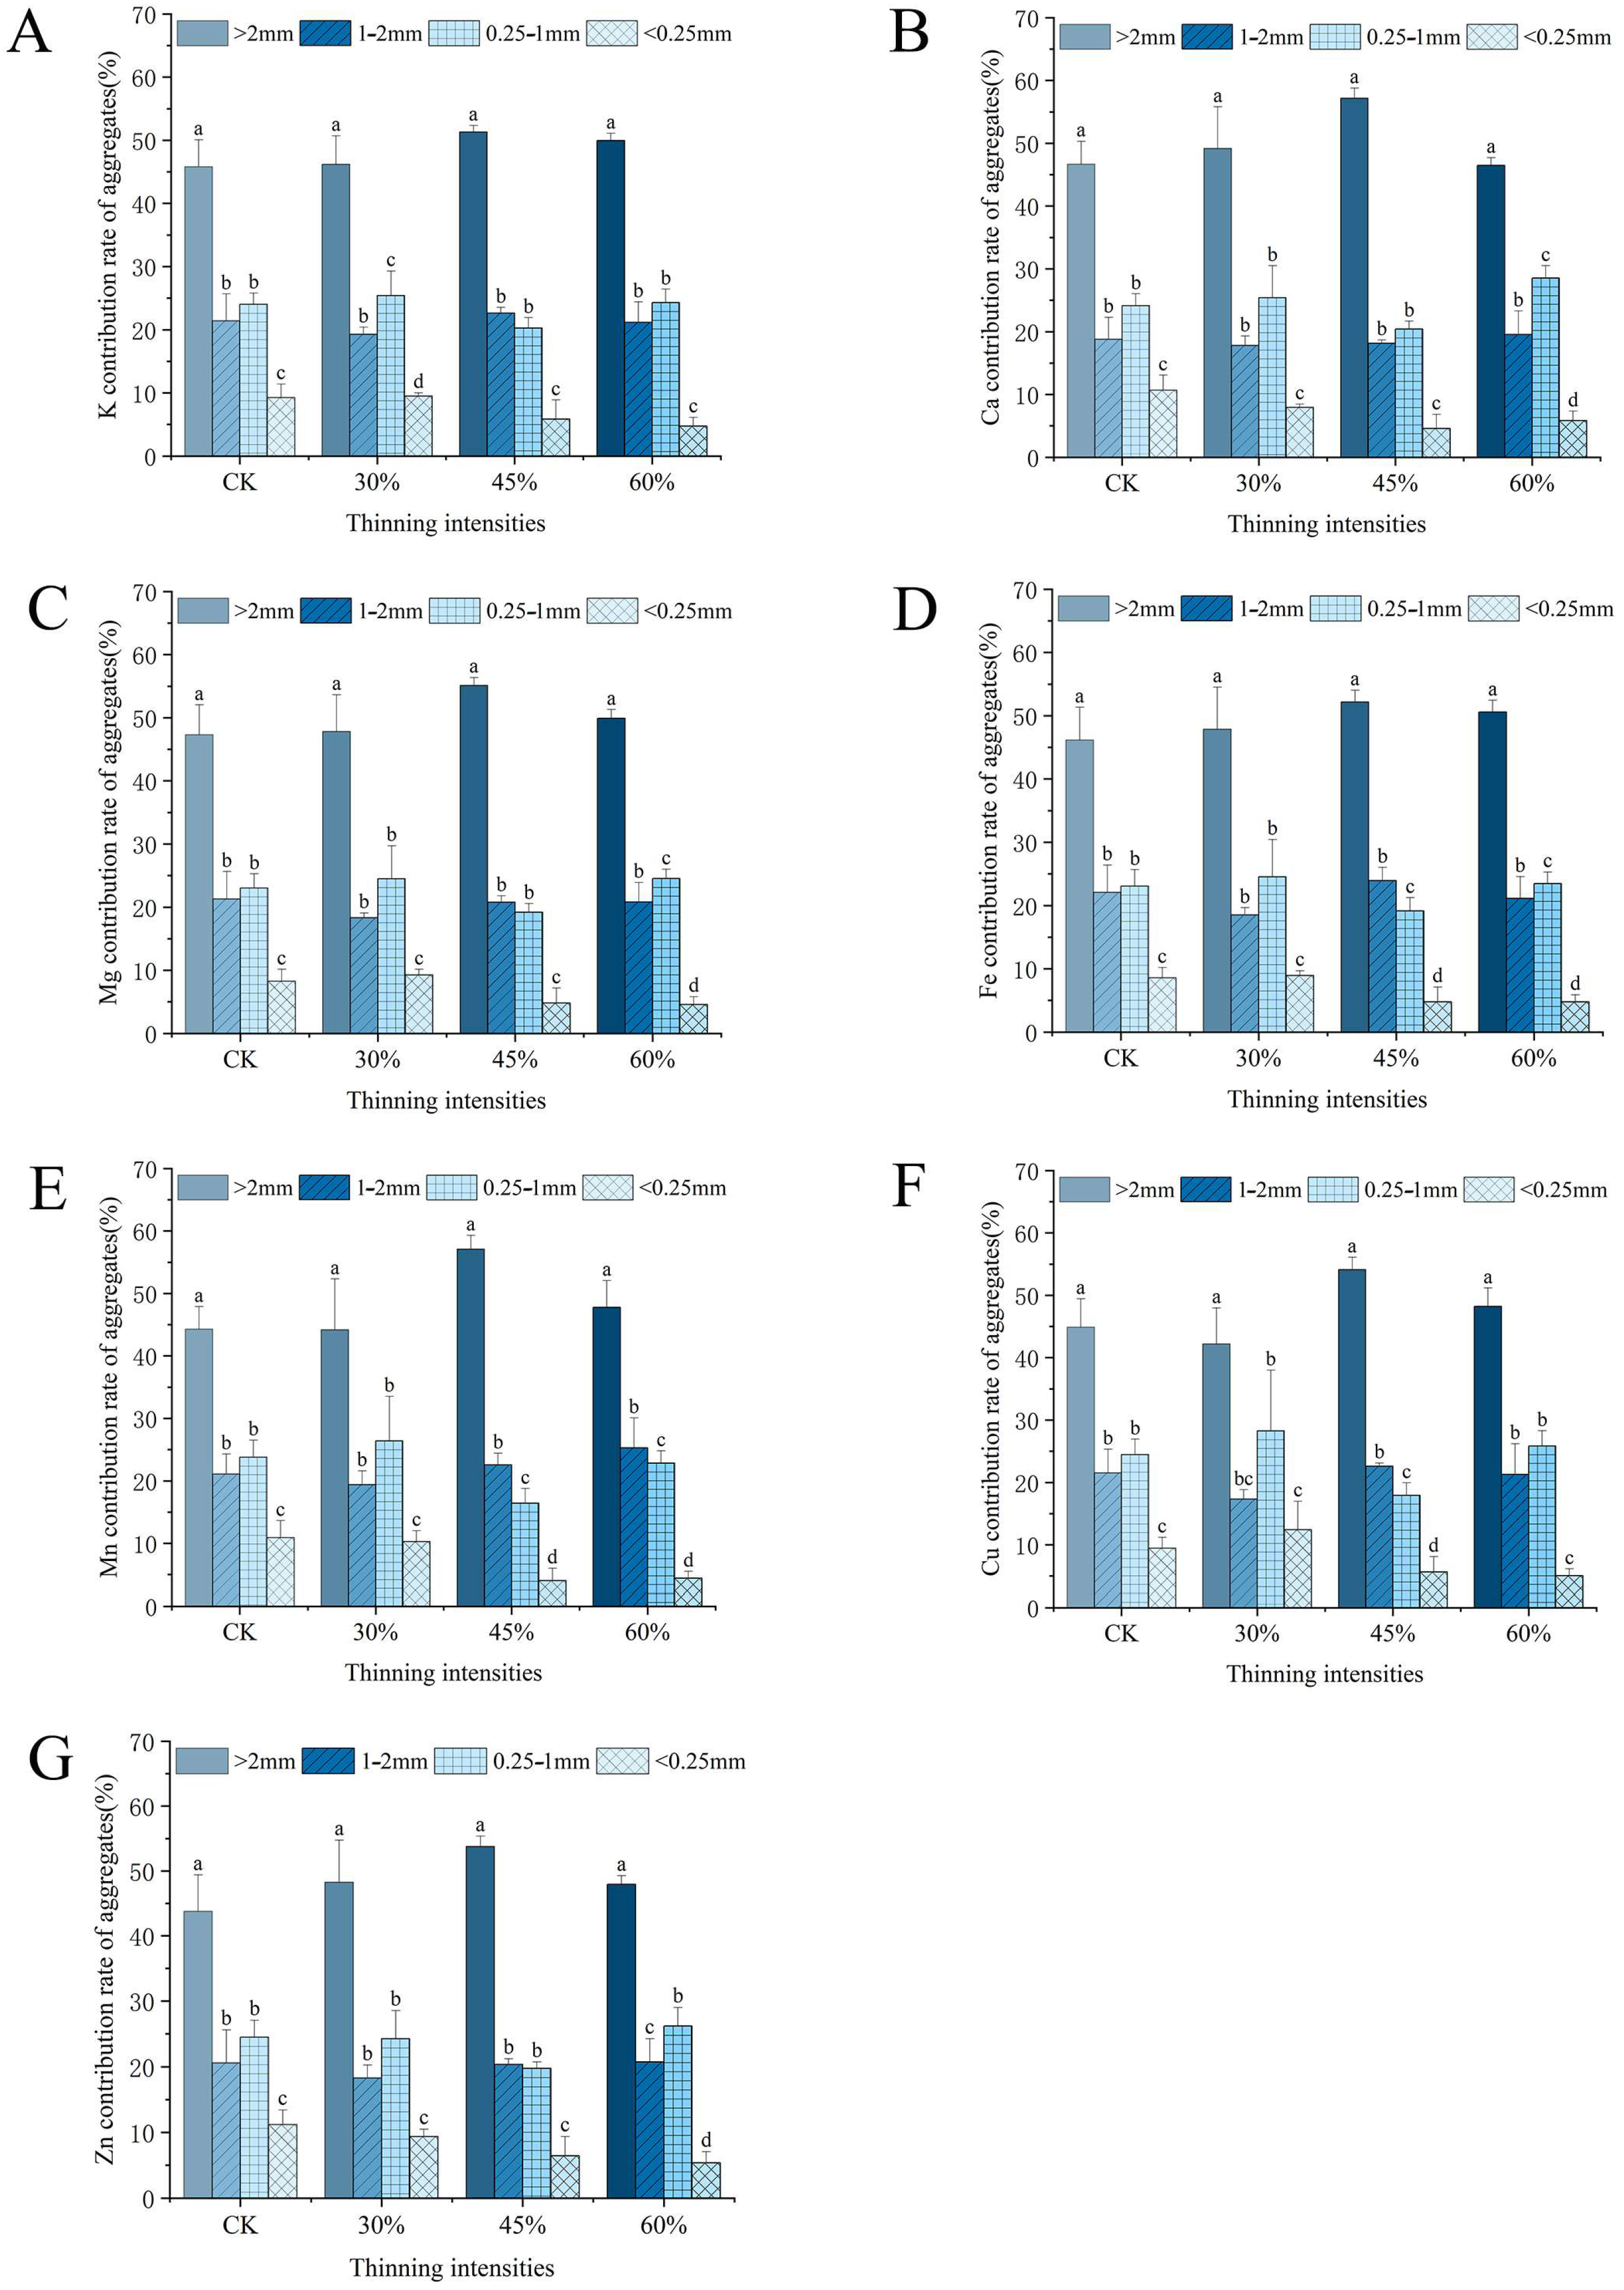
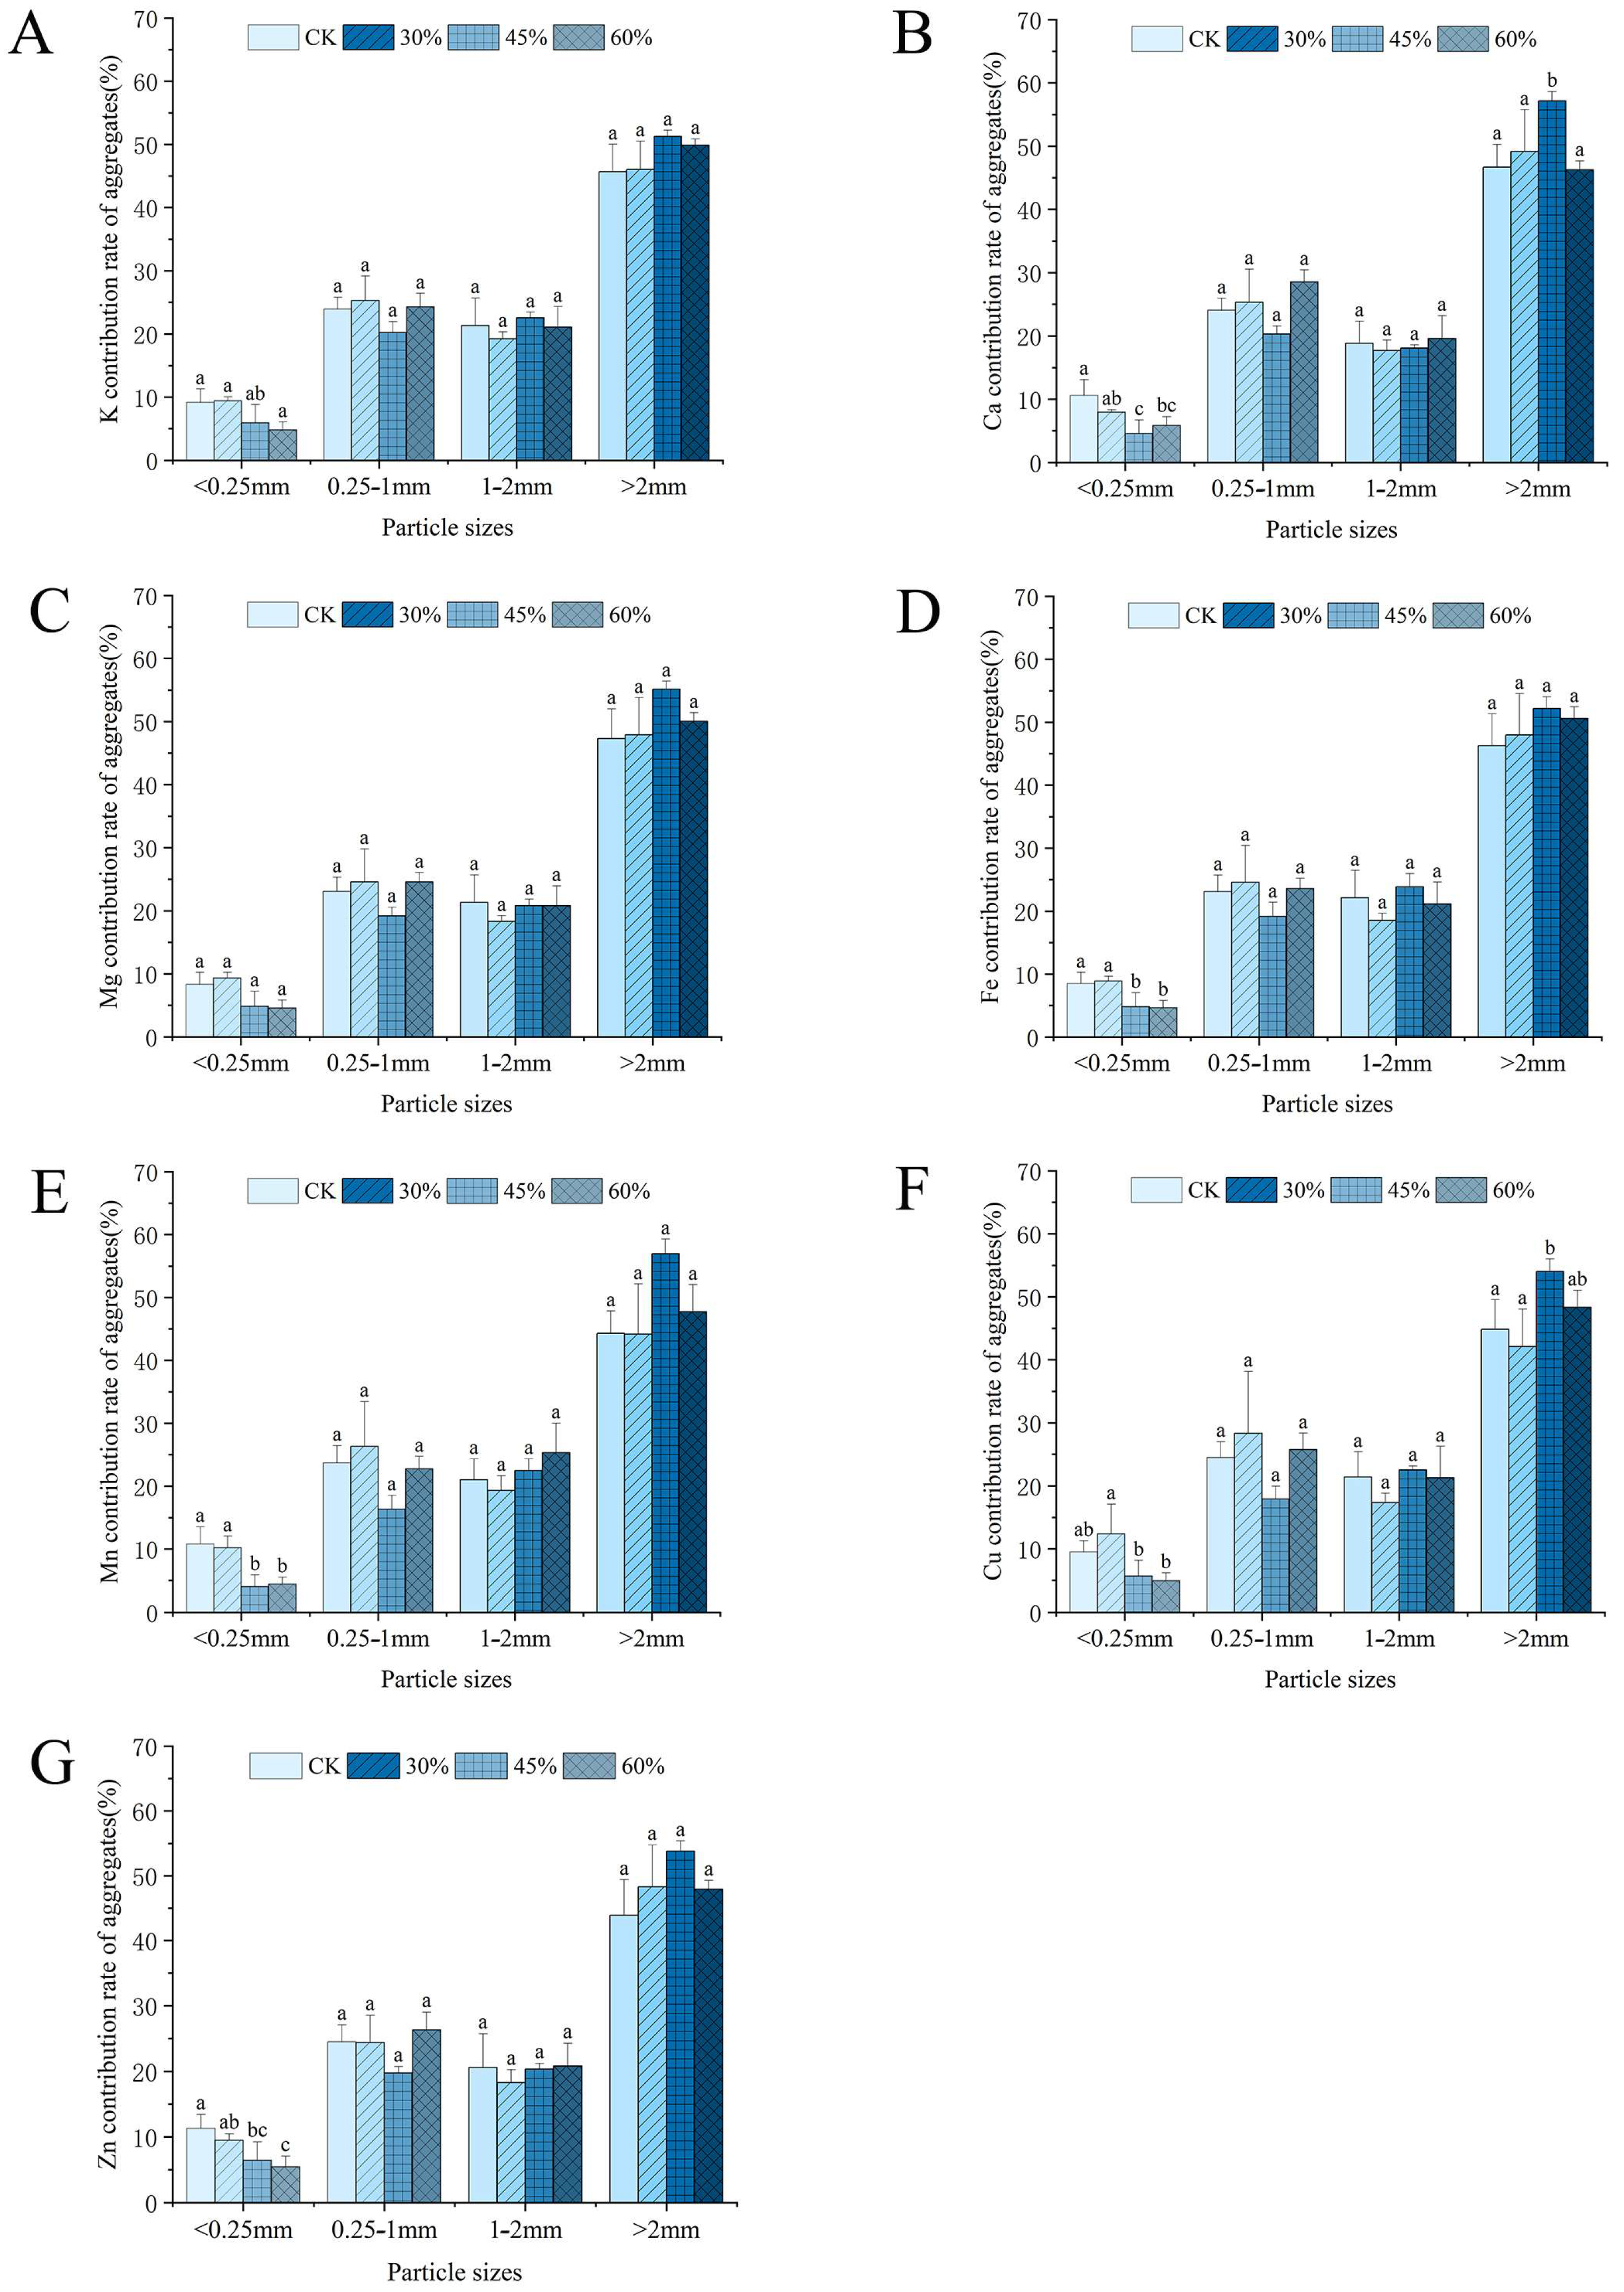
3.3.3. Contribution Rates of Metal Nutrient Element Reserves

The thinning intensity and soil aggregate size significantly influenced the storage contribution rates of metal nutrient elements in soil, with aggregates larger than 2 mm exhibiting the highest contribution to the storage of most metal nutrients (Figure 8 and Figure 9). For K, <0.25 mm aggregates contributed significantly more in the CK and 30% thinning stands than in the 60% thinning stands, but overall, aggregates that were larger than 2 mm made the largest contribution. Ca showed higher contribution rates from <0.25 mm aggregates in the CK stands than in the 45% and 60% thinning stands, while >2 mm aggregates contributed the most in the 45% thinning stands. Similar trends were observed for Mg, where <0.25 mm aggregates contributed more in the CK and 30% thinning stands, but overall, >2 mm aggregates contributed the most. Fe, Mn, Cu, and Zn exhibited similar contribution patterns across different thinning intensities and aggregate sizes, with aggregates larger than 2 mm consistently making the most significant contribution to their storage.

3.4. Relationships Between Metal Nutrient Elements in Soil Aggregates and Environmental Factors

3.4.1. Metal Nutrient Element Content in Soil Aggregates

Our RDA showed that the first two axes cumulatively explained 93.35% of the variation, with the first axis explaining 88.83% and the second axis explaining 4.52%. The organic carbon and pH of the soil and aggregates had significant explanatory power for the distribution of metal nutrient elements in the soil aggregates, with the soil pH and organic carbon contributing the most (Figure 10 and Table 4). The soil organic carbon was positively correlated with its Mg, K, and Fe content and negatively correlated with the Ca content. Organic carbon in the aggregates was positively correlated with Fe, Cu, Mn, and Zn. Moderate thinning (such as 30% and 45% g) significantly enhanced the content of metal nutrient elements in the soil aggregates, thus promoting soil health.

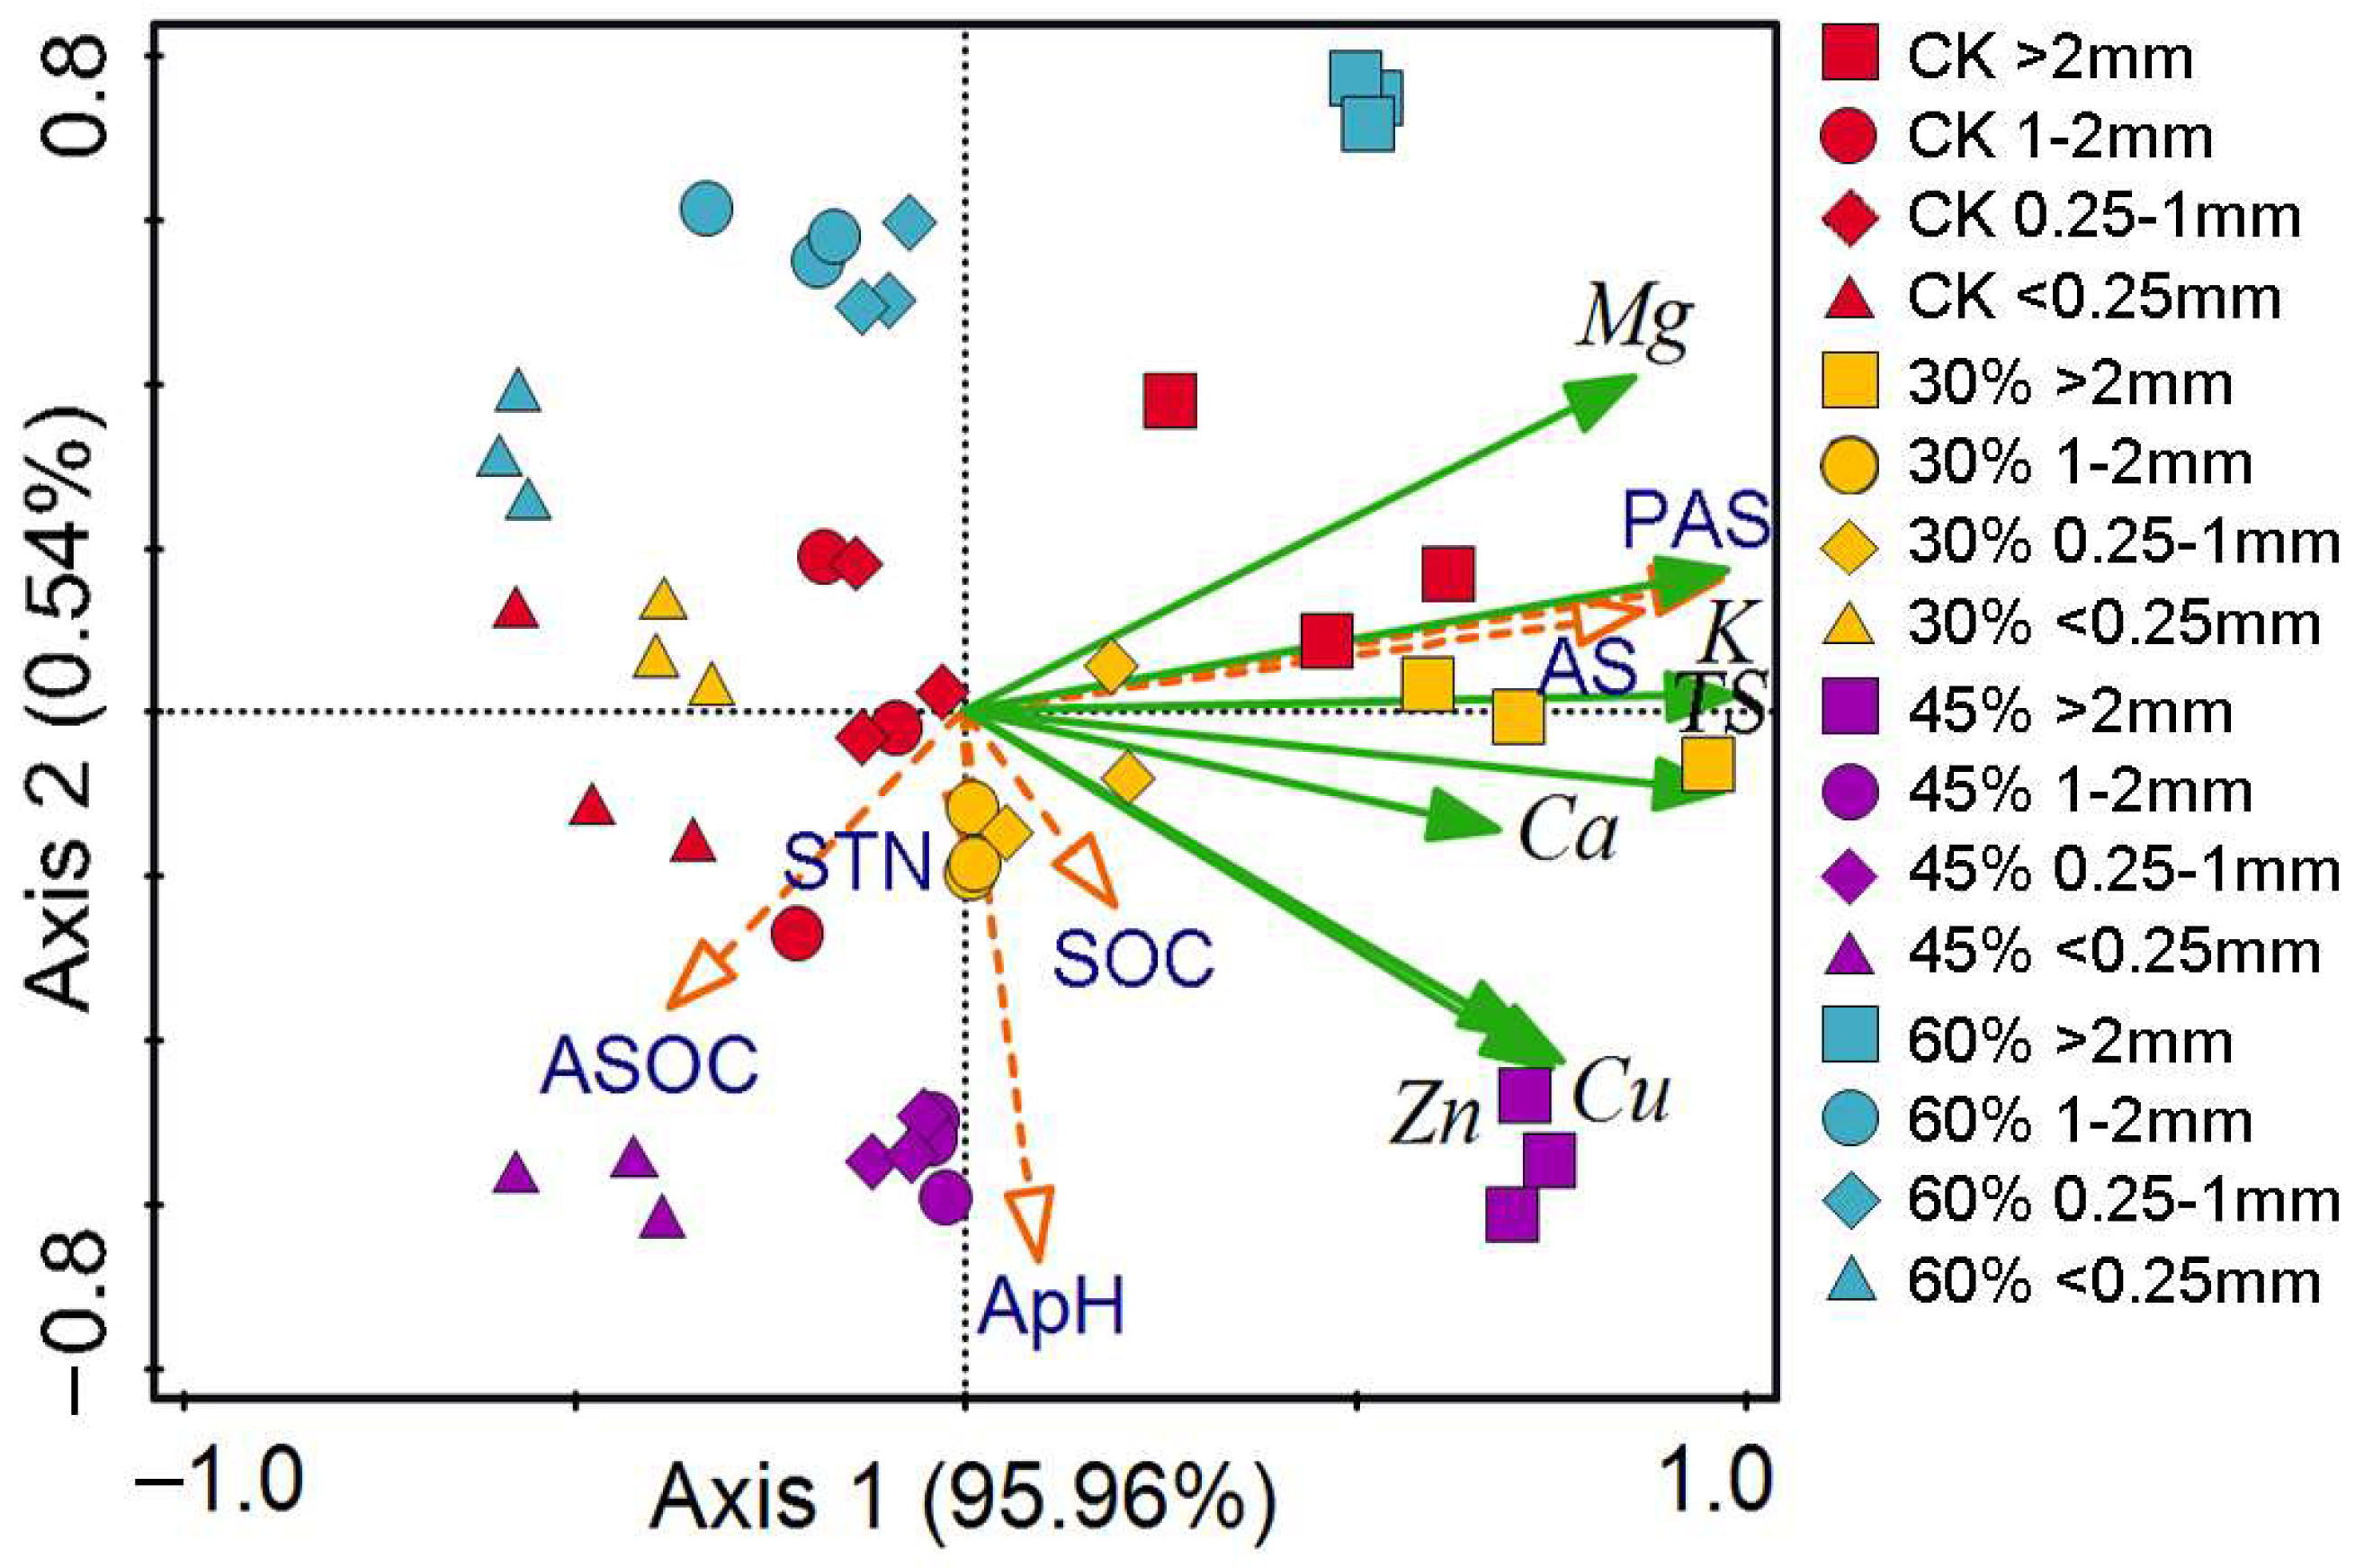
3.4.2. Metal Nutrient Element Stocks in Soil Aggregates

The RDA showed that the first two axes collectively explained 96.50% of the variation, with the first axis explaining 95.96%, and the second axis explaining 0.54%. Six factors, including the size distribution of the soil aggregates, organic carbon in the soil and aggregates, aggregate pH, and tree density, contributed significantly to the explanation and contribution rates of the metal nutrient element reserves in the soil aggregates (Figure 11 and Table 5). Among these factors, the size distribution of the soil aggregates exerted the greatest influence on the distribution of metal nutrient element reserves. Our analysis indicated that large aggregates (>2 mm and 1–2 mm) primarily influenced the metal nutrient element reserves, with >2 mm aggregates serving as the main storage units in Eucalyptus plantations.

4. Discussion

4.1. Composition and Stability of Soil Aggregates

This study revealed that in Eucalyptus plantations under different thinning intensities, large soil aggregates dominate. Among them, aggregates with diameters >2 mm are most abundant, followed by those with diameters of 0.25–1 mm and 1–2 mm, while aggregates <0.25 mm are the least prevalent. This observation is consistent with Wang’s findings in artificial Chinese fir forests, where the soil aggregation compositions across four thinning intensities showed a similar trend of aggregate size distribution [58]. Cheng et al.’s study on Chinese fir plantations similarly demonstrated that larger aggregates predominate, with microaggregates being the least abundant [51]. Additionally, research by Lv also indicated that in natural spruce forests of the Greater Khingan Range, the thinning intensity significantly impacted the proportion of larger aggregates [48]. In this study, the proportion of soil aggregates by size did not significantly change with increasing thinning intensities. However, an increased thinning intensity intensified hydraulic erosion of the soil due to rainfall. Hydraulic erosion selectively affects aggregates, where larger raindrops dislodge microaggregates from the soil surface through splashing, which are then carried away by runoff, resulting in microaggregates being the primary component that is lost [59,60]. Considering our study area’s location in the northern tropics with an annual rainfall exceeding 1300 mm, rainfall impacts the surface soil aggregates of Eucalyptus plantations through impact and abrasion, causing a loss in <0.25 mm microaggregates and increasing the proportion of large aggregates. However, some studies suggest that thinning can reduce stand density, effectively improving the growth space, water, light, and other environmental conditions of the stand. This creates favorable conditions for the survival of understory species, facilitating species colonization and habitat establishment, enhancing vegetation diversity, stabilizing overall function, and improving soil erosion resistance and aggregation [61,62]. A report from Zhang et al. [63] also showed that the removal of understory vegetation led to significantly lower macroaggregate mass but higher microaggregate mass, resulting in a decline in soil aggregate stability.
Studies have indicated that soil aggregates that are larger than 0.25 mm exhibit better stability than those that are smaller than 0.25 mm [64], suggesting that the stability of a soil’s structure is relative to its proportion of large aggregates. In the present study, with increasing thinning intensities, the proportion of microaggregates decreased, while that of large aggregates increased, indicating that the soil stability increased with the thinning intensity. Thinning by 45% and 60% resulted in larger mean weight diameters (MWDs) and geometric mean diameters (GMDs), supporting this conclusion. Larger MWD and GMD values indicate higher soil aggregation, thereby enhancing the soil’s stability and structure [65]. Our results are also consistent with a study on forests of Pinus tabuliformis with different densities at Beijing’s Badaling, where a lower tree density correlated with stronger soil aggregate characteristics [45]. However, Wang’s study found that the soil aggregate stability initially increased and then decreased with the tree density, with the highest stability being measured at 1415 trees/ha and the lowest at 2100 trees/ha [58]. Lv’s research similarly found that in natural spruce forests of the Greater Khingan Range, the soil aggregate stability was optimal at a 30% thinning intensity [48]. These differences may stem from changes in the understory environments due to increased tree densities, affecting the formation and decomposition of organic matter and thus influencing the soil aggregate stability [58]. Nevertheless, the soil organic carbon showed no significant correlation with the aggregate size or proportion, whereas the aggregate organic carbon exhibited a negative correlation with the size and proportion—smaller aggregates had higher organic carbon content. This aligns with the findings of Candan and Broquen [46], as well as another study that also indicated that organic carbon is predominantly distributed in microaggregates [47]. In this study, <0.25 mm aggregates were not the primary aggregate composition, especially under medium to high thinning intensities. This suggests that besides hydraulic erosion selection, the soil type (such as amorphous iron and aluminum oxides in red soil) also significantly influences aggregate stability [66,67].

4.2. Distribution of Soil Aggregate Nutrients

Soil aggregates are formed by means of the binding of organic matter, mineral particles, calcium, and other substances, significantly influencing the distribution of metal elements. The soils in this study are red soils, which are characterized by the high weathering of primary minerals, severe desilication, and aluminum enrichment [68]. During weathering, K, Mg, and other metal elements are leached from the soil by acidic conditions and rainwater, forming minerals such as kaolinite and gibbsite [69]. The internal layers of kaolinite in red soils lack isomorphic substitution, limiting the metal nutrient elements and resulting in a higher Fe content and lower content of other metal nutrient elements in the soil aggregates.
Soil’s organic matter contains abundant nutrient elements, and the content of most metal nutrient elements is positively correlated with the soil’s organic matter content [70]. Ash from burned plant residues contains significant amounts of elements such as Ca, Mg, K, Na, Fe, Mn, Si, P, S, and Al, making plant residues an important source of metal nutrient elements in soils. Soil humus contains large amounts of metal nutrient elements, which are retained in various forms in the humus and released into the soil as decomposition progresses [71]. Humic substances have different complexation abilities with metal ions, with the complexation order being Fe > Al > Cu > Zn, in accordance with the high Fe content in this study [72,73]. Furthermore, in our study, the organic carbon in aggregates was positively correlated with Fe, Cu, Mn, and Zn, as well as with moderate thinning (30% and 45% thinning), indicating that thinning at these intensities not only increased the amount of organic matter but also enhanced that of metal nutrient elements. This aligns with our hypothesis. However, it is possible that the organic matter in the soil is not the primary factor influencing the metal nutrient elements in the soil aggregates, as the role of the soil’s parent material may also be significant [31].
Soil microaggregates are formed by the aggregation of primary particles through van der Waals forces or the aggregation of metal cations [74]. These metal cations play a crucial role in the formation of microaggregates, enhancing the aggregation of colloids, humus, and clay particles with negative charges. Trivalent and divalent cations have stronger aggregation forces, while monovalent cations have weaker aggregation forces [31]. In this study, the Fe content in aggregates of various sizes was relatively high, accounting for more than half of the total element reserves, indicating the significant role of Fe in promoting aggregate formation.
Generally, trace elements such as Fe, Mn, Cu, and Zn are more effective under acidic conditions, with their solubility increasing as the soil pH decreases [75]. However, due to high rainfall in our study area, except for the 45% thinning stands, these elements may have been lost due to leaching in the other stand types. Although the organic carbon content of aggregates in the 45% thinning stands was lower than that in the 30% thinning stands, the pH values of both the soil and aggregates in the 45% thinning stands were the highest of the four stands, approaching or exceeding 6. The higher pH values in the soil and aggregates of the 45% thinning stands resulted in less soluble trace metal nutrient elements, thereby retaining more of these elements.
In this study, the reserves of each metal nutrient element were positively correlated with the size and proportion of the soil aggregates. Reserves are the product of the content and soil mass and are calculated using the soil volume and bulk density. Under the same volume conditions, the soil’s bulk density and content of various metal nutrient elements fluctuate within a certain range, so reserves mainly depend on the relative proportions of various aggregate sizes in the soil. Soil aggregate sizes with relatively higher proportions had greater metal element reserves, which is consistent with the findings of Zhang et al. regarding spruce plantations [57].
The findings of this study indicate that macroaggregates serve as the primary reservoir of metallic nutrients in Eucalyptus plantation soils. Therefore, integrated management measures should be adopted to preserve and enhance soil macroaggregates in Eucalyptus plantation management. These include (1) minimizing mechanical disturbance by prioritizing no-till or shallow tillage during land preparation and young stand tending to avoid structural damage from heavy machinery; (2) increasing the amount of organic matter through litter retention or organic fertilizer application to strengthen cementation via humus and microbial secretions (e.g., glomalin); (3) optimizing the stand structure by establishing mixed coniferous–broadleaf forests and retaining understory vegetation to stabilize aggregates through root penetration and exudates; (4) mitigating water erosion risks by regulating the canopy density to reduce the impact of raindrops and waterlogging damage; and (5) enhancing biological activities.

5. Conclusions

This study investigated how different thinning intensities (CK, 30%, 45%, and 60%) affect the size composition, stability, and distribution of metal nutrient elements of soil aggregates in Eucalyptus plantations. Our results showed that most aggregates consisted of larger particles (>0.25 mm), especially those >2 mm, which were the most abundant. Stands that were thinned by 45% and 60% showed higher soil aggregate stability compared with unthinned (CK) and 30% thinned stands. The metal nutrient content and reserves in the soil aggregates (excluding K) varied significantly across the thinning intensities. The Mg and Fe content were the highest in the 30% thinned stands, while Ca, Mn, Cu, and Zn were the highest in the 45% thinned stands. Larger aggregates (>2 mm) stored the most metal nutrients, whereas smaller ones (<0.25 mm) stored the least. Key factors influencing the metal nutrient content included the soil pH and organic carbon. The aggregate size distribution primarily affected the nutrient reserves in soil aggregates. This study highlights large aggregates as crucial metal nutrient storage sites in Eucalyptus plantation soils. It is recommended to implement measures such as reducing mechanical disturbance, increasing the amount of organic matter, optimizing the stand structure, mitigating water erosion risks, and promoting biological activity, while conducting regular assessments of the aggregate stability.

Author Contributions

Conceptualization, X.H. and F.C.; methodology, X.H. and F.C.; software, Z.L. and J.Y.; validation, X.H. and F.C.; formal analysis, F.C.; investigation, X.H., Z.L., J.Y. and F.C.; resources, F.C.; data curation, X.H., Z.L. and J.Y.; writing—original draft preparation, X.H.; writing—review and editing, X.H. and F.C. All authors have read and agreed to the published version of the manuscript.

Funding

This research was funded by the National Natural Science Foundation of China under grant number 32160359 for the project “Characteristics of microbial communities during decomposition of underground coarse roots of Eucalyptus stumps”. The authors would like to thank all staff involved in the field sampling and experiments for their technical assistance.

Data Availability Statement

The data presented in this study are available on request from the corresponding author.

Conflicts of Interest

The authors declare no conflicts of interest.

References

  1. Xie, Z.S.; Liang, X.; Liu, H.Y.; Deng, X.S.; Cheng, F. Nutrient element stocks and dynamic changes in stump–root systems of Eucalyptus urophylla × E. grandis. Forests 2024, 15, 1. [Google Scholar] [CrossRef]
  2. Resquin, F.; Navarro-Cerrillo, R.M.; Carrasco-Letelier, L.; Casnati, C.R.; Bentancor, L. Evaluation of the nutrient content in biomass of Eucalyptus species from short rotation plantations in Uruguay. Biomass Bioenergy 2020, 134, 1–16. [Google Scholar] [CrossRef]
  3. Gao, G.N.; Huang, X.M.; Xu, H.C.; Wang, Y.; Shen, W.J.; Zhang, W.; Yan, J.L.; Su, X.Y.; Liao, S.S.; You, Y.M. Conversion of pure Chinese fir plantation to multi-layered mixed plantation enhances the soil aggregate stability by regulating microbial communities in subtropical China. For. Ecosyst. 2022, 9, 100078. [Google Scholar] [CrossRef]
  4. Yu, Q.B.; Xu, L.Y.; Wang, M.Y.; Xu, S.X.; Sun, W.X.; Yang, J.Z.; Shi, Y.J.; Shi, X.Z.; Xie, X.Q. Decreased soil aggregation and reduced soil organic carbon activity in conventional vegetable fields converted from paddy fields. Eur. J. Soil Sci. 2022, 73, e13222. [Google Scholar] [CrossRef]
  5. Wang, J.Y.; Deng, Y.S.; Li, D.Y.; Liu, Z.F.; Wen, L.L.; Huang, Z.G.; Jiang, D.H.; Lu, Y.P. Soil aggregate stability and its response to overland flow in successive Eucalyptus plantations in subtropical China. Sci. Total Environ. 2022, 807, 151000. [Google Scholar] [CrossRef]
  6. Ye, Y.Q.; Wang, H.; Luan, J.W.; Ma, J.H.; Ming, A.G.; Niu, B.L.; Liu, C.J.; Freedman, Z.; Wang, J.X.; Liu, S.R. Nitrogen-fixing tree species modulate species richness effects on soil aggregate-associated organic carbon fractions. For. Ecol. Manag. 2023, 546, 121315. [Google Scholar] [CrossRef]
  7. Shi, K.; Liao, J.H.; Zou, X.M.; Chen, H.Y.H.; Delgado-Baquerizo, M.; Wanek, W.; Ni, J.P.; Ren, T.T.; Zhang, C.; Yan, Z.M.; et al. Forest development induces soil aggregate formation and stabilization: Implications for sequestration of soil carbon and nitrogen. Catena 2024, 246, 108363. [Google Scholar] [CrossRef]
  8. Garca-Oliva, F.; Sanford, R.L.J.; Kelly, E.F. Effects of slash-burn management on soil aggregate organic C and N in a tropical deciduous forest. Geoderma 1999, 88, 1–12. [Google Scholar] [CrossRef]
  9. He, Y.; Xu, Z.H.; Chen, C.R.; Burton, J.; Ma, Q.; Ge, Y.; Xu, J.M. Using light fraction and macroaggregate associated organic matters as early indicators for management-induced changes in soil chemical and biological properties in adjacent native and plantation forests of subtropical Australia. Geoderma 2008, 147, 116–125. [Google Scholar] [CrossRef]
  10. Wang, L.F.; Xiao, W.W.; Wang, S.L. Changes of soil aggregate stability and carbon-nitrogen distribution after artificial management of natural secondary forests. J. Beijing For. Univ. 2022, 44, 97–106. [Google Scholar]
  11. Wang, X.H.; Yang, Z.J.; Liu, X.F.; Yang, Y.S.; Wu, J.J.; Fu, L.C.; Chen, T.; Li, W. Effects of natural forest converted to plantations on soil organic carbon distribution and stability of aggregates in middle-subtropics of China. J. Soil Water Conserv. 2014, 28, 177–182,189. [Google Scholar]
  12. Guo, Z.X.; Li, R.N.; Chen, S.D. Effects of subtropical natural forest conversion on soil aggregate stability. J. Subtrop. Resour. Environ. 2023, 18, 62–69+85. [Google Scholar]
  13. Pan, J.C.; Liu, C.; Dong, Z.; Wu, Q.C.; Li, H.L.; Li, Y.B.; Zhang, M.L.; Yang, Z.J. Distribution characteristics of soil aggregates and soil organic carbon in Populus artificial forest with different forest ages in Yellow River flood plain. Res. Soil Water Conserv. 2022, 29, 25–30+37. [Google Scholar]
  14. Wang, C.; Hu, H.B.; Fan, Z.; Lian, J.W. Effects of Quercus acutissima age on composition and organic carbon content of soil water-stable aggregates. Soils 2019, 51, 979–985. [Google Scholar]
  15. Zhang, Y.; Li, H.T.; Wei, Z.C.; Liu, C.H.; Jiang, Z.K.; Ma, X.Q. Soil organic matter characteristics and aggregate stability in different development stages of Chinese fir plantation. Chin. J. Ecol. 2016, 35, 2029–2037. [Google Scholar]
  16. Yang, X.; Xiao, W.F.; Zeng, L.X.; Lei, L.; Li, C.L. Nutrient content and microbial community characteristics of soil aggregates of different sizes in pure and mixed forests of Masson pine. Terr. Ecosyst. Conserv. 2023, 3, 10–19. [Google Scholar]
  17. Yan, Y.; Cui, Y.H.; Fan, R.Y.; Pan, C.L.; Jiang, C.Y.; Hao, J.W.; Ye, S.M. Soil aggregate stability and distribution characteristics of organic nitrogen components in Eucalyptus pure and mixed forests. J. Cent. South Univ. For. Technol. 2023, 43, 149–158. [Google Scholar]
  18. Xie, X.J.; Han, G.Z. Study on soil fractal features and anti-erodibility of soil water-stable aggregates under different Eucalyptus grandis plantations styles. Soils 2014, 46, 725–731. [Google Scholar]
  19. Das, S.; Bhattacharyya, R.; Das Saha, N.; Ghosh, A.; Khan, S.A.; Ahmed, N.; Dey, A.; Bhatia, A.; Pramanik, P.; Kumar, S.N.; et al. Soil aggregate-associated carbon and organic carbon pools as affected by conversion of forest lands to agriculture in an acid soil of India. Soil Till. Res. 2022, 223, 105443. [Google Scholar]
  20. Hu, Y.; Li, Y.; Hou, Y.L. Effects of land use types on stability and organic carbon of soil aggregates in Minjiang River Valley. Res. Soil Water Conserv. 2018, 25, 22–29. [Google Scholar]
  21. Lan, J.C.; Long, Q.X.; Huang, M.Z.; Jiang, Y.X.; Hu, N. Afforestation-induced large macroaggregate formation promotes soil organic carbon accumulation in degraded Karst area. For. Ecol. Manag. 2022, 505, 119884. [Google Scholar]
  22. Bai, Y.X.; Zhou, Y.C.; Du, J.J.; Zhang, X.Y. Tree species identity affects nutrient accumulation and stoichiometric in soil aggregates in mixed plantations of subtropical China. Catena 2024, 236, 107752. [Google Scholar]
  23. Huang, Y.Z.; Wang, S.Q.; Ye, S.M. Effects of Cunninghamia lanceolata stand types on the changes of aggregate-related organic carbon and nutrients in surface soil. Chin. J. Appl. Ecol. 2020, 31, 2857–2865. [Google Scholar]
  24. Chen, T.; Cheng, R.M.; Xiao, W.F.; Zeng, L.X.; Shen, Y.F.; Wang, L.J.; Sun, P.F.; Zhang, M.; Li, J. Response of nitrogen mineralization in soil aggregates to changes in soil moisture and temperature in the Three Gorges Reservoir Area’s typical plantation. For. Res. 2024, 37, 27–38. [Google Scholar]
  25. Wang, Y.; Chen, Z.F.; Huang, K.T.; Chen, X.L.; Chen, L.J.; Wang, Y.Q.; Ke, Q.; Wu, L.C. Effects of non-burning management on soil aggregate nutrients and stability in Eucalyptus plantations. Chin. J. Soil Sci. 2023, 54, 614–625. [Google Scholar]
  26. Baumert, V.L.; Vasilyeva, N.A.; Vladimirov, A.A.; Meier, I.C.; Kögel-Knabner, I.; Mueller, C.W. Root exudates induce soil macroaggregation facilitated by fungi in subsoil. Front. Env. Sci. 2018, 6, 140. [Google Scholar]
  27. Kawakami, T.; Katayama, N.; Nishizawa, K.; Kobayashi, Y.; Suzuki, K.F.; Mori, A.S.; Kobayashi, M. Recovery of earthworm community and development of soil aggregates on scarification site. Jpn. For. Soc. Congr. 2022, 133, 490. [Google Scholar]
  28. Zhang, H.Q.; Schrader, S. Earthworm effects on selected physical and chemical properties of soil aggregates. Biol. Fert. Soils 1993, 15, 229–234. [Google Scholar]
  29. Ma, L.; Shao, M.A.; Li, J. Soil aggregate organic carbon and clover root characteristics as affected by earthworms (Metaphire guillelmi). Land Degrad. Dev. 2022, 33, 3594–3602. [Google Scholar]
  30. Fonte, S.J.; Quintero, D.C.; Velásquez, E.; Lavelle, P. Interactive effects of plants and earthworms on the physical stabilization of soil organic matter in aggregates. Plant Soil 2012, 359, 205–214. [Google Scholar]
  31. Sun, X.Y. Pedology, 2nd ed.; China Forestry Publishing House: Beijing, China, 2021. [Google Scholar]
  32. Li, X.H.; Wang, R.H.; Liu, K.L.; Zhou, Y.H.; Hu, J.Y. Effects of thinning on tree growth and soil physiochemical properties in Cunninghamia lanceolata plantation. J. For. Res. 2023, 28, 251–259. [Google Scholar] [CrossRef]
  33. Li, Y.; Hong, S.X.; Fang, S.Z.; Cui, G.C. Thinning promotes litter decomposition and nutrient release in poplar plantations via altering the microclimate and understory plant diversity. Ann. For. Res. 2023, 66, 3–18. [Google Scholar]
  34. Mao, Z.H.; Zhu, J.J.; Liu, Z.G.; Tan, H.; Cao, B. Effects of thinning on plant species diversity and composition of understory herbs in a larch plantation. Front. For. China 2008, 3, 422–428. [Google Scholar]
  35. Chen, R.Y.; Wei, P.; Liu, J.H. Utilization of compressed Chinese fir thinning wood. Chin. J. Appl. Ecol. 2005, 16, 2306–2310. [Google Scholar]
  36. Cheng, C.P.; Wang, Y.D.; Fu, X.L.; Xu, M.J.; Dai, X.Q.; Wang, H.M. Thinning effect on understory community and photosynthetic characteristics in a subtropical Pinus massoniana plantation. Can. J. For. Res. 2017, 47, 1104–1115. [Google Scholar]
  37. Shen, Y.F.; Wang, N.; Cheng, R.M.; Xiao, W.F.; Yang, S.; Guo, Y. Short-term effects of low intensity thinning on the fine root dynamics of Pinus massoniana plantations in the three Gorges Reservoir Area, China. Forests 2017, 8, 428. [Google Scholar] [CrossRef]
  38. Moore, M.M.; Casey, C.A.; Bakker, J.D.; Springer, J.D.; Fulé, P.Z.; Laughlin, C.D.C. Herbaceous vegetation responses (1992—2004) to restoration treatments in a ponderosa pine forest. Rangel. Ecol. Manag. 2006, 59, 135–144. [Google Scholar]
  39. Zheng, M.H.; Zhou, Z.H.; Luo, Y.Q.; Zhao, P.; Mo, J.M. Global pattern and controls of biological nitrogen fixation under nutrient enrichment: A meta-analysis. Glob. Change Biol. 2019, 25, 3018–3030. [Google Scholar]
  40. Fu, X.L.; Yang, F.T.; Wang, J.L.; Di, Y.B.; Dai, X.Q.; Zhang, X.Y.; Wang, H.M. Understory vegetation leads to changes in soil acidity and in microbial communities 27years after reforestation. Sci. Total Environ. 2015, 502, 280–286. [Google Scholar]
  41. Chen, K.X.; Ye, Y.C.; Mo, L.J.; Huang, Q.L.; Shen, D.C.; Liu, S.S. Effects of thinning on physical and chemical characteristics, soil microorganism and soil enzyme activities of Eucalyptus urophylla plantation. Southwest China J. Agric. Sci. 2017, 30, 2277–2283. [Google Scholar]
  42. Yan, Z.P. Effects of Different Tending Thinning Intensities on Stands and Soil Properties of Eucalyptus Plantations. Master’s Thesis, Central South University of Forestry and Technology, Changsha, China, 2019. [Google Scholar]
  43. Moorhead, D.L.; Rinkes, Z.L.; Sinsabaugh, R.L.; Weintraub, M.N. Dynamic relationships between microbial biomass, respiration, inorganic nutrients and enzyme activities: Informing enzyme-based decomposition models. Front. Microbiol. 2013, 4, 223. [Google Scholar] [CrossRef] [PubMed]
  44. Wu, R.; Cheng, X.Q.; Han, H.R. The Effect of forest thinning on soil microbial community structure and function. Forests 2019, 10, 352. [Google Scholar] [CrossRef]
  45. Zhou, Y.; Chen, Y.X.; Zou, R.; Zhou, W. Effect of stand density on characteristics of soil aggregates in Pinus tabuliformis plantation in Badaling area, Beijing. J. Southwest For. Univ. 2016, 3, 25–30. [Google Scholar]
  46. Candan, F.; Broquen, P. Aggregate stability and related properties in NW Patagonian Andisols. Geoderma 2009, 154, 42–47. [Google Scholar] [CrossRef]
  47. Shen, Y.F.; Cheng, R.M.; Xiao, W.F.; Yang, S. Effects of understory removal and thinning on soil aggregation, and organic carbon distribution in Pinus massoniana plantations in the three Gorges Reservoir Area. Ecol. Indic. 2021, 123, 107323. [Google Scholar] [CrossRef]
  48. Lv, L. Effects of thinning on soil aggregate, active organic carbon and microorganism of Larix gmelinii natural forest. Master’s Thesis, Northeast Forestry University, Harbin, China, 2017. [Google Scholar]
  49. Yu, J.X. Soil aggregate stability and nutrient distribution characteristics of Larix principis-rupprechtii plantations in Taiyue Mountain of Shanxi Province. Master’s Thesis, Beijing Forestry University, Beijing, China, 2019. [Google Scholar]
  50. Liu, S.M.; Tian, D.L.; Xiang, W.H.; Yan, W.D.; Liu, Y.G.; Hu, X.J. The impacts of thinning intensity on overland flow in a Chinese fir plantation. Acta Ecol. Sin. 2015, 35, 5769–5775. [Google Scholar]
  51. Cheng, X.R.; Xing, W.L.; Yuan, H.J.; Yu, M.K. Long-term thinning does not significantly affect soil water-stable aggregates and diversity of bacteria and fungi in Chinese fir (Cunninghamia lanceolata) plantations in eastern China. Forests 2018, 9, 687. [Google Scholar] [CrossRef]
  52. Zhou, C.J.; Wu, Z.L.; Zhou, X.N.; Qiu, R.H. Impact of cutting intensity on litter and soil physicochemical properties of mixed plantations of Cunninghamia lanceolata and broadleaved trees. Chin. J. Appl. Environ. Biol. 2022, 28, 145–151. [Google Scholar]
  53. Harmonized World Soil Database Version 2.0. Available online: https://openknowledge.fao.org/handle/20.500.14283/cc3823en (accessed on 25 March 2025).
  54. Lu, R.K. Analysis Methods of Soil Agricultural Chemistry; China Agricultural Scicnce and Technology Press: Beijing, China, 2000. [Google Scholar]
  55. Yang, Q.; Zhu, D.Y.; Chen, J.; Chen, H. Effects of vegetation restoration models on soil aggregate and organic carbon stock. J. For. Environ. 2022, 42, 631–639. [Google Scholar]
  56. Wu, J.; Yang, G.; Han, X.Y.; Wen, Y.Q.; Yang, Y.W.; Li, W.L.; Liu, Y. Effects of different plantations on soil aggregates in the Nayman sand region. Arid Zone Res. 2022, 39, 1832–1841. [Google Scholar]
  57. Zhang, Z.; Huang, Y.Z.; Zhang, C.; Ye, S.M.; Wang, S.Q. Distribution of phosphorus fractions in soil aggregates in Chinese fir plantations with different stand ages. Chin. J. Appl. Ecol. 2022, 33, 939–948. [Google Scholar]
  58. Wang, D.Y. Effects of density of Larix principis-rupprechtii plantation on organic carbon mineralization of soil aggregate. Master’s Thesis, Beijing Forestry University, Beijing, China, 2020. [Google Scholar]
  59. Fu, Y.; Li, G.L.; Zheng, T.H.; Li, B.Q.; Zhang, T. Splash detachment and transport of loess aggregate fragments by raindrop action. Catena 2017, 150, 154–160. [Google Scholar] [CrossRef]
  60. Hu, X.; Liu, L.Y.; Li, S.J.; Cai, Q.G.; Lü, Y.L.; Guo, J.R. Development of soil crusts under simulated rainfall and crust formation on a loess soil as influenced by polyacrylamide. Pedosphere 2012, 22, 415–424. [Google Scholar] [CrossRef]
  61. Huan, H.E.; Kang, B.J.; Yin, J.; Li, F.; Peng, D.; Li, G.J.; Zha, T.G. Effects of forest management measurements on soil aggregate stability and fine root distribution of Chinese fir in Huaying Mountains of East Sichuan. Chin. J. Soil Sci. 2024, 55, 351–359. [Google Scholar]
  62. Wang, S.S.; Bi, H.X.; Cui, Y.H.; Yun, H.Y.; Ma, X.Z.; Zhao, D.Y.; Hou, G.R. Key indexes and characteristics of soil anti-erodibility of Robinia pseudoacacia with different densities in loess region of western Shanxi Province, northern China. J. Beijing For. Univ. 2022, 44, 94–104. [Google Scholar]
  63. Zhang, Q.Y.; Shao, M.A.; Jia, X.X.; Zhang, C.C. Understory vegetation and drought effects on soil aggregate stability and aggregate-associated carbon on the loess plateau in China. Soil Sci. Soc. Am. J. 2018, 82, 106–114. [Google Scholar]
  64. Eynard, A.; Schumacher, T.E.; Lindstrom, M.J.; Malo, D.D. Aggregate sizes and stability in cultivated South Dakota Prairie Ustolls and Usterts. Soil Sci. Soc. Am. J. 2004, 68, 1360–1365. [Google Scholar]
  65. Amézketa, E. Soil aggregate stability: A review. J. Sustain. Agr. 1999, 14, 83–151. [Google Scholar]
  66. Tian, Y.; Lu, S.G. Amorphous iron oxides protect aggregate-associated organic carbon from microbial utilization and decomposition evidenced from the natural abundance of 13C. Soil Till. Res. 2023, 227, 105623. [Google Scholar]
  67. Lin, Z.; Huang, Z.G.; Liao, D.L.; Huang, W.X.; Huang, J.; Deng, Y.S. Effects of soil organic matter components and iron aluminum oxides on aggregate stability during vegetation succession in granite red soil eroded areas. J. Mt. Sci. 2022, 19, 2634–2650. [Google Scholar]
  68. Liu, K.H.; Lan, J.K.; Zhang, L.; Li, J.B. The features of red soil and their influences on natural environment in Guangxi Zhuang Autonomous Region. Agroenvironmental Prot. 2000, 19, 32–34. [Google Scholar]
  69. Lv, H.B.; Zeng, Z.T.; Yin, G.Q.; Zhao, Y.L. Analysis of mineral composition of red clay in Guangxi. J. Eng. Geol. 2012, 20, 651–656. [Google Scholar]
  70. Liu, X.Y.; Liu, P.; Liu, C. Variation characteristics of organic matters and nutrient elements in typical black soil. Geol. Resour. 2022, 31, 500–507. [Google Scholar]
  71. Shen, Q.; Wu, M.J.; Zhang, M.K. Accumulation and relationship of metals in different soil aggregate fractions along soil profiles. J. Environ. Sci. 2022, 115, 47–54. [Google Scholar] [CrossRef]
  72. Dincher, M.; Calvaruso, C.; Turpault, M.P. Major element residence times in humus from a beech forest: The role of element forms and recycling. Soil Biol. Biochem. 2020, 141, 107674. [Google Scholar] [CrossRef]
  73. Orlov, D.S.; Xie, P. The nature and formation mechanisms of metal-humic complexes. Adv. Soil Sci. 1991, 5, 29–34. [Google Scholar]
  74. Liu, Y.L.; Wang, P.; Wang, J.K. Formation and stability mechanism of soil aggregates: Progress and prospect. Acta Pedol. Sin. 2023, 60, 627–643. [Google Scholar]
  75. Baruah, M.K.; Upreti, M.C. Preferential uptake of Fe (III) by humic acid extracted from lignite. Fuel 1994, 73, 273–275. [Google Scholar] [CrossRef]
Figure 1. Composition (A,B) and stability (C,D) of soil aggregates in Eucalyptus plantations with different thinning intensities. MWD, mean weight diameter; GMD, geometric mean diameter. Lowercase letters indicate significant differences at the 0.05 level between different soil aggregate sizes (or thinning intensities) within the same thinning intensity (or soil aggregate size) using one-way ANOVA with Duncan’s multiple comparison test.
Forests 16 00609 g001
Figure 2. K (A), Ca (B), Mg (C), Fe (D), Mn (E), Cu (F), and Zn (G) content of soil aggregates in Eucalyptus plantations with different thinning intensities. Lowercase letters indicate significant differences at the 0.05 level between different soil aggregate sizes within the same thinning intensity using one-way ANOVA with Duncan’s multiple comparison test.
Forests 16 00609 g002
Figure 3. K (A), Ca (B), Mg (C), Fe (D), Mn (E), Cu (F), and Zn (G) content of different soil aggregate sizes in Eucalyptus plantations. Lowercase letters indicate significant differences at the 0.05 level between different thinning intensities within the same soil aggregate size using one-way ANOVA with Duncan’s multiple comparison test.
Forests 16 00609 g003
Figure 4. Total reserves of metal nutrient elements in soil aggregates under different thinning intensities (A,C) and sizes (B,D). Lowercase letters indicate significant differences at the 0.05 level between different thinning intensities (A) or within the same soil aggregate size (C), while lowercase letters also indicate significant differences at the 0.05 level between different soil aggregate sizes (B) within the same thinning intensity (D) using one-way ANOVA with Duncan’s multiple comparison test.
Forests 16 00609 g004
Figure 5. K (A), Ca (B), Mg (C), Fe (D), Mn (E), Cu (F), and Zn (G) reserves in soil aggregates in Eucalyptus plantations with different thinning intensities. Lowercase letters indicate significant differences at the 0.05 level between different soil aggregate sizes within the same thinning intensity using one-way ANOVA with Duncan’s multiple comparison test.
Forests 16 00609 g005
Figure 6. K (A), Ca (B), Mg (C), Fe (D), Mn (E), Cu (F), and Zn (G) reserves of soil aggregates of different sizes in Eucalyptus plantations. Lowercase letters indicate significant differences at the 0.05 level between different thinning intensities within the same soil aggregate size using one-way ANOVA with Duncan’s multiple comparison test.
Forests 16 00609 g006
Figure 7. The relative proportion of metal nutrient element reserves in soil aggregates of different sizes under different thinning intensities.
Forests 16 00609 g007
Figure 8. K (A), Ca (B), Mg (C), Fe (D), Mn (E), Cu (F), and Zn (G) contribution rates of soil aggregates in Eucalyptus plantations with different thinning intensities. Lowercase letters indicate significant differences at the 0.05 level between different soil aggregate sizes within the same thinning intensity using one-way ANOVA with Duncan’s multiple comparison test.
Forests 16 00609 g008
Figure 9. K (A), Ca (B), Mg (C), Fe (D), Mn (E), Cu (F), and Zn (G) contribution rates of different soil aggregate sizes in Eucalyptus plantations. Lowercase letters indicate significant differences at the 0.05 level between different thinning intensities within the same soil aggregate size using one-way ANOVA with Duncan’s multiple comparison test.
Forests 16 00609 g009
Figure 10. RDA of metal nutrient element content in soil aggregates and environmental factors. SOC, soil organic carbon; ASOC, aggregate soil organic carbon; SpH, soil pH; ApH, aggregate pH.
Forests 16 00609 g010
Figure 11. RDA of metal nutrient element stocks in soil aggregates and environmental factors. TS, total stock; AS, aggregate size; PAS, proportion of aggregate size; SOC, soil organic carbon; ASOC, aggregate soil organic carbon; ApH, aggregate pH; TN, tree number.
Forests 16 00609 g011
Table 1. Overview of Eucalyptus stands with different thinning intensities.
Thinning
Intensity
Number of Trees
(Tree/ha)
Tree Height
(m)
Diameter at Breast Height
(cm)
AspectSlope Degree
(°)
CK13802327Northwest25
30%9662326Northwest27
45%7592226Northwest23
60%5522227Northwest24
Table 2. Physical and chemical characteristics of soils of Eucalyptus plantations with different thinning intensities.
Soil FactorThinning Intensity
CK30%45%60%
SBD (g/cm3)1.38 ± 0.14 b1.26 ± 0.13 b1.54 ± 0.10 a1.38 ± 0.12 b
SCP (%)33.67 ± 3.62 b38.09 ± 4.60 ab40.35 ± 5.99 a37.39 ± 4.32 ab
SNCP (%)7.92 ± 2.79 b13.02 ± 5.12 a6.19 ± 4.26 b7.53 ± 4.24 b
STP (%)41.59 ± 0.92 b51.10 ± 4.77 a46.54 ± 5.66 ab44.92 ± 3.25 b
SWC (%)15.73 ± 0.29 c21.25 ± 0.71 a20.11 ± 0.38 b19.80 ± 0.13 b
SpH4.42 ± 0.09 b4.39 ± 0.05 b5.51 ± 0.03 a4.47 ± 0.04 b
SOC (g/kg)17.56 ± 1.33 b21.98 ± 0.68 a15.41 ± 0.38 c13.84 ± 0.21 d
STN (g/kg)1.03 ± 0.07 b1.32 ± 0.06 a1.09 ± 0.01 b0.91 ± 0.02 c
STP (g/kg)0.20 ± 0.00 b0.28 ± 0.00 a0.21 ± 0.01 b0.28 ± 0.01 a
SAN (mg/kg)3.45 ± 0.45 b3.43 ± 0.63 b4.29 ± 0.74 a b5.01 ± 0.86 a
SNN (mg/kg)6.92 ± 0.14 a7.08 ± 0.15 a4.00 ± 0.16 c6.56 ± 0.16 b
SAP (mg/kg)4.63 ± 0.46 c6.77 ± 0.48 b2.15 ± 0.30 d21.37 ± 1.68 a
Note: SBD, soil bulk density; SCP, soil capillary porosity; SNCP, soil noncapillary porosity; STP, soil total porosity; SWC, soil water content; SpH, soil pH; SOC, soil organic carbon; STN, soil total nitrogen; STP, soil total phosphorus; SAN, soil ammonium nitrogen; SNN, soil nitrate nitrogen; SAP, soil available phosphorus. Lowercase letters indicate significant differences at the 0.05 level between different thinning intensities using one-way ANOVA with Duncan’s multiple comparison test.
Table 3. Physical and chemical characteristics of soil aggregates of Eucalyptus plantations with different thinning intensities.
Soil FactorSizeThinning Intensity
CK30%45%60%
AWC (%)<0.25 mm11.83 ± 0.28 Bc15.97 ± 0.07 Aa14.70 ± 0.02 Ab11.02 ± 0.09 Bd
0.25–1 mm13.31 ± 0.26 Ac15.71 ± 0.06 Aa13.83 ± 0.25 Bb11.15 ± 0.15 Bd
1–2 mm12.82 ± 0.14 Ab14.88 ± 0.41 Ba12.35 ± 0.17 Db10.99 ± 0.31 Bc
>2 mm12.99 ± 0.34 Ab15.21 ± 0.02 Ba13.02 ± 0.22 Cb11.55 ± 0.17 Ac
ApH<0.25 mm4.46 ± 0.04 Ac4.50 ± 0.04 Ac5.87 ± 0.02 Ba4.80 ± 0.05 Ab
0.25–1 mm4.43 ± 0.04 Ad4.53 ± 0.04 Ac5.93 ± 0.02 Ba4.79 ± 0.08 Ab
1–2 mm4.52 ± 0.14 Ac4.55 ± 0.03 Ac5.93 ± 0.03 Ba4.72 ± 0.02 Ab
>2 mm4.46 ± 0.04 Ad4.54 ± 0.01 Ac6.23 ± 0.06 Aa4.79 ± 0.03 Ab
ASOC (g/kg)<0.25 mm21.10 ± 0.07 Ac31.89 ± 0.92 Aa24.28 ± 0.56 Ab18.14 ± 0.42 Ad
0.25–1 mm18.81 ± 0.26 Bc24.32 ± 0.56 Ba22.34 ± 0.66 Bb18.58 ± 0.80 Ac
1–2 mm15.55 ± 0.09 Cb19.28 ± 0.42 Ca18.83 ± 0.05 Ca15.71 ± 0.38 Bb
>2 mm15.13 ± 0.54 Cc17.42 ± 0.48 Db19.10 ± 0.41 Ca15.62 ± 0.17 Bc
ATN (g/kg)<0.25 mm1.38 ± 0.04 Ab1.93 ± 0.04 Aa1.86 ± 0.04 Aa1.25 ± 0.05 Ac
0.25–1 mm1.22 ± 0.02 Bc1.57 ± 0.04 Bb1.67 ± 0.09 Ba1.27 ± 0.02 Ac
1–2 mm1.02 ± 0.01 Cd1.29 ± 0.01 Cb1.44 ± 0.02 Da1.08 ± 0.05 Bc
>2 mm0.98 ± 0.02 Cd1.13 ± 0.05 Db1.54 ± 0.02 Ca1.05 ± 0.02 Bc
ATP (g/kg)<0.25 mm0.24 ± 0.02 Ad0.32 ± 0.00 Ac0.54 ± 0.03 Ba0.37 ± 0.01 Bb
0.25–1 mm0.23 ± 0.01 Ad0.31 ± 0.01 ABc0.76 ± 0.01 Aa0.39 ± 0.01 Ab
1–2 mm0.21 ± 0.00 Bd0.29 ± 0.02 Bc0.53 ± 0.03 Ba0.37 ± 0.01 Bb
>2 mm0.21 ± 0.01 Bd0.29 ± 0.01 Bc0.56 ± 0.02 Ba0.39 ± 0.01 Ab
AAN (mg/kg)<0.25 mm5.87 ± 0.19 Aa5.01 ± 0.43 Ab5.31 ± 0.43 Aab1.98 ± 0.10 Ac
0.25–1 mm3.59 ± 0.24 Bb1.60 ± 0.02 Cd4.71 ± 0.25 Aa2.20 ± 0.19 Ac
1–2 mm2.98 ± 0.08 Cb2.58 ± 0.16 Bb4.66 ± 0.41 Aa1.62 ± 0.21 Bc
>2 mm3.79 ± 0.18 Ba3.20 ± 0.83 Ba3.92 ± 0.22 Ba1.33 ± 0.16 Bb
ANN (mg/kg)<0.25 mm19.98 ± 0.01 Bc28.38 ± 0.45 Ab45.14 ± 0.93 Aa20.79 ± 0.15 Ac
0.25–1 mm20.57 ± 0.47 Ac22.83 ± 0.36 Bb31.11 ± 0.64 Ba19.30 ± 0.40 Bd
1–2 mm16.83 ± 0.24 Cb16.67 ± 0.35 Cb25.10 ± 0.43 Ca15.54 ± 0.71 Cc
>2 mm15.69 ± 0.09 Db15.62 ± 0.18 Db23.21 ± 0.62 Da15.14 ± 0.22 Cb
AAP (mg/kg)<0.25 mm5.62 ± 0.16 Ac7.17 ± 0.06 Bc107.13 ± 4.26 Ca44.80 ± 0.48 Cb
0.25–1 mm4.23 ± 0.19 Bc5.67 ± 0.55 Bc229.50 ± 14.75 Aa54.35 ± 0.97 ABb
1–2 mm3.93 ± 0.19 BCc5.83 ± 1.27 Bc134.71 ± 4.96 Ba50.97 ± 3.22 Bb
>2 mm3.62 ± 0.29 Cd21.95 ± 12.75 Ac133.67 ± 10.40 Ba56.02 ± 3.23 Ab
Note: AWC, aggregate water content; ApH, aggregate pH; ASOC, aggregate soil organic carbon; ATN, aggregate total nitrogen; ATP, aggregate total phosphorus; AAN, aggregate ammonium nitrogen; ANN, aggregate nitrate nitrogen; AAP, aggregate available phosphorus. Lowercase letters indicate significant differences at the 0.05 level between different thinning intensities within the same soil aggregate size, and uppercase letters indicate significant differences at the 0.05 level between different soil aggregate sizes within the same thinning intensity using one-way ANOVA with Duncan’s multiple comparison test.
Table 4. Explanation and contribution rates of individual factors to metal nutrient element content of soil aggregates in RDA.
Soil FactorExplanation (%)Contribution (%)Pseudo-Fp
SpH66.368.390.70.002
SOC22.623.291.50.002
ApH3.53.620.30.002
ASOC1.21.27.90.002
STN0.40.53.10.052
MWD0.60.64.40.058
GMD0.20.21.8-
SBD0.60.65.10.062
SCP0.90.99.6-
AS0.20.22.20.096
PAS0.20.22.30.100
TH<0.1<0.10.10.884
STP<0.1<0.10.40.662
Note: SpH, soil pH; SOC, soil organic carbon; ApH, aggregate pH; ASOC, aggregate soil organic carbon; STN, soil total nitrogen; MWD, mean weight diameter; GMD, geometric mean diameter; SBD, soil bulk density; SCP, soil capillary porosity; AS, aggregate size; PAS, proportion of aggregate size; TH, tree height; STP, soil total phosphorus.
Table 5. Explanation and contribution rates of individual factors to metal nutrient element stocks in soil aggregates in RDA.
Soil FactorExplanation (%)Contribution (%)Pseudo-Fp
PAS89.691.43970.002
SOC3.63.623.40.002
ApH2.22.220.50.002
STN0.50.54.70.018
ASOC0.40.44.70.034
AS0.30.34.00.028
SBD0.30.33.5-
MWD0.30.33.80.056
SpH0.20.23.0-
DBH0.10.11.80.166
STP<0.1<0.10.50.528
SNCP<0.1<0.1<0.10.880
Note: PAS, proportion of aggregate size; SOC, soil organic carbon; ApH, aggregate pH; STN, soil total nitrogen; ASOC, aggregate soil organic carbon; AS, aggregate size; SBD, soil bulk density; MWD, mean weight diameter; SpH, soil pH; DBH, diameter at breast height; STP, soil total phosphorus; SNCP, soil noncapillary porosity.
Disclaimer/Publisher’s Note: The statements, opinions and data contained in all publications are solely those of the individual author(s) and contributor(s) and not of MDPI and/or the editor(s). MDPI and/or the editor(s) disclaim responsibility for any injury to people or property resulting from any ideas, methods, instructions or products referred to in the content.

