Article

Hotspots of Chinese Endemic Tree Plant Diversity Under Different Climate and Land Use Scenarios

1
Key Laboratory of Biodiversity Conservation of National Forestry and Grassland Administration, Ecology and Nature Conservation Institute, Chinese Academy of Forestry, Beijing 100091, China
2
Co-Innovation Centre for Sustainable Forestry in Southern China, Nanjing Forestry University, Nanjing 210037, China
3
School of Geography and Remote Sensing, Guangzhou University, Guangzhou 510006, China
*
Author to whom correspondence should be addressed.
Forests 2025, 16(4), 599; https://doi.org/10.3390/f16040599
Submission received: 19 February 2025 / Revised: 21 March 2025 / Accepted: 26 March 2025 / Published: 29 March 2025
(This article belongs to the Section Forest Biodiversity)

Abstract

:
Climate and land use directly influence species’ spatial distribution, which can alter species’ distribution and lead to significant changes in biodiversity spatial patterns. There are few reports on how climate and land use changes affect plant biodiversity spatial distribution patterns. This study focuses on Chinese endemic tree plants, analyzing the changes in hotspots under current and future conditions (2050 SSP1–2.6 and SSP5–8.5 climate and land use scenarios). Using spatial distribution data of endemic tree plants in China, the Biomod2-integrated species distribution model, and the “top 5% diversity” hotspot identification method, we examine species richness (SR), functional diversity (FD), and phylogenetic diversity (PD). The results indicate that with changes in climate and land use: (1) significant shifts occur in the spatial distribution patterns of hotspots. Although the number of hotspots identified by different diversity indices varies, fragmentation increases across all scenarios. (2) Hotspots tend to concentrate in low-latitude and high-altitude regions. In future scenarios, the longitudinal position of hotspots is significantly lower, and their elevation is significantly higher compared to the current scenario. (3) The spatial patterns of plant diversity in hotspots also change significantly. The SR and PD patterns show similar distribution trends across different scenarios. Under current conditions, the highest values of SR and PD are found in the eastern mountainous regions, such as the Wuyi Mountains and Nanling Mountains, while in future scenarios, they shift to central and western mountainous areas like the Qinling Mountains and Hengduan Mountains. The FD distribution pattern differs, with its highest values consistently found in southeastern Tibet and the Hengduan Mountains across all scenarios. Thus, climate and land use changes not only alter the spatial distribution of hotspots but also change plant diversity within them. This study provides scientific evidence for regional-scale biodiversity conservation under global change.

1. Introduction

Biodiversity is the fundamental structure and backbone of ecosystems, serving as the foundation for ecosystem functions and the maintenance of ecosystem services. It plays an irreplaceable and crucial role in climate regulation, environmental improvement, and other aspects, forming the material basis for human survival [1]. Due to human activities, the global ecological environment is undergoing unprecedented changes, which pose increasingly more severe threats to biodiversity [2]. Studies have indicated that Earth is facing the crisis of a “sixth mass extinction” [3]. Climate and land use changes are considered to be the primary threats to biodiversity, as they alter species’ spatial distributions, consequently changing the patterns of species diversity. This may lead to a large-scale extinction of species within the next century [4]. Therefore, assessing the impacts of climate and land use changes on species distribution and biodiversity is critical for formulating biodiversity conservation policies, planning nature reserves, and managing ecosystems, which has consistently been one of the focal points in biodiversity research.
Plant diversity is an essential component of biodiversity, and its geographic distribution is closely related to climate. The water and thermal conditions required for plant growth are primarily controlled by regional temperature and precipitation [5,6]. Climate change has driven widespread shifts in plant distributions, with suitable habitats expected to move toward higher latitudes and elevations [7,8,9,10,11]. Land use can impact species by altering or destroying their habitats. During long-term evolutionary processes, species have developed relatively stable adaptive relationships with their surroundings and other organisms. Consequently, modifications in land use often result in shifts in species’ distribution ranges [12]. The cumulative or synergistic effects of climate and land use change are expected to significantly affect biodiversity in the coming century [13,14]. In other words, habitat loss and fragmentation may hinder species migration [15], limiting their ability to adapt, while climate change could further degrade habitats [16], increasing the risk of extinction. Therefore, predicting the potential distribution changes in species in response to climate and land use changes has become increasingly important for biodiversity conservation. However, most studies primarily focus on climate change alone, and research on how plant diversity distribution patterns change under the combined influence of climate and land use change remains insufficient.
Given limited resources, the most effective and widely used strategy for maximizing species protection at minimal cost is to prioritize biodiversity hotspots [17]. Traditionally, scientists have defined biodiversity hotspots as regions with extremely high species richness, or a significant number of endemic or endangered species [18,19], using them as the primary basis for conservation planning. This method emphasizes the importance of taxonomic diversity (e.g., species richness, SR), but it implicitly assumes that all species hold equal conservation value, ignoring their ecological and evolutionary distinctiveness [20,21]. With the advancement of scientific research, more studies have adopted multi-metric integrated approaches to comprehensively identify hotspots [22,23,24,25]. While species diversity reflects the number and distribution of species, it does not fully capture underlying ecological and evolutionary processes. Phylogenetic diversity (PD) represents the diversity of species’ genetic composition and evolutionary history [20,21], and it is crucial for maintaining community evolutionary potential. Functional diversity (FD) refers to the variation in species’ ecological traits, which are essential for ecosystem productivity, stability, and services [26]. These three different dimensions of diversity provide distinct information on biodiversity. Furthermore, current methods for identifying biodiversity hotspots mainly rely on species’ actual distributions, clearly showing the current status of hotspots, but they do not predict potential future changes. Therefore, against the backdrop of escalating climate and land use changes, analyzing the potential distribution of species and patterns of biodiversity distribution under different climate and land use scenarios, both current and future, and identifying potential hotspots, is crucial for formulating macro-scale biodiversity conservation plans.
Species distribution models (SDMs) are the primary tools used to predict changes in species distribution under future environmental scenarios. With advances in computer technology and data science, species distribution models have been widely applied in biodiversity assessments [27], potential species distribution predictions [28], and conservation of endangered species [29,30]. Commonly used models include random forest (RF), generalized linear model (GLM), and maximum entropy (MaxEnt), all of which support research on species distribution patterns and inform conservation strategies. The algorithms and principles of these models vary, making it challenging to determine the most suitable approach for accurate predictions [31]. Recently developed ensemble models (EM) [32] have addressed this uncertainty and have been widely used in simulating and assessing species’ potential distributions at macro scales [33]. However, current applications of EM are mostly focused on studying the suitable habitat changes in individual species, while research on the changes in species diversity spatial distribution patterns is still rare.
China is one of the most biodiverse countries in the world [34]. However, increasing climate and land use changes have severely threatened its biodiversity, making research in this field highly valuable for achieving global conservation goals [35]. In the context of global change, effectively implementing forward-looking conservation strategies for China’s woody plant communities requires a comprehensive understanding of species distribution patterns under different potential scenarios [36]. Endemic species, due to their limited geographic ranges, are more vulnerable to extinction risks compared to species with wider distribution. As such, they have become one of the most effective surrogate indicators for identifying priority conservation areas or hotspots [18]. China has an exceptionally high species richness of seed plants, with endemics accounting for more than half of the total seed plant species [37]. Therefore, this study, based on species distribution data and using ensemble species distribution model, simulates the potential distribution of Chinese endemic tree plants under current and future climate and land use scenarios, and identifies potential hotspots for endemic tree plants diversity. The study aims to explore the following for both current and future scenarios: (1) the spatial distribution patterns of potential hotspots and their changes, and (2) the spatial distribution patterns of plant diversity within these potential hotspots and their changes.

2. Materials and Methods

2.1. Dataset

2.1.1. Species Distribution Data

The distribution data of Chinese endemic tree plants used in this study are derived from the established catalog of Chinese endemic seed plants and its distribution database [37], with species distribution or occurrence records at the county-level. The dataset was primarily constructed using resources such as the Flora of China (http://flora.huh.harvard.edu/china/ (accessed on 15 May 2021)), local floras, and major taxonomic and ecological journals. Due to the continuous updates of various data sources, the county-level distribution and elevation information for the species in the dataset were updated in 2021 [38].
County-level distribution data often overestimate the actual distribution range of species. To address this, we overlaid the county-level distribution data, elevation ranges, Chinese administrative boundary data, and digital elevation model (DEM) data to obtain more accurate distribution information for Chinese endemic tree plants. The above species distribution information was converted into a spatial grid with a resolution of 50 km × 50 km in ArcGIS10.2 (ESRI, Redlands, CA, USA). Since the performance of species distribution models depends on the sample size, we included only species with at least 20 occurrence records, following standard practice [39]. Finally, a total of 14,749 distribution records for 314 Chinese endemic tree plants were selected.

2.1.2. Plant Functional Trait Data

To estimate functional diversity, this study focused on three key functional traits of Chinese endemic tree plants: leaf length (cm), maximum height (meters), and flowering duration (months). Maximum height refers to the known maximum potential height of a species rather than its average height, in order to avoid the influence of uncertain growth factors on the results [40]. Leaf length represents the average length of leaves for each species. Flowering duration refers to the total number of months a species takes to complete its entire flowering period. Based on the identified catalog of Chinese endemic tree plants, functional trait data were collected and compiled primarily from platforms such as the Flora of China (http://flora.huh.harvard.edu/china/, (accessed on 18 February 2025)) and other online data-sharing resources. A functional trait dataset for 314 species, each containing at least one known trait value, was established.
Given the incompleteness of trait data, the genus/family mean method (GorFmean) was used to fill in missing values. In this approach, absent trait values for a species were replaced with the average trait values of all species within the genus that have available trait values (or by the family average if genus-level data are unavailable). This method has been widely applied in functional biogeographical studies [41].

2.1.3. Environmental Data

Current and future climate data for constructing species distribution model were obtained from the global climate database WorldClim (http://www.worldclim.org (accessed on 29 July 2024), Version 2.1), with a resolution of 2.5′ × 2.5′. Since there is strong collinearity among many environmental variables, which can lead to model overfitting, a Pearson correlation analysis was conducted on 19 bioclimatic variables. Considering their influence on the distribution of Chinese endemic tree plants, five climate variables with Pearson correlation coefficients less than 0.7 were selected: isothermally (bio3), temperature annual range (bio7), mean temperature of warmest quarter (bio10), precipitation seasonality (bio15) and precipitation of wettest quarter (bio16). Future climate data were sourced from the BCC-CSM2-MR model (Beijing Climate Center, China), which predicts two different climate change scenarios for 2050 (average for 2041–2060): SSP1-2.6 and SSP5-8.5. The SSP1-2.6 scenario represents a pathway of significant CO2 emission reductions, with net-zero emissions expected by mid-century and a projected temperature increase of approximately 1.8 °C by the end of the century. The SSP5-8.5 scenario represents a fossil-fuel-dominated development pathway, with a projected global average temperature increase of about 4.4 °C by the end of the century. For ease of reference in the text, the SSP1-2.6 scenario and SSP5-8.5 scenario will be referred to as the optimistic and pessimistic scenarios, respectively.
Current and future land use data were sourced from the Figshare database (http://www.figshare.com (accessed on 30 July 2024)), which provides global 1 km land use and land cover data from 2020 to 2100 [42]. This dataset categorizes global land use and land cover into six types: cropland, forest, grassland, urban, barren, and water. The future land use and land cover data includes five Shared Socioeconomic Pathways (SSPs). For this study, the two scenarios corresponding to the future climate data were selected.
All environmental data were resampled, registered, clipped, and formatted using ArcGIS10.2 (ESRI, Redlands, CA, USA), with their coordinate system standardized to the Albers Equal Area Conic Projection and a resolution aligned with the species distribution data (50 km × 50 km).

2.1.4. Phylogenetic Tree Construction

In this study, a phylogenetic tree for the 314 Chinese endemic tree plants was constructed using the R package “V. PhyloMaker2” [43]. V.PhyloMaker2 employs the Plantlist, Leipzig Catalogue of Vascular Plants, and World Plants databases for taxonomic correction, with a primary reliance on mega-trees published by Zanne, Smith and Brown, Swanepoel, and others [44,45,46] to generate the phylogenetic tree. The GBOTB.extended.WP.tre tree was chosen as the backbone supertree, as it best covers the species in this study.

2.2. Data Analyses

2.2.1. Species Distribution Modeling

Species distribution models (SDMs) were constructed using the Biomod2 package in R4.4.1 [47], a widely utilized tool for SDMs that integrates multiple algorithms and ensemble modeling to enhance prediction accuracy. We employed five foundational niche modeling algorithms for ensemble modeling: classification tree analysis (CTA), generalized linear model (GLM), generalized boosting model (GBM), random forest (RF), and maximum entropy (MaxEnt), covering classification, regression, and machine learning approaches. Default parameter settings in Biomod2 were applied for all algorithms.
Since only species presence data were available and most models require absence data, two sets of pseudo-absence points (1000 points per set) were randomly generated to mitigate uncertainty from pseudo-absence placement. The species occurrence dataset was split into training (80%) and validation (20%) subsets. To reduce bias from dataset partitioning, this process was repeated 10 times. Consequently, each species generated 100 models (2 pseudo-absence sets × 5 algorithms × 10 replicates) for ensemble modeling. Model performance was evaluated using the true skill statistic (TSS) [48] and the area under the receiver operating characteristic curve (AUC) [49]. TSS, a threshold-dependent metric ranging from −1 to 1, combines sensitivity and specificity, with values >0.7 indicating robust discrimination. AUC, a threshold-independent metric, measures the probability of correct presence-background discrimination (perfect model: AUC = 1). To minimize uncertainty from poorly fitted models, only single-model results with TSS > 0.7 and AUC > 0.7 were retained. Ensemble models were constructed using a weighted averaging approach. Species occurrence probabilities from ensemble outputs were converted to binary predictions (1 = presence, 0 = absence) using the MaxTSS threshold method [35] (Table S1).

2.2.2. Diversity Index Calculation

SR (species richness), the most fundamental measure of biodiversity, was calculated as the total number of Chinese endemic tree plants per grid cell [50]. FD (functional diversity) was quantified using functional richness (FRic), which represents the volume of multidimensional functional trait space occupied by a community, reflecting potential resource utilization [51]. Higher FRic indicates broader trait ranges and greater resource-use efficiency [52], while reduced FRic suggests diminished buffering capacity against environmental stressors [53]. PD (phylogenetic diversity) was measured as Faith’s PD, the sum of branch lengths in the phylogenetic tree for all species within a grid cell [21].
Diversity indices were computed using the “raster”, “FD”, and “picante” packages in R. Spatial visualization of diversity maps was conducted in ArcGIS 10.2 (ESRI, Redlands, CA, USA).

2.2.3. Hotspots Identification

Biodiversity hotspots for Chinese endemic tree plants were identified using the “top 5% diversity” algorithm [24]. Grid cells ranking in the top 5% for SR, FD, or PD were designated as SR hotspots, FD hotspots, or PD hotspots, respectively. These classifications were used for subsequent spatial analyses.

3. Results

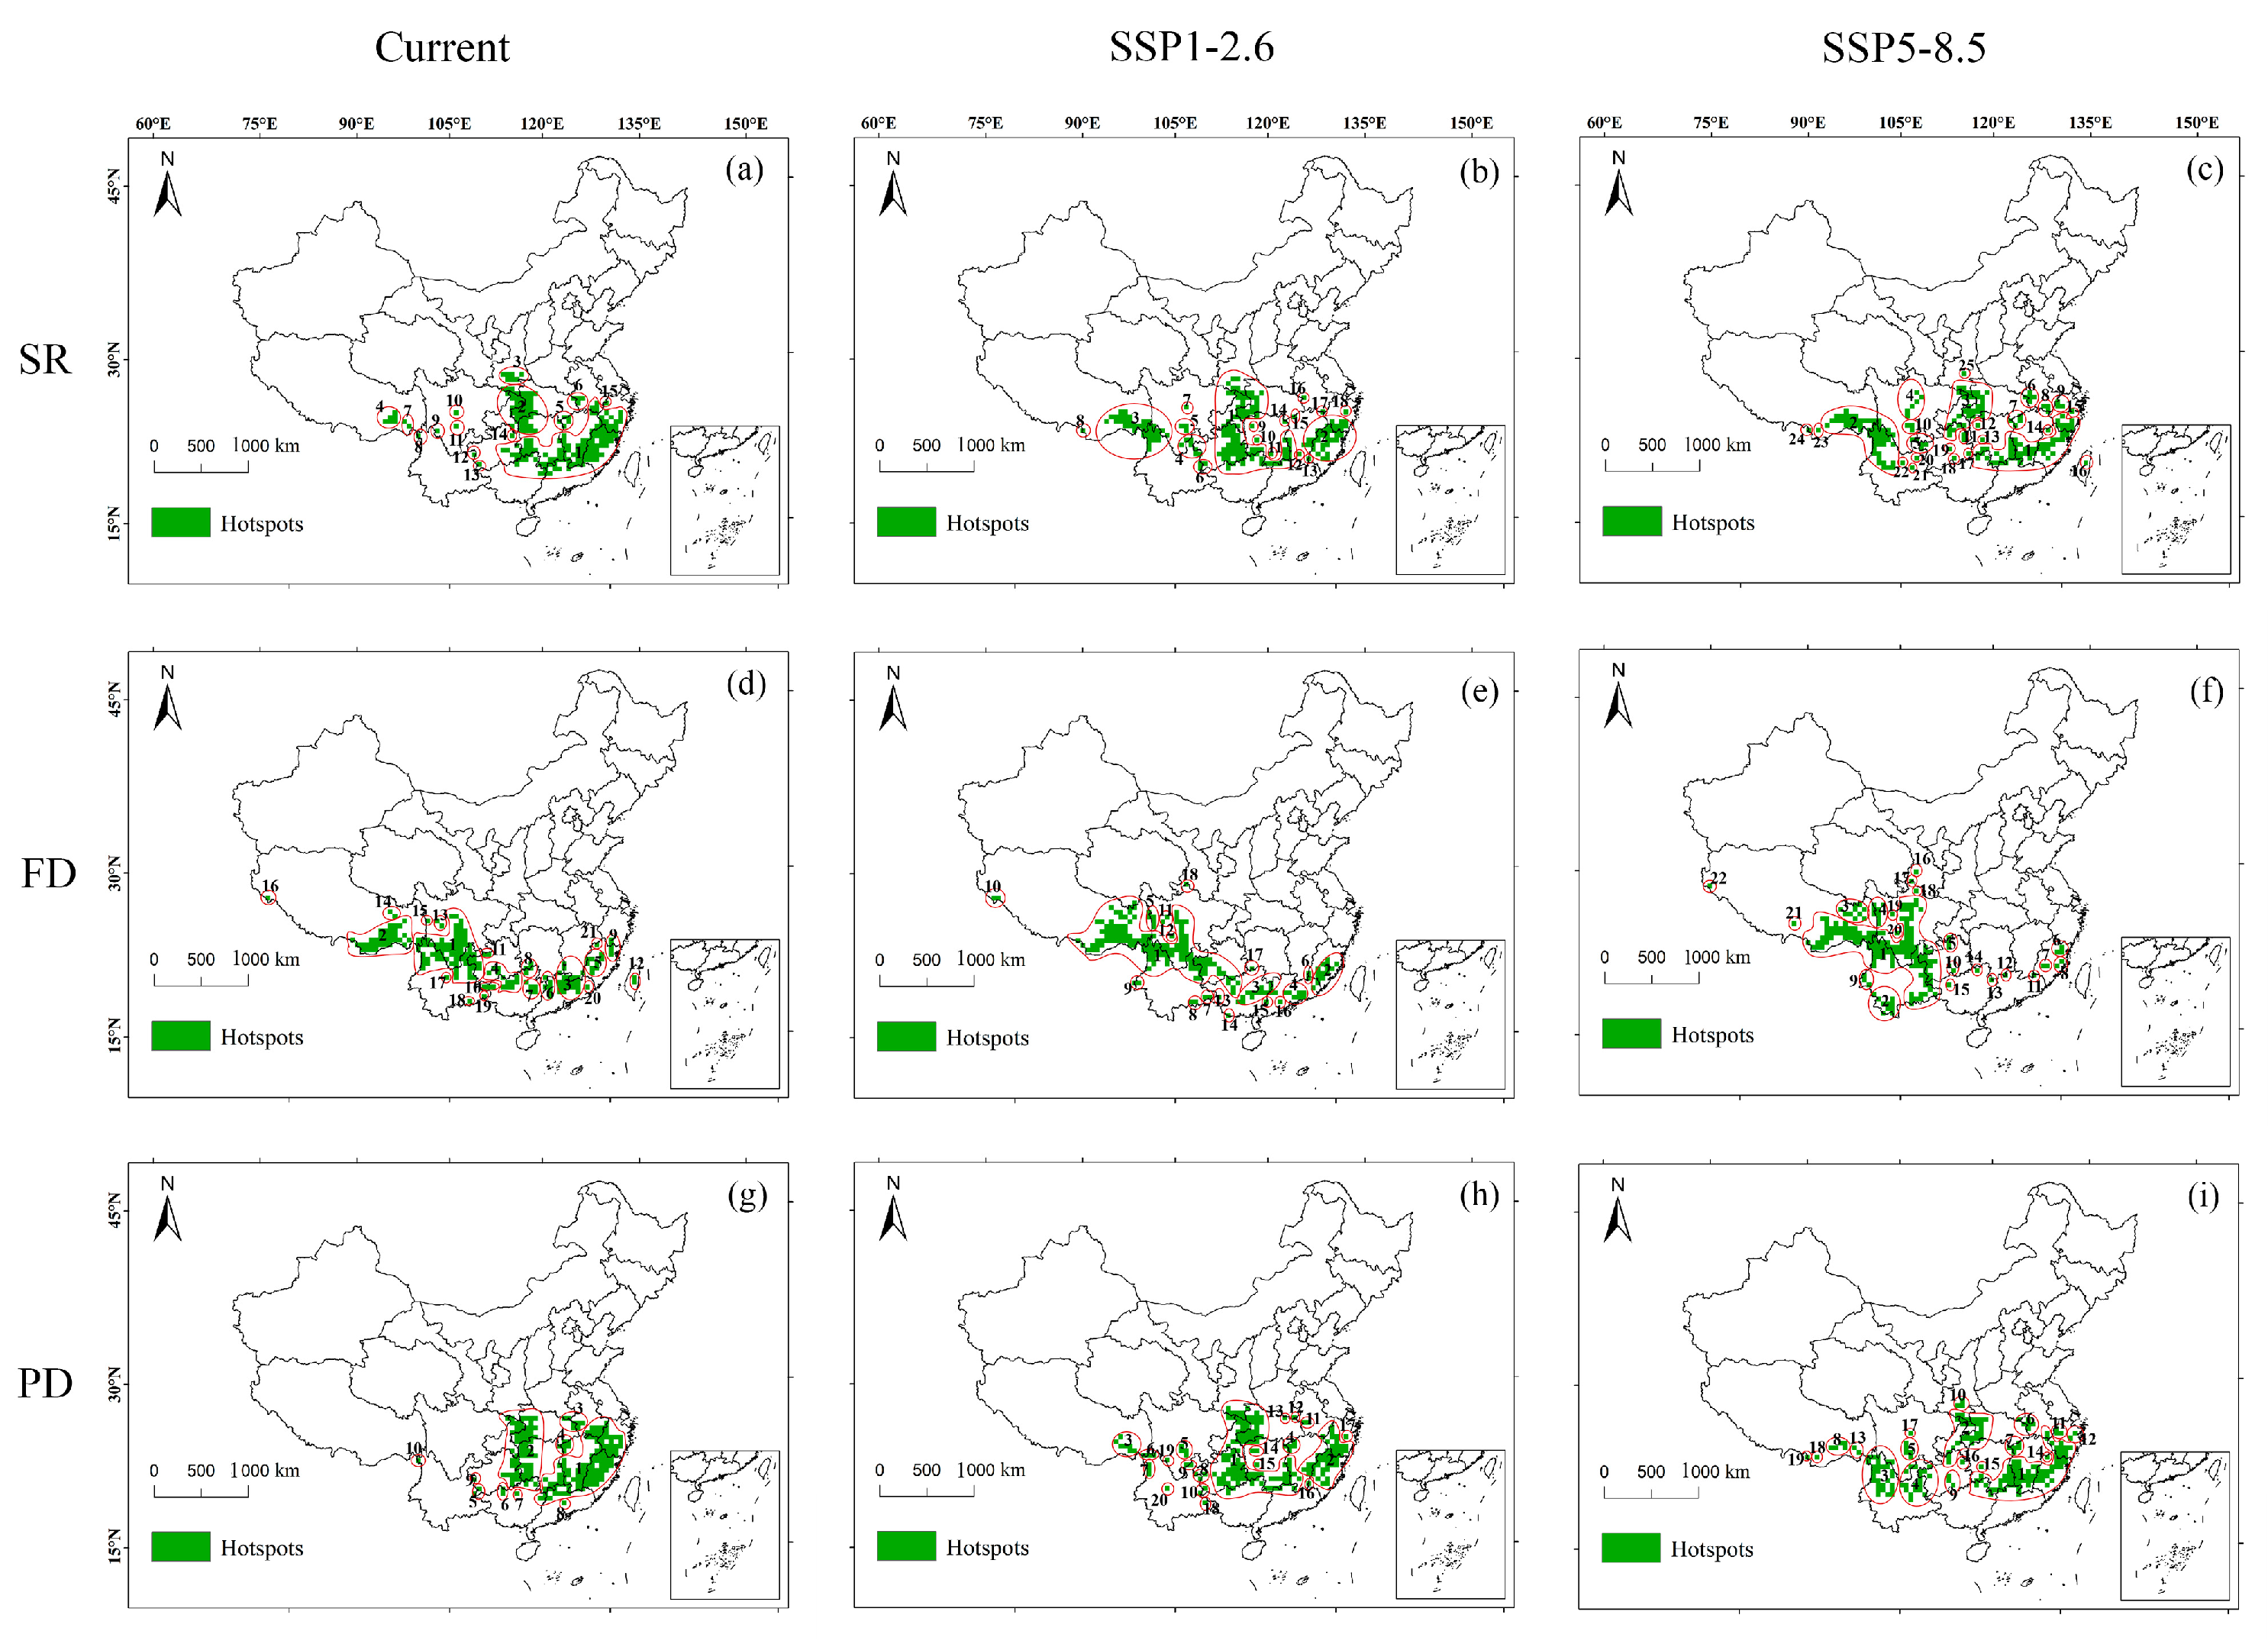
3.1. Spatial Distribution of Potential Hotspots for the Chinese Endemic Tree Plant Diversity Under Different Climate and Land Use Scenarios

Under the current scenario, 15 SR hotspots were identified, primarily located in the Nanling, Tianmu, Wuyi, Yandang, Daiyun, Luoxiao, Xuefeng, and Wuling mountain ranges, as well as mountainous areas in eastern Chongqing and western Hubei. Under the optimistic scenario, 18 SR hotspots were concentrated in the Daiyun, Yandang, Wuyi, and Nanling mountain ranges, eastern Guizhou, the Qinling, Daba, Wudang, and Hengduan mountain ranges. Under the pessimistic scenario, 25 SR hotspots were distributed across the Daiyun, Yandang, Wuyi, Nanling, Qinling, Wudang, and Hengduan mountain ranges, as well as southeastern Tibet. PD hotspots exhibited spatial patterns similar to SR hotspots but varied in count across scenarios: 10 (current), 20 (optimistic), and 19 (pessimistic). For FD hotspots, 21 were identified under the current scenario, mainly in mountainous regions of Zhejiang, Fujian, Nanling, central-southern Sichuan, the Hengduan Mountains, and southeastern Tibet. Under the optimistic scenario, 18 FD hotspots were located in the Daiyun Mountains, western Hubei, the Hengduan Mountains, and southeastern Tibet. Under the pessimistic scenario, 22 FD hotspots were distributed across the Wumeng Mountains, central and southern Sichuan, the Hengduan Mountains, southern Yunnan, and southeastern Tibet (Figure 1).
The number of hotspots diverged across biodiversity dimensions. SR hotspots increased markedly in future scenarios, with the pessimistic scenario yielding more hotspots than the optimistic scenario. PD hotspots also increased in future scenarios, but differences between optimistic and pessimistic scenarios were negligible. In contrast, the count of FD hotspots remained consistent across current and future scenarios (Table 1). Under future scenarios, SR and PD hotspots exhibited higher fragmentation than under the current scenario, with greater fragmentation in pessimistic than optimistic scenarios. However, FD hotspots’ fragmentation remained stable across scenarios (Table 1). Overall, fragmentation levels for all biodiversity dimensions intensified with heightened climate and land use change pressures.
Under future climate and land use change scenarios, the distribution of potential hotspots for the Chinese endemic tree plant diversity shows significant changes along longitude, latitude, and elevation. At the longitude level, significant differences in the longitude of hotspots identified by three dimensions of biodiversity are observed between current and future scenarios, but no significant difference is found between the two future scenarios. Specifically, the average longitude of SR hotspots shifts 3.81° and 4.33° westward under optimistic and pessimistic scenarios, respectively; the average longitude of FD hotspots shifts 1.84° and 3.46° westward; and the average longitude of PD hotspots shifts 2.92° and 4.20° westward in the future two scenarios. At the latitude level, no significant difference is observed in the average latitude of SR and PD hotspots across scenarios, while the average latitude of FD hotspots shifts 0.36° northward (optimistic scenario) and 0.89° northward (pessimistic scenario) under more severe climate and land use changes. At the elevation level, significant differences in elevation are found between the current and future scenarios for SR and PD hotspots, but no significant difference is observed between the two future scenarios. The average elevation of SR hotspots increases by 610.99 m and 732.76 m under optimistic and pessimistic scenarios, respectively; the average elevation of PD hotspots increases by 386.53 m and 596.76 m. Unlike the former two, FD hotspots show significant altitude changes across all scenarios, with the average elevation of FD hotspots increasing by 531.05 m and 884.40 m in the future optimistic and pessimistic scenarios, respectively, compared to the current scenario (Figure 2).

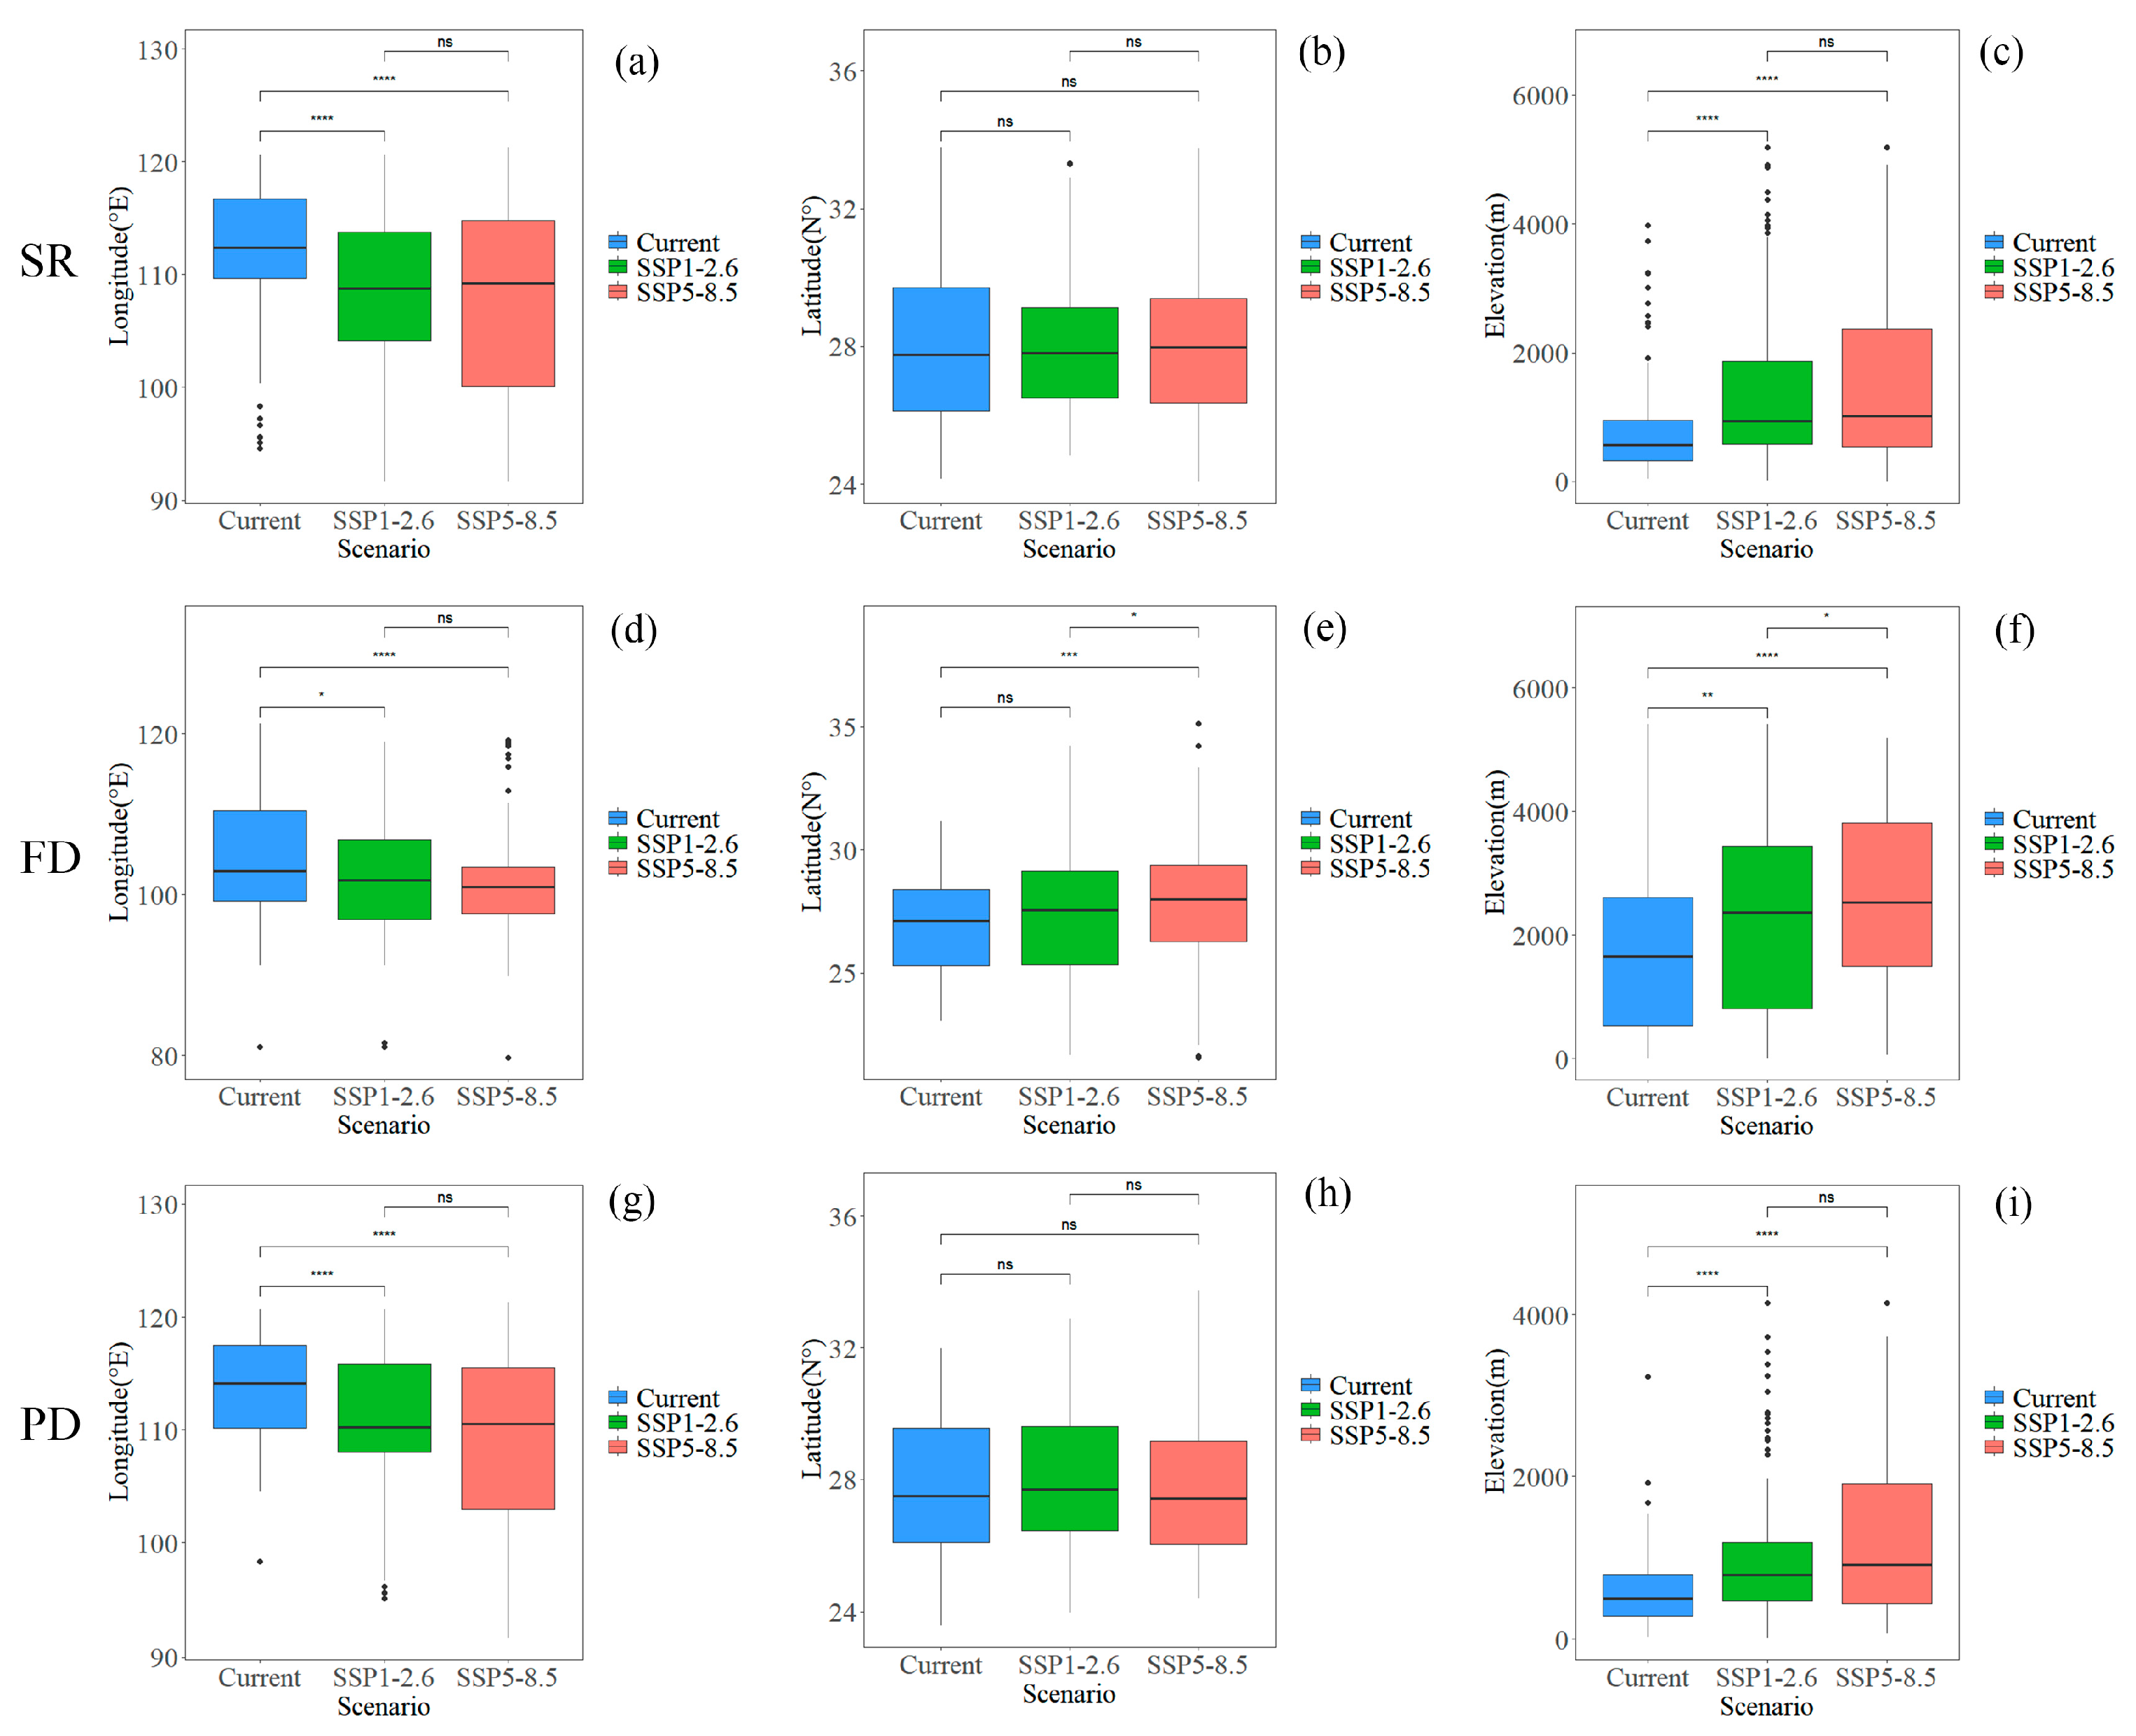
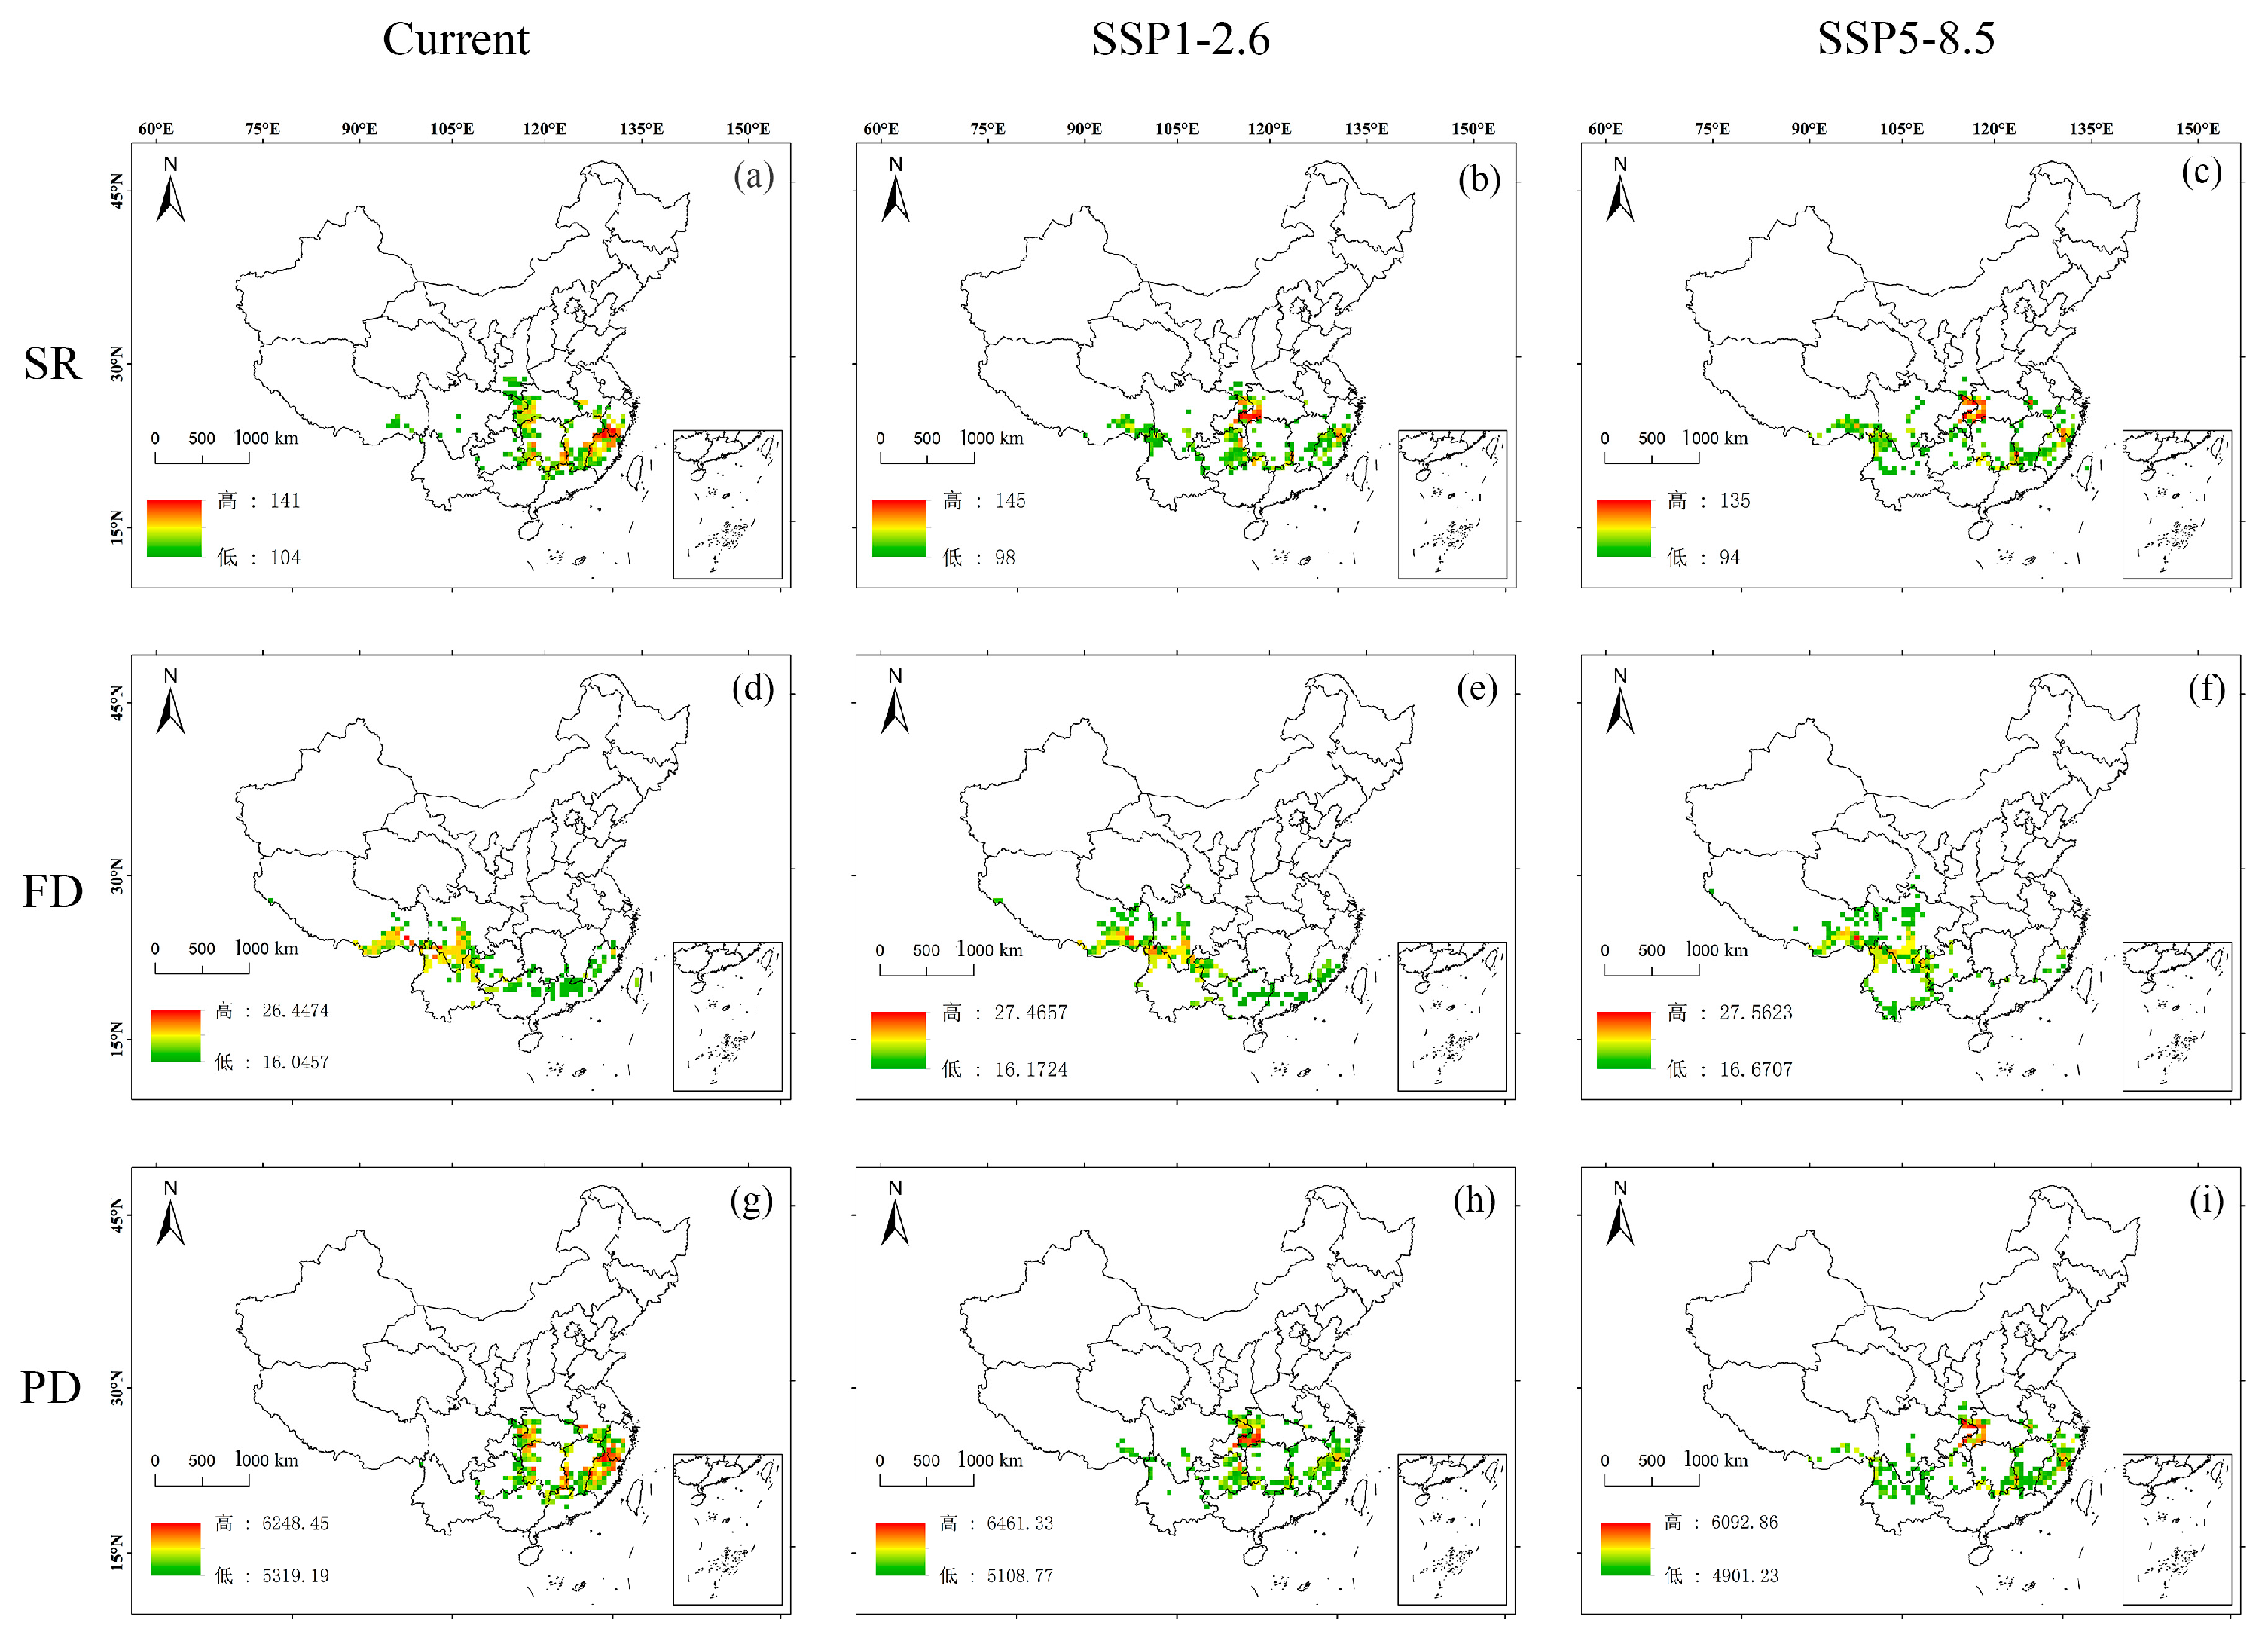
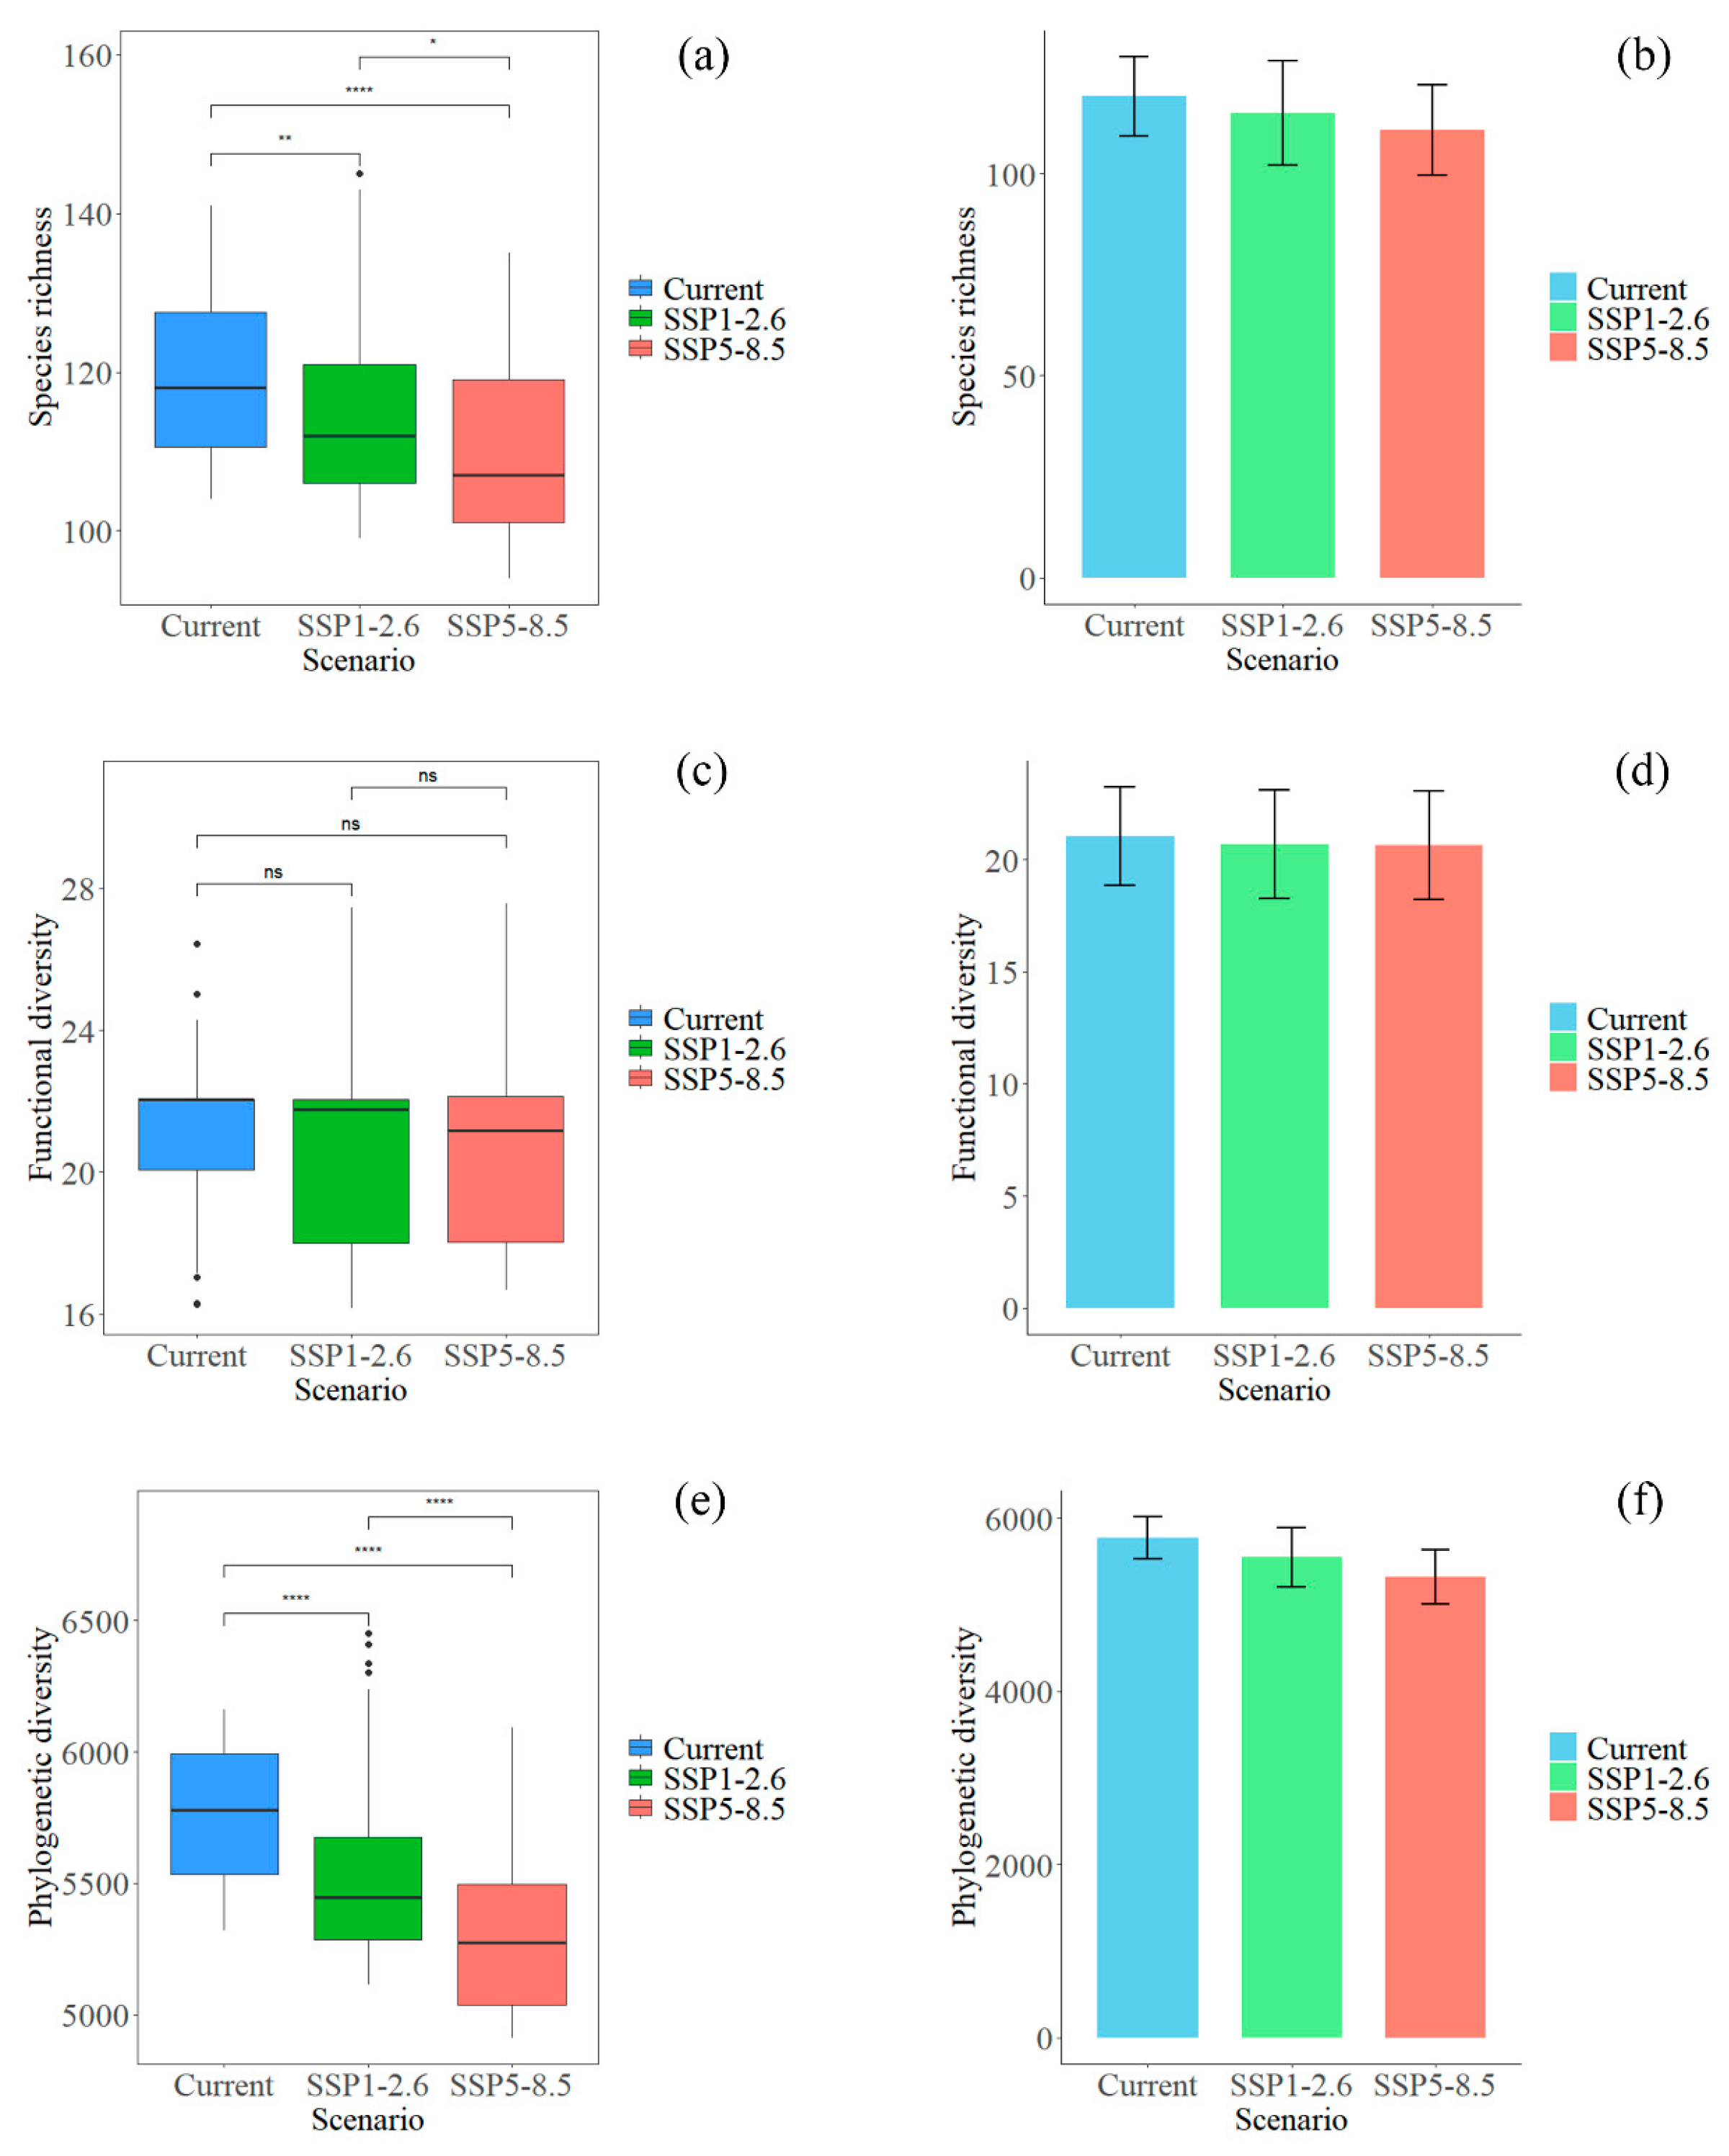
3.2. Spatial Distribution of Plant Diversity in Potential Hotspots for the Chinese Endemic Tree Plant Diversity Under Different Climate and Land Use Scenarios

Under current and future scenarios, the spatial distribution of plant diversity in SR, FD, and PD hotspots for Chinese endemic tree plants shows both similarities and differences. SR and PD hotspots exhibit similar distribution patterns. In the current scenario, the SR and PD hotspots display a spatial distribution trend characterized by higher values in the eastern region and lower values in the central and western regions. The highest-value areas for both SR and PD hotspots are concentrated in the eastern mountainous regions, including the Wuyi Mountains and Nanling Mountains. In future scenarios, the SR and PD hotspots exhibit a distribution trend with higher values in the central region and lower values in the eastern and western regions, with the highest-value areas mainly concentrated in the Qinling Mountains. The spatial distribution pattern of FD differs from the other two. In both current and future scenarios, FD shows a trend of higher values in the west and lower values in the east. The highest-value areas of FD are concentrated in the western mountainous regions, including the Hengduan Mountains and the southeastern part of Tibet (Figure 3).
Under the influence of climate and land use changes, the diversity of Chinese endemic tree plants in hotspots shows distinct changes. SR exhibits significant differences across different scenarios. Under the optimistic scenario, the average SR is expected to decrease by 5.35%, while under the pessimistic scenario, it will decrease by 9.86%. FD does not show significant changes across scenarios, and the average FD remains relatively consistent. PD also shows significant differences across scenarios. Under the optimistic scenario, the average PD will decrease by 3.90%, while under the pessimistic scenario, it will decrease by 8.27% (Figure 4). The number of species in hotspots also changes under the influence of climate and land use changes. In the current scenario, there are a total of 300 species, while under both the optimistic and pessimistic scenarios, the number of species is reduced to 289. Although the species number is the same in both future scenarios, the change in species number compared to the current scenario differs between the two. Under the optimistic scenario, 3 species are expected to migrate into the hotspots, while 14 species will migrate out; under the pessimistic scenario, 5 species will migrate in, and 16 species will migrate out. The fluctuation in species numbers is greater under the pessimistic scenario than under the optimistic one (Figure 5).

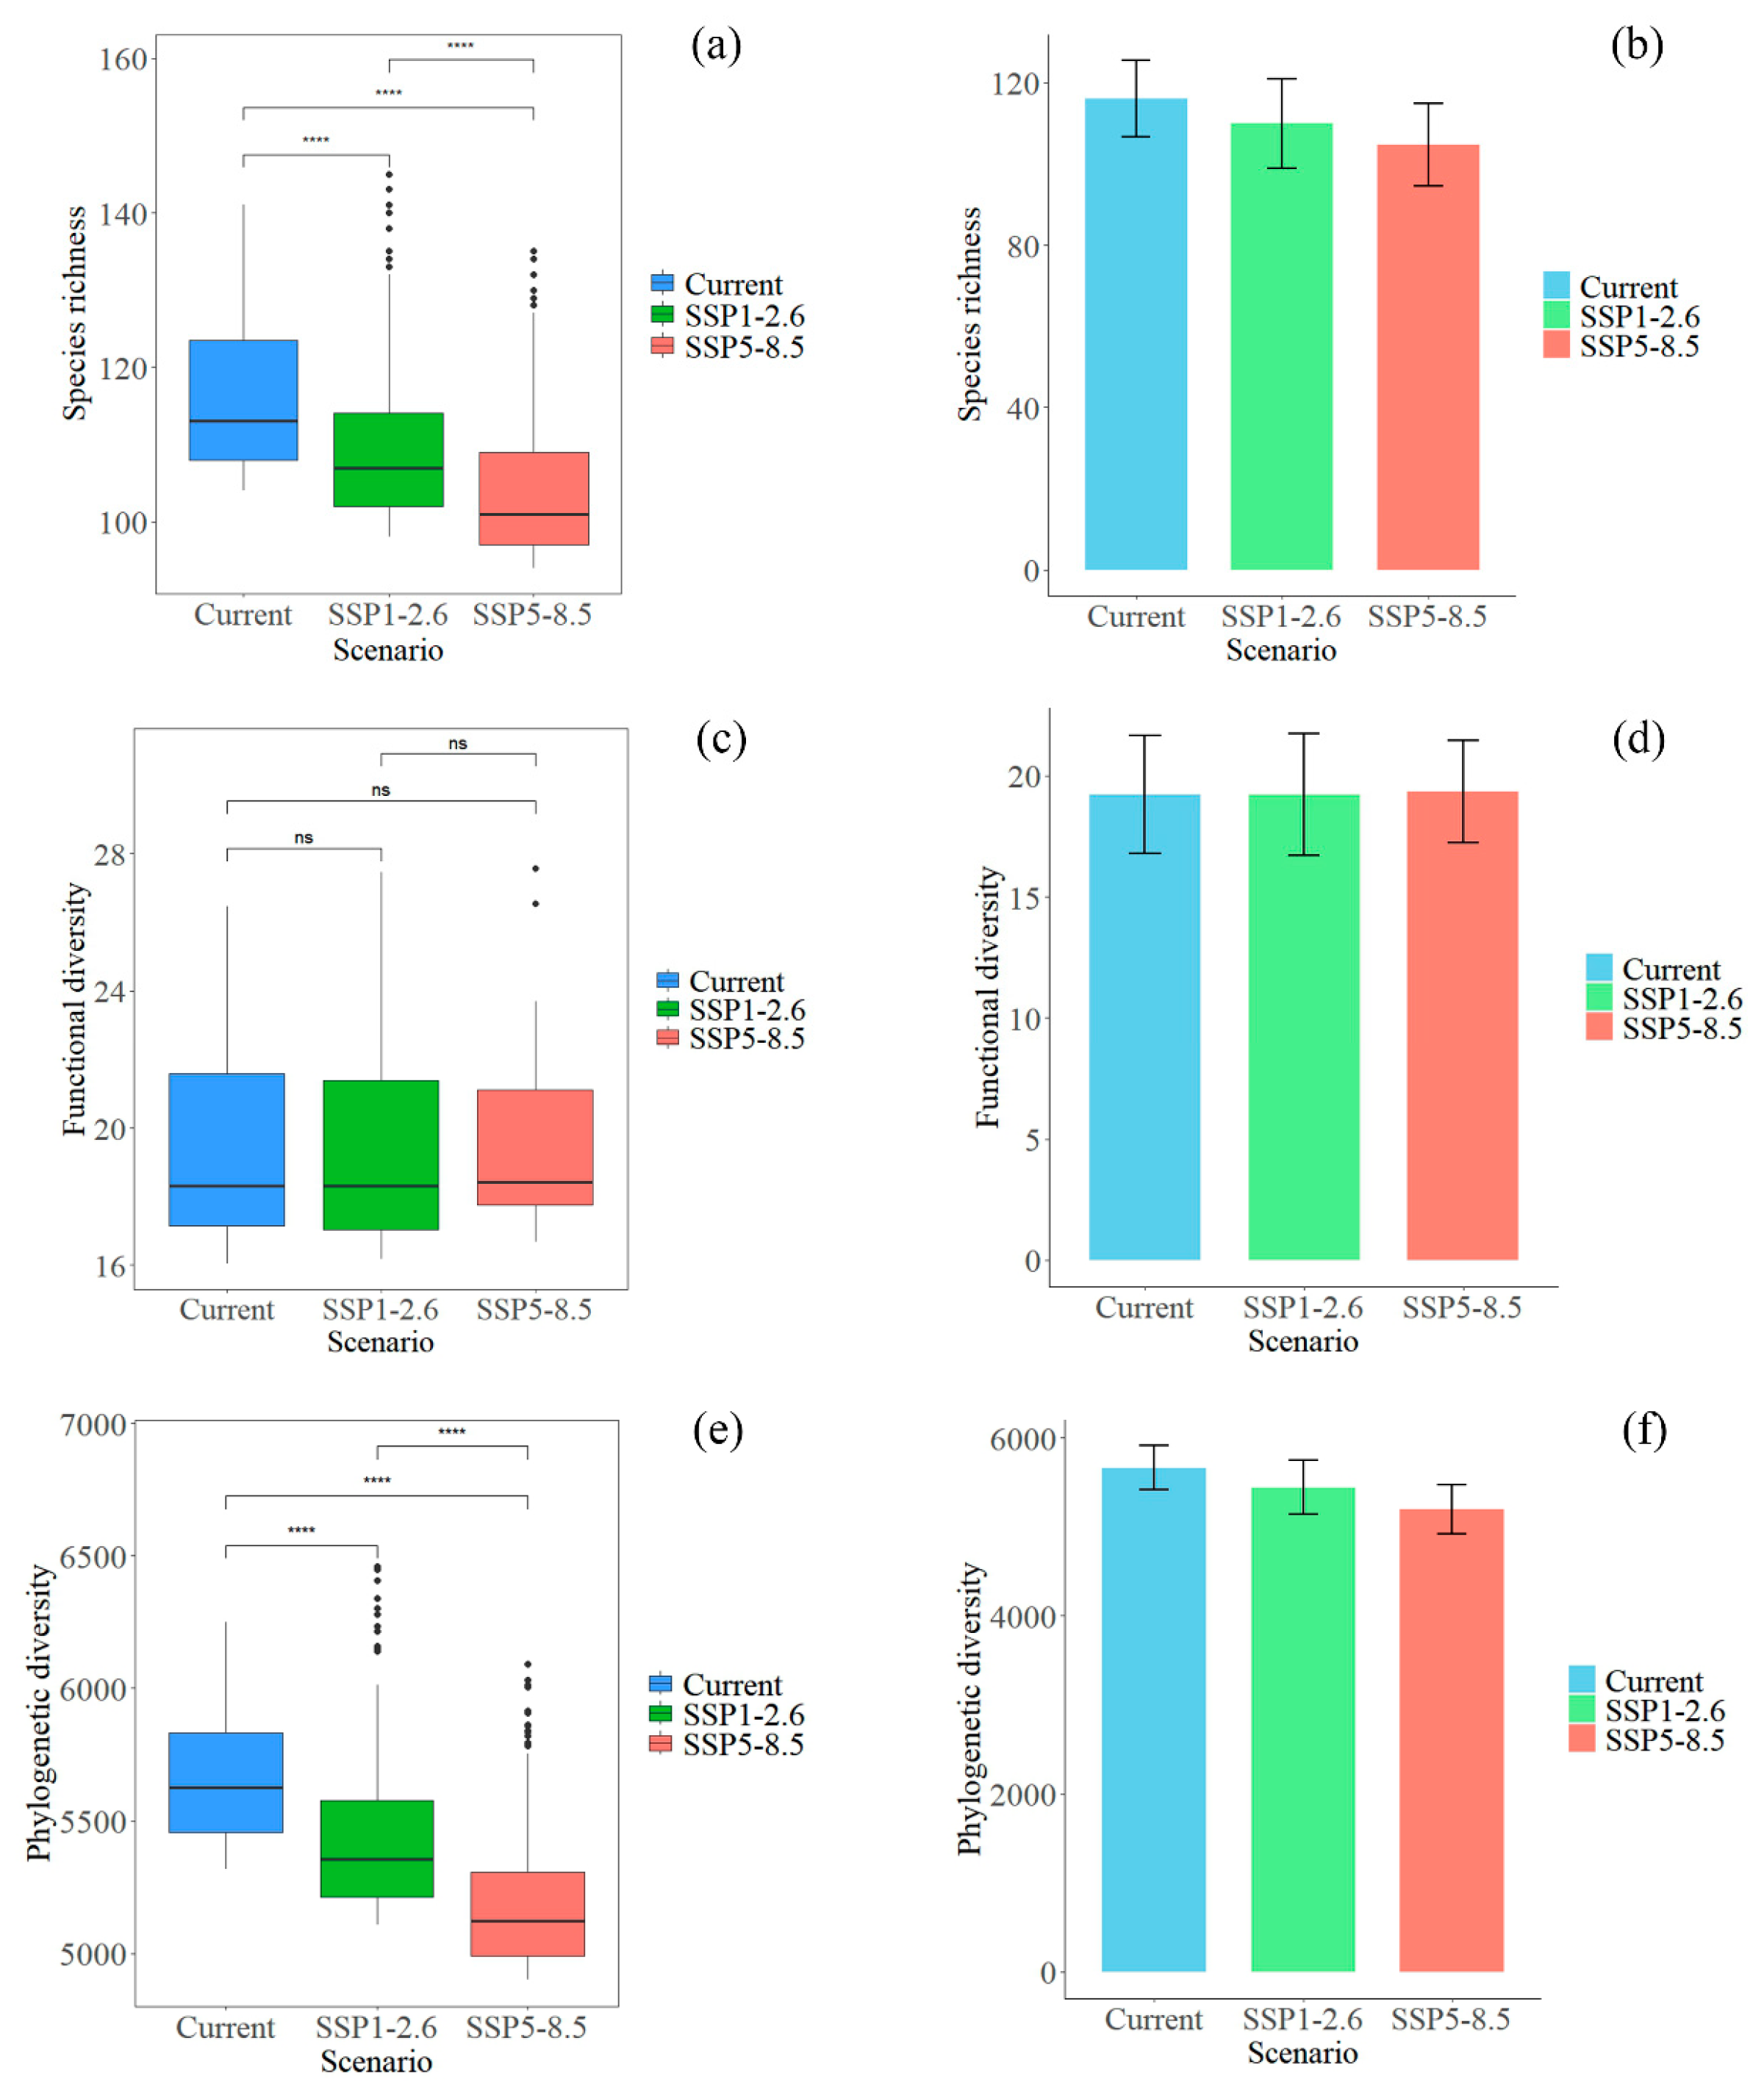
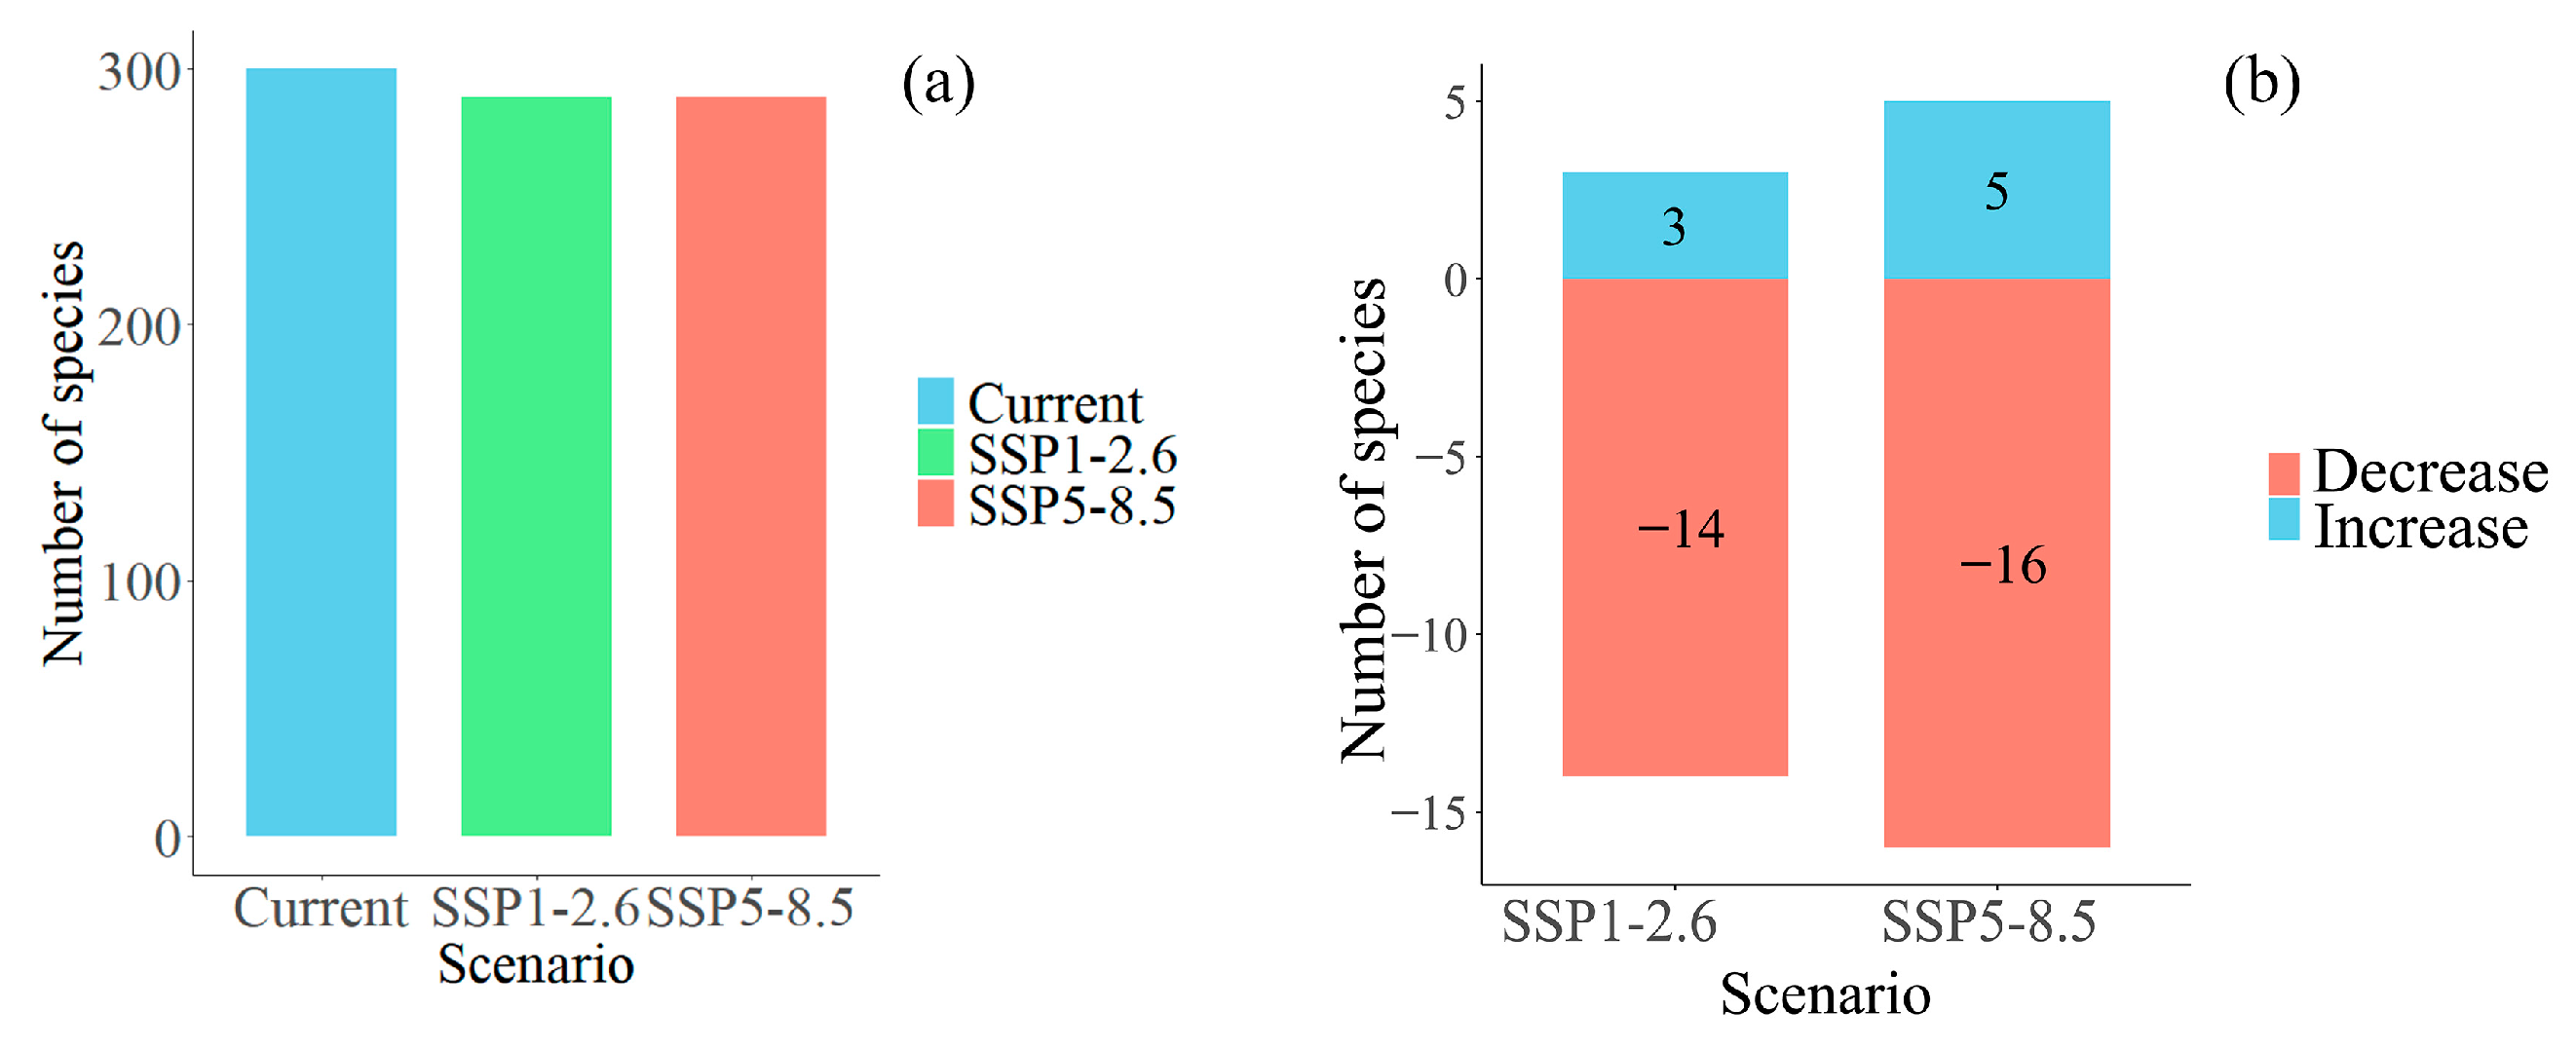
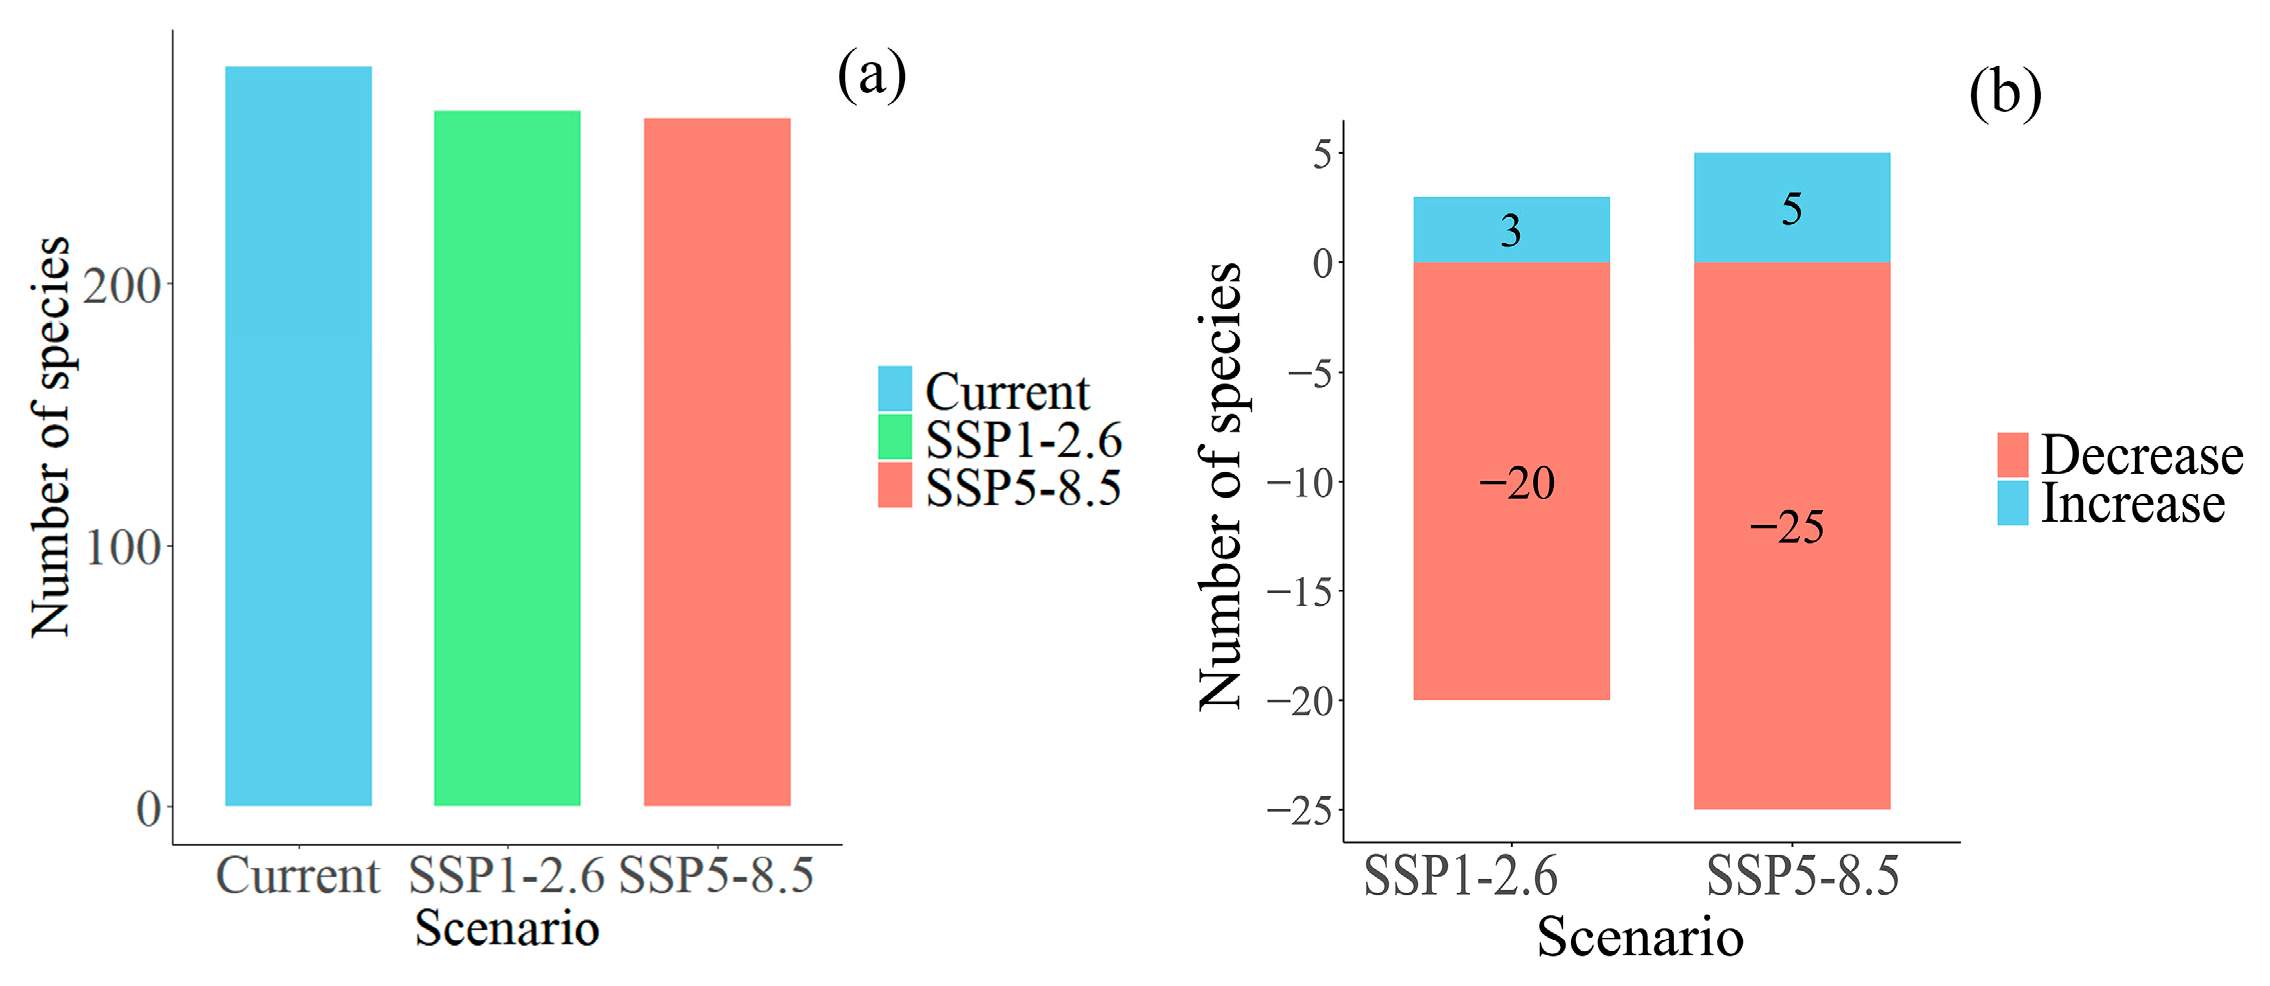
3.3. Changes in Plant Diversity in Potential Shared Hotspots for the Chinese Endemic Tree Plant Diversity Under Different Climate and Land Use Scenarios

Under the influence of climate and land use changes, the diversity of Chinese endemic tree plants in shared hotspots shows distinct changes. Compared to the current scenario, the average SR decreases by 3.47% and 7.10% under the optimistic and pessimistic scenarios, respectively. FD shows no significant changes across the scenarios, with the average FD remaining consistent in the shared hotspots. PD exhibits significant differences across scenarios. Under the optimistic scenario, the average PD will decrease by 3.96%, while under the pessimistic scenario, it will decrease by 7.94% (Figure 6). As climate and land use changes intensify, the number of species in the shared hotspots shows a downward trend. In the current scenario, there are 283 species in the shared hotspots, while there are 266 species under the optimistic scenario and 263 species under the pessimistic scenario. Under the optimistic scenario, 3 species are expected to migrate into the shared hotspots, while 14 species will migrate out. Under the pessimistic scenario, 5 species will migrate in, and 16 species will migrate out. The fluctuation in species numbers is greater under the pessimistic scenario than under the optimistic one (Figure 7).

4. Discussion

4.1. Potential Impacts of Climate and Land Use Changes on the Spatial Distribution of Hotspots for the Chinese Endemic Tree Plant Diversity

Climate and land use changes have significantly altered the spatial distribution of hotspots for the Chinese endemic tree plant diversity. The number of hotspots has noticeably increased, their spatial locations have shifted, and the degree of fragmentation has intensified. The changes in the spatial distribution of biodiversity hotspots are fundamentally driven by shifts in species distribution ranges induced by climate and land use changes. These changes may lead to the expansion, contraction, or migration of species ranges [54]. Due to differences in species’ responses to environmental changes, they may migrate in different directions to seek suitable habitats, ultimately resulting in a fragmented distribution of hotspots, which intensifies as environmental changes become more pronounced [55]. Furthermore, endemic species are generally more sensitive to environmental changes, and the increase in the number of hotspots may indicate substantial shifts in the distribution of certain species under the influence of climate and land use changes, leading to the formation of new hotspots [36]. Hotspots identified based on SR, FD, and PD also show spatial differences. However, certain key regions, such as Daiyun Mountain, the Hengduan Mountains, and the Nanling Mountains, serve as shared hotspots across multiple diversity dimensions. These areas are characterized by high environmental heterogeneity, complex topography, and rich ecological resources, making them critical zones for biodiversity. In the future, they may function as refugia for China’s endemic tree species in response to environmental changes [56,57,58].
Hotspots across different biodiversity dimensions exhibit certain directional trends. The mean longitude of hotspots across the three diversity dimensions has decreased, indicating a shift in hotspots toward lower longitudes. Numerous studies have shown that climate and land use changes drive species migrations toward higher latitudes. However, the different pattern observed in this study may be attributed to the reliance of endemic species on specific topographic and climatic conditions. The major mountain ranges and basins in China are predominantly oriented in an east–west direction, resulting in greater changes along the longitudinal axis while remaining relatively concentrated in latitude. This geographic configuration may have led endemic species to migrate along the longitudinal gradient in response to environmental changes, rather than following the more commonly observed latitudinal migration pattern. Furthermore, under future scenarios, the elevation of hotspots across all diversity dimensions is projected to increase significantly. This trend of species migrating to higher elevations is consistent with findings from studies on other plant groups [59,60,61]. Species distributions are typically influenced by temperature variations [55]. Environmental changes have led to rising temperatures in low-elevation areas, and many species have limited tolerance to high temperatures. As a result, species tend to migrate to higher elevations, where temperatures are lower and more suitable for their survival [62].

4.2. Potential Impacts of Climate and Land Use Changes on the Plant Diversity of Hotspots for the Chinese Endemic Tree Plant Diversity

The study found that the distribution trends of SR and PD in hotspots for Chinese endemic tree plants exhibit similar patterns of change across current and future scenarios. However, the distribution pattern of FD is markedly different from the other two. This suggests that SR and PD have a higher degree of consistency [63], while PD represents the cumulative sum of phylogenetic branch lengths across all species but is not independent of SR, may also be driven by similar environmental factors [64,65]. However, the distribution pattern of FD is markedly different from the other two. FD consistently follows a west-high, east-low distribution pattern, implying that FD may be influenced by unique environmental factors. In future scenarios, the high-value areas of SR and PD shift from the eastern mountainous regions to the central mountainous regions, while FD remains concentrated in the western Hengduan Mountains and southeastern Tibet. Therefore, the differing responses of various diversity dimensions to environmental changes lead to inconsistencies in their spatial distributions [66].
Both SR and PD for endemic tree plants in hotspots significantly decrease, suggesting that these changes pose a potential threat to the diversity of Chinese endemic tree plants. Notably, under the pessimistic scenario, the reductions in SR and PD are substantially greater than under the optimistic scenario, suggesting that more severe climate and land use changes may lead to widespread species loss or migration [54]. In contrast, FD does not show significant changes across scenarios. Some studies have suggested that FD generally varies with SR [67,68]; however, FD and SR do not always change simultaneously [69,70]. Different species may share similar functional traits, allowing remaining species to compensate for lost ecological functions even if some species disappear. As a result, FD may remain stable despite a decline in SR. Additionally, certain species may exhibit strong adaptability to climate and land use changes, becoming dominant within communities and thereby maintaining FD stability.
Moreover, the differences in the number of species migrating into and out of hotspots further confirm the dynamic impacts of climate and land use changes on species distributions. Under more extreme environmental conditions, the fluctuation in species numbers becomes more pronounced, potentially leading to significant changes in species composition within hotspot regions [10]. In shared hotspot regions, plant diversity exhibits an overall declining trend, accompanied by greater fluctuations in species numbers. This suggests that even regions currently recognized for their high conservation value may struggle to maintain their existing species composition and diversity levels in response to climate and land use changes [71]. These findings further confirm the significant impact of environmental changes on the distribution of biodiversity hotspots for Chinese endemic tree plants. These findings further confirm the significant impact of environmental changes on the distribution of biodiversity hotspots for Chinese endemic tree plants.

4.3. Implications for Biodiversity Conservation in China

Against the backdrop of global change, biodiversity conservation has become a critical issue requiring urgent attention worldwide. As the impacts of climate and land use changes on biodiversity continue to intensify, how to mitigate, or even reverse, the negative effects of these changes through effective conservation measures has become a frontier issue in current conservation biology research. This study found that the three dimensions of biodiversity—SR, FD, and PD—respond differently to climate and land use changes. These differences may be due to the fact that biodiversity is, in fact, a multidimensional structure, and thus, one-dimensional diversity indices have limited capacity to reflect overall biodiversity. Compared to one-dimensional indices, multidimensional approaches can more comprehensively reveal the effects of biodiversity on ecosystem [72]. Therefore, employing multidimensional diversity indicators allows for a more comprehensive reflection of biodiversity changes from different perspectives, improving the effectiveness of biodiversity conservation at different levels [73] and providing more precise scientific references for conservation planning.
Research suggests that under future global change, the spatial distribution of certain species will differ from past and present [6,74]. Some widely distributed species may lose their current suitable habitats, placing them at risk under future environmental conditions. Therefore, species threatened by future global changes may differ from those that have survived in the past few decades [75]. Furthermore, studies on model simulations indicate that the areas most affected by future environmental shifts do not overlap with areas that have experienced drastic changes in the past. Thus, it is reasonable to estimate that there will be significant differences between the spatial distributions of currently threatened species and those threatened by future global changes, which could lead to biased estimates in conservation priority planning [76]. Moreover, most existing protected areas were established without considering the impact of global changes on species threat levels [77], which could significantly reduce the effectiveness of these protected areas in the future. Therefore, when establishing protected areas, the impact of global changes on species distribution should be considered to improve the spatial planning of protected areas and protect biodiversity under shifting global conditions.
Protected areas play a vital role in maintaining and restoring species populations [78]. According to the Kunming-Montreal Global Biodiversity Framework, the goal is for the global protected area coverage to reach 30% by 2030. However, determining which regions to designate as protected areas remains a significant challenge [78]. In studies on Chinese endemic plants, both our research and previous studies have identified hotspots for endemic plants, most of which are located in the southern mountainous regions of China. These areas not only have rich plant species but may also become important refuges for species survival under future global changes [79]. Therefore, we recommend that future protected area designations should prioritize these mountainous systems, while also including areas in southern China currently undergoing significant land use changes, to better withstand the impacts of global change and ensure the continued stability of regional biodiversity.

4.4. Uncertainties of the Present Study

In this study, we first simulated the potential distribution of Chinese endemic tree plants under current and future scenarios using an ensemble modeling approach, which reduces uncertainties arising from differences in model algorithms. Our analysis was based on species distribution data with a spatial resolution of 50 km × 50 km, which may lack the precision required for spatial planning in conservation practice. Future studies should consider using higher-resolution data and supplementing the data through field surveys. Dispersal can significantly influence species’ responses to global change [80], potentially affecting research results. Future research could incorporate different dispersal scenarios to further explore the potential transformations of hotspots under climate and land use change.
The distribution of trees is also influenced by various regional environmental factors, such as soil type, texture, depth, and composition, as well as slope, aspect, and elevation. The selection of environmental variables has a certain impact on species distribution predictions and model accuracy. Therefore, to improve the accuracy and reliability of the model, it is advisable to incorporate additional variables that influence species distribution when constructing the model. These variables can serve as important constraints on species distribution, thereby enhancing the precision of model predictions.

5. Conclusions

This study analyzes the changes in hotspots for the Chinese endemic tree plant diversity under future climate and land use changes. The findings reveal that these environmental changes will significantly affect the hotspots for the Chinese endemic tree plants. As climate and land use changes intensify, the fragmentation of hotspots increases, with a tendency for them to be distributed at lower longitudes and higher altitudes. At the same time, both SR and PD show a downward trend, and the fluctuations in species numbers increase within hotspot regions. This study highlights the potential shifts in hotspots for the Chinese endemic tree plant diversity under future environmental scenarios, providing a valuable reference for the planning of future protected areas and the development of biodiversity conservation policies.

Supplementary Materials

The following supporting information can be downloaded at: https://www.mdpi.com/article/10.3390/f16040599/s1, Table S1. The mean TSS and AUC of ensemble model for different species.

Author Contributions

Conceptualization, Z.C. and J.H.; methodology, Z.C.; software, validation, Z.C. and F.Y.; visualization, Z.C., S.X., and S.D.; writing—original draft preparation, Z.C.; writing—review and editing, J.H, Y.X., J.Y., Y.D., and R.Z. All authors have read and agreed to the published version of the manuscript.

Funding

This research was funded by the National Natural Science Foundation of China, grant number 32071648.

Data Availability Statement

The data presented in this study are available on request from the corresponding author.

Acknowledgments

The authors sincerely thank Keping Ma from the Institute of Botany, Chinese Academy of Sciences, for his initial conceptualization and data collection. We also appreciate Qing Wang from the Ecological Technical Research Institute (Beijing) Co., Ltd., for updating the species distribution data.

Conflicts of Interest

The authors declare no conflicts of interest.

References

  1. Manning, P.; Van Der Plas, F.; Soliveres, S.; Allan, E.; Maestre, F.T.; Mace, G.; Whittingham, M.J.; Fischer, M. Redefining ecosystem multifunctionality. Nat. Ecol. Evol. 2018, 2, 427–436. [Google Scholar] [CrossRef]
  2. Osborn, D.; Newbold, T.; Adams, G.L.; Albaladejo Robles, G.; Boakes, E.H.; Braga Ferreira, G.; Chapman, A.S.; Etard, A.; Gibb, R.; Millard, J.; et al. Climate and land-use change homogenise terrestrial biodiversity, with consequences for ecosystem functioning and human well-being. Emerg. Top. Life Sci. 2019, 3, 207–219. [Google Scholar] [CrossRef] [PubMed]
  3. Barnosky, A.D.; Matzke, N.; Tomiya, S.; Wogan, G.O.; Swartz, B.; Quental, T.B.; Marshall, C.; McGuire, J.L.; Lindsey, E.L.; Maguire, K.C.N. Has the Earth’s sixth mass extinction already arrived? Nature 2011, 471, 51–57. [Google Scholar] [CrossRef]
  4. Pimm, S.L.; Jenkins, C.N.; Abell, R.; Brooks, T.M.; Gittleman, J.L.; Joppa, L.N.; Raven, P.H.; Roberts, C.M.; Sexton, J.O. The biodiversity of species and their rates of extinction, distribution, and protection. Science 2014, 344, 1246752. [Google Scholar] [CrossRef]
  5. Urban, M.C. Accelerating extinction risk from climate change. Science 2015, 348, 571–573. [Google Scholar] [CrossRef] [PubMed]
  6. Dyderski, M.K.; Paź, S.; Frelich, L.E.; Jagodziński, A.M. How much does climate change threaten European forest tree species distributions? Glob. Change Biol. 2018, 24, 1150–1163. [Google Scholar] [CrossRef]
  7. Lenoir, J.; Gégout, J.C.; Marquet, P.A.; Ruffray, P.; Brisse, H. A significant upward shift in plant species optimum elevation during the 20th century. Science 2008, 320, 1768–1771. [Google Scholar] [CrossRef] [PubMed]
  8. Chen, I.-C.; Hill, J.K.; Ohlemüller, R.; Roy, D.B.; Thomas, C.D. Rapid range shifts of species associated with high levels of climate warming. Science 2011, 333, 1024–1026. [Google Scholar] [CrossRef]
  9. Guo, Y.; Zhao, Z.; Zhu, F.; Li, X. Climate change may cause distribution area loss for tree species in southern China. For. Ecol. Manag. 2022, 511, 120134. [Google Scholar] [CrossRef]
  10. Li, K.J.; Liu, X.F.; Zhang, J.H.; Zhou, X.L.; Yang, L.; Shen, S.K. Complexity responses of Rhododendron species to climate change in China reveal their urgent need for protection. For. Ecosyst. 2023, 10, 100124. [Google Scholar] [CrossRef]
  11. Luo, W.; Sun, C.; Yang, S.; Chen, W.; Sun, Y.; Li, Z.; Liu, J.; Tao, W.; Tao, J. Contrasting range changes and drivers of four forest foundation species under future climate change in China. Sci. Total Environ. 2024, 942, 173784. [Google Scholar] [PubMed]
  12. Aguilar, R.; Cristóbal-Pérez, E.J.; Balvino-Olvera, F.J.; De Jesús Aguilar-Aguilar, M.; Aguirre-Acosta, N.; Ashworth, L.; Lobo, J.A.; Martén-Rodríguez, S.; Fuchs, E.J.; Sanchez-Montoya, G. Habitat fragmentation reduces plant progeny quality: A global synthesis. Ecol. Lett. 2019, 22, 1163–1173. [Google Scholar] [CrossRef] [PubMed]
  13. Mora, C.; Metzger, R.; Rollo, A.; Myers, R.A. Experimental simulations about the effects of overexploitation and habitat fragmentation on populations facing environmental warming. Proc. R. Soc. B Biol. Sci. 2007, 274, 1023–1028. [Google Scholar] [CrossRef]
  14. Brook, B.W.; Sodhi, N.S.; Bradshaw, C.J. Synergies among extinction drivers under global change. Trends Ecol. Evol. 2008, 23, 453–460. [Google Scholar] [PubMed]
  15. Keith, D.A.; Akçakaya, H.R.; Thuiller, W.; Midgley, G.F.; Pearson, R.G.; Phillips, S.J.; Regan, H.M.; Araújo, M.B.; Rebelo, T.G. Predicting extinction risks under climate change: Coupling stochastic population models with dynamic bioclimatic habitat models. Biol. Lett. 2008, 4, 560–563. [Google Scholar]
  16. Habibullah, M.S.; Din, B.H.; Tan, S.H.; Zahid, H. Impact of climate change on biodiversity loss: Global evidence. Environ. Sci. Pollut. Res. 2022, 29, 1073–1086. [Google Scholar]
  17. Brooks, T.M.; Mittermeier, R.A.; Da Fonseca, G.A.; Gerlach, J.; Hoffmann, M.; Lamoreux, J.F.; Mittermeier, C.G.; Pilgrim, J.D.; Rodrigues, A.S. Global biodiversity conservation priorities. Science 2006, 313, 58–61. [Google Scholar]
  18. Myers, N.; Mittermeier, R.A.; Mittermeier, C.G.; Da Fonseca, G.A.; Kent, J. Biodiversity hotspots for conservation priorities. Nature 2000, 403, 853–858. [Google Scholar]
  19. Orme, C.D.L.; Davies, R.G.; Burgess, M.; Eigenbrod, F.; Pickup, N.; Olson, V.A.; Webster, A.J.; Ding, T.S.; Rasmussen, P.C.; Ridgely, R.S. Global hotspots of species richness are not congruent with endemism or threat. Nature 2005, 436, 1016–1019. [Google Scholar]
  20. Vane-Wright, R.I.; Humphries, C.J.; Williams, P.H. What to protect?—Systematics and the agony of choice. Biol. Conserv. 1991, 55, 235–254. [Google Scholar]
  21. Faith, D.P. Conservation evaluation and phylogenetic diversity. Biol. Conserv. 1992, 61, 1–10. [Google Scholar] [CrossRef]
  22. Xu, Y.; Shen, Z.; Ying, L.; Wang, Z.; Huang, J.; Zang, R.; Jiang, Y. Hotspot analyses indicate significant conservation gaps for evergreen broadleaved woody plants in China. Sci. Rep. 2017, 7, 1859. [Google Scholar] [CrossRef] [PubMed]
  23. Yu, F.; Skidmore, A.K.; Wang, T.; Huang, J.; Ma, K.; Groen, T.A. Rhododendron diversity patterns and priority conservation areas in China. Divers. Distrib. 2017, 23, 1143–1156. [Google Scholar] [CrossRef]
  24. Xie, H.; Tang, Y.; Fu, J.; Chi, X.; Du, W.; Dimitrov, D.; Liu, J.; Xi, Z.; Wu, J.; Xu, X. Diversity patterns and conservation gaps of Magnoliaceae species in China. Sci. Total Environ. 2022, 813, 152665. [Google Scholar] [CrossRef]
  25. Zhao, Z.; Feng, X.; Zhang, Y.; Wang, Y.; Zhou, Z. Species richness, endemism, and conservation of wild Rhododendron in China. Glob. Ecol. Conserv. 2023, 41, e02375. [Google Scholar]
  26. Oliver, T.H.; Isaac, N.J.; August, T.A.; Woodcock, B.A.; Roy, D.B.; Bullock, J.M. Declining resilience of ecosystem functions under biodiversity loss. Nat. Commun. 2015, 6, 10122. [Google Scholar]
  27. Barrett, M.A.; Brown, J.L.; Junge, R.E.; Yoder, A.D. Climate change, predictive modeling and lemur health: Assessing impacts of changing climate on health and conservation in Madagascar. Biol. Conserv. 2013, 157, 409–422. [Google Scholar] [CrossRef]
  28. Tu, Y.; Yao, Z.; Guo, J.; Yang, L.; Zhu, Y.; Yang, X.; Shi, Z.; Indree, T. Predicting the potential risk of Caragana shrub encroachment in the Eurasian steppe under anthropogenic climate change. Sci. Total Environ. 2024, 944, 173925. [Google Scholar]
  29. Yu, F.; Wu, Z.; Shen, J.; Huang, J.; Groen, T.A.; Skidmore, A.K.; Ma, K.; Wang, T. Low-elevation endemic Rhododendrons in China are highly vulnerable to climate and land use change. Ecol. Indic. 2021, 126, 107699. [Google Scholar] [CrossRef]
  30. Li, W.B.; Teng, Y.; Zhang, M.Y.; Shen, Y.; Liu, J.W.; Qi, J.W.; Wang, X.C.; Wu, R.F.; Li, J.H.; Garber, P.A. Human activity and climate change accelerate the extinction risk to non-human primates in China. Glob. Change Biol. 2024, 30, e17114. [Google Scholar] [CrossRef]
  31. Pearson, R.G.; Thuiller, W.; Araujo, M.B.; Martinez-Meyer; Brotons, L.; McClean, C.; Miles, L.S. Model-based uncertainty in species range prediction. J. Biogeogr. 2006, 33, 1704–1711. [Google Scholar]
  32. Ghehsareh Ardestani, E.; Rigi, H.; Honarbakhsh, A. Predicting optimal habitats of Haloxylon persicum for ecosystem restoration using ensemble ecological niche modeling under climate change in southeast Iran. Restor. Ecol. 2021, 29, e13492. [Google Scholar]
  33. Moraitis, M.L.; Valavanis, V.D.; Karakassis, I. Modelling the effects of climate change on the distribution of benthic indicator species in the Eastern Mediterranean Sea. Sci. Total Environ. 2019, 667, 16–24. [Google Scholar] [CrossRef] [PubMed]
  34. Mittermeier, R.A.; Goettsch Mittermeier, C. Megadiversity: Earth’s Biologically Wealthiest Nations; CEMEX: New York, NY, USA, 1997. [Google Scholar]
  35. Peng, S.; Zhang, J.; Zhang, X.; Li, Y.; Liu, Y.; Wang, Z. Conservation of woody species in China under future climate and land-cover changes. J. Appl. Ecol. 2022, 59, 141–152. [Google Scholar]
  36. Pires, M.B.; Kougioumoutzis, K.; Norder, S.; Dimopoulos, P.; Strid, A.; Panitsa, M. The future of plant diversity within a Mediterranean endemism centre: Modelling the synergistic effects of climate and land-use change in Peloponnese, Greece. Sci. Total Environ. 2024, 947, 174622. [Google Scholar] [CrossRef] [PubMed]
  37. Huang, J.H.; Chen, J.H.; Ying, J.S.; Ma, K.P. Features and distribution patterns of Chinese endemic seed plant species. J. Syst. Evol. 2011, 49, 81–94. [Google Scholar]
  38. Wang, Q.; Huang, J.H.; Zang, R.G.; Li, Z.P.; El, K.; Yousry, A. Centres of neo-and paleo-endemism for Chinese woody flora and their environmental features. Biol. Conserv. 2022, 276, 109817. [Google Scholar]
  39. Peng, S.J.; Hu, R.C.; Velazco, S.J.E.; Luo, Y.; Lyu, T.; Zhang, X.L.; Zhang, J.; Wang, Z.H. Preserving the woody plant tree of life in China under future climate and land-cover changes. Proc. R. Soc. B 2022, 289, 20221497. [Google Scholar]
  40. Moles, A.T.; Warton, D.I.; Warman, L.; Swenson, N.G.; Laffan, S.W.; Zanne, A.E.; Pitman, A.; Hemmings, F.A.; Leishman, M.R. Global patterns in plant height. J. Ecol. 2009, 97, 923–932. [Google Scholar] [CrossRef]
  41. Echeverría-Londoño, S.; Enquist, B.J.; Neves, D.M.; Violle, C.; Boyle, B.; Kraft, N.J.B.; Maitner, B.S.; McGill, B.; Peet, R.K.; Sandel, B.; et al. Plant Functional Diversity and the Biogeography of Biomes in North and South America. Front. Ecol. Evol. 2018, 6, 219. [Google Scholar]
  42. Zhang, T.Y.; Cheng, C.X.; Wu, X.D. Mapping the spatial heterogeneity of global land use and land cover from 2020 to 2100 at a 1 km resolution. Sci. Data 2023, 10, 748. [Google Scholar] [CrossRef]
  43. Jin, Y.; Qian, H.V. PhyloMaker2: An updated and enlarged R package that can generate very large phylogenies for vascular plants. Plant Divers. 2022, 44, 335–339. [Google Scholar] [CrossRef] [PubMed]
  44. Zanne, A.E.; Tank, D.C.; Cornwell, W.K.; Eastman, J.M.; Smith, S.A.; FitzJohn, R.G.; McGlinn, D.J.; O’Meara, B.C.; Moles, A.T.; Reich, P.B. Three keys to the radiation of angiosperms into freezing environments. Nature 2014, 506, 89–92. [Google Scholar] [CrossRef]
  45. Smith, S.A.; Brown, J.W. Constructing a broadly inclusive seed plant phylogeny. Am. J. Bot. 2018, 105, 302–314. [Google Scholar] [CrossRef] [PubMed]
  46. Swanepoel, W.; Chase, M.W.; Christenhusz, M.J.; Maurin, O.; Forest, F.; Van Wyk, A.E.P. From the frying pan: An unusual dwarf shrub from Namibia turns out to be a new brassicalean family. Phytotaxa 2020, 439, 171–185. [Google Scholar] [CrossRef]
  47. Thuiller, W.; Lafourcade, B.; Engler, R.; Araújo, M.B. BIOMOD–a platform for ensemble forecasting of species distributions. Ecography 2009, 32, 369–373. [Google Scholar] [CrossRef]
  48. Allouche, O.; Tsoar, A.; Kadmon, R. Assessing the accuracy of species distribution models: Prevalence, kappa and the true skill statistic (TSS). J. Appl. Ecol. 2006, 43, 1223–1232. [Google Scholar] [CrossRef]
  49. Phillips, S.J.; Anderson, R.P.; Schapire, R.E. Maximum entropy modeling of species geographic distributions. Ecol. Model. 2006, 190, 231–259. [Google Scholar] [CrossRef]
  50. Davies, T.J.; Cadotte, M.W. Quantifying biodiversity: Does it matter what we measure? In Biodiversity Hotspots: Distribution and Protection of Conservation Priority Areas; Springer: Berlin/Heidelberg, Germany, 2011; pp. 43–60. [Google Scholar]
  51. Villéger, S.; Mason, N.W.H.; Mouillot, D. New multidimensional functional diversity indices for a multifaceted framework in functional ecology. Ecology 2008, 89, 2290–2301. [Google Scholar] [CrossRef]
  52. Mason, N.W.H.; Mouillot, D.; Lee, W.G.; Wilson, J.B. Functional richness, functional evenness and functional divergence: The primary components of functional diversity. Oikos 2005, 111, 112–118. [Google Scholar] [CrossRef]
  53. Zhong, X.; Qiu, B.; Liu, X. Functional diversity patterns of macrofauna in the adjacent waters of the Yangtze River Estuary. Mar. Pollut. Bull. 2020, 154, 111032. [Google Scholar] [PubMed]
  54. Yu, F.; Wang, T.; Groen, T.A.; Skidmore, A.K.; Yang, X.; Ma, K.; Wu, Z. Climate and land use changes will degrade the distribution of Rhododendrons in China. Sci. Total Environ. 2019, 659, 515–528. [Google Scholar] [PubMed]
  55. Wu, Y.; Dubay, S.G.; Colwell, R.K.; Ran, J.; Lei, F. Mobile hotspots and refugia of avian diversity in the mountains of south-west China under past and contemporary global climate change. J. Biogeogr. 2017, 44, 615–626. [Google Scholar]
  56. Ma, Y.; Mao, X.; Wang, J.; Zhang, L.; Jiang, Y.; Geng, Y.; Ma, T.; Cai, L.; Huang, S.; Hollingsworth, P. Pervasive hybridization during evolutionary radiation of Rhododendron subgenus Hymenanthes in mountains of southwest China. Natl. Sci. Rev. 2022, 9, nwac276. [Google Scholar]
  57. Mo, Z.Q.; Fu, C.N.; Zhu, M.S.; Milne, R.I.; Yang, J.B.; Cai, J.; Qin, H.T.; Zheng, W.; Hollingsworth, P.M.; Li, D.Z. Resolution, conflict and rate shifts: Insights from a densely sampled plastome phylogeny for Rhododendron (Ericaceae). Ann. Bot. 2022, 130, 687–701. [Google Scholar] [CrossRef]
  58. Brighenti, S.; Hotaling, S.; Finn, D.S.; Fountain, A.G.; Hayashi, M.; Herbst, D.; Saros, J.E.; Tronstad, L.M.; Millar, C.I. Rock glaciers and related cold rocky landforms: Overlooked climate refugia for mountain biodiversity. Glob. Change Biol. 2021, 27, 1504–1517. [Google Scholar]
  59. He, X.; Burgess, K.S.; Yang, X.F.; Ahrends, A.; Gao, L.M.; Li, D.Z. Upward elevation and northwest range shifts for alpine Meconopsis species in the Himalaya–Hengduan Mountains region. Ecol. Evol. 2019, 9, 4055–4064. [Google Scholar]
  60. Li, J.; Chang, H.; Liu, T.; Zhang, C. The potential geographical distribution of Haloxylon across Central Asia under climate change in the 21st century. Agric. For. Meteorol. 2019, 275, 243–254. [Google Scholar] [CrossRef]
  61. Zhao, Y.; Deng, X.; Xiang, W.; Chen, L.; Ouyang, S. Predicting potential suitable habitats of Chinese fir under current and future climatic scenarios based on Maxent model. Ecol. Inform. 2021, 64, 101393. [Google Scholar]
  62. Moradi, H.; Noroozi, J.; Fourcade, Y. Plant endemic diversity in the Irano-Anatolian global biodiversity hotspot is dramatically threatened by future climate change. Biol. Conserv. 2025, 302, 110963. [Google Scholar]
  63. Rodrigues, A.S.; Gaston, K.J. Maximising phylogenetic diversity in the selection of networks of conservation areas. Biol. Conserv. 2002, 105, 103–111. [Google Scholar] [CrossRef]
  64. Cai, H.; Lyu, L.; Shrestha, N.; Tang, Z.; Su, X.; Xu, X.; Dimitrov, D.; Wang, Z. Geographical patterns in phylogenetic diversity of Chinese woody plants and its application for conservation planning. Divers. Distrib. 2021, 27, 179–194. [Google Scholar] [CrossRef]
  65. Mishler, B.D.; Knerr, N.; González-Orozco, C.E.; Thornhill, A.H.; Laffan, S.W.; Miller, J.T. Phylogenetic measures of biodiversity and neo-and paleo-endemism in Australian Acacia. Nat. Commun. 2014, 5, 4473. [Google Scholar] [CrossRef]
  66. Luo, A.; Li, Y.; Shrestha, N.; Xu, X.; Su, X.; Li, Y.; Lyu, T.; Waris, K.; Tang, Z.; Liu, X. Global multifaceted biodiversity patterns, centers, and conservation needs in angiosperms. Sci. China Life Sci. 2024, 67, 817–828. [Google Scholar] [CrossRef] [PubMed]
  67. Bu, W.; Zang, R.; Ding, Y. Functional diversity increases with species diversity along successional gradient in a secondary tropical lowland rainforest. Trop. Ecol. 2014, 55, 393–401. [Google Scholar]
  68. Qin, H.; Wang, Y.; Zhang, F.; Chen, J.; Zhang, G.; Dong, G. Application of species, phylogenetic and functional diversity to the evaluation on the effects of ecological restoration on biodiversity. Ecol. Inform. 2016, 32, 53–62. [Google Scholar]
  69. Forest, F.; Grenyer, R.; Rouget, M.; Davies, T.J.; Cowling, R.M.; Faith, D.P.; Balmford, A.; Manning, J.C.; Procheş, Ş.; Van Der Bank, M. Preserving the evolutionary potential of floras in biodiversity hotspots. Nature 2007, 445, 757–760. [Google Scholar]
  70. Ricotta, C. A note on functional diversity measures. Basic Appl. Ecol. 2005, 6, 479–486. [Google Scholar]
  71. Mantyka-Pringle, C.S.; Visconti, P.; Di Marco, M.; Martin, T.G.; Rondinini, C.; Rhodes, J.R. Climate change modifies risk of global biodiversity loss due to land-cover change. Biol. Conserv. 2015, 187, 103–111. [Google Scholar] [CrossRef]
  72. Hu, J.L.; Ci, X.Q.; Zhang, X.Y.; Zhou, R.; Xiao, J.H.; Liu, Z.F.; Zhang, C.Y.; Jin, X.; Li, J. Assessment of multidimensional diversity and conservation of threatened timber trees in China under climate change. Biol. Conserv. 2024, 300, 110871. [Google Scholar] [CrossRef]
  73. Mazel, F.; Guilhaumon, F.; Mouquet, N.; Devictor, V.; Gravel, D.; Renaud, J.; Cianciaruso, M.V.; Loyola, R.; Diniz-Filho, J.A.F.; Mouillot, D. Multifaceted diversity–area relationships reveal global hotspots of mammalian species, trait and lineage diversity. Glob. Ecol. Biogeogr. 2014, 23, 836–847. [Google Scholar] [CrossRef] [PubMed]
  74. Pillet, M.; Goettsch, B.; Merow, C.; Maitner, B.; Feng, X.; Roehrdanz, P.R.; Enquist, B. Elevated extinction risk of cacti under climate change. Nat. Plants 2022, 8, 366–372. [Google Scholar] [CrossRef] [PubMed]
  75. Moat, J.; Gole, T.W.; Davis, A.P. Least concern to endangered: Applying climate change projections profoundly influences the extinction risk assessment for wild Arabica coffee. Glob. Change Biol. 2019, 25, 390–403. [Google Scholar] [CrossRef]
  76. Peng, S.; Shrestha, N.; Luo, Y.; Li, Y.; Cai, H.; Qin, H.; Ma, K.; Wang, Z. Incorporating global change reveals extinction risk beyond the curfent Red List. Curr. Biol. 2023, 33, 3669–3678.e4. [Google Scholar] [CrossRef]
  77. Asamoah, E.F.; Beaumont, L.J.; Maina, J.M. Climate and land-use changes reduce the benefits of terrestrial protected areas. Nat. Clim. Change 2021, 11, 1105–1110. [Google Scholar] [CrossRef]
  78. Pimm, S.L.; Jenkins, C.N.; Li, B.V. How to protect half of Earth to ensure it protects sufficient biodiversity. Sci. Adv. 2018, 4, eaat2616. [Google Scholar] [CrossRef]
  79. Tang, C.Q.; Matsui, T.; Ohashi, H.; Dong, Y.F.; Momohara, A.; Herrando-Moraira, S.; Qian, S.; Yang, Y.; Ohsawa, M.; Luu, H.T. Identifying long-term stable refugia for relict plant species in East Asia. Nat. Commun. 2018, 9, 4488. [Google Scholar] [CrossRef]
  80. Acevedo, M.A.; Beaudrot, L.; Meléndez-Ackerman, E.J.; Tremblay, R.L. Local extinction risk under climate change in a neotropical asymmetrically dispersed epiphyte. J. Ecol. 2020, 108, 1553–1564. [Google Scholar] [CrossRef]
Figure 1. The spatial distribution of potential hotspots for the Chinese endemic tree plant diversity under different climate and land use scenarios. (ac) Species richness (SR) hotspots under current, SSP1-2.6, SSP5-8.5. (df) Functional diversity (FD) hotspots under current, SSP1-2.6, SSP5-8.5. (gi) Phylogenetic diversity (PD) hotspots under current, SSP1-2.6, SSP5-8.5. The number represents the serial numbers of the hotspots.
Forests 16 00599 g001
Figure 2. The spatial distribution patterns of potential hotspots for the Chinese endemic tree plant diversity under different climate and land use scenarios. The figure was generated based on the median and quartiles of longitude, latitude, and elevation for different diversity hotspots under various scenarios. (ac) Spatial distribution patterns of species richness (SR) hotspots across longitude, latitude, and elevation under different scenarios. (df) Spatial distribution patterns of functional diversity (FD) hotspots across longitude, latitude, and elevation under different scenarios. (gi) Spatial distribution patterns of phylogenetic diversity (PD) hotspots across longitude, latitude, and elevation under different scenarios. * p < 0.05; ** p < 0.01; *** p < 0.001; **** p < 0.0001; ns: non-significant.
Forests 16 00599 g002
Figure 3. The spatial distribution of plant diversity in potential hotspots for the Chinese endemic tree plant diversity under different climate and land use scenarios. (ac) Species richness (SR) under current, SSP1-2.6, SSP5-8.5. (df) Functional diversity under current, SSP1-2.6, SSP5-8.5. (gi) Phylogenetic diversity (PD) under current, SSP1-2.6, SSP5-8.5.
Forests 16 00599 g003
Figure 4. The changes in plant diversity in potential hotspots for the Chinese endemic tree plant diversity under different climate and land use scenarios. The figure was generated based on the median and quartiles of plant diversity within hotspots under different scenarios. (a,c,e) Differences in species richness, functional diversity, and phylogenetic diversity within hotspots across different scenarios. (b,d,f) Average species richness, average functional diversity, and average phylogenetic diversity within hotspots across different scenarios. **** p < 0.0001; ns: non-significant.
Forests 16 00599 g004
Figure 5. The number of species distributed in the potential hotspots for the Chinese endemic tree plant diversity under different climate and land use scenarios (a), and the number of species that have changed in different future scenarios compared to the current scenario (b).
Forests 16 00599 g005
Figure 6. The changes in plant diversity in potential shared hotspots for the Chinese endemic tree plant diversity under different climate and land use scenarios. The figure was generated based on the median and quartiles of plant diversity within shared hotspots under different scenarios. (a,c,e) Differences in species richness, functional diversity, and phylogenetic diversity within shared hotspots across different scenarios. (b,d,f) Average species richness, average functional diversity, and average phylogenetic diversity within shared hotspots across different scenarios. * p < 0.05; ** p < 0.01; **** p < 0.0001; ns: non-significant.
Forests 16 00599 g006
Figure 7. The number of species distributed in the potential shared hotspots for the Chinese endemic tree plant diversity under different climate and land use scenarios (a), and the number of species that have changed in different future scenarios compared to the current scenario (b).
Forests 16 00599 g007
Table 1. The numbers and fragmentation index of potential hotspots for the Chinese endemic tree plant diversity under different climate and land use scenarios.
IndexCurrentSSP1-2.6SSP5-8.5
NumberFragmentation IndexNumberFragmentation IndexNumberFragmentation Index
SR150.032180.036250.042
FD210.037180.038220.038
PD100.028200.038190.042
Note: SR, species richness; FD, functional diversity; PD, phylogenetic diversity.
Disclaimer/Publisher’s Note: The statements, opinions and data contained in all publications are solely those of the individual author(s) and contributor(s) and not of MDPI and/or the editor(s). MDPI and/or the editor(s) disclaim responsibility for any injury to people or property resulting from any ideas, methods, instructions or products referred to in the content.

