1. Introduction
As a cutting-edge technological innovation, artificial intelligence (AI) detection is gradually being applied to various traditional industries. In the field of bamboo processing, the creative use of AI algorithms can intelligently identify and classify the texture and structural defects of bamboo, which not only improves production efficiency, but also promotes the intelligent transformation of the bamboo processing fields.
Bamboo is a renewable resource that grows fast and can grow widely in tropical, subtropical, and temperate regions, with good mechanical properties [
1]. Professor Walter Liese conducted a series of studies on the microstructure of bamboo, which provided a scientific basis for the widespread application of bamboo as a sustainable alternative [
2]. Southeast Asia’s policies to replace plastic, such as PVC, with bamboo have accelerated its adoption. Bamboo’s renewability and low-pollution benefits offer significant potential for modern construction, furniture, and other industries [
3]. The Chinese Academy of Forestry and research institutes in South America have studied the mechanical properties of the bamboo fiber structure and explored its engineering application potential [
4,
5,
6]. Currently, AI technology has been applied to bamboo production. For example, the DNN model can predict bamboo’s mechanical properties [
7]; machine learning algorithms can predict bamboo’s compressive strength based on the cross-sectional area, outer diameter, and stem thickness [
8]; and convolutional neural networks (CNNs) can be used to identify bamboo species through images of bamboo stems in cross-sectional views [
9].
Ply bamboo, a high-quality material, is used in high-end consumer durables [
10]. Ply bamboo consists of boards and veneers composed of laminated bamboo strips. The bamboo strips are long and narrow, with a rectangular cross-section. Generally, bamboo strips’ width, thickness, and length are approximately 20 mm, 4.5–7.5 mm, and 2100 mm, respectively [
11,
12]. When producing ply bamboo, it is crucial to carefully apply adhesive to the bamboo strips, assemble them, and subject them to a heat press. To maintain the impeccable appearance and robust mechanical performance of ply bamboo, it is essential to meticulously classify the color and texture of the bamboo strips and rigorously screen for defective strips.
Currently, the inspection process relies mainly on workers sorting the items manually. As a result, manual sorting consumes considerable time and energy because of those defects. However, in addition to the small size characteristics, the surface texture characteristics of the bamboo strips are similar to actual defects.
With the promotion of computer and machine vision technology in industrial production, image processing and machine learning technology has become essential for the surface quality inspection of engineering materials, such as bamboo and wood naturally grown in forests. Bamboo and wood have natural textures on their surfaces and similar types of defect features, such as wormholes and cracks, so wood defect detection is useful for reference in the detection methods for bamboo surface defects. In particular, based on the material color, surface defects can be detected by manually designing image features or automatically extracting features through machine learning [
13,
14,
15,
16,
17,
18]. This type of technical research has a good recognition effect on single features (such as color), but it does not perform well when there are different sizes and shapes, and random location defects appear in bamboo strips during natural growth and mechanical processing. The main reason is that the above methods mainly rely on artificially designed image features to achieve object recognition. The defect features in bamboo strips are complex and variable during growth, making the recognition algorithm less robust and prone to false and missed detections. Researchers typically design an SVM for a specific dataset. For example, Kuang et al. first preprocessed an image and then used the radial basis function (RBF) as a classifier, achieving a certain recognition effect in bamboo defect detection [
19]. However, support vector machines (SVMs) demonstrate limited adaptability in industrial environments, where defect characteristics exhibit high similarity to background patterns or feature morphology and present complex and dynamic variations. Under these conditions, the generalization capabilities of the algorithm require substantial enhancement to achieve optimal performance.
Deep learning can automatically extract features and adaptive defect identification scenarios and has advantages in the high-precision identification of bamboo and wood material defects. For example, using two wood defect datasets, Fang et al. compared YOLOv5, YOLOv3, and Faster R-CNN [
20]. The experimental outcomes demonstrated that YOLOv5 outperformed the other two models in terms of the F1 score and exhibited notable superiority in training speed.
Note that the YOLO network has certain advantages in detecting surface defects in bamboo strips, but it encounters difficulty in identifying detailed features. Wormhole, cracking, burr, and mildew defects are all detailed features; for example, cracks are narrow in the direction of bamboo fibers, and burrs are strands of bamboo fibers on the edge of bamboo strips. Hence, this research realized that YOLO can be improved to recognize regular defects on bamboo surfaces, even though the YOLO approach might miss certain detailed defects. At the same time, there is room to further reduce its weight to meet the requirements of industrial computer hardware configurations.
This paper presents an improved YOLOv8n defect detection model. Bamboo strip manufacturers provide a dataset with defects on bamboo surfaces, and this research employs this dataset to train the improved YOLOv8n model to enhance its ability to extract features of defective objects on bamboo strip surfaces. The primary contributions of this research can be summarized as follows:
The improved YOLOv8 model uses dynamic convolution and the Ghost C3k2 module to replace C2f to reconstruct the backbone and neck parts. After further optimizing C3k2 with dynamic convolution and Ghost convolution, the model maintains accuracy while significantly reducing the parameter count and computational complexity, although this process decreases the detection speed.
The improved model introduces an attention mechanism using an Efficient Multiscale Attention (EMA) module to boost the network’s capacity for target detection. In addition, the network implements the DySample module to replace the original upsample module and enhance network performance.
2. Prior Research Work
In the literature, some scholars have applied and improved YOLO networks to detect defects in wood and bamboo. Some scholars have improved the YOLOv5 model to improve the target recognition performance. Xu et al. improved YOLOv5 with the C3Ghost and SimAm modules for five wood defects [
21]. Hu et al. used vision transformer technology to classify the surface defects of processed bamboo by introducing the DropBlock, and the accuracy of this method is 2% higher than the original transformer network [
22]. Cui et al. proposed an improved YOLOv3 model to detect wood defects by incorporating a spatial pyramid pooling (SPP) mechanism, and the detection time for each image is within 13 ms [
23]. Han et al. introduced the Swin Transformer module and a small-target detection head to detect complex defects on the wood surface and increased the mAP by 3.1% (reached an mAP of 84.2%) [
24]. Zhou et al. enhanced the YOLOv8 network with GSConv and the GS bottleneck and improved the model process capabilities by marking a 1.86% increase over YOLOv8 [
25]. Liu et al. proposed a module using partial depthwise convolution (PDWConv) and replaced the regular convolution with lightweight depthwise separable convolution (DWSConv) for downsampling. As a result, the model’s speed can be increased without losing accuracy [
26]. This method replaces YOLO’s original convolution and uses lightweight convolution to reduce the network parameters.
Equipment often limits the promotion of artificial intelligence technology in the bamboo and wood industry. Small and medium-sized enterprises cannot afford the hardware costs of high-performance equipment. Therefore, reducing the model’s computer requirements is also an important task. Hence, dynamic convolution improves network performance under low-FLOP conditions by dynamically adjusting and optimizing the use of computing resources, which is useful for industries that require efficient operation of devices with limited computing resources [
27,
28]. Hence, this study proposes integrating dynamic convolution mechanisms to enhance the robustness of detailed feature extraction and recognition capabilities.
The above type of convolution primarily exerts a lightweight effect. Conventionally, this approach integrates an attention mechanism to optimize network performance. Combining convolution and attention mechanisms in the YOLO network can help to focus on target areas with complex backgrounds and improve the network recognition capabilities.
Hence, in the literature, Guo et al. improved an algorithm based on YOLOV4-CSP by introducing a symmetric convolution and CBAM attention mechanism, combining channel and spatial attention [
29]. Jia et al. improved the MobileNetV3 model by CBAM to recognize and count bamboo sticks [
30]. Zhang et al. proposed an SE attention mechanism to enhance the recognition ability of wood defects and improve the neck parts to reduce the number of parameters [
31]. Meng et al. proposed a YOLOv5 model based on a Semi-Global Network (SGN) to improve the accuracy of wood defect detection by 3.1% [
32]. Su et al. improved YOLOv8n by adding a small-object detection head and integrating a mixed local channel attention mechanism [
33]. Wang et al. introduced the Biform attention mechanism based on YOLOv7 to achieve content awareness of wood defects [
34].
These studies demonstrate improvements in the performance of object detection algorithms in wood and bamboo defect detection by integrating different attention mechanisms. These improvements usually focus on improving the accuracy, reducing the model parameters, and enhancing the detection ability of detailed features. Hence, incorporating an attention mechanism is anticipated to be a more effective approach to addressing this detection challenge.
This research realizes the relevant industry needs a new method to acquire the necessary feature information caused by detailed bamboo strips in defect images during upsampling in deeper models. This study notes that CARAFE [
35], FADE [
36], and SAPA [
37] introduced dynamic upsamplers that generate content-aware kernels for recombining features, but they add complexity and require high-resolution feature inputs. On the other hand, this research also notes that DySample [
38], an efficient and lightweight alternative, generates content-aware sampling points for resampling continuous feature maps, offering a more intuitive approach than kernel-based methods. With fewer parameters and FLOPs and lower GPU memory usage and latency compared to its counterparts, this study chose DySample to enhance the YOLOv8 upsampler.
3. Materials and Methods
3.1. Algorithm Improvement of YOLOv8
YOLOv8 is a real-time object detection method.
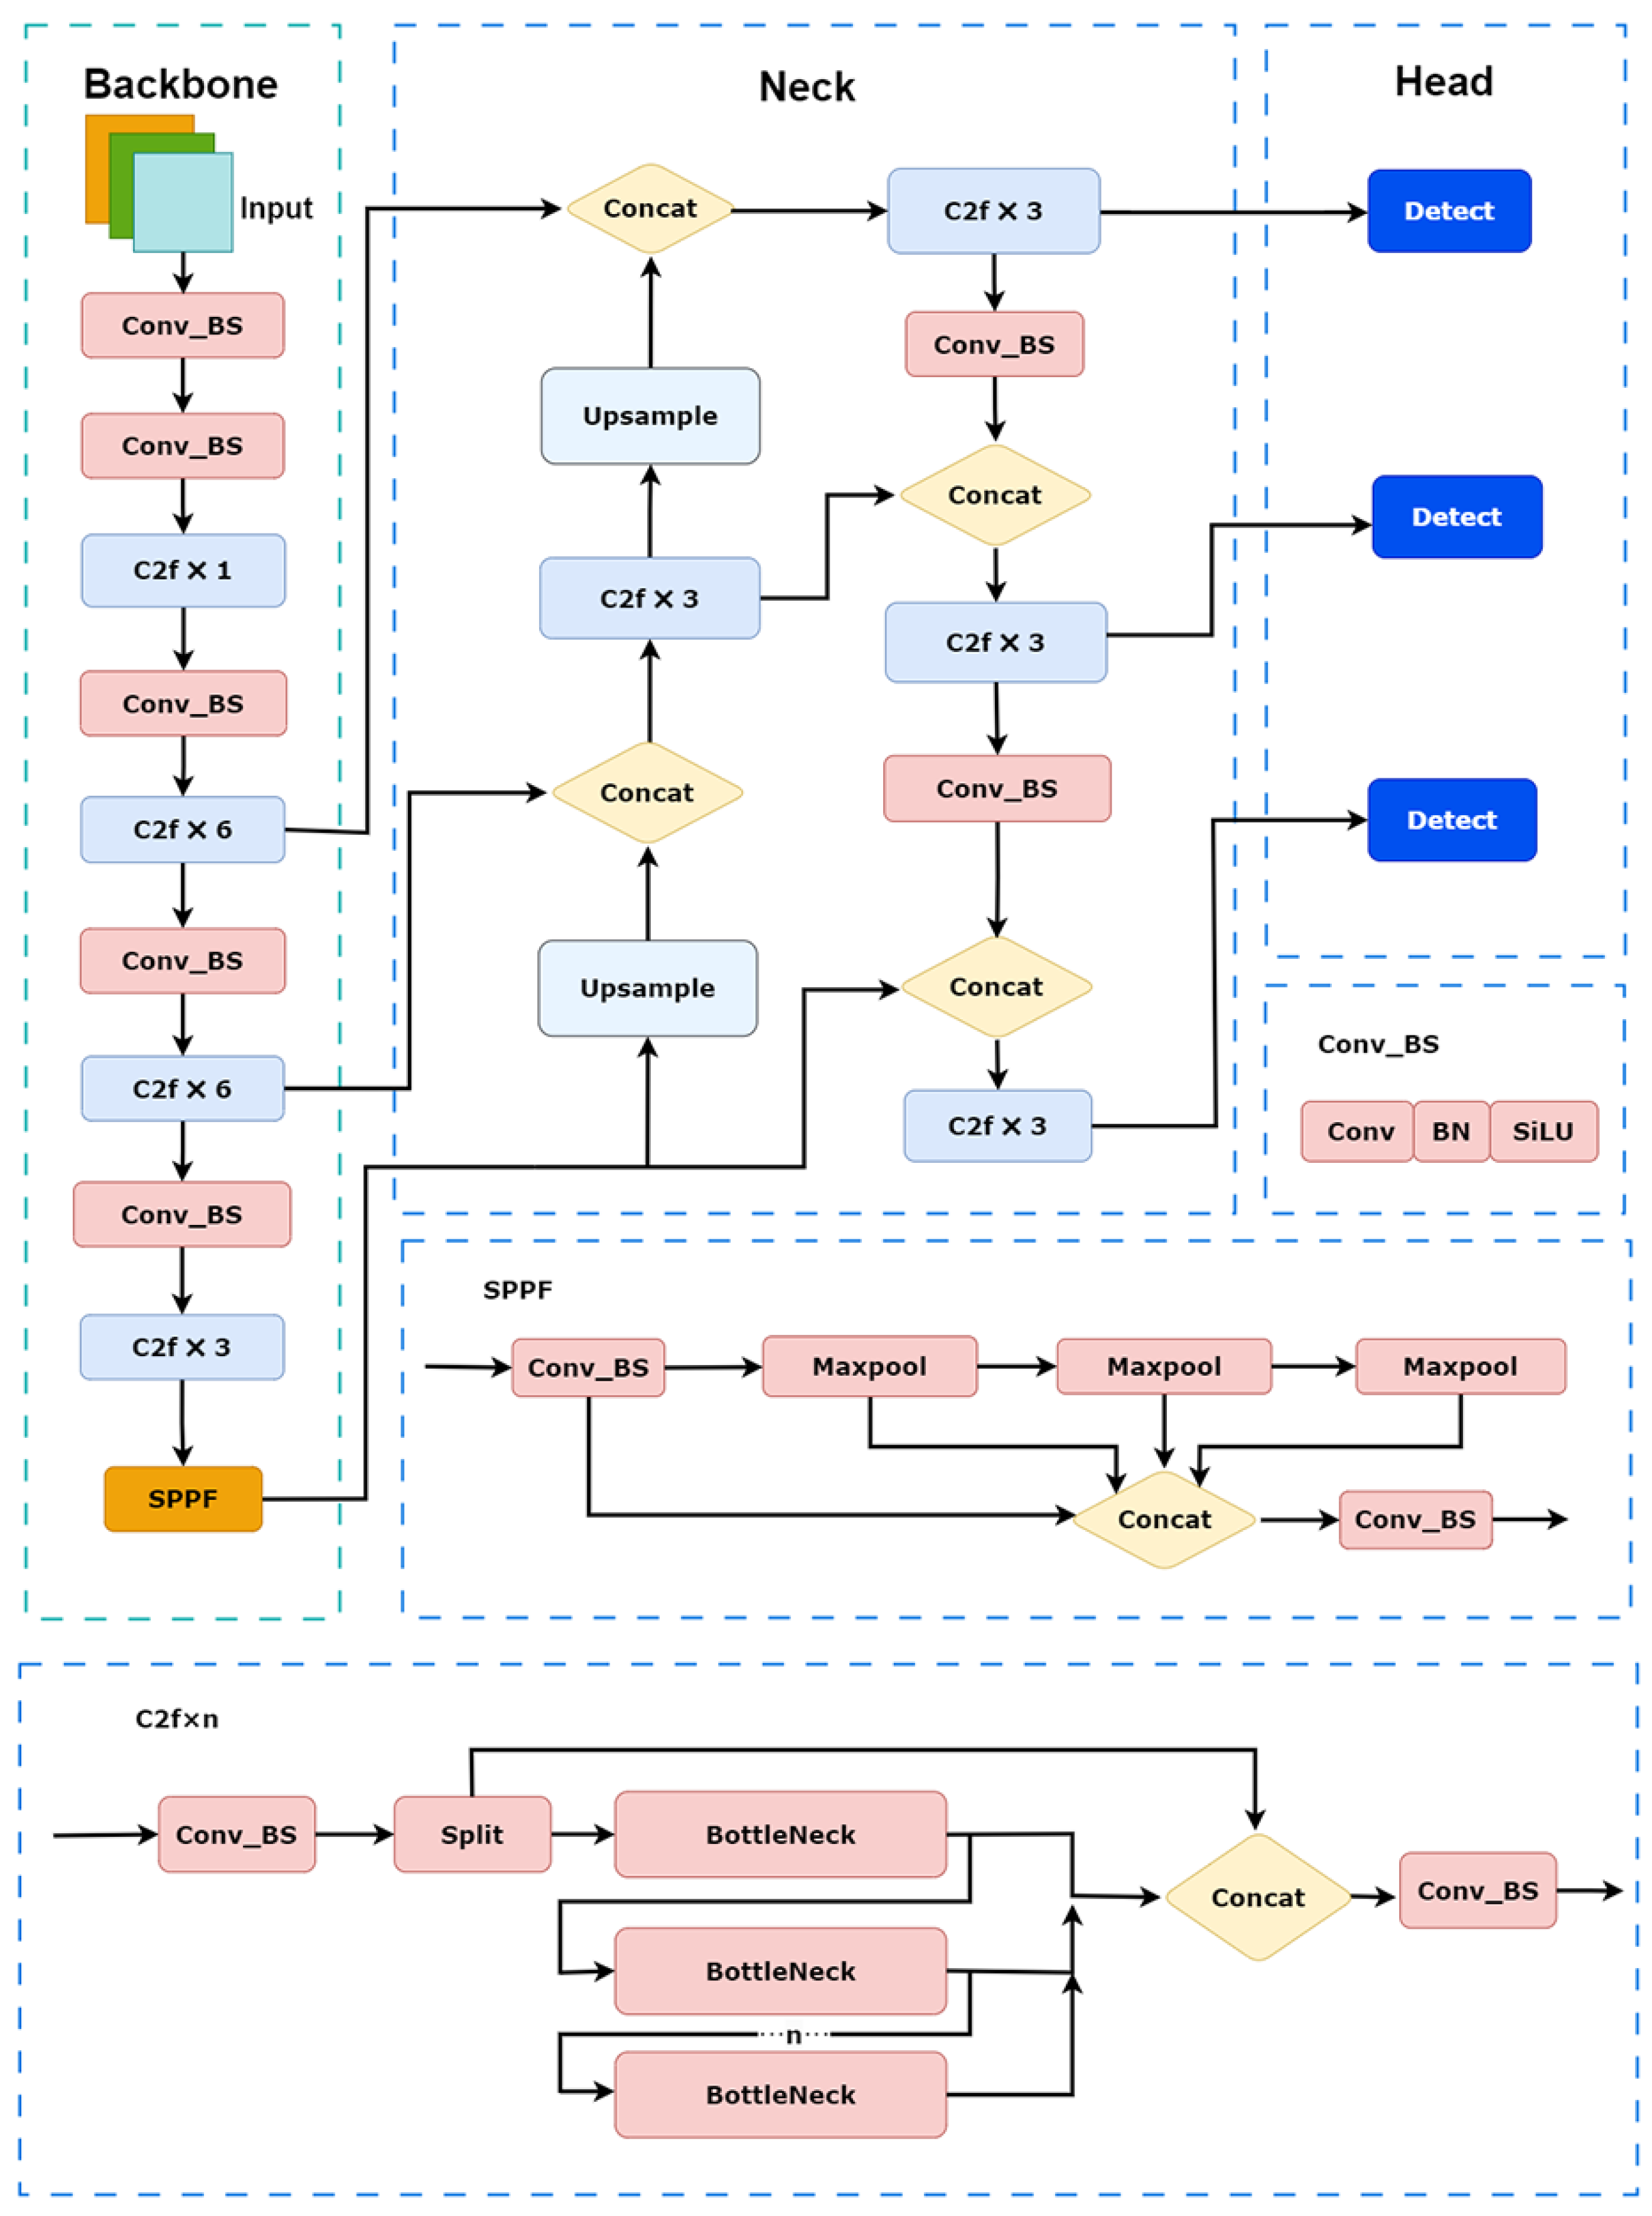
Figure 1 shows the structure of YOLOv8. The YOLOv8 structure consists of backbone, neck, and head output ends. The backbone consists of Conv_BS, C2f, and SPPF modules. The C2f module contains bottlenecks, Conv_BSs, and Splits. The SPPF module extracts multiscale features through pooling with different kernel sizes and performs superposition and fusion. The neck part uses PANet (Path Aggregation Network) to enhance the fusion capability of features at different scales. The head predicts the three-size feature maps and the prediction boxes generated by feature maps of different sizes, and finally outputs the prediction results of the network.
As illustrated in
Figure 2, this study implements modifications by integrating dynamic convolution and an improved Ghost C3k2 module, accompanied by adjustment of the training weights for diverse feature representations. This study attempts to mitigate the loss of feature information in small objects during multiple sampling operations, thus introducing a DySample module to ensure robust detection performance for minute defects, such as mold spots and wormholes. These architectural refinements collectively enhance the network’s capability for precise localized detection tasks. In addition, an EMA module is inserted into the neck part to improve the ability to recognize detailed features.
Through the attention mechanism, the model can dynamically assess the importance of different features and prioritize the most valuable information. As shown in
Figure 2, this study places three EMA modules in the neck section. The primary purpose of placing the attention mechanism in the backbone is to extract low-level features from the original image that are more general and contain a significant amount of redundant information. However, the advantage of the EMA module lies in its ability to fuse features at multiple scales, making it more suitable for integration with the neck part. In this study, EMA modules are set up for different detection scales to capture the characteristics of the targets better.
3.2. Replacement with Dynamic Convolution and C3k2
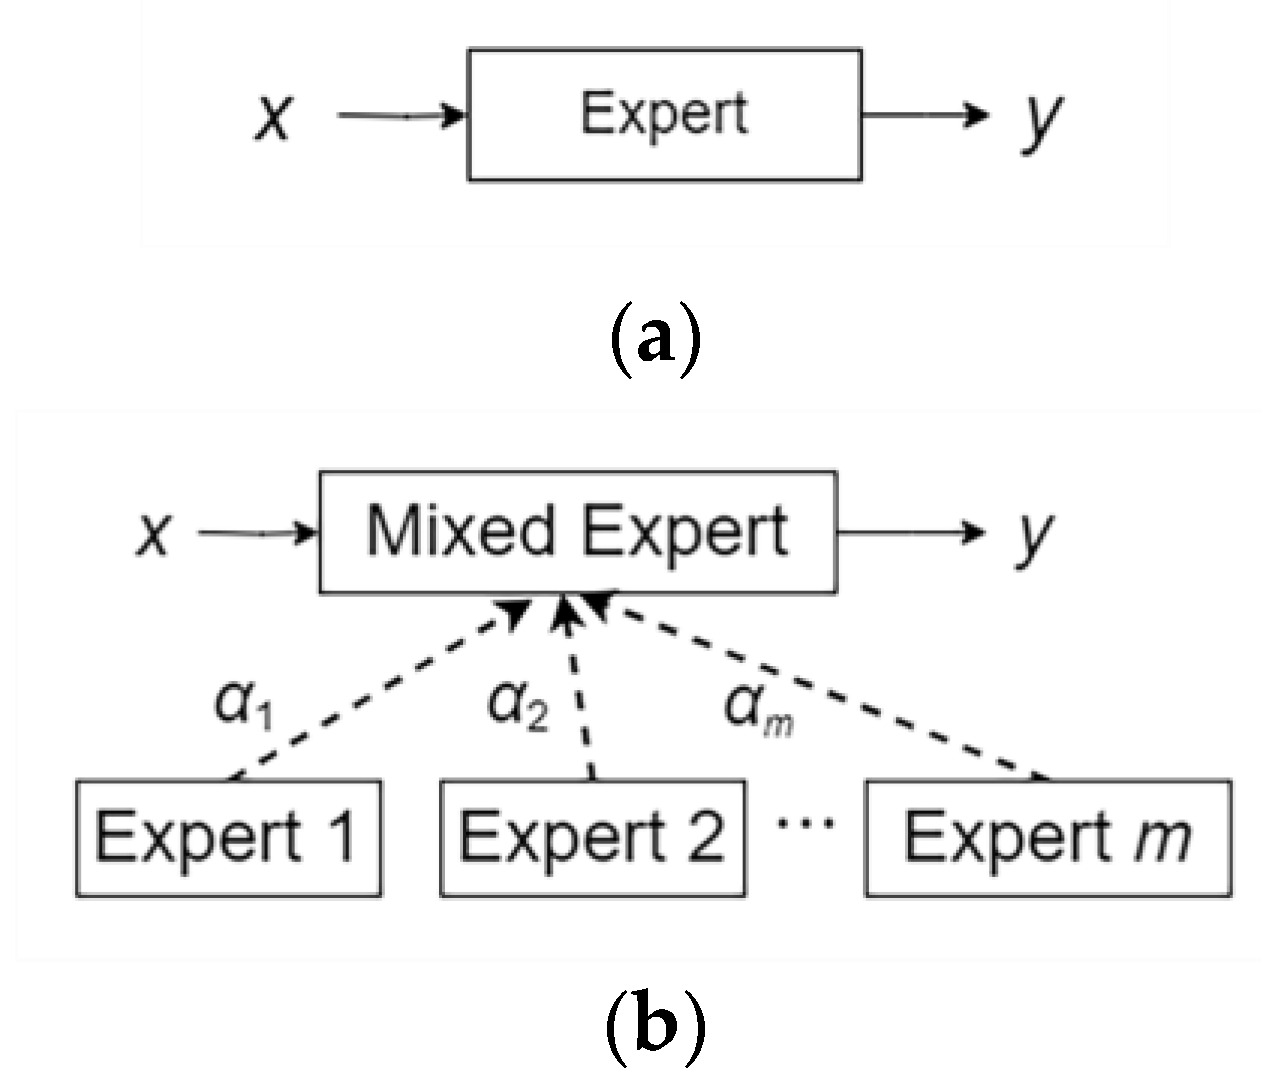
This article introduces DynamicConv (dynamic convolution), which increases the number of parameters but does not introduce extra FLOPs. Dynamic convolution works by dynamically selecting or combining different convolution kernels (called “experts”) for each input sample to process input data. Considering this method as an extension of the traditional convolution operation, the network can adaptively adjust the corresponding parameters according to the input data. In dynamic convolution, instead of using fixed experts for all inputs, there are multiple experts (or sets of parameters), and the expert is chosen dynamically based on the characteristics of the input. The strategy achieves this adaptive selection through the function of a dynamic convolution algorithm (for example, using a multilayer perceptron (MLP) and softmax function), which can dynamically generate weights that control the contribution of each expert.
Figure 3 illustrates the dynamic convolution calculation process.
Figure 3a shows the traditional convolution calculation method, and
Figure 3b shows the dynamic convolution calculation method. In DynamicConv, for a given input feature
X, there is a set of convolution kernels
W1 and
W2…
Wm. Each kernel corresponds to an expert. The output of each expert adjusts itself using a dynamic coefficient generated for each input sample through AI. The output
y is the weighted sum of all dynamically selected convolution kernel operations.
where ∗ represents the convolution operation and calculates the weighted sum dynamically.
Figure 2 shows the C3k module. The C3k module uses the bottleneck structure based on the traditional C3 module and combines it with a larger convolution kernel to strengthen the feature extraction capability. The structure of the C3k2 module usually divides the input features into two parallel convolution paths. The system directly delivers one part through ordinary convolution operations and expands the other through multiple C3k variable convolution kernel sizes or bottleneck structures for deep feature extraction. Finally, the two features are concatenated and fused through 1 × 1 convolution. This structure can remain lightweight while effectively extracting deep features.
Based on dynamic convolution, this study integrates DynamicConv and Ghostbottleneck to improve the C3k2 structure and reduce the number of calculations in the model. GhostNet implements inexpensive operations to simplify the standard convolutional layer through GhostBottleneck. As shown in
Figure 4, the improved C3k2 replaces traditional convolutions with DynamicConv, allowing C3k2 to obtain the dynamic weight advantage of DynamicConv in convolution calculations; it also uses GhostBottleneck to replace C3k2’s bottleneck, and Ghostbottleneck’s linear change method to reduce the number of convolution calculations.
3.3. Attention Mechanism for Optimization
Figure 5 illustrates the EMA module’s work process. EMA will divide C into G sub-features in the channel dimension direction to learn different semantics. EMA exploits the three parallel routes to extract attention weight descriptors of the grouped feature maps. Two parallel routes are in the 1 × 1 branch, and the third is in the 3 × 3 branch. Through the parallel design of the 1 × 1 and 3 × 3 branches, the EMA module can simultaneously capture global channel interactions and local spatial details, effectively handling multiscale targets. In this module, the system divides the input feature map into g groups; each group contains c/g channels. First, the process performs average pooling of each feature map in the X and Y directions (Avg Pool) and then generates two attention weight maps through 1 × 1 convolution and sigmoid activation functions. By using the sigmoid activation function, attention weights are allocated to adaptively assign feature importance, thereby demonstrating more robustness. Next, these weights are group-normalized and softmaxed to obtain the importance of each group feature. Subsequently, the weights are applied to the original feature map through matrix multiplication (Matmul) to achieve feature weighting. By applying the weight to the original feature map through matrix multiplication, the EMA module can dynamically adjust the feature response, suppress noise, and highlight key areas to significantly enhance the expression ability of important features.
On the other hand, the 3 × 3 branch captures the local cross-channel interaction via a 3 × 3 convolution to enlarge the feature space. Finally, the final weighted feature map is output after the sigmoid activation function. In this way, EMA not only encodes the inter-channel information to adjust the importance of different channels but also preserves the precise space structure information in the channel.
3.4. DySample for Upsampling
In the YOLOv8n architecture, the conventional nearest-neighbor interpolation method employed in the upsampling layers exhibits limitations, as it disregards smooth transitions between pixels and relies solely on a limited number of adjacent pixels for prediction. In scenarios characterized by complex image textures or high detail density, this sampling methodology may result in the degradation or loss of fine-scale image information. This study introduces the DySample upsampling mechanism to address this constraint and to replace the traditional upsampling approach. The DySample upsampling methodology implements a point-sampling-based strategy, and
Figure 6 depicts its operational principles. As illustrated in
Figure 6a, we consider a feature map
X with dimensions
C ×
H ×
W and a point sampling set
S with dimensions 2
g × sH × sW, where 2
g denotes the
x and
y coordinates,
sH indicates the sample point height, and
sW indicates the sample point width. The grid_sample function resamples
X using the positions specified in set
S, generating a transformed feature map
X’ with dimensions
C × sH × sW.
This study generates the point sampling set
S through a “linear + pixel shuffle” methodology, with the offset range determined by the static and dynamic range factors, as depicted in
Figure 6b. Taking the static range factor-based sampling method as an example, given a feature map
X of dimensions
C × H × W and an upsampling factor
p,
X initially transforms a linear layer with input channel
C and output channel 2
gs2. Subsequently, the pixel shuffle technique is employed to reshape the output into an offset
O with dimensions of 2
g × sH × sW. The process then computes the sampling set
S as the summation of the offset
O and the original sampling grid
G. The mathematical formulation of this process is expressed in Equations (2) and (3), as follows:
The DySample upsampling mechanism dynamically adjusts each sampling point through learned offsets, facilitating a more precise extraction of detailed features associated with bamboo strip defects. This adaptive sampling approach enhances the perceptual capabilities of the model for minute defect characteristics.
4. Experiment Results and Discussion
4.1. Data Preparation and Experimental Conditions
This study collected images of bamboo strips from a bamboo processing factory in southeastern Asia. Defective bamboo strips sorted by bamboo strip sorting workers were collected and classified into four types of bamboo strip defects: wormholes, mildew, cracks, and burrs. Meanwhile, the workers photographed images of all bamboo strips with and without defects.
The image acquisition system for bamboo strips consisted of some CCD color industrial cameras and ambient light sources. The industrial camera was MV-GE133GC, with a maximum resolution of 1280 × 1024 pixels and an 8 mm lens. Furthermore, the light sources for image shooting were two 22 W JSIONX ambient light sources, which provided a stable light source for bamboo strip image shooting to ensure the stability of the captured image.
Table 1 lists the computing device configuration and training parameters used in the experiment.
The inspected bamboo strips were approximately 2.2 m in length, with a rectangular cross-section measuring approximately 20 mm in width and 5–7 mm in thickness. Generally, these strips exhibit high tensile, compressive, and flexural strengths, as well as excellent elastic moduli and flexibility. This type of bamboo strip is polished and physicochemically treated, and its surface quality and bonding performance are further improved. Thus, it is suitable for fabricating plywood and other structural materials.
The bamboo strip inspection platform has two main functions: feeding and image sampling. The sampling section of the inspection device is shown in
Figure 7a. The cameras are distributed on the front and side of the bamboo strip, and the light sources illuminate the sampling area. When the bamboo strips enter the sampling area, the cameras start capturing the images. The strip takes approximately 10 s to pass through the sampling area, during which time the cameras capture images and transmit them to a computer. During operation, the sampling platform is enclosed, free from external light interference. The camera aperture is set at F2.8, with an exposure time of 0.5 milliseconds. The light sources ensure sufficient exposure of the bamboo strip regions in the image, while the background remains very dark. The captured image is directly imported into the YOLO model for detection without additional photo processing.
Figure 7b shows front and side photos from the cameras.
Figure 7c displays four types of defects identified by the algorithm proposed in this research.
The researchers gathered approximately 11,000 defect images and annotated them in the YOLO data format. The annotations included approximately 4600 crack defects, 5200 mildew defects, 2500 edge defects, and 1200 wormholes. Then, this study split the data into training, validation, and test datasets in an 8:1:1 ratio.
Figure 7c shows photos of the four detailed defects.
4.2. Evaluation Indicator and Model Training Results
This study also evaluated the accuracy of bamboo defect detection by utilizing the average precision (AP), mAP, precision, recall, and frames per second (FPS). The mAP averages the model’s performance across all categories. The average accuracy is a combination of checking accuracy and completeness, where the checking accuracy indicates the proportion of correctly identified positive samples, and the checking completeness refers to correctly identified positive samples. FPS is a metric that represents the number of image frames processed per second and assesses the speed at which the algorithms process data and how long it takes to conclude the models.
Detailed explanations of the calculation methods used for these metrics are provided below:
True positive (TP) is the number of samples where the object exists, and false positive (FP) is the number of samples in which the object does not exist.
The intersection over union (IoU) is the ratio of the intersection to the union of the predicted and labeled boxes. Calculating the AP using the area under the P-R curve (with precision as the vertical axis and recall as the horizontal axis) is straightforward. mAP@0.5 represents the average detection accuracy when the IoU threshold is 0.5, and mAP@0.5:0.95 is the average detection accuracy calculated in steps of 0.05 when the IoU threshold ranges from 0.5 to 0.95. The higher the mAP value, the better the model’s detection performance for bamboo strip defect targets.
YOLOv8 has several serialized network structures, including YOLOv8n, YOLOv8s, YOLOv8m, YOLOv8l, and YOLOv8x. In these five network structures, the model size and the number of parameters increase sequentially. To obtain the best research baseline for bamboo defect detection, the researchers selected YOLOv8n, which is lightweight and has the lowest number of parameters, as the study baseline. Therefore, the researchers made improvements to achieve the best performance.
4.3. Ablation Experiment
Using the same environmental and parameter settings, the researchers performed ablation experiments to precisely assess the influence of the enhancement components on bamboo strip defect detection.
Figure 8 shows the mAP curves of the improved and baseline models for the validation set. YOLOv8n is the baseline, and EMA is the final improved model. The curve obtained for the improved model rises more smoothly than the YOLOv8 curve, and the curve fluctuates less and converges to 0.926 after 300 training epochs. The YOLOv8 mAP curve fluctuates significantly in the early stage, tends to stabilize after 250 training epochs, and achieves 0.915. This indicates that the improved model’s curve presents a better result than that of the original model.
Figure 8 also shows the mAP curves after gradually adding modules, including the curve changes after adding C3k2, C3k2 improved by dynamic convolution, and the DySample module. These curves finally converge between 0.91 and 0.92.
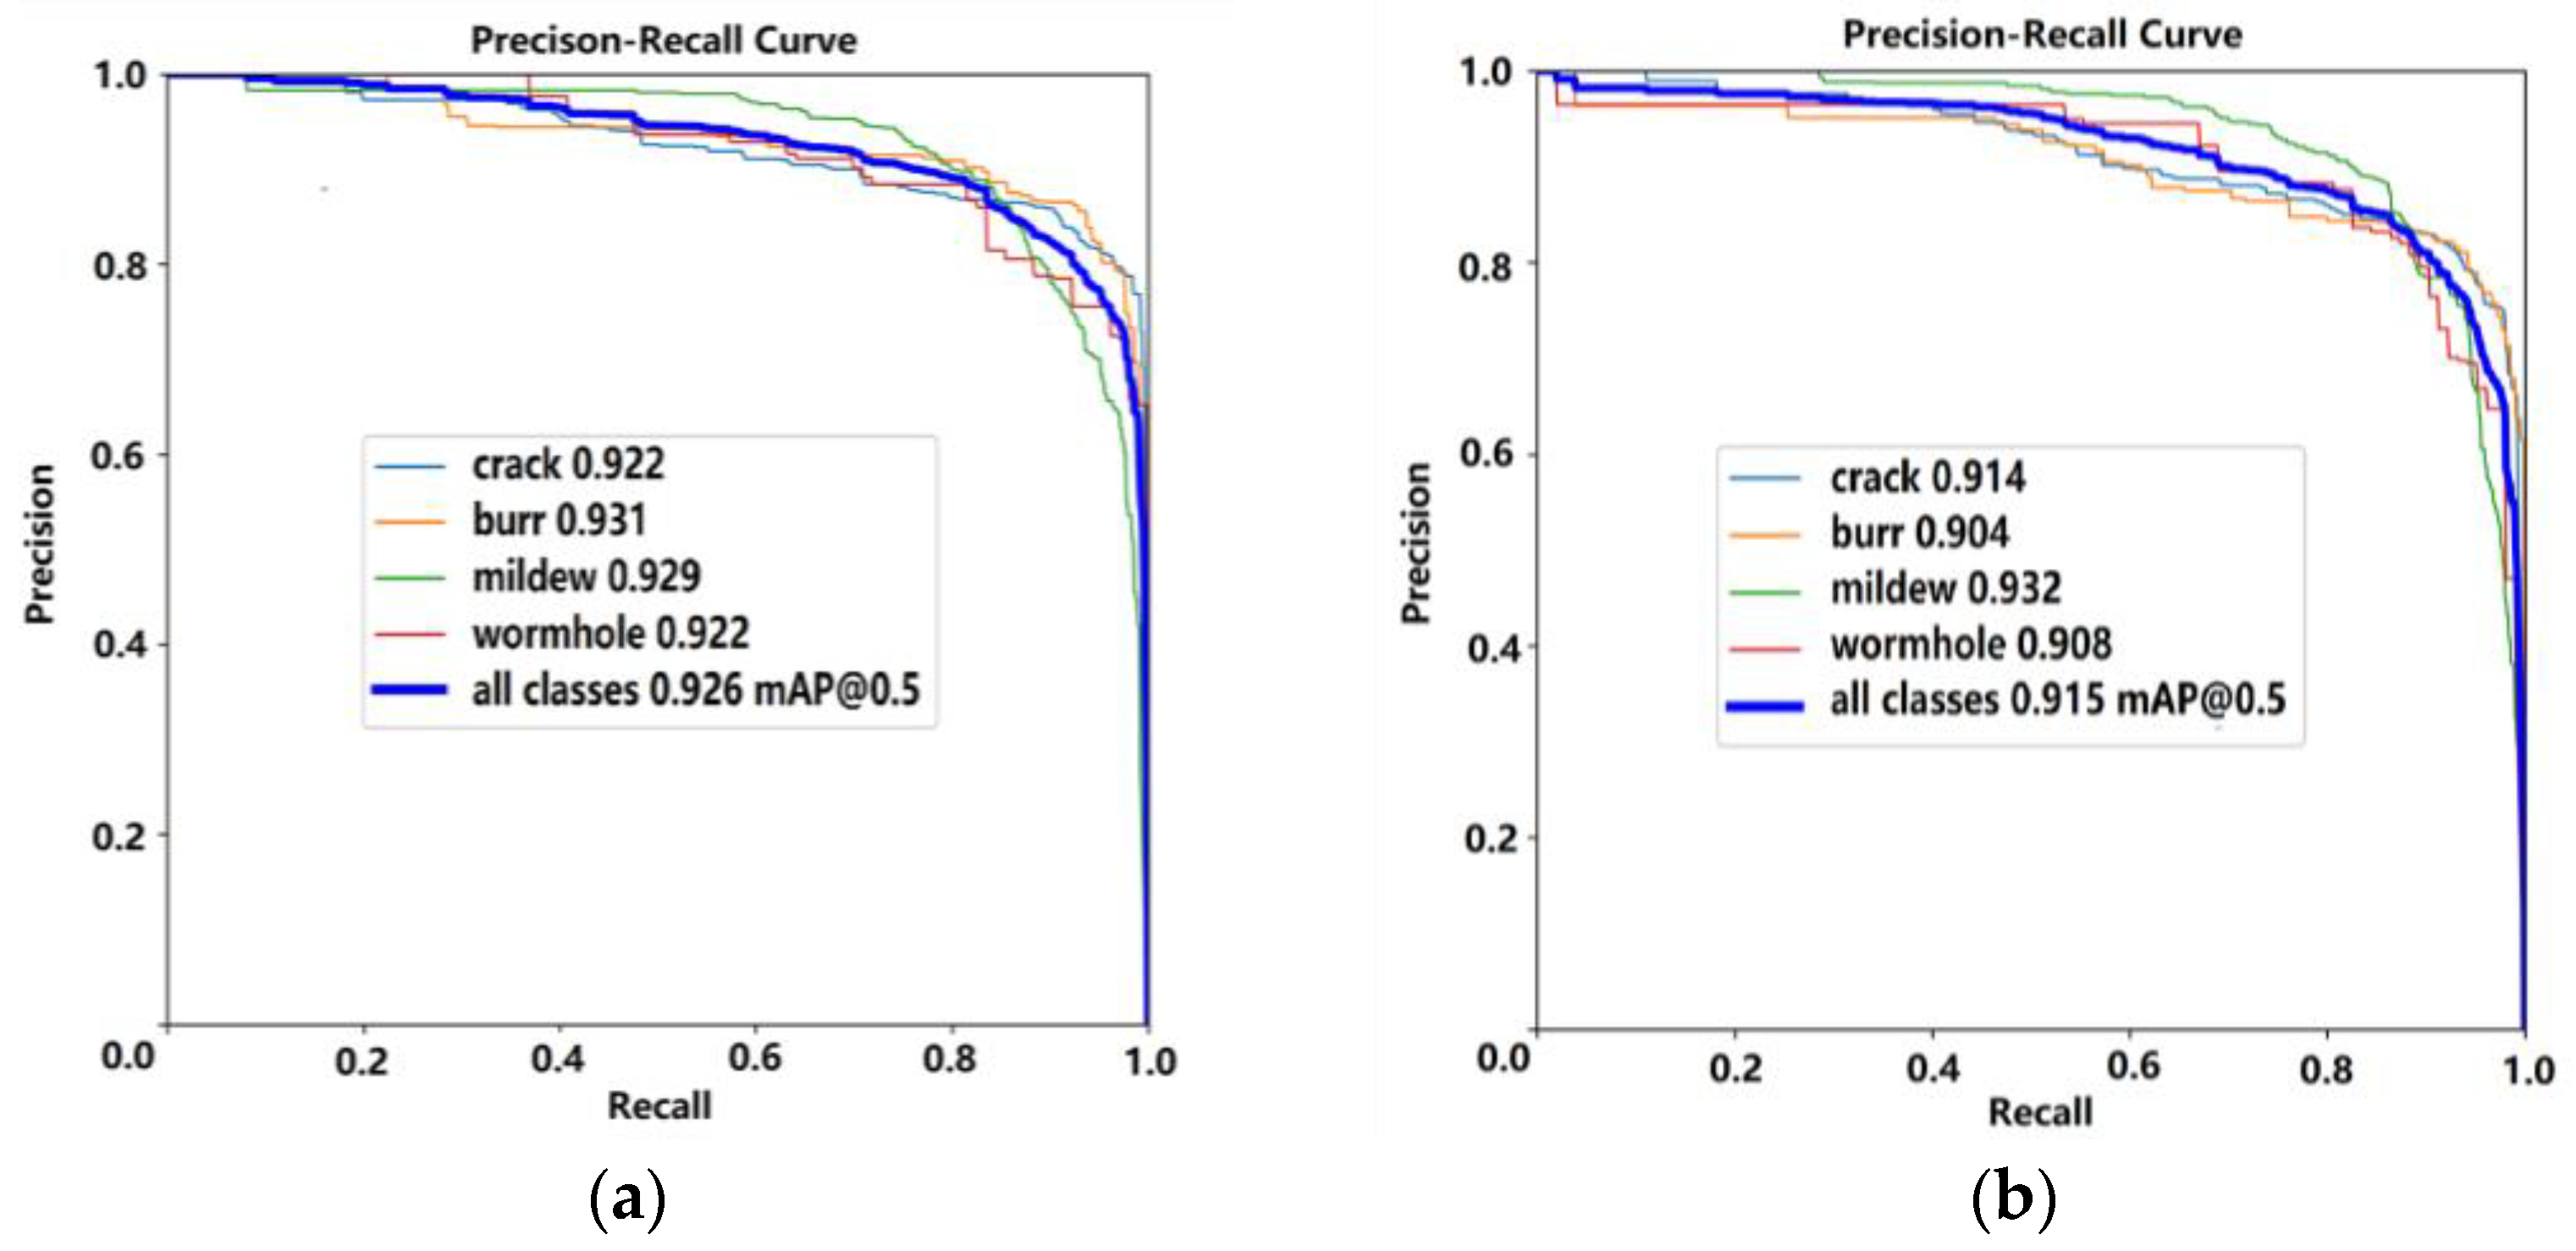
Figure 9 shows the P-R curves obtained from the experiments.
Figure 9a shows the P-R curves of the improved model, and
Figure 9b shows the P-R curves of the baseline YOLOv8n. The figure indicates that the improved YOLO has an obvious improvement in the dataset relative to YOLOv8n, reflecting the model’s good target recognition ability.
To further analyze the effects of each improvement module on the model performance in this study,
Table 2 shows the step-by-step experimental effects of the YOLOv8n improvement. The left side of the table shows the improvement steps, and the right side shows the experimental effects corresponding to the improvement steps.
Table 2 shows that each module has different effects on the model performance in the defect detection task. The “√” in
Table 2 indicates that the corresponding module has been added to the model.
The base model’s mAP@0.5 reached 91.5%, while the precision and recall were 78.9% and 90.4%. First, this study added the C3k2 module to the network, followed by dynamic convolution and the Ghost module, and then C3k2 was optimized. At this time, the mAP@0.5 of the model was 91%, a relative decrease of 0.5%. Simultaneously, the weight decreased to 4.8 M, and FLOPs decreased to 5.4 G. This indicates that the researchers effectively reduced the model weight and FLOPs and decreased the amount of parameter calculation and the computational complexity.
Then, with the addition of DySample, the mAP@0.5 was 91.4%, and the precision and recall were 80% and 91.1%, respectively. Adding DySample improved the model’s accuracy, and the mAP indicators caught up with the original model, YOLOv8n.
After incorporating EMA into the model, the mAP@0.5 was 92.6%, the precision increased to 81.5%, and the weight was hardly increased. Finally, compared to the original model, the improved model achieved a 1.1% improvement in the mAP@0.5 and a 2.6% improvement in the precision. This observation indicates that combining these modules can help to maintain a high detection accuracy while obtaining suitable model parameters. At the same time, the weight decreased to 4.8 M, representing a 14% reduction, and FLOPs decreased to 5.2 G, significantly reducing the computational complexity.
To further analyze the impact of dynamic convolution and the attention mechanism on the detection mAP value of the four defects in the ablation experiment,
Table 3 lists the defect mAP values corresponding to each step of the ablation experiment. The “√” in
Table 3 indicates that the corresponding module has been added to the model. From
Table 3, we can see that the mAP of burrs and wormholes had better outcomes after the model was improved, and the detailed defect detection performance was significantly improved. The mAP of the base model (YOLOv8n) was 91.5%. With the dynamic convolution and improvement of C3k2, the mAP changed to 91.0%, the mAP of mildew decreased to 92%, and the mAP of wormholes decreased to 89.9%. After adding DySample, the defect detection increased by 1% for wormholes and by 0.5% for cracks, while that for burrs and mildew showed almost no change. In addition to EMA, the mAP of the improved model was 92.6%, the mAP of wormholes was 92.2%, and the mAP of burrs was 93.1%; indicators of other defects exhibited only slight changes. This observation indicates that the improved model dynamically adjusts the attention weights for different features, emphasizing wormholes and burrs more.
4.4. Comparative Experiment
During the model optimization process, C3k2 was improved by dynamic convolution. In order to better reflect the effect of dynamic convolution,
Table 4 shows the changes in the main performance indicators of the model before and after the improvement in dynamic convolution, including the detection accuracy, parameters, FLOPs, and FPS. The memory usage can be reflected by the number of model parameters. The larger the number of parameters, the more memory occupied. And the higher the FPS, the lower the inference time.
Table 4 shows the effect of using dynamic convolution to optimize C3k2 in YOLOv8_dynamic convolution_C3k2. The model accuracy was improved, the weight and parameters increased significantly, and the FLOPs was only 5.4 G, indicating that dynamic convolution increased the number of parameters, but did not introduce additional FLOPs, only increasing the FPS. After the introduction of Ghost convolution to continue the optimization, the weight and parameters were significantly reduced, but the FLOPs was not reduced, which indicates that Ghost convolution can effectively reduce the number of parameters, without increasing the computational complexity, and improve the FPS. However, the improvement in the FPS caused by Ghost convolution still cannot reach the FPS of the original model. This may be because the optimization effect depends on the hardware. The hardware has insufficient support for these convolution methods, which may lead to a reduction in reasoning speed.
In this study, the Dysample algorithm replaces the nearest-neighbor interpolation algorithm of YOLOv8. In order to further analyze the optimization of DySample in the model, comparisons with other common upsampling algorithms based on the upsampling of YOLOv8 using Dysample, bilinear interpolation, transposed convolution, and bicubic interpolation were conducted. The results of these comparisons are presented in
Table 5.
Table 5 shows that DySample improved the precision compared to YOLOv8’s nearest-neighbor interpolation, and the other metrics are similar. For bilinear interpolation, transposed convolution, and bicubic interpolation, the effects are often expressed by the peak signal-to-noise ratio (PSNR) and structural similarity index (SSIM), and the PSNR and SSIM are mainly used for image reconstruction or super-resolution tasks. The purpose of YOLO upsampling is to enhance feature extraction ability, and the appropriate evaluation indicators are mAP, precision, etc. Compared with transposed convolution, bilinear interpolation, and bicubic interpolation, DySample has the highest mAP@0.5 and precision and the lowest FLOPs, while the other indicators are not significantly different.
This research compared different algorithms to verify the experimental results of bamboo strip defect detection. The algorithms included YOLOv5n, YOLOv8n, YOLOv10n, YOLO11, and the improved model. The employed assessment criteria included mAP@0.5, precision, mAP@0.95, recall, weight, FLOPs, and FPS.
Table 4 presents the results of the comparative experiments.
As can be seen from
Table 6, the improved model has the best mAP@0.5, YOLOv5n has the lowest mAP@0.5, and the mAPs of the other YOLO models are similar. Although the weight of YOLOv5n is the lowest at 4.7M, its mAP is significantly lower than that of the developed model. The weight of the developed model is significantly lower than that of YOLOv8/10/11. The weight and FLOPs together reflect the requirements of the model on computer hardware, which have an important impact on industrial computers or low-performance edge computer hardware. The developed model has the lowest weight and FLOPs compared to the other models, which means it has low hardware requirements, which is conducive to reducing hardware costs and industrial promotion. As for FPS, YOLOv5, YOLOv8, and YOLO11 have significantly higher values, but their FLOPs is also high. The premise of high-speed detection is to rely on support such as high-performance GPUs, and it is difficult to take advantage of FPS if the system cannot meet the FLOPs requirements. Compared with YOLOv6n and YOLOv7n, the improved model is better, and the FLOPs is a significant advantage. And compared with Faster R-CNN and SSD, it can be seen that their mAP@0.5s are higher than those of the YOLO versions, but they have a large number of parameters, sacrifice a lot of reasoning time, and depend on high-performance hardware.
Table 7 lists the mAPs for the four bamboo strip defects of the different YOLO models. The different YOLO versions have different effects on detecting different defects. YOLOv5n achieved 86.3% accuracy in wormhole detection, while YOLOv8n achieved 93.2% accuracy in mildew detection. The performance of YOLOv10n and YOLO11n in defect detection was relatively balanced, with YOLO11n achieving accuracies of 91.1% and 93.5% in wormhole and mildew detection, respectively. However, the developed algorithm performed well on all four defect detection tasks, especially wormhole and burr detection, achieving accuracies of 92.2% and 93.1%, respectively, and the overall mAP@0.5 also reached 92.6%, the highest among all the models. This shows that the developed algorithm has good generalization ability and accuracy in defect detection tasks, especially in wormhole and burr detection, and the improved YOLO shows obvious advantages over the other YOLO versions.
Although the FPS of the improved model in this study is lower than that of the other YOLO models, it does not affect the practical application of the model in industrial scenarios. In industrial applications, defect detection focuses on the stable detection of detailed defects. In industrial production, the length of bamboo strips is about 2.2 M, the movement speed of the mechanical structure of the detection device is limited, and the speed of bamboo strips passing through the detection device is relatively slow (about 10 s/root), which provides enough time for photographing and identification. Therefore, even if the FPS is reduced, the production process is unaffected. Thus, the FPS of the current model satisfies actual requirements.
Taken together, through the research methods, the improved model in this study showed good performance in terms of the mAP and comprehensiveness of the burr and wormhole targets, indicating that the improved model had good target recognition ability for several samples.
4.5. Visual Structural Analysis
This study verifies the performance of the research method in real scenarios by presenting the model detection results, as shown in
Figure 10, for the four types of defect images mentioned in this article.
Figure 10a shows the detection results of YOLOv8n, and
Figure 10b shows the detection results of the improved model. The first comparison involves a wormhole defect. The wormhole defects in the sample are small and distributed along the texture direction. In
Figure 10a, the improved model has relatively high confidence in the wormhole. In
Figure 10b, the cracking defect is a narrow seam along the grain direction, which is easily confused with the background of the bamboo strips. Based on the recognition results, the algorithm model can identify cracking defects more confidently than the original model. In
Figure 10c, we select a burr defect with a small curved edge. Note that it is different from common straight-edge burrs; however, the algorithm model can also complete the identification, which demonstrates its enhanced flexibility in recognizing such features. Simultaneously, the improved model’s recognition confidence is also improved. As shown in
Figure 10d, the defect area is small and very close to the texture, and the algorithm model can still identify the mold defect. Moreover, the mold defect is similar to the cracking defect in
Figure 10d; both are narrow black lines, but the algorithm model accurately identifies them as mold defects, and there is no misjudgment.
Compared with the image recognition method, the improved model can achieve better recognition of bamboo strip defects. In practical applications, researchers have focused on attention mechanisms, data sampling, and confidence threshold settings to ensure performance consistency. The data come from the production processes of enterprises, including various types of bamboo defects. Data are added and updated to continuously improve the generalization ability of the model. On the other hand, researchers can reduce false positives by adjusting the confidence threshold because a higher confidence threshold can make the model more conservative and avoid mistaking texture as defects. In the actual application of the equipment, the detection of bamboo strip defects is continuously monitored and adjusted according to the actual feedback to ensure the continuous and stable identification of bamboo strip defects.
5. Discussions
When detecting surface defects in bamboo strips, defects such as cracks, mildew spots, wormholes, and burrs are detailed features. Image processing technology can easily confuse defects with the background textures. This study identified four types of detailed features on the surface of bamboo strips by using an improved YOLOv8 network to detect defects.
For YOLOv8n, the mAP@0.5 of the network is 91.5%, the mAP@0.95 is 71.6%, the precision is 78.9%, and the recall is 90.4%. This study integrated the C3k2 module to rebuild the backbone and neck parts of YOLOv8 and optimized the structure of the C3k2 module with dynamic convolution and Ghostbottleneck. In addition, the DySample module replaced the original upsample module, thereby maintaining the computational speed and reducing model inference latency.
To further improve the recognition of detailed targets such as wormholes and burrs, the EMA module was incorporated to improve the recognition of defective targets. After introducing an attention mechanism to improve the network model, the mAP@0.5 was 92.6%, the mAP@0.95 was 72%, the precision was 81.5%, and the recall was 91%. Among these indicators, mAP@0.5 plays the role of an overall indicator. The mAP@0.5 of burr defects increased to 93.1%, and the mAP@0.5 of wormholes increased to 92.2%. The results show that EMA can coordinate the weights of different features through the collaborative attention mechanism and enhance the model’s adaptability to detailed defects.
This study used YOLOv8n as the framework and baseline network. This study further improved the detection capabilities of YOLOv8n for a few types of defects in bamboo strips. In particular, the improvement significantly increased the mAP of wormhole targets, reaching 92.2%, which is 1.4% higher than the original 90.8%, and the mAP of burr targets, reaching 93.1%, which is 2.7% higher than the original 90.4%. The calculated parameter count was 4.9 M, which decreased by 0.8 M from the 5.7 M of the base YOLOv8n, reducing its weight by 14%. This effect is achieved mainly because of the dynamic convolution and attention mechanism, which improve the ability to detect a few types of unevenly distributed objects and focus on the target to be measured. C3k2 with Ghostbottleneck also plays a role in reducing the weight. Although the calculation amount of the model is reduced by 14% and high accuracy is maintained through optimization, there is a certain loss in the detection speed. However, this speed loss is acceptable in practical applications, and the model can still satisfy the needs of industrial scenarios.
This study applied the improved YOLOv8 to identify four defects in bamboo strips and allowed the deep learning network to focus on detailed defects, improving the detection performance for detailed defects and achieving a lightweight network. From the research results, the mAP indicator of the detailed features improved, but it is necessary to consider further improvements in the overall mAP.
Considering the applicability of the algorithm in the detection of materials with similar textures, the basic principle of the YOLO model is to extract image features through a convolutional neural network and predict the boundary box and category of the target. Although the texture characteristics of bamboo strips may be similar to other materials (such as wood), factors such as texture details, lighting conditions, and background interference of different materials may still lead to differences in the detection performance. First of all, the number of data samples is large, so it is not recommended to use a single image generation such as rotation and scaling. Secondly, considering the influence of light, the detection light should be similar to that used in the dataset sampling.
In order to promote this research, several future research directions can be explored. First, integrated multimodal data fusion can improve the detection accuracy with other data types. Second, a YOLO model optimized for edge computers will be able to carry out real-time detection in industrial environments while maintaining accuracy and reducing computational complexity. Finally, extending this method to other materials, such as wood and plant fiber materials, will help to expand its applicability for detecting surface defects and structural problems.
6. Conclusions
This study proposes an improved network model based on the YOLOv8 architecture. This research implements several innovative optimizations to improve the detection of detailed features in the production process of defect detection in bamboo strips. First, this study reconfigured the backbone and neck structures with dynamic convolution, optimizing the C3k2 module and effectively enhancing the model processing performance with a lightweight model. This study also implemented the DySample module to replace the original upsample module, improving the model’s overall performance. Subsequently, this research introduced the EMA module to enhance the recognition of targets.
The network model proposed in this study performed well through the above improvements, identifying defects in bamboo strips. The experimental results show that this model improved the mAP to 92.6%, reduced the weight by 14%, and decreased the FLOPs to 5.2 G. This study presents obvious advantages of the model in detecting detailed defect features in bamboo strips and reducing requirements on device hardware.


