Article

Determination of Fractional Vegetation Cover Threshold Based on the Integrated Synergy–Supply Capacity of Ecosystem Services

1
College of Soil and Water Conservation, Beijing Forestry University, Beijing 100083, China
2
State Key Laboratory of Efficient Production of Forest Resources, Beijing 100083, China
3
Ji County Station, Chinese National Ecosystem Research Network (CNERN), Beijing 100083, China
4
Key Laboratory of National Forestry and Grassland Administration on Soil and Water Conservation, Beijing Engineering Research Center of Soil and Water Conservation, Engineering Research Center of Forestry Ecological Engineering, Ministry of Education (Beijing Forestry University), Beijing 100083, China
*
Author to whom correspondence should be addressed.
Forests 2025, 16(4), 587; https://doi.org/10.3390/f16040587
Submission received: 20 February 2025 / Revised: 25 March 2025 / Accepted: 26 March 2025 / Published: 27 March 2025
(This article belongs to the Special Issue Assessing, Valuing, and Mapping Ecosystem Services)

Abstract

:
Determining the optimal vegetation cover threshold in a region for facilitating both high levels of ecosystem services (ESs) supply and synergistic sustainable development among different ESs is crucial. This study delineated the nonlinear relationship between the fractional vegetation cover (FVC) and the integrated synergy–supply capacity of ESs in Ji County, on China’s Loess Plateau (2000–2023). The FVC was quantified using Landsat remote sensing data. Assessments of carbon storage, soil conservation, water conservation, and habitat quality were conducted based on multi-source remote sensing datasets and the Integrated Valuation of Ecosystem Services and Tradeoffs (InVEST) model, which subsequently informed the evaluation of the integrated synergy–supply capacity of ESs. Spatial–temporal distribution characteristics were assessed via trend analysis methods and the spatial correlation relationship was assessed via bivariate local spatial autocorrelation analysis. The constraint line analysis and the restricted cubic spline method were combined to analyze the nonlinear relationship between the two and to quantify the FVC threshold. The results revealed that the spatial distribution of both the FVC and the integrated synergy–supply capacity of ESs was higher in the north, with a growth trend observed respectively. A highly significant positive spatial correlation existed between the two (Moran’s I > 0.6520, p < 0.01), dominated by the High–High agglomeration type (55.71%). The relationship between the regional FVC and the ISSC of ESs, the forest land FVC and the ISSC of ESs, and the grassland FVC and the ISSC of ESs all exhibited a positive convex function constraint line. The regional FVC threshold was 0.5, the forest land FVC threshold was 0.28, and the grassland FVC threshold was 0.77. When the FVC value was above the threshold, its facilitating effect on the ISSC of ESs diminished. This study advances vegetation threshold research by integrating the supply levels and synergy degrees of multiple ESs, providing a scientific foundation for formulating strategies for regional ecological restoration and adaptive management, and offering a reference for high-quality vegetation restoration in global arid, semi-arid, and erosion-prone regions.

1. Introduction

The ecosystem as an essential foundation for human growth and progress. It provides living conditions, preserves the balance between humanity and nature, maintains species and genetic diversity, and facilitates the coordinated development of various ecological cycles [1,2,3]. As an important component of the ecosystem, vegetation serves as a vital intermediary between the terrestrial environment and the atmosphere, markedly influencing energy exchange, carbon equilibrium, and climatic stability within terrestrial ecosystems [4]. The United Nations Decade of Ecosystem Restoration 2021–2030 underscores the importance of vegetation in enhancing ecosystem services (ESs). Generally, increased vegetation coverage enhances regional ecosystem quality and provision of ESs. For instance, research in Brazil has revealed that a 20% expansion of the tropical montane cloud forests coverage improves water yield in the Brazilian Atlantic Forest [5]. Findings from China’s Loess Plateau has indicated that enhancing the stand regeneration capacity of Black Locust (Robinia pseudoacacia L.) plantations could effectively optimize total ecological functions simultaneously [6]. To monitor the alterations in vegetation, previous studies have proposed various vegetation indicators, including the normalized difference vegetation index (NDVI), the fractional vegetation cover (FVC), and so on. The FVC is commonly used to denote the vegetation cover across a region [7,8,9].
Global concern regarding vegetation conservation efforts and ES evaluations related to vegetation restoration is continually increasing [10]. For instance, investigations in China’s karst ecologically fragile zones, the American valley-scale floodplain, and Guyana’s Atlantic coastal area [11,12,13] have specifically evaluated vegetation restoration outcomes. Meanwhile, assessments of ecosystem services and their trade-off relationships have generated substantial academic discourse in diverse national contexts, including Canada, Russia, and China [14,15,16]. An important challenge in ecosystem restoration is identifying the optimal vegetation cover for maximizing ES benefits [17]. Previous studies have indicated that ESs exhibit a nonlinear response to alterations in vegetation [18,19], with this nonlinear variation signifying the presence of threshold effects [16]. A multi-year study by Gao et al. in Changting County, China, examining vegetation cover and soil productivity relationship, revealed sustained soil degradation when vegetation cover falls below the degradation threshold of 20% [8]. Jiang et al. analyzed the constraining effect of the NDVI on soil conservation on the Loess Plateau from 2000 to 2015, and suggested that the overall vegetation cover should not exceed 50% [20]. Most current studies typically focus on vegetation cover thresholds for individual ESs. However, it has been suggested that determining the vegetation cover thresholds based on total ESs, rather than focusing on individual ESs, can offer valuable insights for the sustainable management of vegetation at the regional scale [10]. Ruan et al. applied the elasticity coefficient method to analyze threshold effects of the FVC on the total ESs under different land-use types in the Qilian Mountains. Their results identified optimal FVC ranges: 0.4–0.48 for forest land, 0.24–0.30 for grassland, and 0.19–0.20 for unused land [21]. In parallel research, Zhao et al. applied the constraint line method to examine NDVI limitations on ESs in the Tibetan Plateau. Their analysis revealed maximum total ESs when the NDVI reached 0.65–0.75, with the constraint line exhibiting an S-shaped type [22]. These findings emphasize the necessity to determine vegetation cover thresholds to balance ecological restoration objectives with total ESs.
Due to various factors, such as vegetation changes, trade-offs and synergies may occur among various ESs at specific geographical and temporal scales [23]. To advance sustainable development, the trade-offs among different ESs should be diminished while enhancing the synergies between them. Consequently, studies elucidating the nonlinear dynamics of ESs synergies and vegetation cover, as well as identifying vegetation cover thresholds, need consideration [24]. Nevertheless, the majority of the existing literature on the topic is from the viewpoint of ES pairs, while focusing on mutual benefit, as illustrated by the research in the Songhua River Basin [25] and tropical island basins [26]. Previous studies have paid insufficient attention to the extent of synergy among the total ESs [27], and the supply levels of ESs are frequently overlooked. However, under the backdrop of vegetation restoration, there exists an ecological governance demand that necessitates the high-level supply of ESs, alongside the promotion of synergy among total ESs at the regional scale. Xun et al. have proposed an ecosystem service benefit index and identified thresholds for precipitation and the NDVI [28]. Drawing on this index, the study integrated the supply levels and synergy degrees of multiple ESs to determine the vegetation cover threshold, thereby addressing a crucial gap in regional-scale management practices.
The Loess Plateau, characterized by its distinct erosion gully topography, is extremely vulnerable to erosion, ranking among the most severely affected regions of soil erosion globally [29]. To curtail soil erosion and enhance ESs, the increase in vegetation cover serves as a primary strategy [30]. However, previous studies have indicated that excessive vegetation restoration may result in imbalances in the regional water resource supply and demand, along with several other issues, such as decreased soil moisture content [31]. To genuinely achieve the multi-win goals of ESs, it is crucial to define the threshold of regional vegetation cover according to the integrated synergy–supply capacity (ISSC) of the total ESs.
However, amidst the widespread implementation of vegetation restoration initiatives, current research predominantly focuses on the constraint effects of vegetation cover on either ES supply levels or paired ES trade-off/synergy relationships, with limited studies holistically integrating multiple ES supply levels and synergy degrees. This indicates that there is still a research gap in this field. What characterizes the nonlinear relationship between vegetation cover and the ISSC of ESs? What is the vegetation cover threshold determined based on the ISSC of ESs? Currently, these issues remain contentious within the research field, and these uncertainties present considerable hurdles for future vegetation restoration and ecosystem management. Based on this, this study selected the typical region of Ji County in the Loess Plateau as the study area. The main objectives of this study were to quantitatively assess the FVC and the ISSC of ESs, and to clarify the spatial relationship between them, as well as to combine the constraint line method with the restricted cubic spline (RCS) method to clarify the nonlinear relationship between the FVC and the ISSC of ESs, and to determine the FVC threshold.

2. Materials and Methods

The research workflow of this study is illustrated in Figure 1.

2.1. Research Area

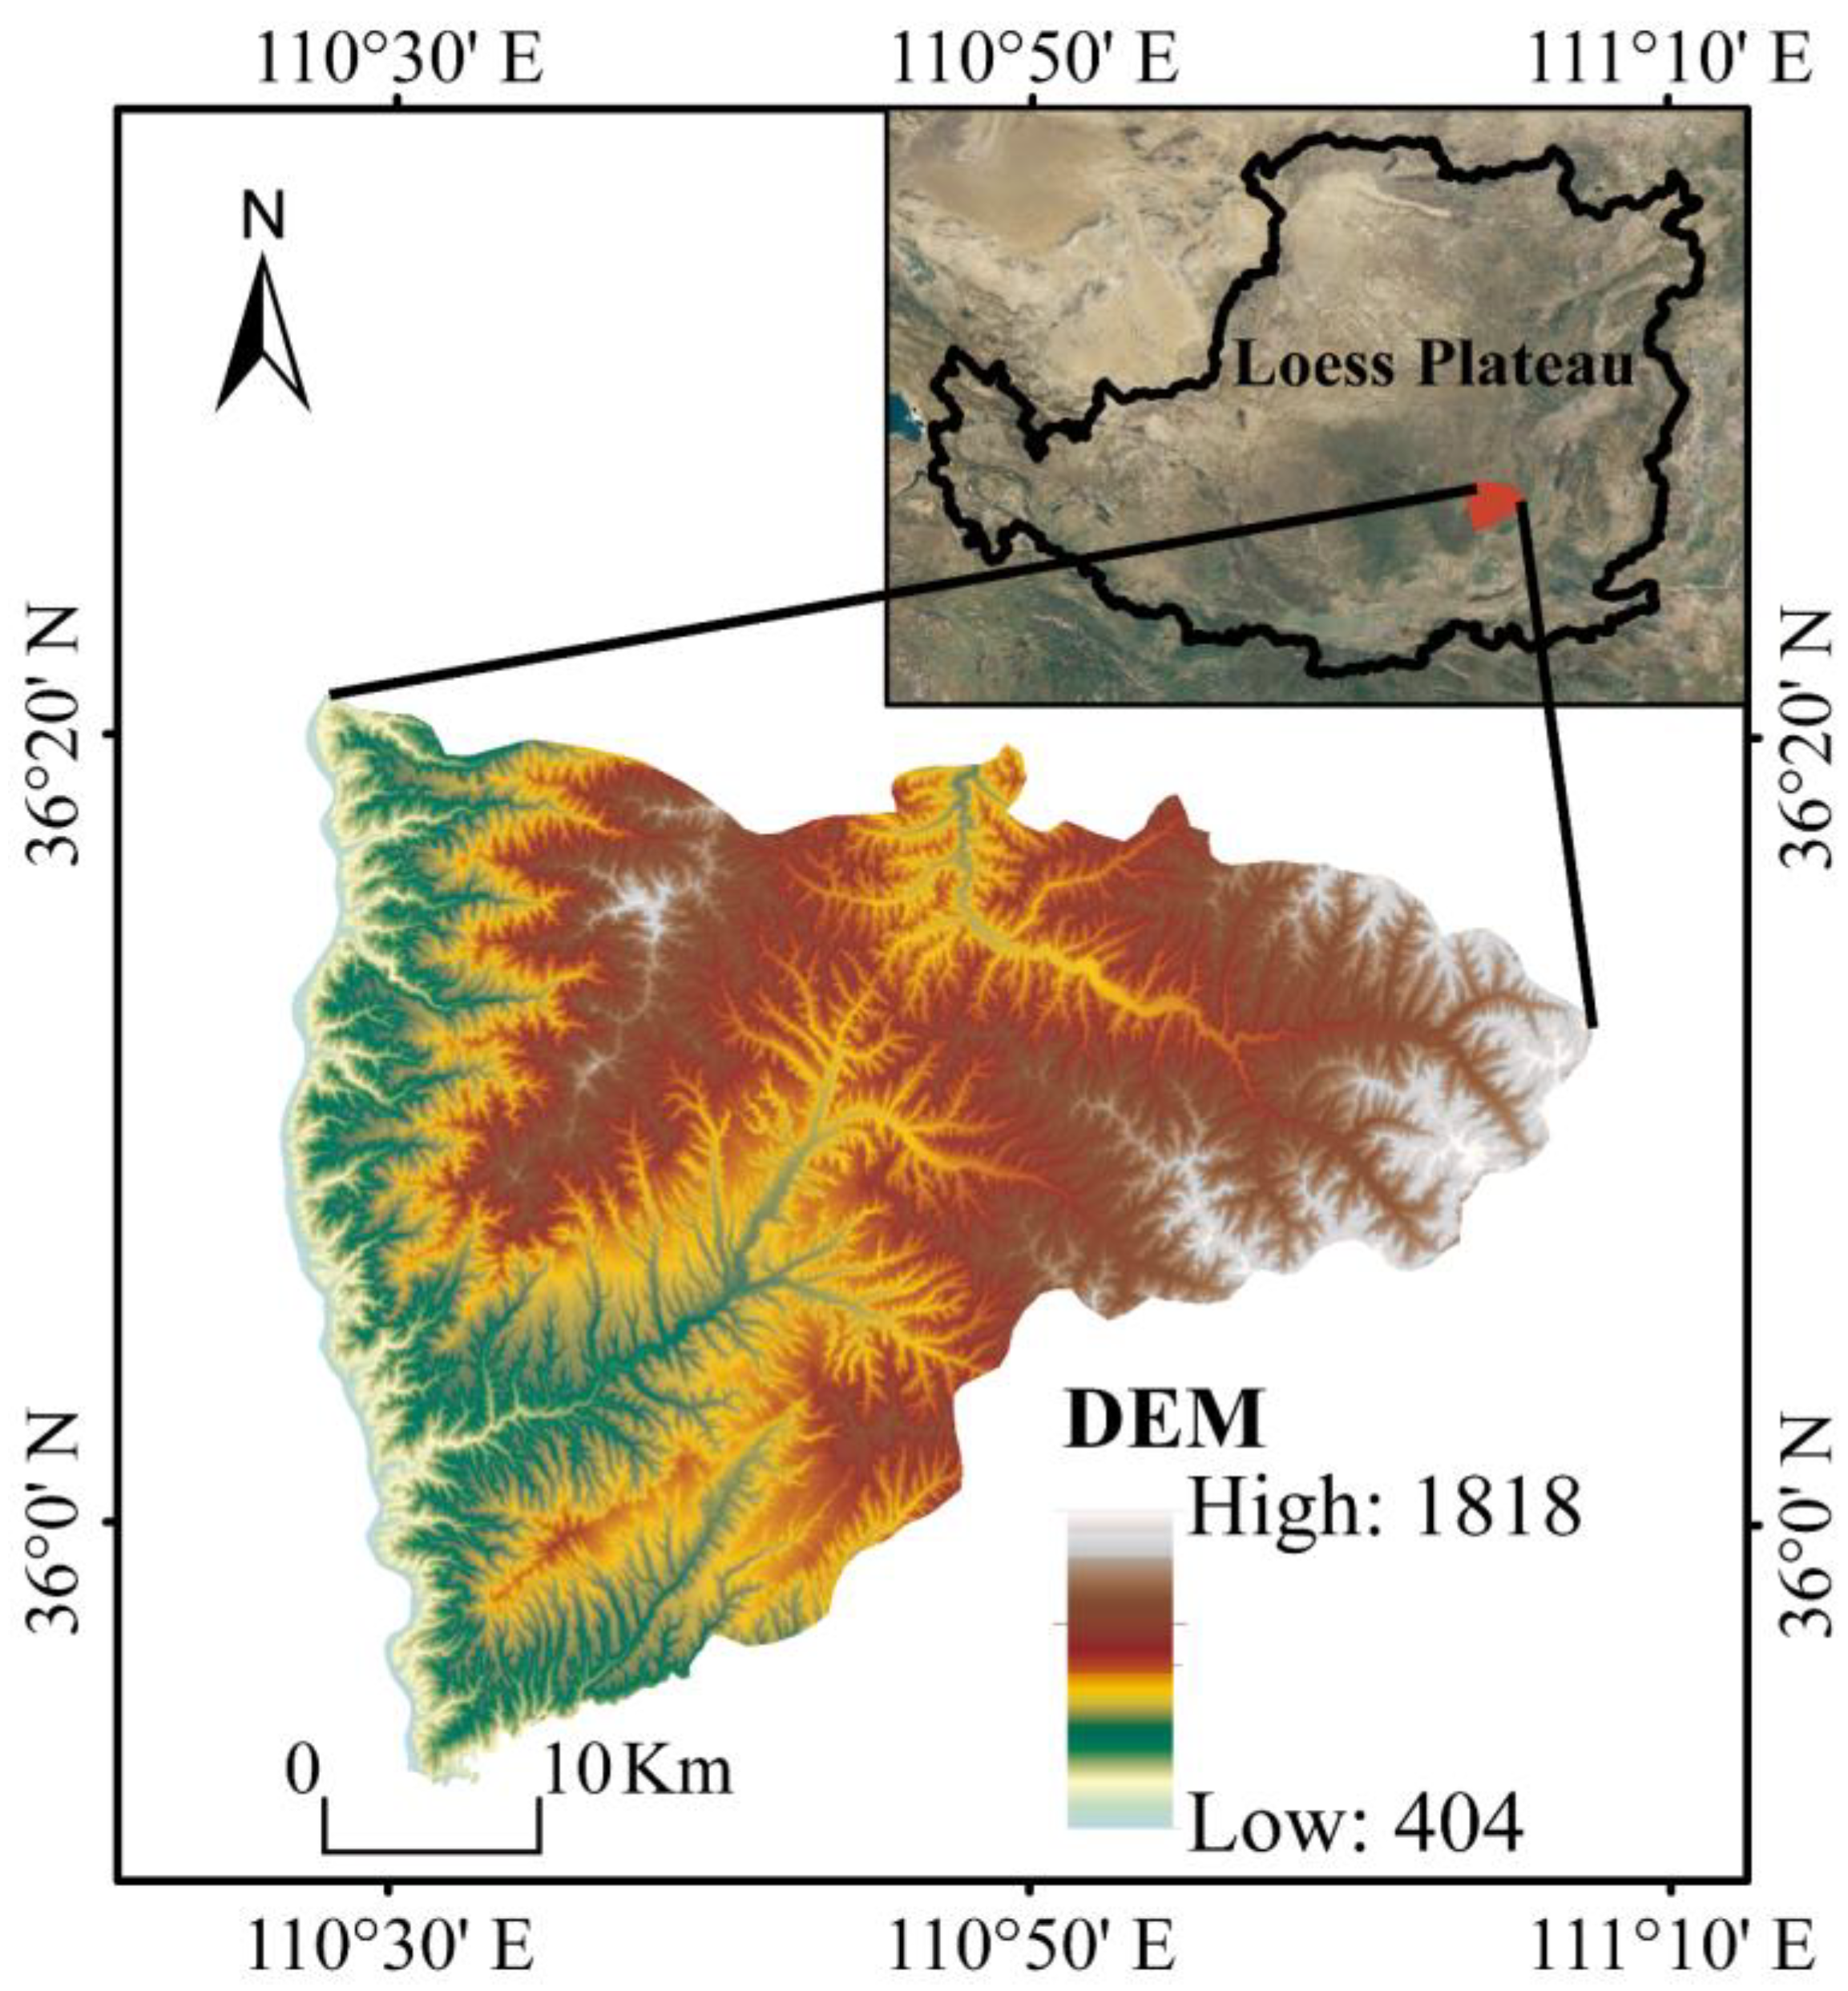
Ji County (latitude 110.44–111.13° E, longitude 35.88–36.36° N), which encompasses an area of 1781 km2, is located to the west of Linfen City in Shanxi Province (China), adjacent to the Yellow River (Figure 2). The region’s topography is elevated in the northeast and depressed in the southwest, with landforms categorized into mountainous, loess hills and gullies, and loess broken tableland, among others; the terrain has a lot of ups and downs. Ji County experiences a temperate continental climate, with precipitation primarily occurring from June to September, and a long-term average temperature of approximately 10 °C. The mean annual precipitation in the region is 544.46 mm. According to the soil classification of the Food and Agriculture Organization of the United Nations, the main soil type in Ji County is Calcaric Cambisols. Ji County is located within the Yellow River Basin, with its principal rivers being the Xinshui River, the Qingshui River, and the Yiting River. Since 2000, Ji County has implemented several ecological protection projects, such as the Grain for Green Program (GFGP), which have achieved remarkable results. The vegetation in Ji County mainly includes natural forests, planted forests, shrublands, and grasslands. The natural forests mainly consist of Liaodong Oak (Quercus wutaishansea Mary) and David’s aspen (Populus davidiana Dode). The planted forests mainly consist of Black Locust (Robinia pseudoacacia L.), Oriental Arborvitae (Platycladus orientalis (L.) Franco), and Chinese pine (Pinus tabuliformis Carrière). The main shrub communities include Willowleaf Meadowsweet (Spiraea salicifolia L.), Manchu rose (Rosa xanthina Lindl.), and Chinese Silkvine (Periploca sepium Bunge). The main herbaceous communities include Artemisia genus (Artemisia sacrorum Ledeb.) and Radix rubiae (Rubia cordifolia L.), among others.

2.2. Data Sources and Preprocessing

This study used spatial datasets from multiple sources (Table 1). The Landsat series remote sensing images captured during May–October of each year, corresponding to the vegetation growing season in Ji County, were used to produce the FVC data. Based on previous studies, the land use data were classified into six types: arable land, forest land, grassland, water area, construction land, and bare land. All the data were resampled to a resolution of 30 m to maintain spatial consistency.

2.3. Study Methods

2.3.1. Methods for Assessing Ecosystem Services

The Integrated Valuation of Ecosystem Services and Tradeoffs (InVEST) model was selected for estimating ESs in Ji County [10]. The ESs considered were carbon storage (CS), soil conservation (SC), water conservation (WC), and habitat quality (HQ) (Table 2). The evaluation techniques for ESs are presented in the Supplementary Material.

2.3.2. Assessing Ecosystem Services Integrated Synergy–Supply Capacity

This study referred to the research by Bradford and D’Amato [32], quantifying the trade-off degrees among multiple ESs. The equations used for the calculation are shown as follows:
R M S D = i = 1 n E S i E S ¯ 2 n 1
where R M S D denotes the root-mean-square deviation of the n ESs, E S i represents the normalized value of the i th ES, and E S ¯ represents the average value of all min–max normalized ESs.
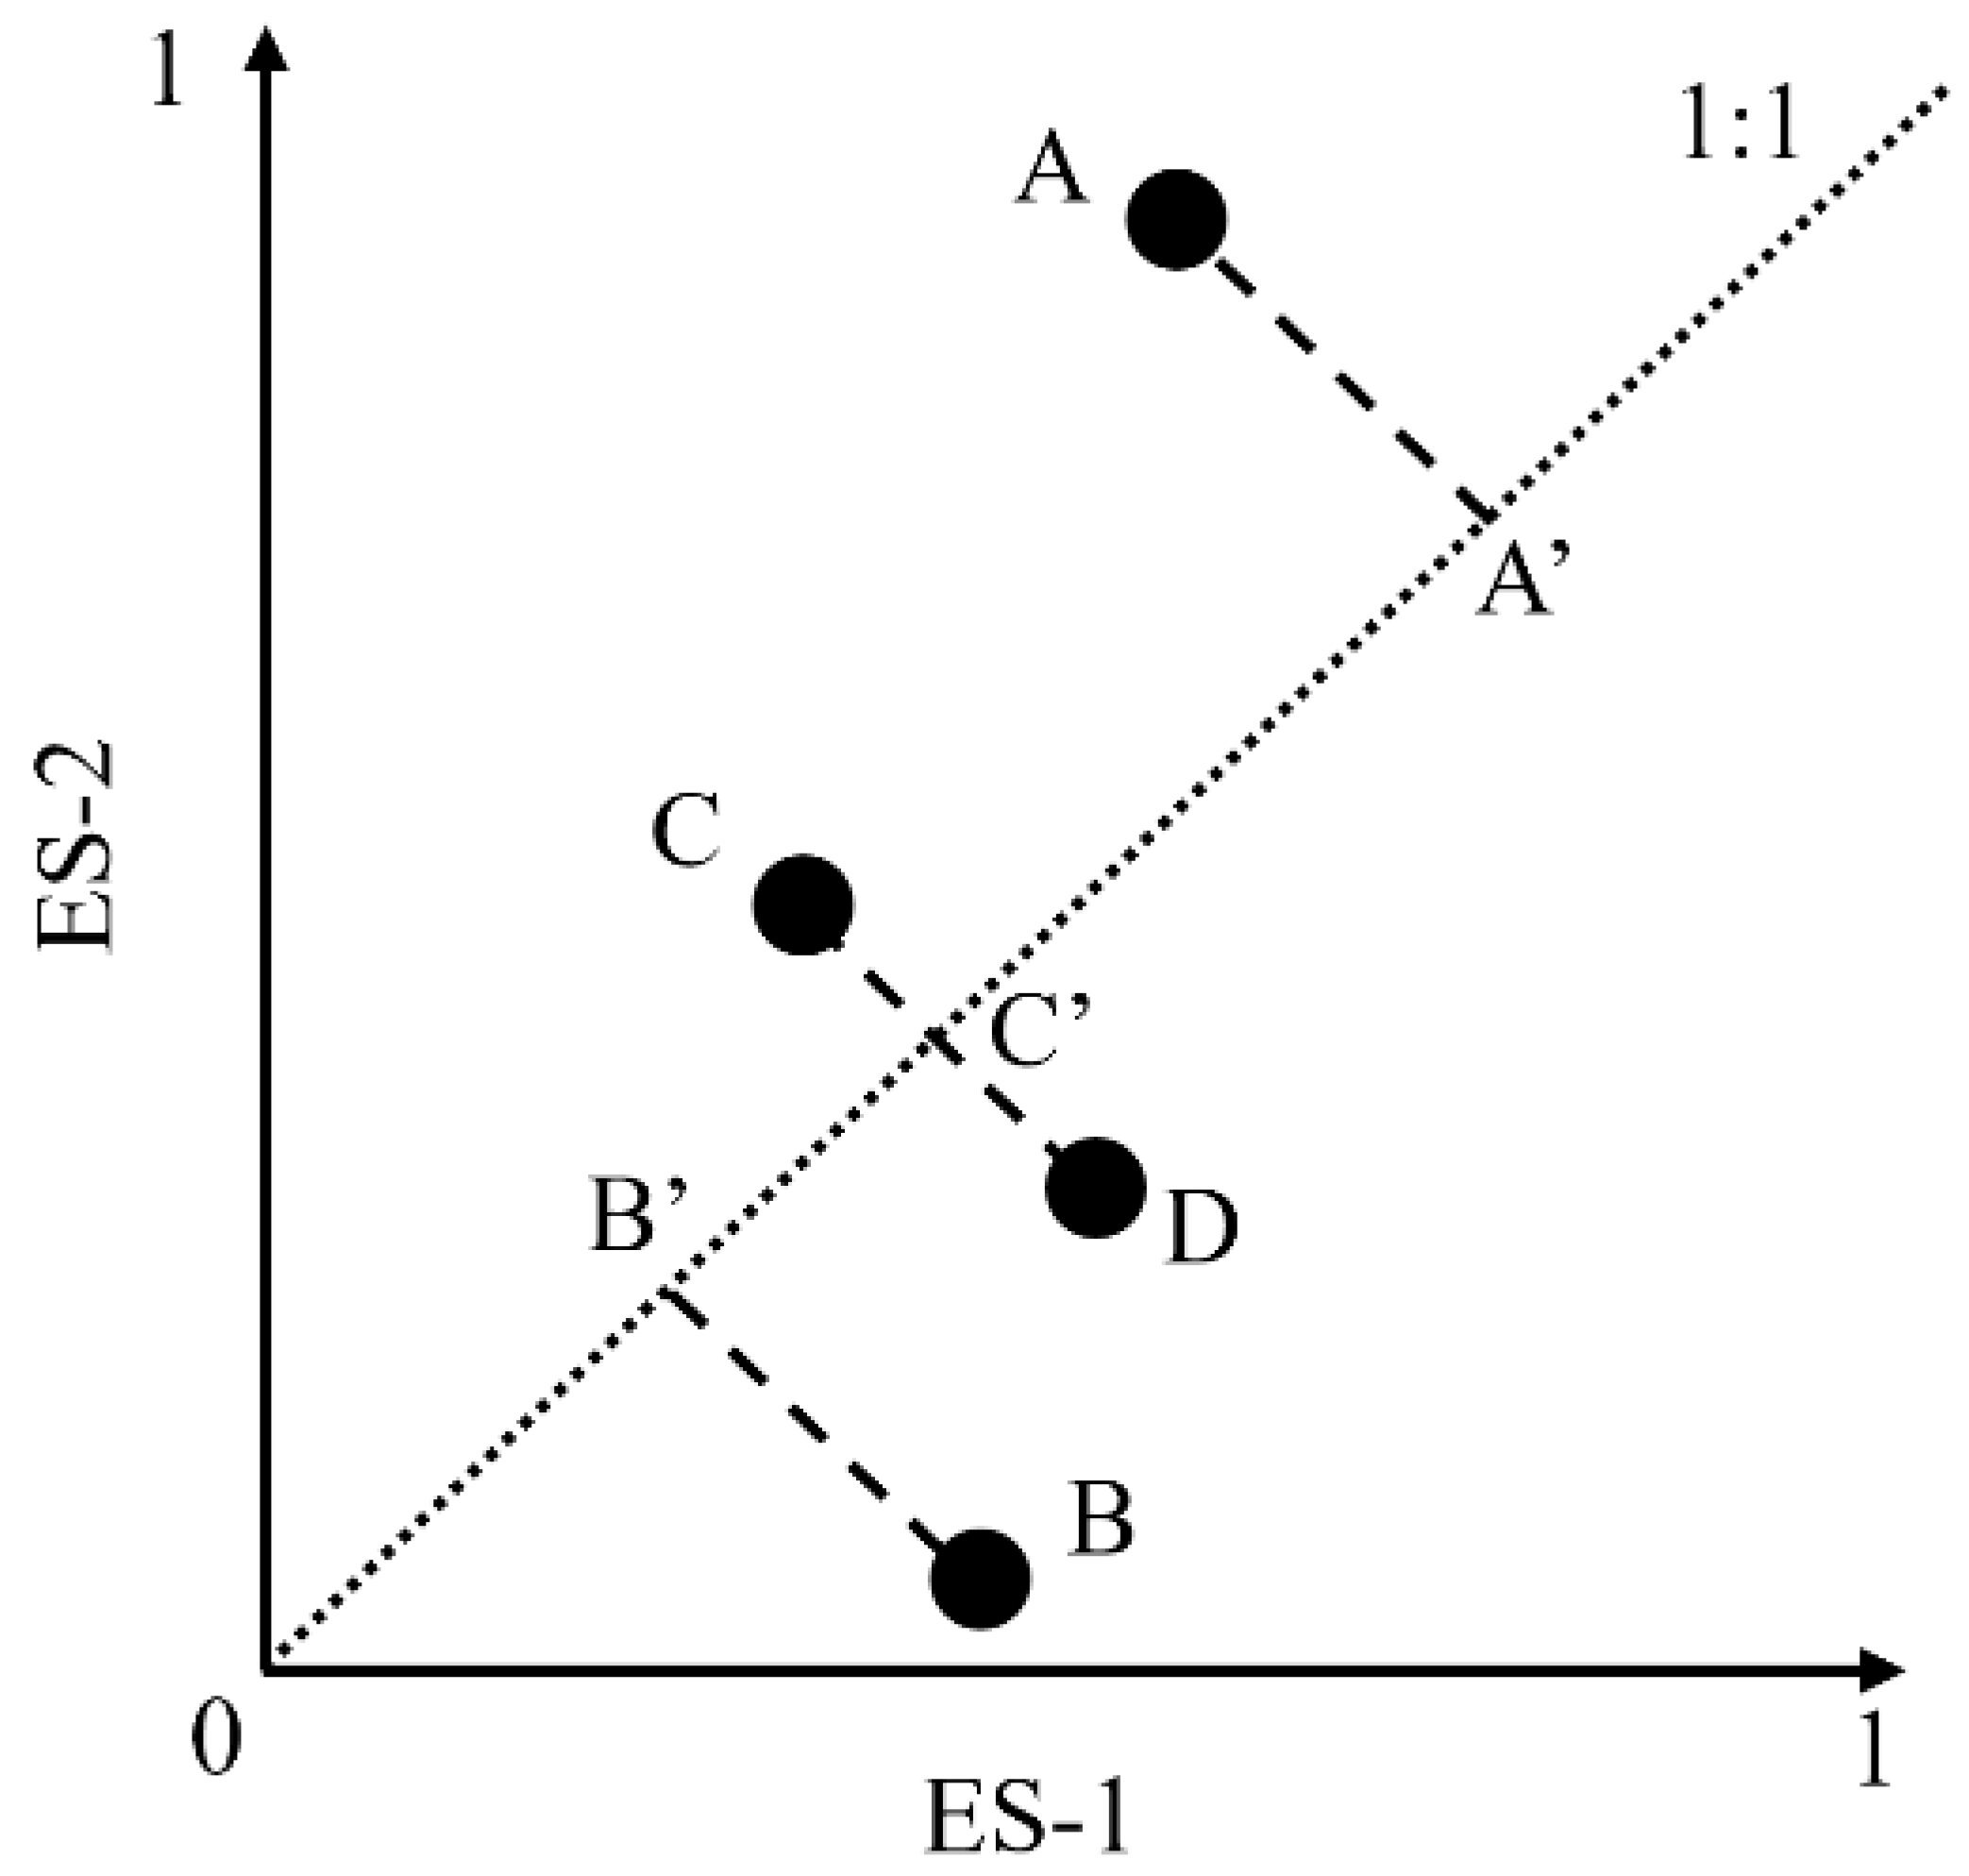
However, Figure 3 demonstrates three distinct scenarios: (1) even with identical total ES trade-off degrees between points A and B (AA’ = BB’), the total ES supply level at point A (sum of ES-1 and ES-2) exceeds that at point B; (2) even with identical total ES trade-off degrees between points C and D (CC’ = DD’), point C exhibits a higher ES-2 supply level, whereas point D dominates in the ES-1 supply level; and (3) a higher total ES supply level at point A compared to point C, despite point A exhibiting a stronger total ES trade-off degree (AA’ > CC’). Consequently, neither maximizing the total ES supply level nor minimizing the trade-off degree (i.e., maximizing synergy degree) alone sufficiently determines whether regional ESs achieve coordinated multi-objective optimization.
This study referenced the work of Xun et al. for the quantitative evaluation of the integrated synergy–supply capacity (ISSC) of ESs [28]. The equations used for the calculation are shown as follows:
I S S C = i = 1 n ω i E S i 1 R M S D
where I S S C represents the ESs integrated synergy–supply capacity. The larger the I S S C , the higher the total ESs integrated synergy–supply capacity, thereby facilitating the multi-win objective for total ESs. This result can be interpreted in two ways: on the one hand, when 1 R M S D increases, it signifies enhanced synergy across all the ESs; on the other hand, when i = 1 n ω i E S i increases, the total supply of ESs can be deemed larger. The value of ω i denotes the weight of the i th ES, with all four ESs being considered in this study having equally weights, and n denotes the total number of ESs [28]. The ISSC of ESs was divided into five levels using the Jenks natural breaks classification method: low level (0.11–0.22), lower level (0.22–0.37), medium level (0.37–0.50), higher level (0.50–0.60), and high level (0.60–0.69).

2.3.3. Quantifying Fractional Vegetation Cover

This study employed element dichotomy to determine the fractional vegetation cover of Ji County for 2000–2023 [33,34]. The equation used for the calculation is shown as follows:
F V C = N D V I N D V I s o i l / N D V I v e g N D V I s o i l
where N D V I denotes the normalized difference vegetation index, N D V I s o i l is the NDVI value corresponding to pure bare soil, N D V I v e g is the NDVI value corresponding to pure vegetation. The FVC was divided into five levels: low level (0–0.3), lower level (0.3–0.45), medium level (0.45–0.60), higher level (0.60–0.75), and high level (0.75–1).

2.3.4. Trend Analysis Methods

In light of the widespread application of the Theil–Sen estimator and the Mann–Kendall trend test methods for analyzing trends in extensive time series datasets [35], this study computed the trends of the FVC and the ISSC of ESs by developing code (in MATLAB R2021b) using these two methods. The specific formulae and significance tests are presented in the Supplementary Material.

2.3.5. Analyzing the Spatial Relationship Between the Fractional Vegetation Cover and the Integrated Synergy–Supply Capacity of Ecosystem Services

This study used bivariate local spatial autocorrelation analysis with the GeoDa 1.22 software [36] to investigate the spatial correlation between the FVC and the ISSC of ESs. The specific formulae used for the calculation are presented in the Supplementary Material.

2.3.6. Determining the Nonlinear Relationship Between the Fractional Vegetation Cover and the Integrated Synergy–Supply Capacity of Ecosystem Services and Determining the Fractional Vegetation Cover Threshold

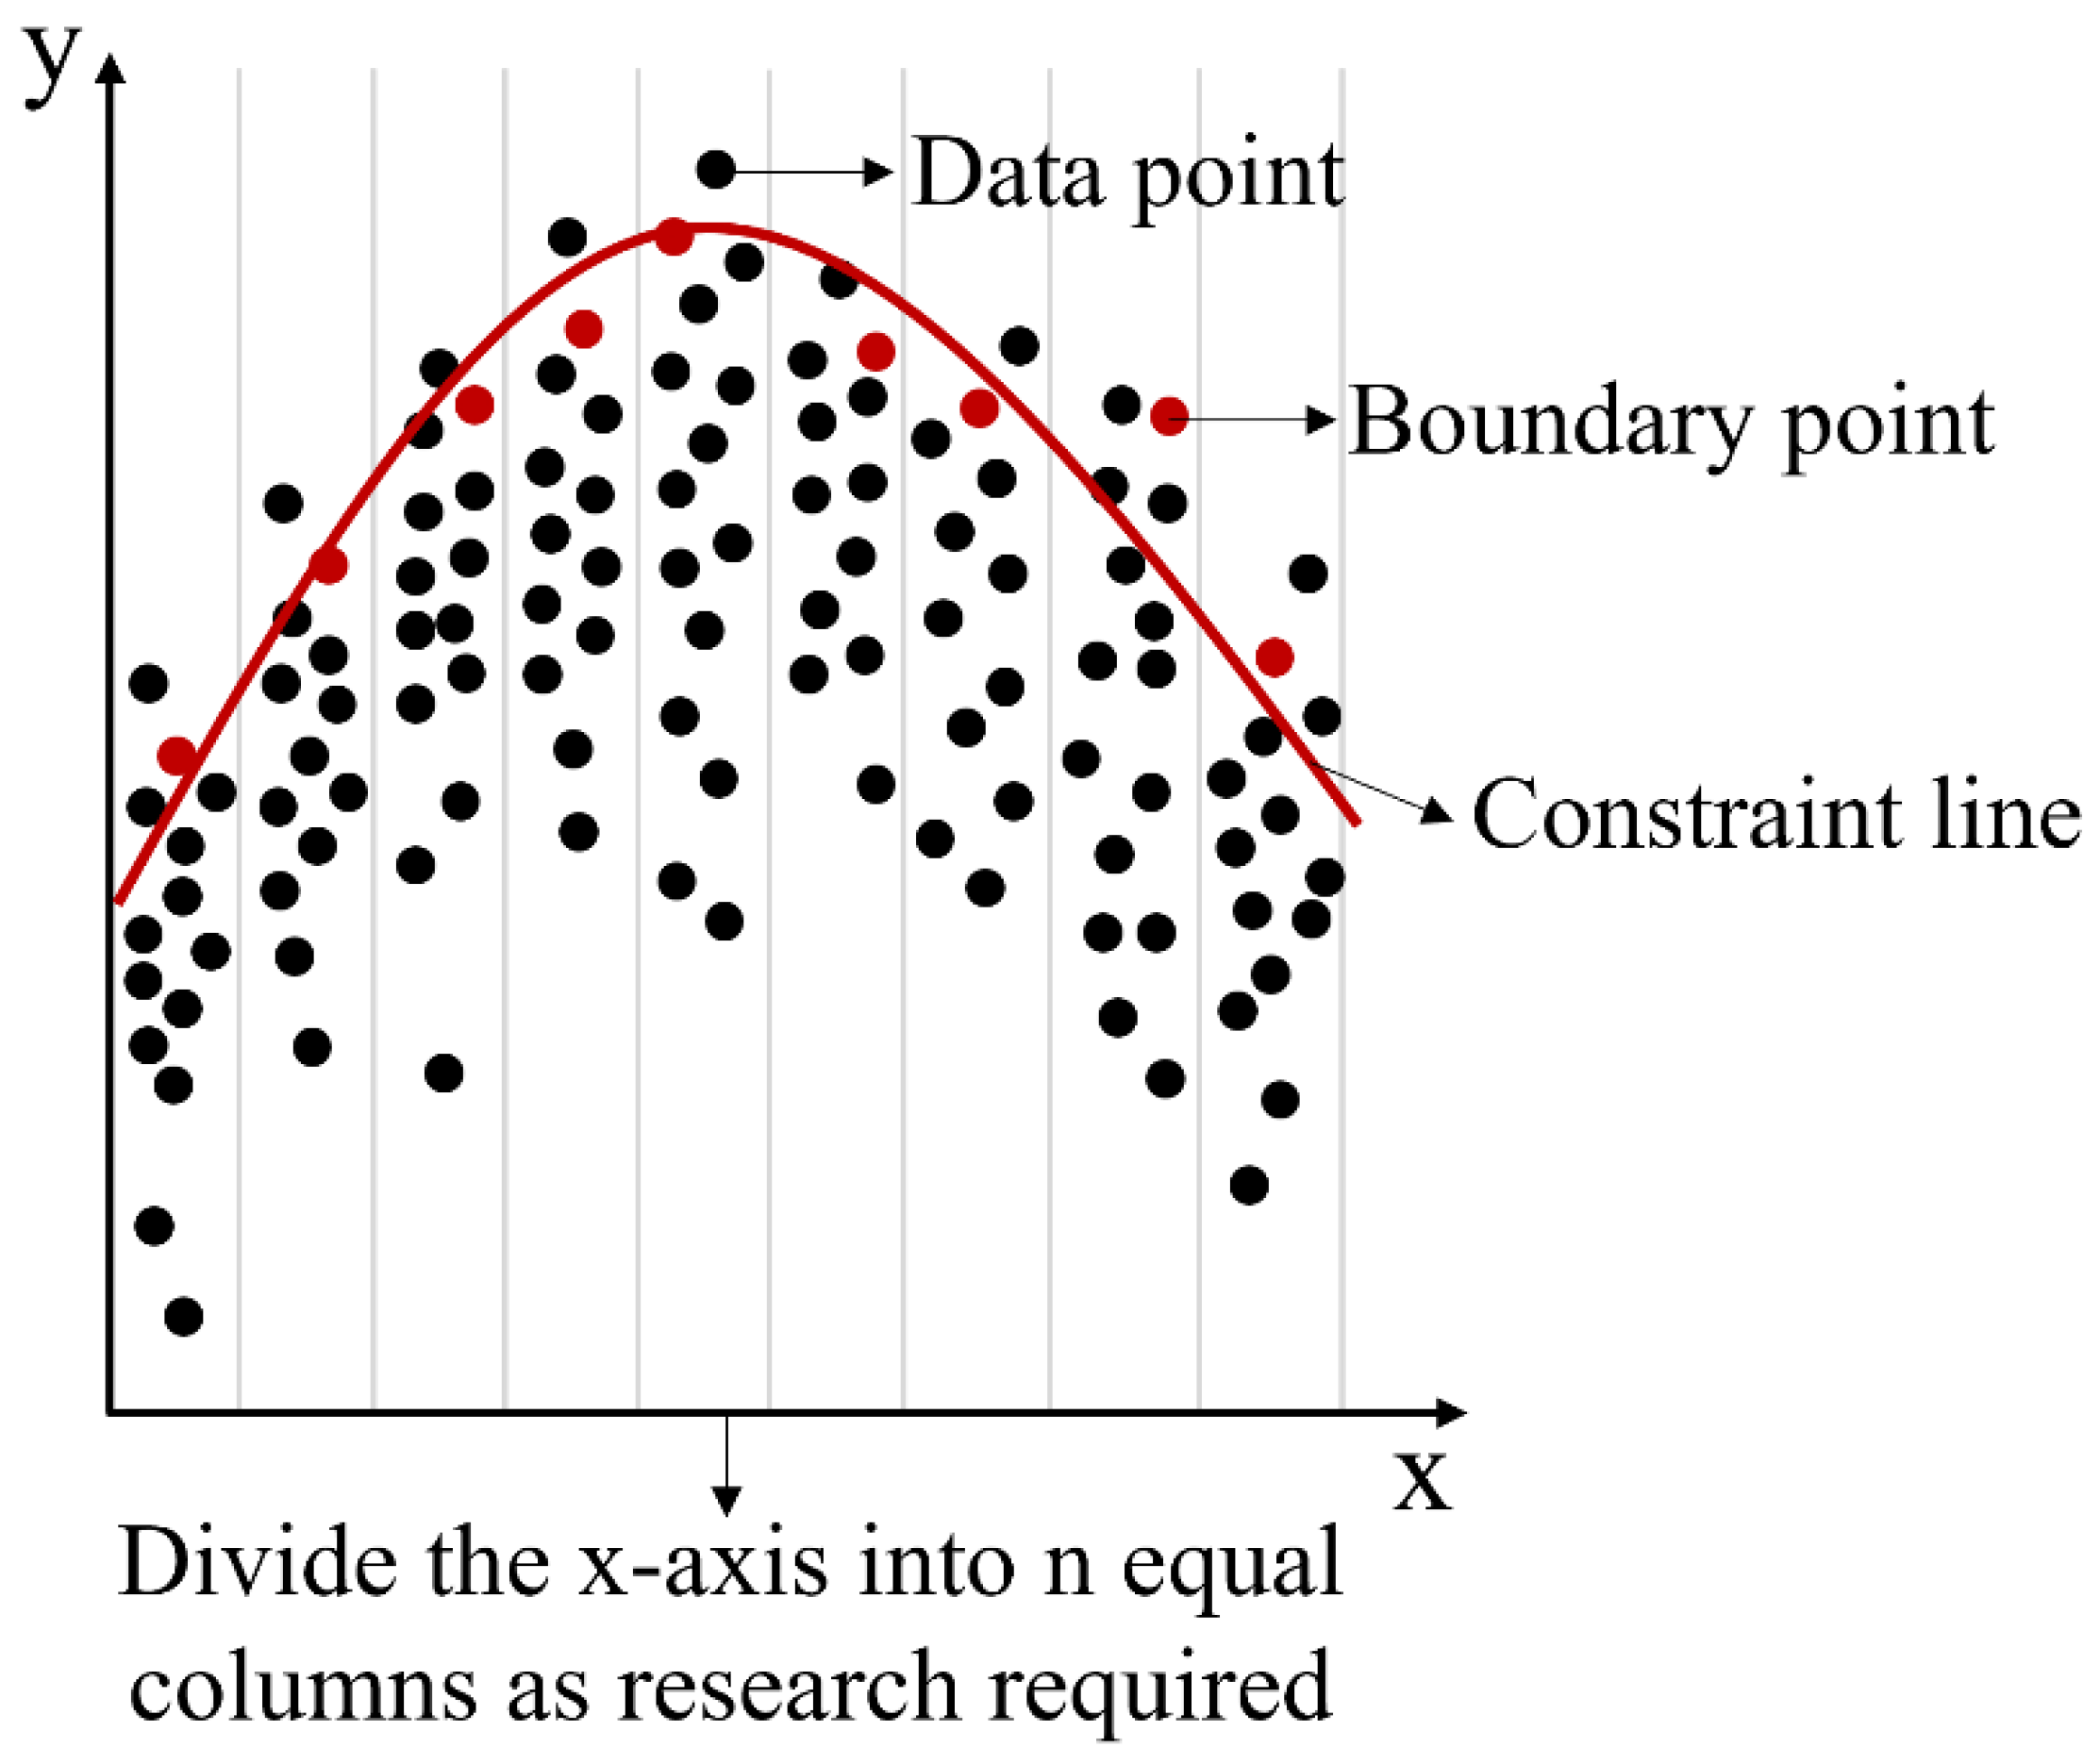
This study evaluated the nonlinear relationship between the FVC and the ISSC of ESs using segmented quantile regression in constraint line analysis (Figure 4) [37]. Detailed procedures and schematic diagrams of constraint line types (Figure S2) are presented in the Supplementary Material. Subsequently, restricted cubic spline (RCS) analysis [38] was conducted using the rms package in the R 4.3.2 software, to determine the threshold of the FVC based on the ISSC of ESs. The RCS is a prevalent method used for investigating nonlinear relationships [39]. The RCS is fundamentally a continuously smooth segmented trinomial function [39]. The shape of the curve of the RCS is affected by the quantity and positioning of segmentation points (nodes). However, in a majority of instances, the quantity of nodes dictates the smoothness of the RCS fitting outcomes [40]. This study fitted separate RCS models with varying node quantities, compared them, and picked the model with the lowest Akaike information criterion (AIC) value to ascertain the FVC threshold.

3. Results

3.1. Spatial Relationship Between the Fractional Vegetation Cover and the Integrated Synergy–Supply Capacity of Ecosystem Services

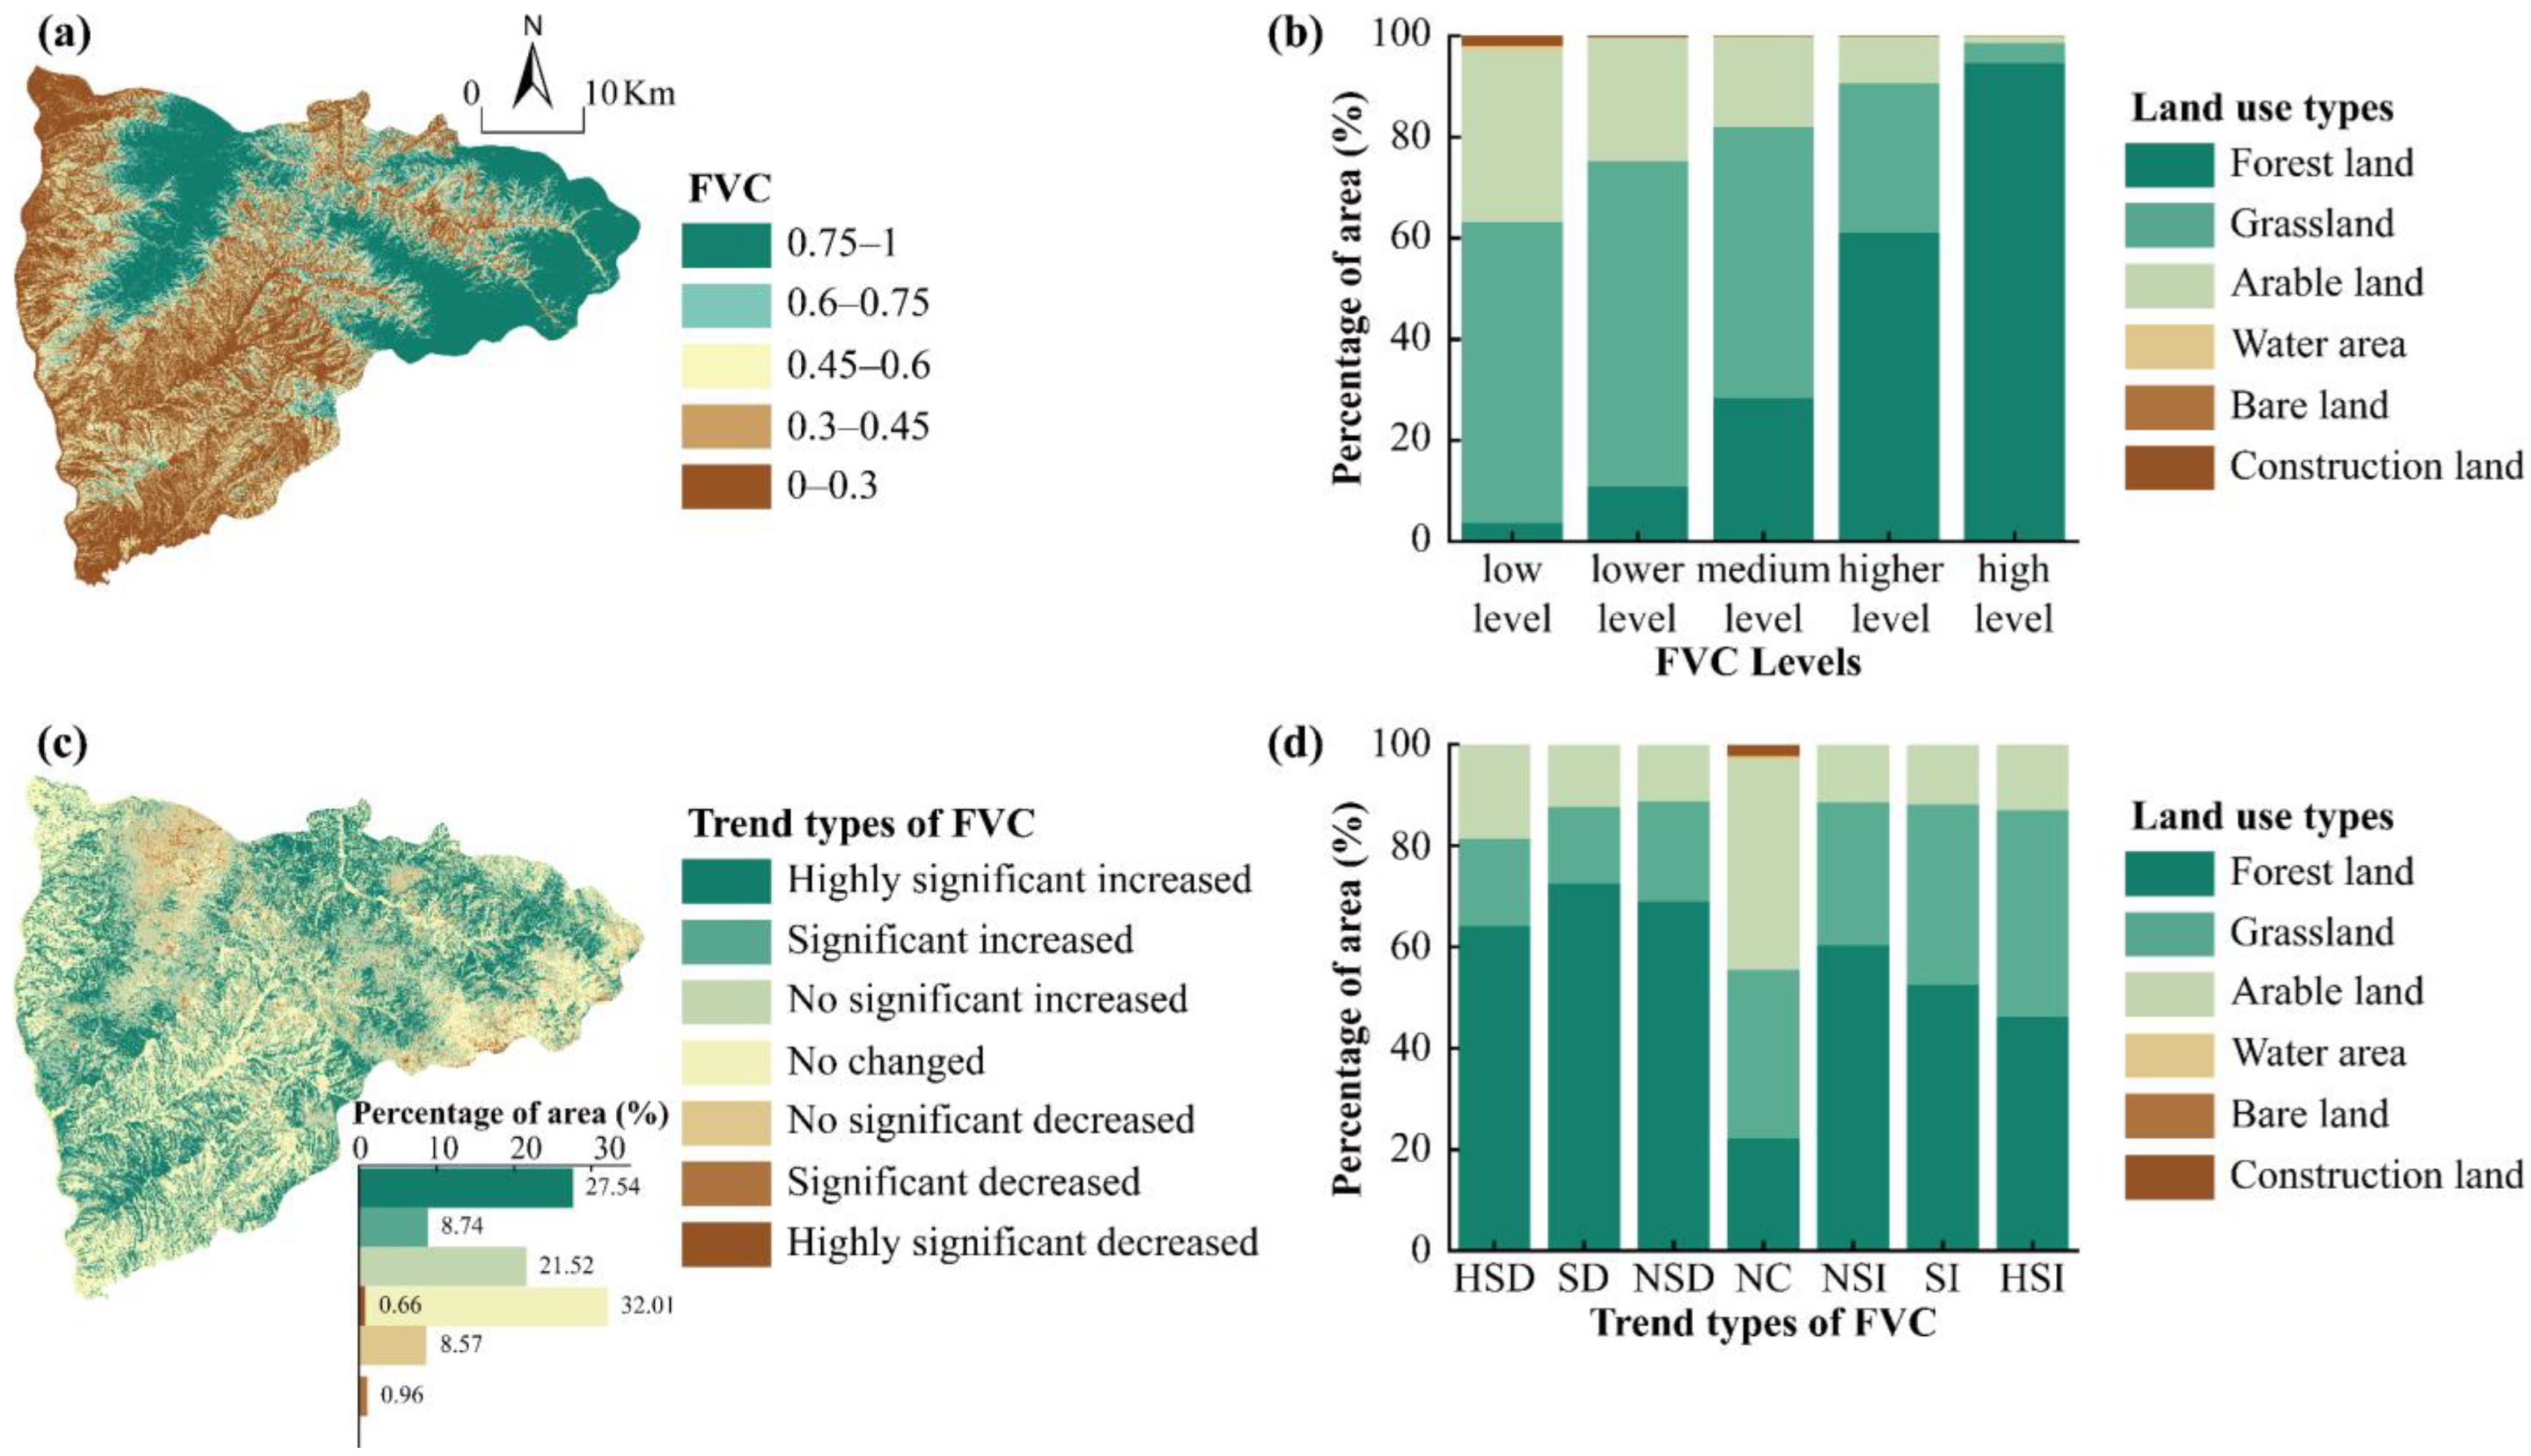
The FVC exhibited an increasing tendency from the southwest to the northeast (Figure 5a). Areas with higher and high levels (0.6–1) of FVC were dominated by forest land. In the higher level, the forest land area accounted for 61.11%, and in the high level, the forest land area accounted for 94.62% (Figure 5b). Areas with other levels (0–0.6) of FVC were dominated by grassland. In the medium level, the grassland area accounted for 53.62%; in the lower level, the grassland area accounted for 64.40%; and in the low level, the grassland area accounted for 59.59% (Figure 5b). In general, the spatial distribution of the FVC exhibited considerable variation. From 2000 to 2023, the FVC showed an overall increase (Figure 5c). The area where the FVC increased accounted for approximately 57.80%, within which a region of 646.29 km2 demonstrated a significant increase in the FVC (p < 0.05). The areas where the FVC increased significantly were concentrated in forest and grassland regions (Figure 5d). The forest land area accounted for 46.09%–52.53%, and the grassland area accounted for 35.60%–40.93%. The area where the FVC remained unchanged accounted for about 32.01%. About 1.62% of the area experienced a significant decrease in the FVC (p < 0.05). The areas with a decreasing trend were concentrated in the northwestern part of the study area, where the primary vegetation type was forest (Figure 5d). The forest land area accounted for 64.08%–72.45%.
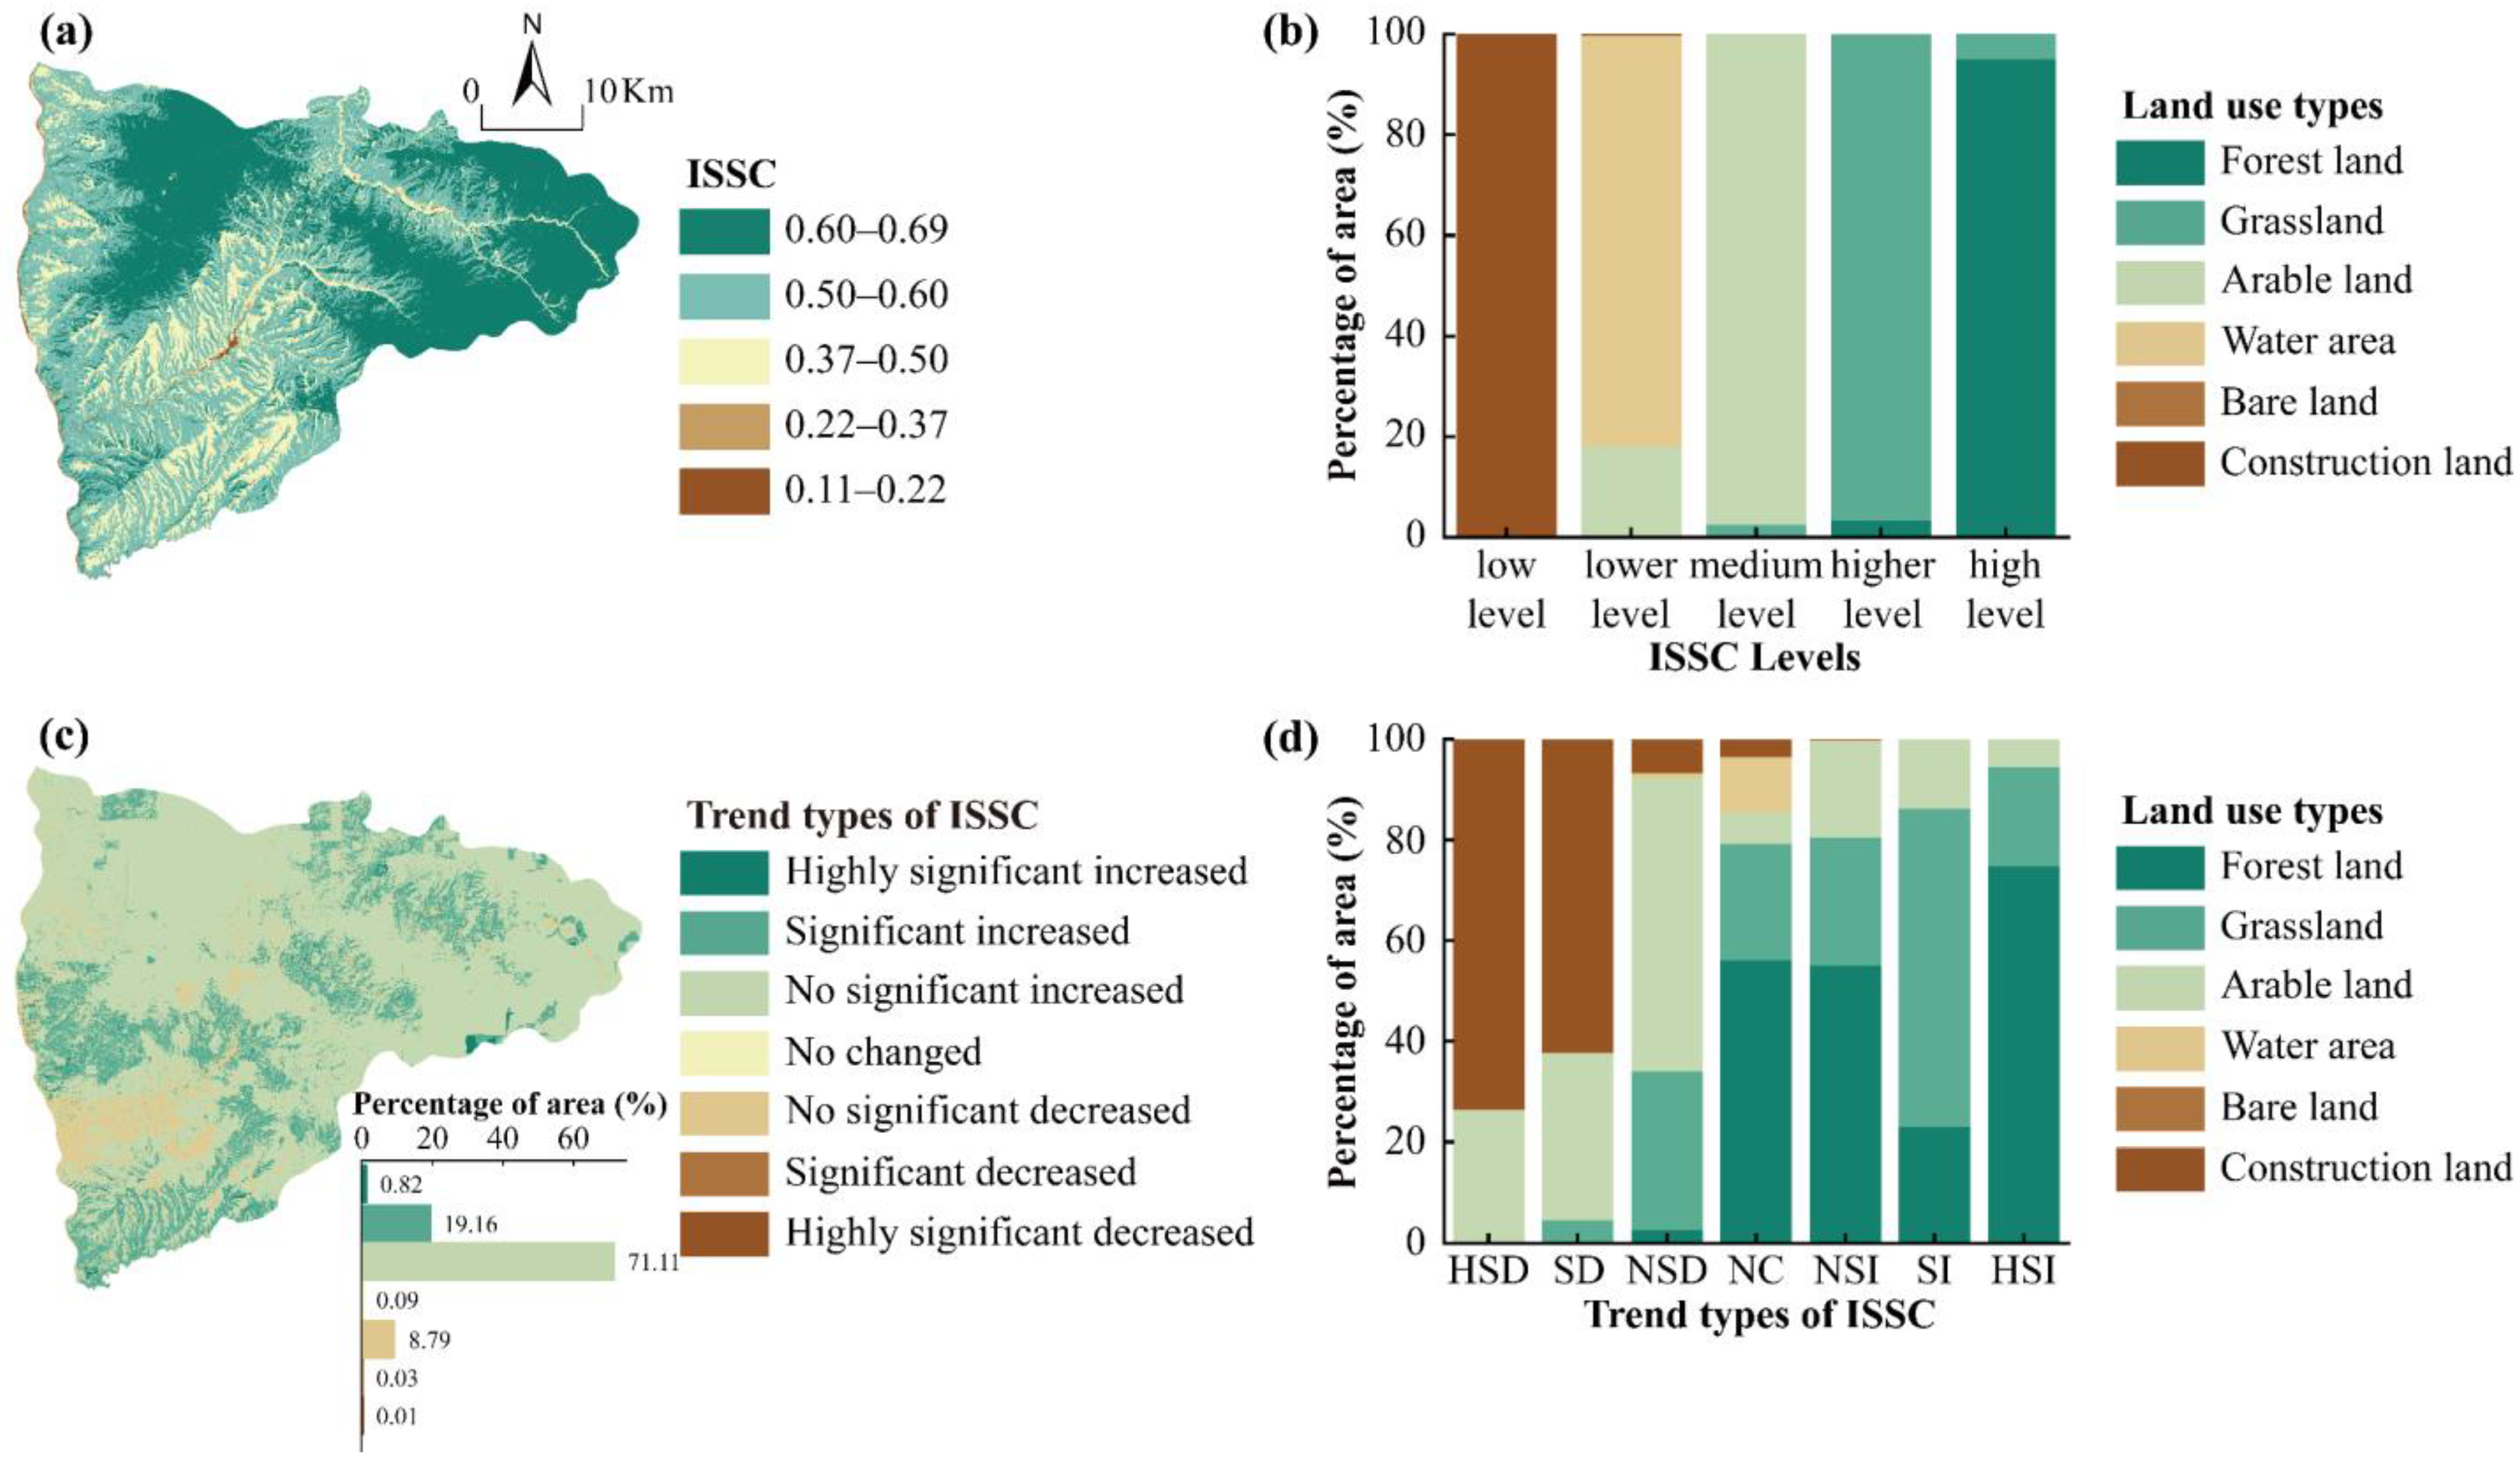
The ISSC index ranged from 0.11 to 0.69 (Figure 6a), with the average value being 0.57. In the northern portion of the study area, the ISSC of ESs was comparatively elevated, exhibiting a contiguous and expansive distribution pattern. Areas with high level (0.6–0.69) of ISSC were dominated by forest land, with an area proportion of 95.08% (Figure 6b). The regions with the lowest ISSC of ESs were characterized by a striped distribution pattern, which was particularly evident in the central part of the study area. Construction land was concentrated here, with an area proportion of 99.61% (Figure 6b).
From 2000 to 2023, the ISSC of ESs showed an overall increase (Figure 6c). The area where the ISSC of ESs increased accounted for approximately 91.09%, within which a region of 355.86 km2 demonstrated a significant increase in the ISSC of ESs (p < 0.05). The areas where the ISSC of ESs increased significantly were concentrated in forest and grassland regions (Figure 6d). The forest land area accounted for 23.07%–74.73%, and the grassland area accounted for 19.75%–63.08%. The area where the ISSC of ESs remained unchanged accounted for about 0.09%. About 0.04% of the area experienced a significant decrease in the ISSC of ESs (p < 0.05). The areas with a decreasing trend were concentrated in the southwestern part of the study area, which included grassland, arable land, and construction land (Figure 6d). In regions where the ISSC of ESs significantly decreased (p < 0.05), the area proportion of construction land was 62.27%–73.60%, and the area proportion of arable land was 26.40%–33.15%. In regions where the decrease was not significant (p > 0.05), the area proportion of arable land was 58.36%, and the area proportion of grassland was 31.44%.
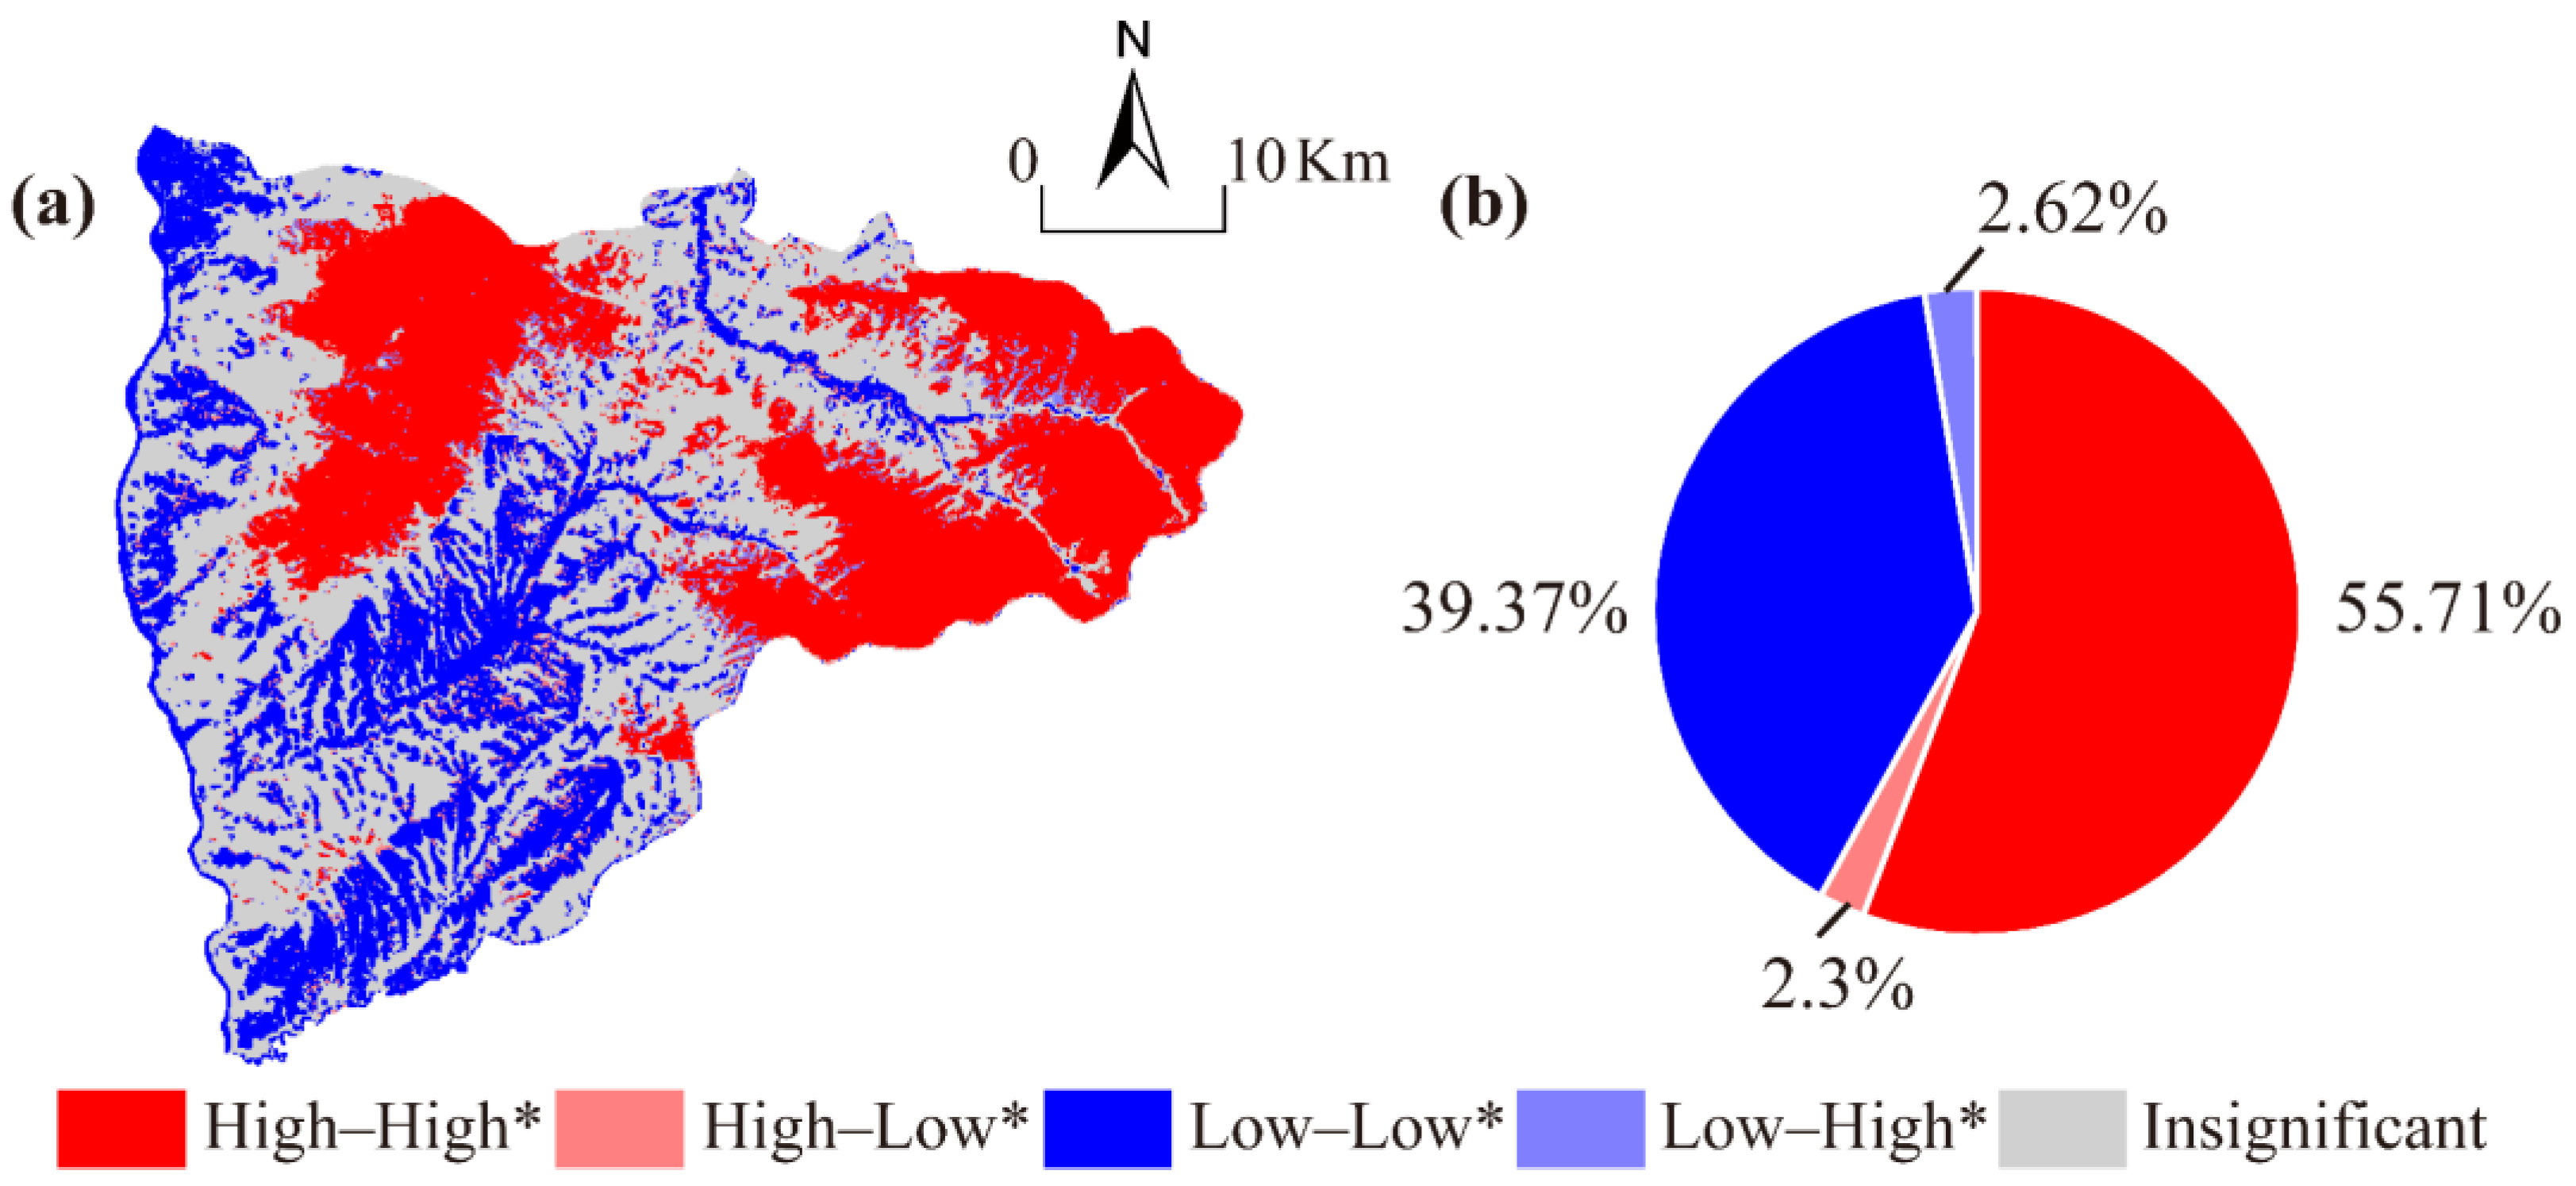
The FVC demonstrated a highly significant spatial positive correlation with the ISSC of ESs (Moran’s I > 0.6520, p < 0.01). In further examination of the spatial local correlation between the FVC and the ISSC of ESs (Figure 7a), the spatial agglomeration patterns of the FVC and the ISSC of ESs were primarily delineated into four types.
The High–High agglomeration type (high in both the FVC and the ISSC of ESs) was mostly situated in the northern region of the study area (Figure 7a), covering 55.71% of the four types of spatial agglomeration patterns (Figure 7b). The Low–Low agglomeration type, characterized by low levels of both the FVC and the ISSC of ESs, covered 39.37% of the four types of spatial agglomeration patterns (Figure 7b), and was predominantly situated in the southern and western regions of the study area (Figure 7a). The High–Low agglomeration type (higher FVC but lower ISSC of ESs) covered 2.3% of the four types of spatial agglomeration patterns, while the Low–High agglomeration type (lower FVC but higher ISSC of ESs) covered 2.62% of the four types of spatial agglomeration patterns (Figure 7b). Both were concentrated in the regions adjacent to the High–High and the Low–Low agglomeration types.

3.2. Determination of Fractional Vegetation Cover Constraint Line and Threshold Based on the Integrated Synergy–Supply Capacity of Ecosystem Services

To select the appropriate RCS model for analyzing the nonlinear relationship and threshold, it is necessary to first determine the quantity of segmentation points. In this study, three to five segmentation points were set (Table 3). This study used the RCS model with four segmentation points to analyze the nonlinear relationship between the regional FVC and ISSC of ESs and the FVC threshold. Additionally, RCS models with five segmentation points were separately applied to investigate the nonlinear relationships and thresholds of FVC for forest land and grassland in relation to their respective ISSC of ESs.
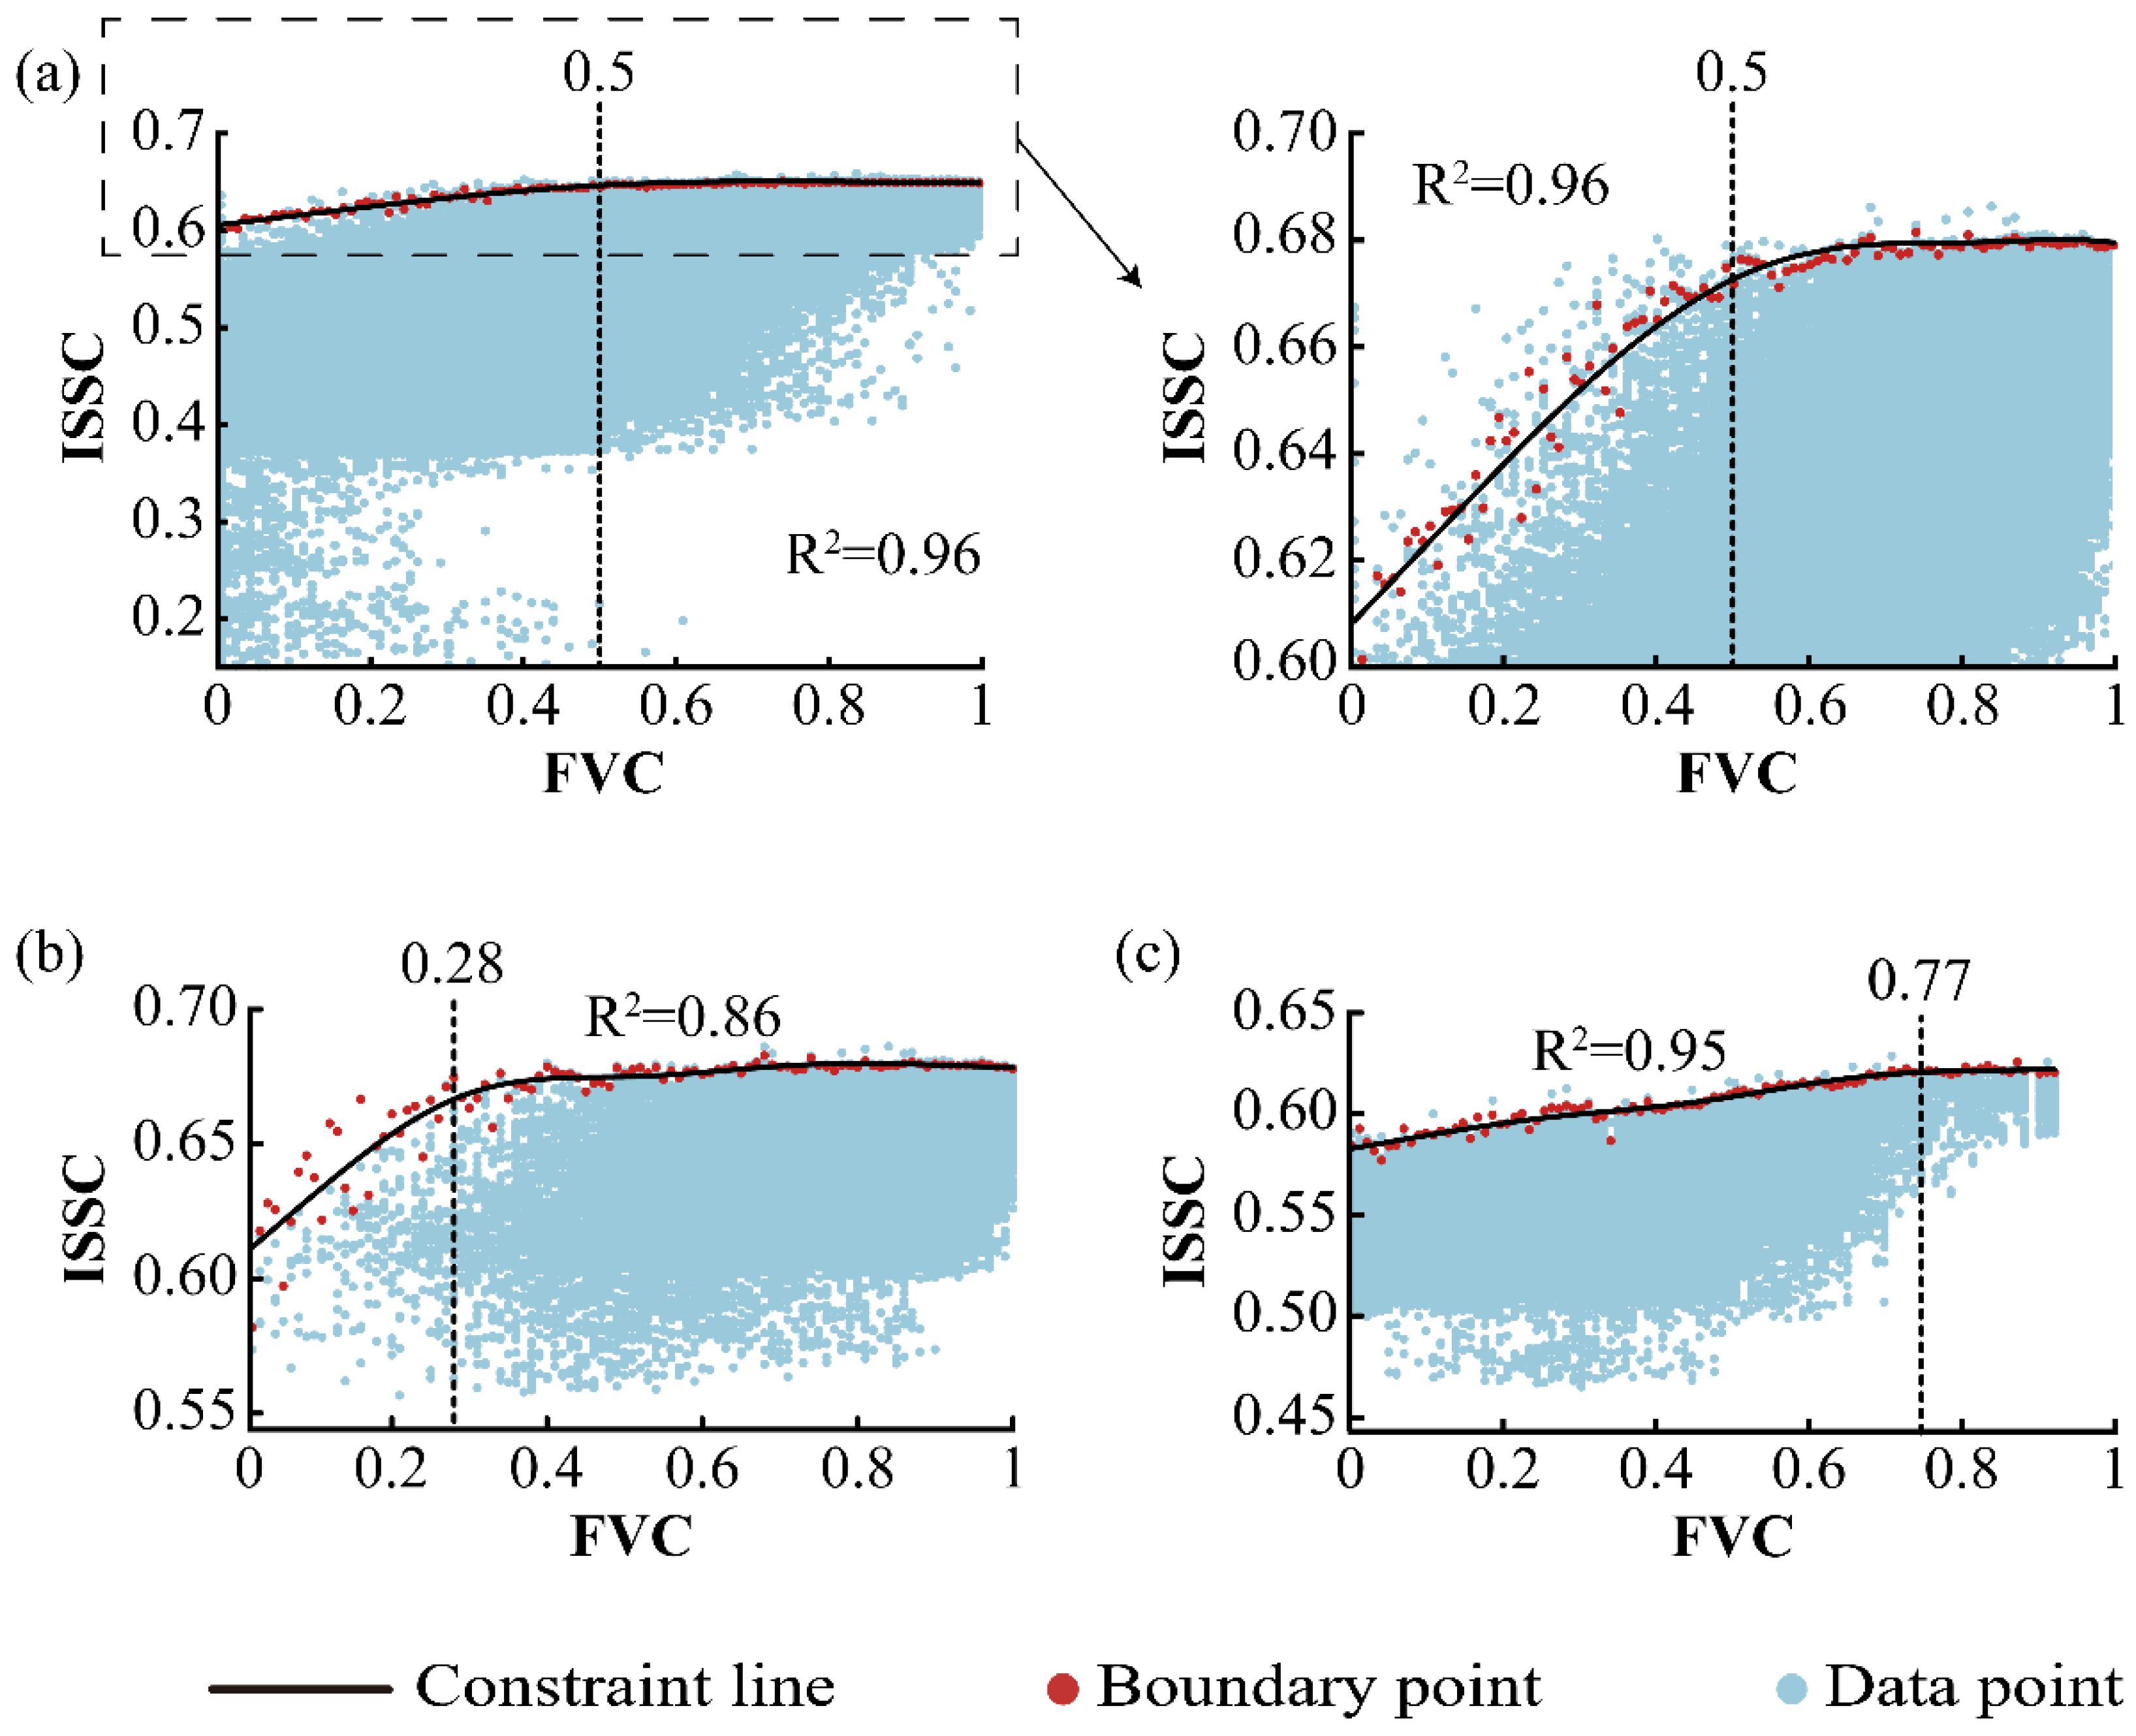
Looking at the data points in Figure 8a, it was seen that a large number of data points were at the medium-to-high level (0.37–0.69) of the ISSC index when the regional FVC value was below 0.5. However, there were also some data points at the low and lower levels (0.11–0.37) of the ISSC index. As the regional FVC increased above 0.8, the data points were almost entirely above the medium level (0.37–0.50) of the ISSC index. As observed from Figure 8b, all forest land data points were at the higher and high levels (0.50–0.69) of the ISSC index, with the majority concentrated in the high-level range (0.60–0.69) of the ISSC index. From Figure 8c, it can be seen that all grassland data points were mainly at the higher level (0.50–0.60) of the ISSC index.
The nonlinear relationship between the ISSC of ESs and the regional FVC exhibited a constraint line in the shape of a positive convex function (Figure 8a). As the regional FVC increased, the ISSC of ESs was enhanced. Analysis of the nonlinear relationships between the FVC of different vegetation types and the ISSC of ESs revealed that the constraint curves for both the forest land FVC vs. ISSC of ESs (Figure 8b) and the grassland FVC vs. ISSC of ESs (Figure 8c) exhibited a positive convex functional form. As the forest land FVC and the grassland FVC increased, the ISSC of ESs improved, and the forest land ISSC of ESs improved more obviously.
The threshold for the regional FVC was determined to be 0.5, the forest land FVC threshold was 0.28, and the grassland FVC threshold was 0.77. When the FVC value was less than the threshold, the ISSC of ESs increased with the augmentation of the FVC (Figure 8). When the FVC value exceeded the threshold, further increments in the FVC value did not result in significant alterations to the ISSC of ESs.

4. Discussion

4.1. Nonlinear Constraint and Threshold Effect of Fractional Vegetation Cover on the Integrated Synergy–Supply Capacity of Ecosystem Services

This study revealed a nonlinear relationship of positive convex function type between the regional FVC and the ISSC of ESs, as well as between the forest land FVC and the ISSC of ESs, and between the grassland FVC and the ISSC of ESs via constraint line analysis. The implementation of the vegetation restoration project has greatly promoted the increase in the vegetation coverage area. Increased vegetation, especially forests, increases the carbon sequestration capacity of the region while enhancing the soil conservation capacity [41]. However, several studies have shown that the relationship between vegetation cover and the supply level of ESs is not a simple linear facilitative relationship. In addition, there may be vegetation cover thresholds for ESs. Gong et al. investigated the constraining effect of the FVC on ESs in the Yellow River Basin. Their research findings indicated that the constraining effect of the FVC on food production was represented by a positive convex function, and there was no FVC threshold, suggesting that, as the FVC increased, food production also increased. The constraining effect of the FVC on water yield, landscape aesthetics, and soil conservation was represented by downward-opening parabolas, with the FVC thresholds of 80%, 60%, and 80%, respectively. All three ESs initially increased with increasing FVC, and then showed a decreasing trend. The constraining effect of the FVC on total ESs also exhibited a downward-opening parabolic pattern, with the FVC threshold of 80% [42].
The synergistic degree of the ESs also exhibits a nonlinear relationship with vegetation cover, and there may be a threshold effect. Deng et al. explored the interaction mechanisms of water–energy–food services along the NDVI gradients in the Songhua River Basin, and identified the nonlinear relationships and thresholds. Their study showed a pattern of fluctuating enhancement of synergistic effect of water yield and net primary productivity with the increasing NDVI. The synergistic effect of water yield and food production began to weaken when the NDVI reached 0.7. The interaction between net primary productivity and food production shifted from a trade-off to synergy when the NDVI reached 0.2, with the synergy intensifying when the NDVI reached 0.4, and diminishing when the NDVI reached 0.6 [25]. For this study, the ISSC of ESs combined the supply levels and synergy degrees of total ESs into a single indicator. An analysis of the prior research demonstrates that the relationship between the FVC and the ISSC of ESs is likely nonlinear. Nevertheless, the exact characteristic of this non-linearity, including the potential threshold effect, remains to be systematically investigated. Therefore, this study employed the constraint line method to investigate the nonlinear relationship between the two and observed that, as the FVC increased, the growth of the ISSC of ESs shifted from fast to slow. This nonlinear relationship also suggests the possibility of an FVC threshold.
This study identified that the regional FVC threshold was 0.5, the forest land FVC threshold was 0.28, and the grassland FVC threshold was 0.77. The FVC threshold for forest land was lower than that for grassland, likely due to the differences in their structural forms and ecological functions. For forest land, at lower vegetation coverage, its canopy can still effectively reduce raindrop splash erosion [43]. Leaf functional traits and root functional traits can enhance soil organic matter content [44,45], working together to promote carbon storage and soil conservation functions. Meanwhile, the deep root systems of forests can enhance soil shear strength [46], reducing soil erodibility. By contrast, the ecological functions of grasslands highly depend on the continuity of vegetation and the density of surface coverage. When the vegetation cover of the grassland is low, the patchy vegetation is challenged in establishing an effective continuous vegetation layer, resulting in low water conservation and soil retention capabilities [47]. When the vegetation cover on the grassland is high, the dense herbaceous layer can enhance soil stability through an intricate network of roots [48]; it increases the surface roughness, reducing runoff velocity [47], thereby synergistically enhancing water conservation and soil retention functions.
When the FVC value was below the threshold, the ISSC of ESs improved more significantly. When the FVC value was above the threshold, there was no significant increase in the ISSC of ESs. This indicated that the facilitative effect of the FVC on the ISSC of ESs exhibited a pattern of initially strong and subsequently diminishing influence. The primary cause of this occurrence, as posited by this study, is the restriction of the water conservation function.
According to the extant literature, it is indubitable that an increase in vegetation and litter can intercept precipitation and reduce surface runoff [49]. Concurrently, the well-developed underground root network of vegetation can alter soil structure, thereby accommodating a greater volume of moisture [50]. Consequently, it is widely acknowledged that vegetation possesses a robust capability for water conservation. However, in arid and semi-arid regions, as the vegetation cover continues to increase to a certain extent, it may conversely result in a higher consumption of water (as the vegetation would try to satisfy its own physiological demands), while also leading to an intensification of transpiration [31]. Consequently, the water conservation function of the vegetation is constrained [51]. Simultaneously, the severe depletion of soil moisture can induce soil desiccation [52], which is also detrimental to the performance of the vegetation’s soil conservation function. The study by Feng et al. indicated that vegetation restoration on the Loess Plateau is approaching the water resource–carrying capacity threshold [31]. Excessive vegetation cover could potentially become a burden in regions that experience water scarcity. In consideration of the vital importance of water resources to the arid and semi-arid regions and the global climate trend towards warmer and drier conditions [53], it is essential to engage in prolonged attention of the changes in water conservation function.

4.2. Methods for Determining Fractional Vegetation Cover Threshold

Determining the FVC threshold can assist policymakers to identify the most economically and efficiently managed vegetation strategies, thereby facilitating the formulation of subsequent vegetation restoration plans. Zhang et al. identified the FVC thresholds for various bioclimatic regions in the Loess Plateau to be 32%–44%, based on the total ecosystem services [9]. Chen et al. determined the FVC thresholds for the Loess Plateau to be between 53% and 65%, based on scenario projections that accounted for climate change [52]. The thresholds obtained in this study exhibited a slight discrepancy compared to those reported in the aforementioned studies. On one hand, this discrepancy can be attributed to the scale effects inherent in both ESs and thresholds [9,54]; different scales may result in varying thresholds. On the other hand, the variation in the methods employed for identifying the thresholds may also contribute to the differences in the outcomes.
Currently, effective methods used for identifying thresholds include statistical analyses (e.g., regression analysis, meta-analysis, and constraint line analysis) and model simulations (e.g., system dynamics models). Among these, meta-analysis requires a set of highly consistent data, while system dynamics models necessitate extensive information to describe the internal influences and responses of the system and are seldom employed for quantifying ecological impacts [19]. In comparison to these two methods, regression analysis has less stringent data requirements, allowing for a convenient and efficient determination of thresholds, and has been widely applied [55].
However, in reality, two variables within ecological processes often exhibit complex interactions and are influenced by a multitude of factors; consequently, the relationship between these two variables may exhibit distributional characteristics consistent with a scatter cloud [56]. Traditional regression analysis focuses on the relationship at the mean values of variables, requiring the data to be distributed around the mean. Yet, scatter clouds are not distributed around a specific mean value [37]. Hence, conventional regression analysis is not suitable for research in which the relationship between two variables exhibits characteristics of a scatter cloud distribution.
In ecology, the boundary of a scatter cloud for two variables is referred to as the boundary line (constraint line) [57]. Constraint line analysis can accurately define the boundary patterns of the scatter cloud, while outlining the limiting relationships among variables. Furthermore, it can effectively capture the constraining impact of the observed limiting variables on the response variables, as well as the potential range or maximum values of response variables under the influence of the limiting variables [37]. Scatter points distributed on the constraint line indicate that the response variable is either minimally influenced or entirely unaffected by other factors [58,59]. Among the current methods used for drawing constraint lines, segmented quantile regression is more statistically grounded [58,59]; thus, it has been widely applied in ESs studies [60].
In the practical application of constraint line analysis, this study noted that relying solely on the results of the polynomial fitting for threshold determination may lead to misjudgment. This is because there may be instances where the fitting may be less than ideal or the absence of extremum in the constraint line fitting result. This study posits that the determination of thresholds should first adhere to the actual distribution of the scatter cloud, with secondary consideration being given to the morphology of the constraint line; if necessary, further analysis should be conducted in conjunction with other methods. In this study, the distribution of the scatter cloud indicates that the enhancement effect of the ISSC of ESs became insignificant once the FVC exceeded a certain value. The RCS method can effectively determine the nonlinear relationship between two variables and can extract thresholds through curve trends [40,61,62]; hence, this study elected to use the RCS method in combination with constraint line analysis. The RCS method is widely used in medicine, but there is currently a lack of research on determining threshold based on ESs by combining constraint line analysis with the RCS method. This study can provide relevant case support.

4.3. Determining the Fractional Vegetation Cover Threshold Offers Significant Reference for Ecological Management Practices

The FVC serves as a crucial indicator for assessing the status of surface vegetation cover and also reflects the quality of the regional ecological environment. In ecological conservation and restoration efforts, the application range of the FVC threshold is broad. It can be utilized for delineating ecological function areas and for demarcating ecological protection red lines. Additionally, the FVC threshold can serve as a key indicator in ecological environment monitoring to help determine the health status of regional ecosystems. By monitoring changes in the FVC, the degradation or improvement of the ecological environment can be ascertained [63].
In ecological restoration projects, the FVC threshold can be used as one of the quantitative targets for assessing restoration effectiveness. The existence of the FVC threshold implies that ecological restoration should not solely aim for heightened greenness; rather, it should necessitate the implementation of diverse vegetation management strategies to foster a synergistic improvement of ESs at the regional scale. These strategies include maintaining optimal planting densities and employing intercropping techniques to mitigate soil moisture depletion from plantation forestry [64], as well as introducing drought-resistant shrubs and herbaceous plants in areas with limited water resources [65], and mitigating the potential risks associated with excessive water resource consumption [66]. Furthermore, the FVC threshold can be used to determine the vegetation configuration and greening standards, the planning and modification of vegetation patterns, the vegetation restoration processes and objectives, promoting rational and efficient land resource utilization through the spatial optimization of land use to achieve synergistic improvement of ecosystem services [67].
In the future, ecological management practices can be carried out in the study area based on the results of this study. The higher FVC threshold (0.77) for the grassland indicated that, in the study area, it is necessary to prioritize the enhancement of grassland cover to maximize the ISSC of ESs for the grassland. The lower FVC threshold (0.28) for the forest land indicated that its restoration should focus on structural optimization rather than simply increasing vegetation cover to avoid excessive water consumption. These findings provide a quantitative basis for differentiated vegetation management strategies in the study area.
For the entire region, it is necessary to perform a thorough ecosystem evaluation for regions where the FVC value is below 0.5, and to formulate a detailed ecological restoration plan for different vegetation types. Furthermore, in regions that experience significant soil erosion, vegetation restoration must be conducted, while enhancing ecological conservation and designating the protected areas to safeguard critical species and habitats. Moreover, it is important to devise and execute pertinent policies and provide financial subsidies to encourage enterprises and individuals to engage in ecological restoration efforts.
When the FVC value is higher than 0.5, and the spatial aggregation type of FVC and the ISSC of ESs is the High–Low type, it is discussed in two cases. On the one hand, there may be a limiting effect of vegetation on the ISSC of ESs; hence, forest management practices, such as thinning cutting, should be implemented to decrease forest stand density. At the same time, the vegetation structure should be optimized to improve the stability of the ecosystem. On the other hand, it is possible that the limiting effect of other factors on the ISSC of ESs exceeds the facilitating effect of the vegetation. In such cases, the factors contributing to the low ISSC of ESs (e.g., steep slopes, inadequate water supply, economic construction, etc.) should be identified, and ecological restoration works should be carried out according to the local conditions. For instance, the implementation of soil and water conservation engineering techniques (e.g., terrace construction, slope protection measures, etc.) and the establishment of water-saving irrigation systems, among others.
In regions where the FVC value exceeds 0.5, and the spatial aggregation type of the FVC and the ISSC of ESs is the Low–High or High–High type, it is imperative to conduct regular ecological monitoring activities. The protection of grassland should be enhanced, and the vegetation cover of grassland should be moderately increased. Furthermore, anthropogenic interference should be reduced, and natural regeneration and succession of vegetation should be allowed. Under the premise of ecological protection, moderate scientific research should be carried out to enhance the understanding of the relationship between vegetation and the ecosystem.

4.4. Limitations of This Study

This study conducted a quantitative assessment of the FVC and the ISSC of ESs, identifying their spatial relationship. On this basis, the constraint effects and thresholds of the FVC for the region and different vegetation types were determined. Nonetheless, this study is subject to certain uncertainties and has a few limitations.
First, this study quantified only four ES indicators, which may not encompass the entirety of the regional ESs. Future studies should incorporate additional indicators, such as cultural services and food supply, thereby conducting a comprehensive examination of the ISSC of all the ESs from a combined human–society–ecology perspective. This study analyzed the nonlinear relationships between the regional FVC and the ISSC of ESs, the forest land FVC and the ISSC of ESs, and the grassland FVC and the ISSC of ESs, and determined the FVC thresholds. In the future, remote sensing technology could be integrated with the Braun–Blanquet approach [68] for precise large-scale vegetation ecological classification, further verifying the relationship between the ISSC of ESs of different vegetation communities and their coverage, and to determine vegetation cover thresholds. Additionally, this work used the constraint line analysis and the RCS method to determine the constraint effects and thresholds of the FVC for the region and different vegetation types; future studies can further explore their underlying mechanisms and processes. Simultaneously, the identification of thresholds is also scale-dependent; the FVC thresholds identified in this study refer to the critical points at which the promotional effect of the FVC for the region and different vegetation types on the ISSC of ESs experienced a transition (during the study period). The thresholds may vary across different spatiotemporal contexts. Thus, this underscores the imperative of accounting for scale effects when determining the thresholds while necessitating the validation of thresholds through multiscale analyses in future research.

5. Conclusions

This study focuses on exploring the relationship between the FVC and the ISSC of ESs, and determining the optimal FVC threshold for the region. This study provided the following conclusions. (1) The spatial distribution of both the FVC and the ISSC of ESs was higher in the north, with a growth trend observed respectively. (2) The ISSC of ESs exhibited a highly significant (Moran’s I > 0.6520, p < 0.01) positive spatial correlation with the FVC. The relationship between these two variables manifested in four distinct spatial agglomeration types, with the High–High agglomeration type representing the largest proportion (55.71%). (3) The relationship between the regional FVC and the ISSC of ESs, as well as between the forest land FVC and the ISSC of ESs, between the grassland FVC and the ISSC of ESs, all exhibited constraint lines in the shape of a positive convex function. The regional FVC threshold was 0.5, the forest land FVC threshold was 0.28, and the grassland FVC threshold was 0.77. When the FVC value exceeded the threshold, its facilitating effect on the ISSC of ESs began to diminish, indicating the necessity for moderate vegetation enhancement. (4) The FVC threshold serves as a key indicator for guiding regional ecological management practices. The threshold difference between the forest land FVC and the grassland FVC highlights the distinct management strategies for specific vegetation types, suggesting that forest management should prioritize the optimization of vegetation structure, whereas grasslands require prioritizing an increase in vegetation cover to enhance the ISSC of ESs. For the entire region, in areas where the FVC is below the threshold of 0.5, it is recommended to conduct a thorough assessment of ecosystem functions, delineate ecological protection zones, and implement targeted vegetation restoration measures. For regions where the FVC exceeds the threshold value of 0.5, adaptive strategies should be prioritized to optimize vegetation structure, and ecological restoration, and protection work should be carried out in accordance with local conditions, combining soil and water conservation engineering techniques. In addition, regular ecological monitoring activities should be conducted.
By combining constraint line analysis with the RCS method, this study overcomes the limitations of traditional regression methods in handling scatter cloud relationships. It offers a replicable framework for detecting vegetation cover thresholds, thereby expanding relevant research and providing valuable insights for formulating vegetation restoration and ecological management strategies in other arid and semi-arid regions or areas with severe soil and water loss. Furthermore, this study emphasizes the importance of considering the synergy–supply capacity of all the ESs when determining the FVC threshold. The methods and framework employed in this study can be applied to other studies about threshold effects based on ESs, contributing significantly to addressing the many challenges facing global ecological restoration and achieving sustainable development.

Supplementary Materials

The following supporting information can be downloaded at: https://www.mdpi.com/article/10.3390/f16040587/s1. Table S1: Biophysical table for the Carbon Storage and Sequestration module (t/ha); Table S2: Biophysical table for the Sediment Delivery Ratio module; Table S3: Biophysical table for the Annual Water Yield module; Table S4: Threat factors and their stress intensity; Table S5: Sensitivity of land use type to habitat threat factors; Table S6: Trend classification in terms of β, Z, and p values, using the Theil–Sen estimator and the Mann–Kendall trend test methods; Figure S1: Multi-year average spatial distribution of ecosystem services in Ji County. (a) Carbon storage; (b) soil conservation; (c) water conservation; (d) habitat quality. Figure S2: Constraint line type diagram (modified from reference [37]). (a) downward-opening parabola type; (b) upward-opening parabola type; (c) positive convex function type; (d) S-shaped type; (e) exponential type; (f) hump-shaped type. References [37,69,70,71,72,73,74,75,76,77,78,79,80,81,82,83,84,85,86,87,88,89,90,91,92,93,94] are cited in Supplementary Material.

Author Contributions

Conceptualization, Z.L. and H.B.; methodology, Z.L. and H.B.; formal analysis, Z.L.; investigation, Z.L., D.Z., N.G., N.W. and Y.S.; data curation, Z.L. and Y.S.; writing—original draft preparation, Z.L.; writing—review and editing, Z.L., D.Z., N.G. and H.B.; visualization, Z.L.; supervision, D.Z., N.W. and H.B.; funding acquisition, H.B. All authors have read and agreed to the published version of the manuscript.

Funding

This research was funded by the National Key Research and Development Program of China (No. 2024YFD2200504, No. 2022YFF1300401).

Data Availability Statement

The original contributions presented in this study are included in the article and Supplementary Material.

Conflicts of Interest

The authors declare no conflicts of interest.

References

  1. Holdren, J.P.; Ehrlich, P.R. Human population and the global environment. Am. Sci. 1974, 62, 282–292. Available online: http://www.jstor.org/stable/27844882 (accessed on 16 September 2023). [PubMed]
  2. Costanza, R.; d’Arge, R.; de Groot, R.; Farber, S.; Grasso, M.; Hannon, B.; Limburg, K.; Naeem, S.; O’Neill, R.V.; Paruelo, J.; et al. The value of the world’s ecosystem services and natural capital. Nature 1997, 387, 253–260. [Google Scholar] [CrossRef]
  3. Bennett, E.M.; Peterson, G.D.; Gordon, L.J. Understanding relationships among multiple ecosystem services. Ecol. Lett. 2009, 12, 1394–1404. [Google Scholar] [CrossRef] [PubMed]
  4. Bachelet, D.; Neilson, R.P.; Lenihan, J.M.; Drapek, R.J. Climate Change Effects on Vegetation Distribution and Carbon Budget in the United States. Ecosystems 2021, 4, 164–185. [Google Scholar] [CrossRef]
  5. Teixeira, G.M.; Figueiredo, P.H.; Salemi, L.F.; Ferraz, S.F.; Ranzini, M.; Arcova, F.C.; Cicco, V.; Rizzi, N.E. Regeneration of tropical montane cloud forests increases water yield in the Brazilian Atlantic Forest. Ecohydrology 2021, 14, e2298. [Google Scholar] [CrossRef]
  6. Wang, N.; Bi, H.; Peng, R.; Zhao, D.; Liu, Z. Synergistic enhancement of regeneration capacity and ecological functions of Robinia pseudoacacia L. plantations in the Loess Plateau. Catena 2024, 243, 108226. [Google Scholar] [CrossRef]
  7. Gitelson, A.A.; Kaufman, Y.J.; Stark, R.; Rundquist, D. Novel algorithms for remote estimation of vegetation fraction. Remote Sens. Environ. 2002, 80, 76–87. [Google Scholar] [CrossRef]
  8. Gao, Y.; Zhong, B.; Yue, H.; Wu, B.; Cao, S. A degradation threshold for irreversible loss of soil productivity: A long-term case study in China. J. Appl. Ecol. 2011, 48, 1145–1154. [Google Scholar] [CrossRef]
  9. Zhang, K.; Lv, Y.; Fu, B.; Yin, L.; Yu, D. The effects of vegetation coverage changes on ecosystem service and their threshold in the Loess Plateau. Acta Geogr. Sin. 2020, 75, 949–960. [Google Scholar] [CrossRef]
  10. Qiu, H.; Zhang, J.; Han, H.; Cheng, X.; Kang, F. Study on the impact of vegetation change on ecosystem services in the Loess Plateau, China. Ecol. Indic. 2023, 154, 110812. [Google Scholar] [CrossRef]
  11. Zhu, M.; Zhou, Z.; Wu, X.; Liu, R.; Zheng, J.; Wang, J.; Wan, J. Response of vegetation carbon sequestration potential to the effectiveness of vegetation restoration in karst ecologically fragile areas in Guizhou, southwest China. Ecol. Indic. 2024, 158, 111495. [Google Scholar] [CrossRef]
  12. Munyon, J.W.; Flitcroft, R.L. Evaluating floodplain vegetation after valley-scale restoration with unsupervised classification of National Agriculture Imagery Program data in semi-arid environments. J. Am. Water Resour. Assoc. 2025, 61, e13245. [Google Scholar] [CrossRef]
  13. Ram, M.; Sheaves, M.; Waltham, N.J. Tracking the long-term vegetation and soil characteristics of restored mangroves: A case study from Guyans’ coast. Restor. Ecol. 2024, 32, e14170. [Google Scholar] [CrossRef]
  14. Raudsepp-Hearne, C.; Peterson, G.D.; Bennett, E.M. Ecosystem service bundles for analyzing tradeoffs in diverse landscapes. Proc. Natl. Acad. Sci. USA 2010, 107, 5242–5247. [Google Scholar] [CrossRef]
  15. Bukvareva, E.; Zamolodchikov, D.; Kraev, G.; Grunewald, K.; Narykov, A. Supplied, demanded and consumed ecosystem services: Prospects for national assessment in Russia. Ecol. Indic. 2017, 78, 351–360. [Google Scholar] [CrossRef]
  16. Dang, H.; Li, J.; Zhang, Y.; Zhou, Z. Evaluation of the equity and regional management of some urban green space ecosystem services: A case study of main urban area of Xi’an city. Forests 2021, 12, 813. [Google Scholar] [CrossRef]
  17. Foudi, S.; Spadaro, J.V.; Chiabai, A.; Polanco-Martinez, J.M.; Neumann, M.B. The climatic dependencies of urban ecosystem services from green roofs: Threshold effects and non-linearity. Ecosyst. Serv. 2017, 24, 223–233. [Google Scholar] [CrossRef]
  18. Peng, J.; Tian, L.; Liu, Y.; Zhao, M.; Hu, Y.; Wu, J. Ecosystem services response to urbanization in metropolitan areas: Thresholds identification. Sci. Total Environ. 2017, 607, 706–714. [Google Scholar] [CrossRef]
  19. Shen, J.; Li, S.; Liu, L.; Liang, Z.; Wang, Y.; Wang, H.; Wu, S. Uncovering the relationships between ecosystem services and social-ecological drivers at different spatial scales in the Beijing-Tianjin-Hebei region. J. Clean. Prod. 2020, 290, 125193. [Google Scholar] [CrossRef]
  20. Jiang, C.; Wang, X.; Zhang, H.; Labzovskii, L.; Wang, J.; Liu, T. Re-orienting ecological restoration in degraded drylands for a more sustainable soil–water relationship: Non-linear boundary of limited water resources in combating soil loss. J. Arid Environ. 2019, 167, 87–100. [Google Scholar] [CrossRef]
  21. Ruan, J.; Li, Z.; Zhang, X.; Jian, X.; Wang, D. Optimal vegetation coverage from the perspective of ecosystem services in the Qilian Mountains. Environ. Res. Commun. 2024, 6, 115023. [Google Scholar] [CrossRef]
  22. Zhao, Z.; Dai, E. Vegetation cover dynamics and its constraint effect on ecosystem services on the Qinghai-Tibet Plateau under ecological restoration projects. J. Environ. Manag. 2024, 356, 120535. [Google Scholar] [CrossRef]
  23. Feng, Z.; Jin, X.; Chen, T.; Wu, J. Understanding trade-offs and synergies of ecosystem services to support the decision-making in the Beijing-Tianjin-Hebei region. Land Use Policy 2021, 106, 105446. [Google Scholar] [CrossRef]
  24. Cord, A.F.; Bartkowski, B.; Beckmann, M.; Dittrich, A.; Hermans-Neumann, K.; Kaim, A.; Lienhoop, N.; Locher-Krause, K.; Priess, J.; Schröter-Schlaack, C.; et al. Towards systematic analyses of ecosystem service trade-offs and synergies: Main concepts, methods and the road ahead. Ecosyst. Serv. 2017, 28, 264–272. [Google Scholar] [CrossRef]
  25. Deng, G.; Jiang, H.; Ma, S.; Wen, Y.; He, C.; Sheng, L.; Gu, D. How water–energy–food services and their interactions change along multiple environmental gradients. Agric. Water Manag. 2025, 309, 109339. [Google Scholar] [CrossRef]
  26. Zhang, L.; Lei, J.; Chen, Z.; Zhou, P.; Wu, T.; Chen, X.; Li, Y.; Pan, X. Spatiotemporal Differentiation and Trade-offs and Synergies of Ecosystem Services in Tropical Island Basins: A Case Study of Three Major Basins of Hainan Island. J. Clean. Prod. 2025, 490, 144798. [Google Scholar] [CrossRef]
  27. Chen, T.; Wang, Y.; Zeng, X.; Wang, Q. Characteristics and the constraint relationship between ecosystem services and vegetation coverage in the Southwest China. Acta Ecol. Sin. 2023, 43, 2253–2270. [Google Scholar] [CrossRef]
  28. Xun, B.; Zheng, Y.; Fan, R.; Hao, R.F.; Liu, B.Y. Assessment of trade-off/synergy relationships between ecosystem services and identification of ecological restoration thresholds. Acta Ecol. Sin. 2024, 44, 7431–7444. [Google Scholar] [CrossRef]
  29. Zheng, T.; Zhou, Z.; Zou, Y.; Pulatov, B.; Biswas, A. Analysis of spatial and temporal characteristics and spatial flow process of soil conservation service in Jinghe basin of China. Sustainability 2021, 13, 1794. [Google Scholar] [CrossRef]
  30. Ouyang, Z.; Zheng, H.; Xiao, Y.; Polasky, S.; Liu, J.; Xu, W.; Wang, Q.; Zhang, L.; Xiao, Y.; Rao, E.M.; et al. Improvements in ecosystem services from investments in natural capital. Science 2016, 352, 1455–1459. [Google Scholar] [CrossRef]
  31. Feng, X.; Fu, B.; Piao, S.; Wang, S.; Ciais, P.; Zeng, Z.; Li, Y.; Jiang, X.; Wu, B. Revegetation in China’s Loess Plateau is approaching sustainable water resource limits. Nat. Clim. Chang. 2016, 6, 1019–1022. [Google Scholar] [CrossRef]
  32. Bradford, J.B.; D’Amato, A. Recognizing trade-offs in multi-objective land management. Front. Ecol. Environ. 2012, 10, 210–216. [Google Scholar] [CrossRef]
  33. Ivits, E.; Cherlet, M.; Sommer, S.; Mehl, W. Addressing the complexity in non- linear evolution of vegetation phenological change with time-series of remote sensing images. Ecol. Indic. 2013, 26, 49–60. [Google Scholar] [CrossRef]
  34. Imukova, K.; Ingwersen, J.; Streck, T. Determining the spatial and temporal dynamics of the green vegetation fraction of croplands using high-resolution RapidEye satellite images. Agric. For. Meteorol. 2015, 206, 113–123. [Google Scholar] [CrossRef]
  35. Ali, R.; Kuriqi, A.; Abubaker, S.; Kisi, O. Long-term trends and seasonality detection of the observed flow in Yangtze River using Mann-Kendall and Sen’s innovative trend method. Water 2019, 11, 1855. [Google Scholar] [CrossRef]
  36. Anselin, L. Local indicators of spatial association-LISA. Geog. Anal. 1995, 27, 93–115. [Google Scholar] [CrossRef]
  37. Hao, R.F.; Yu, D.Y.; Wu, J.G. Relationship between paired ecosystem services in the grassland and agro-pastoral transitional zone of China using the constraint line method. Agr. Ecosyst. Environ. 2017, 240, 171–181. [Google Scholar] [CrossRef]
  38. Fong, Y.; Huang, Y.; Gilbert, P.B.; Permar, S.R. chngpt: Threshold regression model estimation and inference. BMC Bioinform. 2017, 18, 454. [Google Scholar] [CrossRef]
  39. Gauthier, J.; Wu, Q.V.; Gooley, T.A. Cubic splines to model relationships between continuous variables and outcomes: A guide for clinicians. Bone Marrow Transplant. 2020, 55, 675–680. [Google Scholar] [CrossRef]
  40. Li, D.; Cao, W.; Dou, Y.; Wu, S.; Liu, J.; Li, S. Non-linear effects of natural and anthropogenic drivers on ecosystem services: Integrating thresholds into conservation planning. J. Environ. Manag. 2022, 321, 116047. [Google Scholar] [CrossRef]
  41. Zhou, J.; Fu, B.; Gao, G.; Lü, Y.; Liu, Y.; Lü, N.; Wang, S. Effects of precipitation and restoration vegetation on soil erosion in a semi-arid environment in the Loess Plateau, China. Catena 2016, 137, 1–11. [Google Scholar] [CrossRef]
  42. Gong, J.; Ma, Z.; Hu, C.; He, L.; Lei, J. Study on the Constraint Effect of Vegetation on Ecosystem Services in the Yellow River Basin. Forests 2024, 15, 1771. [Google Scholar] [CrossRef]
  43. Ma, M.; Li, Q.; Wang, J.; Wang, Y.; Zhang, M. A Review of Canopy Interception of Forest Ecosystems in Drylands of China. J. Northwest For. Univ. 2024, 39, 1–13. [Google Scholar] [CrossRef]
  44. Yang, C.; Zhang, X.; Ni, H.; Gai, X.; Huang, Z.; Du, X.; Zhong, Z. Soil carbon and associated bacterial community shifts driven by fine root traits along a chronosequence of Moso bamboo (Phyllostachys edulis) plantations in subtropical China. Sci. Total Environ. 2021, 752, 142333. [Google Scholar] [CrossRef]
  45. Augusto, L.; Boča, A. Tree functional traits, forest biomass, and tree species diversity interact with site properties to drive forest soil carbon. Nat. Commun. 2022, 13, 1097. [Google Scholar] [CrossRef] [PubMed]
  46. Guo, M.; Wang, W.; Kang, H.; Yang, B. Changes in soil properties and erodibility of gully heads induced by vegetation restoration on the Loess Plateau, China. J. Arid Land 2018, 10, 712–725. [Google Scholar] [CrossRef]
  47. Wang, G.; Liu, G.; Li, C. Effects of changes in alpine grassland vegetation cover on hillslope hydrological processes in a permafrost watershed. J. Hydrol. 2012, 444, 22–33. [Google Scholar] [CrossRef]
  48. Chen, H.; Zhang, X.; Abla, M.; Lü, D.; Yan, R.; Ren, Q.; Ren, Z.; Yang, Y.; Zhao, W.; Lin, P.; et al. Effects of vegetation and rainfall types on surface runoff and soil erosion on steep slopes on the Loess Plateau, China. Catena 2018, 170, 141–149. [Google Scholar] [CrossRef]
  49. Hua, F.; Bruijnzeel, L.A.; Meli, P.; Martin, P.A.; Zhang, J.; Nakagawa, S.; Miao, X.; Wang, W.; Mcevoy, C.; Peña-Arancibia, J.L.; et al. The biodiversity and ecosystem service contributions and trade-offs of forest restoration approaches. Science 2022, 376, 839–844. [Google Scholar] [CrossRef]
  50. Xiao, T.; Li, P.; Fei, W.; Wang, J. Effects of vegetation roots on the structure and hydraulic properties of soils: A perspective review. Sci. Total Environ. 2023, 906, 167524. [Google Scholar] [CrossRef]
  51. Wen, X.; Théau, J. Spatiotemporal analysis of water-related ecosystem services under ecological restoration scenarios: A case study in northern Shaanxi, China. Sci. Total Environ. 2020, 720, 137477. [Google Scholar] [CrossRef] [PubMed]
  52. Chen, Y.; Wang, K.; Fu, B.; Wang, Y.; Tian, H.; Wang, Y.; Zhang, Y. 65% cover is the sustainable vegetation threshold on the Loess Plateau. Environ. Sci. Ecotechnol. 2024, 22, 100442. [Google Scholar] [CrossRef]
  53. Fu, B.J.; Wang, S.; Liu, Y.; Liu, J.B.; Liang, W.; Miao, C.Y. Hydrogeomorphic ecosystem responses to natural and anthropogenic changes in the Loess Plateau of China. Annu. Rev. Earth Planet. Sci. 2017, 45, 223–243. [Google Scholar] [CrossRef]
  54. Shi, Y.; Tonda, A.; Accatino, F. Handling ecosystem service trade-offs: The importance of the spatial scale at which no-loss constraints are posed. Landsc. Ecol. 2023, 38, 1163–1175. [Google Scholar] [CrossRef]
  55. Ficetola, G.F.; Denoel, M. Ecological thresholds: An assessment of methods to identify abrupt changes in species-habitat relationships. Ecography 2009, 32, 1075–1084. [Google Scholar] [CrossRef]
  56. Pittman, S.D.; Turnblom, E.C. A study of self-thinning using coupled allometric equations: Implications for coastal Douglas-fir stand dynamics. Can. J. For. Res. 2003, 33, 1661–1669. [Google Scholar] [CrossRef]
  57. Webb, R. Use of the boundary line in the analysis of biological data. Hortic. Sci. 1972, 47, 309–319. [Google Scholar] [CrossRef]
  58. Mills, A.J.; Fey, M.V.; Donaldson, J.; Todd, S.; Theron, L. Soil infiltrability as a driver of plant cover and species richness in the semi-arid Karoo, South Africa. Plant Soil 2009, 320, 321–332. [Google Scholar] [CrossRef]
  59. Medinski, T.V.; Mills, A.J.; Esler, K.J.; Schmiedel, U.; Jürgens, N. Do soil properties constrain species richness? Insights from boundary line analysis across several biomes in south western Africa. J. Arid Environ. 2010, 74, 1052–1060. [Google Scholar] [CrossRef]
  60. Li, Z.; Guan, D.; Zhou, L.; Zhang, Y. Constraint relationship of ecosystem services in the Yangtze River Economic Belt, China. Environ. Sci. Pollut. 2021, 29, 12484–12505. [Google Scholar] [CrossRef]
  61. Hong, G.; Liu, S.; Liu, W.; Wu, X. Nonlinear trade-off relationship and critical threshold between ecosystem services and climate resilience for sustainable urban development. Sustain. Cities Soc. 2024, 103, 105253. [Google Scholar] [CrossRef]
  62. Yang, M.; Chen, Y.; Yang, Y.; Yan, Y. Nonlinear relationship and threshold-based zones between ecosystem service supply-demand ratio and land use intensity: A case study of the Beijing-Tianjin-Hebei region, China. J. Clean. Prod. 2024, 481, 144148. [Google Scholar] [CrossRef]
  63. Li, J.; Pei, Y.; Zhao, S.; Xiao, R.; Sang, X.; Zhang, C. A Review of Remote Sensing for Environmental Monitoring in China. Remote Sens. 2020, 12, 1130. [Google Scholar] [CrossRef]
  64. Wang, Y.; Yan, W.; Han, X.; Pan, F.; Cheng, L.; Liu, W. Changes in deep soil water content in the process of large-scale apple tree planting on the Loess Tableland of China. Forests 2021, 12, 123. [Google Scholar] [CrossRef]
  65. Hu, J.; Lü, Y.; Fu, B.; Comber, A.J.; Harris, P. Quantifying the effect of ecological restoration on runoff and sediment yields: A meta-analysis for the Loess Plateau of China. Prog. Phys. Geog. 2017, 41, 753–774. [Google Scholar] [CrossRef]
  66. Cao, S.X.; Chen, L.; Shankman, D.; Wang, C.M.; Wang, X.B.; Zhang, H. Excessive reliance on afforestation in China’s arid and semi-arid regions: Lessons in ecological restoration. Earth Sci. Rev. 2011, 104, 240–245. [Google Scholar] [CrossRef]
  67. Qiu, J.; Huang, T.; Yu, D. Evaluation and optimization of ecosystem services under different land use scenarios in a semiarid landscape mosaic. Ecol. Indic. 2022, 135, 108516. [Google Scholar] [CrossRef]
  68. Ivanova, N. Global overview of the application of the Braun-Blanquet approach in research. Forests 2024, 15, 937. [Google Scholar] [CrossRef]
  69. Xu, L.; He, N.; Yu, G. A dataset of carbon density in Chinese terrestrial ecosystems (2010s). China Sci. Data 2019, 4, 86–92. [Google Scholar] [CrossRef]
  70. Yang, J.X.; Bao, P.; Zhang, D.G. Spatio-temporal evolution of carbon stocks in the Yellow River Basin based on InVEST and CA-Markov models. Chin. J. Eco-Agric. 2021, 29, 1018–1029. [Google Scholar] [CrossRef]
  71. Chen, X.; Yu, L.; Hou, S.; Liu, T.; Li, X.; Li, Y.; Du, Z.; Li, C.; Wu, H.; Gao, G.; et al. Unraveling carbon stock dynamics and their determinants in China’s Loess Plateau over the past 40 years. Ecol. Indic. 2024, 159, 111760. [Google Scholar] [CrossRef]
  72. Chen, G.; Yang, Y.; Liu, L.; Li, X.; Zhao, Y.; Yuan, Y. Research review on total belowground carbon allocation in forest ecosystems. J. Subtrop. Resour. Environ. 2007, 2, 34–42. [Google Scholar] [CrossRef]
  73. Peng, S.; Gang, C.; Cao, Y.; Chen, Y. Assessment of climate change trends over the loess plateau in China from 1901 to 2100. Int. J. Climatol. 2017, 38, 2250–2264. [Google Scholar] [CrossRef]
  74. Peng, S.Z.; Ding, Y.X.; Wen, Z.M.; Chen, Y.M.; Cao, Y.; Ren, J.Y. Spatiotemporal change and trend analysis of potential evapotranspiration over the Loess Plateau of China during 2011–2100. Agric. For. Meteorol. 2017, 233, 183–194. [Google Scholar] [CrossRef]
  75. Peng, S. 1-km Monthly Mean Temperature Dataset for China (1901–2023). National Tibetan Plateau/Third Pole Environment Data Center, China. 2019. Available online: https://doi.org/10.11888/Meteoro.tpdc.270961 (accessed on 14 January 2024).
  76. Peng, S.Z.; Ding, Y.X.; Liu, W.Z.; Li, Z. 1 km monthly temperature and precipitation dataset for China from 1901 to 2017. Earth Syst. Sci. Data 2019, 11, 1931–1946. [Google Scholar] [CrossRef]
  77. Ding, Y.X.; Peng, S.Z. Spatiotemporal trends and attribution of drought across China from 1901–2100. Sustainability 2020, 12, 477. [Google Scholar] [CrossRef]
  78. Peng, S. 1-km Monthly Precipitation Dataset for China (1901–2023). National Tibetan Plateau/Third Pole Environment Data Center, China. 2020. Available online: https://doi.org/10.5281/zenodo.3114194 (accessed on 26 December 2023).
  79. Fischer, G.; Nachtergaele, F.O.; Prieler, S.; Velthuizen, H.V.; Verelst, L.; Wiberg, D. Global Agro-ecological Zones Assessment for Agriculture (GAEZ 2008). IIASA, Laxenburg, Austria and FAO, Rome, Italy. 2008. Available online: https://www.fao.org/soils-portal/data-hub/soil-maps-and-databases/harmonized-world-soil-database-v12/en/ (accessed on 28 October 2023).
  80. NASA JPL. NASADEM Merged DEM Global 1 arc second V001 [Data Set]. NASA EOSDIS Land Processes Distributed Active Archive Center. 2020. Available online: https://doi.org/10.5067/MEaSUREs/NASADEM/NASADEM_HGT.001 (accessed on 19 October 2023).
  81. Zhang, Y.; Shi, F.; Zhang, Y.; Li, M.; Cui, G.; Liu, Z. Temporal and Spatial Changes and Driving Factors of Soil Erosion in the Middle Reaches of the Yellow River. Res. Soil Water Conserv. 2023, 30, 1–12. [Google Scholar] [CrossRef]
  82. Xu, J.; Liu, H. Assessment and prediction of ecosystem services trade-offs and synergies relationships in Gansu Province. China Environ. Sci. 2024, 44, 1863–1874. [Google Scholar] [CrossRef]
  83. Cai, C.; Ding, S. Study of applying USLE and geographical information system IDRISI to predict soil erosion in small watershed. J. Soil Water Conserv. 2000, 14, 19–24. [Google Scholar] [CrossRef]
  84. Zhou, W.; Liu, G.; Pan, J.; Feng, X. Distribution of available soil water capacity in China. J. Geog. Sci. 2005, 15, 3–12. [Google Scholar] [CrossRef]
  85. Xue, J.; Li, Z.; Feng, Q.; Gui, J.; Zhang, B. Spatiotemporal variations of water conservation and its influencing factors in ecological barrier region, Qinghai-Tibet Plateau. J. Hydrol.-Reg. Stud. 2022, 42, 101164. [Google Scholar] [CrossRef]
  86. Ding, Y.X.; Peng, S.Z. Spatiotemporal change and attribution of potential evapotranspiration over China from 1901 to 2100. Theor. Appl. Climatol. 2021, 145, 79–94. [Google Scholar] [CrossRef]
  87. Peng, S. 1-km Monthly Potential Evapotranspiration Dataset for China (1901–2023). National Tibetan Plateau/Third Pole Environment Data Center, China. 2022. Available online: https://doi.org/10.11866/db.loess.2021.001 (accessed on 1 November 2023).
  88. Yan, F.; Shangguan, W.; Zhang, J.; Hu, B.F. Depth-to-bedrock map of China at a spatial resolution of 100 meters. Sci. Data 2020, 7, 2. [Google Scholar] [CrossRef]
  89. Yun, L.; Bi, H.; Ma, W. Distribution characteristics of Robinia pseudoacacia roots in silvopastoral system in the loess region of west Shanxi. J. Arid Land Resour. Environ. 2012, 26, 151–155. [Google Scholar] [CrossRef]
  90. Sun, T.; Wang, X.; Li, D.; Liu, X.; Wang, R.; Zhang, S. Changes in root biomass of grassland along the environmental gradient in the Loess Plateau. Acta Ecol. Sin. 2021, 41, 6234–6244. [Google Scholar] [CrossRef]
  91. Lan, Y.; Sun, T.; Li, W. Trade-offs and synergies of farmland ecosystem services in Loess Plateau: A case study of Longdong Region, Northwest China. Trans. Chin. Soc. Agric. Eng. 2023, 39, 236–244. [Google Scholar] [CrossRef]
  92. Zhao, Y.; Yu, Y.; Sun, B. Research on the Spatiotemporal Changes of Supply and Demand for Water Yield in Shanxi Province. J. Soil Water Conserv. 2023, 37, 126–133+144. [Google Scholar] [CrossRef]
  93. Natural Capital Project. InVEST 3.14.1 User’s Guide; Stanford University, University of Minnesota, Chinese Academy of Sciences, The Nature Conservancy, World Wildlife Fund, Stockholm Resilience Centre and the Royal Swedish Academy of Sciences: San Francisco, CA, USA, 2023. [Google Scholar]
  94. Chen, S.; Huang, Y.; Jin, Y. Spatiotemporal changes of habitat quality before and after the implementation of Grain for Green Project in the middle reaches of the Yellow River. Arid Zone Res. 2023, 40, 456–468. [Google Scholar] [CrossRef]
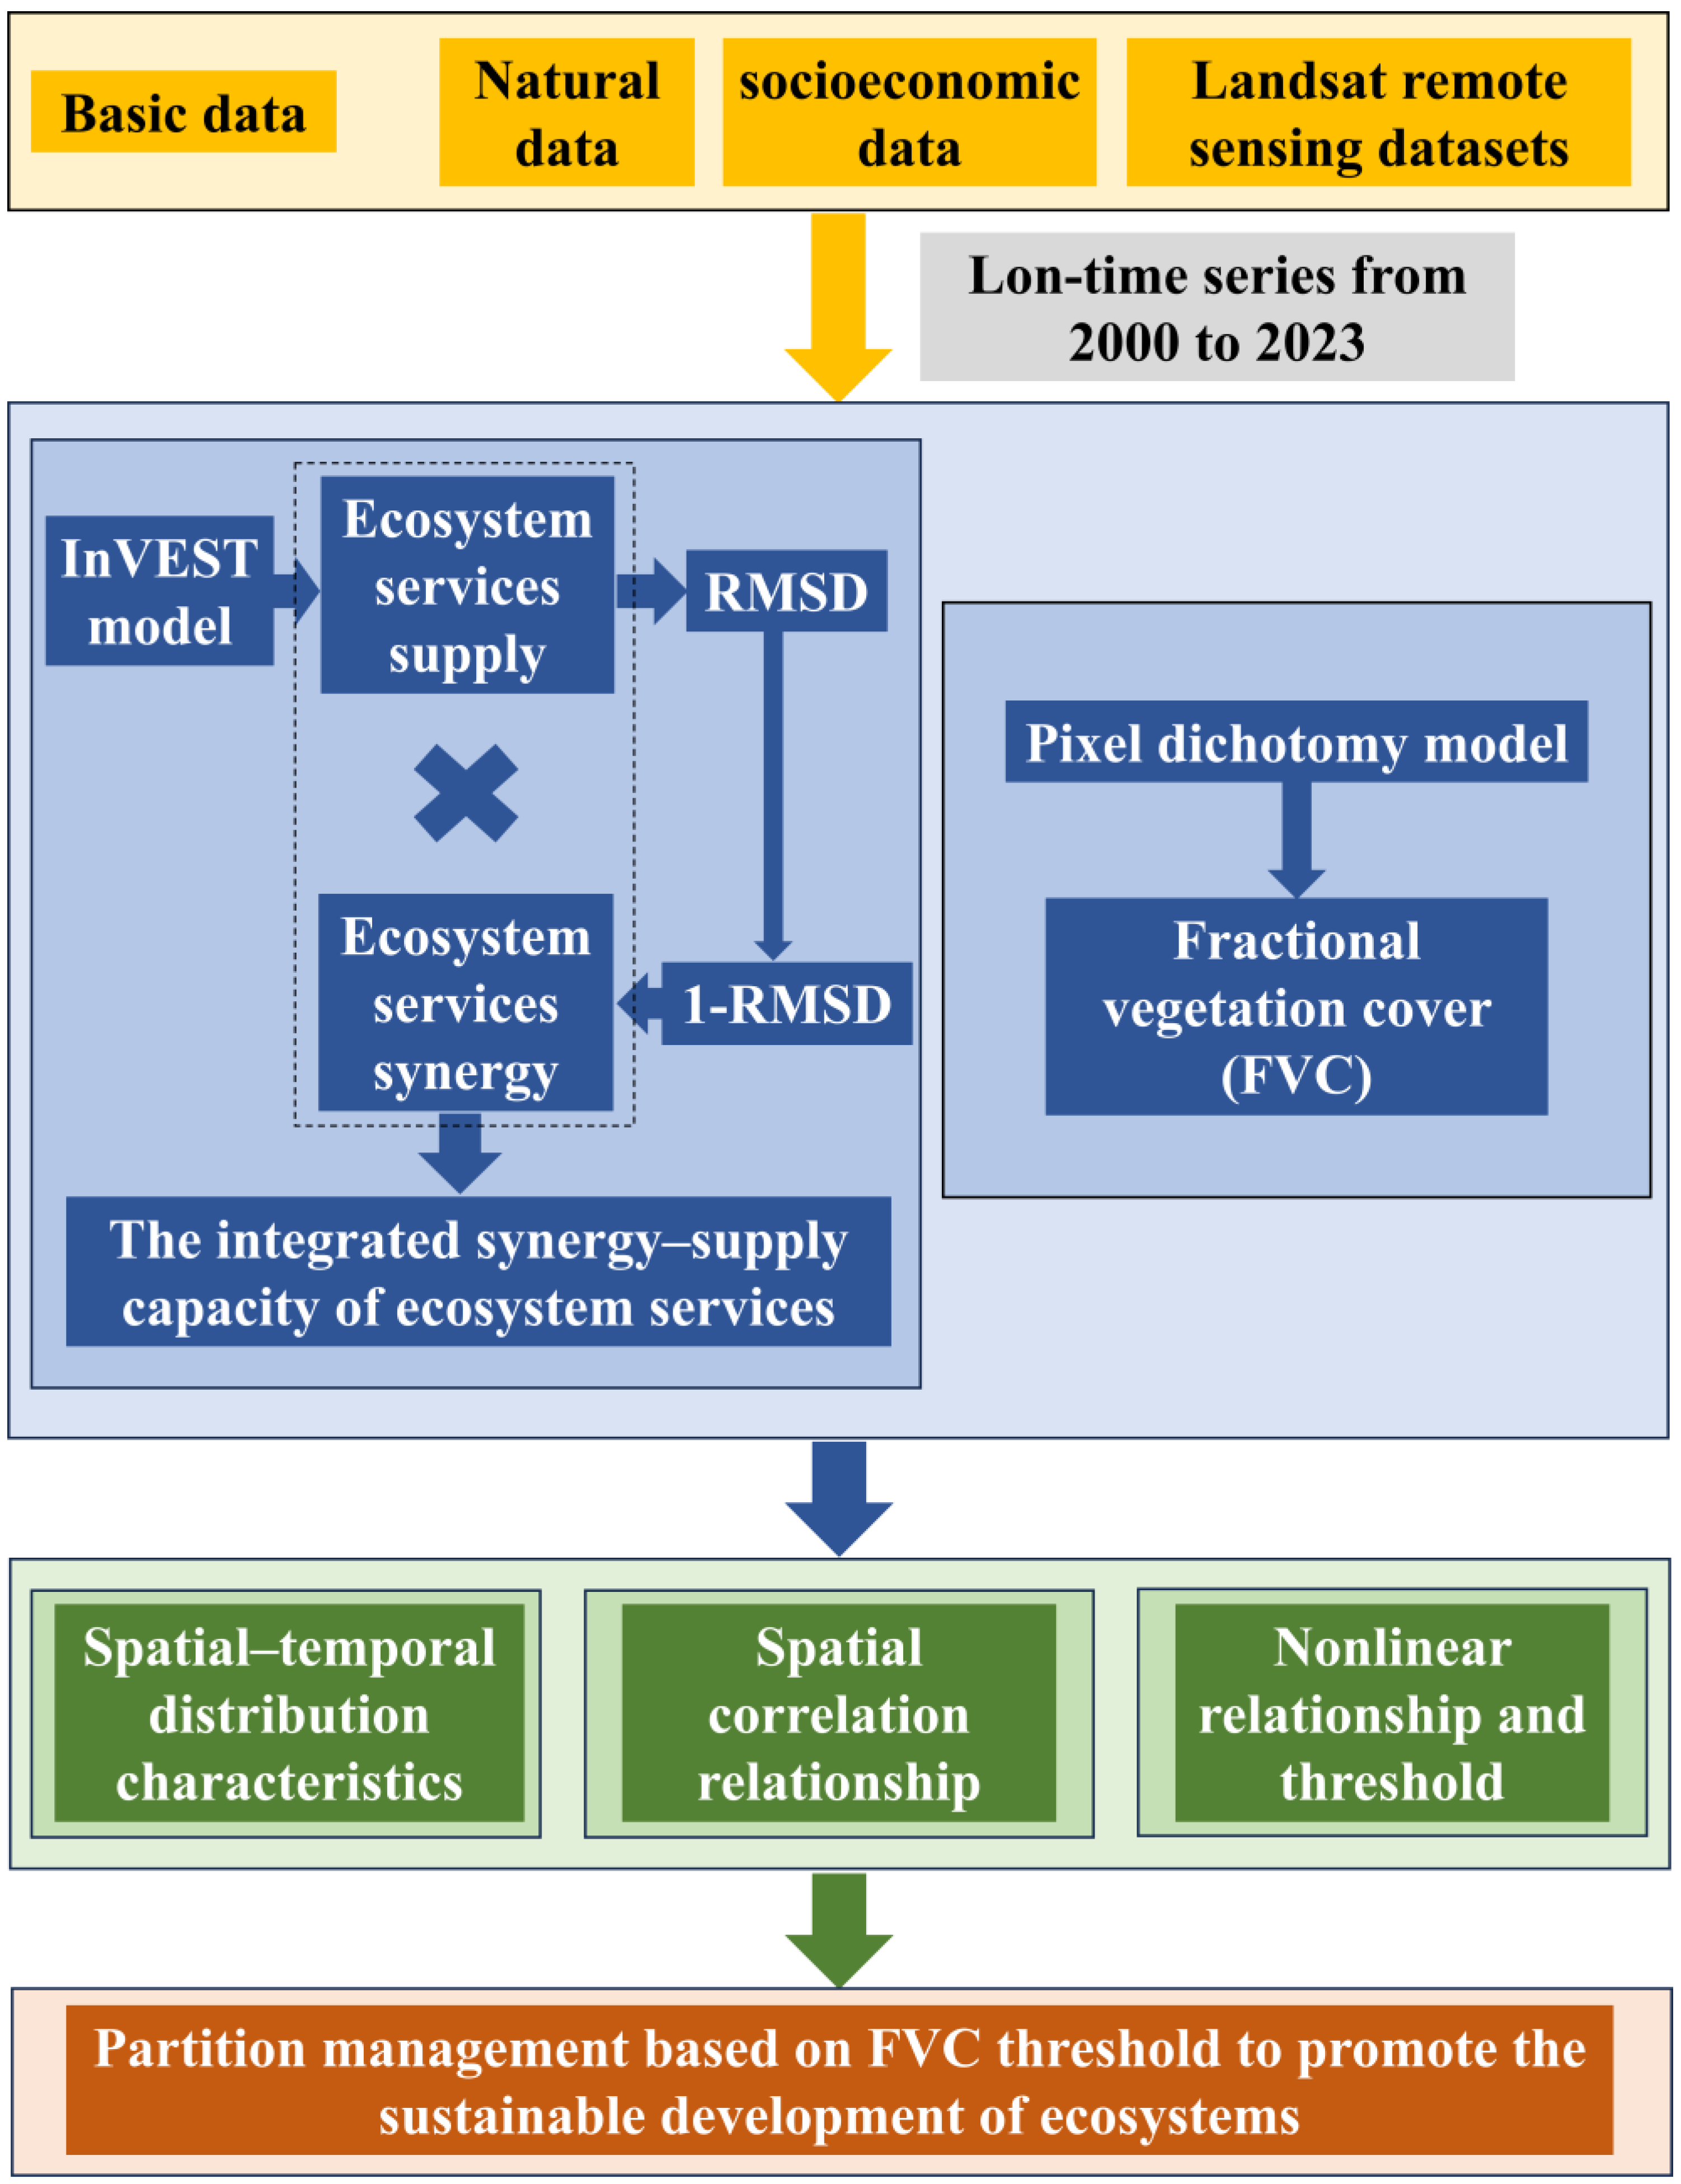
Figure 1. Research framework diagram.
Forests 16 00587 g001
Figure 2. Location of the study region.
Forests 16 00587 g002
Figure 3. The meaning of trade-off relationships among ecosystem services and integrated synergy–supply capacity of ecosystem services in a two-dimensional coordinate system (modified from references [28,32]). ES-1 and ES-2 represent the normalized values of the ecosystem service 1 and ecosystem service 2, respectively. A, B, C, and D represent coordinate points for different combinations of ESs. The perpendicular distance from each point to the 1:1 baseline (on the line, the trade-off is zero), such as AA’, represents the degree of trade-off (RMSD) for the combination of ESs. The farther the distance, the greater the degree of trade-off, and the smaller the degree of synergy (1-RMSD). The trade-off degrees for total ESs corresponding to each point in the Figure 3 are ranked as AA’ = BB’ > CC’ = DD’.
Forests 16 00587 g003
Figure 4. Constraint Line Diagram (modified from reference [37]).
Forests 16 00587 g004
Figure 5. Spatial distribution and trends of fractional vegetation cover in Ji County. (a) Spatial distribution of multi-year average values of fractional vegetation cover during 2000–2023; (b) percentage of land use types on different fractional vegetation cover levels; (c) trends of fractional vegetation cover and the area proportion of different trend types; (d) percentage of land use types on different fractional vegetation cover trend types. HSD denotes highly significant decreased, SD denotes significant decreased, NSD denotes no significant decreased, NC denotes no changed, NSI denotes no significant increased, SI denotes significant increased, HSI denotes highly significant increased.
Forests 16 00587 g005
Figure 6. Spatial distribution and trends of integrated synergy–supply capacity of ecosystem services in Ji County. (a) Spatial distribution of multi-year average values of integrated synergy–supply capacity of ecosystem services during 2000–2023; (b) percentage of land use types on different integrated synergy–supply capacity of ecosystem services levels; (c) trends of integrated synergy–supply capacity of ecosystem services and the area proportion of different trend types; (d) percentage of land use types on different integrated synergy–supply capacity of ecosystem services trend types. HSD denotes highly significant decreased, SD denotes significant decreased, NSD denotes no significant decreased, NC denotes no changed, NSI denotes no significant increased, SI denotes significant increased, HSI denotes highly significant increased.
Forests 16 00587 g006
Figure 7. Spatial correlation between the fractional vegetation cover and the integrated synergy–supply capacity of ecosystem services in Ji County. (a) Spatial distribution of spatial agglomeration types; (b) percentage of spatial agglomeration types. The * denotes p < 0.05, the Insignificant denotes p > 0.05.
Forests 16 00587 g007
Figure 8. Nonlinear relationship between fractional vegetation cover and the integrated synergy–supply capacity of ecosystem services: (a) regional; (b) forest land; (c) grassland. Abbreviations: coefficient of determination (R2).
Forests 16 00587 g008
Table 1. Sources of the datasets used in this study.
Data TypesFormatResolutionData Source
Fractional vegetation cover (FVC) dataRaster30 mGoogle Earth Engine platform
(https://code.earthengine.google.com (accessed on 5 May 2024))
Land use dataRaster30 mGoogle Earth Engine platform
(https://code.earthengine.google.com (accessed on 7 March 2024))
Digital elevation model (DEM)Raster30 mNational Aeronautics and Space Administration Digital Elevation Model (NASADEM)
(https://lpdaac.usgs.gov/products/nasadem_hgtv001/ (accessed on 19 October 2023))
PrecipitationRaster1 kmNational Scientific Data Center for the Tibetan Plateau
(https://data.tpdc.ac.cn/ (accessed on 26 December 2023))
TemperatureRaster1 kmNational Scientific Data Center for the Tibetan Plateau
(https://cstr.cn/18406.11.Meteoro.tpdc.270961 (accessed on 14 January 2024))
Potential evapotranspirationRaster1 kmNational Scientific Data Center for the Tibetan Plateau
(https://data.tpdc.ac.cn/ (accessed on 1 November 2023))
Soil dataRaster1 kmHarmonized World Soil Database (HWSD)
(https://www.fao.org/soils-portal/data-hub/soil-maps-and-databases/harmonized-world-soil-database-v12/en/ (accessed on 28 October 2023))
Depth to bedrock dataRaster100 mDepth-to-bedrock map of China at resolution of 100 m
(http://globalchange.bnu.edu.cn/research/cdtb.jsp (accessed on 28 October 2023))
RoadShapfile-OpenStreetMap (OSM)
(https://www.openstreetmap.org/ (accessed on 29 October 2023))
Table 2. Ecosystem services assessment methods.
Ecosystem ServicesAbbreviationCalculation Formula
Carbon storageCS C t o t a l = ( 1 n C i a b o v e + 1 n C i b e l o w + 1 n C i d e a d + 1 n C i s o i l ) × A i
Soil conservationSC R K L S = R × K × L S
U S L E = R × K × L S × P × C
S C = R K L S U S L E
Water conservationWC Y x = 1 A E T x P x × P x
W C = min 1 , 249 V × min 1 , 0.3 D × min 1 , K s o i l 300 × Y x
D = log W a t e r   p i x e l   c o u n t S o i l _ d e p t h × P e r c e n t _ s l o p e
Habitat qualityHQ D x j = r = 1 R y = 1 Y r w r / r = 1 R w r × r y × i r x y × β x × S j r
Q x j = H j 1 D x j z D x j z + k 2
Table 3. Quantity of segmentation points and Akaike information criterion values in the restricted cubic spline model.
ClassificationQuantity of Segmentation PointsAIC Value
Regional3−793.02
4−801.94
5−799.78
Forest land3−651.07
4−676.29
5−683.68
Grassland3−826.28
4−828.89
5−838.89
Disclaimer/Publisher’s Note: The statements, opinions and data contained in all publications are solely those of the individual author(s) and contributor(s) and not of MDPI and/or the editor(s). MDPI and/or the editor(s) disclaim responsibility for any injury to people or property resulting from any ideas, methods, instructions or products referred to in the content.