
Soil Invertebrates Play Key Roles in Stage-Specific Shifts in Elevational Patterns of Litter Decomposition in Dongling Mountain, Beijing

Abstract
1. Introduction
2. Materials and Methods
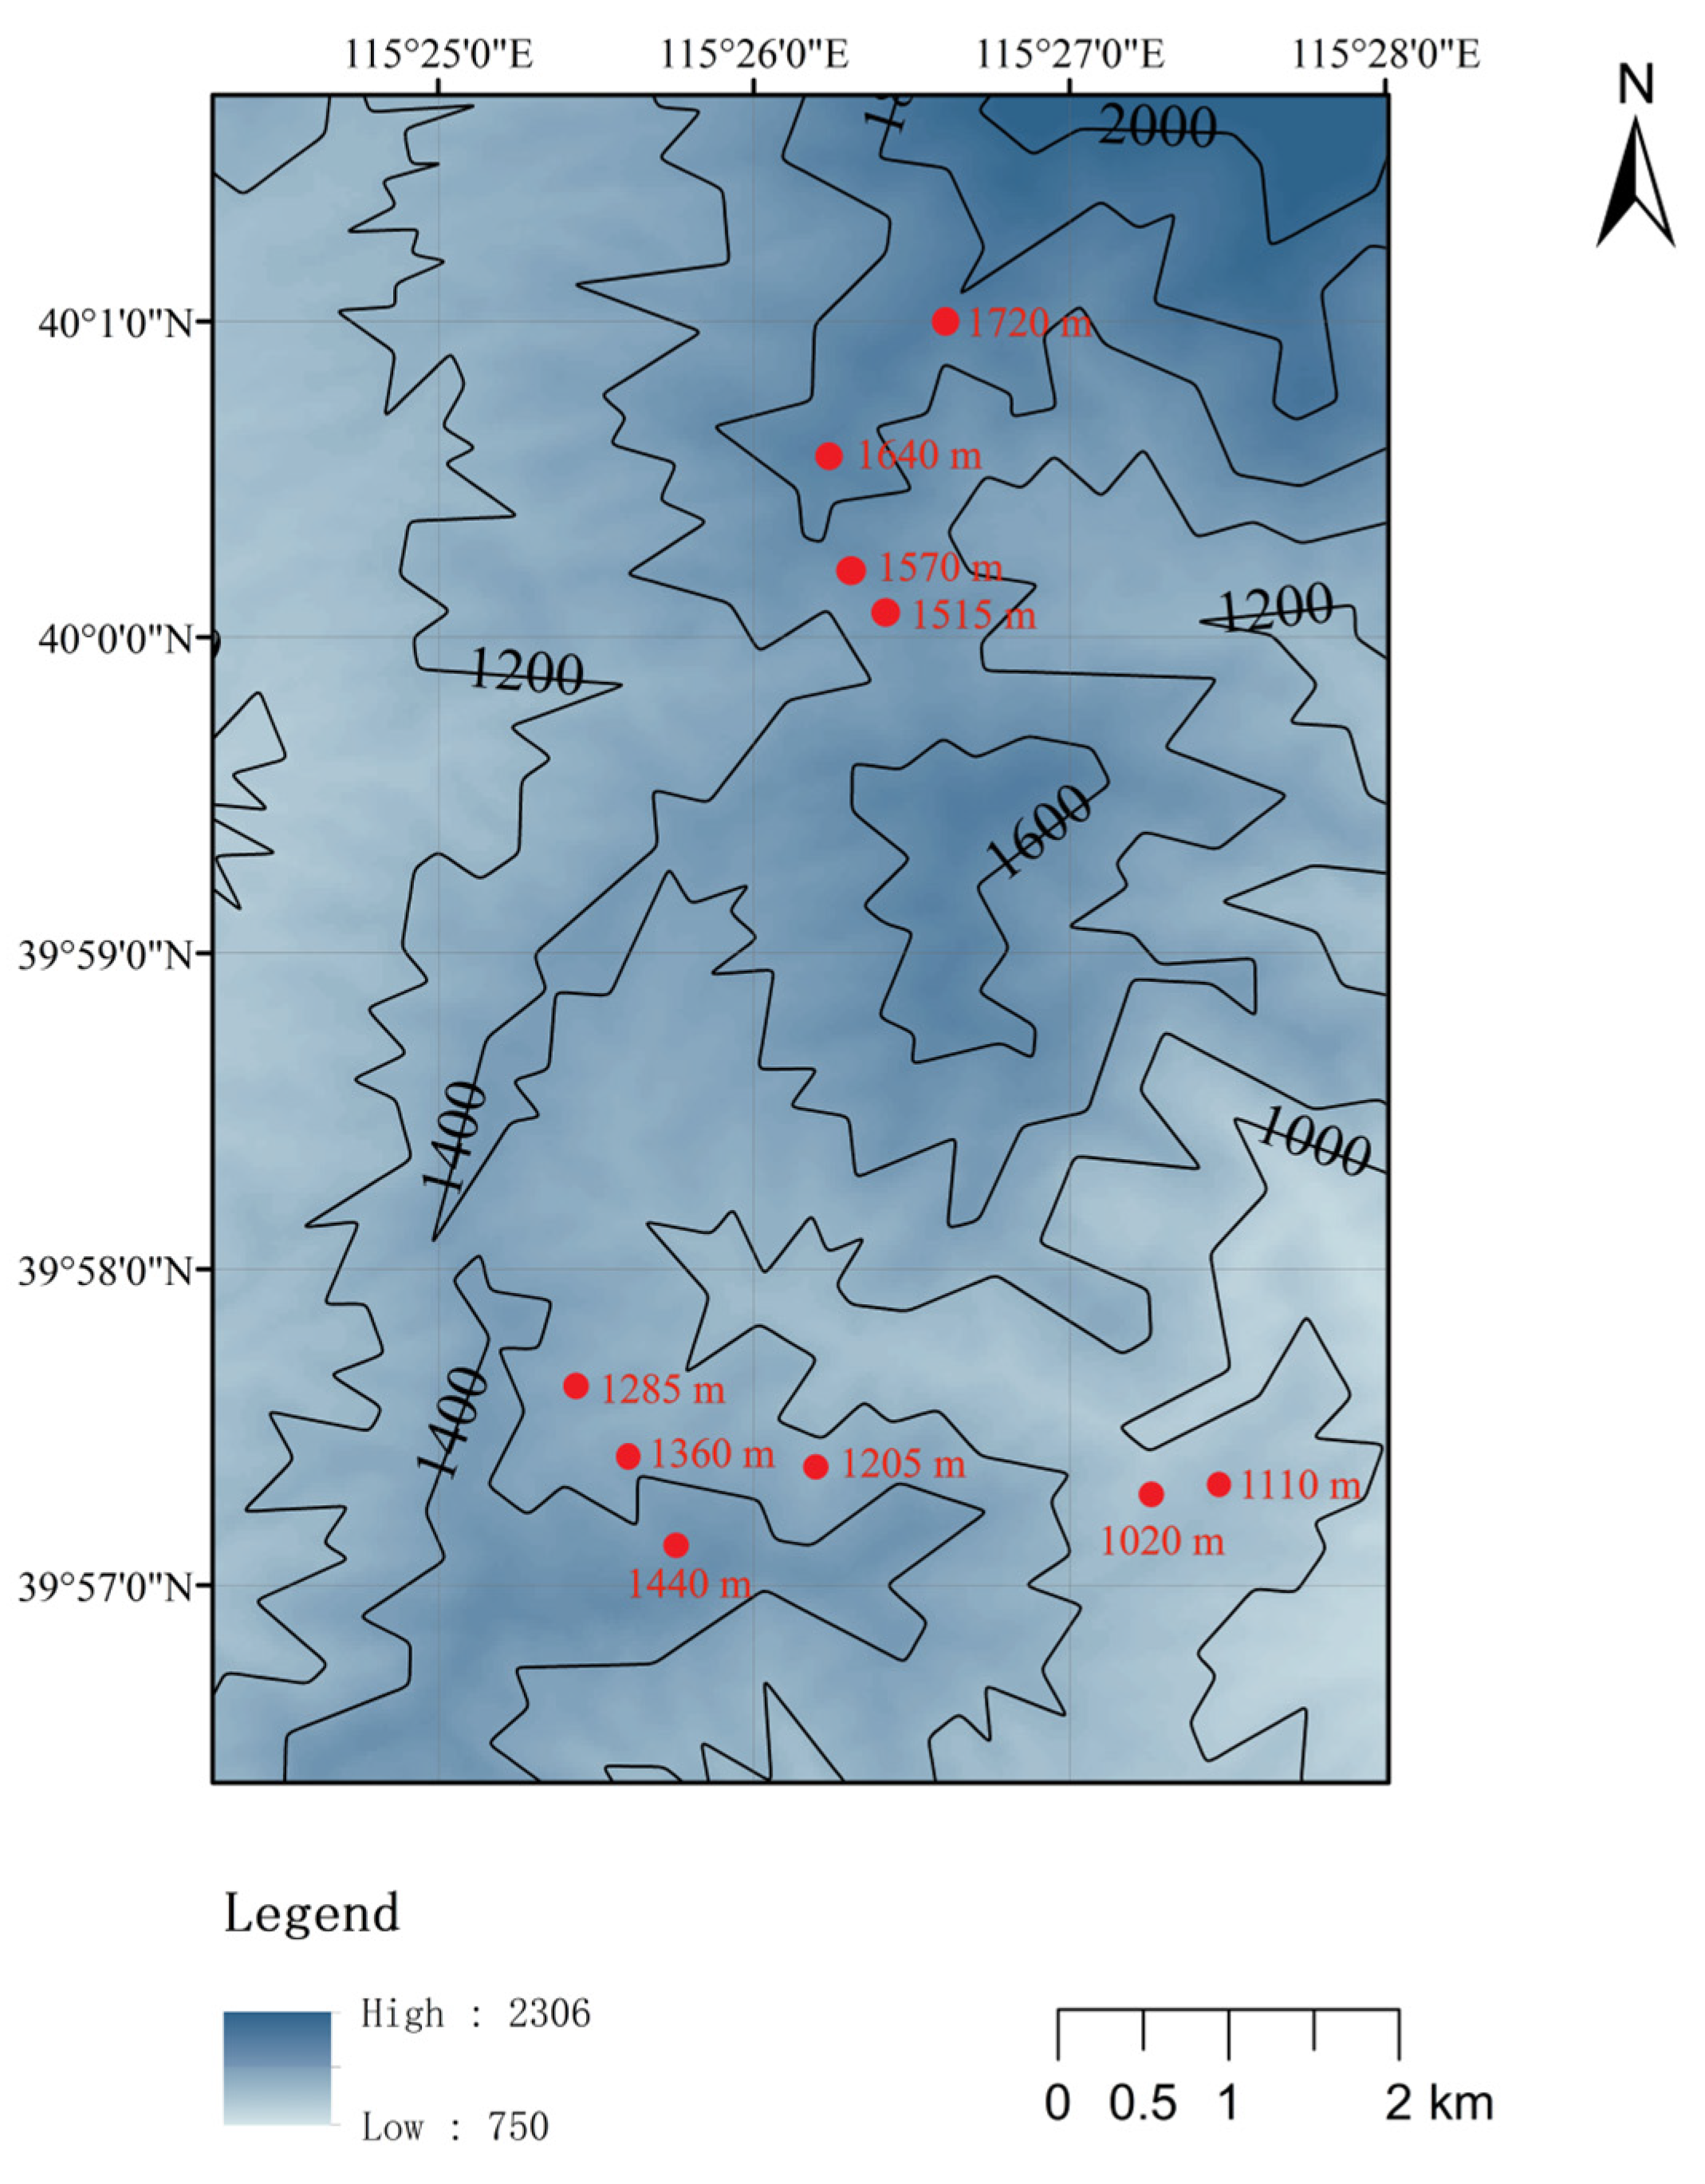
2.1. Site Description
2.2. Sample Collection and Processing
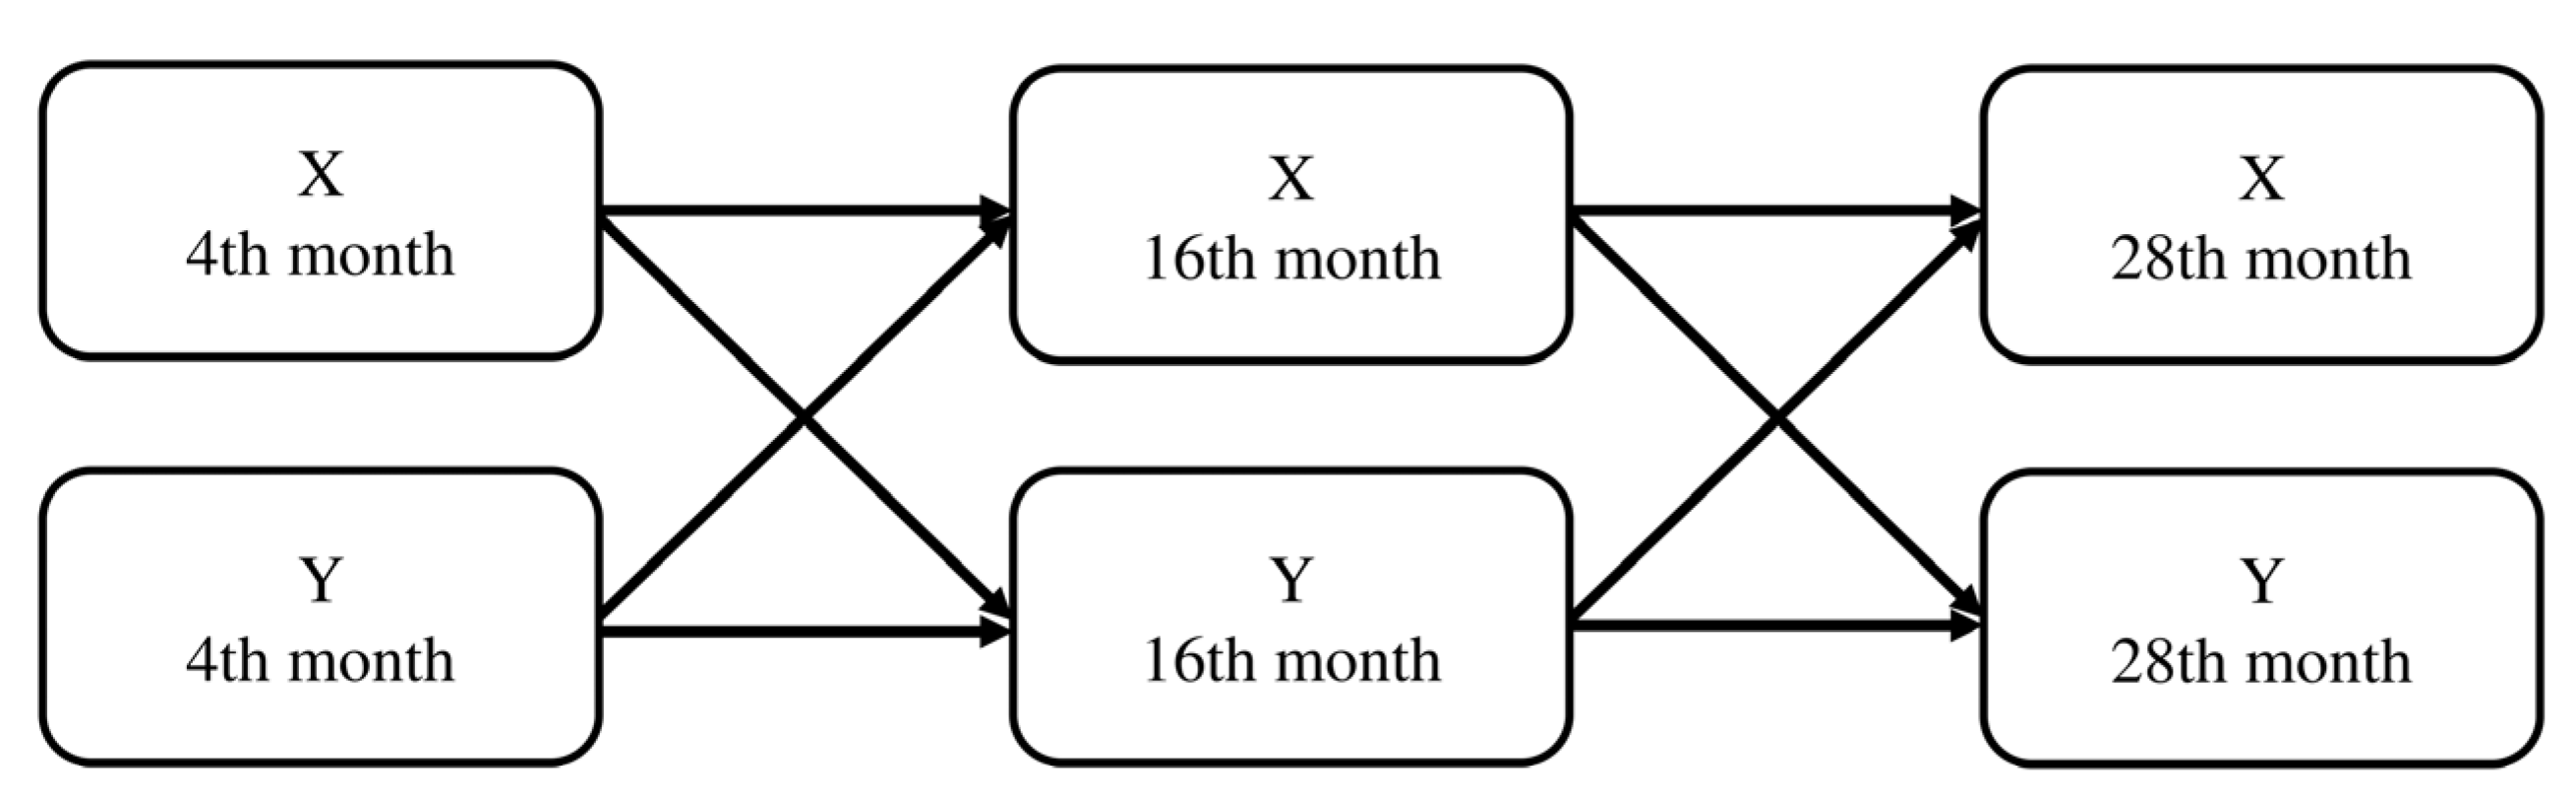
2.3. Data Analysis
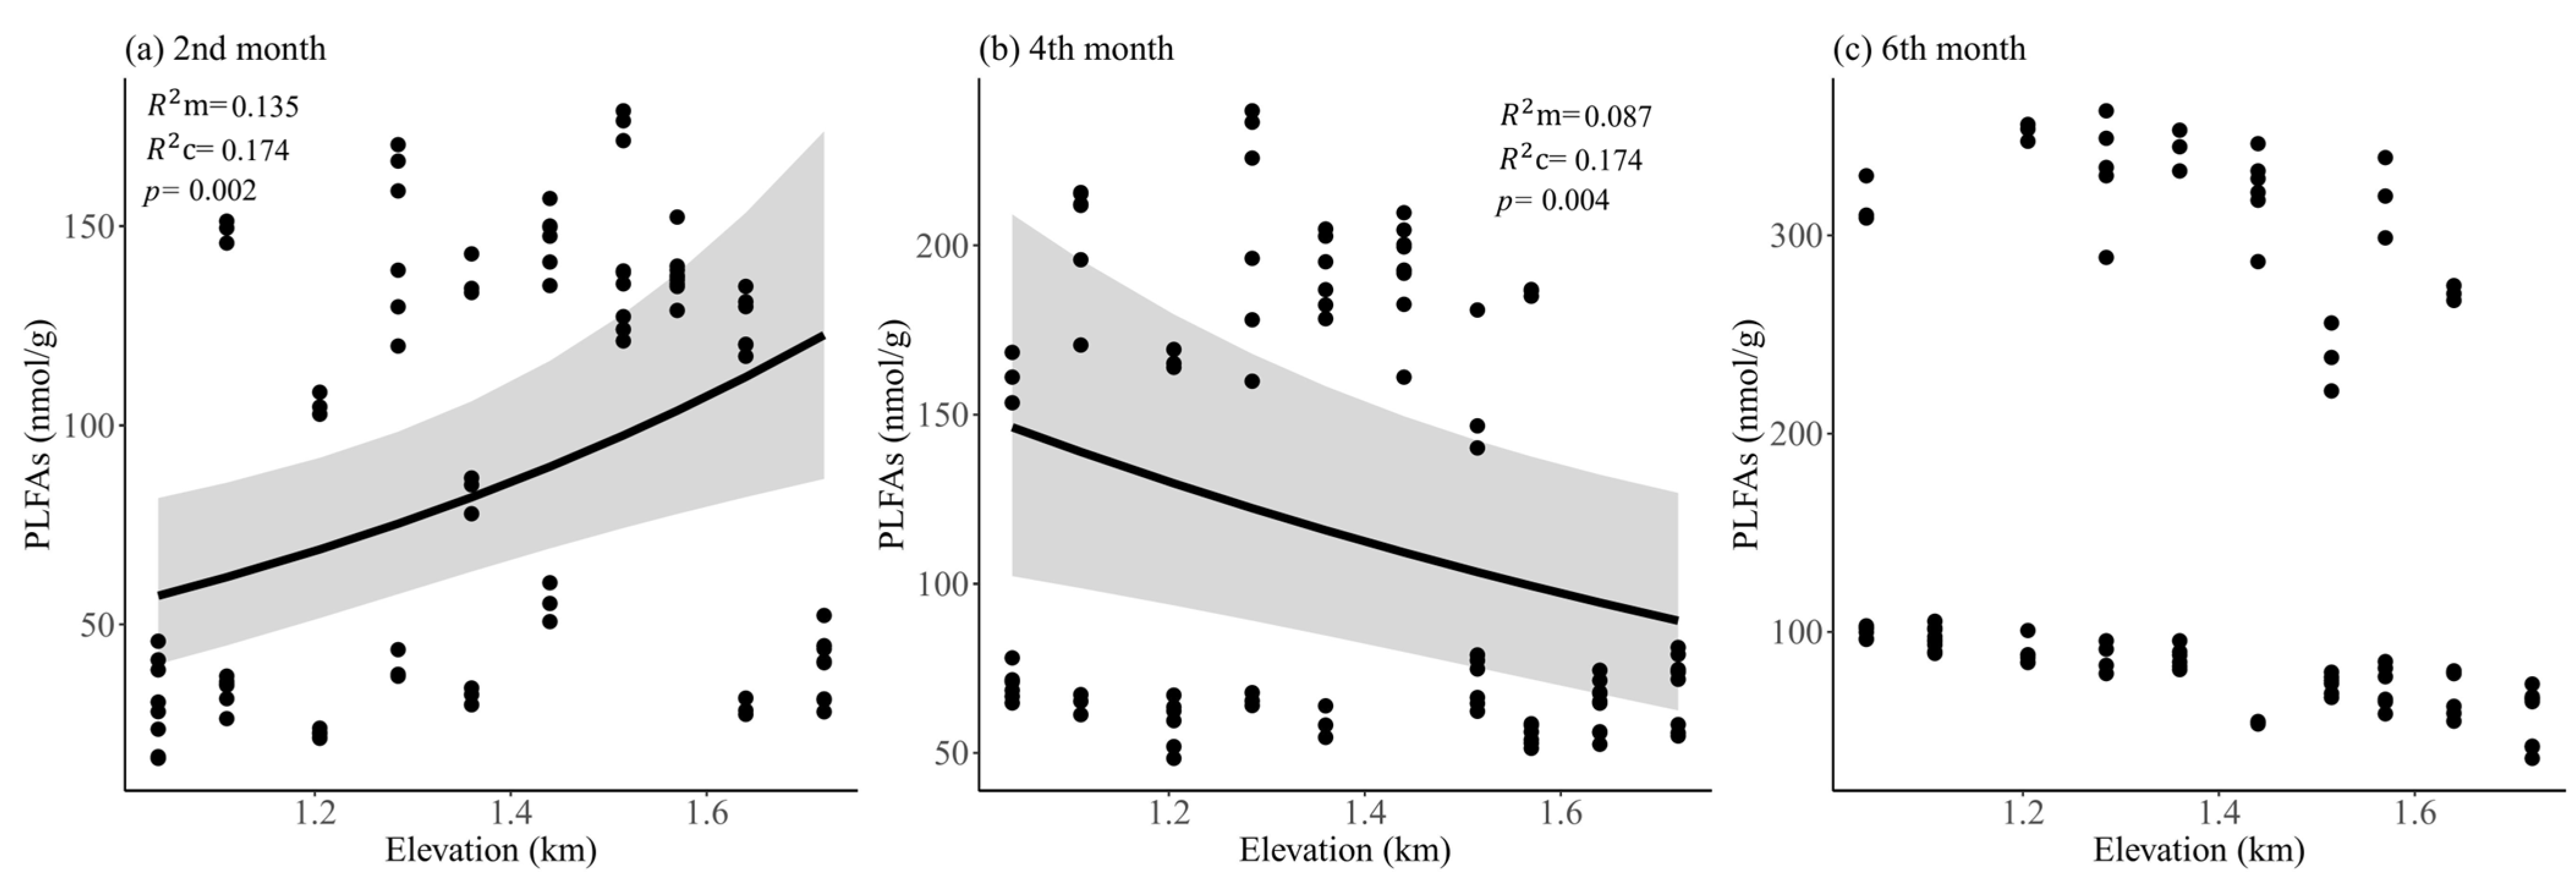
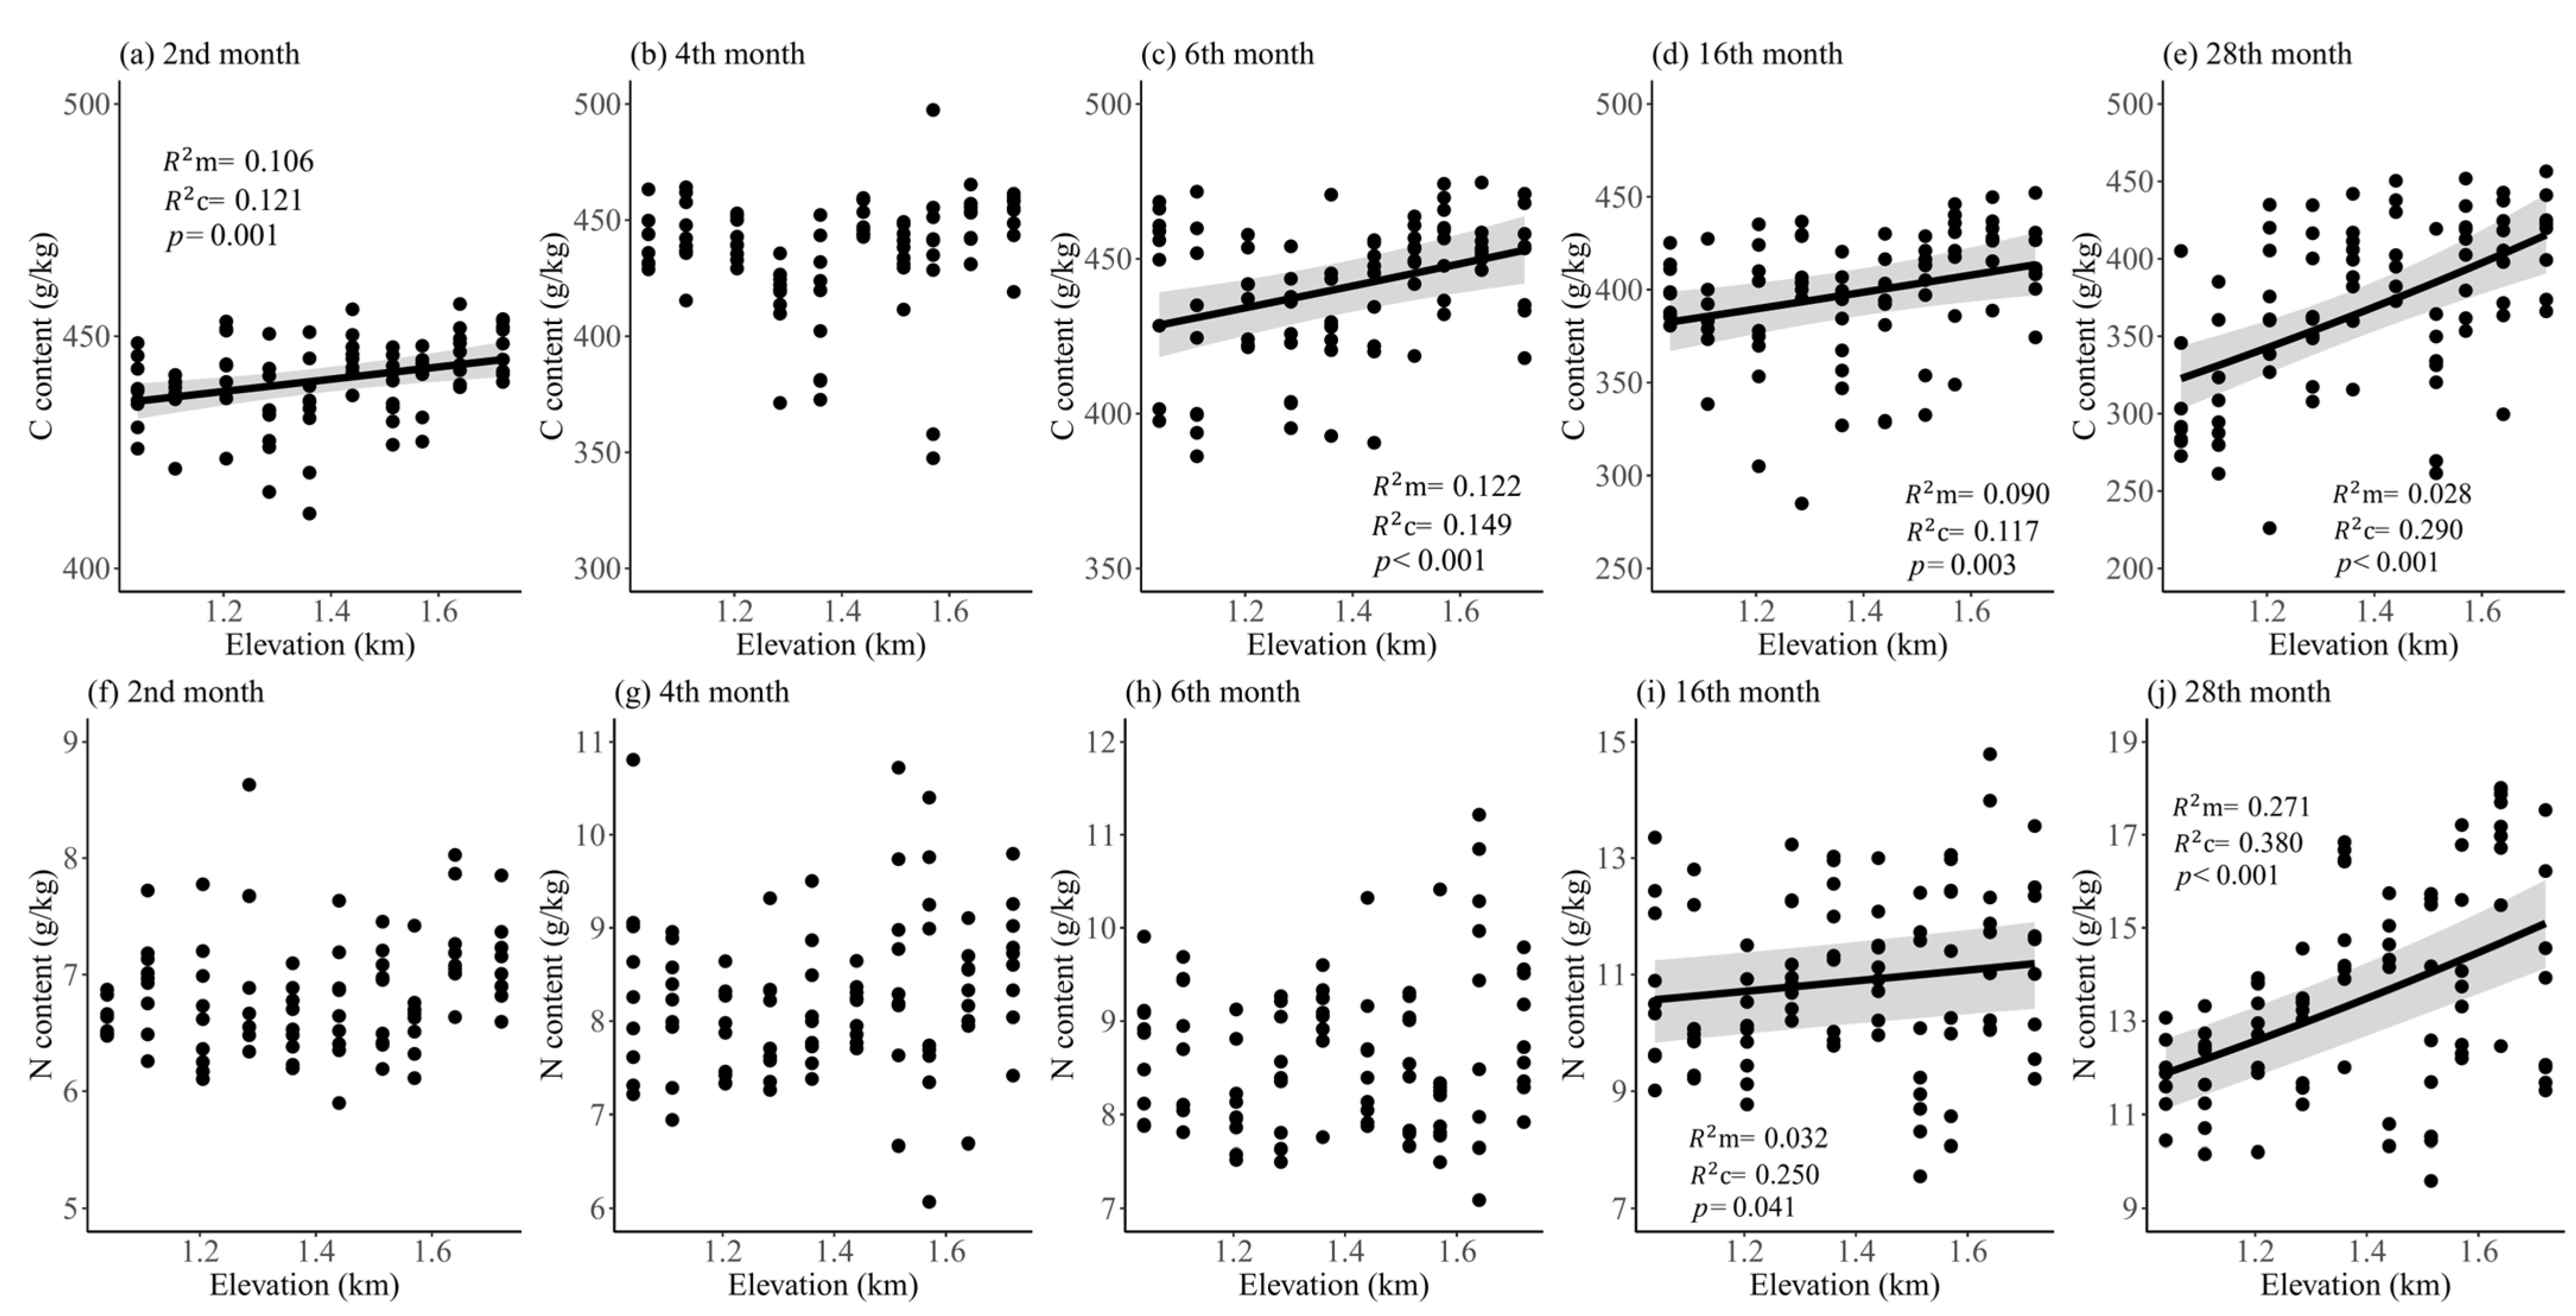
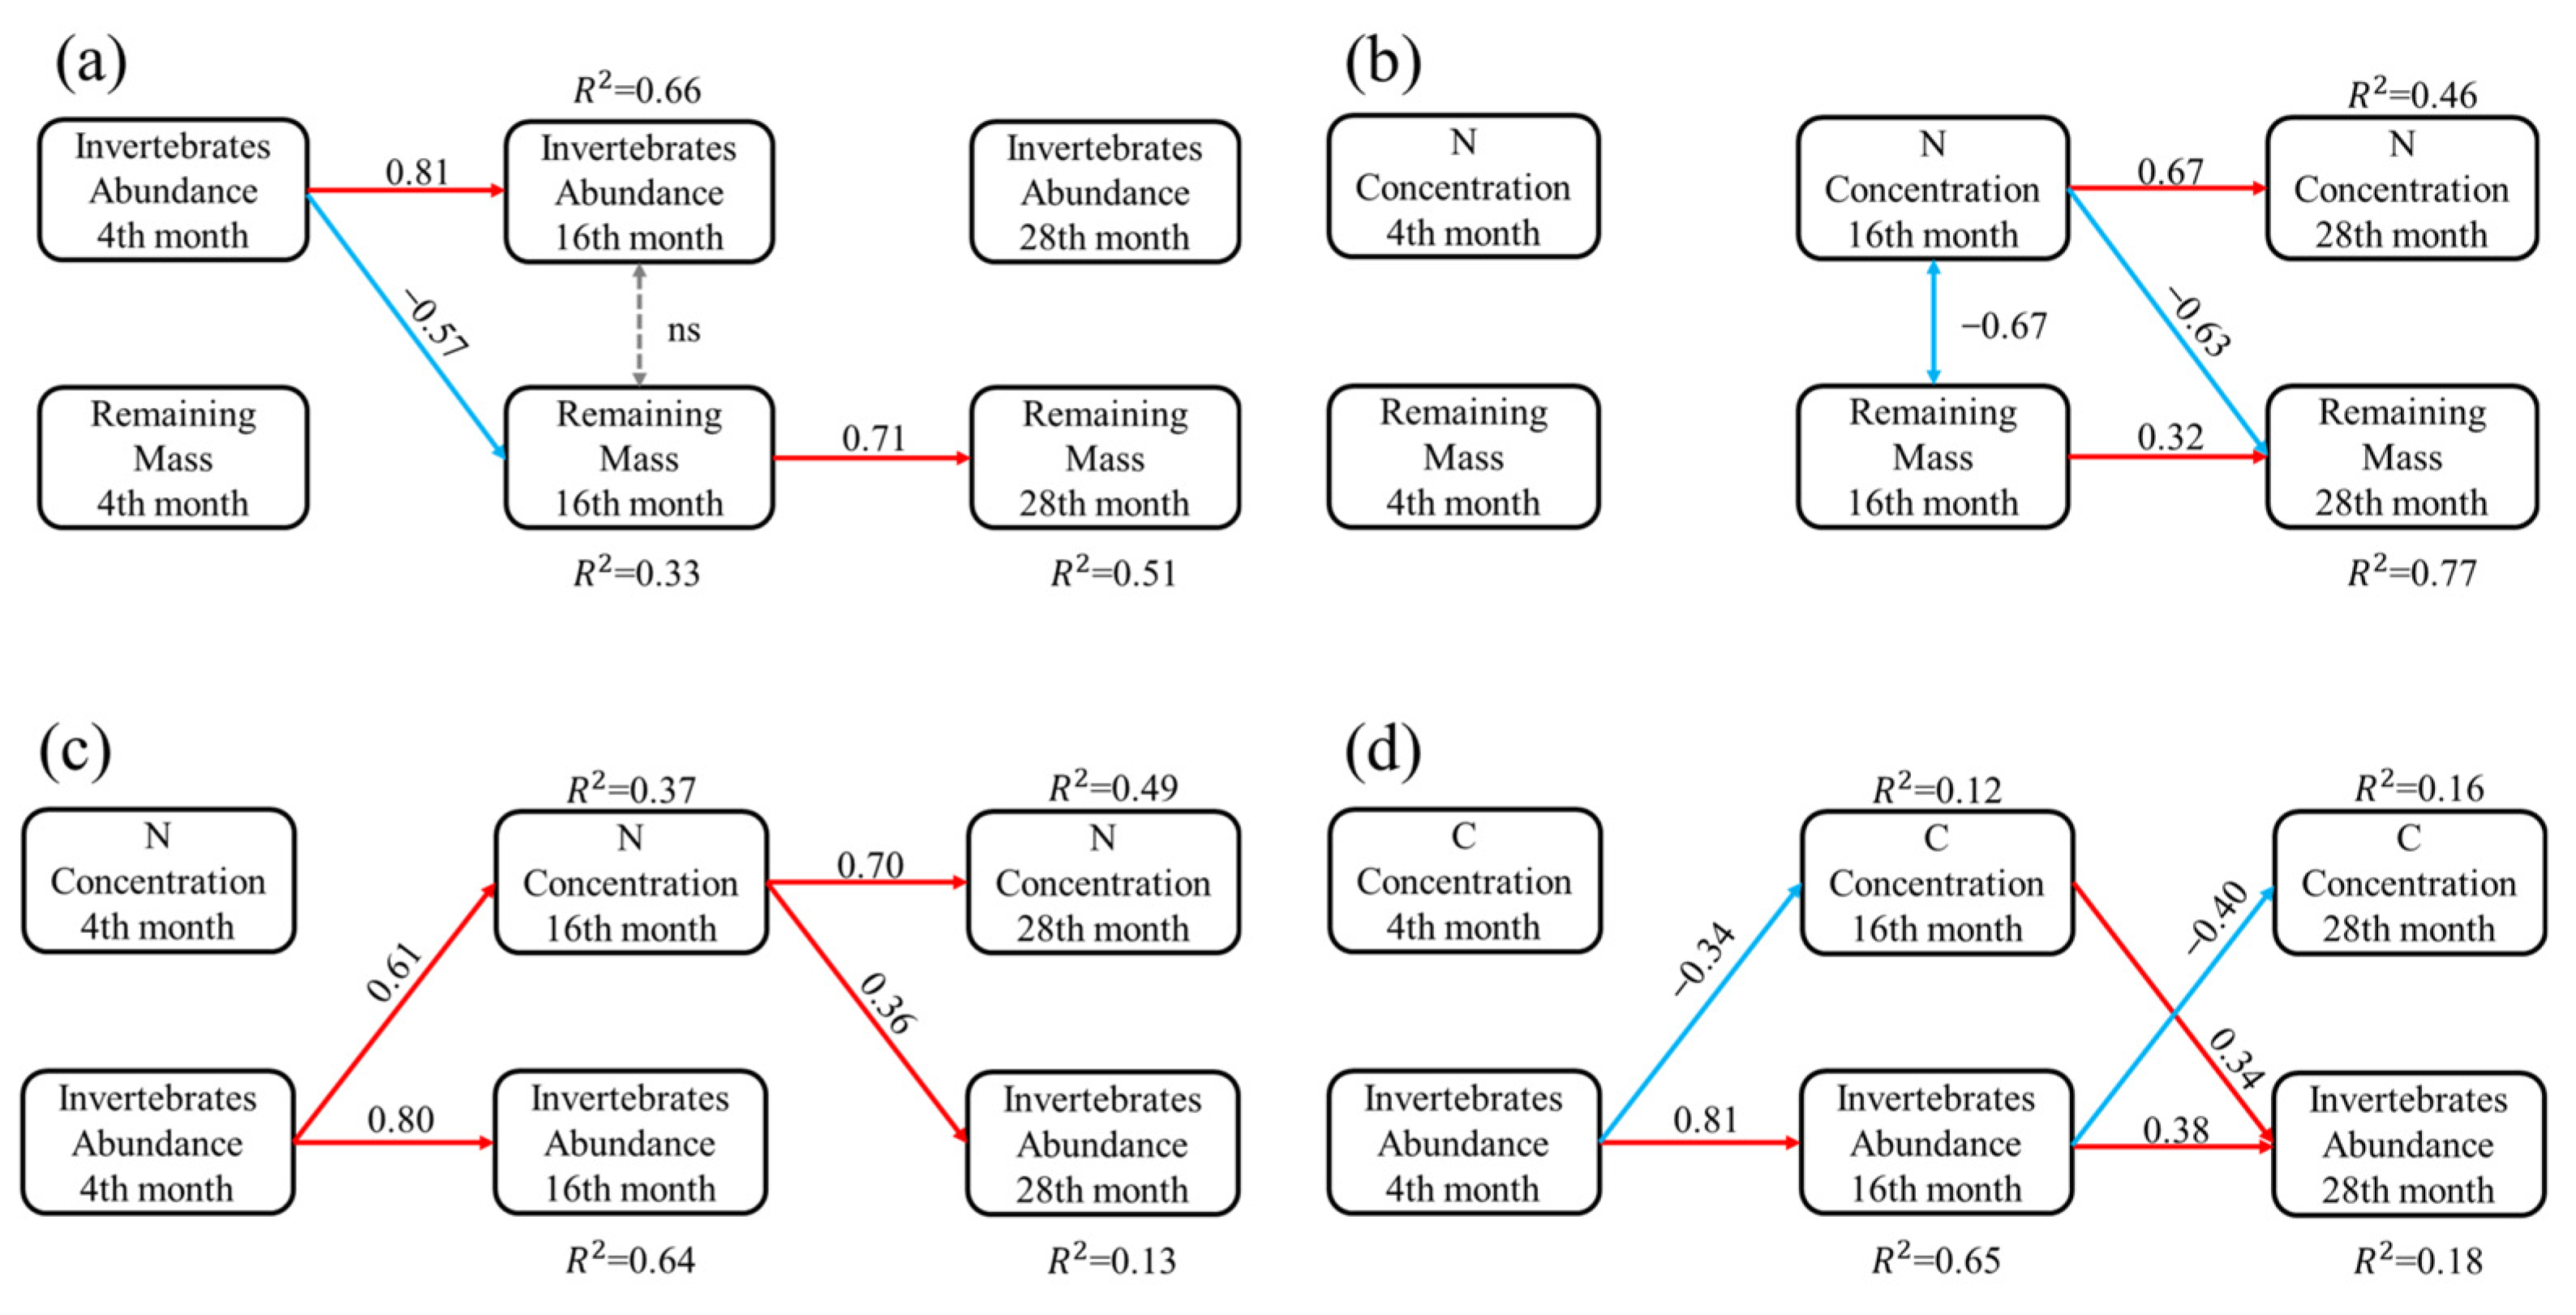
3. Results
4. Discussion
5. Conclusions
Author Contributions
Funding
Data Availability Statement
Acknowledgments
Conflicts of Interest
Appendix A

| Class | Order | Family | Abundance (Specimens) | Percent (%) |
|---|---|---|---|---|
| Oligochaeta | Haplotaxida | Lumbricidae | 185 | 1.056 |
| Tubificida | Enchytraeidae | 22 | 0.126 | |
| Arachnida | Araneae | Clubionidae | 11 | 0.063 |
| Heteropodidae | 24 | 0.137 | ||
| Agelenidae | 4 | 0.023 | ||
| Oonopidae | 12 | 0.068 | ||
| Zodariidae | 4 | 0.023 | ||
| Gnaphosidae | 7 | 0.040 | ||
| Salticidae | 1 | 0.006 | ||
| Titanoecidae | 1 | 0.006 | ||
| Pseudoscorpiones | Atemnidae | 34 | 0.194 | |
| Cheiridiidae | 2 | 0.011 | ||
| Acariformes | 121 | 0.691 | ||
| Parasiformes | 6286 | 35.879 | ||
| Oribatida | Ptychoid Oribatida mites | 70 | 0.400 | |
| Macropyline Oribatida mites | 783 | 4.469 | ||
| Apterogasterine Oribatida mites | 1207 | 6.889 | ||
| Pterogasterine Oribatida mites | 109 | 0.622 | ||
| Malacostraca | Isopoda | Armadillidiidae | 8 | 0.046 |
| Porcellionidae | 9 | 0.051 | ||
| Diplopoda | Spirostreptida | Harpagophoridae | 2 | 0.011 |
| Spirobolidae | Pseudospirobolellidae | 1 | 0.006 | |
| Chilopoda | Lithobiomorpha | 69 | 0.394 | |
| Geophilomorpha | 2 | 0.011 | ||
| Collembola | Collembola | Isotomidae | 1812 | 10.342 |
| Onychiuridae | 1303 | 7.437 | ||
| Tomoceridae | 506 | 2.888 | ||
| Neanridae | 807 | 4.606 | ||
| Sminthuridae | 100 | 0.571 | ||
| Entomobryidae | 2572 | 14.680 | ||
| Diplura | Diplura | Campodeidae | 1 | 0.006 |
| Symphyla | Symphyla | Scolopendrellidae | 2 | 0.011 |
| Scutigerellidae | 13 | 0.074 | ||
| Insecta | Hemiptera | Meenoplidae | 5 | 0.029 |
| Cicadidae | 2 | 0.011 | ||
| Cicadellidae | 24 | 0.137 | ||
| Pyrrhocoridae | 4 | 0.023 | ||
| Hebridae | 6 | 0.034 | ||
| Cydnidae | 4 | 0.023 | ||
| Tingidae | 2 | 0.011 | ||
| Coccoidea | 16 | 0.091 | ||
| Aphididae | 40 | 0.228 | ||
| Dermaptera | Chelisochidae | 12 | 0.068 | |
| Thysanoptera | Phlaeothripidae | 7 | 0.040 | |
| Hymenoptera | Pergidae | 5 | 0.029 | |
| Formicidae | 43 | 0.245 | ||
| Neuroptera | Chrysopidae | 3 | 0.017 | |
| Psocoptera | Epipsocidae | 7 | 0.040 | |
| Liposcelididae | 5 | 0.029 | ||
| Amphientomidae | 364 | 2.078 | ||
| Diptera (larvae) | Platypezidae | 34 | 0.194 | |
| Pachyneuridae | 1 | 0.006 | ||
| Tipulidae | 9 | 0.051 | ||
| Scatopsidae | 19 | 0.108 | ||
| Bombyliidae | 3 | 0.017 | ||
| Sciaridae | 11 | 0.063 | ||
| Bibionidae | 2 | 0.011 | ||
| Ceratopogonidae | 1 | 0.006 | ||
| Empididae | 6 | 0.034 | ||
| Mycetophilidae | 30 | 0.171 | ||
| Phoridae | 143 | 0.816 | ||
| Diadocididae | 447 | 2.551 | ||
| Hesperinidae | 18 | 0.103 | ||
| Dolichopodidae | 13 | 0.074 | ||
| Lepidoptera (larvae) | Hepialidae | 10 | 0.057 | |
| Geometridae | 1 | 0.006 | ||
| Limacodidae | 21 | 0.120 | ||
| Tortricidae | 21 | 0.120 | ||
| Psychidae | 2 | 0.011 | ||
| Coleoptera | Cantharidae | 22 | 0.126 | |
| Carabidae | 1 | 0.006 | ||
| Geotrupidae | 1 | 0.006 | ||
| Cicindelidae | 1 | 0.006 | ||
| Scarabaeoidae | 8 | 0.046 | ||
| Silvanidae | 1 | 0.006 | ||
| Cleridae | 8 | 0.046 | ||
| Elateridae | 1 | 0.006 | ||
| Tenebrionidae | 2 | 0.011 | ||
| Dermestidae | 2 | 0.011 | ||
| Ladybirds | 1 | 0.006 | ||
| Scydmaeninae | 1 | 0.006 | ||
| Curculionidae | 6 | 0.034 | ||
| Mycetophagidae | 6 | 0.034 | ||
| Meloidae | 1 | 0.006 | ||
| Pselaphidae | 1 | 0.006 | ||
| Staphlinidae | 11 | 0.063 | ||
| Ptiliidae | 1 | 0.006 | ||
| Silphidae | 14 | 0.080 | ||
| Total | 17,520 | 100.000 |
| Classifications for PLFAs | PLFA Signatures | References |
|---|---|---|
| G+ | i15:0, a15:0, i16:0, i17:0, a17:0 | [39,66] |
| G− | 15:1ω6c, 16:1ω9c, 16:1ω7c, 17:1ω8c, 18:1ω5c, 15:0 3-OH, cy17:0, cy19:0 | [40,66] |
| F | 18:1ω9, 18:2ω6, 9 | [67,68] |
| B | G+, G−, 14:0, 15:0, 16:0, 17:0, 18:0, 20:0, i15:1, i16:1, i17:1, 16:1 2-OH | [41,68,69] |
| Factors | Correlation Coefficient | |
|---|---|---|
| D1 | D2 | |
| C Content | −0.17288 | 0.27453 |
| N Content | 0.195266 | 0.27992 |
| Abundance | 0.42561 | −0.02923 |
References
- Felipe, G.S. Loblolly pine needle decomposition and nutrient dynamics as affected by irrigation, fertilization, and substrate quality. For. Ecol. Manag. 2001, 152, 85–96. [Google Scholar] [CrossRef]
- Swift, M.J.; Heal, O.W.; Anderson, J.M. Decomposition in Terrestrial Ecosystems; University of California Press: Oakland, CA, USA, 1979. [Google Scholar]
- Delgado-Baquerizo, M.; Reich, P.B.; Garcia-Palacios, P.; Milla, R. Biogeographic bases for a shift in crop C:N:P stoichiometries during domestication. Ecol. Lett. 2016, 19, 564–575. [Google Scholar] [CrossRef] [PubMed]
- Zhang, J.; Qin, T.; Xiao, S.; Yan, S.; Tian, Z.; Li, Y. Research Advances on Carbon-Water Relationship of Forest Litter-Soil Interface. Pol. J. Environ. Stud. 2022, 31, 3919–3928. [Google Scholar]
- Ingrid, K.-K. The macromolecular organic composition of plant and microbial residues as inputs to soil organic matter. Soil. Biol. Biochem. 2002, 34, 139–162. [Google Scholar] [CrossRef]
- Lal, R. Soil Carbon Sequestration Impacts on Global Climate Change and Food Security. Science 2004, 304, 1623–1627. [Google Scholar] [CrossRef] [PubMed]
- Vitousek, P.; Mooney, H.; Lubchenco, J.; Melillo, J. Human Domination of Earth’s Ecosystems. Science 1997, 277, 494–499. [Google Scholar] [CrossRef]
- Garcia-Palacios, P.; Shaw, E.A.; Wall, D.H.; Hattenschwiler, S. Temporal dynamics of biotic and abiotic drivers of litter decomposition. Ecol. Lett. 2016, 19, 554–563. [Google Scholar] [CrossRef]
- Gholz, H.L.; Wedin, D.A.; Smitherman, S.M.; Harmon, M.E.; Parton, W.J. Long-term dynamics of pine and hardwood litter in contrasting environments: Toward a global model of decomposition. Glob. Change Biol. 2001, 6, 751–765. [Google Scholar] [CrossRef]
- Trofymow, J.A.; Moore, T.R.; Titus, B.; Prescott, C.; Morrison, I.; Siltanen, M.; Smith, S.; Fyles, J.; Wein, R.; Camiré, C.; et al. Rates of litter decomposition over 6 years in Canadian forests: Influence of litter quality and climate. Can. J. For. Res. 2002, 32, 789–804. [Google Scholar] [CrossRef]
- Tláskal, V.; Voříšková, J.; Baldrian, P. Bacterial succession on decomposing leaf litter exhibits a specific occurrence pattern of cellulolytic taxa and potential decomposers of fungal mycelia. FEMS Microbiol. Ecol. 2016, 92, fiw177. [Google Scholar] [CrossRef]
- Chassain, J.; Gonod, L.V.; Chenu, C.; Joimel, S. Role of different size classes of organisms in cropped soils: What do litterbag experiments tell us? A meta-analysis. Soil Biol. Biochem. 2021, 162, 108394. [Google Scholar] [CrossRef]
- Frouz, J. Effects of soil macro- and mesofauna on litter decomposition and soil organic matter stabilization. Geoderma 2018, 332, 161–172. [Google Scholar] [CrossRef]
- Edward, K.T.; Ryan, O.D.; Daniel, E.; Elizabeth, C.; James, T. Water-soluble luminal contents of the gut of the earthworm Lumbricus terrestris L. and their physiological significance. Comp. Biochem. Physiol. Part A Mol. Integr. Physiol. 2001, 129, 345–353. [Google Scholar] [CrossRef]
- Cárcamo, H.A.; Prescott, C.E.; Chanway, C.P.; Abe, T.A. Do soil fauna increase rates of litter breakdown and nitrogen release in forests of British Columbia, Canada? Can. J. For. Res. 2001, 31, 1195–1204. [Google Scholar] [CrossRef]
- Zan, P.; Sun, T.; Mao, Z. Effects of soil fauna on litter decomposition using field microcosms across 16 co-occurring temperate tree species. Aust. For. 2021, 84, 33–38. [Google Scholar] [CrossRef]
- Zan, P.; Mao, Z.; Sun, T. Effects of soil fauna on litter decomposition in Chinese forests: A meta-analysis. PeerJ 2022, 10, e12747. [Google Scholar] [CrossRef]
- Rui, Y.; Qun, L.; Shanyi, T.; Anton, P.; Biao, Z.; Kaijun, Y.; Zhiji, L.; Liyan, Z.; Bo, T.; Li, Z.; et al. Nitrogen deposition stimulates decomposition via changes in the structure and function of litter food webs. Soil Biol. Biochem. 2022, 166, 108522. [Google Scholar] [CrossRef]
- Christian, K. The use of ‘altitude’ in ecological research. Trends Ecol. Evol. 2007, 22, 569–574. [Google Scholar] [CrossRef]
- Chen, D.; Yu, M.; González, G.; Zou, X.; Gao, Q. Climate Impacts on Soil Carbon Processes along an Elevation Gradient in the Tropical Luquillo Experimental Forest. Forests 2017, 8, 90. [Google Scholar] [CrossRef]
- Wang, Z.; Luo, T.; Li, R.; Tang, Y.; Du, M. Causes for the unimodal pattern of biomass and productivity in alpine grasslands along a large altitudinal gradient in semi-arid regions. J. Veg. Sci. 2013, 24, 189–201. [Google Scholar] [CrossRef]
- He, X.; Hou, E.; Veen, G.F.; Ellwood, M.D.F.; Dijkstra, P.; Sui, X.; Zhang, S.; Wen, D.; Chu, C. Soil microbial biomass increases along elevational gradients in the tropics and subtropics but not elsewhere. Glob. Ecol. Biogeogr. 2020, 29, 345–354. [Google Scholar] [CrossRef]
- Yang, Y.; Wu, Q.; Yang, W.; Wu, F.; Zhang, L.; Xu, Z.; Liu, Y.; Tan, B.; Li, H.; Zhou, W. Temperature and soil nutrients drive the spatial distributions of soil macroinvertebrates on the eastern Tibetan Plateau. Ecosphere 2020, 11, e03075. [Google Scholar] [CrossRef]
- Bolat, İ.; Öztürk, M. Effects of altitudinal gradients on leaf area index, soil microbial biomass C and microbial activity in a temperate mixed forest ecosystem of Northwestern Turkey. Iforest-Biogeosci. For. 2017, 10, 334–340. [Google Scholar]
- Fan, J.H.; Zhang, X.K.; Lui, X.Y.; Yan, Y.; Wang, X.D. Leaf Litter Decomposition in Three Subalpine Forests along an Elevation Gradient in Tibet. Pol. J. Environ. Stud. 2014, 23, 1137–1146. [Google Scholar]
- Zhang, L.; Liu, J.R.; Yin, R.; Xu, Z.F.; You, C.M.; Li, H.; Wang, L.X.; Liu, S.N.; Xu, H.W.; Xu, L.; et al. Soil fauna accelerated litter C and N release by improving litter quality across an elevational gradient. Ecol. Process. 2023, 12, 47. [Google Scholar] [CrossRef]
- Sariyildiz, T.; Küçük, M. Influence of slope position, stand type and rhododendron (Rhododendron ponticum) on litter decomposition rates of Oriental beech (Fagus orientalis Lipsky.) and spruce [Picea orientalis (L.) Link]. Eur. J. For. Res. 2009, 128, 351–360. [Google Scholar] [CrossRef]
- Bohara, M.; Acharya, K.R.; Perveen, S.; Manevski, K.; Hu, C.; Yadav, R.K.P.; Shrestha, K.; Li, X. In situ litter decomposition and nutrient release from forest trees along an elevation gradient in Central Himalaya. Catena 2020, 194, 104698. [Google Scholar]
- Ma, S.; Chen, S.; Ding, Y.; He, Z.; Hu, G.; Liu, J.; Luo, Y.h.; Song, K.; Yang, Y.; Huang, X.; et al. What controls forest litter decomposition? A coordinated distributed teabag experiment across ten mountains. Ecography 2024, e07339. [Google Scholar] [CrossRef]
- Liu, Y.; Chen, Y.; Zhang, J.; Yang, W.; Peng, Z.; He, X.; Deng, C.; He, R. Changes in foliar litter decomposition of woody plants with elevation across an alpine forest–tundra ecotone in eastern Tibet Plateau. Plant Ecol. 2016, 217, 495–504. [Google Scholar] [CrossRef]
- Wang, Z.H.; Yin, X.Q.; Li, X.Q. Soil mesofauna effects on litter decomposition in the coniferous forest of the Changbai Mountains, China. Appl. Soil Ecol. 2015, 92, 64–71. [Google Scholar] [CrossRef]
- Christenson, L.; Clark, H.; Livingston, L.; Heffernan, E.; Campbell, J.; Driscoll, C.; Groffman, P.; Fahey, T.; Fisk, M.; Mitchell, M.; et al. Winter Climate Change Influences on Soil Faunal Distribution and Abundance: Implications for Decomposition in the Northern Forest. Northeast. Nat. 2017, 24, B209–B234. [Google Scholar] [CrossRef]
- Zhang, X.; Liu, Z.; Zhu, Z.; Du, L. Impacts of decomposition of mixture of leaf litters from Platycladus orientalis and other trees on nutrient release. Acta Pedol. Sin. 2013, 50, 178–185. [Google Scholar]
- Xu, G.; Lin, Y.; Zhang, S.; Zhang, Y.; Li, G.; Ma, K. Shifting mechanisms of elevational diversity and biomass patterns in soil invertebrates at treeline. Soil Biol. Biochem. 2017, 113, 80–88. [Google Scholar] [CrossRef]
- Ma, K.; Huang, J.H.; Yu, S.; Chen, L.Z. Plant community diversity in Dongling Mountain, Beijing, China II. Species richness, evenness and species diversities. Acta Ecol. Sin. 1995, 15, 268–277. [Google Scholar]
- Zhu, J.X.; Hu, X.Y.; Yao, H.; Liu, G.H.; Ji, C.J.; Fang, J.Y. A significant carbon sink in temperate forests in Beijing: Based on 20-year field measurements in three stands. Sci. China-Life Sci. 2015, 58, 1135–1141. [Google Scholar] [CrossRef] [PubMed]
- Macfadyen, A. Notes on Methods for the Extraction of Small Soil Arthropods. J. Anim. Ecol. 1953, 22, 65. [Google Scholar] [CrossRef]
- Dhaliwal, G.S.; Gupta, N.; Kukal, S.S.; Meetpal-Singh. Standardization of Automated Vario EL III CHNS Analyzer for Total Carbon and Nitrogen Determination in Plants. Commun. Soil Sci. Plant Anal. 2014, 45, 1316–1324. [Google Scholar] [CrossRef]
- Bligh, E.; Dyer, W. Orange-red Flesh in God and Haddock. J. Fish. Res. Board Can. 2011, 16, 449–452. [Google Scholar] [CrossRef]
- Frostegård, Å.; Tunlid, A.; Bååth, E. Microbial biomass measured as total lipid phosphate in soils of different organic content. J. Microbiol. Methods 1991, 14, 151–163. [Google Scholar] [CrossRef]
- Frostegård, Å.; Bååth, E.; Tunlio, A. Shifts in the structure of soil microbial communities in limed forests as revealed by phospholipid fatty acid analysis. Soil Biol. Biochem. 1993, 25, 723–730. [Google Scholar] [CrossRef]
- Zelles, L. Fatty acid patterns of phospholipids and lipopolysaccharides in the characterisation of microbial communities in soil: A review. Biol. Fertil. Soils 1999, 29, 111–129. [Google Scholar] [CrossRef]
- Robert, W.B.; David, R.C.; Huadong, Z.; Davey, L.J. Use of metabolomics to quantify changes in soil microbial function in response to fertiliser nitrogen supply and extreme drought. Soil Biol. Biochem. 2021, 160, 108351. [Google Scholar] [CrossRef]
- Yao, G.; Quanyi, H.; Tianqi, L.; Yunfeng, D.; Chengfang, L.; Xuelin, Z.; Juan, L.; Cougui, C. Long-term rice–crayfish coculture increases plant lignin but not microbial necromass contribution to soil organic carbon. Soil Tillage Res. 2025, 248, 106424. [Google Scholar] [CrossRef]
- Djukic, I.; Kepfer-Rojas, S.; Schmidt, I.K.; Larsen, K.S.; Beier, C.; Berg, B.; Verheyen, K.; TeaComposition. Early stage litter decomposition across biomes. Sci. Total Environ. 2018, 628–629, 1369–1394. [Google Scholar] [CrossRef] [PubMed]
- Ge, J.; Ma, B.; Xu, W.; Zhao, C.; Xie, Z. Temporal shifts in the relative importance of climate and leaf litter traits in driving litter decomposition dynamics in a Chinese transitional mixed forest. Plant Soil 2022, 477, 679–692. [Google Scholar] [CrossRef]
- Kohl, L.; Myers-Pigg, A.; Edwards, K.A.; Billings, S.A.; Warren, J.; Podrebarac, F.A.; Ziegler, S.E. Microbial inputs at the litter layer translate climate into altered organic matter properties. Glob. Change Biol. 2021, 27, 435–453. [Google Scholar] [CrossRef]
- Gao, M.X.; Li, J.K.; Zhang, X.P. Responses of soil fauna structure and leaf litter decomposition to effective microorganism treatments in Da Hinggan Mountains, China. Chin. Geogr. Sci. 2012, 22, 647–658. [Google Scholar] [CrossRef]
- Bothwell, L.D.; Selmants, P.C.; Giardina, C.P.; Litton, C.M. Leaf litter decomposition rates increase with rising mean annual temperature in Hawaiian tropical montane wet forests. PeerJ 2014, 2, e685. [Google Scholar] [CrossRef]
- Liu, G.; Sun, J.; Tian, K.; Yuan, X.; An, S.; Wang, H. Litter decomposition of emergent plants along an elevation gradient in wetlands of Yunnan Plateau, China. Chin. Geogr. Sci. 2017, 27, 760–771. [Google Scholar] [CrossRef]
- Tang, R.; DeLuca, T.H.; Cai, Y.; Sun, S.; Luo, J. Long-term decomposition dynamics of broadleaf litters across a climatic gradient on the Qinghai-Tibetan Plateau, China. Plant Soil 2021, 465, 403–414. [Google Scholar] [CrossRef]
- Wang, S.; Ruan, H. Effects of soil mesofauna and microclimate on nitrogen dynamics in leaf litter decomposition along an elevation gradient. Afr. J. Biotechnol. 2011, 10, 6732–6742. [Google Scholar]
- Peng, Y.; Yang, W.; Yue, K.; Tan, B.; Wu, F. Impacts of soil fauna on nitrogen and phosphorus release during litter decomposition were differently controlled by plant species and ecosystem type. J. For. Res. 2018, 30, 921–930. [Google Scholar] [CrossRef]
- Yang, K.; Zhu, J.; Zhang, W.; Zhang, Q.; Lu, D.; Zhang, Y.; Zheng, X.; Xu, S.; Wang, G.G. Litter decomposition and nutrient release from monospecific and mixed litters: Comparisons of litter quality, fauna and decomposition site effects. J. Ecol. 2022, 110, 1673–1686. [Google Scholar] [CrossRef]
- Bradford, M.A.; Berg, B.; Maynard, D.S.; Wieder, W.R.; Wood, S.A.; Cornwell, W. Understanding the dominant controls on litter decomposition. J. Ecol. 2015, 104, 229–238. [Google Scholar] [CrossRef]
- Canessa, R.; van den Brink, L.; Saldaña, A.; Rios, R.S.; Hättenschwiler, S.; Mueller, C.W.; Prater, I.; Tielbörger, K.; Bader, M.Y.; Piper, F. Relative effects of climate and litter traits on decomposition change with time, climate and trait variability. J. Ecol. 2020, 109, 447–458. [Google Scholar] [CrossRef]
- Hoeber, S.; Fransson, P.; Weih, M.; Manzoni, S. Leaf litter quality coupled to Salix variety drives litter decomposition more than stand diversity or climate. Plant Soil 2020, 453, 313–328. [Google Scholar] [CrossRef]
- Berg, B.; Kjønaas, O.J.; Johansson, M.B.; Erhagen, B.; Åkerblom, S. Late stage pine litter decomposition: Relationship to litter N, Mn, and acid unhydrolyzable residue (AUR) concentrations and climatic factors. For. Ecol. Manag. 2015, 358, 41–47. [Google Scholar] [CrossRef]
- Cornwell, W.K.; Weedon, J.T. Decomposition trajectories of diverse litter types: A model selection analysis. Methods Ecol. Evol. 2014, 5, 173–182. [Google Scholar] [CrossRef]
- Ribeiro, F.P.; Oliveira, A.D.d.; Bussinguer, A.P.; Rodrigues, M.I.; Cardoso, M.S.S.; Lustosa Junior, I.M.; Valadão, M.B.X.; Gatto, A. How long does it take to decompose all litter in Brazilian savanna forest? Cerne 2022, 28, e102819. [Google Scholar] [CrossRef]
- Liu, S.; Bu, M.; Li, Y.; Shi, X.; Huang, C.; Wen, H.; Liu, Y.; Wu, C. Regulation of initial soil environmental factors on litter decomposition rate affects the estimation accuracy of litter mass loss in a subtropical forest. Plant Soil 2022, 485, 395–410. [Google Scholar] [CrossRef]
- Yin, R.; Qin, W.; Zhao, H.; Wang, X.; Cao, G.; Zhu, B. Climate warming in an alpine meadow: Differential responses of soil faunal vs. microbial effects on litter decomposition. Biol. Fertil. Soils 2022, 58, 509–514. [Google Scholar] [CrossRef]
- Wu, Q.; Ni, X.; Sun, X.; Chen, Z.; Hong, S.; Berg, B.; Zheng, M.; Chen, J.; Zhu, J.; Ai, L.; et al. Substrate and climate determine terrestrial litter decomposition. Proc. Natl. Acad. Sci. USA 2025, 122, e2420664122. [Google Scholar] [CrossRef] [PubMed]
- Schwieger, S.; Dorrepaal, E.; Petit Bon, M.; Vandvik, V.; le Roux, E.; Strack, M.; Yang, Y.; Venn, S.; van den Hoogen, J.; Valiño, F.; et al. Environmental Conditions Modulate Warming Effects on Plant Litter Decomposition Globally. Ecol. Lett. 2025, 28, e70026. [Google Scholar] [CrossRef]
- Kuiling, Z.; Zhiheng, W.; Xiangyun, Z.; Jonathan, L.; Nawal, S.; Tong, L.; Ao, L.; Yaoqi, L.; Chengjun, J.; Shijia, P.; et al. Upward shift and elevational range contractions of subtropical mountain plants in response to climate change. Sci. Total Environ. 2021, 783, 146896. [Google Scholar] [CrossRef]
- Marschner, P.; Crowley, D.E.; Yang, C.-H. Development of specific rhizosphere bacterial communities in relation to plant species, nutrition and soil type. Plant Soil 2004, 261, 199–208. [Google Scholar]
- Tunlid, A.; White, D.C. Biochemical Analysis of Biomass, Community Structure, Nutritional Status, and Metabolic Activity of Microbial Communities in Soil. In Soil Biochemistry; CRC Press: Boca Raton, FL, USA, 1992. [Google Scholar]
- Joergensen, R.G.; Emmerling, C. Methods for evaluating human impact on soil microorganisms based on their activity, biomass, and diversity in agricultural soils. J. Plant Nutr. Soil Sci. 2006, 169, 295–309. [Google Scholar] [CrossRef]
- Fierer, N.; Strickland, M.S.; Liptzin, D.; Bradford, M.A.; Cleveland, C.C. Global patterns in belowground communities. Ecol. Lett. 2009, 12, 1238–1249. [Google Scholar]

Disclaimer/Publisher’s Note: The statements, opinions and data contained in all publications are solely those of the individual author(s) and contributor(s) and not of MDPI and/or the editor(s). MDPI and/or the editor(s) disclaim responsibility for any injury to people or property resulting from any ideas, methods, instructions or products referred to in the content. |
© 2025 by the authors. Licensee MDPI, Basel, Switzerland. This article is an open access article distributed under the terms and conditions of the Creative Commons Attribution (CC BY) license (https://creativecommons.org/licenses/by/4.0/).
Share and Cite
Zhang, S.; Zhang, Y.; Lin, Y.; Wang, M.; Xu, G.; Ma, K. Soil Invertebrates Play Key Roles in Stage-Specific Shifts in Elevational Patterns of Litter Decomposition in Dongling Mountain, Beijing. Forests 2025, 16, 584. https://doi.org/10.3390/f16040584
Zhang S, Zhang Y, Lin Y, Wang M, Xu G, Ma K. Soil Invertebrates Play Key Roles in Stage-Specific Shifts in Elevational Patterns of Litter Decomposition in Dongling Mountain, Beijing. Forests. 2025; 16(4):584. https://doi.org/10.3390/f16040584
Chicago/Turabian StyleZhang, Shijie, Yuxin Zhang, Yinghua Lin, Miao Wang, Guorui Xu, and Keming Ma. 2025. "Soil Invertebrates Play Key Roles in Stage-Specific Shifts in Elevational Patterns of Litter Decomposition in Dongling Mountain, Beijing" Forests 16, no. 4: 584. https://doi.org/10.3390/f16040584
APA StyleZhang, S., Zhang, Y., Lin, Y., Wang, M., Xu, G., & Ma, K. (2025). Soil Invertebrates Play Key Roles in Stage-Specific Shifts in Elevational Patterns of Litter Decomposition in Dongling Mountain, Beijing. Forests, 16(4), 584. https://doi.org/10.3390/f16040584