Article

Analysis and Use of Wood Waste in Lithuania for the Development of Engineered Wood Composite

Building Materials Institute, Faculty of Civil Engineering, Vilnius Gediminas Technical University, Linkmenu Str. 28, LT-08217 Vilnius, Lithuania
*
Author to whom correspondence should be addressed.
Forests 2025, 16(4), 577; https://doi.org/10.3390/f16040577
Submission received: 28 February 2025 / Revised: 20 March 2025 / Accepted: 25 March 2025 / Published: 26 March 2025
(This article belongs to the Special Issue Wood Treatments and Modification Technologies—2nd Edition)

Abstract

:
The rational use of wood waste allows the saving of forest resources and contributes to the reduction of the greenhouse effect. Three types of wood waste were used in this work: packaging (W), demolition and furniture construction (PLY), and door production (DW). The work performed an analysis of the granulometric composition of the wood waste and assessed the size, shape, and composition of the wood particles. The particle size was in the range of 0–20 mm, but the quantitative proportion of particles of different sizes in waste of different nature and shape was different. All wood particles were thermochemically treated to reduce the amount of dust and soluble particles and to increase the surface roughness of the wood particles to ensure better adhesion parameters with the binder. The binder used was biopolyurethane. Engineered wood composites (EWC) were formed from biopolyurethane and wood waste in a 50:50 ratio to evaluate compressive and bending strength. The strength values showed that all wastes were suitable for forming composites, but the size of the particles affected the magnitude of these values. The highest compressive stress of 11.7 MPa was obtained from composites using 0–5 mm PLY waste, while the lowest stress of 5.2 MPa was obtained from 0–20 mm W waste. In this case, the size of the wood waste particles affected not only the compressive stress but also the density of the composite. The analysis of the composite densities showed that 84.1% of the variation in the total density values was determined by the sample fraction, particle length-width ratio, angularity and sharpness and 15.9% by other factors that were not evaluated. For flexural strength, particle size and nature did not show a clear tendency, and values ranged from 7.2 to 11.5 MPa. The thermochemical treatment method of the wood particles had no or only a slight effect on the strength characteristics of the engineered wood composite.

1. Introduction

The use of raw wood in the manufacture of construction timber and wood products is notably inefficient throughout almost all phases of production, indicating a clear opportunity for improvement in this regard [1].
In the context of Brazilian legislation, specifically the CONAMA decree of 2016 [2], most of the wood is transported to sawmills to prepare various products. However, the legislation stipulates a maximum yield of sawn wood of 35%, resulting in the classification of 65% of the total wood mass as residual material. The generation of this residual material is a direct consequence of the process of transforming wood into logs within forest ecosystems and culminates in the final preparation of sawn wood in specialised wood processing facilities. The waste generated in the forest consists of branches, tops, and firewood, while the wood bark and cuttings are produced by the wood processing company. The amounts of different parts of green and dry trees are indicated in Table 1, and a graphic representation of the parts of trees according to the type of cutting is given in Figure 1 [3].
A considerable amount of wood waste is produced as a byproduct of the recovery of used wood products. According to the Lithuanian State Data Agency [4], wood product waste is generated during the demolition and removal of construction products and the recovery of packaging. A significant proportion of this waste is disposed of in landfills, while a notable share is treated, recycled, or incinerated to produce thermal energy. The remaining part is exported or incinerated without thermal energy recovery.
Wood waste is derived from a variety of resources, demonstrating a lack of homogeneity as a material [5]. In addition, the chemical and physical composition of wood waste is highly complex [6]. Wood waste resources are characterised by a variety of physical and chemical contaminants, which pose significant challenges during recycling processes and affect the properties of the resulting recycled products. Mechanical processes (e.g., screening, magnet, or eddy current) have been used to address the physical contaminants present in wood waste, including plastics, metals, textiles, and other materials. However, the removal of chemical contaminants from wood, preservatives, paints, glues, and similar substances remains a challenging aspect of mechanical waste wood processing. Consequently, the effective management of these pollutants in wood waste is essential for the efficient reuse of these valuable resources [7]. Despite the establishment and implementation of wood waste management principles in numerous countries, a lack of consensus on the classification of wood waste hinders trade between European countries [8].
One of the most popular solutions is the production of thermal energy, together with other products, such as activated carbon, biofuels, and biochar, in addition to the many uses of wood waste, such as the chemical industry and the production of fibres and composites [9].
Wood waste management companies must face a multitude of challenges, including but not limited to: pretreatment of raw materials; operational challenges; downstream product treatment; safety; and risk assessment [10]. The utilisation of substandard and frequently heterogeneous feedstocks can result in several complications, including the formation of slag within combustion and gasification systems, the occurrence of tar during the pyrolysis process, the presence of fly ash contamination and sedimentation, as well as unbalanced heat exchange between the heat generation unit (combustion) and the heat recovery unit (pyrolysis). Finally, the deployment of these technologies is influenced by market demand, energy requirements, environmental impacts, and the availability of raw materials [11].
Despite the challenges associated with its management, wood waste represents a valuable raw material for the energy and materials sector. The volume of wood waste is increasing in line with the rapid processes of urbanisation and industrialisation that occur in numerous regions of the world. According to data collected in 2014 [12], approximately 60 million tonnes of wood waste are generated in Europe every year, coming from various industrial sectors. Germany has the distinction of being the nation with the highest annual generation of wood waste in Europe, contributing approximately 6.6 million tonnes in 2016, positioning it as a prominent contributor to the overall landscape of waste management on the continent [13]. Italy, the United Kingdom, and France collectively generate approximately 4 million tonnes per year, while Belgium, Austria, Spain, and Poland collectively produce around 2 million tonnes in 2014 [14]. Sweden, Norway and Denmark collectively accumulate approximately 1.0 million tonnes per year [15]. According to the United States Environmental Protection Agency (EPA), the US generated around 18.1 million tonnes of short wood waste collected from municipal solid waste streams in 2018. Despite variations in the methodologies employed for wood waste management, the degree to which wood waste is recycled exhibits significant international variability. This variability is evident in the utilisation of materials and energy. European countries generate an excess of wood waste relative to its use for energy production, which is 60%–95% of the total. Sweden, Switzerland, Norway, The Netherlands, and Finland are the leading European countries that use a high proportion of wood waste for energy production, ranging from 85 to 95% [16]. In other countries, wood waste is used more efficiently to produce new materials. In terms of material use, Italy ranks first among European countries with a 42% share of wood waste in panel production, followed by Austria with 33% [15].
Two main sources of pollution are identified in wood: physical sources (stones, metals, plastics, textiles, etc.) [6,17,18] and chemical—a wide array of metals and their respective compounds [19,20]. The most common binders identified in recycled panel wood waste include urea formaldehyde, thiourea formaldehyde, melamine urea formaldehyde, methane diisocyanate, and phenol formaldehyde [21,22,23,24,25,26,27]. The presence of physical contaminants derived from wood waste is not a significant concern. The application of appropriate classification techniques enables the detection and removal of each contaminant, thus ensuring the purity of the wood composite material [28].
The potential to recycle a significant portion of wood waste from wood packaging [29], construction and demolition projects [30], furniture sector [31] is promising, but requires the implementation of effective separation [32] and recycling practices. Furthermore, the evolving nature of construction codes and the economic limitations surrounding the recycling of materials [33] such as medium-density fibreboards highlight the complexities involved in the management of wood waste.
Many studies have been conducted on wood waste [34] and deadwood processing [35]. The use of formaldehyde [34] in the production of wood waste or deadwood-plastic composites (WPC) because of the high reactivity, chemical versatility [36] provides the most attractive basic product characteristics, but due to health effects occurring from the release of formaldehyde into the air, many of the alternative natural bio-based binders are being developed. They have lower reactivity, which increases the cost of production, and there is a lack of research on toxicity and potential environmental impacts [37,38]. One of the most attractive alternatives today is polymeric systems based on methylene diphenyl diisocyanate [39]. In this case, the plastic used to produce the wood-plastic composites does not need to be recycled and the moulding process does not need the extra energy to form the samples [40].
This study examines the impact of the size and shape of the wood waste particles on the strength characteristics of the resulting product, engineered wood composite (EWC).

2. Materials and Methods

2.1. Materials

Wood waste from several different sources in the construction industry was used, including the door manufacturing industry (DW), wood packaging (W), and the construction demolition and furniture industry (PLY) (Figure 2).
The first set of samples of DW waste consisted of softwood shavings supplied by the door manufacturer AS Viljandi Windows & Doors (Viljandi, Estonia), which also contained aluminium fibres. The resulting mixture of softwood and aluminium fibre did not require additional mechanical grinding. The second group of samples was formed from (W) packaging pallets, while (PLY) was formed from construction demolition and furniture waste. Both groups of materials were supplied by JSC Ekobazė (Vilnius, Lithuania). To achieve the required dimensions for the second and third groups of samples, which were larger in size, a GMM-S hammer mill (JSC Radviliskis machine factory, Radviliškis, Lithuania) was used for mechanical processing. The rotation speed of the mill rotor was 3000 min−1, and the mesh sizes of the interchangeable sieves used were 20, 10, and 5 mm.
To enhance the adhesion of the wood particles to the binder, the wood particles were additionally processed with 10% solutions (based on the weight of the sample) of hydrogen peroxide, sodium carbonate, or calcium hypochlorite. All chemicals were purchased from UAB “Lerochem”, (Klaipėda, Lithuania). The wood waste samples were coded according to their granulometric composition and the solutions that were used for chemical treatment (Table 2).
The moisture content of wood waste particles varied between 9.3 and 10.7%. Its influence on the properties of the composite was not evaluated in further studies.
The ratios of biopolyurethane to wood waste for the preparation of the blends are shown in Table 3.
Lupranat M20S polymeric 4,4-diphenylmethane diisocyanate with 31.5% NCO (BASF, Berlin, Germany) was used as hardener. The binder components also consisted of polyol Biopolyol RD (SIA PolyLabs, Riga, Latvia), which had a polyol hydroxyl number of 350 KOH/g and a water content of less than 0.2%, as well as natural rapeseed oil (UAB “Lomista”, Kaišiadorys, Lithuania).

2.2. Preparation of EWC

The wood waste and biopolyurethane were loaded into a 50 litre plastic round container and thoroughly mixed for 1 minute using the Apex ST2 mixer (Wagner S.p.A., Valmadrera, Italy) at a speed of 200 rpm. Subsequently, the mixture was transferred to a metal form and pressurised to a pressure of 0.9 MPa. The next step was to use a pneumatic-hydraulic press, the Tongrun T40 (Shanghai Tongrun Imp. & Exp. Co., Ltd., Shanghai, China), for crimping. The clamped specimen was then held for 30 min and dismantled.

2.3. Test Methods

The strength characteristics of the formed specimens were determined 3 days after their formation. A Hounsfield H10KS universal test press (Hounsfield Test Equipment, Redhill, UK) was used to determine the strengths. For the evaluation of the strengths, three samples were prepared from each composition. The compressive strength was determined in accordance with EN ISO 29469 [41]. Cube-shaped specimens of 15 mm × 15 mm × 15 mm were prepared for testing, while the bending strength was determined according to EN 310 [42], employing test specimens of 300 mm × 50 mm × 10 mm. Statistical analysis of the test data was performed using the Statistica programme [43].

3. Results

The granulometric composition of the samples is presented in Figure 3.
As shown in Figure 1, the particle size distribution of wood waste showed that two particle sizes predominated in DW waste: >0.315–1.25 and >2.5–5. On the contrary, in PLY and W waste, the particle size range >2.55–>5 mm was clearly distinguished. This variation can be attributed to the technological parameters associated with door production, which significantly influence the composition of the resulting waste. In addition, the distribution of various waste particles after their chemical treatment also varied. When examining DW waste particles, the size of which varied from 0 to 2.5 mm, an increase in fine particles was observed after chemical treatment compared to untreated waste. Fine wood particles were likely easier to wash out, while heavier aluminium particles affected the particle mass distribution. Additional leaching in water showed that the mass of aluminium particles in the DW waste was 10.6% by mass. Meanwhile, in PLY waste, also in W waste, no increase in fine particles was observed.
Furthermore, all wood waste was divided into three fractions: 0–<5, ≥5–<10, and ≥10–<20 mm. A representative sample from each fraction was selected for analysis of the morphology of the wood waste particles. The images of particles of different fractions are presented in Figure 4.
The particles in each fraction were systematically labelled and analysed using ImageJ 1.54, a public-domain software programme for image processing and analysis. This analytical procedure included measurements of aspect ratio, roundness, and circularity—the majority of studies have identified these particle shape characteristics as the most commonly used. The results of this analysis are presented in Table 4. ImageJ defines the aspect ratio as a measure of the proportional dimensions of an object. Specifically, it is defined as the ratio of the width to the height of the bounding box that encloses the shape and can be calculated as [44]:
A R = W H
An elevated aspect ratio is indicative of a more elongated configuration. Conversely, a value that approaches one suggests a shape that is more square-like or circular.
Roundness is a quantitative metric that evaluates the extent to which the geometry of an object approximates a perfect circle. Within the ImageJ software framework, the roundness of an image can be calculated by the following formula [44]:
R o u n d n e s s = 4 × A r e a π × P e r i m e t e r 2
Values approaching 1 are indicative of shapes that are more circular, while lower values are indicative of more irregular shapes.
Circularity quantifies the degree to which a shape is round. Circularity is frequently defined as [44]:
C i r c u l a r i t y = 4 × π × A r e a P e r i m e t e r 2
As with the concept of roundness, a circularity value of 1 corresponds to a theoretically perfect circle, while values less than 1 indicate deviations from circularity. As these properties demonstrate, the angularity and sharpness of the corners are characteristics of both roundness and circularity.
Table 4 shows that the dispersion of the particle shape indicators of the studied waste was very large. Such a dispersion reflects not only a large set of particle length, width, and shape but also the nature of the particles and technological parameters, thanks to which the particles were prepared.
Then an analysis of the effect of particle fractions, shapes, and chemical treatment methods on the density and strength indicators of the EWC was performed. The greatest influence on the density and strength indicators of the composite was exerted by the fraction of wood particles. Figure 5 shows the dependence of density on fraction and chemical treatment method.
Analysis of composites from the PLY, W, and DW waste showed that the density of the composites depends on the fraction size (Figure 5a). Statistical analysis showed that the density results of composites from PLY and W waste differed significantly depending on the fraction size, which ranged from 5 to 20 mm. The observed sample data indicated a low risk of error while p < α, where α is the significance level and 0.05 is the threshold in the study’s statistical analysis. Consequently, it can be concluded that the findings were statistically significant. The F-criterion, often termed ANOVA (analysis of variance), was used to determine the impact of various factors on the target criteria. The hypothesis that formed the basis of this study was that if the F-criterion was sufficiently high, it would indicate a significant statistical effect. Therefore, the corresponding p-value will be small, indicating strong evidence against the null hypothesis. The following are the data for the statistical analysis of composites: PLY waste F = 18.4; p = 0, and W waste F = 114.3; p = 0.
As the fraction size of the construction demolition and furniture waste increased from 5 to 20 mm, the density of the PLY waste composites decreased by ~11%, and the density of the W waste composites decreased by ~25%. At the same time, composite testing from DW waste was carried out only with fraction sizes of 20 mm, and the average value of the density of the samples was 815 ± 37 kg/m3
The density of composites from construction demolition and furniture industry, as well as wood packaging waste, depending on the fraction size, could be described by regression Equations (4) and (5), respectively:
ρ P L Y = 885.876 20.664 · F r + 0.6155 · F r 2
ρ W = 895.996 40.516 · F r + 1.2334 · F r 2
where ρ —density of the samples, kg/m3; F r —fraction, mm. The data from the statistical analysis of the regression equations are presented in Table 5.
The correlation coefficient R shows a measure of the strength of the linear relationship between two quantitative variables, as well as the direction of that relationship. The closer R is to 1 (−1 or 1), the stronger the relationship. The correlation coefficient R of 0.9 is higher in composites made from W waste, while in composites made from PLY waste it is 0.65. The coefficient of determination R2 is a measure of the goodness of fit of a model. The coefficient of determination R2, evaluated within the range of 0 ≤ R2 ≤ 1, can also be expressed as a percentage. This indicates the impact of particle size on variation around the mean of the density in composites derived from W waste, with a substantial impact in 82% of composites. Whereas in composites of PLY waste, this impact is only 42%.
Figure 5b presents the changes in the densities of composites PLY, W and DW wa ste after processing the raw materials with various solutions: H2O2; Na2CO3; and Ca(OCl)2. The analysis showed that after processing PLY, W and DW waste with different solutions and using them to produce composites, the use of these solutions does not significantly affect the densities of the composites. This statement was confirmed by statistical analysis, which showed an insignificant difference in the averages of the test results (see Table 6).
After the analysis of the densities of the composites was performed, an attempt was made to combine the data of three types of composites into one array to describe the densities of the composites. The following parameters were used for the general description of the composite densities: sample fraction, aspect ratio, roundness, and circularity. The composite fraction from W waste was 5, 10, and 20 mm, the particle aspect ratio was 4.11, 4.869, and 3.228, the roundness was 0.373, 0.446, and 0.460, and the circularity was 0.515, 0.558, and 0.616. The fraction of composites from PLY waste was 5, 10, and 20 mm, the particle aspect ratio was 3.850, 6.153, and 6.952, the roundness was 1.818, 4.028, and 5.874, and the circularity was 0.317, 0.245, and 0.210. The fraction of composite from door production waste was 20 mm, the particle aspect ratio was 2.499, the roundness was 0.525, and the circularity was 0.709. The dependence of the composite densities on the fraction, particle aspect ratio, roundness, and circularity was described by Equation (6):
ρ g e n e r a l = 591.979 806.206 · F r 18.725 · A R + 43.667 · R + 777.293 · C + 0.6805 · F r 2
where ρgeneral—general density of samples, kg/m3; Fr—fraction, mm; A R —aspect ratio; R—roundness; C—circularity. The square deviation of the total density of composites from the PLY, W, and DW waste was Sr = 36.2 kg/m3, R = 0.917, R2 = 0.841. The regression equation obtained showed that 84.1% of the variation in the total density values was determined by the sample fraction, particle length-width ratio, angularity, and sharpness and 15.9% by other factors that were not evaluated.
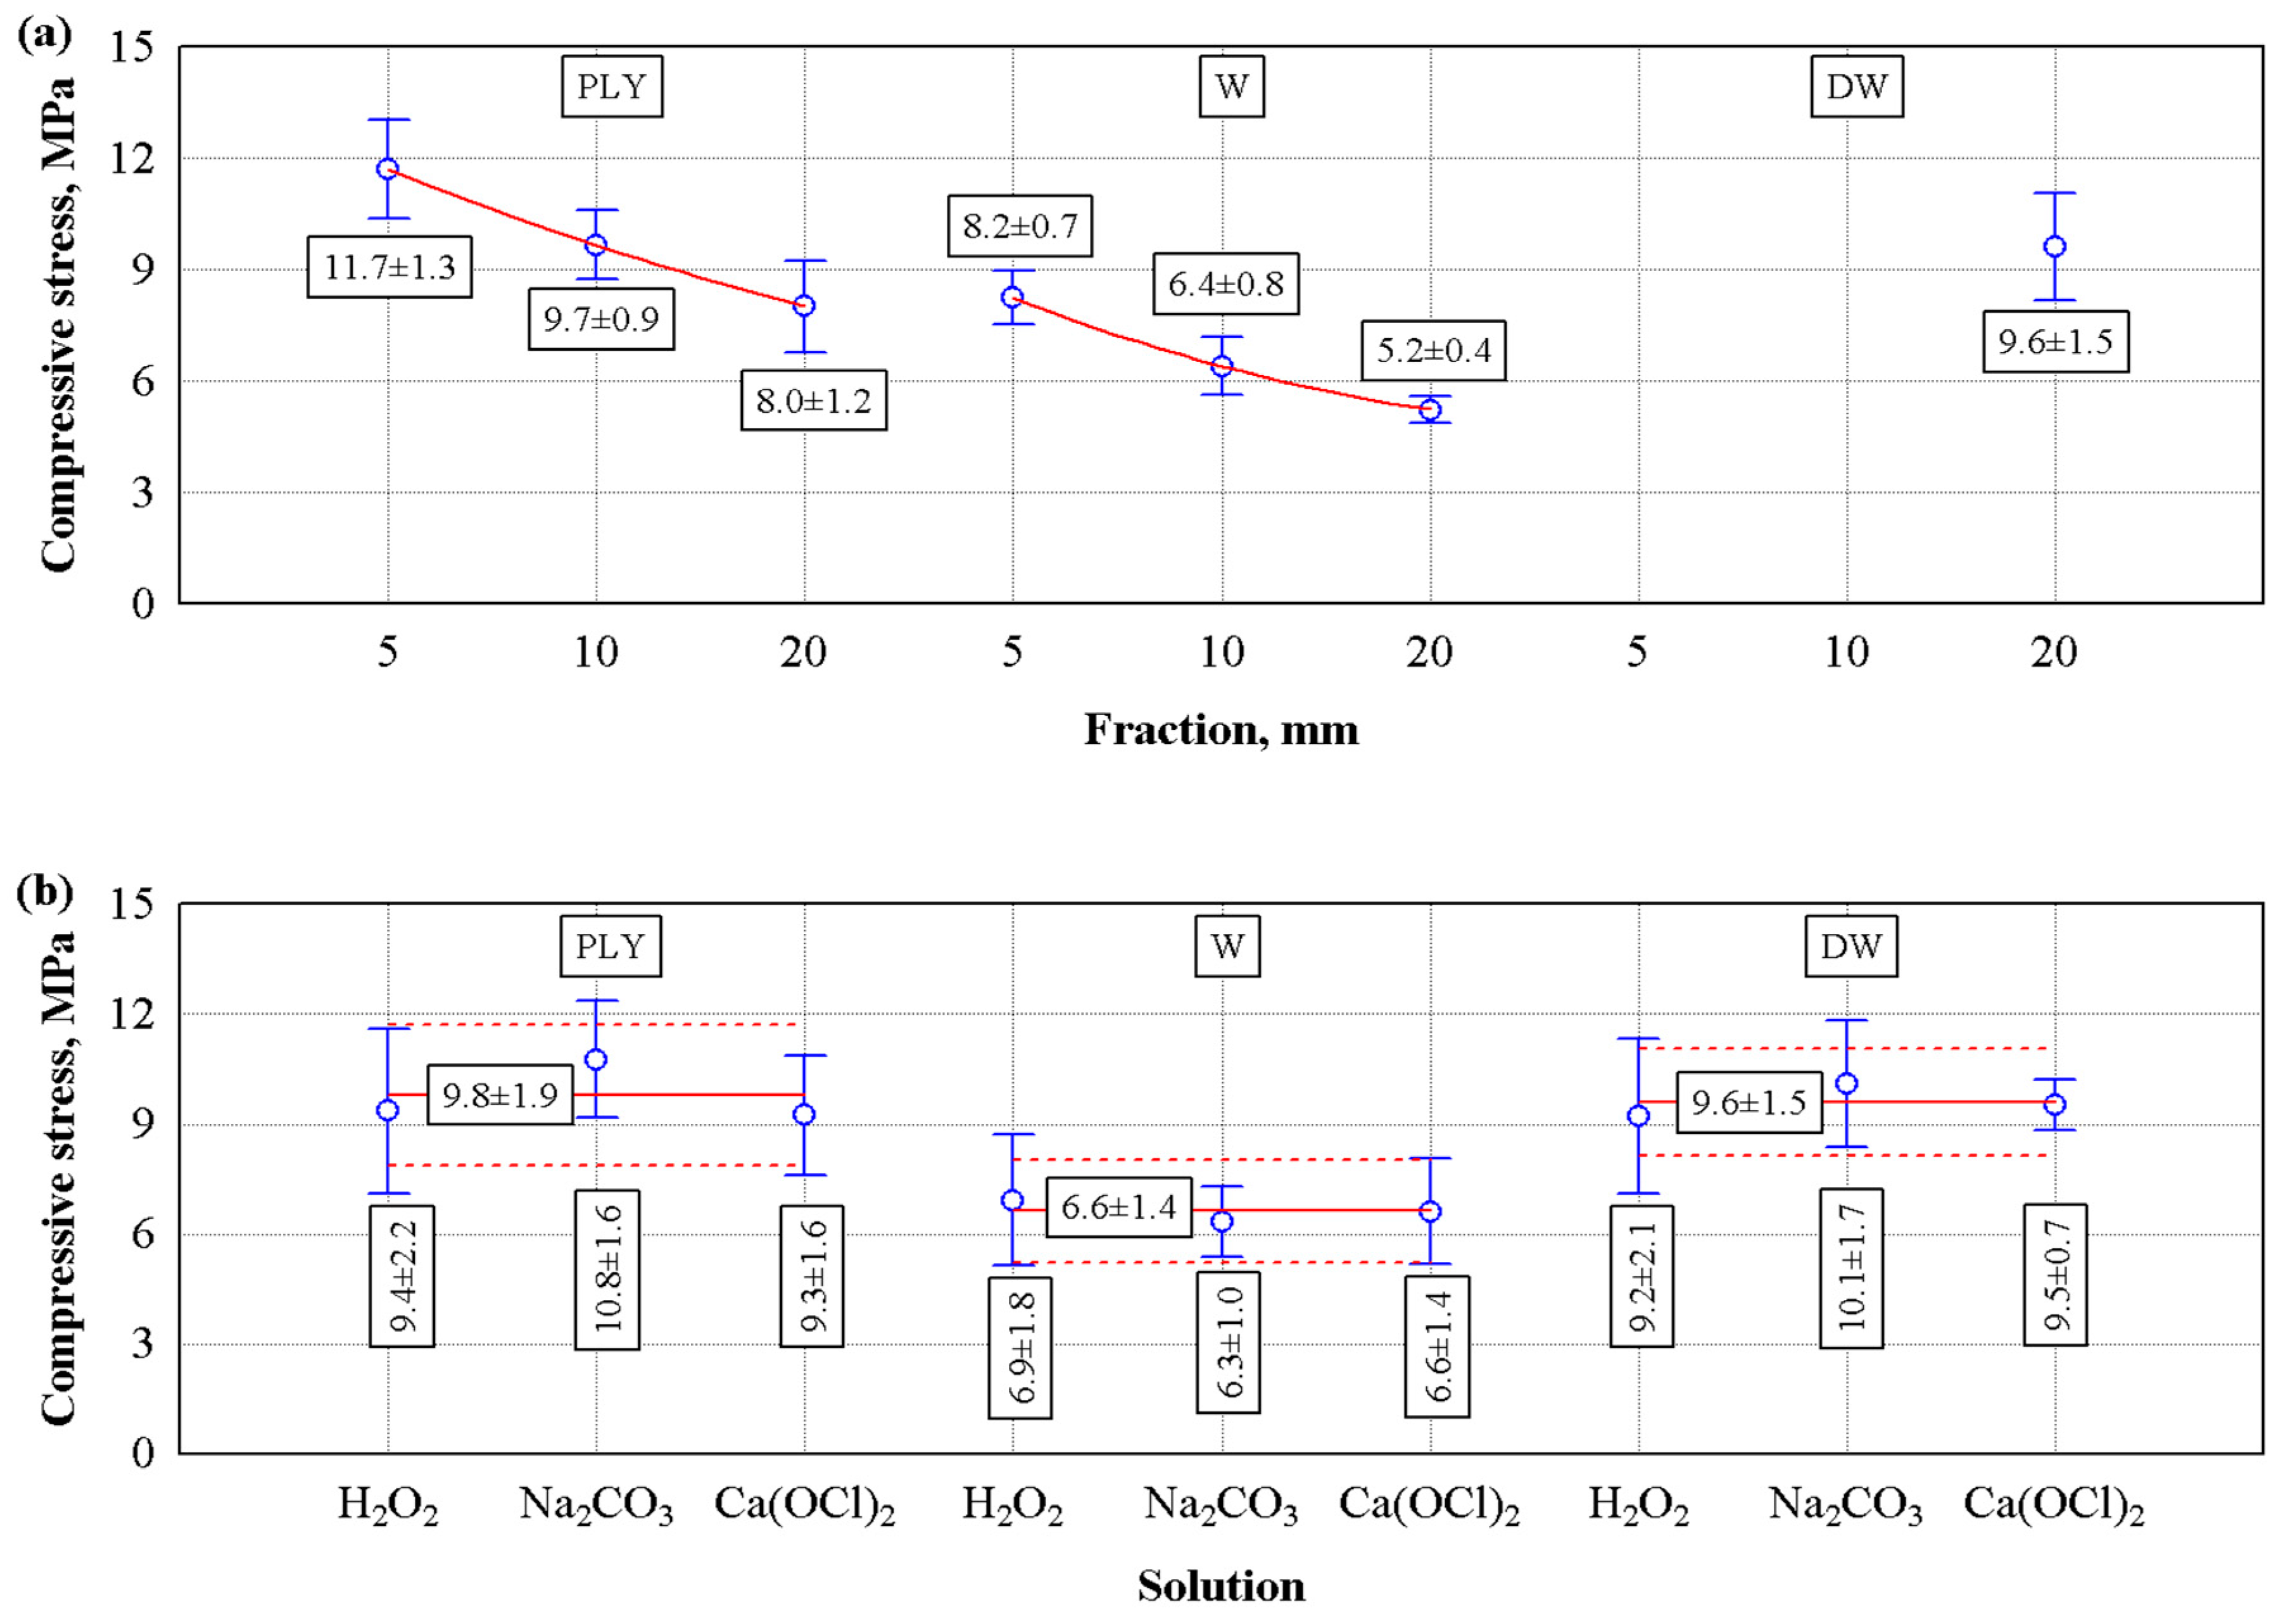
Figure 6 presents the compressive stress analysis of composites from the PLY, W, and DW waste. The change in compressive stress of composites was investigated as a function of the size of the raw material fraction and the raw material treated with different solutions.
Figure 6 shows that the compressive stress of composites from the PLY, W, and DW waste depended on the fraction size (Figure 6a). The compressive stress of composites from the PLY and W decreased with the fraction size, varying from 5 to 20 mm. Statistical analysis showed that there was a significant difference in the results of the compressive stress of composites from the PLY and W waste depending on the fraction size, which varied from 5 to 20 mm. This was confirmed by the statistical analysis data obtained: composites from construction PLY waste F = 22.0; p = 0, composites from W waste F = 49.6; p = 0.
As the fraction size of raw materials increased from 5 to 20 mm, the compressive stress of composites from the PLY waste decreased by ~46%, and that of the W waste composites by ~57%. The compressive stress of composites from the PLY and W waste as a function of the fraction size was described by regression Equations (7) and (8), respectively:
σ 10 % P L Y = 14.5170 0.64504 · F r + 0.015981 · F r 2
σ 10 % W = 10.89822 0.61586 · F r + 0.016633 · F r 2
where σ(10%)—compressive stress, MPa; Fr—fraction, mm. The data from the statistical analysis of the regression equations are presented in Table 7.
The DW waste composite was tested with only a fraction size of 20, and the average compressive stress of the samples was 9.61 ± 1.46 MPa. Compressive stress analysis was also carried out on PLY, W, and DW waste treated with different solutions: H2O2; Na2CO3; and Ca(OCl)2. The findings revealed that the treatment of PLY wastes with these various solutions and its use in composite production construction did not have a significant impact on the compressive stress of the composite. A statistical analysis was carried out, which showed a nonsignificant difference between the results of the subjects (see Table 8).
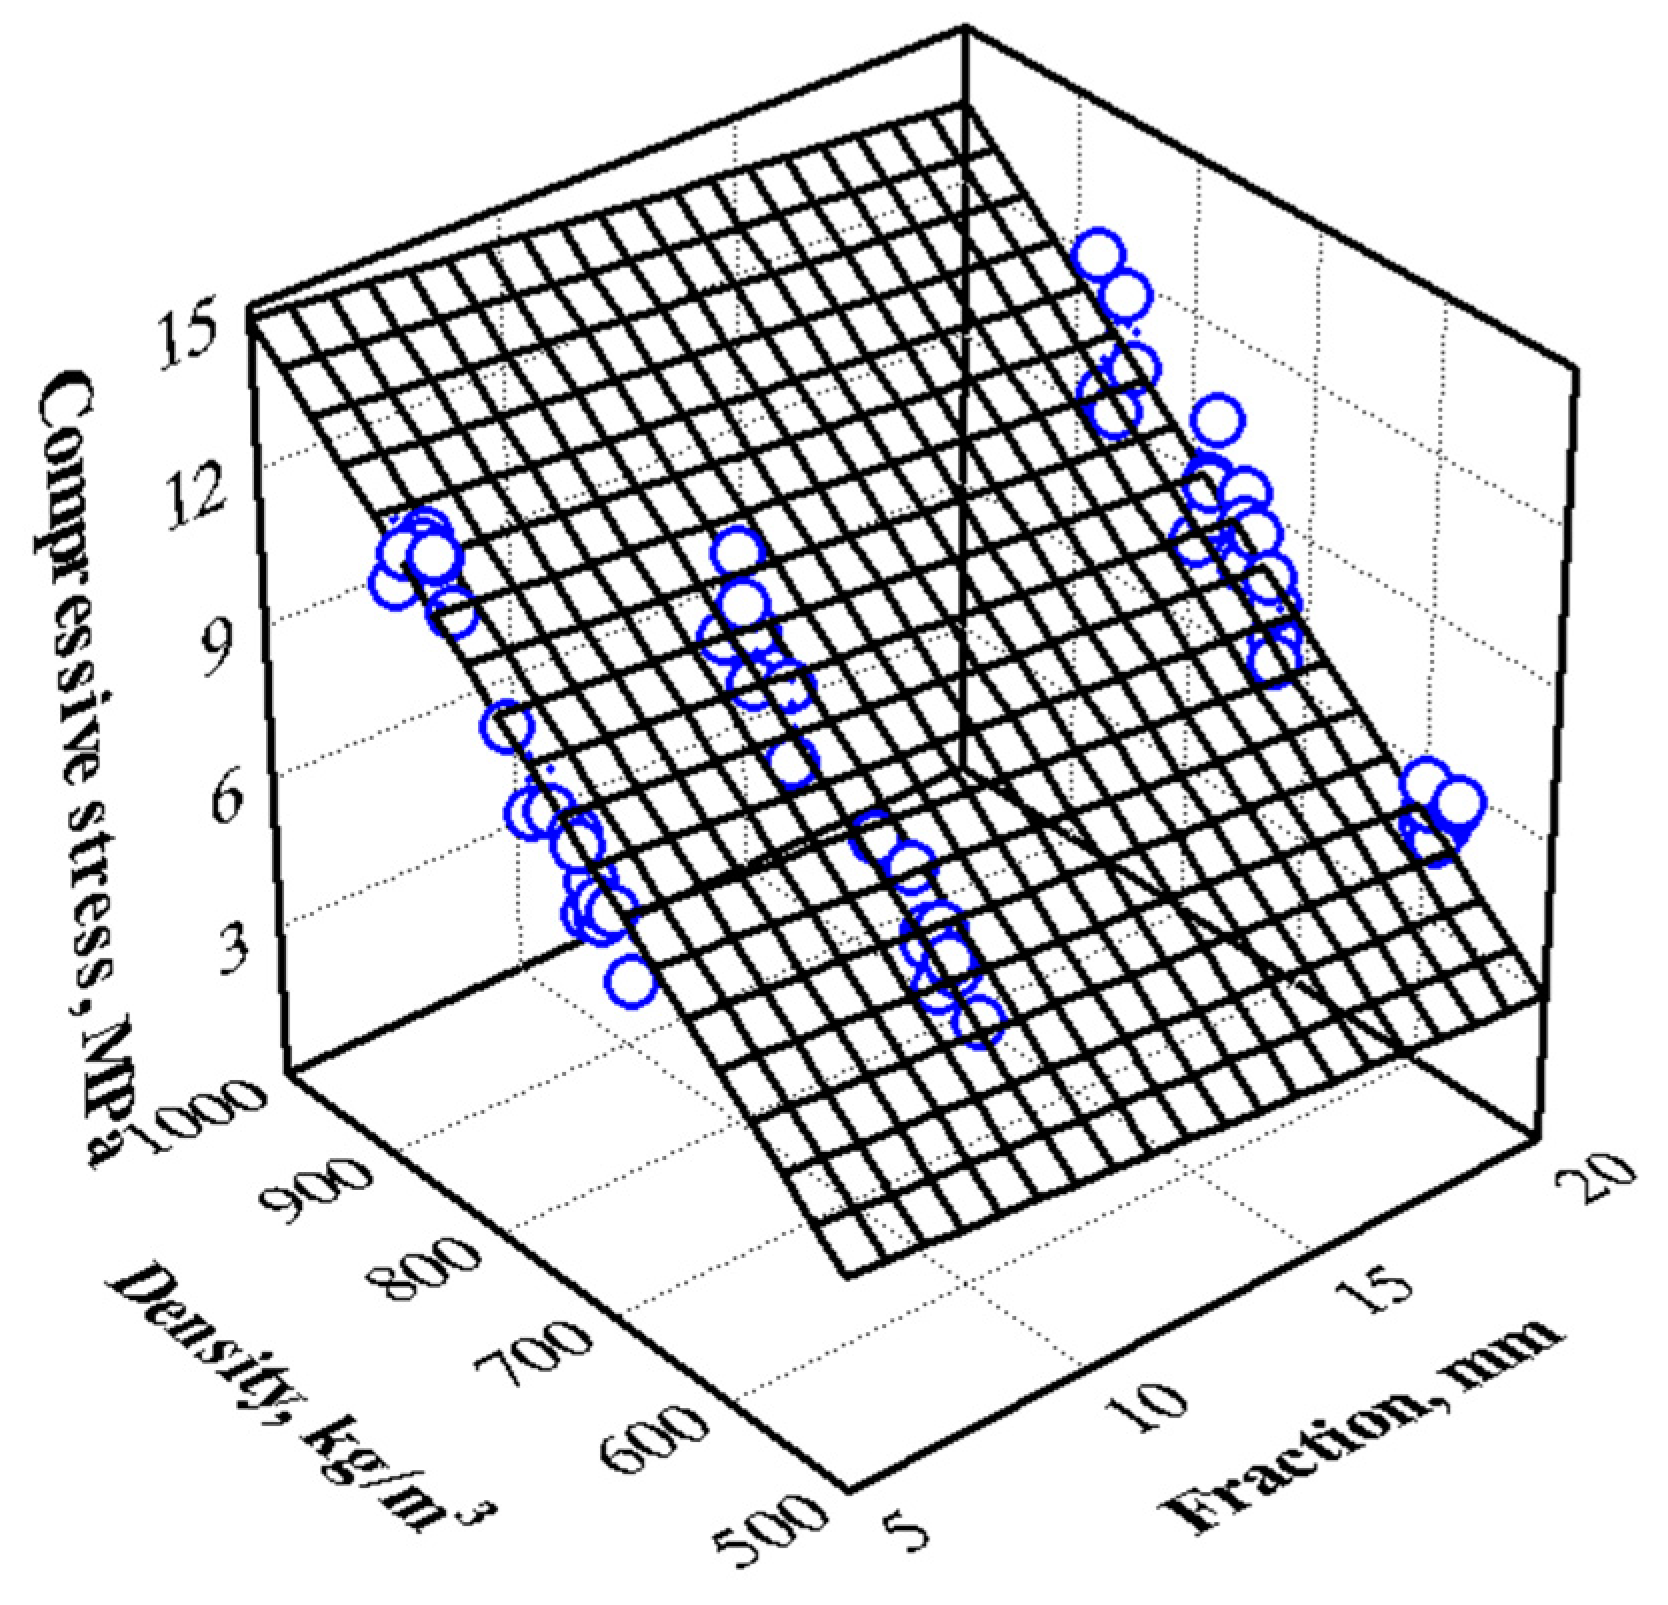
The analysis of compression tests tried to describe compressive stress by integrating the data from the three types of composites into a unified array. The following parameters were selected to describe the compressive stress: density of the samples and fraction. The fraction of the PLY waste composite varied from 5 to 20 mm, and the density varied from 675 to 875 kg/m3. The fraction of composite from the W waste was also varied from 5 to 20 mm, and the density ranged from 572 to 744 kg/m3. The fraction of waste composite of DW waste was taken as 20 mm, and the density varied from 781 to 881 kg/m3. The relationship between compressive stress, fraction, and density of the compound was modelled using the following equation, and a graphical interpretation of the regression Equation (9) is presented in Figure 7.
σ 10 % = 5.98345 0.08501 · F r + 0.02121 · ρ
where σ 10 % —compressive stress, MPa; F r —fraction, mm; ρ —density of the samples, kg/m3.
The squared deviation of compressive stress was determined to be Sr = 0.769 MPa, R = 0.942, R2 = 0.887. The resulting regression equation showed that 88.7% of the variation in compressive stress values was caused by the density and fractional size of the sample, with the remaining 11.3% resulting from factors that were not evaluated.
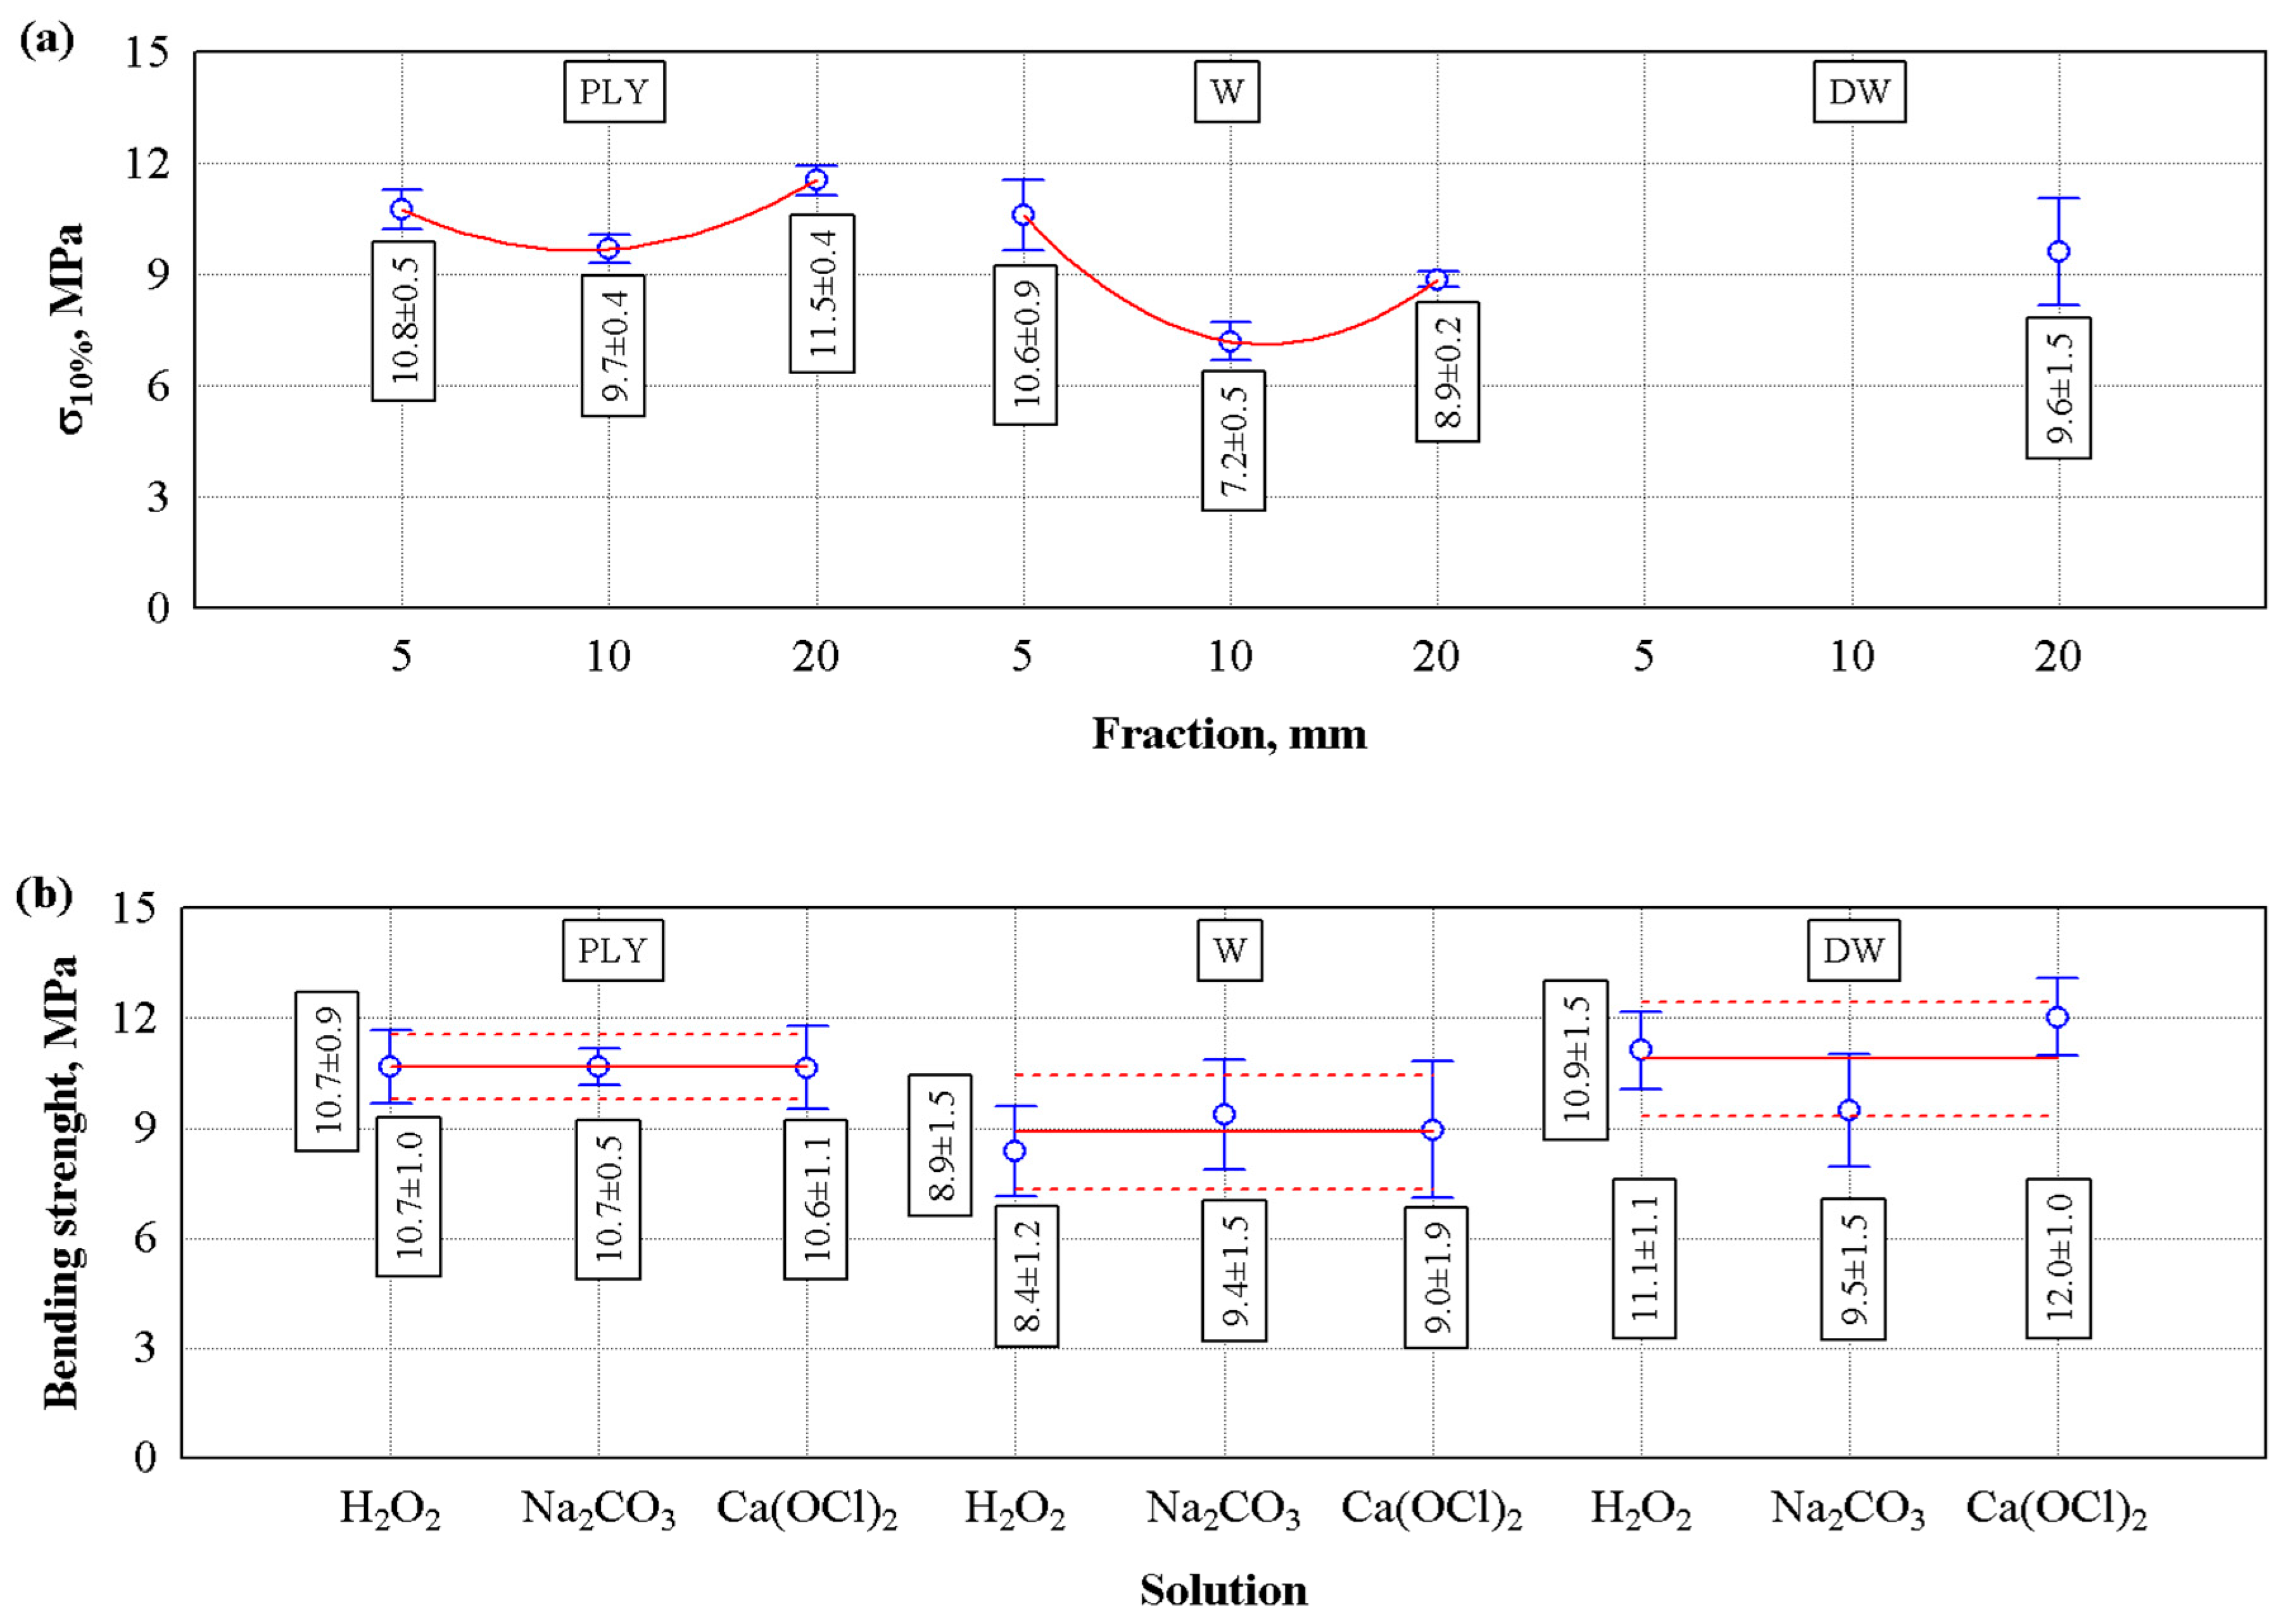
Figure 8 presents the bending strength analysis of composites from PLY, W, and DW wastes. The change in the bending strength of composites was investigated as a function of the fraction size of the raw material and the raw materials treated with different solutions.
Figure 8 shows that the bending strength of the composites of the PLY waste depended on the fraction size (see Figure 8a). The bending strength of composites from the PLY and W waste decreased with the fraction size varying from 5 to 20 mm. Statistical analysis showed that there is a significant difference in the bending strength results of composites from the PLY and W waste depending on the fraction size, which ranged from 5 to 20 mm. This was confirmed by the statistical analysis data obtained: composites from PLY waste F = 40.5; p = 0, composites from W waste F = 64.7; p = 0. As the raw material fraction size increased from 5 to 10 mm, the bending strength of composites from PLY waste decreased by ~11%, and as the fraction size increased from 10 to 20 mm, the bending strength increased by ~19%. As the raw material fraction size increased from 5 to 10 mm, the bending strength of the composite from wood packaging waste decreased by ~47%, while as the fraction size increased from 10 to 20 mm, the bending strength increased by ~23%. The bending strength of composites from the construction demolition and furniture, and wood packaging waste as a function of the fraction size was described by regression Equations (10) and (11), respectively:
σ b P L Y = 13.146 0.6119 · F r + 0.0266 · F r 2
σ b W = 16.835 1.5283 · F r + 0.05648 · F r 2
where ρ —density of the samples, kg/m3; F r —fraction, mm.
The data from the statistical analysis of the regression equations are presented in Table 9.
Analysis of bending strength after processing construction demolition and furniture, wood packaging and door production waste with various solutions: H2O2; Na2CO3; and Ca(OCl)2 are presented in Figure 8b. After processing PLY, W, and DW waste with different solutions and using them for composite production, the processing of raw materials with solutions does not affect the bending strength of the composite. This statement was confirmed by statistical analysis, which showed an insignificant difference in the averages of the test results (see Table 10).
After the analysis of the bending tests was performed, an attempt was made to combine the data from three types of composites into one array to describe the bending strength. The following parameters were used to describe the bending strength: density and fraction of the samples. The relationship between bending strength and both density and fraction size was described by the following Equation (12):
σ b g e n e r a l = 14.211 + 0.9269 · F r + 0.03279 · ρ + 0.0266 · F r · ρ
where σb—bending strength, MPa; Fr—fraction, mm; ρ—density of samples, kg/m3. The squared deviation of the bending strength was Sr = 0.878 MPa, R = 0.838, R2 = 0.733, n = 63. The regression equation obtained shows that 70.3% of the variation in the bending strength values is determined by the density and fraction size of the samples and 29.7% by other factors that were not evaluated.
The graphical interpretation of the regression equation is presented in Figure 9.

4. Discussion

The present study provides empirical evidence that wood waste can be reused for the development and production of high value products after use in various industrial applications. A variety of measures must be used to ensure that wood waste is used rationally, as illustrated in the present study. Research has focused on the mechanical preparation and thermochemical treatment of wood waste. Mechanical treatment yielded various particle sizes of wood waste, and the production of three fractions (0–5, 0–10, and 0–20). Thermochemical treatment has been demonstrated to be an effective method for the pretreatment of wood as a lignocellulosic biomass. This treatment has been determined to break the crosslinks between components, resulting in the separation of cellulose, hemicellulose, and lignin. The activation of hydroxyl groups has been shown to reduce the polarity difference between wood particles and the polymer matrix [45]. The thermochemical pretreatment has been conducted using both alkaline and oxidative solutions. The utilization of alkaline solutions has been demonstrated to enhance surface area by reducing crystallinity, while oxidizing solution have been shown to remove lignin and hemicellulose [46]. The findings of the study indicate that the nature of the solutions employed did not have a direct impact on the strength or density of the resulting EWC. However, it can be concluded that the thermochemical pretreatment was successful in modifying the surface properties of wood particles in all cases.
Research has determined that particle size has a significant impact on the density and strength of EWC. A significant amount of research has been conducted on the particle sizes and shapes of wood waste particles and their effect on the properties of composites. However, detailed comparisons are limited. It should be noted that raw materials, their processing, the choice of binder, the formulation of mixtures and the production technology have substantial differences and have different effects on the properties of wood composites. The authors [47] of the research paper point out that wood waste is shredded in a range of particle sizes for different applications. For particleboard production, the shredded wood is sized between 2–20 mm, while for cement-bonded composites, the size is typically between 0.3–5 mm. In some cases, the particle size of the wood also affects the surface quality of the final product, as it is important to avoid open pores on the surface of the product [48]. In the present study, wood particles within the 0.5 mm fraction were used for the outer layer, while those within the 2–8 mm fraction were used for the inner honeycomb [49].
This indicates that a decrease in tensile strength and bending strength values, and an increase in water absorption values, are observed with decreasing wood particle size. In contrast, in the present study, particle size had a significant influence on the density and compressive stress of the engineered wood composite, while the bending strength was not clearly influenced and was probably related to the nature of the waste wood [50].
Prepared particles ranging in size from 0.2 to 3.0 mm from wood waste were evaluated. The length-width ratio of the obtained particles was found to have an average value of 3.5, with a maximum and a minimum value ranging from 1 to 5. In this case, the particle aspect ratio, as well as circularity and roundness, showed a large spread of results in all cases. In our case, the aspect ratio of individual fractions and particles of different nature was significantly higher and varied from 2.5 to 7.0. It is important to note that the shape parameters of the particles are determined not only by the selected technology and grinding equipment, but also by their natural characteristics, as evidenced by the waste from the production of doors, which has not received any additional mechanical treatment [51].
The researchers report that experimental and theoretical investigations indicate that particle shape and size influence the dynamics of biomass particles, including drying, heating, and reaction rate. The evaluation of particle shapes in our work allowed for a comparative analysis of wood wastes of different nature, and it was found that the shape of the particles does not significantly affect the properties of the composite. As presented in the standard deviations, analysing the diversity of particles in terms of shape leads to the attainment of mean values that are close to each other for the quantities investigated. Furthermore, this analysis provides the opportunity to obtain composites that possess similar properties.
A potential area for further research is the composition of wood waste and the number of impurities in wood waste, which has not been assessed in this work. On the basis of visual analysis, the DW waste was found to include softwood and aluminium fibre, as well as softwood impregnated with protective agents. The PLY waste was found to consist of softwood, varnished softwood, plywood, particleboard, laminated board, fibreboard, and polyethylene particles. It was noted that the greater proportion of these particles was contaminated with paints, varnishes, adhesives, and impregnates.
The W waste contained hardwood and softwood particles. Wooden pallets are the least contaminated, although it is notable that pallets may contain very small amounts of marking paint, adhesives, and incidental chemicals due to the multiple uses of pallets in various applications. Research by other authors shows that non-wood waste in mixed wood waste ranges from 1.1 to 2.7% [19]. The present study has shown that the additional treatment of wood waste leads to a significant reduction in the influence of extraneous materials on the properties of the composite. The results of the study demonstrate that the type of wood waste used is not a significant factor in determining the suitability of wood waste for use in composites.
The nature of the waste wood did not have a significant effect on either the density or the strength of the composite. The chemical solutions used were observed to also not significantly affect the properties of the composite, but the wood waste itself had a greater influence. The number of solutes leached from the different materials resulted in a variation in the density.
The highest concentrations of leachate were found in the most contaminated waste streams, including those from construction demolition and furniture, and door manufacturing waste. It is probable that only natural soluble substances, such as sugars, tannins, and waxes, were leached from packaging waste. In this case, studies have demonstrated that the use of the least environmentally and human health-impacting Na2CO3 solution is perfectly adequate.
The biopolyurethane binder applied in this study has a significant impact on the creation and manufacture of engineered wood from the point of view of manufacturing and product shape. The primary benefit of the binder is that it simplifies the production of high-dimensional items without requiring the use of heat treatment. It is noteworthy that formaldehyde-based adhesives currently account for approximately 95% of all adhesives used in the production of wood-based panels worldwide [52].
As the authors note, a significant research focus in recent years has been on enhancing the properties of wood composites, reducing formaldehyde emissions from urea formaldehyde resin, and decreasing the time required for thermal pressing. Conventional binders are typically effective at curing temperatures ranging from 150 to 210 °C [53].
Furthermore, it is noteworthy that heat-seating compounds generally exhibit minimal dimensional variability, particularly in the thickness direction. During the curing process of thicker layers, the outer layers are at risk of overheating, leading to the initiation of pyrolysis processes. Meanwhile, the inner layers cannot achieve the optimal cure temperature, resulting in deficiencies in their properties [54].
Biopolyurethane is a material that has a number of notable advantages. First, it does not require heat treatment, and in addition, it contains a high proportion of renewable raw materials. Its carbon content is approximately 80% (when considering carbon preservation), and it is possible to adjust the curing time, making it an excellent alternative for the large-scale production of both flat and bulky products.

5. Conclusions

The granulometric composition of the wood waste particles was analysed, and it was concluded that the nature of the wood waste particles determines the particle size distribution. Specifically, door waste has a predominance of 0.315–1.25 mm particles, while construction demolition and furniture waste, and packaging waste have a predominance of ≥2.5 mm particles.
The shape of the wood waste particles visually varies among all waste, but the average values of aspect ratio, roundness, and circularity do not significantly affect their density and strength indicators.
The efficiency of thermochemical treatment of wood waste particles is more related to the nature of the waste itself than to the specific solution used. In all cases, thermochemical treatment has the least influence on both density and strength indicators when processing packaging waste, while the efficiency is similar when processing construction demolition and furniture waste and packaging waste.
The greatest influence on the density of composites is the granulometric composition; the larger the particles, the lower the density of the composite. The same trends are observed when analysing compressive stress. It is likely that the biopolyurethane binder fills the gaps between fine particles better, so the particles adhere more reliably, and at the same time, the density increases. In the case of bending strength, the fraction has a more complex influence. Composites are characterised by a lower bending strength when using a 10 mm fraction. Chemical treatment agents do not affect the bending strength of the composite, or their influence is insignificant.

Author Contributions

Conceptualisation, S.V. (Sigitas Vėjelis) and A.R.; methodology, S.V. (Sigitas Vėjelis) and A.R.; software, A.R. and S.V. (Saulius Vaitkus); validation, S.V. (Sigitas Vėjelis) and A.R.; formal analysis, S.V. (Sigitas Vėjelis) and S.V. (Saulius Vaitkus); investigation, A.R., S.V. (Sigitas Vėjelis), and S.V. (Saulius Vaitkus); resources, A.R. and S.V. (Sigitas Vėjelis); data curation, S.V. (Sigitas Vėjelis); writing, S.V. (Sigitas Vėjelis) and A.R.; writing—review and editing, S.V. (Sigitas Vėjelis) and A.R.; visualisation A.R.; supervision, S.V. (Sigitas Vėjelis) and A.R. All authors have read and agreed to the published version of the manuscript.

Funding

This research has received funding from the Research Council of Lithuania (LMTLT), agreement number S-MIP-23-121; research project “Development of large-scale engineered wood from renewable resources and evaluation of its performance”.

Data Availability Statement

The original contributions presented in the study are included in the article, further inquiries can be directed to the corresponding author.

Conflicts of Interest

The authors declare no conflicts of interest.

Abbreviations

The following abbreviations are used in this manuscript:
EWCEngineered wood composite
PLYConstruction demolition and furniture waste
DWDoor production waste
WPackaging waste
H2O2Hydrogen peroxide
Na2CO3Sodium carbonate
Ca (OCl)2Calcium hypochlorite

References

  1. Guo, J.; Zhang, Y.; Fang, J.; Ma, Z.; Li, C.; Yan, M.; Qiao, N.; Liu, Y.; Bian, M. Reduction and Reuse of Forestry and Agricultural Bio-Waste Through Innovative Green Utilization Approaches: A Review. Forests 2024, 15, 1372. [Google Scholar] [CrossRef]
  2. CONAMA. Ministry of Environment. National Council of the Environment, Resolution. 2016, No. 474. p. 74. Available online: https://www.in.gov.br/materia/-/asset_publisher/Kujrw0TZC2Mb/content/id/22787983/do1-2016-05-02-resolucao-n-474-de-6-de-abril-de-2016--22787761 (accessed on 22 February 2025).
  3. Association of Private Forest Owners. Classification of the Wood Stem According to the Parts of the Tree. 2024. Available online: https://www.pmsa.lt/ (accessed on 22 February 2025).
  4. Official Statistics Portal. Waste Generation in Lithuania, 2019–2021. Environment, Agriculture and Energy in Lithuania (Edition 2023). 2023. Available online: https://osp.stat.gov.lt/lietuvos-aplinka-zemes-ukis-ir-energetika-2023/aplinka/atliekos (accessed on 16 February 2025).
  5. Bergeron, F.C. Assessment of the Coherence of the Swiss Waste Wood Management. Resour. Conserv. Recycl. 2014, 91, 62–70. [Google Scholar] [CrossRef]
  6. Edo, M.; Björn, E.; Persson, P.E.; Jansson, S. Assessment of Chemical and Material Contamination in Waste Wood Fuels—A Case Study Ranging over Nine Years. Waste Manag. 2016, 49, 311–319. [Google Scholar] [CrossRef]
  7. Besserer, A.; Troilo, S.; Girods, P.; Rogaume, Y.; Brosse, N. Cascading Recycling of Wood Waste: A Review. Polymers 2021, 13, 1752. [Google Scholar] [CrossRef] [PubMed]
  8. Jan, V.M. Überblick Über Den Europäischen Markt, SUEZ Trading. BAV-Altholztag, München, Deutschland; European Market Overview, SUEZ Trading; German Waste Wood Association—Waste Wood Day: Munich, Germany, 2019. [Google Scholar]
  9. Rautkoski, H.; Vähä-Nissi, M.; Kataja, K.; Gestranius, M.; Liukkonen, S.; Määttänen, M.; Liukkonen, J.; Kouko, J.; Asikainen, S. Recycling of Contaminated Construction and Demolition Wood Waste. Waste Biomass Valorization 2016, 7, 615–624. [Google Scholar] [CrossRef]
  10. Mulder, E.; de Jong, T.P.R.; Feenstra, L. Closed Cycle Construction: An Integrated Process for the Separation and Reuse of C&D Waste. Waste Manag. 2007, 27, 1408–1415. [Google Scholar] [CrossRef]
  11. Woolf, D.; Lehmann, J.; Fisher, E.M.; Angenent, L.T. Biofuels from Pyrolysis in Perspective: Trade-Offs between Energy Yields and Soil-Carbon Additions. Environ. Sci. Technol. 2014, 48, 6492–6499. [Google Scholar] [CrossRef]
  12. European Commission. Construction and Demolition Waste. EU Rules Aim to Ensure That This Waste Is Managed in an Environmentally Sound Way, and to Contribute to the Circular Economy. December 2008. Available online: https://environment.ec.europa.eu/topics/waste-and-recycling/construction-and-demolition-waste_en?prefLang=lt (accessed on 22 February 2025).
  13. Purkus, A.; Lüdtke, J.; Becher, G.; Dieter, M.; Jochem, D.; Lehnen, R.; Liesebach, M.; Polley, H.; Rüter, S.; Schweinle, J.; et al. Evaluation of the Charter for Wood 2.0: Methodological Principles and Evaluation Concept; Thünen Report 68; Johann Heinrich von Thünen-Institut: Braunschweig, Germany, 2019. [Google Scholar]
  14. Ikenze, N.; Rizos, V.; Nipius, L. Improving Waste Wood Circularity in the EU: Classification Frameworks and Policy Options; Technical Report; CEPS: Brussels, Belgium, 2024. [Google Scholar]
  15. Waste Incineration in the Nordic Countries. 2024. Available online: https://pub.norden.org/temanord2024-524/temanord2024-524.pdf (accessed on 16 February 2025).
  16. German Waste Wood Association. Waste Wood Markets in Europa, Category Europe. Bundesverband der Altholzaufbereiter und -Verwerter (BAV e.V.). 2021. Available online: https://altholzverband.de/2021/09/27/waste-wood-markets-in-europe/ (accessed on 22 February 2025).
  17. Faraca, G.; Boldrin, A.; Astrup, T. Resource Quality of Wood Waste: The Importance of Physical and Chemical Impurities in Wood Waste for Recycling. Waste Manag. 2019, 87, 135–147. [Google Scholar] [CrossRef]
  18. Nagalli, A.; Lopes, F.P.; Pereira, P.M.; Hamaya, R.M.; Luis, R.; Izzo, S. Analysis of Wood Waste Contamination Used in Construction Sites. EJGE 2013, 18, 3999. [Google Scholar]
  19. Lesar, B.; Humar, M.; Hora, G. Quality Assessment of Recycled Wood with and without Non-Wooden Materials from Selected Recycling Companies in Europe. Waste Manag. 2018, 79, 362–373. [Google Scholar] [CrossRef]
  20. Robey, N.M.; Solo-Gabriele, H.M.; Jones, A.S.; Marini, J.; Townsend, T.G. Metals Content of Recycled Construction and Demolition Wood before and after Implementation of Best Management Practices. Environ. Pollut. 2018, 242, 1198–1205. [Google Scholar] [CrossRef]
  21. Azambuja Rda, R.; de Castro, V.G.; Trianoski, R.; Iwakiri, S. Recycling Wood Waste from Construction and Demolition to Produce Particleboards. Maderas. Cienc. Tecnol. 2018, 20, 681–690. [Google Scholar] [CrossRef]
  22. Hameed, M.; Rönnols, E.; Bramryd, T. Particleboard Based on Wood Waste Material and Bonded by Hibrid Resin of TF and PMDI. Part 1. The Mechanical and Physical Properties of the Particle Boards. Holztechnologie 2018, 59, 24–32. [Google Scholar]
  23. Laskowska, A.; Mamiński, M. Properties of Particleboard Produced from Post-Industrial UF- and PF-Bonded Plywood. Eur. J. Wood Wood Prod. 2018, 76, 427–435. [Google Scholar] [CrossRef]
  24. Mirski, R.; Dziurka, D. The Utilization of Chips from Comminuted Wood Waste as a Substitute for Flakes in the Oriented Strand Board Core. For. Prod. J. 2011, 61, 473–477. [Google Scholar] [CrossRef]
  25. Roffael, E.; Behn, C.; Schneider, T.; Krug, D. Bonding of Recycled Fibres with Urea-Formaldehyde Resins. Int. Wood Prod. J. 2016, 7, 36–45. [Google Scholar]
  26. Schild, A.; Cool, J.; Barbu, M.C.; Smith, G.D. Feasibility of Substituting Core Layer Strands in Randomly OSB with Contaminated Waste Wood Particles. Wood Mater. Sci. Eng. 2019, 16, 170–177. [Google Scholar]
  27. Yang, T.H.; Lin, C.J.; Wang, S.Y.; Tsai, M.J. Characteristics of Particleboard Made from Recycled Wood-Waste Chips Impregnated with Phenol Formaldehyde Resin. Build. Environ. 2007, 42, 189–195. [Google Scholar] [CrossRef]
  28. Nguyen, D.L.; Luedtke, J.; Nopens, M.; Krause, A. Production of Wood-Based Panel from Recycled Wood Resource: A Literature Review. Eur. J. Wood Wood Prod. 2023, 81, 557–570. [Google Scholar] [CrossRef]
  29. Alsaffar, A.K.K.; Alquzweeni, S.S.; Al-Ameer, L.R.; Ali, A.H.; Mohamed, A.; Aldaihani, H.M.; Reham, A.; Al-Ansari, N.; Al-Hashimi, O.; Shubbar, A.; et al. Development of Eco-Friendly Wall Insulation Layer Utilising the Wastes of the Packing Industry. Heliyon 2023, 9, e21799. [Google Scholar] [CrossRef]
  30. Tanthanawiwat, K.; Gheewala, S.H.; Nilsalab, P.; Schoch, M.; Silalertruksa, T. Environmental Sustainability and Cost Performances of Construction and Demolition Waste Management Scenarios: A Case Study of Timber and Concrete Houses in Thailand. J. Clean. Prod. 2024, 436, 140652. [Google Scholar] [CrossRef]
  31. Gibier, M.; Sadeghisadeghabad, M.; Girods, P.; Zoulalian, A.; Rogaume, Y. Furniture Wood Waste Depollution through Hydrolysis under Pressurized Water Steam: Experimental Work and Kinetic Modelization. J. Hazard. Mater. 2022, 436, 129126. [Google Scholar] [CrossRef]
  32. Asa, P.; El Feghali, C.; Steixner, C.; Tahouni, Y.; Wagner, H.J.; Knippers, J.; Menges, A. Embraced Wood: Circular Construction Method for Composite Long-Span Beams from Unprocessed Reclaimed Timber, Fibers and Clay. Constr. Build. Mater. 2024, 416, 135096. [Google Scholar] [CrossRef]
  33. Pazzaglia, A.; Castellani, B. A Decision Tool for the Valorization of Wood Waste. Environ. Clim. Technol. 2023, 27, 824–835. [Google Scholar] [CrossRef]
  34. Astari, L.; Prasetiyo, K.W.; Suryanegara, L. Properties of Particleboard Made from Wood Waste with Various Size. In Proceedings of the Humanosphere Science School 2017 & the 7th International Symposium for a Sustainable Humanosphere, Bogor, Indonesia, 1–2 November 2017; Volume 166. [Google Scholar] [CrossRef]
  35. Bekhta, P.; Kozak, R.; Gryc, V.; Sebera, V.; Tippner, J. Effects of Wood Particles from Deadwood on the Properties and Formaldehyde Emission of Particleboards. Polymers 2022, 14, 3535. [Google Scholar] [CrossRef]
  36. Stoeckel, F.; Konnerth, J.; Gindl-Altmutter, W. Mechanical Properties of Adhesives for Bonding Wood-A Review. Int. J. Adhes. Adhes. 2013, 45, 32–41. [Google Scholar] [CrossRef]
  37. Chen, H.; Wu, Q.; Ren, X.; Zhu, X.; Fan, D. A Fully Bio-Based Adhesive with High Bonding Strength, Low Environmental Impact, and Competitive Economic Performance. Chemical Eng. J. 2024, 494, 153198. [Google Scholar] [CrossRef]
  38. Solt, P.; Konnerth, J.; Gindl-Altmutter, W.; Kantner, W.; Moser, J.; Mitter, R.; van Herwijnen, H.W.G. Technological Performance of Formaldehyde-Free Adhesive Alternatives for Particleboard Industry. Int. J. Adhes. Adhes. 2019, 94, 99–131. [Google Scholar] [CrossRef]
  39. Thoemen, H. Wood-Based Panels—An Introduction for Specialists; Brunel University Press: Brunel, UK, 2010. [Google Scholar]
  40. Olszewski, A.; Kosmela, P.; Piszczyk, Ł. A Novel Approach in Wood Waste Utilization for Manufacturing of Catalyst-Free Polyurethane-Wood Composites (PU-WC). Sustain. Mater. Technol. 2023, 36, e00619. [Google Scholar] [CrossRef]
  41. ISO Standard No. 29469; Thermal Insulating Products for Building Applications—Determination of Compression Behaviour. European Committee for Standartization: Brussels, Belgium, 2022.
  42. EN 310:1993; Wood-Based Panels—Determination of Modulus of Elasticity in Bending and of Bending Strength (EN Standard No. EN 310). European Standard: Brussels, Belgium, 1993.
  43. TIMCO Software Inc. Data Science Textbook. 2020. Available online: https://docs.tibco.com/data-science/GUID-FE8CE528-28B3-4898-993D-097A87EF8407-homepage.html (accessed on 22 February 2025).
  44. Ferreira, T.; Rasband, W. ImageJ User Guide. 2012. Available online: https://imagej.net/ij/docs/guide/user-guide.pdf (accessed on 22 February 2025).
  45. Li, X.; Tabil, L.G.; Panigrahi, S. Chemical Treatments of Natural Fiber for Use in Natural Fiber-Reinforced Composites: A Review. J. Polym. Environ. 2007, 15, 25–33. [Google Scholar] [CrossRef]
  46. Roy, R.; Rahman, M.S.; Raynie, D.E. Recent Advances of Greener Pretreatment Technologies of Lignocellulose. Curr. Res. Green Sustain. Chem. 2020, 3, 100035. [Google Scholar] [CrossRef]
  47. Hossain, M.U.; Poon, C.S. Comparative LCA of Wood Waste Management Strategies Generated from Building Construction Activities. J. Clean. Prod. 2018, 177, 387–397. [Google Scholar] [CrossRef]
  48. Pędzik, M.; Kwidziński, Z.; Janiszewska-Latterini, D.; Rogoziński, T. Particleboard from the Residues of Wooden Door Production as a Closed Material Cycle. Ind. Crop. Prod. 2024, 222, 119653. [Google Scholar] [CrossRef]
  49. Bazzetto, J.T.D.L.; Bortoletto Junior, G.; Brito, F.M.S. Effect of Particle Size on Bamboo Particle Board Properties. Floresta Ambiente 2019, 26, e20170125. [Google Scholar] [CrossRef]
  50. Liu, D.; Qasem, B.; Hou, J.; Wang, Z.; Cen, J.; Arkin, S.; Zhang, X.; Zhang, Y.; Yu, Y. Recycling Construction Wastes to Fabricate Particle Boards with Admirable Flame Retardancy, Smoke Suppression and Mechanical Performance. Constr. Build. Mater. 2023, 404, 133265. [Google Scholar] [CrossRef]
  51. Lu, H.; Ip, E.; Scott, J.; Foster, P.; Vickers, M.; Baxter, L.L. Effects of Particle Shape and Size on Devolatilization of Biomass Particle. Fuel 2010, 89, 1156–1168. [Google Scholar] [CrossRef]
  52. Lee, S.H.; Lum, W.C.; Boon, J.G.; Kristak, L.; Antov, P.; Pedzik, M.; Rogozinski, T.; Taghiyari, H.R.; Lubis, M.A.R.; Fatriasari, W.; et al. Particleboard from Agricultural Biomass and Recycled Wood Waste: A Review. J. Mater. Res. Technol. 2022, 20, 4630–4658. [Google Scholar] [CrossRef]
  53. Esteves, B.; Aires, P.; Sen, U.; Gomes, M.D.G.; Guiné, R.P.F.; Domingos, I.; Ferreira, J.; Viana, H.; Cruz-Lopes, L.P. Particleboard Production from Paulownia Tomentosa (Thunb.) Steud. Grown in Portugal. Polymers 2023, 15, 1158. [Google Scholar] [CrossRef]
  54. Krumins, J.A.; Vamza, I.; Dzalbs, A.; Blumberga, D. Particle Boards from Forest Residues and Bio-Based Adhesive. Buildings 2024, 14, 462. [Google Scholar] [CrossRef]
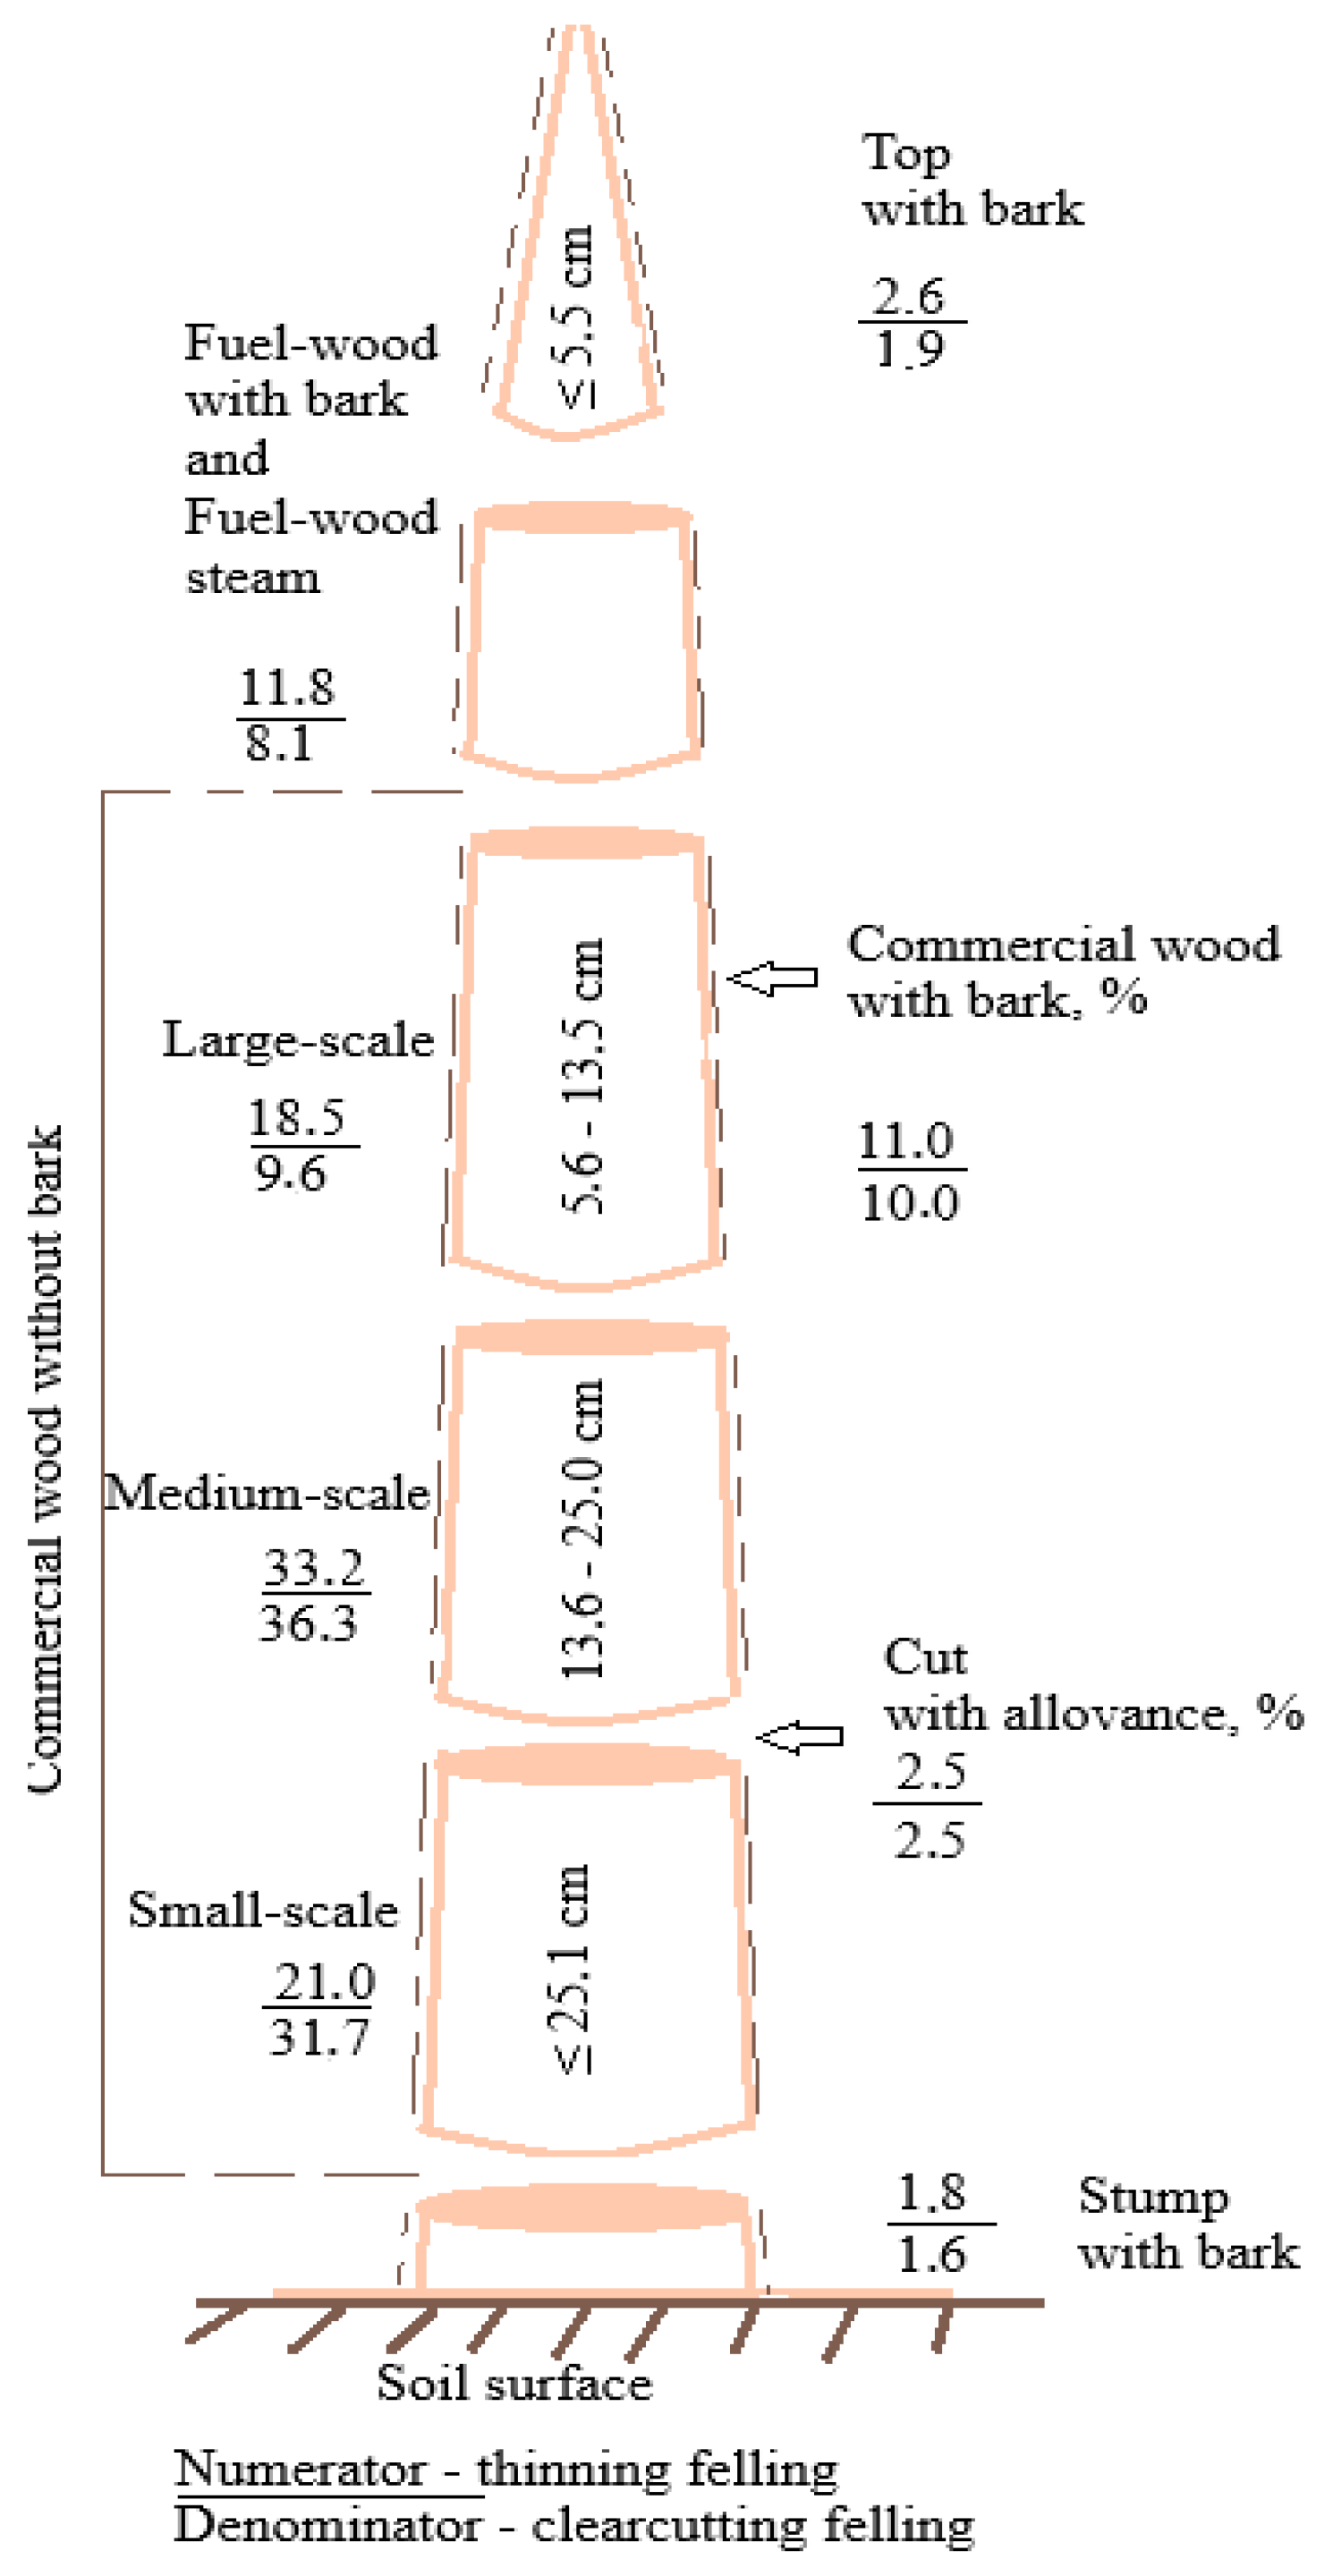
Figure 1. Classification of the wood stem according to parts of the tree [1].
Forests 16 00577 g001
Figure 2. Wood waste as raw material from: (a) DW; (b) W; (c) PLY.
Forests 16 00577 g002
Figure 3. The granulometric composition of wood waste samples: (a) DW; (b) PLY; (c) W.
Forests 16 00577 g003
Figure 4. View of different fractional wood waste particles, mm: (a) 0–<5, PLY; (b) ≥5–<10, PLY; (c) ≥10–<20, PLY; (d) 0–<5, W; (e) ≥5–<10, W; (f) ≥10–<20, W; (g) 0–<5, DW; (h) ≥5–<10, DW; (i) ≥10–<20, DW.
Forests 16 00577 g004
Figure 5. The dependence of density on (a) fraction and (b) chemical treatment method; ─── average line; - - - - confidence intervals with 0.95 probability.
Forests 16 00577 g005
Figure 6. The influence of different raw materials on the compressive stress of composites: (a) dependence of the compressive stress of the composite on the raw material fraction; (b) dependence of the compressive stress of the composite on the type of solution after processing the raw materials; ─── average line; - - - - confidence intervals with 0.95 probability.
Forests 16 00577 g006
Figure 7. Relationship between compressive stress, the fraction, and density of the composite; —experimental data.
Forests 16 00577 g007
Figure 8. The influence of different raw materials on the bending strength of composites: (a) dependence of the bending strength of the composite on the raw material fraction; (b) dependence of the bending strength of the composite on the type of solution after processing the raw materials; ─── average line; - - - - confidence intervals with 0.95 probability.
Forests 16 00577 g008
Figure 9. Graphical interpretation of the regression dependence (12) describing the bending strength values of composites; —experimental data.
Forests 16 00577 g009
Table 1. The present inventory comprises data related to the removal of trees in Lithuania, classified according to the structure of the tree stem assortment, year 2012.
FellingTreesCommercial WoodFuel-WoodResiduesStemsDead TreesBranches
Large-ScaleMedium-ScaleSmall-ScaleTotal
% of the Volume of Green Tree Stemsm/ha
ClearcuttingGreen31.736.39.677.68.114.3230.2 36.5
Dryon an area of 20 987 ha 8.7
ThinningGreen21.033.218.572.711.815.5
Dryon an area of 120 315 ha. 6.0
Table 2. Preparation of wood waste samples.
No.Sample CodeWood Waste SourceWood Particle Size, mmChemical Treatment Solution, 10%
1PLY 0/5_H2O2PLY≤5hydrogen peroxide
2PLY 0/5_Na2CO3sodium carbonate
3PLY 0/5_Ca(OCl)2calcium hypochlorite
4PLY 0/10_H2O2≤10hydrogen peroxide
5PLY 0/10_Na2CO3sodium carbonate
6PLY 0/10_Ca(OCl)2calcium hypochlorite
7PLY 0/20_H2O2≤20hydrogen peroxide
8PLY 0/20_Na2CO3sodium carbonate
9PLY 0/20_Ca(OCl)2calcium hypochlorite
10DW 0/5_H2O2DW≤5hydrogen peroxide
11DW 0/5_Na2CO3sodium carbonate
12DW 0/5_Ca(OCl)2calcium hypochlorite
13DW 0/10_H2O2≤10hydrogen peroxide
14DW 0/10_Na2CO3sodium carbonate
15DW 0/10_Ca(OCl)2calcium hypochlorite
16DW 0/20_H2O2≤20hydrogen peroxide
17DW 0/20_Na2CO3sodium carbonate
18DW 0/20_Ca(OCl)2calcium hypochlorite
19W 0/5_H2O2W≤5hydrogen peroxide
20W 0/5_Na2CO3sodium carbonate
21W 0/5_Ca(OCl)2calcium hypochlorite
22W 0/10_H2O2≤10hydrogen peroxide
23W 0/10_Na2CO3sodium carbonate
24W 0/10_Ca(OCl)2calcium hypochlorite
25W 0/20_H2O2≤20hydrogen peroxide
26W 0/20_Na2CO3sodium carbonate
27W 0/20_Ca(OCl)2calcium hypochlorite
28PLYPLY≤20without chemical treatment
29DWDW
30WW
Table 3. Ratios of raw materials for the preparation of mixtures.
Biopolyurethane, %Wood Waste, %
IsocyanatePolyolRapeseed Oil
18221050
Table 4. Analysis of the shape of particles.
Type and Fraction of Wood WasteAspect Ratio RoundnessCircularity
W, 0–<54.110 ± 3.2700.373 ± 0.2090.515 ± 0.224
W, ≥5–<104.869 ± 6.3880.446 ± 0.2550.558 ± 0.259
W, ≥10–<203.228 ± 2.3520.460 ± 0.2420.616 ± 0.235
PLY, 0–<53.850 ± 1.8180.317 ± 0.1430.435 ± 0.172
PLY, ≥5–<10,6.153 ± 4.0280.245 ± 0.1860.432 ± 0.188
PLY, ≥10–<206.952 ± 5.8740.210 ± 0.1120.389 ± 0.151
DW, 0–<52.499 ± 1.7340.525 ± 0.2360.709 ± 0.237
DW, ≥5–<103.838 ± 2.5500.364 ± 0.1890.365 ± 0.220
DW, ≥10–<203.348 ± 2.3500.391 ± 0.1650.378 ± 0.198
Table 5. The data of regression equations.
Type of
Composite
Number of SpecimensCorrelation Coefficient RCoefficient of
Determination R2
Standard
Deviation Sr, kg⁄m3
PLY waste (Equation (4))540.6470.42040.4
W waste (Equation (5))540.9040.81830.0
Table 6. Statistical analysis of test results.
Type of
Composite
Density,
kg/m3
F Criterionp ValueCorrelation
Coefficient R
Coefficient of
Determination R2
PLY waste752 ± 520.150.860.0710.00596
W waste 639 ± 690.360.700.1170.0137
DW815 ± 370.590.560.2710.0734
Table 7. The data of regression equations.
Type of
Composite
Number of
Specimens
Correlation
Coefficient R
Coefficient of
Determination R2
Standard
Deviation Sr, MPa
PLY waste (Equation (7))270.8040.6471.18
W waste (Equation (8))270.8970.8051.94
Table 8. Statistical analysis of test results.
Type of
Composite
F Criterionp ValueCorrelation
Coefficient R
Coefficient of
Determination R2
PLY waste1.900.170.3700.137
W waste 0.370.690.1740.0302
DW0.240.790.2720.0742
Table 9. The data of regression equations.
Type of
Composite
Number of SpecimensCorrelation
Coefficient R
Coefficient of
Determination R2
Standard
Deviation Sr, MPa
PLY waste (Equation (7))270.8780.7710.440
W waste (Equation (8))270.9180.8440.635
Table 10. Statistical analysis of test results.
Type of
Composite
Bending Strength, MPaF criterionp ValueCorrelation
Coefficient R
Coefficient of
Determination R2
PLY waste10.7 ± 0.90.00230.990.01390.000193
W waste 8.9 ± 1.50.980.390.2750.0758
DW10.9 ± 1.50.240.800.2710.0735
Disclaimer/Publisher’s Note: The statements, opinions and data contained in all publications are solely those of the individual author(s) and contributor(s) and not of MDPI and/or the editor(s). MDPI and/or the editor(s) disclaim responsibility for any injury to people or property resulting from any ideas, methods, instructions or products referred to in the content.