
Structure and Composition of a Selectively Logged Miombo Woodland in Central Mozambique


Abstract
1. Introduction
2. Materials and Methods
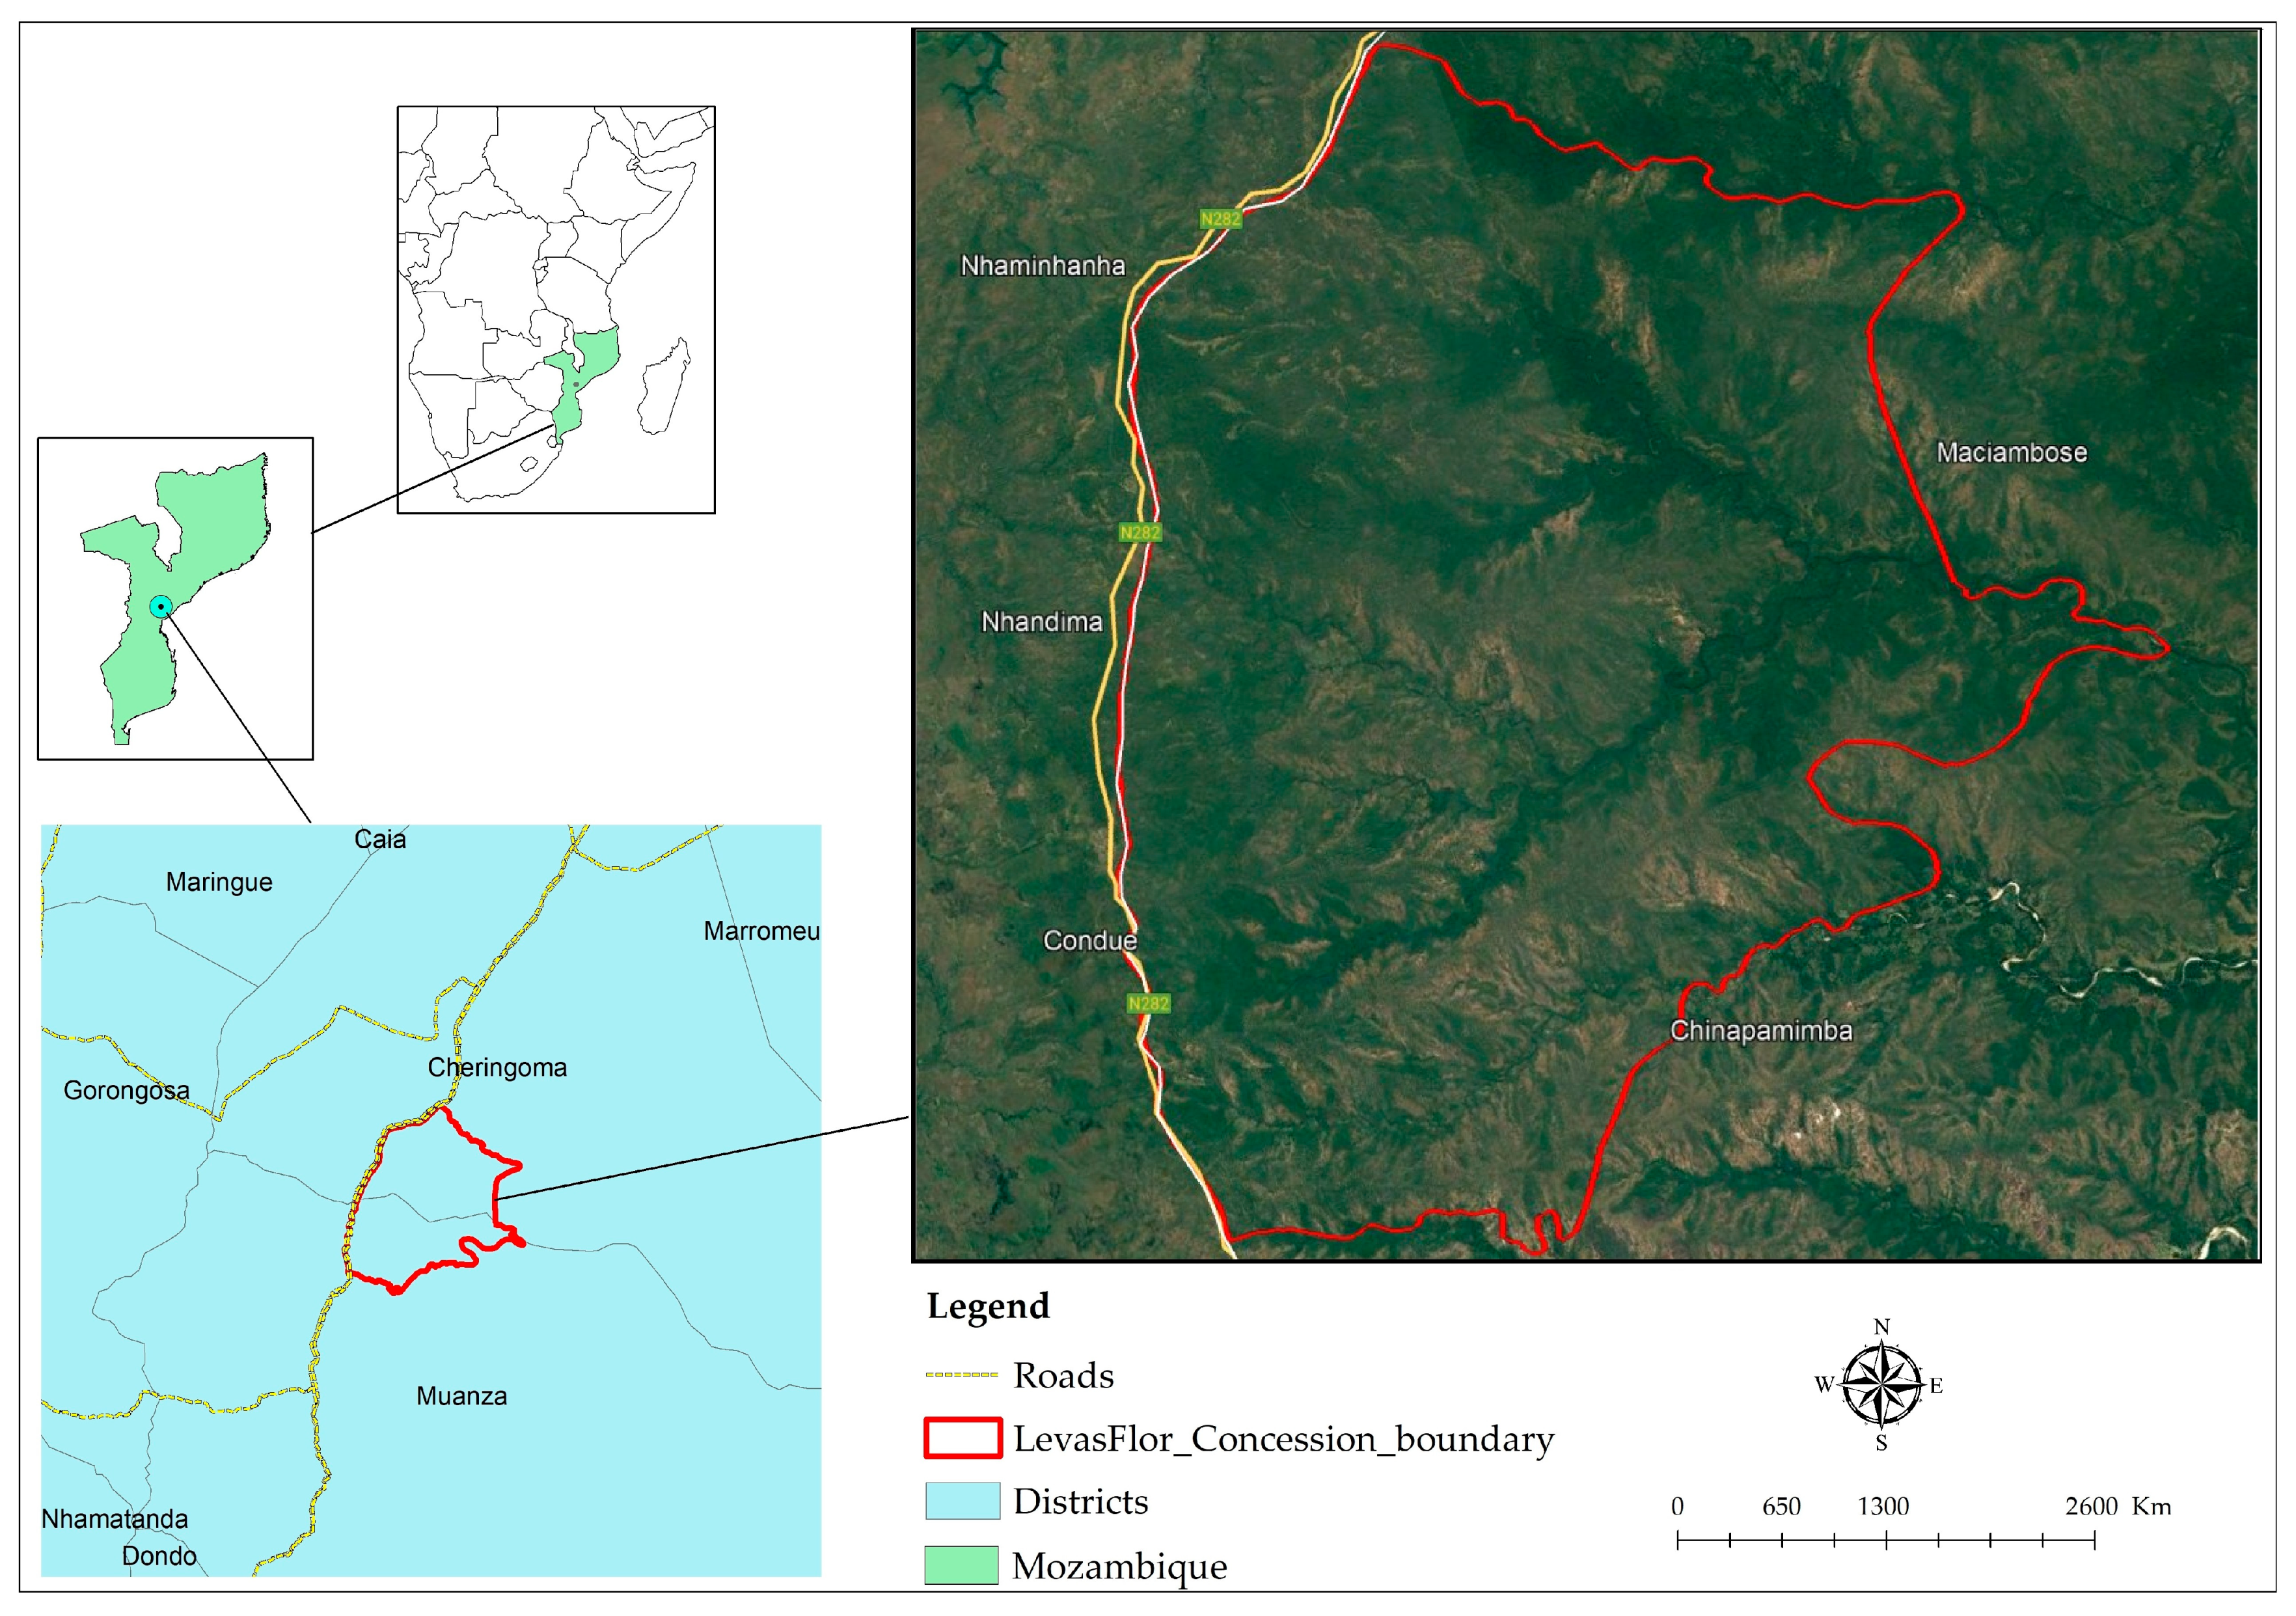
2.1. Study Area
2.2. Methods
2.2.1. Data Collection
2.2.2. Data Analysis
3. Results
3.1. Stand Structure
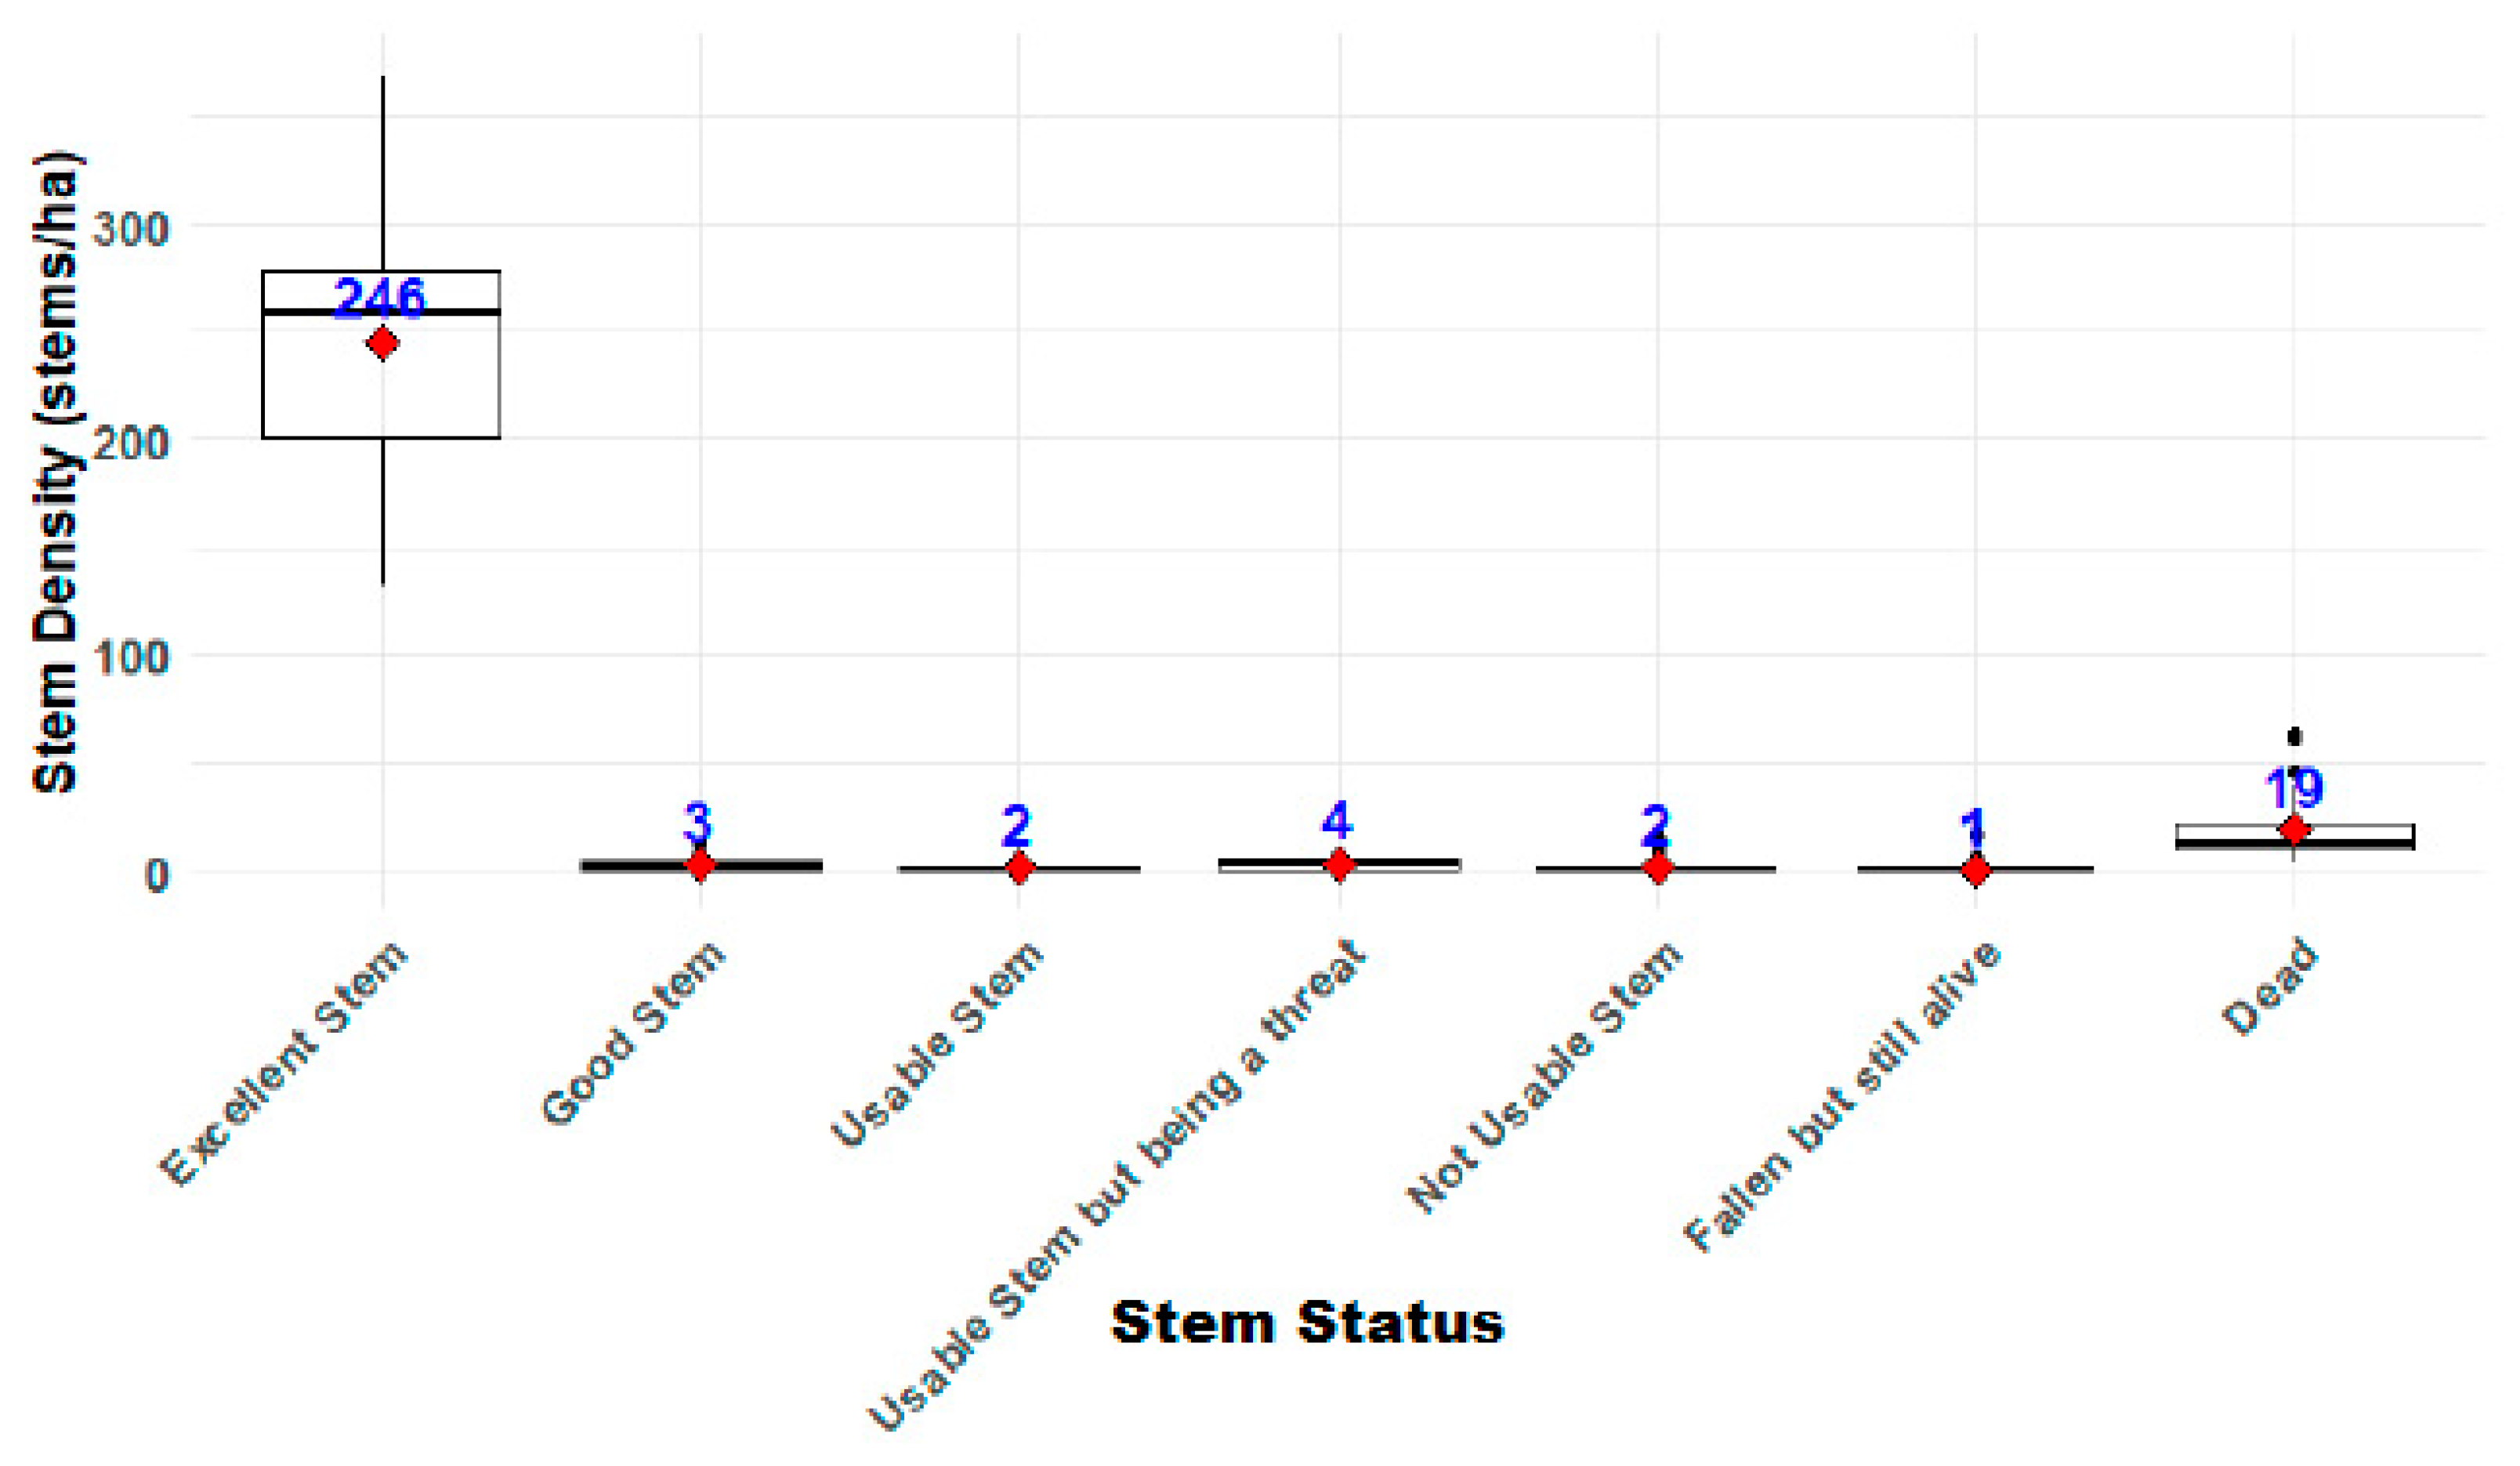
3.1.1. Stand Structure by Stem Quality and Health Status
3.1.2. Stand Structure by Stem Density, Basal Area, Above Ground Biomass, Stem and Total Volume for All Trees Within the Stand
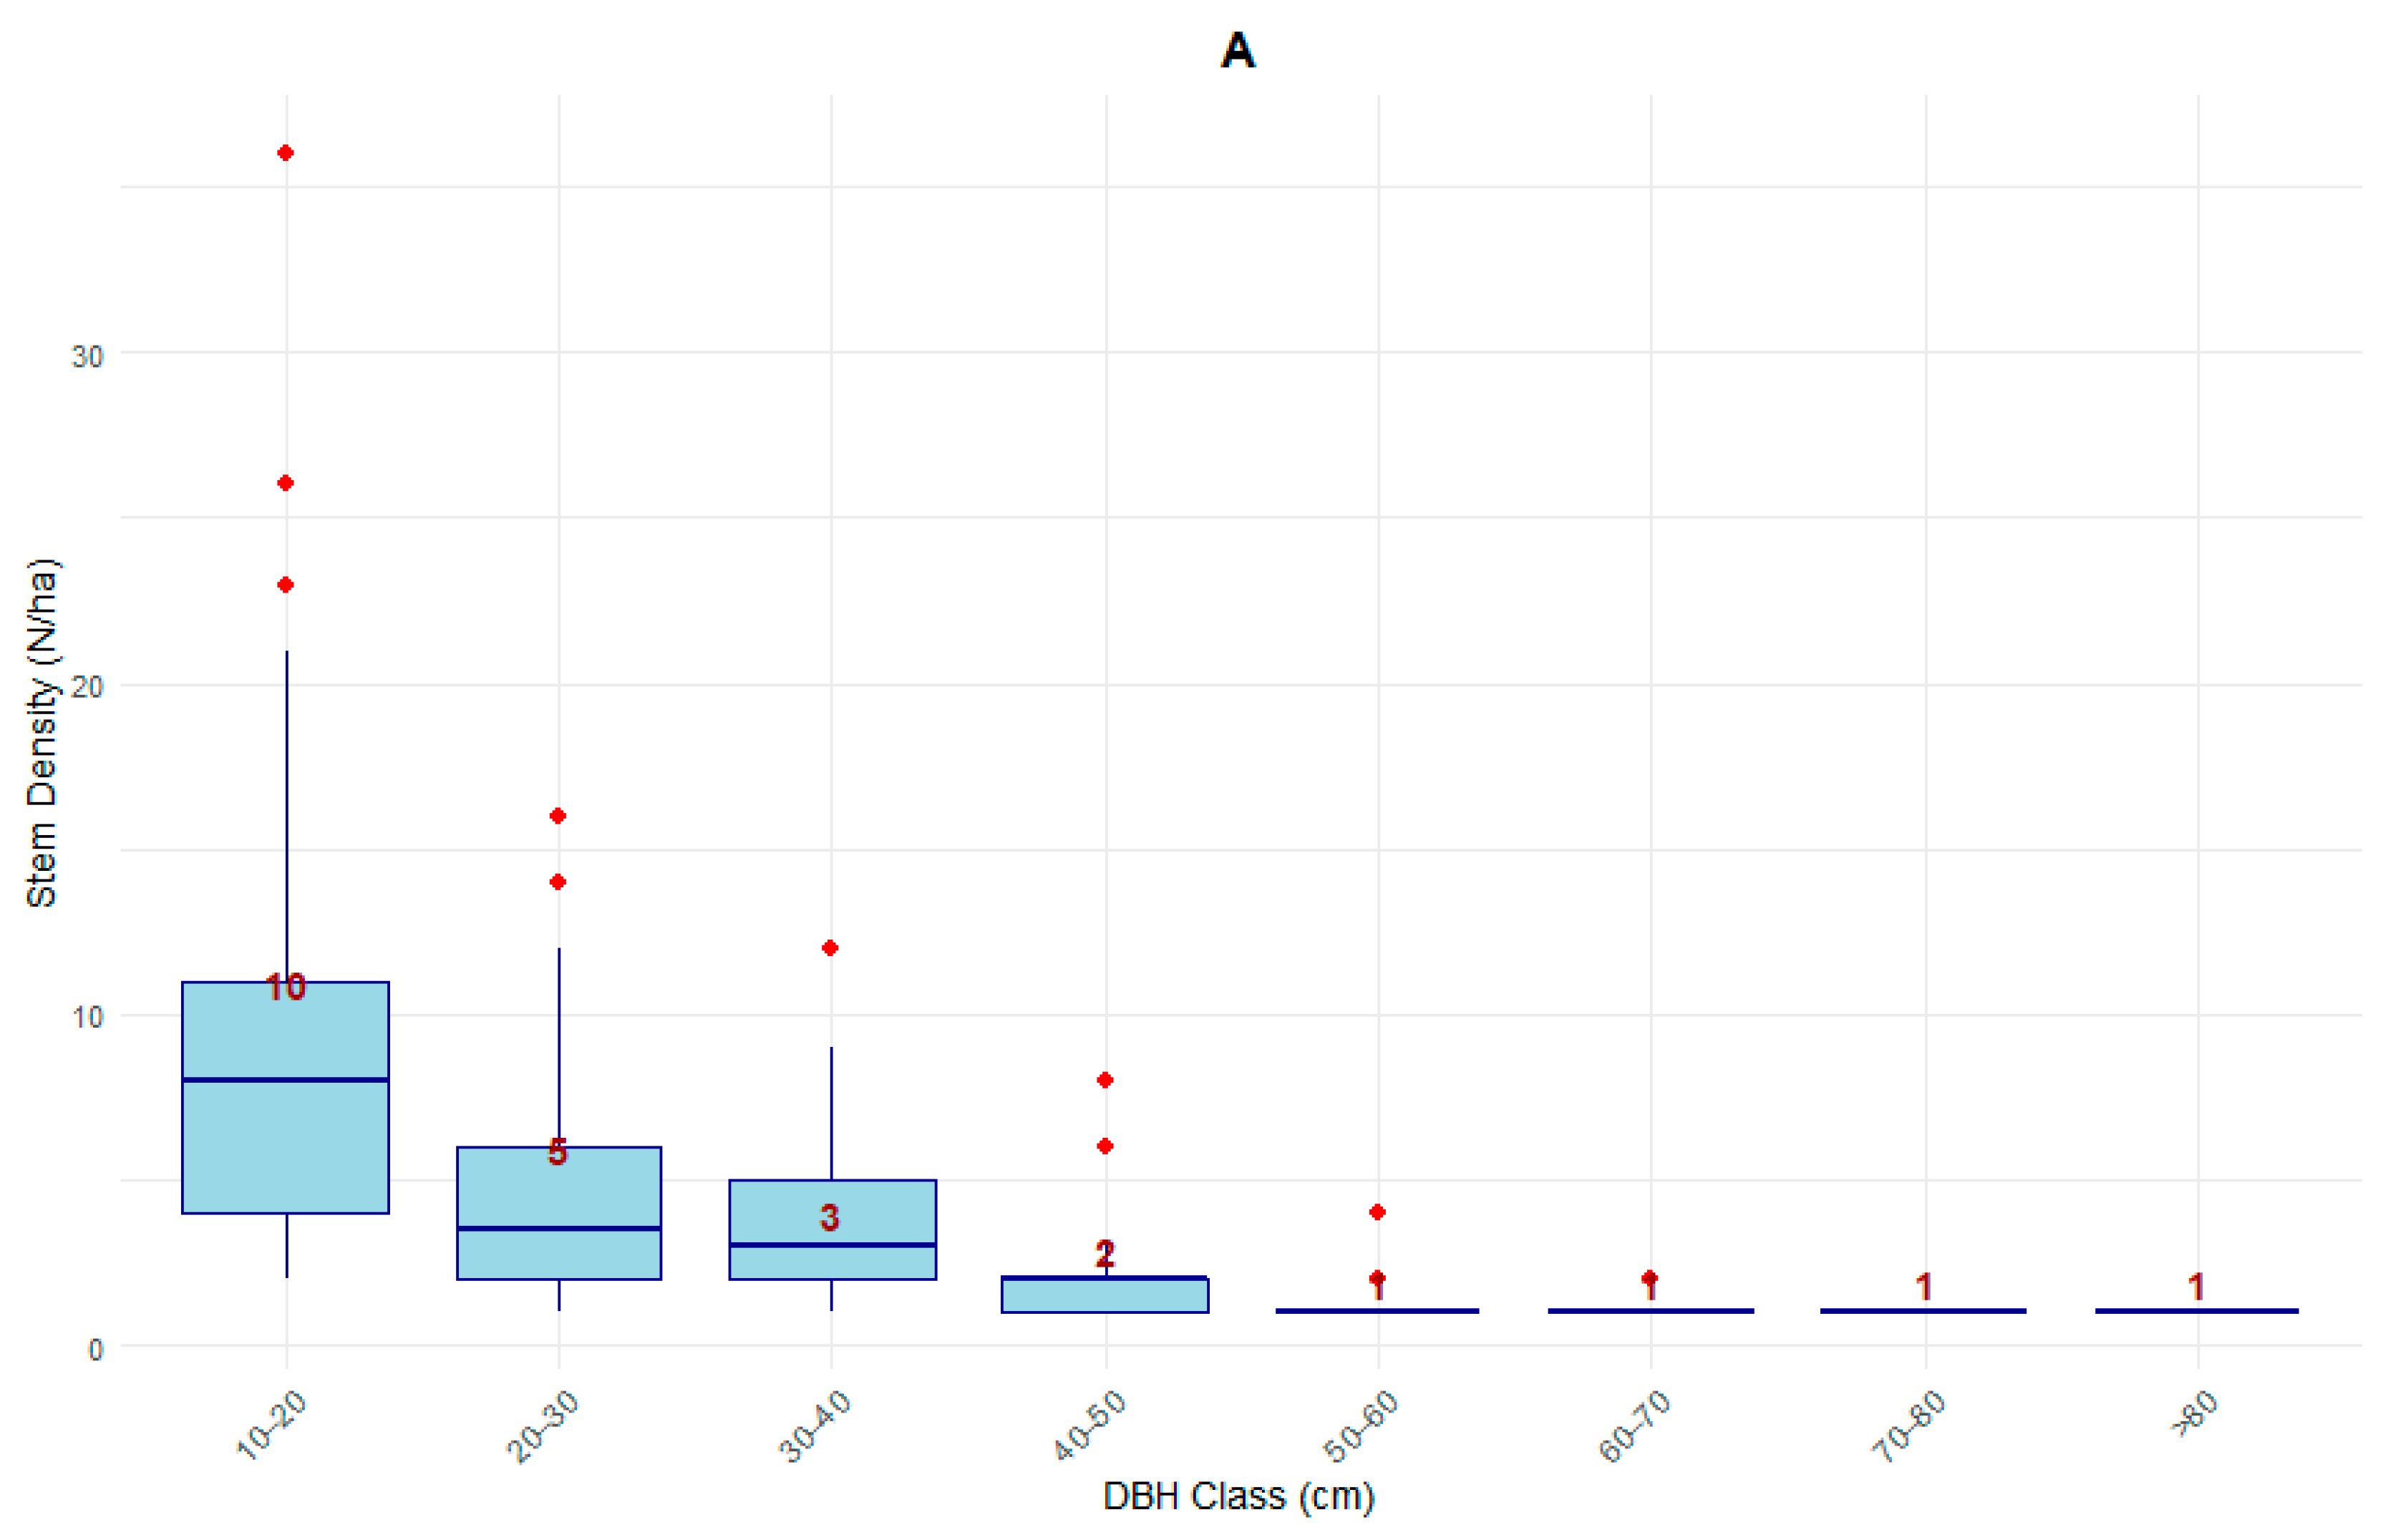
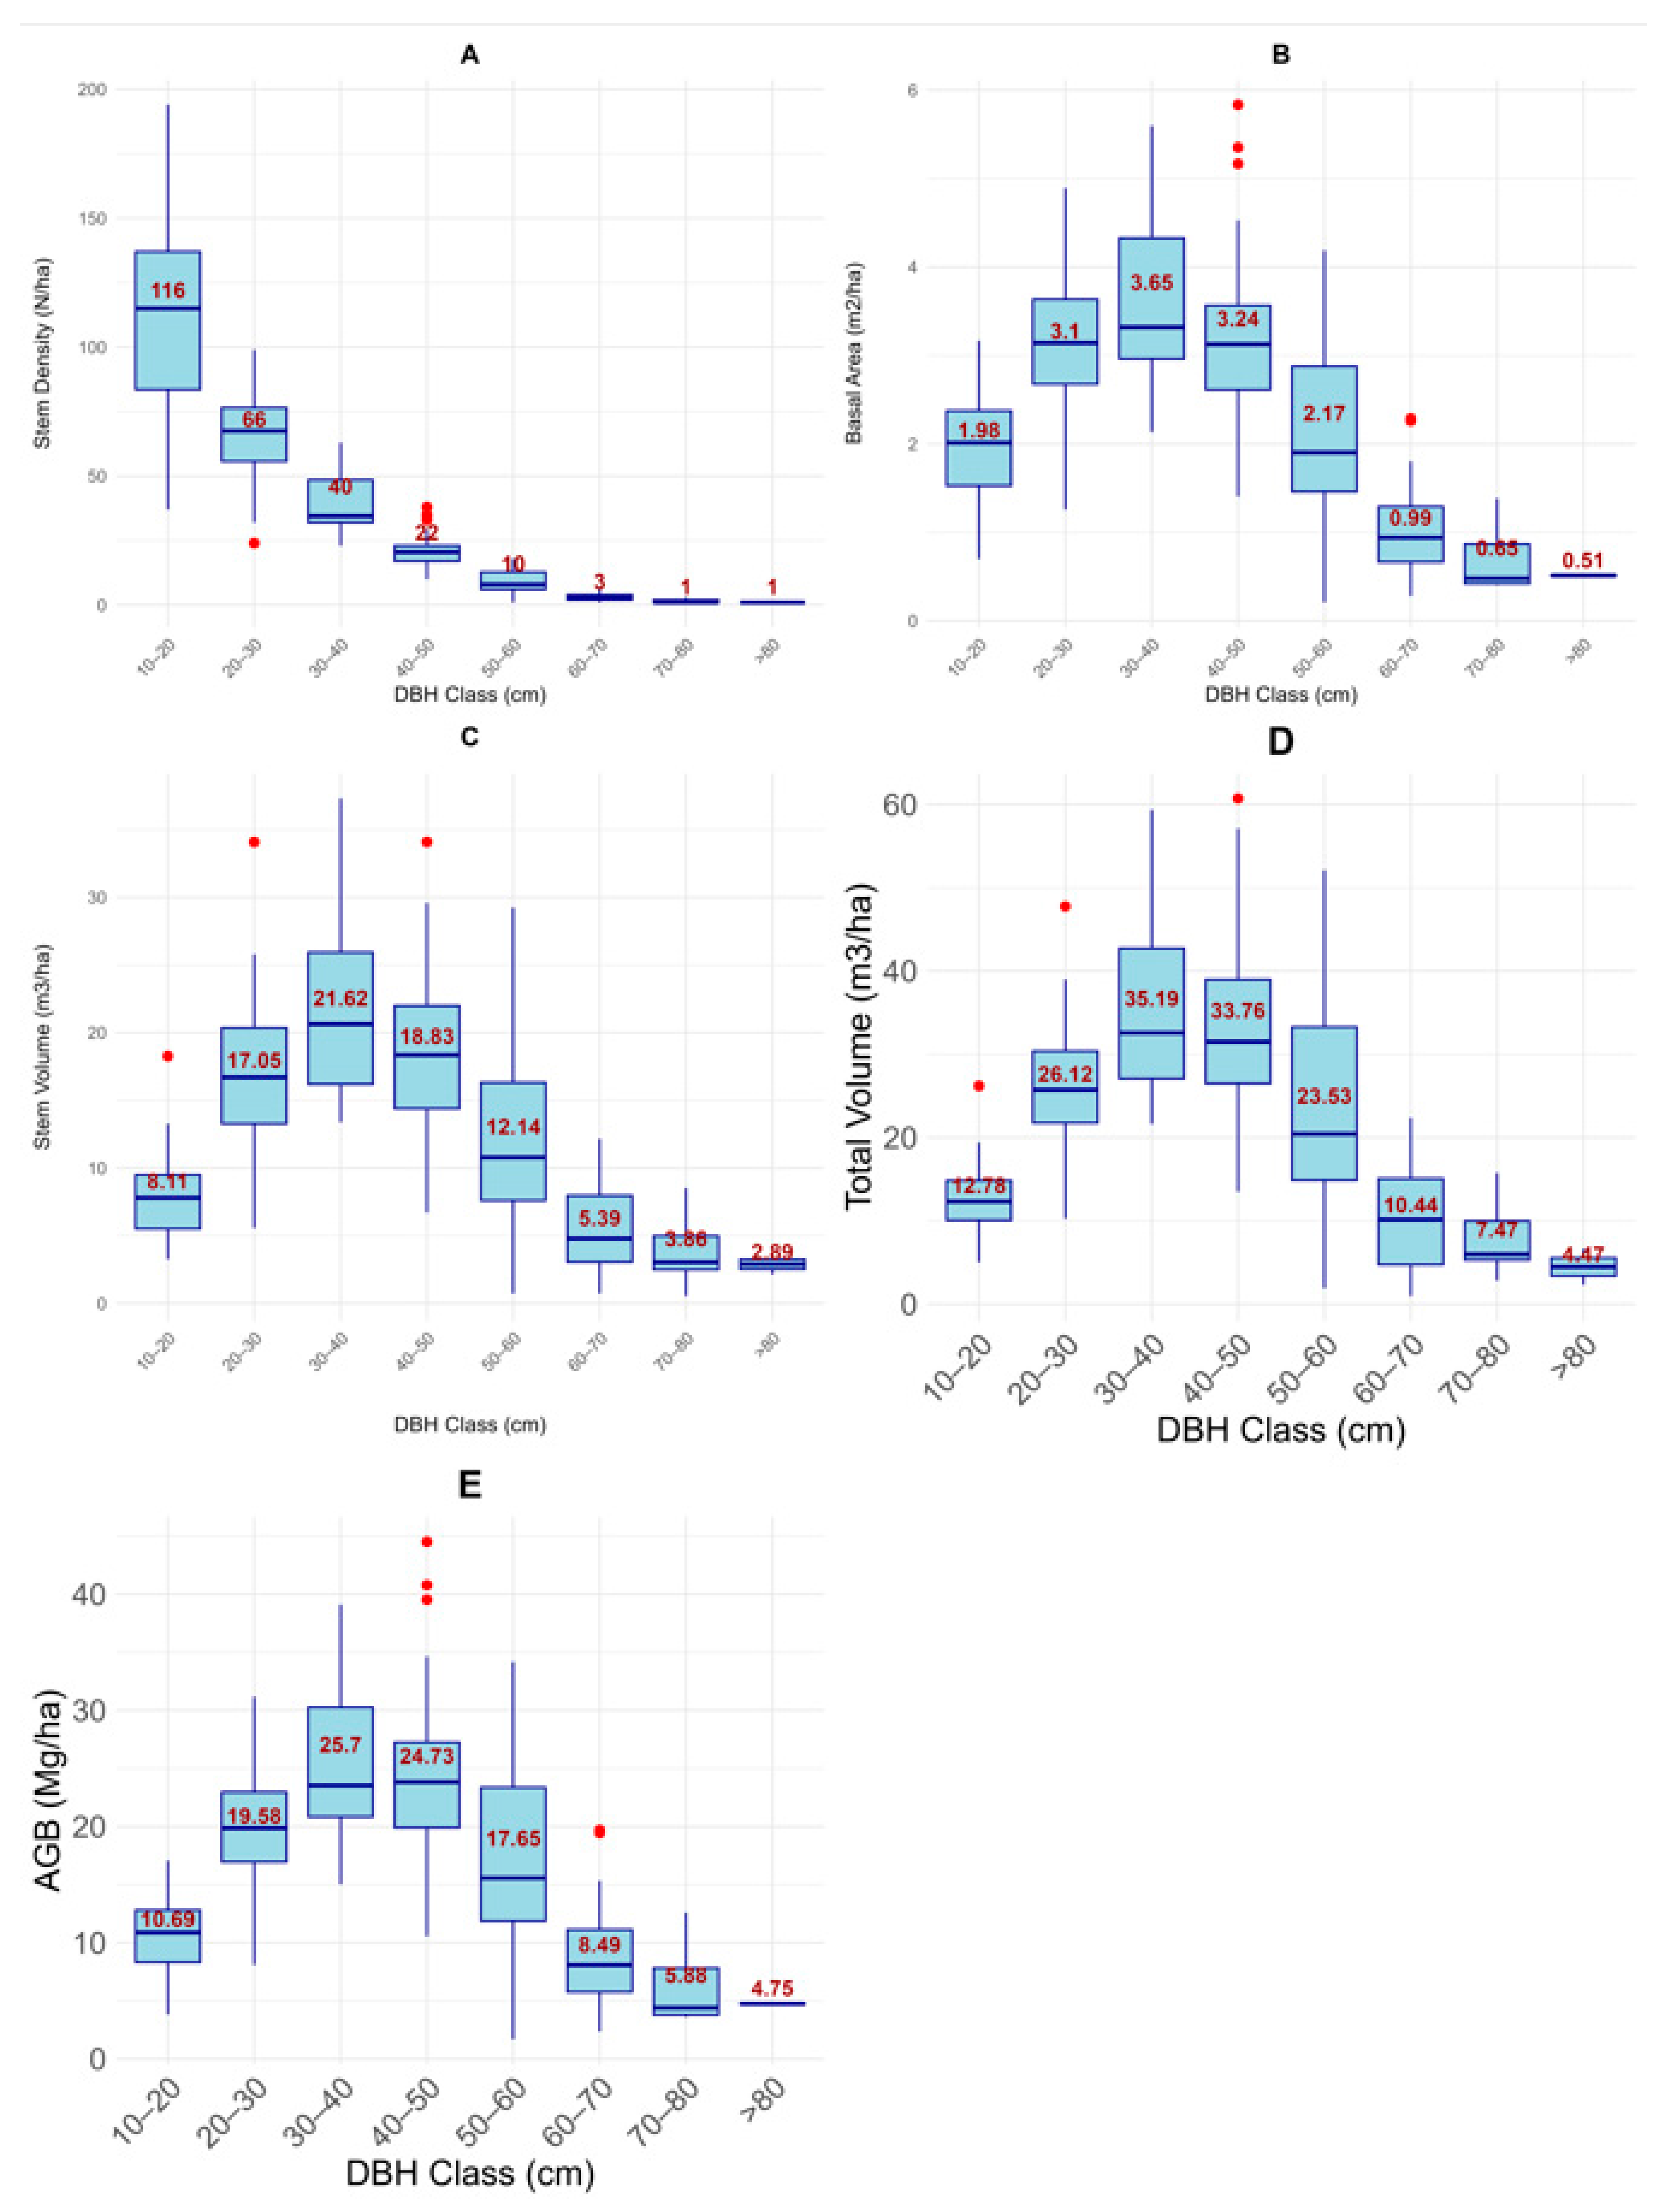
3.1.3. Diameter Distribution of Stand Structural Variables, i.e., Stem Density, Basal Area, Above Ground Biomass, Stem and Total Volume
3.2. Tree Species Composition
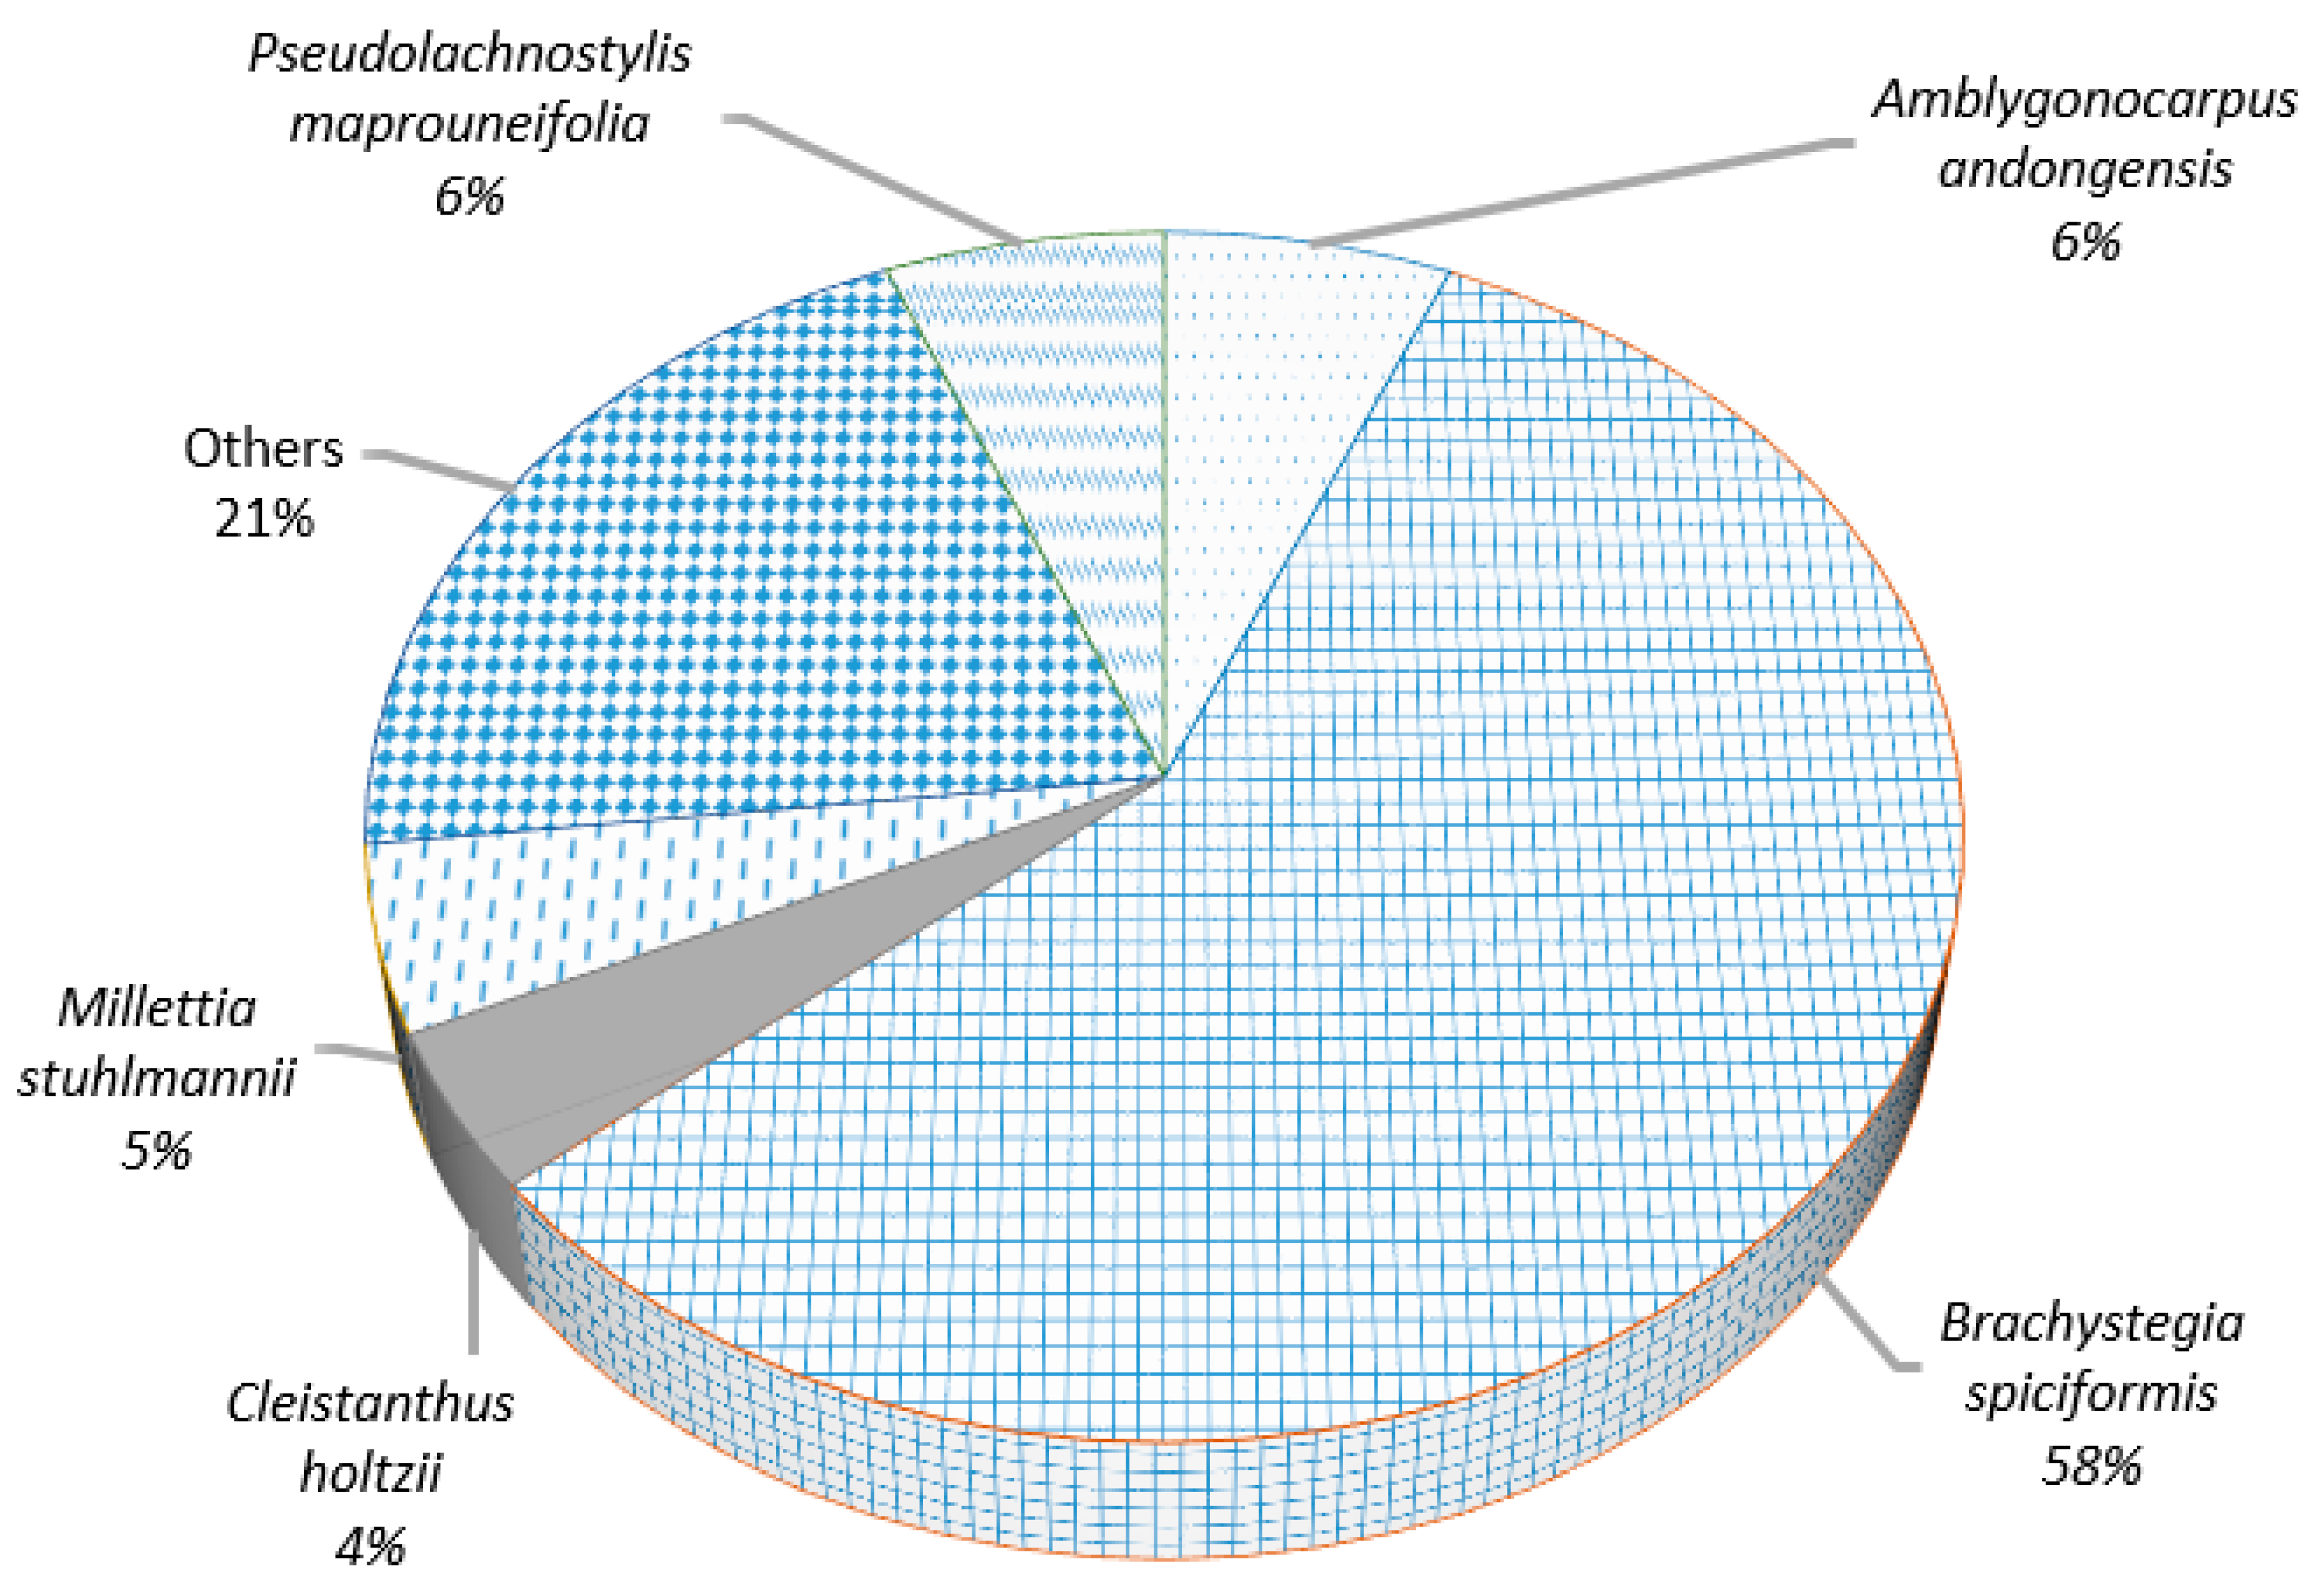
3.2.1. Species Richness, Importance Value Index, and Family
3.2.2. Composition of Rare Tree Species
3.2.3. Tree Species Diversity
3.3. Structural Variables of a Selectively Logged Stand by Tree Categories
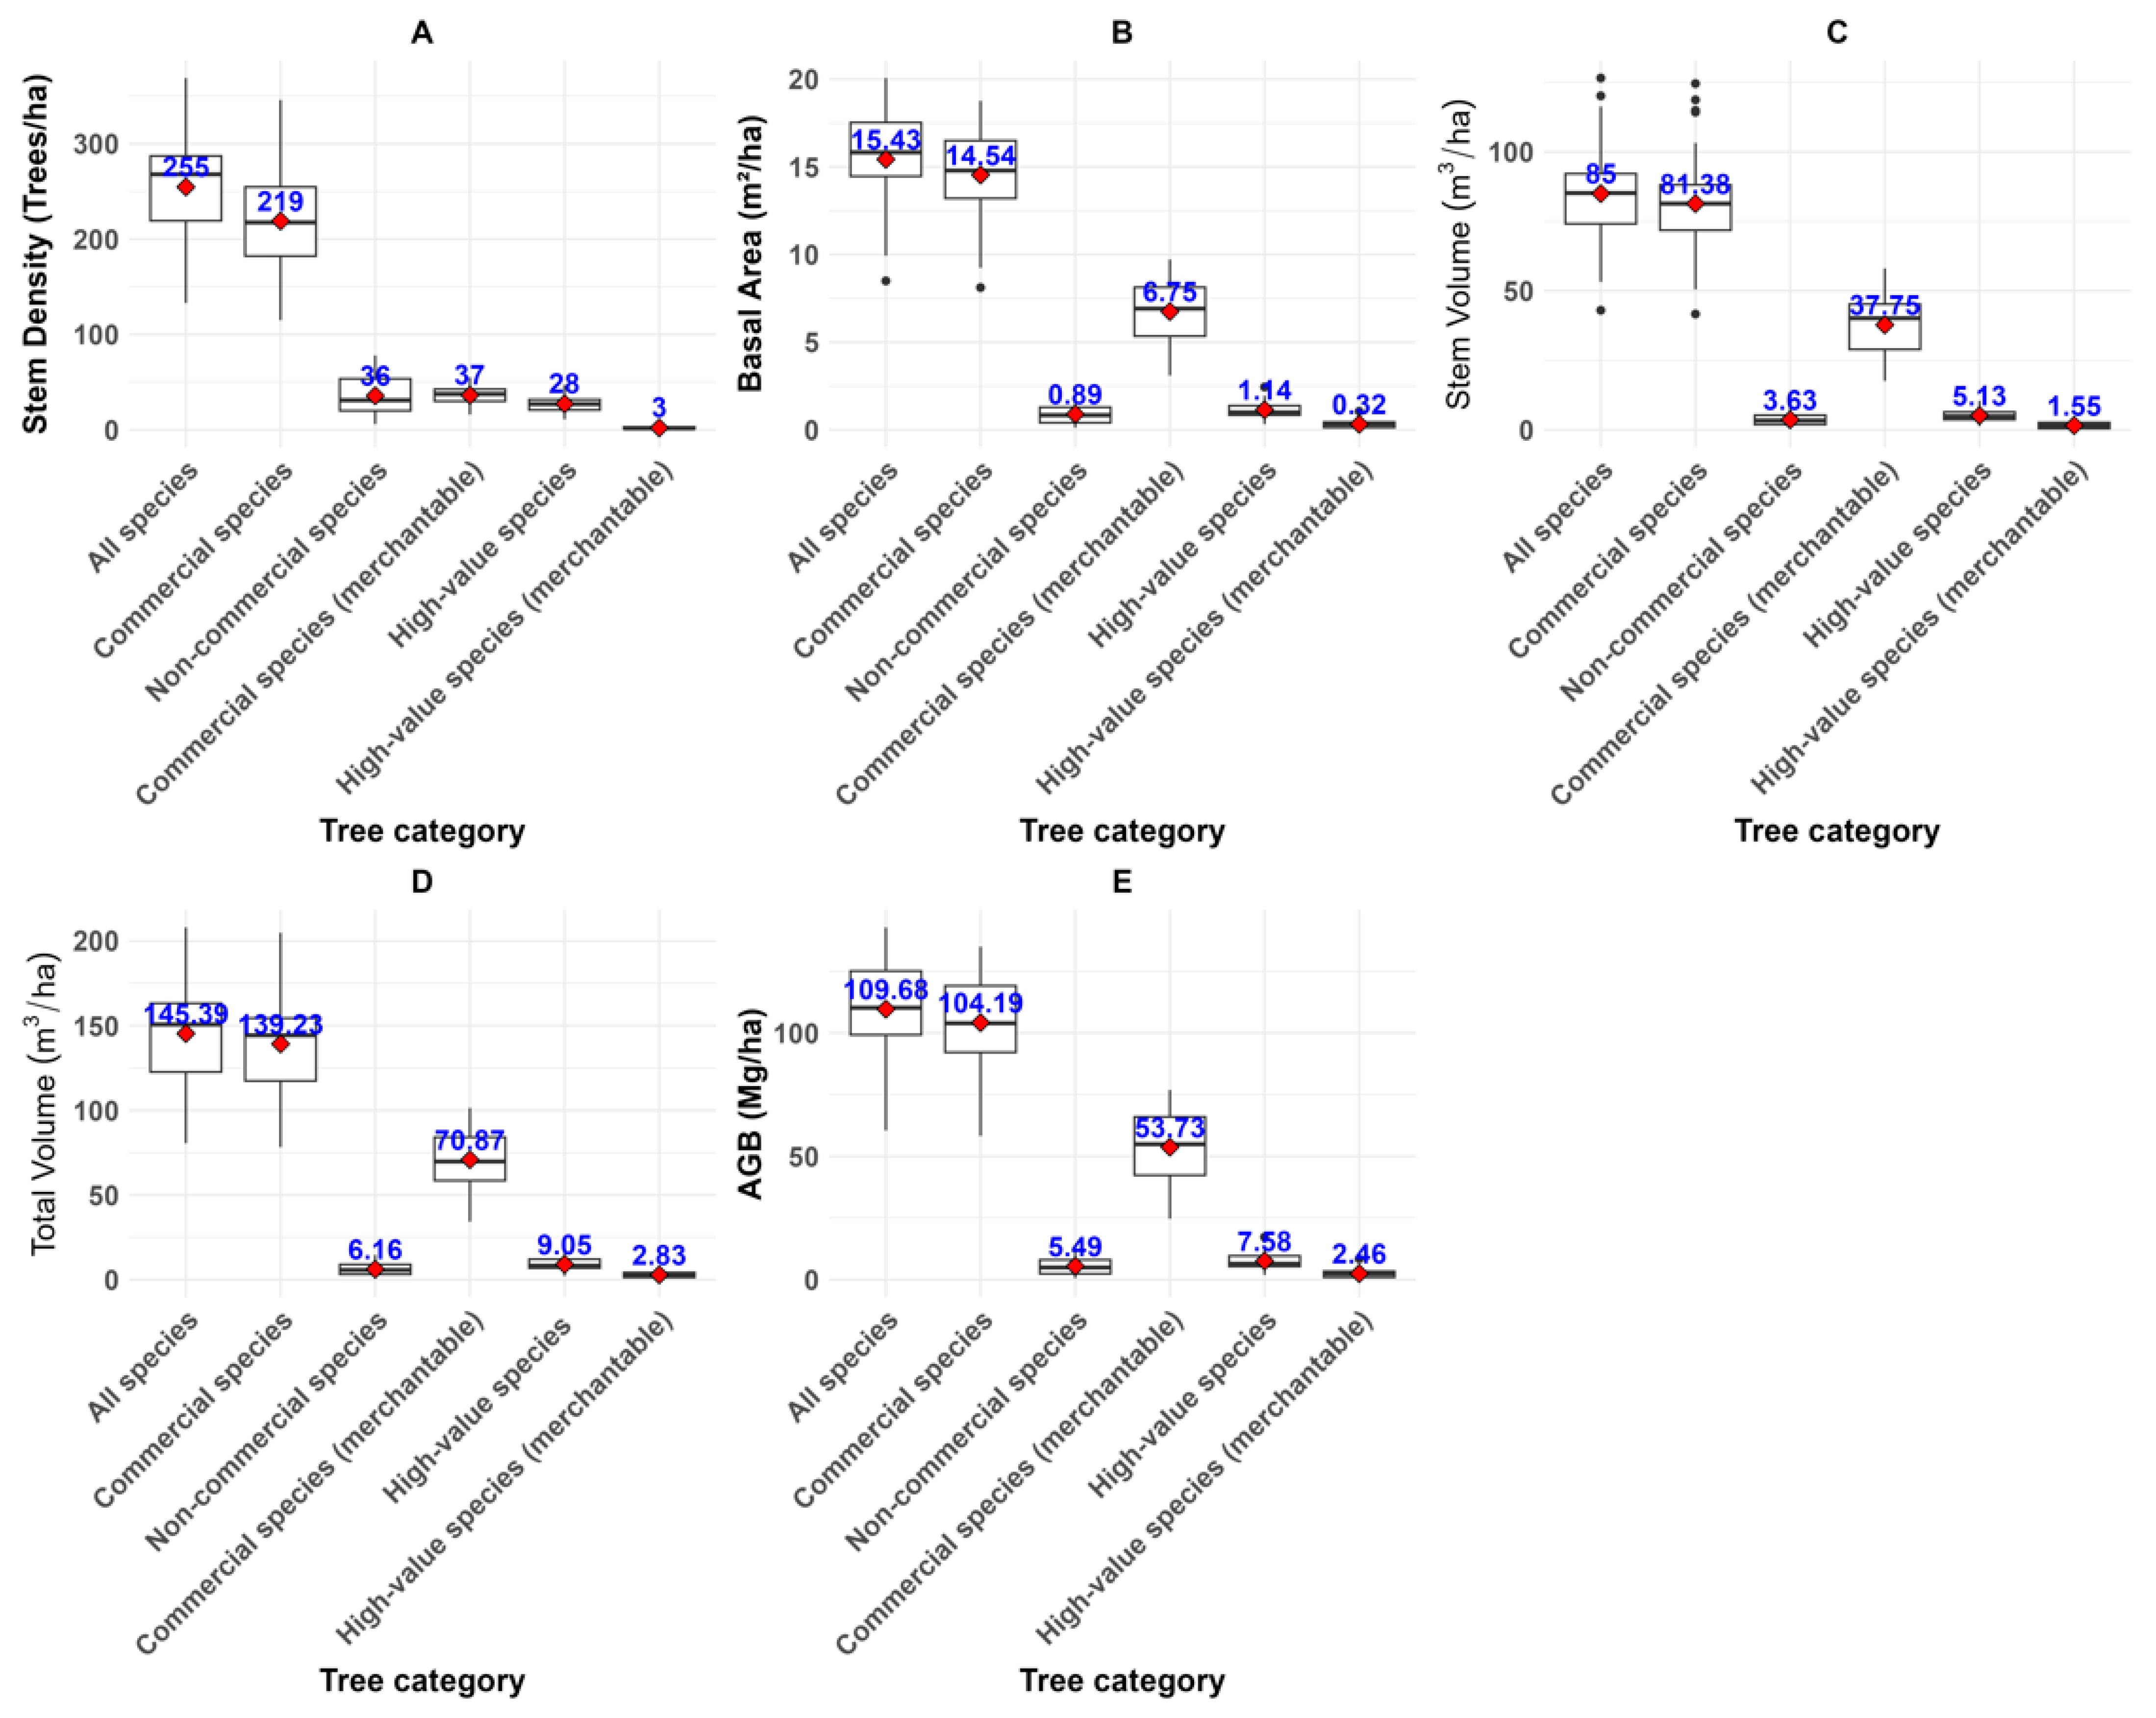
3.3.1. Stem Density, Basal Area, Above Ground Biomass, Stem and Total Volume for All Trees Categories
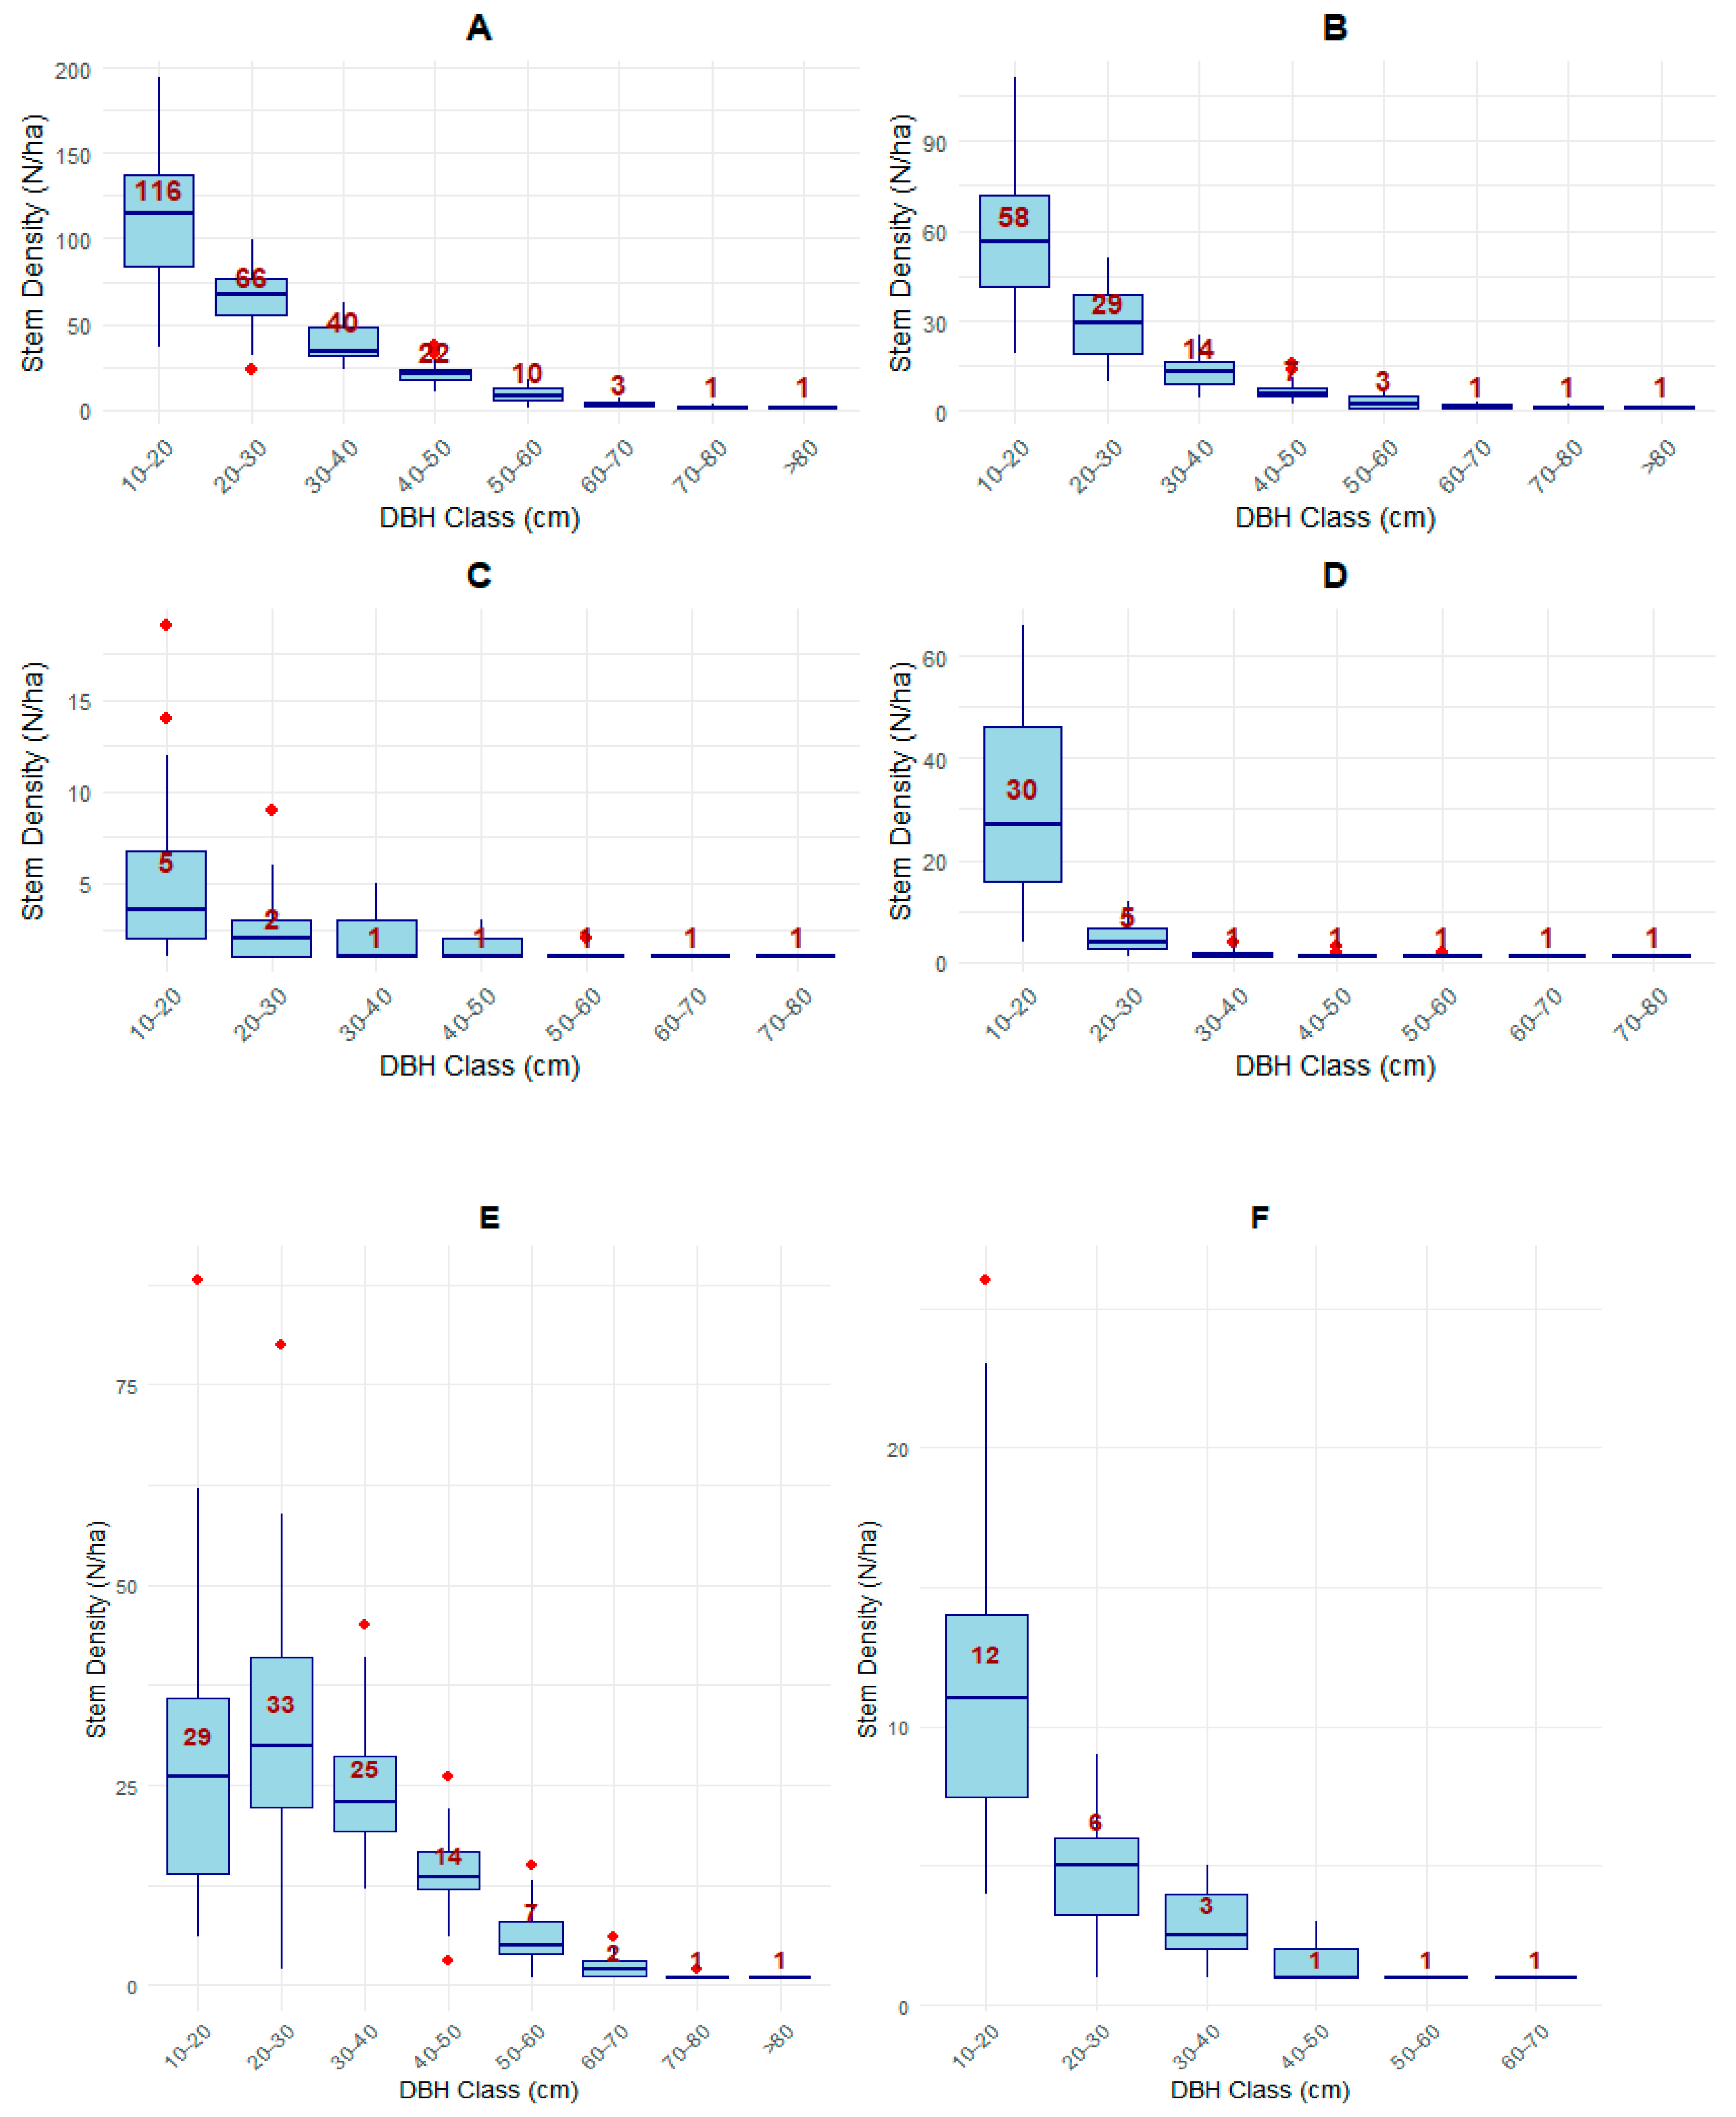
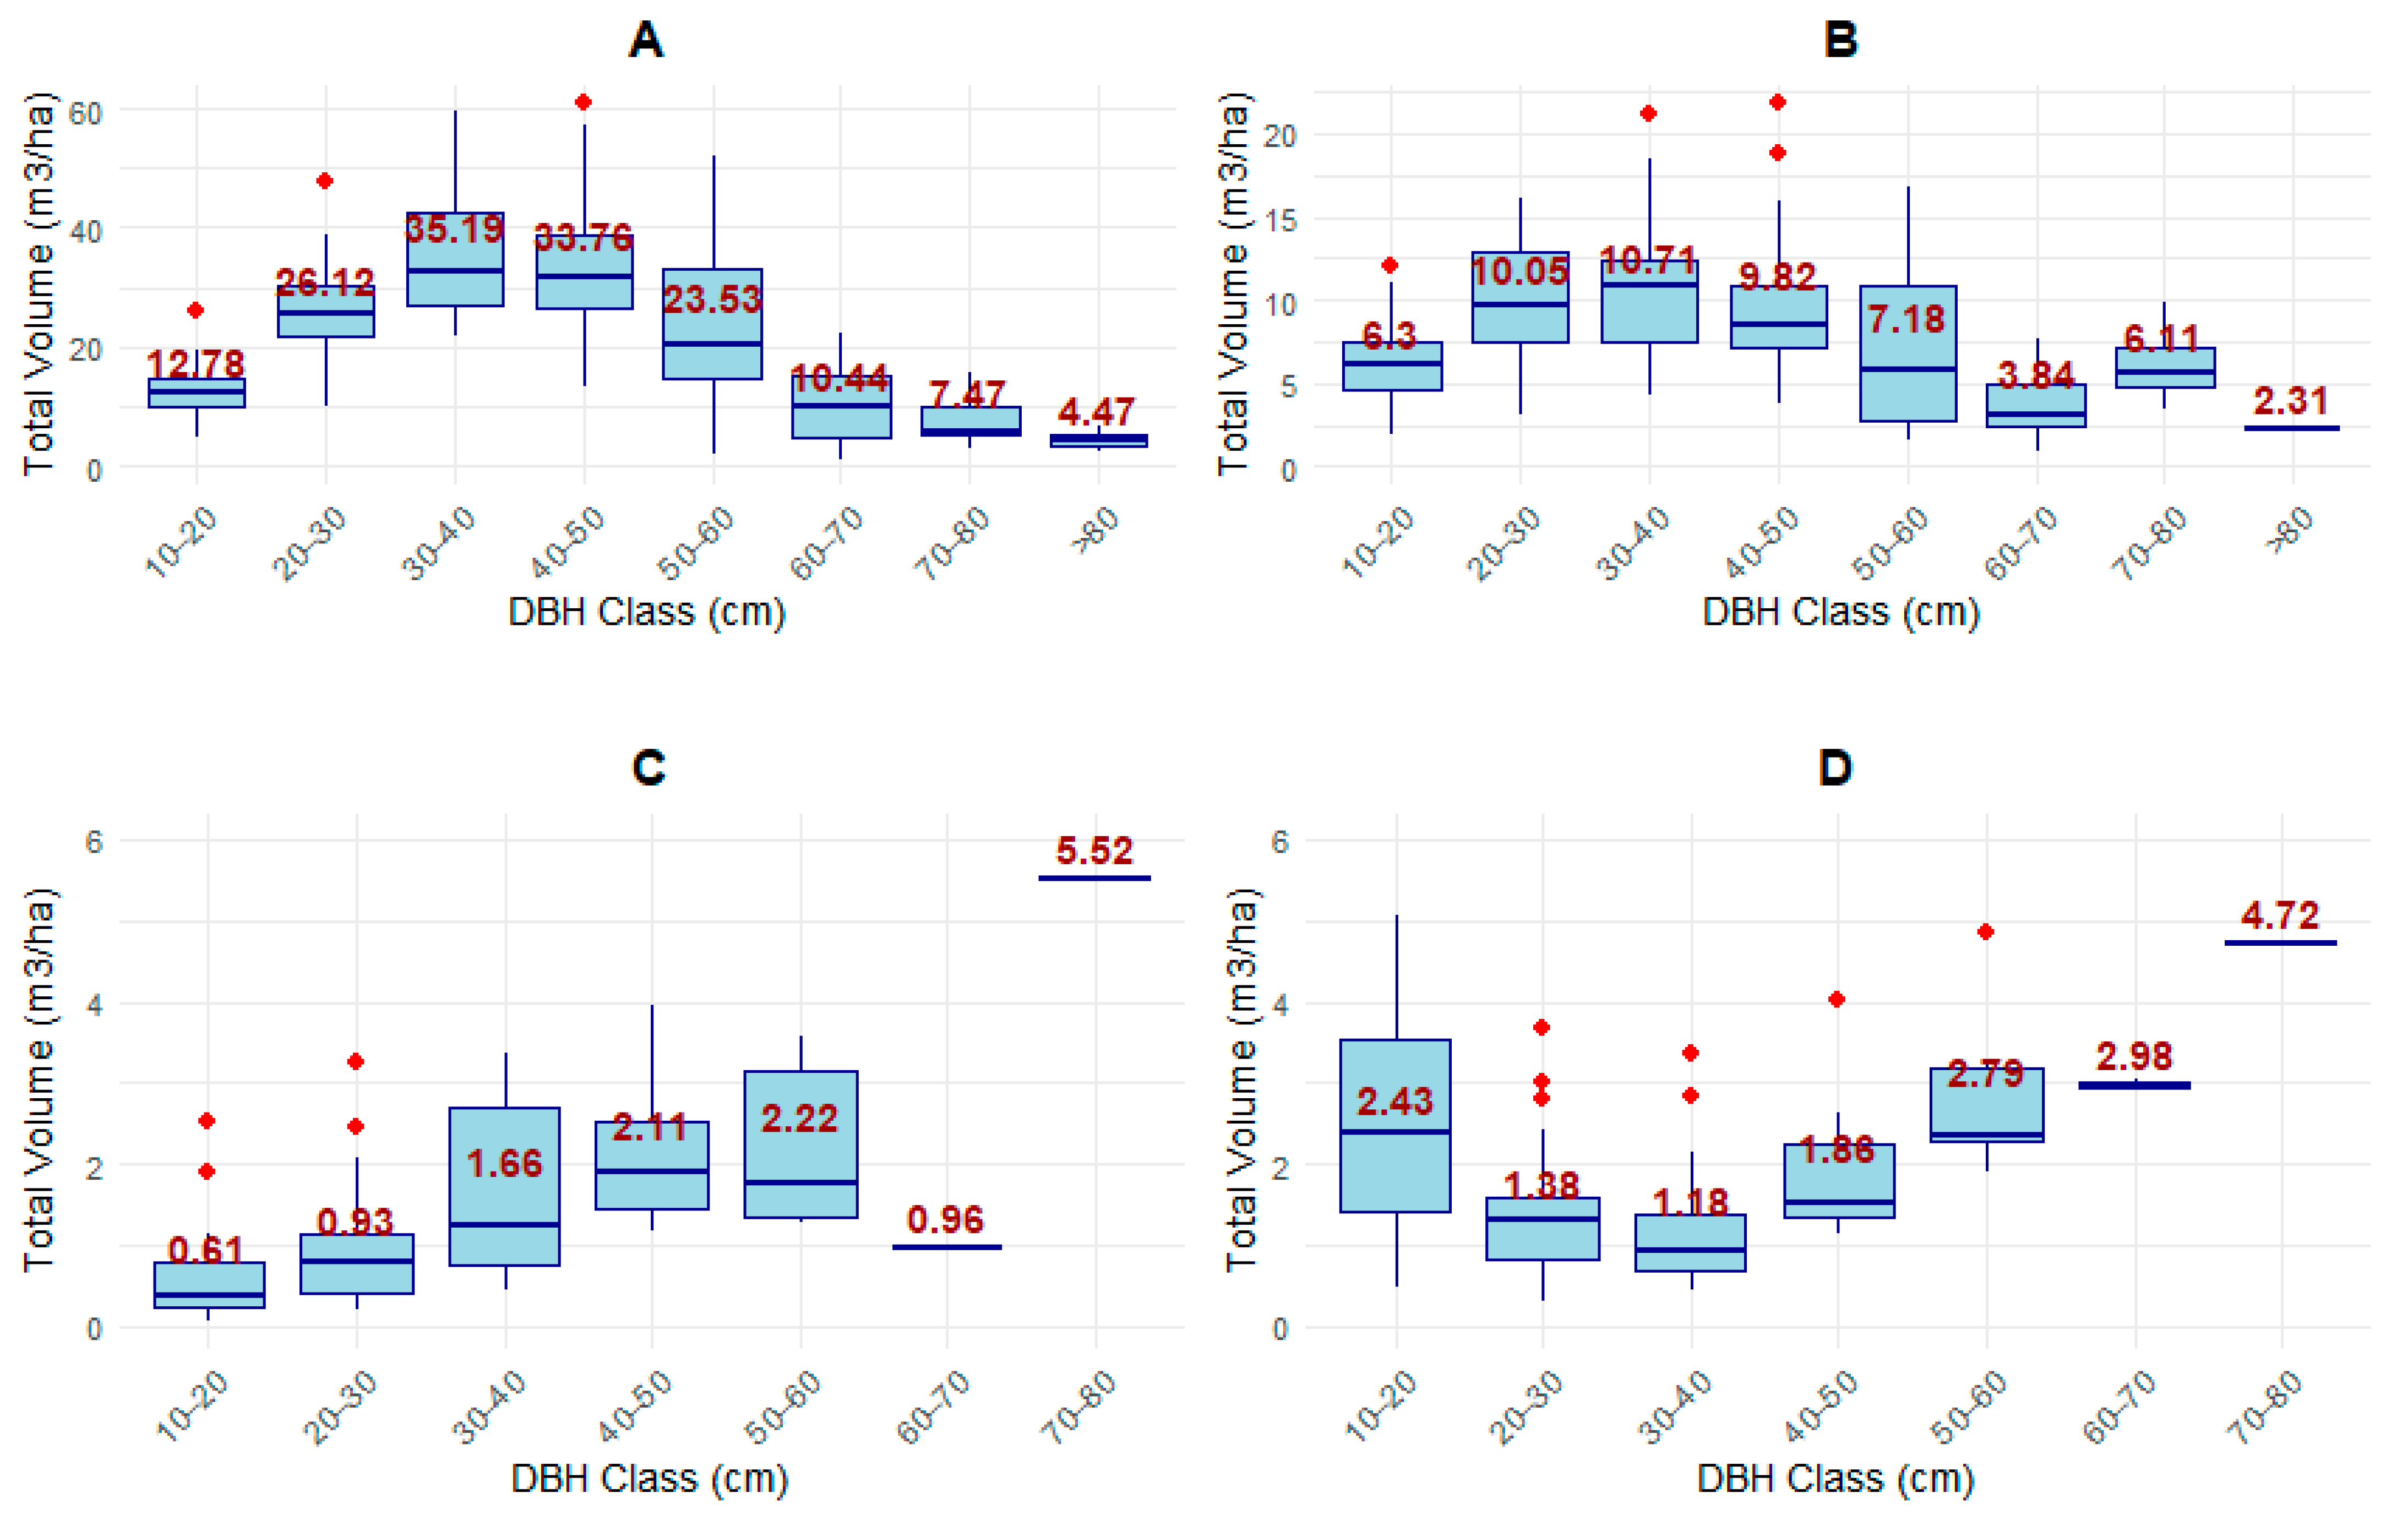
3.3.2. Diameter Distribution by Tree Species Categories
4. Discussion
4.1. Structural Dynamics and Mortality Patterns
4.2. Distribution of Parameters by DBH Classes
4.3. Species Composition, Dominance Patterns, and Ecological Implications of Disturbance in Managed Miombo Woodlands
4.4. Impact of Management on Species Diversity in Miombo Woodlands
4.5. Relationship Between Structural Variables and Tree Categories
5. Conclusions
Author Contributions
Funding
Data Availability Statement
Acknowledgments
Conflicts of Interest
Abbreviations
| MW | Miombo woodlands |
Appendix A

| Scientific Name | 10–20 | 20–30 | 30–40 | 40–50 | ||||||||||||
| N | BA | Vol | AGB | N | BA | Vol | AGB | N | BA | Vol | AGB | N | BA | Vol | AGB | |
| Brachystegia spiciformis | 28 | 0.53 | 4.06 | 2.93 | 32 | 1.57 | 14.82 | 9.99 | 25 | 2.32 | 23.72 | 16.34 | 14 | 2.12 | 23.28 | 16.17 |
| Amblygonocarpus andongensis | 5 | 0.08 | 0.5 | 0.44 | 2 | 0.09 | 0.66 | 0.58 | 1 | 0.13 | 1.09 | 0.91 | 2 | 0.24 | 2.15 | 1.8 |
| Pseudolachnostylis maprouneifolia | 11 | 0.19 | 1.13 | 1.02 | 5 | 0.26 | 1.83 | 1.61 | 3 | 0.25 | 1.94 | 1.76 | 1 | 0.15 | 1.19 | 1.18 |
| Millettia stuhlmannii | 11 | 0.19 | 1.17 | 1 | 5 | 0.24 | 1.74 | 1.48 | 2 | 0.2 | 1.76 | 1.41 | 1 | 0.11 | 1.01 | 0.82 |
| Cleistanthus holtzii | 7 | 0.12 | 0.84 | 0.67 | 4 | 0.19 | 1.52 | 1.18 | 2 | 0.14 | 1.27 | 1 | 1 | 0.09 | 0.89 | 0.66 |
| Burkea africana | 1 | 0.02 | 0.12 | 0.1 | 2 | 0.08 | 0.56 | 0.48 | 2 | 0.15 | 1.51 | 1.08 | 1 | 0.15 | 1.62 | 1.14 |
| Julbernardia globiflora | 2 | 0.03 | 0.17 | 0.13 | 2 | 0.08 | 0.6 | 0.48 | 1 | 0.12 | 1 | 0.87 | 1 | 0.12 | 1.03 | 0.88 |
| Combretum zeyheri | 14 | 0.21 | 1.18 | 1.14 | 2 | 0.1 | 0.62 | 0.6 | 0 | 0.01 | 0.05 | 0.05 | 0 | 0.03 | 0.03 | |
| Pteleopsis myrtifolia | 5 | 0.08 | 0.59 | 0.45 | 2 | 0.1 | 0.8 | 0.62 | 1 | 0.05 | 0.47 | 0.35 | 0 | 0.03 | 0.29 | 0.2 |
| Lannea antiscorbutica | 5 | 0.09 | 0.55 | 0.49 | 2 | 0.11 | 0.82 | 0.67 | 1 | 0.05 | 0.44 | 0.38 | 0 | 0.01 | 0.12 | 0.1 |
| Mimusops obtusifolia | 1 | 0.02 | 0.1 | 0.08 | 0 | 0.02 | 0.15 | 0.12 | 0 | 0.02 | 0.16 | 0.14 | 0 | 0.05 | 0.38 | 0.36 |
| Mundulea sericea | 1 | 0.01 | 0.05 | 0.05 | 0 | 0.01 | 0.08 | 0.06 | 0 | 0.01 | 0.12 | 0.1 | 0 | 0.03 | 0.33 | 0.24 |
| Spirostachys africana | 1 | 0.01 | 0.1 | 0.08 | 0 | 0.02 | 0.17 | 0.14 | 0 | 0.04 | 0.37 | 0.31 | 0 | 0.04 | 0.3 | 0.3 |
| Acacia gerrardii | 1 | 0.01 | 0.07 | 0.06 | 0 | 0.02 | 0.14 | 0.12 | 1 | 0.05 | 0.45 | 0.33 | 0 | 0.02 | 0.22 | 0.17 |
| Combretum molle | 5 | 0.07 | 0.38 | 0.36 | 0 | 0.02 | 0.13 | 0.13 | 0 | 0.01 | 0.06 | 0.06 | 0 | 0.04 | 0.03 | |
| Kigelia africana | 1 | 0.01 | 0.07 | 0.06 | 1 | 0.03 | 0.22 | 0.17 | 0 | 0.02 | 0.18 | 0.13 | 0 | 0.02 | 0.2 | 0.15 |
| Pterocarpus angolensis | 3 | 0.05 | 0.34 | 0.28 | 1 | 0.04 | 0.36 | 0.27 | ||||||||
| Terminalia sericea | 2 | 0.03 | 0.18 | 0.18 | 1 | 0.04 | 0.28 | 0.28 | 0 | 0.01 | 0.07 | 0.07 | ||||
| Turraea nilotica | 6 | 0.09 | 0.41 | 0.45 | 0 | 0.01 | 0.04 | 0.06 | ||||||||
| Afzelia quanzensis | 0 | 0.01 | 0.04 | 0.03 | 0 | 0.01 | 0.07 | 0.05 | 0 | 0.02 | 0.19 | 0.14 | 0 | 0.01 | 0.09 | 0.06 |
| Sclerocarya birrea | 0 | 0.01 | 0.01 | 0 | 0.02 | 0.02 | 0 | 0.02 | 0.16 | 0.12 | 0 | 0.02 | 0.17 | 0.13 | ||
| Strychnos madagascariensis | 2 | 0.02 | 0.12 | 0.13 | 0 | 0.02 | 0.14 | 0.13 | 0 | 0.01 | 0.05 | 0.04 | 0 | 0.03 | 0.03 | |
| Uapaca nitida | 1 | 0.02 | 0.12 | 0.1 | 0 | 0.01 | 0.09 | 0.07 | 0 | 0.02 | 0.02 | |||||
| Balanites maughamii | 0 | 0.03 | 0.02 | 0 | 0.04 | 0.03 | 0 | 0.01 | 0.01 | |||||||
| Erythophloeum suaveolens | 0 | 0 | 0.02 | 0.01 | 0 | 0.02 | 0.19 | 0.14 | ||||||||
| Hirtella zanguebarica | 1 | 0.01 | 0.06 | 0.07 | 0 | 0.01 | 0.04 | 0.04 | 0 | 0.02 | 0.03 | |||||
| Vitex payos | 0 | 0.01 | 0.01 | |||||||||||||
| Milicia excelsa | 0 | 0.02 | 0.02 | 0 | 0.02 | 0.02 | 0 | 0.01 | 0.01 | 0 | 0.04 | 0.03 | ||||
| Maytenus guyansis | 1 | 0.01 | 0.06 | 0.05 | 0 | 0.03 | 0.03 | |||||||||
| Acacia nigrescensis | 0 | 0.02 | 0.01 | 0 | 0.03 | 0.02 | 0 | 0.04 | 0.04 | |||||||
| Parinari curatellifolia | 1 | 0.01 | 0.08 | 0.07 | ||||||||||||
| Erythophleum africanum | 0 | 0 | 0.03 | 0.02 | 0 | 0.01 | 0.06 | 0.04 | ||||||||
| Dyospiros mespiliformis | ||||||||||||||||
| Combretum hereroense | 0 | 0.01 | 0.03 | 0.03 | 0 | 0.01 | 0.02 | |||||||||
| Xeroderris stuhlmannii | 0 | 0.02 | 0.02 | 0 | 0.04 | 0.03 | ||||||||||
| Scolopia stolzii | 0 | 0.01 | 0.01 | 0 | 0.02 | 0.02 | 0 | 0.02 | 0.02 | |||||||
| Euclea natalensis | 0 | 0.02 | 0.02 | 0 | 0.01 | 0.01 | ||||||||||
| Grewia transzambesica | 0 | 0.02 | 0.02 | |||||||||||||
| Diplorhynchus condylocarpon | 0 | 0.02 | 0.02 | |||||||||||||
| Tabernaemontana elegans | 0 | 0.01 | 0.02 | 0 | 0.01 | |||||||||||
| Antidesma venosum | 0 | 0.01 | 0.01 | 0 | 0.01 | 0.01 | ||||||||||
| Albizia versicolor | 0 | 0.01 | 0.01 | 0 | 0.01 | 0.01 | ||||||||||
| Tamarindus indica | 0 | 0.02 | 0.01 | |||||||||||||
| Hugonia busseana | 0 | 0.01 | 0.01 | |||||||||||||
| Piliostigma thoningii | 0 | 0.01 | 0.01 | 0 | 0.01 | 0.01 | ||||||||||
| Casearia gladiiformis | 0 | 0.01 | 0.01 | |||||||||||||
| Garcinia livingstonei | 0 | 0.01 | 0.01 | |||||||||||||
| Strichnos spinosa | 0 | 0 | 0.01 | 0.01 | ||||||||||||
| Markhamia obtusifolia | 0 | 0.01 | 0.01 | |||||||||||||
| Albizia adianthifolia | 0 | 0.01 | ||||||||||||||
| Celtis gomphophylla | 0 | |||||||||||||||
| Dalbergia nitidula | 0 | |||||||||||||||
| Margaritaria discoidea | 0 | |||||||||||||||
| Sphaerocoryne gracilis | 0 | |||||||||||||||
| Vangueria infausta | 0 | |||||||||||||||
| Ximenia caffra | 0 | |||||||||||||||
| Ziziphus abyssinica | 0 | |||||||||||||||
| Total | 116 | 1.98 | 12.78 | 10.69 | 65 | 3.1 | 26.12 | 19.58 | 39 | 3.65 | 35.19 | 25.7 | 21 | 3.24 | 33.76 | 24.73 |
| Scientific Name | 50–60 | 60–70 | 70–80 | >80 | ||||||||||||
| N | BA | Vol | AGB | N | BA | Vol | AGB | N | BA | Vol | AGB | N | BA | Vol | AGB | |
| Brachystegia spiciformis | 6 | 1.42 | 16.03 | 11.55 | 2 | 0.62 | 6.93 | 5.29 | 1 | 0.29 | 3.44 | 2.57 | 0 | 0.01 | 0.2 | 0.14 |
| Amblygonocarpus andongensis | 1 | 0.29 | 3.02 | 2.39 | 0 | 0.09 | 0.74 | 0.78 | 0 | 0.05 | 0.52 | 0.48 | 0 | 0.01 | 0.07 | 0.14 |
| Pseudolachnostylis maprouneifolia | 0 | 0.1 | 0.88 | 0.78 | 0 | 0.02 | 0.14 | 0.15 | ||||||||
| Millettia stuhlmannii | 0 | 0.03 | 0.31 | 0.24 | 0 | 0.01 | 0.11 | 0.09 | ||||||||
| Cleistanthus holtzii | 0 | 0.08 | 0.78 | 0.64 | 0 | 0.03 | 0.31 | 0.24 | 0 | 0.01 | 0.18 | 0.12 | ||||
| Burkea africana | 0 | 0.04 | 0.5 | 0.36 | ||||||||||||
| Julbernardia globiflora | 0 | 0.06 | 0.51 | 0.45 | 0 | 0.02 | 0.12 | 0.14 | ||||||||
| Combretum zeyheri | ||||||||||||||||
| Pteleopsis myrtifolia | 0 | 0.01 | 0.12 | 0.11 | 0 | 0.01 | 0.06 | 0.07 | ||||||||
| Lannea antiscorbutica | ||||||||||||||||
| Mimusops obtusifolia | 0 | 0.01 | 0.1 | 0.1 | 0 | 0.02 | 0.18 | 0.17 | 0 | 0.03 | 0.28 | 0.26 | ||||
| Mundulea sericea | 0 | 0.06 | 0.65 | 0.48 | 0 | 0.02 | 0.18 | 0.15 | 0 | 0.01 | 0.14 | 0.13 | ||||
| Spirostachys africana | 0 | 0.01 | 0.08 | 0.1 | ||||||||||||
| Acacia gerrardii | 0 | 0.01 | 0.09 | 0.06 | ||||||||||||
| Combretum molle | ||||||||||||||||
| Kigelia africana | 0 | 0.01 | 0.1 | 0.07 | ||||||||||||
| Pterocarpus angolensis | ||||||||||||||||
| Terminalia sericea | ||||||||||||||||
| Turraea nilotica | ||||||||||||||||
| Afzelia quanzensis | 0 | 0.01 | 0.05 | 0.05 | 0 | 0.01 | 0.16 | 0.13 | ||||||||
| Sclerocarya birrea | 0 | 0.01 | 0.11 | 0.1 | ||||||||||||
| Strychnos madagascariensis | ||||||||||||||||
| Uapaca nitida | 0 | 0.01 | 0.09 | 0.06 | ||||||||||||
| Balanites maughamii | 0 | 0.01 | 0.09 | 0.12 | 0 | 0.01 | 0.03 | 0.07 | ||||||||
| Erythophloeum suaveolens | ||||||||||||||||
| Hirtella zanguebarica | ||||||||||||||||
| Vitex payos | 0 | 0.01 | 0.12 | 0.11 | ||||||||||||
| Milicia excelsa | ||||||||||||||||
| Maytenus guyansis | ||||||||||||||||
| Acacia nigrescensis | ||||||||||||||||
| Parinari curatellifolia | ||||||||||||||||
| Erythophleum africanum | ||||||||||||||||
| Dyospiros mespiliformis | 0 | 0.01 | 0.1 | 0.06 | ||||||||||||
| Combretum hereroense | ||||||||||||||||
| Xeroderris stuhlmannii | ||||||||||||||||
| Scolopia stolzii | ||||||||||||||||
| Euclea natalensis | ||||||||||||||||
| Grewia transzambesica | ||||||||||||||||
| Diplorhynchus condylocarpon | ||||||||||||||||
| Tabernaemontana elegans | ||||||||||||||||
| Antidesma venosum | ||||||||||||||||
| Albizia versicolor | ||||||||||||||||
| Tamarindus indica | ||||||||||||||||
| Hugonia busseana | ||||||||||||||||
| Piliostigma thoningii | ||||||||||||||||
| Casearia gladiiformis | ||||||||||||||||
| Garcinia livingstonei | ||||||||||||||||
| Strichnos spinosa | ||||||||||||||||
| Markhamia obtusifolia | ||||||||||||||||
| Albizia adianthifolia | ||||||||||||||||
| Celtis gomphophylla | ||||||||||||||||
| Dalbergia nitidula | ||||||||||||||||
| Margaritaria discoidea | ||||||||||||||||
| Sphaerocoryne gracilis | ||||||||||||||||
| Vangueria infausta | ||||||||||||||||
| Ximenia caffra | ||||||||||||||||
| Ziziphus abyssinica | ||||||||||||||||
| Total | 9 | 2.17 | 23.52 | 17.65 | 3 | 0.84 | 8.91 | 7.24 | 1 | 0.42 | 4.83 | 3.81 | 0 | 0.03 | 0.26 | 0.28 |
| ScientificName | Merchantable | Total | ||||||||||||||
| N | BA | Vol | AGB | N | BA | Vol | AGB | |||||||||
| Brachystegia spiciformis | 23 | 4.46 | 49.87 | 35.72 | 108 | 8.88 | 92.47 | 64.98 | ||||||||
| Pseudolachnostylis maprouneifolia | 4 | 0.52 | 4.16 | 3.88 | 21 | 0.96 | 7.12 | 6.51 | ||||||||
| Millettia stuhlmannii | 1 | 0.15 | 1.44 | 1.15 | 20 | 0.77 | 6.1 | 5.05 | ||||||||
| Combretum zeyheri | 16 | 0.32 | 1.88 | 1.82 | ||||||||||||
| Cleistanthus holtzii | 1 | 0.12 | 1.28 | 1.01 | 13 | 0.66 | 5.79 | 4.51 | ||||||||
| Amblygonocarpus andongensis | 3 | 0.69 | 6.5 | 5.59 | 11 | 0.99 | 8.74 | 7.52 | ||||||||
| Lannea antiscorbutica | 0 | 0.01 | 0.12 | 0.1 | 8 | 0.27 | 1.93 | 1.65 | ||||||||
| Pteleopsis myrtifolia | 0 | 0.05 | 0.47 | 0.38 | 8 | 0.28 | 2.32 | 1.8 | ||||||||
| Turraea nilotica | 6 | 0.1 | 0.46 | 0.51 | ||||||||||||
| Julbernardia globiflora | 1 | 0.19 | 1.66 | 1.47 | 6 | 0.41 | 3.42 | 2.95 | ||||||||
| Burkea africana | 1 | 0.19 | 2.13 | 1.5 | 5 | 0.44 | 4.31 | 3.16 | ||||||||
| Combretum molle | 5 | 0.1 | 0.62 | 0.58 | ||||||||||||
| Pterocarpus angolensis | 4 | 0.1 | 0.7 | 0.56 | ||||||||||||
| Terminalia sericea | 0 | 0.01 | 0.07 | 0.07 | 3 | 0.09 | 0.54 | 0.52 | ||||||||
| Strychnos madagascariensis | 2 | 0.05 | 0.34 | 0.33 | ||||||||||||
| Mimusops obtusifolia | 1 | 0.11 | 0.96 | 0.91 | 2 | 0.16 | 1.34 | 1.23 | ||||||||
| Spirostachys africana | 1 | 0.1 | 0.75 | 0.72 | 2 | 0.13 | 1.01 | 0.94 | ||||||||
| Acacia gerrardii | 2 | 0.11 | 0.98 | 0.73 | ||||||||||||
| Kigelia africana | 0 | 0.03 | 0.3 | 0.22 | 2 | 0.08 | 0.76 | 0.57 | ||||||||
| Mundulea sericea | 2 | 0.16 | 1.55 | 1.21 | ||||||||||||
| Uapaca nitida | 0 | 0.01 | 0.11 | 0.08 | 1 | 0.04 | 0.31 | 0.26 | ||||||||
| Parinari curatellifolia | 1 | 0.01 | 0.08 | 0.07 | ||||||||||||
| Hirtella zanguebarica | 0 | 0.02 | 0.03 | 1 | 0.02 | 0.12 | 0.14 | |||||||||
| Afzelia quanzensis | 0 | 0.02 | 0.21 | 0.18 | 1 | 0.06 | 0.6 | 0.47 | ||||||||
| Maytenus guyansis | 1 | 0.01 | 0.09 | 0.08 | ||||||||||||
| Sclerocarya birrea | 0 | 0.01 | 0.11 | 0.1 | 1 | 0.05 | 0.48 | 0.38 | ||||||||
| Balanites maughamii | 0 | 0.03 | 0.13 | 0.21 | 0 | 0.03 | 0.2 | 0.26 | ||||||||
| Combretum hereroense | 0 | 0.01 | 0.04 | 0.05 | ||||||||||||
| Euclea natalensis | 0 | 0.03 | 0.03 | |||||||||||||
| Milicia excelsa | 0 | 0.01 | 0 | 0.01 | 0.09 | 0.09 | ||||||||||
| Grewia transzambesica | 0 | 0.02 | 0.02 | |||||||||||||
| Acacia nigrescensis | 0 | 0.01 | 0.04 | 0.04 | 0 | 0.01 | 0.09 | 0.08 | ||||||||
| Diplorhynchus condylocarpon | 0 | 0.02 | 0.02 | |||||||||||||
| Erythophloeum suaveolens | 0 | 0.02 | 0.19 | 0.14 | 0 | 0.02 | 0.21 | 0.15 | ||||||||
| Tabernaemontana elegans | 0 | 0.02 | 0.02 | |||||||||||||
| Tamarindus indica | 0 | 0.02 | 0.01 | |||||||||||||
| Vitex payos | 0 | 0.01 | 0.12 | 0.11 | 0 | 0.01 | 0.13 | 0.11 | ||||||||
| Antidesma venosum | 0 | 0.02 | 0.02 | |||||||||||||
| Hugonia busseana | 0 | 0.01 | 0.01 | |||||||||||||
| Piliostigma thoningii | 0 | 0.01 | 0.01 | |||||||||||||
| Scolopia stolzii | 0 | 0.01 | 0.05 | 0.04 | ||||||||||||
| Albizia versicolor | 0 | 0.02 | 0.02 | |||||||||||||
| Casearia gladiiformis | 0 | 0.01 | 0.01 | |||||||||||||
| Erythophleum africanum | 0 | 0.01 | 0.06 | 0.04 | 0 | 0.01 | 0.1 | 0.06 | ||||||||
| Garcinia livingstonei | 0 | 0.01 | 0.01 | |||||||||||||
| Strichnos spinosa | 0 | 0.01 | 0.01 | |||||||||||||
| Xeroderris stuhlmannii | 0 | 0.04 | 0.03 | 0 | 0.01 | 0.06 | 0.05 | |||||||||
| Albizia adianthifolia | 0 | 0.01 | ||||||||||||||
| Celtis gomphophylla | 0 | |||||||||||||||
| Dalbergia nitidula | 0 | |||||||||||||||
| Dyospiros mespiliformis | 0 | 0.01 | 0.1 | 0.06 | 0 | 0.01 | 0.1 | 0.06 | ||||||||
| Margaritaria discoidea | 0 | |||||||||||||||
| Markhamia obtusifolia | 0 | 0.01 | 0.01 | |||||||||||||
| Sphaerocoryne gracilis | 0 | |||||||||||||||
| Vangueria infausta | 0 | |||||||||||||||
| Ximenia caffra | 0 | |||||||||||||||
| Ziziphus abyssinica | 0 | |||||||||||||||
| Total | 36 | 7 | 71 | 54 | 255 | 15.43 | 145.38 | 109.68 | ||||||||
Appendix B
| Specie | Family | Shade Tolerance/Intolerance | Fire Resistance | Commercial Value | Conservation Value | |
|---|---|---|---|---|---|---|
| 1 | Brachystegia spiciformis | Fabaceae | LD | FS | SC | LC |
| 2 | P. maprouneifolia | Euphorbiaceae | LD | FT | TC | NIL |
| 3 | Millettia stuhlmannii | Fabaceae | ST | FT | FiC | NIL |
| 4 | A. andongensis | Fabaceae | LD | FT | SC | NIL |
| 5 | Combretum zeyheri | Combretaceae | LD | FT | NC | LC |
| 6 | Lannea antiscorbutica | Anacardiaceae | Ubiquitous | FT | FoC | NIL |
| 7 | Pteleopsis myrtifolia | Combretaceae | LD | FT | SC | NIL |
| 8 | Turraea nilotica | Meliaceae | LD | NC | LC | |
| 9 | Burkea africana | Fabaceae | LD | FT | SC | LC |
| 10 | Cleistanthus holtzii | Phyllanthaceae | TC | NIL | ||
| 11 | Combretum molle | Combretaceae | LD | FT | NC | LC |
| 12 | S. madagascariensis | Loganiaceae | LD | NC | NIL | |
| 13 | Acacia gerrardii | Fabaceae | LD | NC | NIL | |
| 14 | Kigelia africana | Bignoniaceae | LD | TC | LC | |
| 15 | Julbernardia globiflora | Fabaceae | LD | FS | SC | NIL |
| 16 | Pterocarpus angolensis | Fabaceae | LD | FT | FiC | LC |
| 17 | Mundulea sericea | Fabaceae | LD | NC | LC | |
| 18 | Mimusops obtusifolia | sapotaceae | ST | FoC | NIL | |
| 19 | Terminalia sericea | Combretaceae | LD | FT | TC | LC |
| 20 | Afzelia quanzensis | Fabaceae | FiC | LC | ||
| 21 | Parinari curatellifolia | Chrysobalanaceae | LD | FT | SC | LC |
| 22 | Spirostachys africana | Euphorbiaceae | LD | P | LC | |
| 23 | Sclerocarya birrea | Anacardiaceae | LD | SC | LC | |
| 24 | Uapaca nitida | Euphorbiaceae | LD | TC | LC | |
| 25 | Hirtella zanguebarica | Chrysobalanaceae | FoC | NIL | ||
| 26 | Maytenus guyansis | Celastraceae | ST | NC | LC | |
| 27 | Balanites maughamii | Zygophyllaceae | LD | FiC | LC | |
| 28 | Combretum hereroense | Combretaceae | FT | NC | LC | |
| 29 | Milicia excelsa | Moraceae | LD | P | NT | |
| 30 | Erythophloeum suaveolens | Fabaceae | FiC | NIL | ||
| 31 | Grewia transzambesica | Malvaceae | LD | NC | LC | |
| 32 | Acacia nigrescensis | Fabaceae | LD | TC | NIL | |
| 33 | Vitex payos | Lamiaceae | LD | TC | LC | |
| 34 | Euclea natalensis | Ebenaceae | ST | NC | LC | |
| 35 | Scolopia stolzii | Salicaceae | ST | NC | NIL | |
| 36 | Piliostigma thoningii | Fabaceae | LD | TC | LC | |
| 37 | D. condylocarpon | Meliaceae | LD | FT | NC | NIL |
| 38 | Erythophleum africanum | Fabaceae | TC | NIL | ||
| 39 | Tabernaemontana elegans | Apocynaceae | LD | NC | LC | |
| 40 | Tamarindus indica | Fabaceae | LD | FoC | LC | |
| 41 | Hugonia busseana | Linaceae | ST | NC | ||
| 42 | Albizia versicolor | Fabaceae | Ubiquitous | FT | FiC | LC |
| 43 | Casearia gladiiformis | Salicaceae | NC | LC | ||
| 44 | Strichnos spinosa | Loganiaceae | LD | NC | ||
| 45 | Antidesma venosum | Phyllanthaceae | LD | FoC | LC | |
| 46 | Garcinia livingstonei | Clusiaceae | NC | LC | ||
| 47 | Celtis gomphophylla | Cannabaceae | LD | TC | LC | |
| 48 | Xeroderris stuhlmannii | Fabaceae | TC | |||
| 49 | Dyospiros mespiliformis | Ebenaceae | LD | P | ||
| 50 | Albizia adianthifolia | Fabaceae | Ubiquitous | FT | SC | LC |
| 51 | Markhamia obtusifolia | Bignoniaceae | ST | NC | LC | |
| 52 | Sphaerocoryne gracilis | Annonaceae | NC | LC | ||
| 53 | Dalbergia nitidula | Fabaceae | LD | NC | LC | |
| 54 | Margaritaria discoidea | Phyllanthaceae | NC | LC | ||
| 55 | Ximenia caffra | Olacaceae | LD | NC | LC | |
| 56 | Ziziphus abyssinica | Rhamnaceae | LD | NC | LC | |
| 57 | Vangueria infausta | Rubiaceae | ST | NC | LC | |
| 58 | Rourea orientales | Cannabaceae | NC | LC |
References
- MITADER. Inventário Florestal Nacional; MITADER: Maputo, Mozambique, 2018. [Google Scholar]
- Goodman, R.C.; Van Hensbergen, H.J.; Bengtsson, K.; Kaplan, A.; Persson, M. Commentary Transforming the tropical timber industry could be the key to realizing the potential of forests and forest products. One Earth 2024, 7, 1142–1146. [Google Scholar] [CrossRef]
- Gumbo, D.J.; Dumas-Johansen, M.; Muir, G.; Boerstler, F.; Xia, Z. Sustainable Management of Miombo Woodlands. Food Security, Nutrition, and Wood Energy; Food and Agriculture Organization of the United Nations (FAO): Rome, Italy, 2018. [Google Scholar]
- Makunga, J.E.; Misana, S.B. The Extent and Drivers of Deforestation and Forest Degradation in Masito-Ugalla Ecosystem, Kigoma Region, Tanzania. Open J. For. 2017, 7, 285–305. [Google Scholar] [CrossRef]
- Syampungani, S.; Chirwa, P.W.; Geldenhuys, C.J.; Handavu, F.; Chishaleshale, M.; Rija, A.A.; Mbanze, A.A.; Ribeiro, N.S. Managing Miombo: Ecological and Silvicultural Options for Sustainable Socio-Economic Benefits. In Miombo Woodlands in a Changing Environment: Securing the Resilience and Sustainability of People and Woodlands; Ribeiro, N.S., Katerere, Y., Chirwa, P.W., Grundy, I.M., Eds.; Springer Nature Switzerland AG: Cham, Switzerland, 2020; Chapter IV; pp. 101–131. [Google Scholar]
- White, F. The Vegetation of Africa; UNESCO: Paris, France, 1983. [Google Scholar]
- Syampungani, S. Vegetation Change Analysis and Ecological Recovery of The Copperbelt Miombo Woodland of Zambia. Ph.D. Thesis, University of Stellenbosch, Stellenbosch, South Africa, 2008. [Google Scholar]
- Lawton, A.R.M. A Study of the Dynamic Ecology of Zambian Vegetation. J. Ecol. 1978, 66, 175–198. [Google Scholar] [CrossRef]
- Trapnell, C.G. Ecological Results of Woodland and Burning Experiments in Northern Rhodisia. J. Ecol. 1959, 47, 129. [Google Scholar] [CrossRef]
- Bulenga, G.B.; Maliondo, S.M.S.; Katani, J.Z. Relationships Between Tree Species Diversity With Soil Chemical Properties in Semi-Dry Miombo Woodland Ecosystems. Tanzan. J. For. Nat. Conserv. 2021, 90, 1–17. [Google Scholar]
- Mario, A.J.; Mesa, S.A.R.; Serrote, C.M.L. The effect of anthropic activities on forest coverage in the Mecubúri Forest Reserve, Mozambique. Nativa 2021, 9, 588–593. [Google Scholar] [CrossRef]
- Ribeiro, N.; Ruecker, G.; Govender, N.; Macandza, V.; Pais, A.; Machava, D.; Chauque, A.; Lisboa, S.N.; Bandeira, R. The influence of fire frequency on the structure and botanical composition of savanna ecosystems. Ecol. Evol. 2019, 9, 8253–8264. [Google Scholar] [CrossRef]
- Chidumayo, E.N. Forest degradation and recovery in a miombo woodland landscape in Zambia: 22 years of observations on permanent sample plots. For. Ecol. Manag. 2013, 291, 154–161. [Google Scholar] [CrossRef]
- Kikula, I.S. The Influence of Fire on the Composition of Miombo Woodland of SW Tanzania. Oikos 1986, 46, 317–324. [Google Scholar] [CrossRef]
- Frost, P. The ecology of miombo woodlands. In The Miombo in Transition: Woodlands and Welfare in Africa; Campbell, B., Ed.; CIFOR: Jakarta, Indonesia, 1996; Chapter 2; pp. 11–57. [Google Scholar] [CrossRef]
- Chidumayo, E.; Marunda, C. Dry Forests and Woodlands in Sub-Saharan Africa: Context and Challenges. In The Dry Forests and Woodlands of Africa: Managing for Products and Services, 1st ed.; Chidumayo, E.N., Gumbo, D.J., Eds.; Center for International Forestry Research (CIFOR): London, UK; Washington, DC, USA, 2010; Chapter I; pp. 1–9. [Google Scholar] [CrossRef]
- Orthmann, B. Vegetation Ecology of a Woodland-Savanna Mosaic in Central Benin (West Africa): Ecosystem Analysis with Focus on the Impact of Selective Logging. Ph.D. Thesis, Universität Rostock, Rostock, Germany, 2005. [Google Scholar]
- Chirwa, P.W.; Syampungani, S.; Geldenhuys, C.J. The ecology and management of the Miombo woodlands for sustainable livelihoods in southern Africa: The case for non-timber forest products. South. For. 2009, 70, 237–245. [Google Scholar] [CrossRef]
- Republica de Mocambique, Boletim da República. 2020. Available online: https://gazettes.africa/akn/mz/officialGazette/government-gazette-series-i/2020-03-27/60/por@2020-03-27/source (accessed on 20 December 2024).
- Poudyal, B.H.; Maraseni, T.; Cockfield, G. Evolutionary dynamics of selective logging in the tropics: A systematic review of impact studies and their e ff ectiveness in sustainable forest management. For. Ecol. Manag. 2018, 430, 166–175. [Google Scholar] [CrossRef]
- Cazzolla Gatti, R.; Castaldi, S.; Lindsell, J.A.; Coomes, D.A.; Marchetti, M.; Maesano, M.; Di Paola, A.; Paparella, F.; Valentini, R. The impact of selective logging and clearcutting on forest structure, tree diversity and above-ground biomass of African tropical forests. Ecol. Res. 2014, 30, 119–132. [Google Scholar] [CrossRef]
- Nasi, R.; Cassagne, B.; Billand, A. Forest management in Central Africa: Where are we? Int. For. Rev. 2006, 8, 14–20. [Google Scholar] [CrossRef]
- Perez-Verdin, G.; Monarrez-Gonzalez, J.C.; Tecle, A.; Pompa-Garcia, M. Evaluating the multi-functionality of forest ecosystems in northern Mexico. Forests 2018, 9, 178. [Google Scholar] [CrossRef]
- Sitoe, A.; Chidumayo, E.; Alberto, M. Timber and wood products. In The Dry Forests and Woodlands of Africa: Managing for Products and Services, 1st ed.; Chidumayo, E.N., Gumbo, D.J., Eds.; Center for International Forestry Research: London, UK; Washington, DC, USA, 2010; Chapter VI; pp. 131–153. [Google Scholar] [CrossRef]
- Ribeiro, N.S.; de Miranda, P.L.S.; Timberlake, J. Biogeography and Ecology of Miombo Woodlands. In Miombo Woodlands in a Changing Environment: Securing the Resilience and Sustainability of People and Woodlands, 1st ed.; Ribeiro, N.S., Yemi, K., Chirwa, P.W., Grundy, I.M., Eds.; Springer Nature: Cham, Switzerland, 2020; Chapter II; pp. 9–55. [Google Scholar]
- Damptey, F.G.; Adofo, E.; Duah-Gyamfi, A.; Adusu, D.; Opuni-Frimpong, E. Logging effects on seedling regeneration and diversity in a tropical moist semi-deciduous forest in Ghana. Geol. Ecol. Landsc. 2023, 7, 269–280. [Google Scholar] [CrossRef]
- Hofiço, N.D.S.A. Potencial de regeneração natural e crescimento de Millettia stuhlmannii taub. Em floresta de miombo como Subsídio para o manejo sustentável. Ph.D. Thesis, Universidade Federal De Santa Maria, Santa Maria, Brazil, 2021. [Google Scholar]
- Kalaba, F.K.; Quinn, C.H.; Dougill, A.J.; Vinya, R. Floristic composition, species diversity and carbon storage in charcoal and agriculture fallows and management implications in Miombo woodlands of Zambia. For. Ecol. Manag. 2013, 304, 99–109. [Google Scholar] [CrossRef]
- Lisboa, S.N.; Grinand, C.; Betbeder, J.; Montfort, F.; Blanc, L. Disentangling the drivers of deforestation and forest degradation in the Miombo landscape: A case study from Mozambique. Int. J. Appl. Earth Obs. Geoinf. 2024, 130, 103904. [Google Scholar] [CrossRef]
- Workneh, Y.; Wasie, D. Effects of Selective Harvesting on Diversit, Structure and Regeneration of Woody Plants in Mixed Plantation of Menagesha Suba Forest, Central Ethiopia. Int. J. For. Res. 2024, 2024, 1–20. [Google Scholar] [CrossRef]
- Syampungani, S.; Geldenhuys, C.J.; Chirwa, P.W. Linking disturbances to sustainable management of the copperbelt miombo woodland ecosystems of zambia. In Sustainable Management in Africa: Some Solutions to Natural Forest Management Problems in Africa; Geldenhuys, C.J., Ham, C., Ham, H., Eds.; Department of Forest and Wood Science of Stellenbosch University: Matieland, South Africa, 2008; pp. 71–87. [Google Scholar]
- Ribeiro, N.S.; de Miranda, P.L.S.; Timberlake, J. Biogeography and Ecology of Miombo Woodlands. In Managing Miombo: Ecological and Silvicultural Options for Sustainable Socio-Economic Benefit; Ribeiro, N.S., Katerere, Y., Chirwa, P.W., Grundy, M.I., Eds.; Springer Nature: Cham, Switzerland, 2020; Chapter II; pp. 9–54. [Google Scholar]
- Amonum, J.I.; Jonathan, B.A.; Japheth, H. Structure and Diversity of Tree Species at the College of Forestry and Fisheries, University of Agriculture Makurdi, Benue State, Nigeria. Int. J. For. Hortic. 2019, 5, 20–27. [Google Scholar] [CrossRef]
- Ribeiro, N.S.; Grundy, I.M.; Gonçalves, F.M.P.; Moura, I.; Santos, M.J.; Kamoto, J.; Ribeiro-Barros, A.I.; Gandiwa, E. People in the Miombo Woodlands: Socio-Ecological Dynamics. In Miombo Woodlands in a Changing Environment: Securing the Resilience and Sustainability of People and Woodlands; Ribeiro, N.S., Katerere, Y., Chirwa, P.W., Grundy, I.M., Eds.; Springer: Cham, Switzerland, 2020; Chapter III; pp. 55–100. [Google Scholar]
- Matowo, G.S.; Sangeda, A.Z.; Katani, J.Z. The regeneration dynamics of Miombo tree species in Sub-Saharan Africa. Afr. J. Ecol. Ecosyst. 2019, 6, 1–16. [Google Scholar]
- Nangendo, G.; Steege, H.T.; Bongers, F. Composition of woody species in a dynamic forest–woodland–savannah mosaic in Uganda: Implications for conservation and management. Biodivers. Conserv. 2006, 15, 1467–1495. [Google Scholar] [CrossRef]
- Dziba, L.; Ramoelo, A.; Ryan, C.; Harrison, S.; Pritchard, R.; Tripathi, H.; Sitas, N.; Selomane, O.; Engelbrecht, F.; Pereira, L.; et al. Scenarios for Just and Sustainable Futures in the Miombo Woodlands. In Miombo Woodlands in a Changing Environment: Securing the Resilience and Sustainability of People and Woodlands, 1st ed.; Ribeiro, N.S., Katerere, Y., Chirwa, P.W., Grundy, I.M., Eds.; Springer Nature: Cham, Switzerland, 2020; Chapter VI; pp. 191–235. [Google Scholar]
- De Cáceres, M.; Martín-Alcón, S.; González-Olabarria, J.R.; Coll, L. A general method for the classification of forest stands using species composition and vertical and horizontal structure. Ann. For. Sci. 2019, 76, 40. [Google Scholar] [CrossRef]
- Sobola, O.O.; Oke, D.O.; Adedayo, A.G.; Olusola, J.A. Tree Species Composition, Richness and Diversity in the Northern Guinea-Savanna Taraba State, Nigeria. Asian J. Res. Agric. For. 2021, 7, 1–11. [Google Scholar] [CrossRef]
- Perring, M.P.; Standish, R.J.; Price, J.N.; Craig, M.D.; Erickson, T.E.; Ruthrof, K.X.; Whiteley, A.S.; Valentine, L.E.; Hobbs, R.J. Advances in restoration ecology: Rising to the challenges of the coming decades. Ecosphere 2015, 6, 1–25. [Google Scholar] [CrossRef]
- Congdon, R.A.; Herbohn, J.L. Ecosystem dynamics of disturbed and undisturbed sites in north Queensland wet tropical rain forest. I. Floristic composition, climate and soil chemistry. J. Trop. Ecol. 1993, 9, 349–363. [Google Scholar] [CrossRef]
- Fujimori, T. Ecological and Silvicultural Strategies for Sustainable Forest Management, 1st ed.; Elsevier Science B.V.: Amsterdam, The Netherlands, 2001. [Google Scholar]
- Victor, P.M.; Tshisikhawe, M.P.; Magwede, K. Population dynamics of Spirostachys africana Sond. a species highly exploited amongst some communities of Limpopo Province, South Africa. Biodiversitas 2023, 24, 492–497. [Google Scholar] [CrossRef]
- Kacholi, D.S. Population structure, harvesting rate and regeneration status of four woody species in Kimboza forest reserve, Morogoro region—Tanzania. Plants Environ. 2020, 2, 94–100. [Google Scholar] [CrossRef]
- Temgoua, L.F.; Solefack, M.C.M.; Nyong, P.A.; Tadjo, P. Floristic diversity and exploitable potential of commercial timber species in the Cobaba community forest in Eastern Cameroon: Implications for forest management. For. Sci. Technol. 2020, 16, 56–67. [Google Scholar] [CrossRef]
- Romero, F.M.B.; Jacovine, L.A.G.; Ribeiro, S.C.; Torres, C.M.M.E.; Silva, L.F.D.; Gaspar, R.D.O.; Rocha, S.J.S.S.D.; Staudhammer, C.L.; Fearnside, P.M. Allometric equations for volume, biomass, and carbon in commercial stems harvested in a managed forest in the southwestern amazon: A case study. Forests 2020, 11, 874. [Google Scholar] [CrossRef]
- Chaúque, M. Relatório de Inventário Florestal Relatório de Inventário Florestal da Concessão Florestal de Condue, Distritos de Muanza e Cheringoma, Província de Sofala; Pemba, Mozambique, 2020. [Google Scholar]
- Falcão, M.P. Plano de Maneio Revisto 2017-2022 Levasflor; Maputo, Mozambique, 2017. [Google Scholar]
- LevasFlor. Plano De Maneio Da LevasFlor; LDA: Beira, Mozambique, 2024. [Google Scholar]
- Tchouto, M.G.P.; De Boer, W.F.; De Wilde, J.J.F.E.; Van Der Maesen, L.J.G. Diversity patterns in the flora of the Campo-Ma’an rain forest, Cameroon: Do tree species tell it all? In Forest Diversity and Management; Hawksworth, D.L., Bull, A.T., Eds.; Springer: Dordrecht, The Netherlands, 2006; pp. 293–314. [Google Scholar] [CrossRef]
- Kershaw, J.J.A.; Ucey, M.J.; Beers, T.W.; Husch, B. Forest Mensuration, 5th ed.; John Wiley & Sons: West Sussex, UK, 2017. [Google Scholar]
- Marzoli, A. Inventário Florestal Nacional-Avaliação Integrada Das Florestas de Moçambique; Ministério de Agricultura: Maputo, Mozambique, 2007; p. 98. [Google Scholar]
- Guedes, B.S.; Sitoe, A.A.; Olsson, B.A. Allometric models for managing lowland miombo woodlands of the Beira corridor in Mozambique. Glob. Ecol. Conserv. 2018, 13, e00374. [Google Scholar] [CrossRef]
- Mounmemi, H.K.; Ekué, M.R.M.; Forbi, F.P.; Banoho, L.P.R.K.; Tiokeng, B.; Maffo, N.L.M.; Betti, L.J.; Tchoupou, C.M.V.; Ntonmen, A.F.Y.; Taedoumg, H.E.; et al. Assessing plant diversity change in logged and unlogged dense semi-deciduous production forest of eastern Cameroon. Heliyon 2023, 9, e16199. [Google Scholar] [CrossRef]
- Henderson, P.A. Practical Methods in Ecology, 1st ed.; Blackwell Science Ltd.: Malden, MA, USA; Oxford, UK; Victoria, Australia; Berlin, Germany, 2003; Volume 30. [Google Scholar] [CrossRef]
- Southwood, T.R.E.; Henderson, P.A. Ecological Methods, 3rd ed.; Blackwell Science Ltd.: Oxford, UK; London, UK; Edinburgh, UK, 2000. [Google Scholar]
- Nyirenda, H.; Assédé, E.P.S.; Chirwa, P.W.; Geldenhuys, C.; Nsubuga, F.W. The effect of land use change and management on the vegetation characteristics and termite distribution in Malawian Miombo woodland agroecosystem. Agrofor. Syst. 2019, 93, 2331–2343. [Google Scholar] [CrossRef]
- Zimudzi, C.; Chapano, C. Diversity, Population Structure, and Above Ground Biomass in Woody Species on Ngomakurira Mountain, Domboshawa, Zimbabwe. Int. J. Biodivers. 2016, 2016, 4909158. [Google Scholar] [CrossRef]
- Ryan, C.M.; Pritchard, R.; McNicol, I.; Owen, M.; Fisher, J.A.; Lehmann, C. Ecosystem services from southern African woodlands and their future under global change. Philos. Trans. R. Soc. B Biol. Sci. 2016, 371, 20150312. [Google Scholar] [CrossRef] [PubMed]
- Mwakalukwa, E.E.; Andrew, S.M. Structure, regeneration and carbon stocks of woody plants in the Litwang’ata village land forest reserve, Southwest Tanzania. Folia Oecologica 2024, 51, 29–38. [Google Scholar] [CrossRef]
- Desanker, P.V.; Prentice, I.C. MIOMBO—A vegetation dynamics model for the miombo woodlands on Zambezian Africa. For. Ecol. Manag. 1994, 69, 87–95. [Google Scholar] [CrossRef]
- Ryan, C.; Williams, M. How does fire intensity and frequency affect miombo woodland tree populations and biomass? Ecol. Appl. 2011, 21, 48–60. [Google Scholar] [CrossRef]
- Mapaure, I. Short-term responses of shrub layer communities to dry season fires and tree thinning in semi-arid miombo woodlands of north-western Zimbabwe. Afr. J. Plant Sci. 2013, 7, 414–425. [Google Scholar] [CrossRef]
- Humphrey, J.; Bailey, S. Practice Guide: Managing Deadwood in Forests and Woodlands, 1st ed.; Forestry Commission: Edinburgh, Scotland, 2012. [Google Scholar]
- Maliondo, S.M.S.; Abeli, W.S.; Meiludie, R.E.L.O.; Migunga, G.A.; Kimaro, A.A.; Applegate, G.B. Tree species composition and potential timber production of a communal miombo woodland in Handeni district, Tanzania. J. Trop. For. Sci. 2005, 17, 104–120. [Google Scholar]
- Miapia, L.M.; Ariza-Mateos, D.; Lacerda-Quartín, V.; Palacios-Rodríguez, G. Deforestation and Biomass Production in Miombo Forest in Huambo (Angola): A Balance between Local and Global Needs. Forests 2021, 12, 1557. [Google Scholar] [CrossRef]
- Chingonikaya, E.E.; Munishi, P.K.T.; Luoga, E.J. Woody Vegetation Stocking, Composition and Diversity in Miombo Woodlands in Tanzania: A Case Study of Mgori Forest Reserve in Singida District. Tanzan. J. For. Nat. Conserv. 2010, 80, 1–18. [Google Scholar]
- Chamshama, S.A.O.; Mugasha, A.G.; Zahabu, E. Stand biomass and volume estimation for miombo woodlands at kitulangalo, morogoro, tanzania. S. Afr. For. J. 2004, 200, 59–69. [Google Scholar] [CrossRef]
- Mwakalukwa, E.E.; Meilby, H.; Treue, T. Floristic Composition, Structure, and Species Associations of Dry Miombo Woodland in Tanzania. ISRN Biodivers. 2014, 2014, 1–15. [Google Scholar] [CrossRef]
- Koirala, A.; Montes, C.R.; Bullock, B.P.; Wagle, B.H. Developing taper equations for planted teak (Tectona grandis L.f.) trees of central lowland Nepal. Trees For. People 2021, 5, 100103. [Google Scholar] [CrossRef]
- Bulusu, M.; Martius, C.; Clendenning, J. Carbon stocks in miombo woodlands: Evidence from over 50 years. Forests 2021, 12, 862. [Google Scholar] [CrossRef]
- Shirima, D.D.; Munishi, P.K.T.; Lewis, S.L.; Burgess, N.D.; Marshall, A.R.; Balmford, A.; Swetnam, R.D.; Zahabu, E.M. Carbon storage, structure and composition of Miombo woodlands in Carbon storage, structure and composition of miombo woodlands in Tanzania’s Eastern Arc Mountains. Afr. J. Ecol. 2011, 49, 332–342. [Google Scholar] [CrossRef]
- Muvengwi, J.; Chisango, T.; Mpakairi, K.; Mbiba, M.; Witkowski, E.T.F. Structure, composition and regeneration of miombo woodlands within harvested and unharvested areas. For. Ecol. Manag. 2020, 458, 117792. [Google Scholar] [CrossRef]
- Handavu, F.; Syampungani, S.; Chisanga, E. The influence of stump diameter and height on coppicing ability of selected key Miombo woodland tree species of Zambia: A guide for harvesting for charcoal production. Ecol. Nat. Environ. 2011, 3, 461–468. [Google Scholar] [CrossRef]
- Syampungani, S.; Geldenhuys, C.J.; Chirwa, P.W. Regeneration dynamics of miombo woodland in response to different anthropogenic disturbances: Forest characterisation for sustainable management. Agrofor. Syst. 2015, 90, 563–576. [Google Scholar] [CrossRef]
- Saka, M.G.; Nyiptem, E.I. Quantitative Analysis of Tree Species Composition and Diversity in Gashaka Gumti National Park Nigeria. Int. J. Res. Agric. For. 2018, 5, 17–23. [Google Scholar]
- Zisadza-Gandiwa, P.; Mabika, C.T.; Kupika, O.L.; Gandiwa, E.; Murungweni, C. Vegetation Structure and Composition across Different Land Uses in a Semiarid Savanna of Southern Zimbabwe. Int. J. Biodivers. 2013, 2013, 692564. [Google Scholar] [CrossRef]
- Ameja, L.G.; Ribeiro, N.; Sitoe, A.A.; Guillot, B. Regeneration and restoration status of miombo woodland following land use land cover changes at the buffer zone of Gile National Park’s Central Mozambique. Trees For. People 2022, 9, 100290. [Google Scholar] [CrossRef]
- Hofiço, N.D.S.A.; Fleig, F.D. Diversity and Structure of Miombo Woodlands in Mozambique Using a Range of Sampling Sizes. J. Agric. Sci. Technol. B 2015, 5, 679–690. [Google Scholar] [CrossRef]
- Jew, E.K.K.; Dougill, A.J.; Sallu, S.M.; O’Connell, J.; Benton, T.G. Miombo woodland under threat: Consequences for tree diversity and carbon storage. For. Ecol. Manag. 2016, 361, 144–153. [Google Scholar] [CrossRef]
- Mwavu, E.N.; Witkowski, E.T.F. Population structure and regeneration of multiple-use tree species in a semi-deciduous African tropical rainforest: Implications for primate conservation. For. Ecol. Manag. 2009, 258, 840–849. [Google Scholar] [CrossRef]
- Tshisikhawe, M.P.; Siaga, N.M.; Bhat, R.B. Population dynamics of Millettia stuhlmannii Taub. in Ha-Makhuvha, Vhembe district of Limpopo province, South Africa. Phyton-Int. J. Exp. Bot. 2011, 80, 127–132. [Google Scholar] [CrossRef]
- Egonmwan, I.Y.; Ogana, F.N. Application of diameter distribution model for volume estimation in Tectona grandis L.f. stands in the Oluwa forest reserve, Nigeria. Trop. Plant Res. 2020, 7, 573–580. [Google Scholar] [CrossRef]
- Buramuge, V.A.; Ribeiro, N.S.; Olsson, L.; Bandeira, R.R.; Lisboa, S.N. Tree Species Composition and Diversity in Fire-Affected Areas of Miombo Woodlands, Central Mozambique. Fire 2023, 6, 26. [Google Scholar] [CrossRef]
- Hofiço, N.D.S.A.; Costa, E.A.; Nanvonamuquitxo, S.J.A.; Fleig, F.D. Regulation of the Diametric Structure of the Miombo Woodland Using the De Liocourt Method in Mozambique. Nativa 2018, 6, 407–414. [Google Scholar] [CrossRef]
- Banda, T.; Schwartz, M.W.; Caro, T. Woody vegetation structure and composition along a protection gradient in a miombo ecosystem of western Tanzania. For. Ecol. Manag. 2006, 230, 179–185. [Google Scholar] [CrossRef]
- Nanvonamuquitxo, S.J.A.; Macueia, F.B.E.D.; Caravela, M.I. Structure and forest diversity of Miombo woodland in Taratibu, North of Mozambique. Nativa 2019, 7, 778–783. [Google Scholar] [CrossRef]
- Rodgers, W.A. The Miombo Woodlands. In East African Ecosystems and Their Conservation; McClanahan, T.R., Young, T.P., Eds.; Oxford University Press: New York, NY, USA, 1996; Chapter 12; pp. 299–326. [Google Scholar] [CrossRef]
- Bulenga, G.B.; Maliondo, S.M.S.; Katani, J.Z.; Nyberg, G. Tree Species Diversity and Edaphic Factors Associated with Different Land Uses in Tropical Forest Ecosystems, Tanzania. Open J. Ecol. 2023, 13, 759–772. [Google Scholar] [CrossRef]
- Bilew, A.; Kitessa, H.; Balcha, A. Floristic composition and structural analysis of Gelesha forest, Gambella regional State, Southwest Ethiopia. J. Ecol. Nat. Environ. 2015, 7, 218–227. [Google Scholar] [CrossRef]
- Sambou, S.; Faye, L.C.; Diop, F.N.; Dieng, S.D.; Mbow, C. Importance Value Index and Species Relative Contribution to Carbon Stocks in Savanna Ecosystems: Implications for Climate Change Mitigation and Forest Management in Patako Forest (Senegal). Int. J. Innov. Sci. Res. Technol. 2022, 7, 359–365. [Google Scholar]
- Huang, W.; Pohjonen, V.; Johansson, S.; Nashanda, M.; Katigula, M.I.L.; Luukkanen, O. Species diversity, forest structure and species composition in Tanzanian tropical forests. For. Ecol. Manag. 2003, 173, 11–24. [Google Scholar] [CrossRef]
- Achury, R.; Staab, M.; Blüthgen, N.; Weisser, W.W. Forest gaps increase true bug diversity by recruiting open land species. Oecologia 2023, 202, 299–312. [Google Scholar] [CrossRef]
- Bwambok, E.; Konje, M. Impact of Anthropogenic Activities on Tree Species Density And Stem Size Distribution in Kisere Fragment of the The Kakamega Forest, Kenya. Res. J. For. 2021, 8. Available online: https://researchjournali.com/view.php?id=5735 (accessed on 11 December 2024).
- Roque, R.H.; Sebbenn, A.M.; Boshier, D.H.; Filho, A.F.; Tambarussi, E.V. Logging Affects Genetic Diversity Parameters in an Araucaria angustifolia Population: An Endangered Species in Southern Brazil. Forests 2023, 14, 1046. [Google Scholar] [CrossRef]
- Ratnam, W.; Rajora, O.P.; Finkeldey, R.; Aravanopoulos, F.; Bouvet, J.M.; Vaillancourt, R.E.; Kanashiro, M.; Fady, B.; Tomita, M.; Vinson, C. Genetic effects of forest management practices: Global synthesis and perspectives. For. Ecol. Manag. 2014, 333, 52–65. [Google Scholar] [CrossRef]
- Miller, G.W.; Smith, H.C. A Practical Alternative to Single-Tree Selection? North. J. Appl. For. 1993, 10, 32–38. [Google Scholar] [CrossRef]
- Grisez, T.J.; Mendel, J.J. The Rate of Value Increase for Black Cherry, Red Maple, and White Ash; Northeastern Forest Experiment Station, Forest Service, US Department of Agriculture: Upper Darby, PA, USA, 1972.
- Modest, R.; Maganga, S.; Hassan, S.; Mariki, S.; Muganda, M. Population Structure and Exploitation of Three Commercial Tree Species in Nguru ya Ndege Forest Reserve, Morogoro—Tanzania. Ethiop. J. Environ. Stud. Manag. 2011, 3, 41–48. [Google Scholar] [CrossRef]
- Mudekwe, J. The Impact of Subsistence Use of Forest Products and the Dynamics of Harvested Woody Species Populations in a Protected Forest Reserve in Western Zimbabwe. Ph.D. Thesis, Univeristy of Stellenbosch, Stellenbosch, South Africa, 2007. [Google Scholar]
- Mate, R.; Johansson, T.; Sitoe, A. Biomass equations for tropical forest tree species in mozambique. Forests 2014, 5, 535–556. [Google Scholar] [CrossRef]
- Joaquim-Meque, E.; Lousada, J.; Liberato, M.L.R.; Fonseca, T.F. Forest in Mozambique: Actual Distribution of Tree Species and Potential Threats. Land 2023, 12, 1519. [Google Scholar] [CrossRef]
- Gonçalves, F.M.P.; Revermann, R.; Gomes, A.L.; Aidar, M.P.M.; Finckh, M.; Juergens, N. Tree Species Diversity and Composition of Miombo Woodlands in South-Central Angola: A Chronosequence of Forest Recovery after Shifting Cultivation. Int. J. For. Res. 2017, 2017, 6202093. [Google Scholar] [CrossRef]
- Geldenhuys, C.J.; Ham, C.; Ham, H. (Eds.) Sustainable Management in Africa: Some Solutions to Natural Forest Management Problems in Africa; Department of Forest and Wood Science of Stellenbosch University: Matieland, South Africa, 2008. [Google Scholar]


| IVI Position | Scientific Name | Frequency | Min (trees/ha) | Max (trees/ha) | Mean (trees/ha) | Value of IVI |
|---|---|---|---|---|---|---|
| 1 | Brachystegia spiciformis | 34 | 34 | 231 | 108 | 0.66 |
| 2 | Pseudolachnostylis maprouneifolia | 34 | 5 | 47 | 20.5 | 0.38 |
| 3 | Millettia stuhlmannii | 34 | 10 | 31 | 19.5 | 0.38 |
| 4 | Amblygonocarpus andongensis | 34 | 3 | 26 | 11.3 | 0.37 |
| 5 | Combretum zeyheri | 33 | 0 | 45 | 16.5 | 0.35 |
Disclaimer/Publisher’s Note: The statements, opinions and data contained in all publications are solely those of the individual author(s) and contributor(s) and not of MDPI and/or the editor(s). MDPI and/or the editor(s) disclaim responsibility for any injury to people or property resulting from any ideas, methods, instructions or products referred to in the content. |
© 2025 by the authors. Licensee MDPI, Basel, Switzerland. This article is an open access article distributed under the terms and conditions of the Creative Commons Attribution (CC BY) license (https://creativecommons.org/licenses/by/4.0/).
Share and Cite
Manjate, A.; Zahabu, E.; Ilstedt, U.; Egas, A.; Goodman, R.C. Structure and Composition of a Selectively Logged Miombo Woodland in Central Mozambique. Forests 2025, 16, 569. https://doi.org/10.3390/f16040569
Manjate A, Zahabu E, Ilstedt U, Egas A, Goodman RC. Structure and Composition of a Selectively Logged Miombo Woodland in Central Mozambique. Forests. 2025; 16(4):569. https://doi.org/10.3390/f16040569
Chicago/Turabian StyleManjate, Américo, Eliakimu Zahabu, Ulrik Ilstedt, Andrade Egas, and Rosa C. Goodman. 2025. "Structure and Composition of a Selectively Logged Miombo Woodland in Central Mozambique" Forests 16, no. 4: 569. https://doi.org/10.3390/f16040569
APA StyleManjate, A., Zahabu, E., Ilstedt, U., Egas, A., & Goodman, R. C. (2025). Structure and Composition of a Selectively Logged Miombo Woodland in Central Mozambique. Forests, 16(4), 569. https://doi.org/10.3390/f16040569