Article

Hydraulic Parameters of Pressure–Volume Curves and Their Relationship with the Moisture Content of Live Fuels in Two Woody Species and an Epiphyte

by
Fabiola Guerrero Felipe
1,
Teresa Alfaro Reyna
2,
Josué Delgado Balbuena
2,
Francisco Fábian Calvillo Aguilar
3 and
Carlos Alberto Aguirre Gutierrez
2,*
1
División de Ciencias Forestales, Universidad Autonoma Chapingo, Carr. Federal Mexico-Texcoco Km 38.5, El Cooperativo, Texcoco 56230, Mexico
2
Centro Nacional de Investigación Disciplinaria Agricultura Familiar, Km 8.5, Carretera Ojuelos, Lagos de Moreno 47540, Mexico
3
Centro Nacional de Recursos Géneticos, Boulevard de la Biodiversidad No. 400, Colonia Rancho las Cruces, Tepatitlan de Morelos 47600, Mexico
*
Author to whom correspondence should be addressed.
Forests 2025, 16(4), 568; https://doi.org/10.3390/f16040568
Submission received: 30 January 2025 / Revised: 11 March 2025 / Accepted: 18 March 2025 / Published: 25 March 2025
(This article belongs to the Section Forest Hydrology)

Abstract

:
Arid and semiarid ecosystems face significant water scarcity due to high evaporation rates exceeding precipitation. This study examines temporal variations in water relations of two woody species, Vachellia schaffneri (S. Watson) Seigler & Ebinger, and Prosopis laevigata (Humb. & Bonpl. ex Willd.) M.C. Johnst, and one epiphyte, Tillandsia recurvata (L.) L. (Bromeliaceae), to assess their drought tolerance and water storage capacity. We hypothesized that species with greater water storage capacity would exhibit lower drought tolerance due to reduced osmotic adjustments, whereas species with lower storage capacity would maintain turgor through osmotic regulation and cell wall rigidity. Predawn and midday water potentials (Ψpd, Ψmd) were measured, and pressure–volume (P–V) curves were used to derive parameters such as saturated water content (SWC), osmotic potential (πo), turgor loss point (ΨTLP), relative water content at ΨTLP (RWCTLP), bulk modulus of elasticity (ε), and full turgor capacitance (CFT). Significant correlations were found between CFT and ΨTLP (positive), πo (positive), and ε (negative). P. laevigata and T. recurvata exhibited higher water storage capacities (41.46 and 26.45 MPa−1, respectively) but had a lower ability to maintain cell turgor under drought conditions. In contrast, V. schaffneri exhibited the lowest water storage capacity (11.88 MPa−1) but demonstrated the highest ability to maintain cell turgor (ΨTLP = −1.31 MPa) and superior osmotic adjustments (πo = −0.59 MPa). Both V. schaffneri and P. laevigata exhibited rigid cell walls, whereas T. recurvata displayed greater elasticity in its cell structures. The lowest moisture content in V. schaffneri suggests increased flammability and fire spread potential. Future studies should focus on live fuel moisture content across more species, explore seasonal variations in hydraulic traits, and integrate these physiological parameters into fire risk models to enhance wildfire prediction and management.

1. Introduction

We live in a changing world; plants, like all living beings, must adapt to their environment in order to survive. One of the most challenging ecosystems is arid and semiarid regions, characterized by substantial water loss through evaporation, surpassing that received from precipitation [1]. Moreover, in such ecosystems, water input through precipitation is not only scarce but also highly variable across both time and space [2]. Consequently, water availability stands as the principal limiting factor for primary productivity and numerous physiological processes within these ecosystems [3]. The anticipated impact of climate change is expected to exacerbate these conditions, leading to heightened incidence and intensity of droughts [4], which is a key factor in determining the performance of plants and is one of the main sources of variation in traits associated with plant function and structure [5].
Plants have developed diverse adaptations and mechanisms to prevent dehydration and turgor loss, in order to face water deficits, such as undergo osmotic adjustments and changes in cell wall elasticity [6]. However, not all species employ the same mechanisms or strategies, as they operate under varying degrees of stress [7,8]. If water deficit persists over an extended period, plants deploy mechanisms that safeguard against cellular damage, such as protein synthesis and the production of protective molecules (proline, glycine betaine, late embryogenesis abundant proteins). These mechanisms help mitigate damage caused by reactive oxygen species [9]. Osmotic adjustment is one of the most important physiological processes for plants in adapting to water and salt stress [10,11]. Adjustment involves the gradual accumulation of compatible osmotic compounds in the cytoplasm, reducing osmotic potential and maintaining high water potential pressure, turgor pressure, water potential gradients, and water flow [12]. While osmotic adjustment is vital for plant survival during drought conditions, it may not necessarily enhance plant growth or crop yield [13]. Decreases in leaf water potential (Ψ) due to reduced solute potential (Ψπ) are associated with osmotic adjustment in various plant species. Some studies suggest that these tolerance indicators can be used to select suitable species for planting in water-scarce areas [14]. More cell walls that are elastic may also contribute to maintaining cell turgor, and this parameter is measured as the elasticity modulus (ε) of the tissue, can help maintain cell turgor the introduction should briefly place the study in a broad context and highlight why it is important [15]. An increase in the fraction of apoplastic water, which induces osmotic adjustment, is a common response of plants to drought, improving their tolerance to water deficit.
One of the most widely employed techniques for assessing plant water status is the pressure chamber [16]. This method facilitates the generation and analysis of pressure–volume (P–V) curves to estimate plant water-related parameters [14,17,18,19]. The analysis of P–V curves enables the determination of leaf traits like water potential at the turgor loss point, and relative water content at the turgor loss point, capacitance, and elasticity of cell wall, which are associated with water stress tolerance. For instance, the turgor loss point (ΨTLP) represents the critical water potential level at which plant cells lose their turgidity. Cell turgor, widely acknowledged as the most prominent indicator of plant drought stress, holds significant importance as a key physiological trait due to its strong correlation with factors such as stomatal conductance and susceptibility to embolism [14,15]. On the other hand, the relative water content at the turgor loss point (RWCTLP) and the capacitance (C) measure the effects of water stress on tissue water volume. RWCTLP indicates the percentage of saturated volume remaining at ΨTLP and C indicates the ability to store and release water within their cells and tissues. Finally, the elasticity modulus of cell walls (ε) is considered an important physiological trait to depict the acclimation of plants to water stress. A large value for the ε is related to rigid cell walls with less elasticity [20].
P–V curves are commonly employed to determine leaf moisture content in terms of relative water content. However, they can also be utilized to estimate leaf moisture content as Leaf Fuel Moisture Content (LFMC). Humidity in plants is a crucial trait that influences combustion and fire spread [21,22]. Typically, forest fires align with periods of drought, characterized by high soil and atmospheric water deficit. During these times, fuel moisture content decreases, leading to heightened flammability and an increased risk of forest fires [23]. The amount of moisture in the fuels is called the fuel moisture content (FMC), which is defined as the mass of water per unit mass of dry material and is often expressed as a percent [24]. The distribution of both dead and live Fuel Moisture Contents (FMCs) exhibits complexity due to the diverse spatial variations in biophysical factors influencing FMC dynamics. These factors encompass interactions with plant water status, necromass, weather conditions, and topographical features. Ecophysiological processes, transpiration and soil water dynamics intricately regulate live fuel moisture content, while the physical process of evaporation [25] predominantly determines dead fuel moisture content. However, both live and dead fuel moisture dynamics are ultimately driven by the gradient of vapor pressure (humidity) from the particle to the atmosphere [26].
Despite the well-documented mechanisms of osmotic adjustment and cellular protection under drought stress, there is limited research explicitly linking these physiological traits to live fuel moisture content (LFMC), a critical parameter for understanding fire risk. While plant physiologists have often focused on water potential and individual moisture content variations, few studies have explored how these traits influence LFMC dynamics. This study aims to fill this gap by investigating how water storage capacity, cell wall elasticity, and other hydraulic traits affect LFMC, which in turn, affects fire behavior in drought-prone regions. Specifically, our research objectives are to: (1) explore the relationship between hydraulic traits (including water storage capacity and cell wall elasticity) and LFMC, and (2) examine how these traits contribute to drought tolerance and water retention. We hypothesize that species with higher water storage capacity and more flexible cell walls will retain more water and therefore exhibit higher moisture content in live fuel. To test this hypothesis, we studied temporal variations in water relation parameters in two woody species, Vachellia schaffneri (S. Watson) Seigler & Ebinger (V. schaffneri) and Prosopis laevigata (Humb. & Bonpl. ex Willd.) M.C. Johnst (P. laevigata), and one epiphytic species, Tillandsia recurvata (L.) L. (Bromeliaceae) (T. recurvata).

2. Materials and Methods
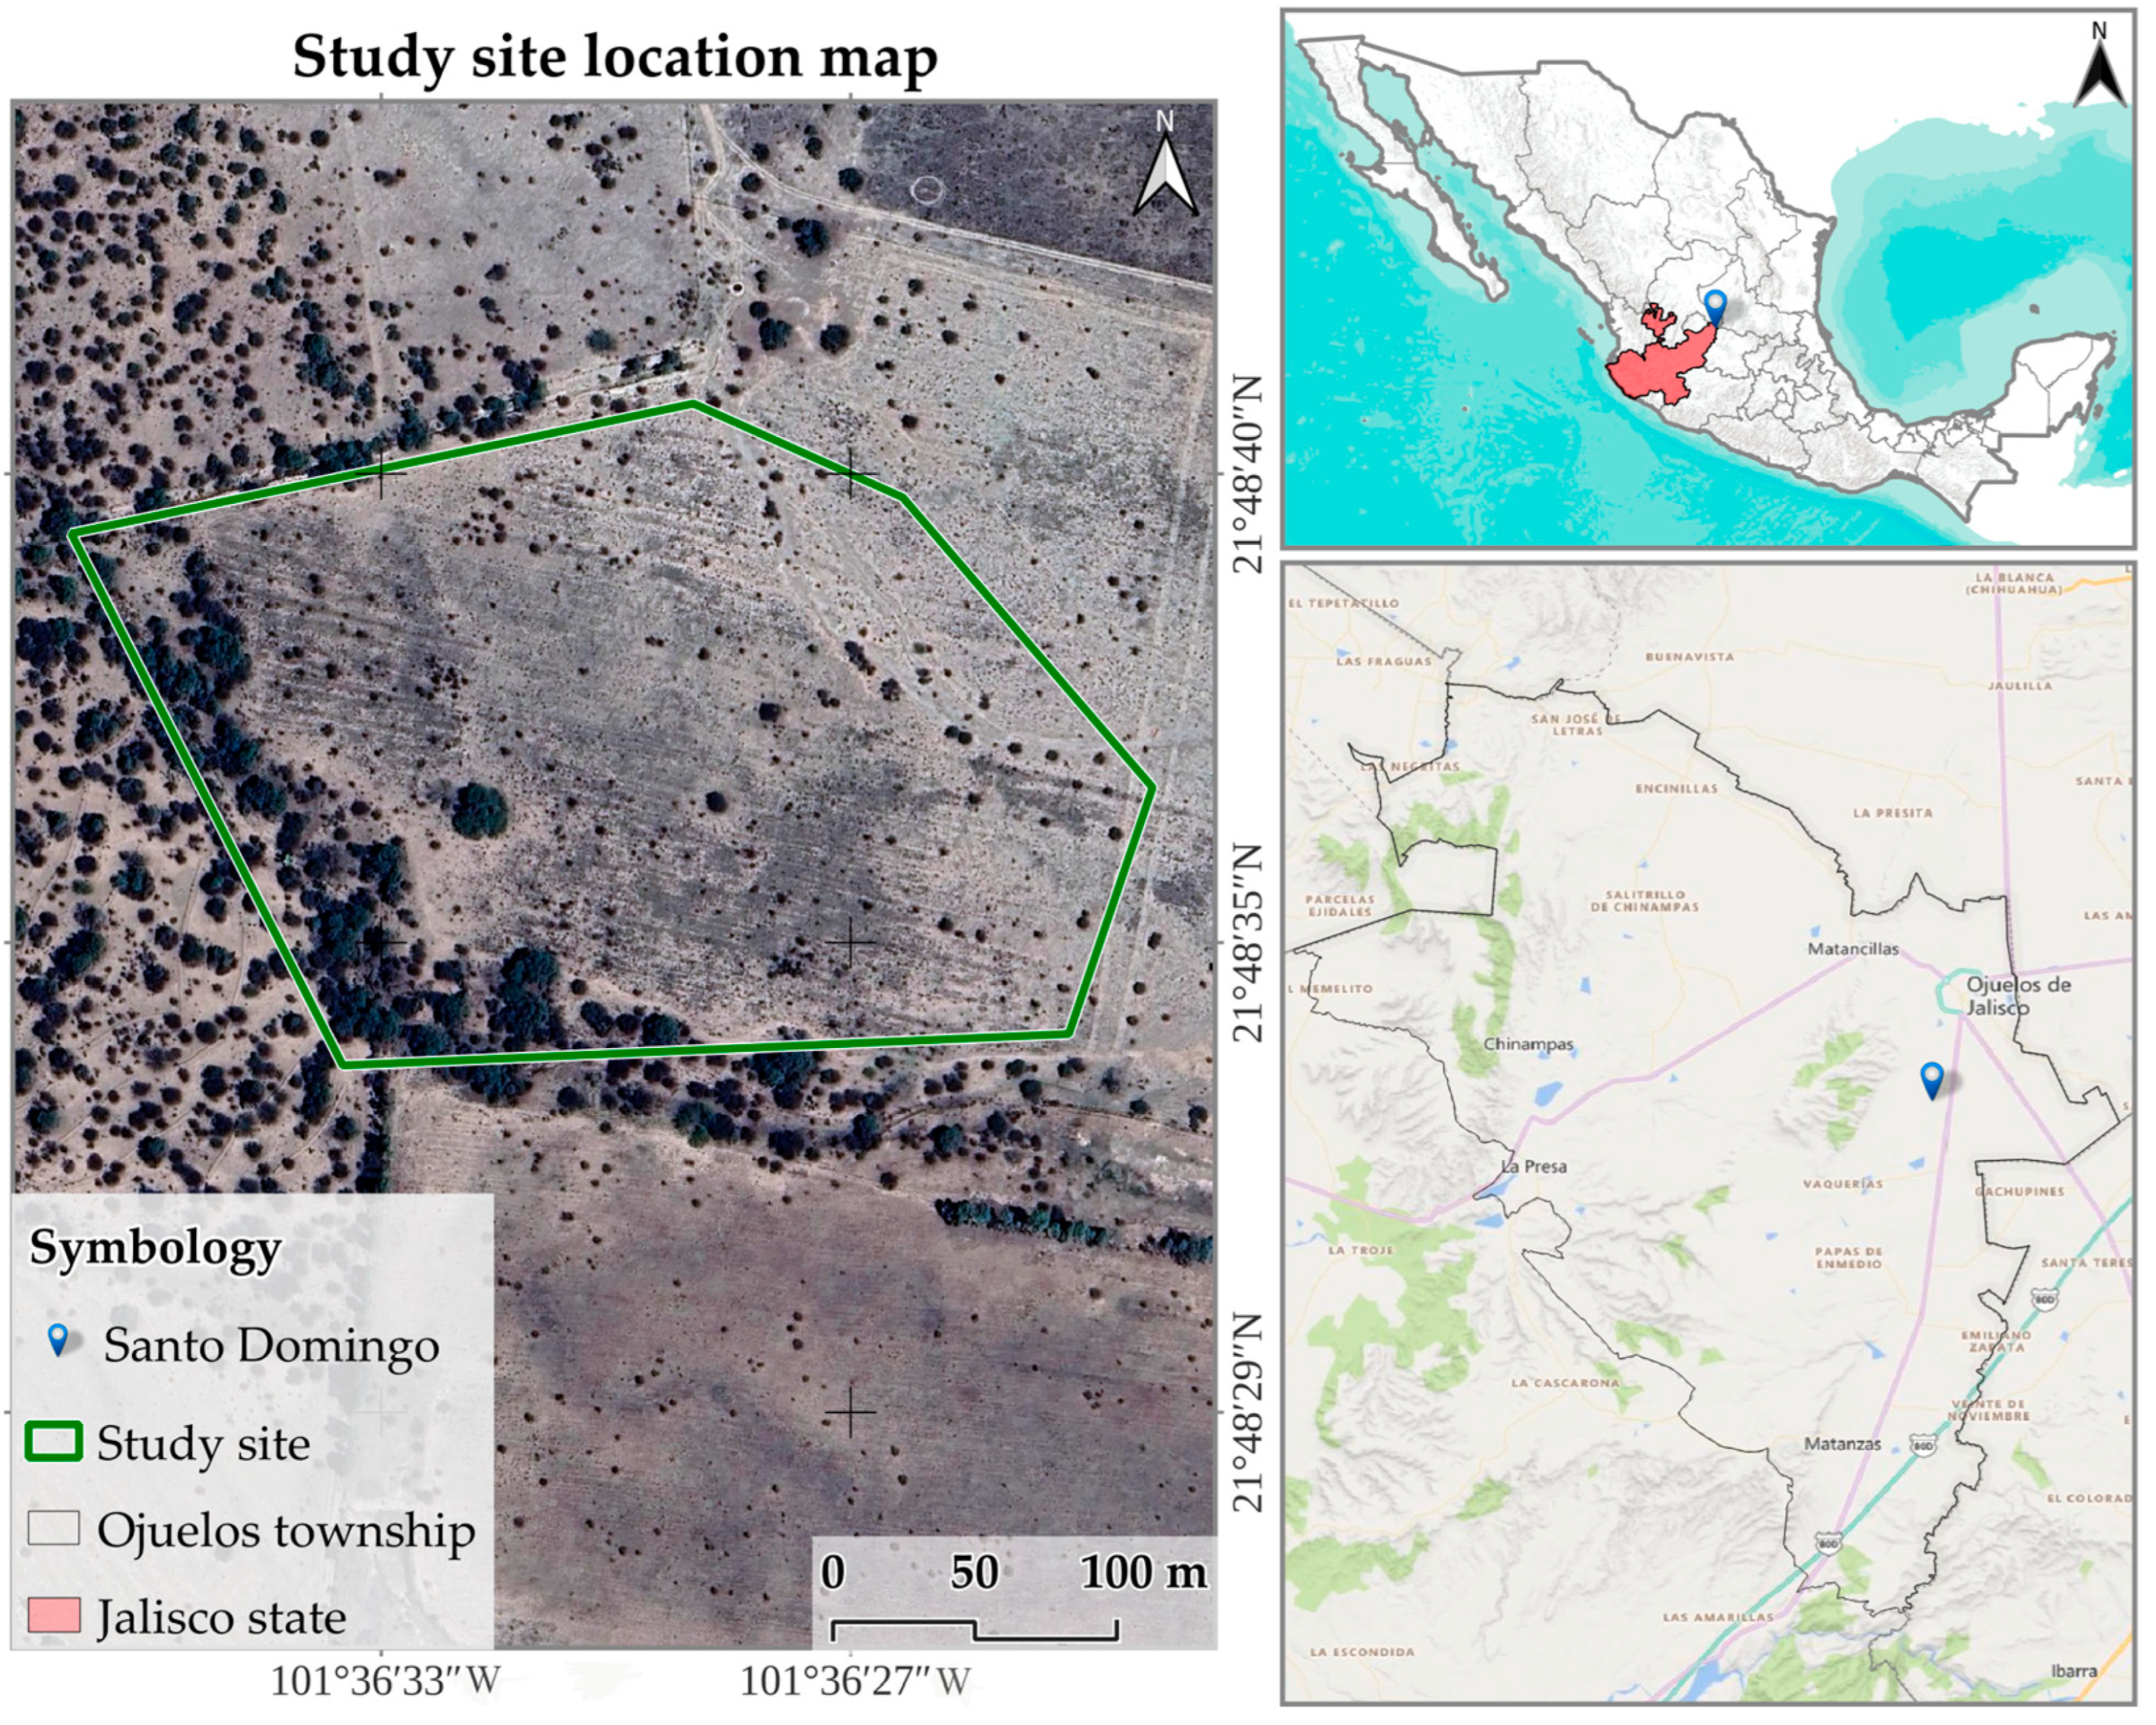
2.1. Study Site

This study was conducted from May to August 2020 at a site located on a semiarid grassland, in Santo Domingo ranch, a research station belonging to the National Livestock Organization. The site is located in the geographic subprovince Llanos de Ojuelos, Jalisco (21°46′52.25″ N and 101°36′29.56″ W) at 2240 m above sea level (Figure 1). The vegetation is a continental tropical semiarid grassland, located approximately 464 Km from the Pacific Ocean and 344 Km from the Gulf of Mexico. The site is a paddock of induced grassland, which was recovered from rainfed agriculture 35 years ago and was kept without grazing for the last 15 years. The dominant grass species is the weeping lovegrass (Eragrostis curvula) with some shrubs of different heights of Mimosa monancistra, Prosopis laevigata, and Acacia shaffneri. Grass basal cover varies between 5% and 40%, reaching 60 cm height and a canopy cover of 81.46% (i.e., including shrubs and other non-grass species) with a leaf area index (LAI) of 0.58 m2m−2 [27,28].
The region has a mean annual rainfall of 424 ± 11 mm, of which ~95% falls between June and September with a low fraction (~5%) during winter and exhibiting from 6 to 9 months period of low rain [29]. Potential evaporation exceeds precipitation by ~950 mm (aridity index = 0.31). The monthly average of potential evaporation is 687 mm, with the maximum levels observed in May (928 mm), and the minimum in November (471 mm). The mean annual temperature is 17.5 ± 0.5 °C, with mean extreme temperatures ranging from 26.8 °C for the warmest month to 2.6 °C for the coldest month. The topography consists of Valleys with gentle rolling hills and soils classified as Haplic xerosol and Haplic phaeozem, with textures dominated by silty clay, sandy loam textures. The soil is shallow, with an average depth of 0.3–0.4 m and cemented layer underneath. In this study, we measured several water-related physiological parameters on two common woody species in the semiarid grassland (P. laevigata and V. schaffneri) and one atmospheric epiphyte (T. recurvata) that occupies tree canopies of woody species in dry ecosystems.

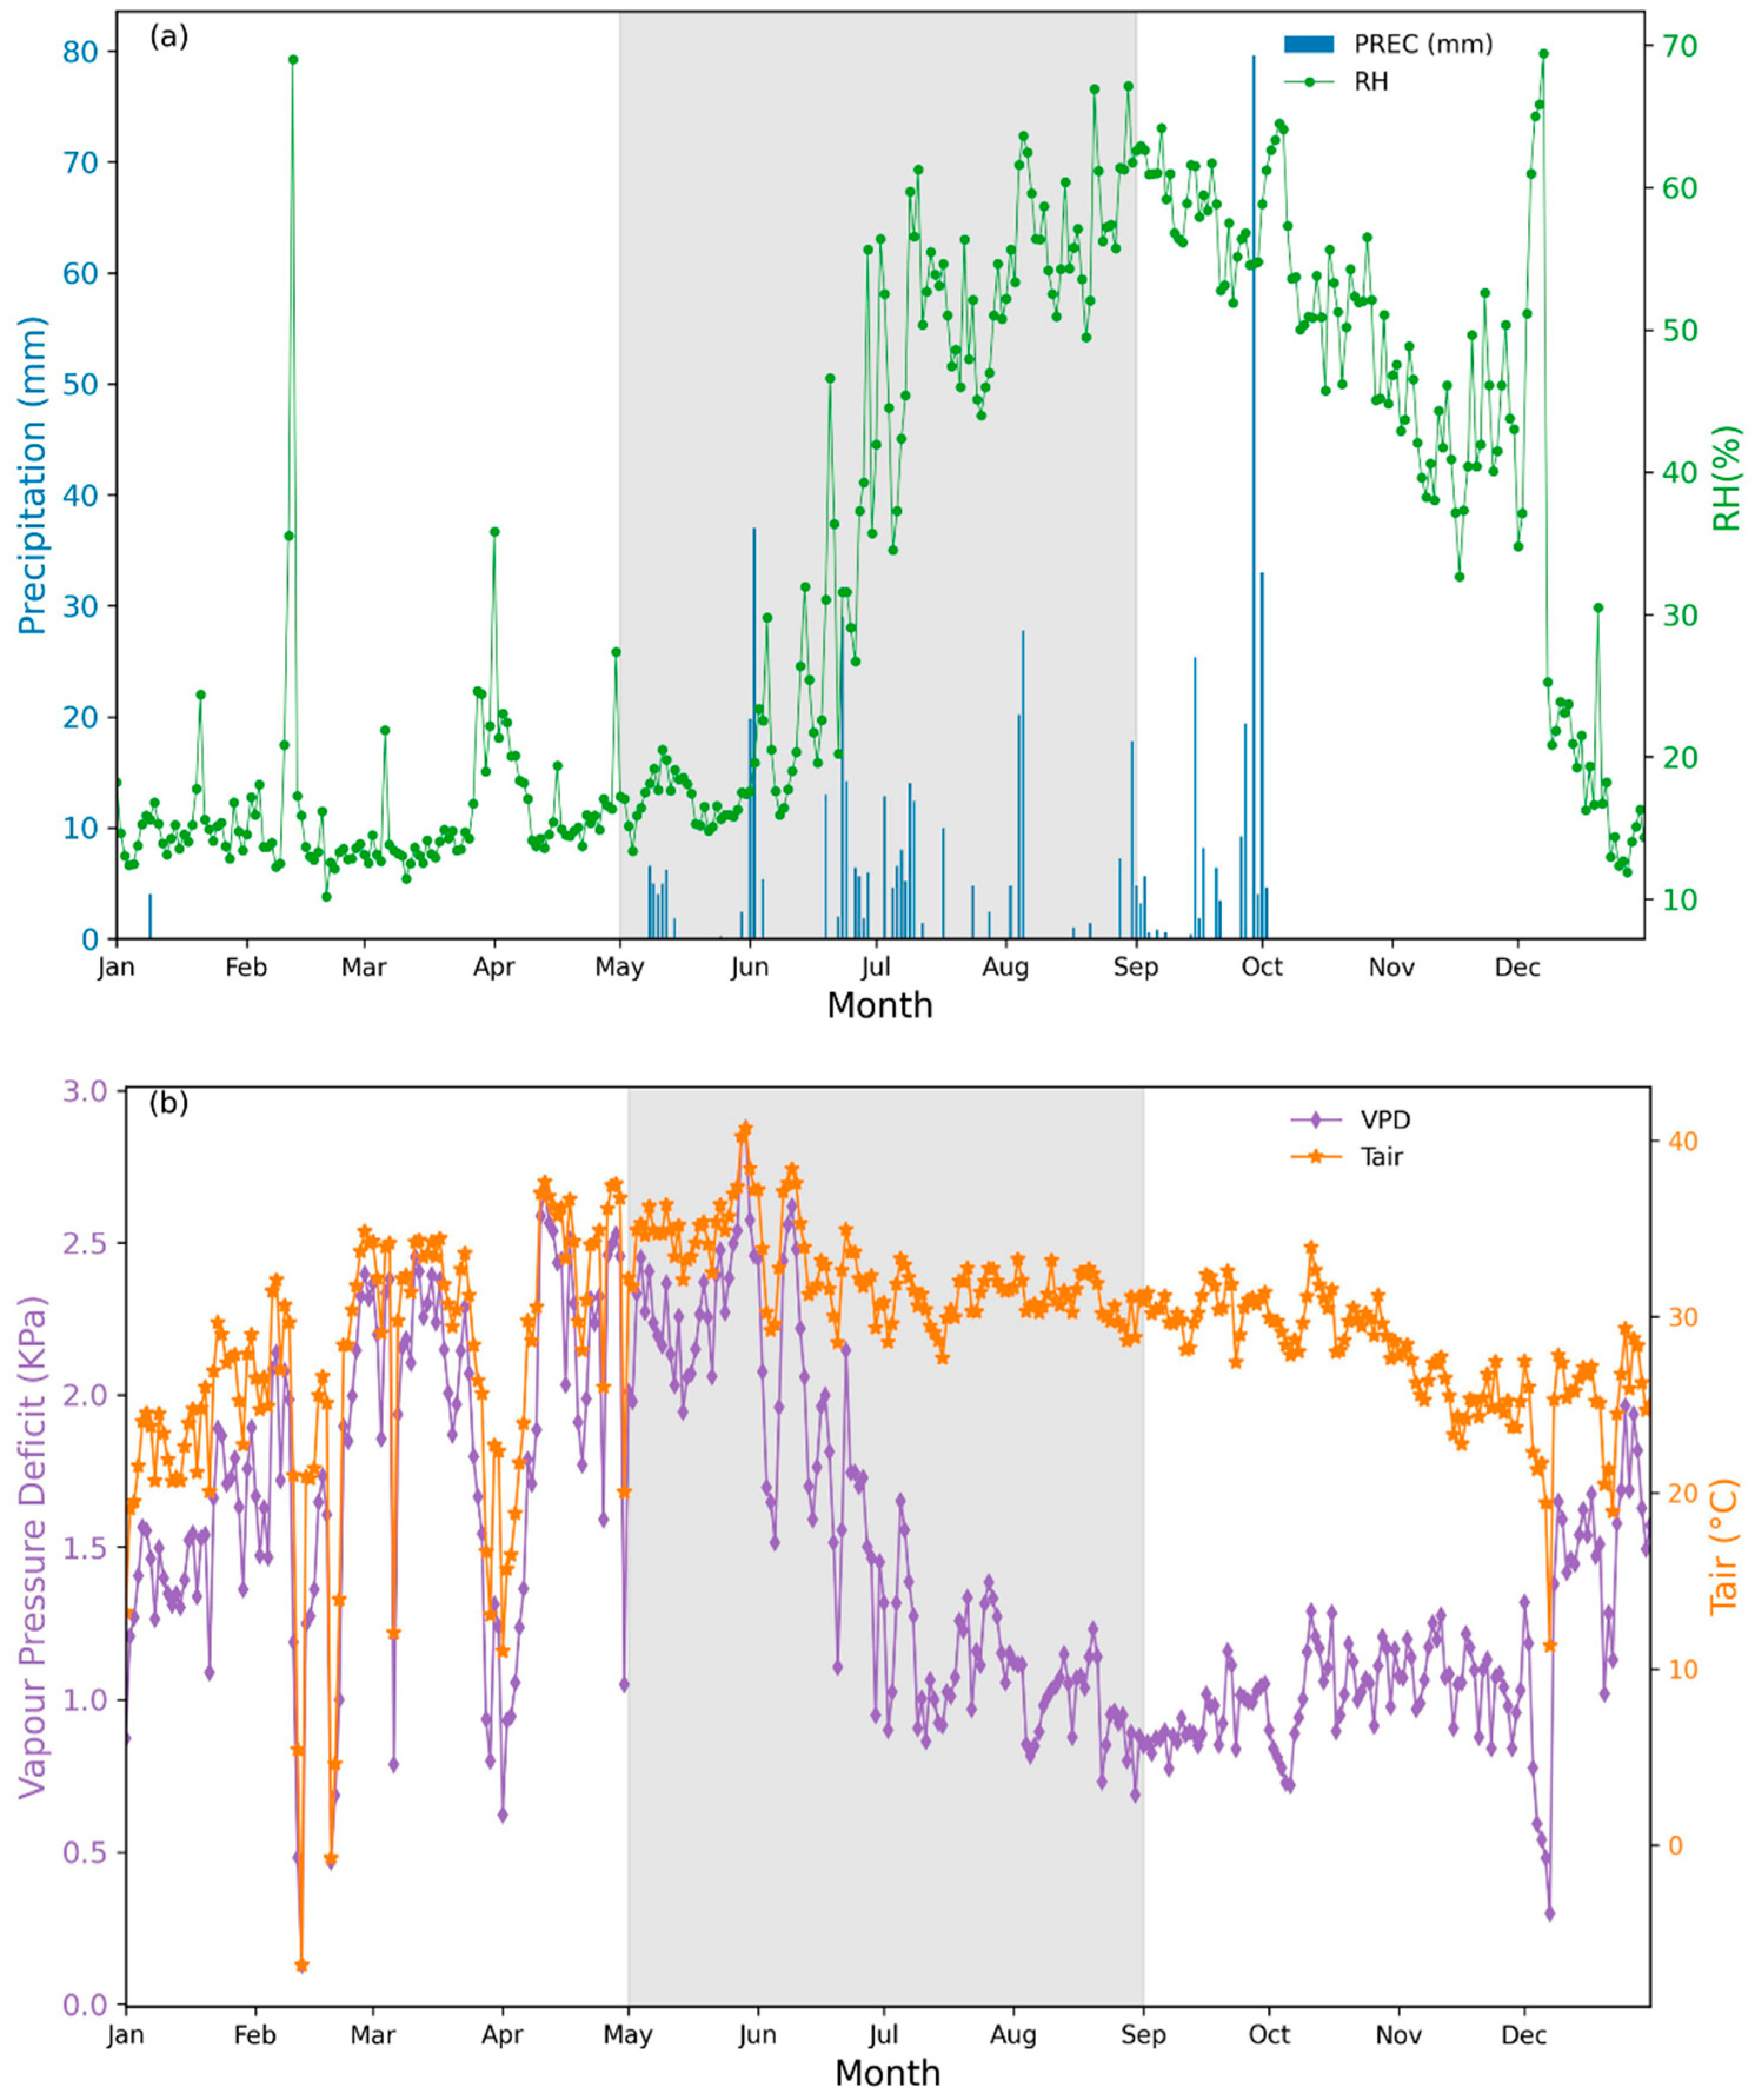
2.2. Precipitarion and Soil Measurements

Precipitation data were collected using rain gauges located near the study site, recording event precipitation throughout the sampling period. These data were obtained from rain gauges situated at various points within the Centro Nacional de Investigación Disciplinaria en Agricultura Familiar (CENID AF). Daily Soil moisture data were retrieved from the National Aeronautics and Space Administration’s POWER database (NASA, https://power.larc.nasa.gov/data-access-viewer/, accessed on 6 January 2025), produced by the NASA Langley Research Center POWER Project, funded through the NASA Earth Science Directorate Applied Science Program. We downloaded surface soil wetness, which represents the amount of water and water vapor in the upper 5 cm of soil, and root zone soil wetness, which reflects the water and vapor available to plants in the root zone (typically the upper 200 cm of soil). Both metrics are expressed as the proportion of water present in a given soil volume.
Meteorological data, including daily air temperature and vapor pressure, were obtained from the closest meteorological station available from the Red Nacional de Estaciones Agrometeorológicas Automatizadas (RNEAA), a component of the Laboratorio Nacional de Modelaje y Sensores Remotos (LNMYSR).

2.3. Plant Selection

For the plant selection, a preliminary survey was conducted on-site, and four V. schaffneri trees, three P. laevigata trees, and eight T. recurvata samples were randomly chosen. To distinguish them, each tree was labeled using aluminum foil. Subsequently, four samples were collected from each of the chosen trees. Selection criteria prioritized branches displaying vitality with straight stems measuring 3 to 5 cm in length to ensure proper handling of the specimens. In the case of epiphytic samples, their size was considered, leading to the selection of larger samples of approximately 8–10 cm in length.

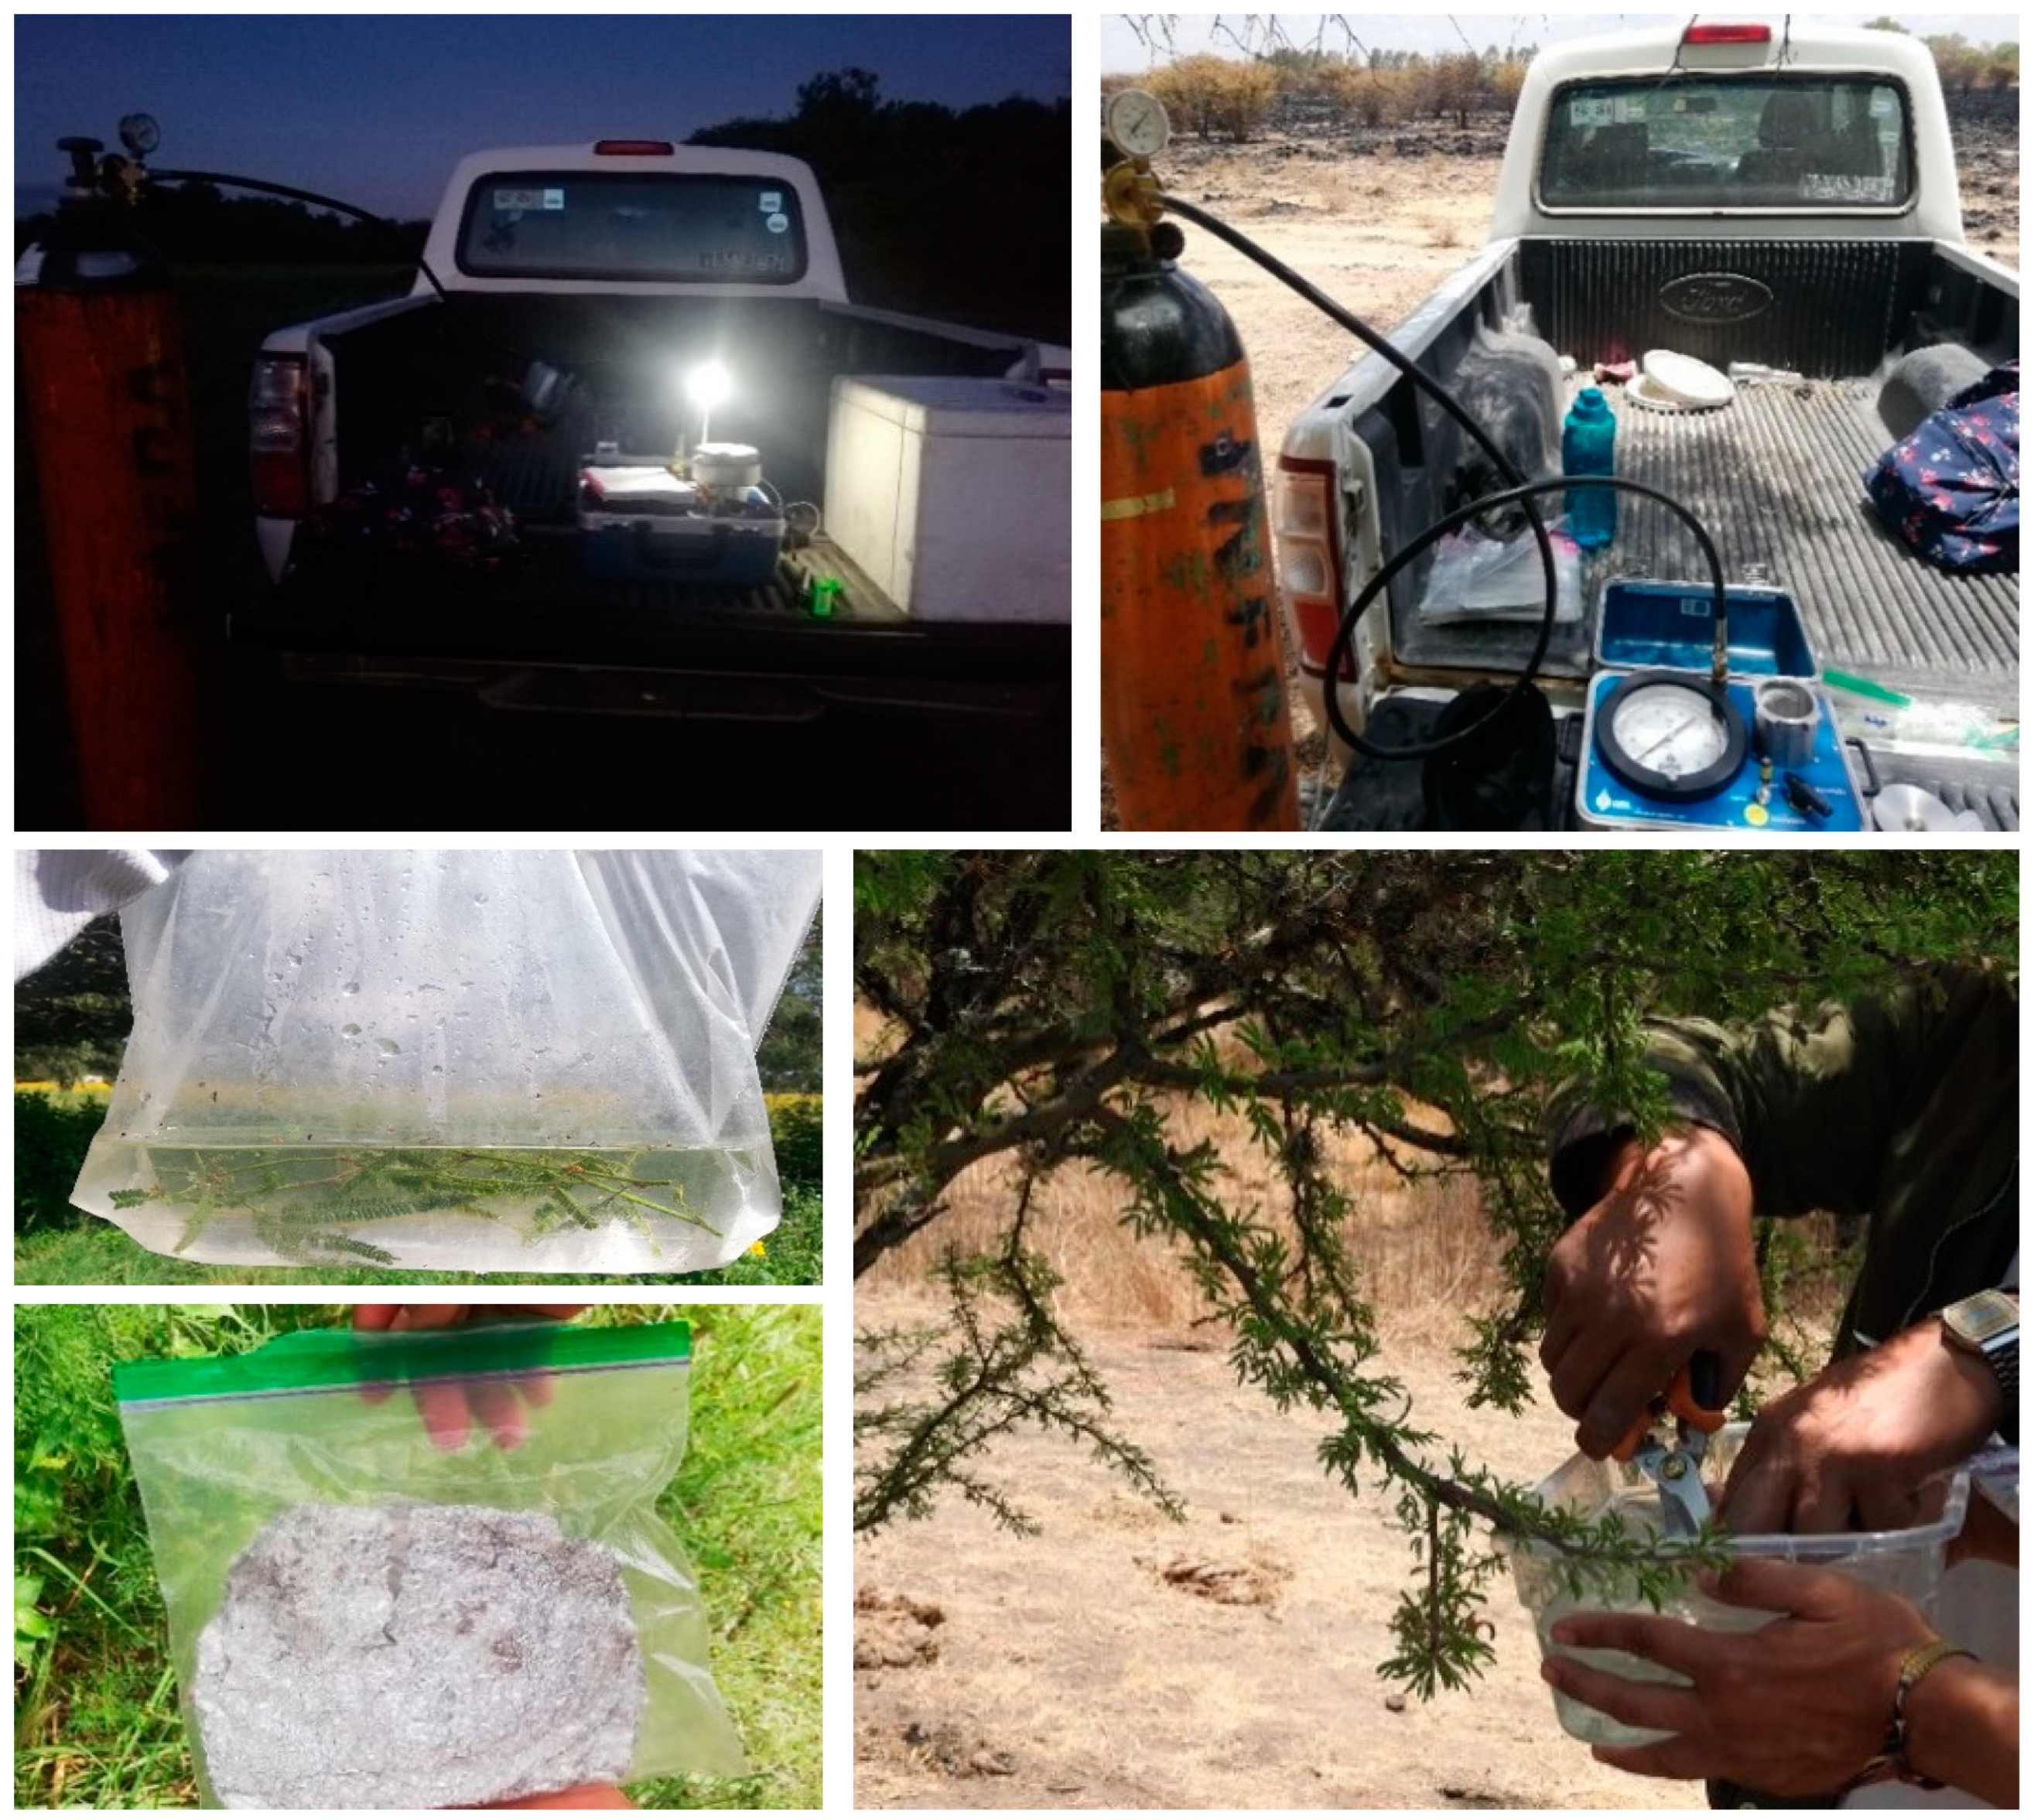
2.4. Plant Water Potential

Simultaneously, using the same leaves and twigs selected from the sample collection, the water potential was measured by employing the Scholander pressure chamber. (PSM Instrument Corp., Corvalis, OR, USA). Predawn water potential (Ψpd; 06:00 to 07:00) was measured, for at least four individuals per species before the sunrise. In addition to predawn water potentials, midday water potentials (Ψmd; 14:00 to 15:00) were measured (Figure 2). These measurements were carried out during each field visit throughout the study period, using the same leaves or twigs selected from the individuals.

2.5. Pressure–Volume Curves

Pressure–volume curves (P–V curves) were determined on eight leaves and twigs per species using the bench-dehydration method [30], during May and June, which is the end of the dry season. Samples were collected from the field, shoots were cut under water, sealed in Ziploc plastic bags with water, and placed inside a cooler for transporting back to the lab of Centro Nacional de Investigación Disciplinaria en Agricultura Familiar (CENID AF) (Figure 2). In the lab, the entire sample was rehydrated overnight. The next day, samples were weighed and measured for water potential using a Scholander-type pressure chamber and then dried on the bench. Weighing, measuring water potential, and drying samples were repeated until achieving −2 to −4 MPa, depending on the species. Leaves were scanned to calculate the leaf area using ImageJ (Bethesda, MD, USA; V.153j) and afterwards leaves were dried out for at least 48 h at 60 °C to obtain the leaf dry mass. Pressure–volume curve parameters were estimated from the curves for each species, including saturated water content (SWC; %), relative water content at turgor loss point (RWCTLP; %), osmotic potential (π0; MPa), water potential at turgor loss point (ΨTLP; MPa), bulk modulus of elasticity (ε; MPa), capacitance at full turgor (CFT; MPa−1), capacitance at turgor loss point (CTLP; MPa−1) and relative capacitance [30].

2.6. Live Fuel Moisture Content

Moisture content at turgor loss point was determined following the methodology of Scarff [31], which links the hydraulic traits and the fuel moisture content, to calculate how those parameters vary across species and how strongly that variation drives differences in fuel moisture content under typical fire weather when plants are wilting.
We used the two classical equations relating turgor pressure to water content to partition the effect of these traits on fuel moisture during fire weather (MCTLP). Equation (1) governs water content in leaves and fine distal shoots.
M C T L P = M C 100 1 + S P O M P a   × W s ε M P a
where MCTLP is the moisture content at turgor loss point (g H2O/g dry mass), MC100 saturated moisture content (g H2O/g dry mass), SP0 leaf cell solute potential (MPa), Ws leaf symplastic water fraction (%) and ε bulk modulus of elasticity.
Equation (2) governs water content in twigs.
M C T L P = M C 100 1 + Ψ T L P M P a C F T M P a 1  
where ΨTLP is the water potential at turgor loss point (MPa); CFT capacitance at full turgor (MPa−1).

2.7. Data Analysis

All statistical tests were performed in Rstudio v.2023.06.2 [32]. Data were checked for normality and homogeneity of variance through visual inspection of diagnostic plots and Levene’s test. Variation in P–V curve traits (saturated water content, relative water content at turgor loss point, bulk modulus of elasticity, capacitance at full turgor, capacitance at turgor loss point, and relative capacitance) among species was assembled using a mixed-model ANOVA to appropriately handle repeated measurements within individual trees and no independence in leaf and twigs water potential measurements. Where ANOVAs were significant, differences among species were tested for using Tukey’s HSD post hoc test, which provides balance between statistical power and conservativeness. Correlation analysis between environmental variables and leaf water potentials were performed with Pearson’s correlation procedure. All results given in the text are the mean values ± SE, or the mean values and upper and lower confidence limits at 95%.

3. Results

3.1. Environmental Variables and Leaf Water Potentials

The highest temperatures were observed in May and remained relatively constant throughout the experimental period (Figure 3a). However, larger differences were observed in the vapor pressure deficit (VPD), with maximum values of 2.5 kPa occurring in May and early June, and the lowest values occurring in August and September (VPD~1.0). Soil temperature varied largely through time and depth. The soil moisture content at 0–10 cm and 10–20 cm depths showed greater variation, as these layers are more directly influenced by surface climate conditions. Consequently, light rainfall events were reflected in an increase in soil moisture percentages at these upper layers (Figure S1). During the dry season (May), the average soil moisture content was recorded as less than 11%. Notably, in the first (13 May 2021) and fourth (17 June 2021) weeks of sampling, significant reductions in soil moisture were observed, with the lowest values recorded during the study period (7.8 ± 2.44% and 8.34 ± 0.76%, respectively). In contrast, during the rainy season, the average monthly soil moisture content increased to approximately 17%. This period coincided with three major rainfall events, and the third, fifth, and sixth weeks of sampling showed the highest soil moisture percentages (Figure S1).
There was a large variation in rainfall events during the period of measurements, with a low rainfall at the end of dry period (may; 1.6–6 mm) and high events of rainfall during wet period (34.2–39.4 mm; Figure 4a). The accumulated daily precipitation for the study period was 129.4 mm. June received 53.6 mm, the wettest month, representing 42% of the total precipitation during our study.

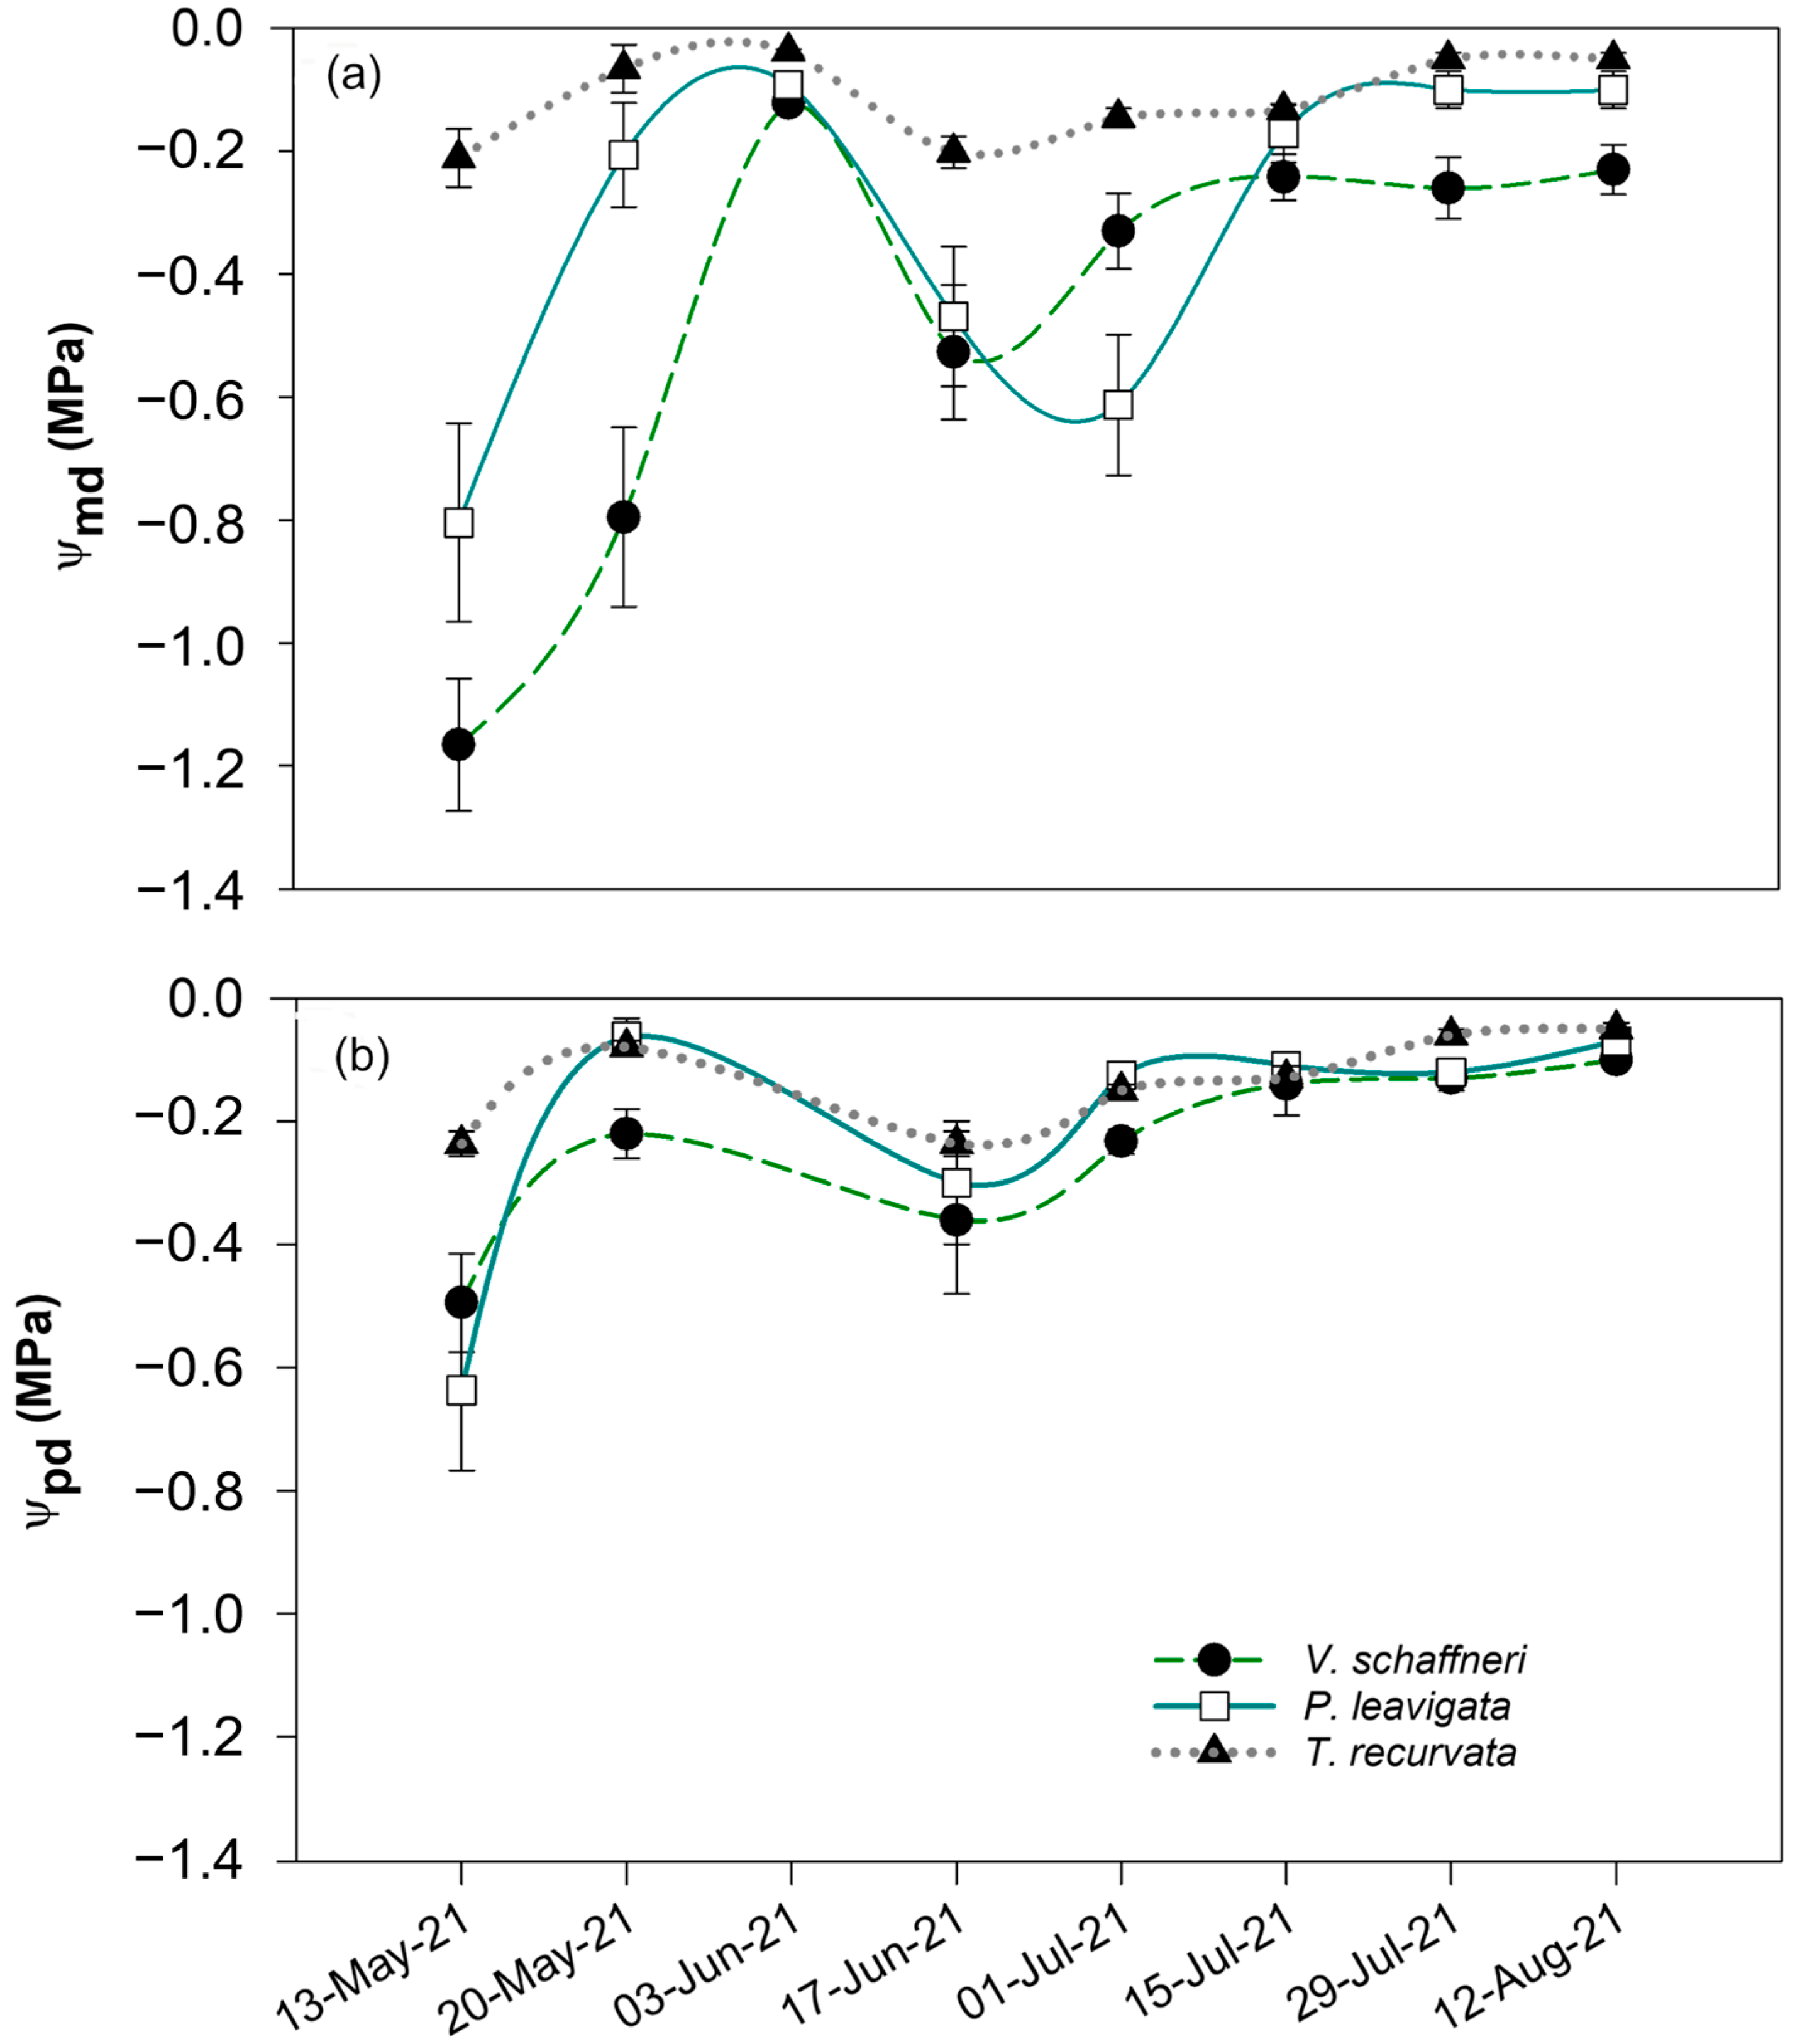
3.2. Leaf Water Potentials

The most negative Ψleaf was observed during the warmer dry month where rainfall was minimum except for T. recurvata (Figure 4a). The lowest variation in Ψleaf was observed in T. recurvata, where Ψleaf ranged from −0.2 to −0.05 Mpa, in contrast Ψleaf in V. schaffneri ranged from −0.2 to −1.2 MPa. The predawn water potential was lower at the end of the dry period in association with reduction in soil moisture and the lowest precipitation (Figure 4b), but it remained relatively constant for the rest of the study period.

3.3. Relationship Between Leaf Water Potentials and Environmental Variables

In the analysis of the correlation matrix analysis of predawn (Ψpd) and midday (Ψmd) leaf water potentials with environmental variables revealed distinct response patterns among the three species (Figure 5). Vachellia schaffneri showed a significant negative correlation between predawn water potential and vapor pressure deficit (VPD; r = −0.80, p < 0.05), along with a positive correlation with relative humidity (RH; r = 0.79, p < 0.05). During midday, V. schaffneri also exhibited a negative correlation with VPD (r = −0.80, p < 0.05) and air temperature (r = −0.86, p < 0.05), while showing a positive correlation with soil moisture at 30 cm depth (r = 0.72, p < 0.05), suggesting a strong dependence on deeper soil water reserves.
Prosopis laevigata, on the other hand, did not exhibit correlations between predawn water potential nor midday water potential and the variables VPD, RH, Tair, and soil moisture. Similarly, both predawn and midday water potential of T. recurvata did not show correlations with environmental and soil moisture variables. This suggests that these environmental variables do not have a clear impact on the water potential of this species.

3.4. Pressure–Volume Curves

There were significant differences among species in the P–V curve parameters such as SWC, π0, ΨTLP, RWC, and CTLP (p < 0.05). Across all sampling dates, the species with the lowest π0 was V. schaffneri (−0.59 ± 0.06 MPa), while the species with the highest π0 were P. leavigata (−0.32 ± 0.04 MPa) and T. recurvata (−0.33 ± 0.05 MPa; Figure 6a). Similarly, the species with the highest values of ΨTLP were P. leavigata (−0.6 ± 0.4 MPa) and T. recurvata (−0.66 ± 0.06 MPa). The lowest ΨTLP was observed in V. schaffneri (−1.31 ± 0.08 MPa; Figure 6b). Highest values of RWC were measured in P. leavigata (90.5 ± 1.27%), followed by T. recurvata (84.72 ± 1.88%), while V. schaffneri was the species with the lowest values (79.37 ± 1.3%).
There were no significant differences in ε among species at any sampling time. The largest ε was observed in P. leavigata (3.27 ± 0.67 MPa), intermediate values in V. schaffneri (2.72 ± 0.56 MPa), and lowest in T. recurvata (2.04 ± 0.61 MPa), indicating cell walls with moderate elasticity (Figure 6c). In correspondence, the capacitance at full turgor (CTLP) for V. schaffneri ranged between 0.08 and 0.4 MPa, the highest values occurred in P. leavigata (0.14–0.65 MPa) with its more elastic leaves and T. recurvata showed relatively high values (0.23–0.38 MPa) with its much more elastic leaves (Figure 6d).

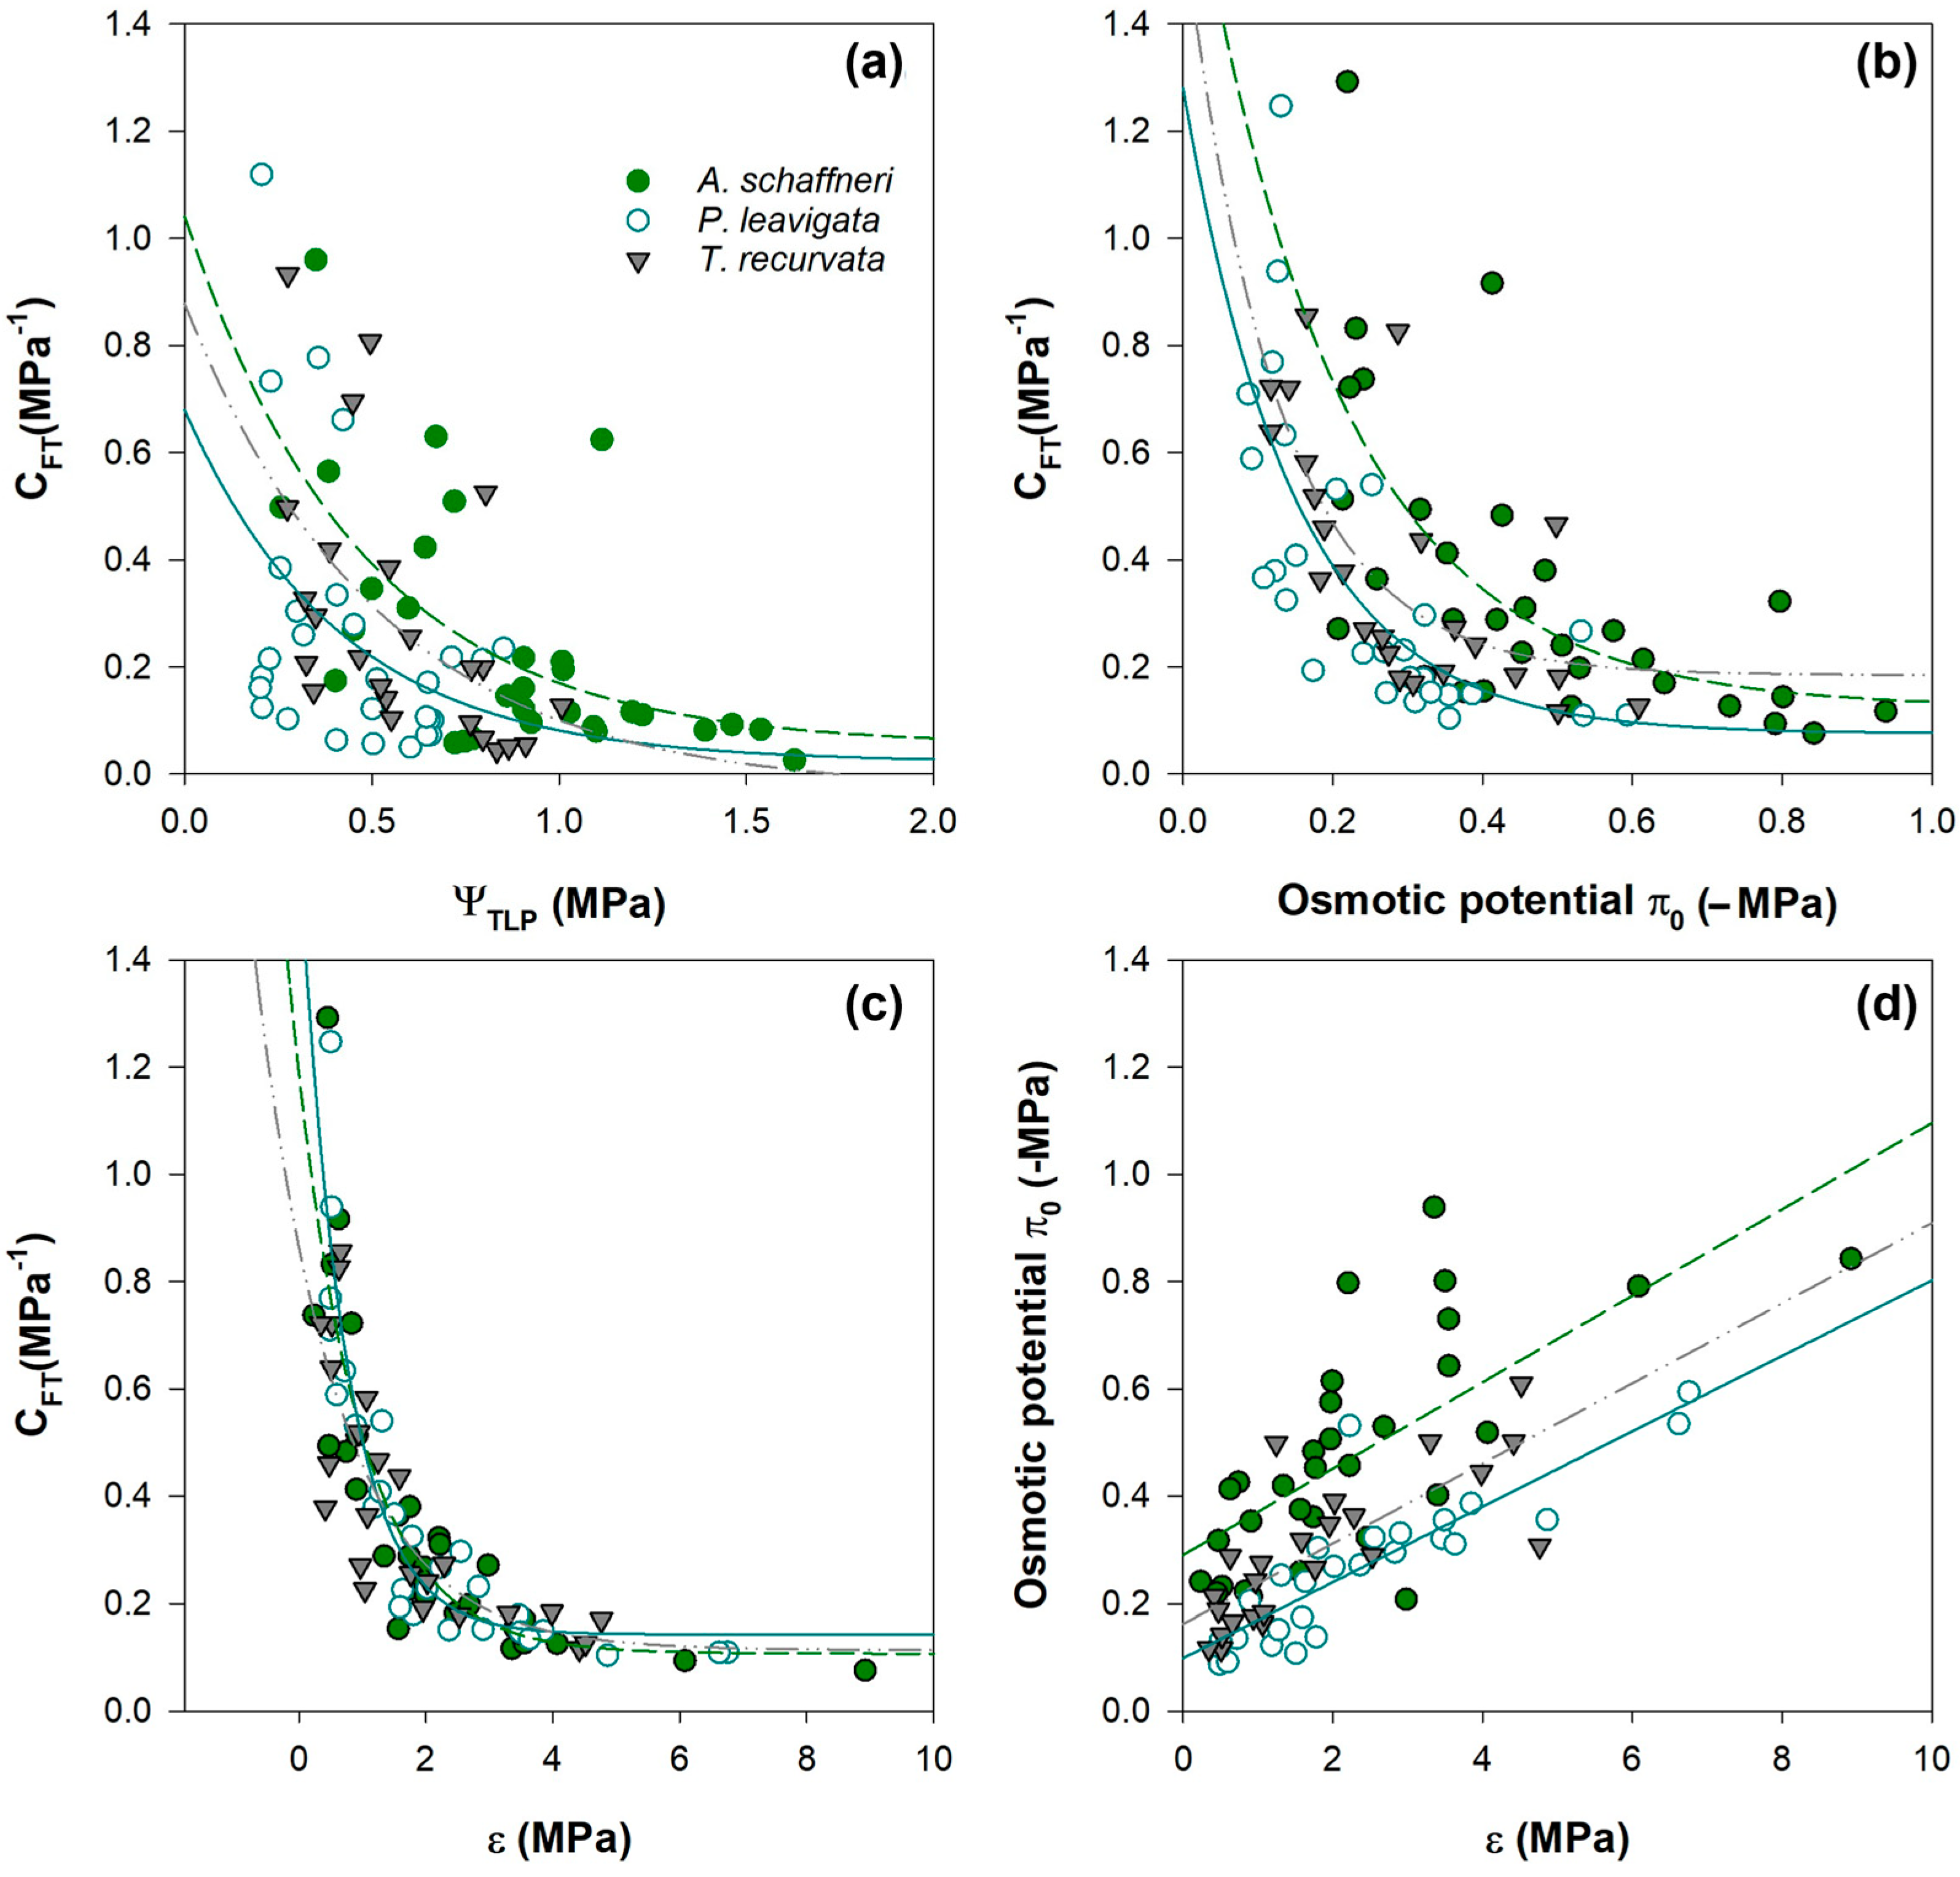
3.5. Correlation P–V Parameters

The relationships between pressure–volume (P–V) curve parameters and capacitance at full turgor (CFT) predominantly followed a nonlinear pattern. Data were best described using an exponential decay equation (f = y0 + a*exp(−b**x)), as shown in Figure 7a–c. However, the relationship between osmotic potential at full turgor (π0) and bulk modulus of elasticity (ε) followed a linear trend (Figure 7d). The correlation between CFT and turgor loss point (ΨTLP) for V. schaffneri, P. laevigata, and T. recurvata was not statistically significant (p > 0.01; Figure 7a). Instead, CFT showed a strong association with π0, where a reduction in π0 corresponded to a rapid decrease in CFT (Figure 7b). Osmotic potential (π0) accounted for 40%–49% of the variation in CFT among the studied species, suggesting a moderate influence of osmotic adjustment on water storage capacity.
A highly significant negative correlation was observed between CFT and ε (p < 0.001; Figure 7c), where species with greater leaf elasticity exhibited higher CFT. The variation in ε explained up to 85% of the changes in CFT for P. laevigata, whereas this relationship weakened slightly in T. recurvata (65% explained variance). Furthermore, a strong negative correlation was detected between π0 and ε (p < 0.001; Figure 7d), indicating that osmotic and elastic adjustments in leaf water relations were closely coordinated. Species with more rigid cell walls (higher ε) tended to exhibit more negative π0 values, as observed in P. laevigata and T. recurvata. This suggests that species with stiffer cell walls may rely more on osmotic adjustments to maintain turgor under drought stress conditions.

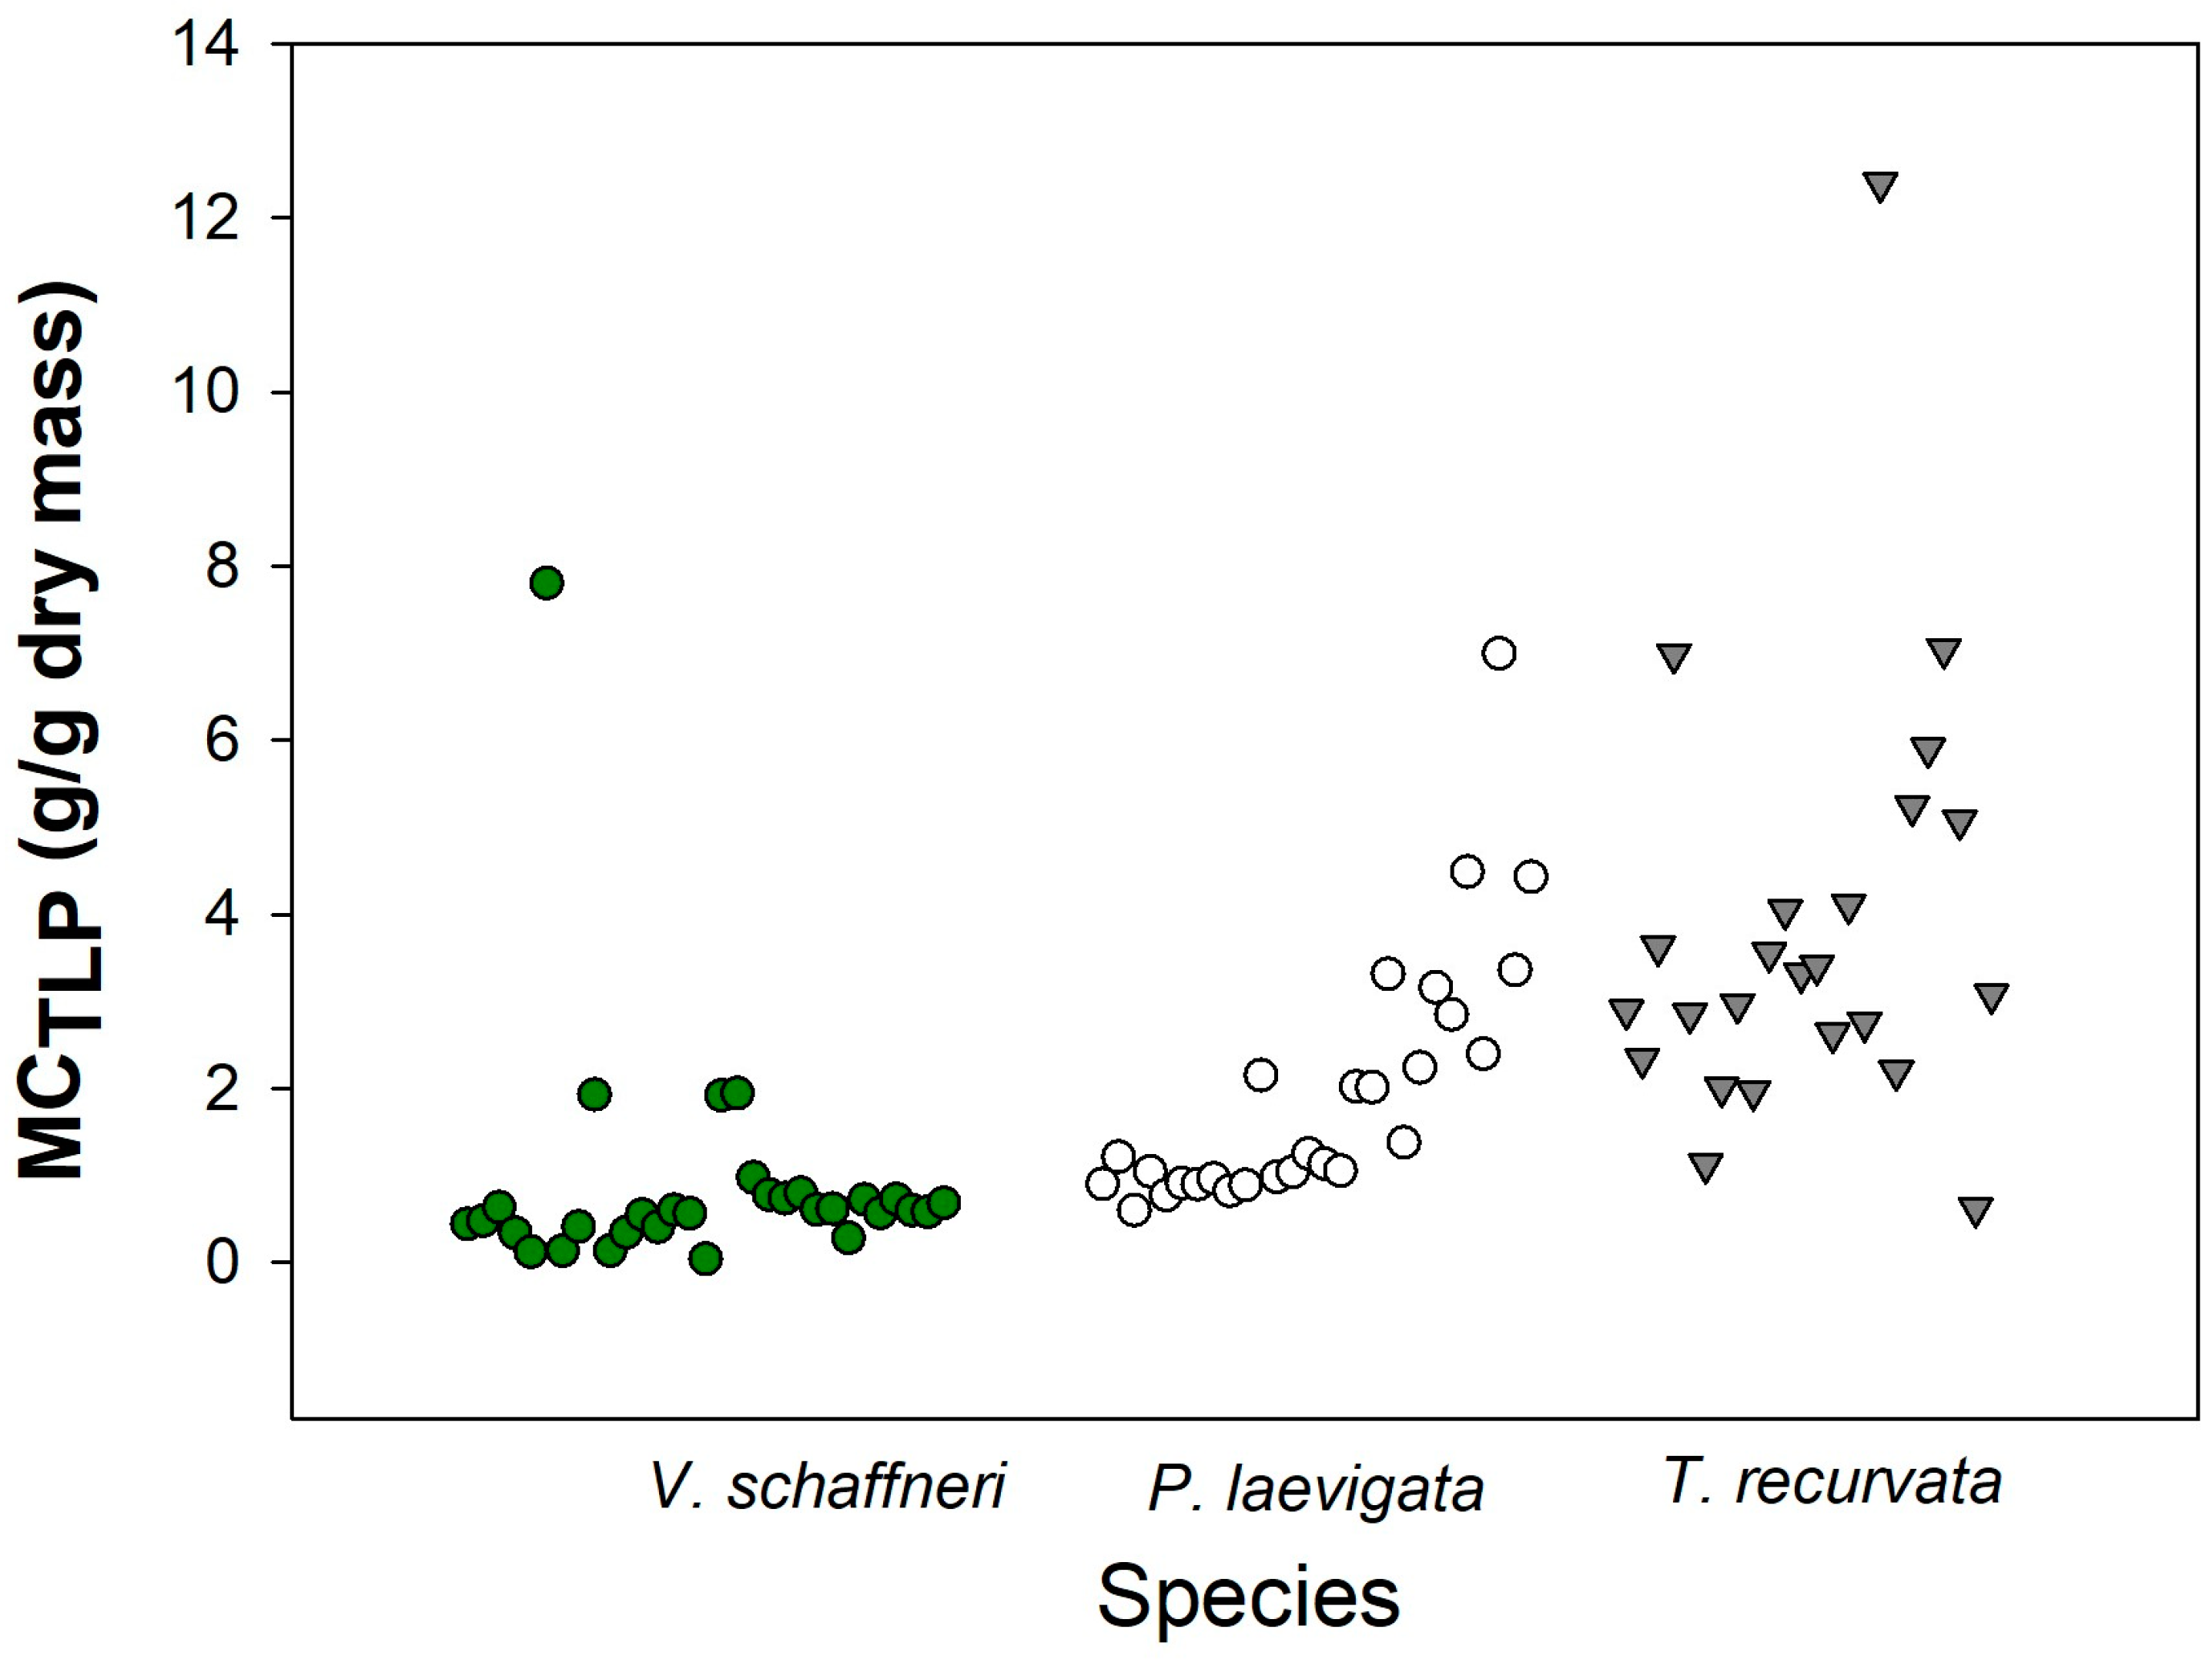
3.6. Fuel Moisture Content

The estimated moisture content at the point of turgor loss (MCTLP) varied significantly among species. T. recurvata exhibited the highest MCTLP values, reaching a maximum of 5.19 ± 1.27 g/g, with an average of 3.84 ± 0.71 g/g (Table 1). P. laevigata followed a similar pattern, with a peak MCTLP of 3.738 ± 0.551 g/g and an average of 1.99 ± 0.29 g/g. In contrast, V. schaffneri had the lowest MCTLP values, with a maximum of 1.29 ± 0.93 g/g and an average ranging from 0.89 ± 0.35 g/g. Notably, T. recurvata and P. laevigata maintained significantly higher MCTLP values, approaching 7 g/g in some instances (Figure 8). Meanwhile, V. schaffneri consistently exhibited lower fuel moisture content, with values remaining below 2 g/g.
These differences suggest that T. recurvata and P. laevigata possess greater water retention capacity, which could influence their flammability under drought conditions. In contrast, the lower MCTLP observed in V. schaffneri indicates a higher susceptibility to desiccation and potential fire ignition.

4. Discussion

4.1. Seasonal Patterns in Leaf Water Potentials

In semiarid ecosystems, soil water availability is a key determinant of plant functioning. The small precipitation event observed at the beginning of the sampling period led to an increase in water potential across all species, while variations in Ψpd and Ψmd during this study reflect the seasonal increase in soil water availability following rainfall. This suggests that species capable of maintaining their biological functions despite very negative Ψmd values or responding to small precipitation events possess specific adaptations for efficient rehydration or transpiration minimization, thereby conserving soil water [33]. Larger and more frequent precipitation events (>30 mm) increased and stabilized water potential, particularly at predawn (Figure 4a,b), which aligns with previous findings on the role of soil moisture in modulating plant water status [34,35]. The midday water potential (Ψmd) exhibited significant fluctuations due to increased exposure of leaves to solar radiation, high air temperature, and low relative humidity, leading to dehydration and water loss [35,36]. In contrast, at night, when transpiration ceases, water redistribution within the plant restores the gradient, resulting in higher Ψpd values by dawn.
Our findings for Tillandsia recurvata, which maintained water potential values closer to zero (−0.23 MPa), are consistent with reports indicating that this species is primarily influenced by air humidity conditions rather than soil moisture, adjusting gas exchange dynamics accordingly [36]. Similar physiological responses have been reported in other epiphytes, such as Tillandsia ionantha, which exhibited Ψmd values around −0.40 MPa [37]. This supports the well-established ability of epiphytes to absorb atmospheric water, reinforcing their drought-resistant traits. In contrast, Vachellia schaffneri exhibited more pronounced variations in Ψmd, indicating strong dependence on soil water availability. The more negative Ψmd values observed during the dry season suggest potential constraints on root access to deeper moisture sources. The range of Ψmd values obtained (−1.16 ± 0.11 MPa) is within reported values for other Fabaceae species, such as Acacia berlandieri, which reaches −2.79 MPa during the dry season [38]. Additionally, the significant correlation between Ψ and vapor pressure deficit (VPD) suggests that as atmospheric dryness increases, water loss intensifies, exacerbating plant water stress. This pattern agrees with previous research demonstrating the influence of VPD on plant transpiration and water potential in semiarid environments [39]. The capacity of V. schaffneri to adjust its resource allocation strategy, prioritizing root development under water-limited conditions, has been previously reported in drought-adapted species [40,41].
Similarly, Prosopis laevigata exhibited pronounced variations in Ψmd, though its values were less negative than those of V. schaffneri. The Ψmd values recorded (−0.8 ± 0.16 MPa) were higher than those observed in Prosopis argentina and Prosopis alpataco (−2.5 MPa), which inhabit regions with annual precipitation as low as 80–200 mm [42]. This suggests that P. laevigata can tolerate water deficits while maintaining leaf water potential, a trait previously linked to its capacity for deep-water uptake and long root system development. Unlike V. schaffneri, P. laevigata showed no strong correlation between leaf water potential and environmental variables, indicating decoupling from atmospheric humidity and temperature (Figure 5). This is consistent with previous reports suggesting that mesquites rely more on deep soil moisture and exhibit anisohydric behavior, maintaining transpiration even under declining water availability [43]. The higher water storage capacity of P. laevigata has been well documented, supporting its ability to persist in extreme environments.
Predawn water potentials of P. laevigata were relatively stable compared to midday values (Figure 4b). Given its reliance on deep water reserves, it was expected that Ψpd and Ψmd would remain less variable over time than in V. schaffneri. Additionally, the higher midday Ψ variability observed in P. laevigata may be attributed to lower stomatal control, a characteristic of anisohydric species, in contrast to V. schaffneri and T. recurvata, which exhibit more efficient stomatal regulation to minimize water loss under dry conditions [43]. This corresponds with the greater water storage capacity of P. laevigata, which ensures water availability even under stressful conditions.

4.2. Hydraulic Traits

Some pressure–volume curve traits showed large variation, which is likely due to multiple factors. For instance, genetic variability and phenotypic plasticity among individuals can influence water storage capacity in plants [44]. Some plants may possess adaptations for specific stressful conditions or exhibit a greater ability to store water [45]. Additionally, branch moisture content can vary with tissue age, as older tissues tend to dehydrate more rapidly and may have a lower water storage capacity than younger tissues [46]. While we attempted to select individuals with similar characteristics, inherent variations in these traits may be unavoidable.
Significant differences in hydraulic traits were observed among species. The largest contrast was in ΨTLP, with values ranging from −1.31 MPa in V. schaffneri to −0.35 MPa in P. laevigata. These differences closely followed variations in πo, with V. schaffneri exhibiting the most negative πo values, suggesting greater water stress sensitivity. According to the literature, decreases in ΨTLP are associated with decreases in πo, which generate a significant improvement in water absorption in the soil under stress conditions [7,14]. This adjustment represents an alternative strategy to water deficit conditions. The results obtained for both parameters in V. schaffneri are comparable to those reported in Acacia xanthophloea and Acacia tortilis [47]; however, these decreases do not limit the growth of the species since they continue to grow with lower foliar water potential. On the other hand, it is also known that the osmotic potential of the cell can decrease due to the accumulation of compatible osmolytes in the cytoplasm (proline and betaine), which prevent the decrease in water potential without interfering with cellular functioning, acting as osmotic agents to protect the plant from dehydration [48]. This behavior has been reported for P. laevigata, which could explain why ΨTLP and πo only decreased slightly. This also suggests that species can show alternative strategies to maintain turgor and avoid plant desiccation.
Significant differences in RWCTLP were found in V. schaffneri (79.37%), indicating that drought conditions had a greater impact on the huisache’s cellular water content. This may be due to its low ability to retain and absorb water molecules. This suggests that plants can reduce the solute potential of the symplast by pumping water from the symplast to the apoplast, thereby reducing RWC [7]. This is also reflected in the negative values obtained for this species in πo. In the case of P. laevigata and T. recurvata, the RWCTLP decreased to a lesser extent (90.55%, 84.72%, respectively), suggesting stronger water retention mechanisms. In the case of mesquite, for example, hydrated cells are maintained by reducing the cellular water potential through the synthesis of compatible solutes (e.g., proline, glycine betaine, and soluble sugars), which is consistent with the mechanisms reported in existing literature for this species [49]. These differences may be linked to leaf anatomical traits such as stomatal density and cuticular properties, which influence transpiration rates and water loss.
Despite variations in other hydraulic traits, no significant differences in cell wall elasticity (ε) were found among species. This suggests that elastic adjustment may not be a primary drought response mechanism in these species. However, previous studies indicate that CAM plants, such as T. recurvata, often exhibit highly elastic cell walls (ε ≈ 2.04 MPa) to maintain turgor during dehydration, consistent with our findings [50,51]. Similar low ε values have been reported in other epiphytes, supporting their capacity to withstand extended drought periods [37]. Conversely, P. laevigata and V. schaffneri exhibited higher ε values (3.27 MPa and 2.72 MPa, respectively), indicating stiffer cell walls. While some studies suggest that increased ε enhances drought tolerance by maintaining turgor, others argue that its role is ambiguous, as both increases and decreases in ε have been associated with drought adaptation [7,52]. Our findings suggest that in woody species, ε may serve more as a threshold mechanism to prevent excessive dehydration rather than as a direct driver of drought resistance [14].
Capacitance (CFT) differed significantly among species, with P. laevigata exhibiting the highest water storage capacity. According to literature, the Prosopis genus prioritizes its reproductive functions, but during non-flowering and non-fruiting periods, the plant stores water reserves in its trunks and roots, providing structural support and ensuring an efficient root system that can penetrate depths of up to 50 m. This adaptation confers an advantage for the plant to thrive in extreme environmental conditions [53]. T. recurvata ranked second in CFT performance. Thanks to CAM metabolism and specialized non-collenchymatous succulent tissues for water storage, this species can rely on stored water to survive extended drought periods [54]. Studies have reported that this mechanism can sustain the plant for up to six months without water [55].
The lowest CFT was recorded in V. schaffneri, which may indicate that the water transport pathways also function as water storage compartments. However, they do not have a high capacity to store water and therefore cannot buffer the fluctuations induced by water stress [56]. Some authors suggest that certain species can maintain high stomatal conductance under hydraulic stress conditions, subjecting themselves to low water potential and high losses of hydraulic conductance, but still maintaining gas exchange at relatively high rates. This enables the species to invest in hydraulic safety by constructing a xylem that is resistant to hydraulic failure through a more resistant conducting tissue that is less capable of water transport [33,57].

4.3. Moisture Content

We expected that species with a higher water storage capacity and more flexible cell walls would retain water more effectively, leading to higher moisture content in live fuel. Our results confirm this hypothesis, as P. laevigata exhibited the largest capacitance and highest moisture content, while T. recurvata showed high elasticity, moderate capacitance, and elevated moisture levels. Findings from previous studies indicate that species with greater water storage capacity tend to exhibit higher moisture content in live fuel, which influences their flammability and ignition potential [31].
The MCTLP parameter, which estimates the moisture content of live fuel at the point of turgor loss, is critical in assessing species’ fire susceptibility. Among the three species studied, T. recurvata exhibited the highest MCTLP, suggesting that even under extreme environmental conditions such as drought, minimal precipitation, extreme temperatures, and high radiation, it retains a considerable amount of water in its cells, making it less prone to ignition. This result is consistent with studies showing that species with high elasticity and moderate capacitance can maintain hydration under water-deficit conditions, thereby influencing their fire behavior [32,58,59,60]. Conversely, woody species recorded the lowest MCTLP values, with P. laevigata displaying slightly higher values than V. schaffneri (1.99 g/g and 0.89 g/g, respectively). This difference is consistent with the ability of P. laevigata to maintain hydrated cells under stressful conditions due to its superior water storage capacity, a pattern observed in other drought-adapted woody species [23,61]. In contrast, V. schaffneri, with lower water storage capacity and higher susceptibility to water stress, exhibited a lower MCTLP, making it more vulnerable to desiccation and potentially increasing its flammability. These results reinforce the evidence that moisture content plays a fundamental role in fire dynamics at the landscape scale, particularly in ecosystems where fire regimes are strongly influenced by drought cycles [23,59,61]. Traits associated with water access and regulation are therefore critical in determining the moisture content of plant species, especially as fire events become more frequent and increasingly coincide with drought periods.

5. Conclusions

The three studied species exhibited distinct drought response strategies, influencing their water potential dynamics and structural adaptations. P. laevigata maintained stable predawn water potential but exhibited greater midday fluctuations, while T. recurvata showed minimal temporal variability due to its reliance on atmospheric moisture and internal water storage. V. schaffneri, with lower water storage capacity and rigid cell walls, displayed traits associated with higher fire risk. In contrast, T. recurvata retained significant cellular water even under extreme drought, reducing its susceptibility to ignition. This study highlights the role of plant hydraulic traits in regulating live fuel moisture content, a key factor in wildfire dynamics. The observed differences in water storage capacity and turgor maintenance among species suggest that vegetation composition can influence fire behavior. Species with lower moisture content, such as V. schaffneri, may increase fire risk by providing drier fuels, whereas species with greater water retention, such as T. recurvata, could help mitigate fire spread.
From an ecosystem management perspective, understanding species-specific water use strategies is essential for improving fire prevention and land management. Conserving or restoring species with higher live fuel moisture content could act as a natural barrier to fire spread in arid and semiarid landscapes. Additionally, incorporating hydraulic traits into fire risk models can enhance wildfire prediction and management efforts. Given the increasing frequency of wildfires, particularly in these regions, further research should expand to a broader range of species to determine whether similar hydraulic patterns are consistent across different functional groups. Long-term, multi-season studies are also needed to assess year-round variations in plant water relations and their impact on live fuel moisture content. Moreover, integrating hydraulic parameters into predictive fire risk models will be key to refining wildfire prevention and management strategies.

Supplementary Materials

The following supporting information can be downloaded at: https://www.mdpi.com/article/10.3390/f16040568/s1, Figure S1: Soil moisture (%) at three depths (0–10, 10–20, and 20–30 cm) throughout the study period. Measurements were taken on the same dates as leaf water potentials.

Author Contributions

Conceptualization, C.A.A.G. and F.G.F.; methodology, C.A.A.G., F.G.F. and T.A.R.; software, C.A.A.G., J.D.B. and F.F.C.A.; validation, C.A.A.G., F.G.F. and J.D.B.; formal analysis, C.A.A.G.; investigation, C.A.A.G. and F.G.F.; resources, C.A.A.G.; data curation, J.D.B.; writing—original draft preparation, F.G.F., T.A.R. and C.A.A.G.; writing—review and editing, F.G.F., C.A.A.G., T.A.R., J.D.B. and F.F.C.A.; visualization, F.F.C.A.; project administration, C.A.A.G. All authors have read and agreed to the published version of the manuscript.

Funding

This research received no external funding.

Institutional Review Board Statement

Not applicable.

Informed Consent Statement

Not applicable.

Data Availability Statement

The data presented in this study are available on request from the corresponding author due to publication restrictions.

Acknowledgments

We extend our gratitude to Tulio Arredondo for providing the Scholander pressure chamber; this article is dedicated to his memory. We also acknowledge Miguel Luna for his invaluable support during the student’s research stay.

Conflicts of Interest

The authors declare no conflicts of interest.

References

  1. Wang, L.; d’Odorico, P.; Evans, J.P.; Eldridge, D.J.; McCabe, M.F.; Caylor, K.K.; King, E.G. Dryland ecohydrology and climate change: Critical issues and technical advances. Hydrol. Earth Syst. Sci. 2012, 16, 2585–2603. [Google Scholar] [CrossRef]
  2. Achite, M.; Caloiero, T.; Jehanzaib, M.; Wałęga, A.; Kuriqi, A.; Pellicone, G. Geo-Statistical Characterization of Annual Maximum Daily Rainfall Variability in Semi-Arid Regions. Atmosphere 2024, 15, 1519. [Google Scholar] [CrossRef]
  3. Briones, O.; Búrquez, A.; Martínez-Yrízar, A.; Pavón, N.; Perroni, Y. Biomasa y productividad en las zonas áridas mexicanas. Madera Bosques 2018, 24, 1–19. [Google Scholar] [CrossRef]
  4. Armenteras, D.; Dávalos, L.M.; Barreto, J.S.; Miranda, A.; Hernández-Moreno, A.; Zamorano-Elgueta, C.; González-Delgado, T.M.; Meza-Elizalde, M.C.; Retana, J. Fire-induced loss of the world’s most biodiverse forests in Latin America. Sci. Adv. 2021, 7, eabd3357. [Google Scholar] [CrossRef]
  5. Loram-Lourenco, L.; Farnese, F.D.S.; Sousa, L.F.D.; Alves, R.D.F.B.; Andrade, M.C.P.D.; Almeida, S.E.D.S.; Moura, L.M.; Costa, A.C.; Silva, F.G.; Galmés, J.; et al. A structure shaped by fire, but also water: Ecological consequences of the variability in bark properties across 31 species from the Brazilian Cerrado. Front. Plant Sci. 2020, 10, 1718. [Google Scholar] [CrossRef] [PubMed]
  6. Zivcak, M.; Brestic, M.; Sytar, O. Osmotic Adjustment and Plant Adaptation to Drought Stress. In Drought Stress Tolerance in Plants; Hossain, M., Wani, S., Bhattacharjee, S., Burritt, D., Tran, L.S., Eds.; Springer: Cham, Switzerland, 2016; Volume 1. [Google Scholar] [CrossRef]
  7. Ilyas, M.; Nisar, M.; Khan, N.; Hazrat, A.; Khan, A.H.; Hayat, K.; Fahad, S.; Khan, A.; Ullah, A. Drought Tolerance Strategies in Plants: A Mechanistic Approach. J. Plant Growth Regul. 2021, 40, 926–944. [Google Scholar] [CrossRef]
  8. Graciano, C.; Fernández, M.E. Curvas de presión-volumen para la estimación de parámetros hídricos. In Técnicas en Medición en Ecofisiología Vegetal: Conceptos y Procedimientos; Fernández, M.E., Gyenge, J., Eds.; Ediciones INTA: Buenos Aires, Argentina, 2010; 140p, ISBN 978-987-1623-76-1. Available online: https://openlibrary.org/books/OL27090860M/T%C3%A9cnicas_en_medici%C3%B3n_en_ecofisiolog%C3%ADa_vegetal (accessed on 10 January 2025).
  9. Kumar, S.; Sachdeva, S.; Bhat, K.V.; Vats, S. Plant Responses to Drought Stress: Physiological, Biochemical and Molecular Basis. In Biotic and Abiotic Stress Tolerance in Plants; Vats, S., Ed.; Springer: Singapore, 2018. [Google Scholar] [CrossRef]
  10. Blum, A. Osmotic adjustment is a prime drought stress adaptive engine in support of plant production. Plant Cell Environ. 2017, 40, 4–10. [Google Scholar] [CrossRef] [PubMed]
  11. Turner, N.C. Turgor maintenance by osmotic adjustment, an adaptive mechanism for coping with plant water deficits. Plant Cell Environ. 2017, 40, 1–3. [Google Scholar] [CrossRef]
  12. Sanders, G.J.; Arndt, S.K. Osmotic Adjustment Under Drought Conditions. In Plant Responses to Drought Stress; Aroca, R., Ed.; Springer: Berlin/Heidelberg, Germany, 2012. [Google Scholar] [CrossRef]
  13. Li, X.; Blackman, C.J.; Choat, B.; Rymer, P.D.; Medlyn, B.E.; Tissue, D.T. Drought tolerance traits do not vary across sites differing in water availability in Banksia serrata (Proteaceae). Funct. Plant Biol. 2019, 46, 624–633. [Google Scholar] [CrossRef]
  14. Bartlett, M.K.; Scoffoni, C.; Ardy, R.; Zhang, Y.; Sun, S.; Cao, K.; Sack, L. Rapid determination of comparative drought tolerance traits: Using an osmometer to predict turgor loss point. Methods Ecol. Evol. 2012, 3, 880–888. [Google Scholar] [CrossRef]
  15. Leuschner, C.; Wedde, P.; Lübbe, T. The relation between pressure–volume curve traits and stomatal regulation of water potential in five temperate broadleaf tree species. Ann. For. Sci. 2019, 76, 60. [Google Scholar] [CrossRef]
  16. Scholander, P.F.; Bradstreet, E.D.; Hemmingsen, E.A.; Hammel, H.T. Sap Pressure in Vascular Plants: Negative hydrostatic pressure can be measured in plants. Science 1965, 148, 339–346. [Google Scholar] [CrossRef]
  17. Tyree, M.T.; Hammel, H.T. The Measurement of the Turgor Pressure and the Water Relations of Plants by the Pressure-bomb Technique. J. Exp. Bot. 1972, 23, 267–282. [Google Scholar] [CrossRef]
  18. Mart, K.B.; Veneklaas, E.J.; Bramley, H. Osmotic potential at full turgor: An easily measurable trait to help breeders select for drought tolerance in wheat. Plant Breed. 2016, 135, 279–285. [Google Scholar] [CrossRef]
  19. Zhu, S.; Chen, Y.; Ye, Q.; He, P.; Liu, H.; Li, R.; Fu, P.; Jiang, G.; Cao, K. Leaf turgor loss point is correlated with drought tolerance and leaf carbon economics traits. Tree Physiol. 2018, 38, 658–663. [Google Scholar] [CrossRef]
  20. Bartlett, M.K.; Sinclair, G.; Fontanesi, G.; Knipfer, T.; Walker, M.A.; McElrone, A.J. Root pressure–volume curve traits capture rootstock drought tolerance. Ann. Bot. 2022, 129, 389–402. [Google Scholar] [CrossRef] [PubMed]
  21. Nolan, R.H.; Blackman, C.J.; de Dios, V.R.; Choat, B.; Medlyn, B.E.; Li, X.; Bradstock, R.A.; Boer, M.M. Linking Forest Flammability and Plant Vulnerability to Drought. Forests 2020, 11, 779. [Google Scholar] [CrossRef]
  22. Nolan, R.H.; Foster, B.; Griebel, A.; Choat, B.; Medlyn, B.E.; Yebra, M.; Younes, N.; Boer, M.M. Drought-related leaf functional traits control spatial and temporal dynamics of live fuel moisture content. Agric. For. Meteorol. 2022, 319, 108941. [Google Scholar] [CrossRef]
  23. Pivovaroff, A.L.; Emery, N.; Sharifi, M.R.; Witter, M.; Keeley, J.E.; Rundel, P.W. The Effect of Ecophysiological Traits on Live Fuel Moisture Content. Fire 2019, 2, 28. [Google Scholar] [CrossRef]
  24. Yebra, M.; Dennison, P.E.; Chuvieco, E.; Riaño, D.; Zylstra, P.; Hunt, E.R., Jr.; Danson, F.M.; Qi, Y.; Jurdao, S. A global review of remote sensing of live fuel moisture content for fire danger assessment: Moving towards operational products. Remote Sens. Environ. 2013, 136, 455–468. [Google Scholar] [CrossRef]
  25. Manzello, S.L. (Ed.) Encyclopedia of Wildfires and Wildland-Urban Interface (WUI) Fires; Springer International Publishing: Cham, Switzerland, 2020. [Google Scholar] [CrossRef]
  26. Griebel, A.; Boer, M.M.; Blackman, C.; Choat, B.; Ellsworth, D.S.; Madden, P.; Medlyn, B.; de Dios, V.R.; Wujeska-Klause, A.; Yebra, M.; et al. Specific leaf area and vapour pressure deficit control live fuel moisture content. Funct. Ecol. 2023, 37, 719–731. [Google Scholar] [CrossRef]
  27. Delgado-Balbuena, J.; Arredondo, J.T.; Loescher, H.W.; Huber-Sannwald, E.; Chavez-Aguilar, G.; Luna-Luna, M.; Barretero-Hernandez, R. Differences in plant cover and species composition of semiarid grassland communities of central Mexico and its effects on net ecosystem exchange. Biogeosciences 2013, 10, 4673–4690. [Google Scholar] [CrossRef]
  28. Aguirre-Gutiérrez, C.A.; Holwerda, F.; Goldsmith, G.R.; Delgado, J.; Yepez, E.; Carbajal, N.; Escoto-Rodríguez, M.; Arredondo, J.T. The importance of dew in the water balance of a continental semiarid grassland. J. Arid Environ. 2019, 168, 26–35. [Google Scholar] [CrossRef]
  29. Delgado-Balbuena, J.; Arredondo, J.T.; Loescher, H.W.; Pineda-Martínez, L.F.; Carbajal, J.N.; Vargas, R. Seasonal precipitation legacy effects determine the carbon balance of a semiarid grassland. J. Geophys. Res. Biogeosci. 2019, 124, 987–1000. [Google Scholar] [CrossRef]
  30. Sack, L.; Cowan, P.D.; Jaikumar, N.; Holbrook, N.M. The ‘hydrology’ of leaves: Co-ordination of structure and function in temperate woody species. Plant Cell Environ. 2003, 26, 1343–1356. [Google Scholar] [CrossRef]
  31. Scarff, F.R.; Lenz, T.; Richards, A.E.; Zanne, A.E.; Wright, I.J.; Westoby, M. Effects of plant hydraulic traits on the flammability of live fine canopy fuels. Funct. Ecol. 2021, 35, 835–846. [Google Scholar] [CrossRef]
  32. R Core Team. R: A Language and Environment for Statistical Computing; R Foundation for Statistical Computing: Vienna, Austria, 2020; Available online: https://www.R-project.org/ (accessed on 1 July 2024).
  33. Garrido, S.M. Estudio de la Arquitectura Hidráulica y Estrategia Hidráulica de Prosopis Tamarugo Como Mecanismo de Aclimatación Bajo Condiones de Descenso de Nivel Freático. Ph.D. Thesis, Universidad de Chile, Santiago, Chile, 2018. [Google Scholar]
  34. Donovan, L.A.; Richards, J.H.; Linton, M.J. Magnitude and mechanisms of disequilibrium between predawn plant and soil water potentials. Ecology 2003, 84, 463–470. [Google Scholar] [CrossRef]
  35. García López, A.; Cun González, R.; Montero San José, L. Effect of day time on leaf water potential in sorghum and their relationship with soil humidity. Rev. Cienc. Técnicas Agropecu. 2010, 19, 7–11. Available online: http://scielo.sld.cu/scielo.php?script=sci_arttext&pid=S2071-00542010000300002&lng=es&tlng=en (accessed on 4 December 2024).
  36. Lange, O.L.; Medina, E. Stomata of the CAM plant Tillandsia recurvata respond directly to humidity. Oecologia 1979, 40, 357–363. [Google Scholar] [CrossRef]
  37. Nowak, E.J.; Martin, C.E. Physiological and anatomical responses to water deficits in the CAM epiphyte Tillandsia ionantha (Bromeliaceae). Int. J. Plant Sci. 1997, 158, 818–826. [Google Scholar] [CrossRef]
  38. RodrÍguez, H.G.; Silva, I.C.; Meza, M.V.G.; Jordan, W.R. Seasonal Plant Water Relationships in Acacia berlandieri. Arid Soil Res. Rehabil. 2000, 14, 343–357. [Google Scholar] [CrossRef]
  39. Merine, A.K.; Rodríguez-García, E.; Alía, R.; Pando, V.; Bravo, F. Effects of water stress and substrate fertility on the early growth of Acacia senegal and Acacia seyal from Ethiopian Savanna woodlands. Trees 2015, 29, 593–604. [Google Scholar] [CrossRef]
  40. Richards, J.H. Root growth response to defoliation in two Agropyron bunchgrasses: Field observations with an improved root periscope. Oecologia 1984, 64, 21–25. [Google Scholar] [CrossRef]
  41. Perkins, S.R.; Keith Owens, M. Growth and biomass allocation of shrub and grass seedlings in response to predicted changes in precipitation seasonality. Plant Ecol. 2003, 168, 107–120. [Google Scholar] [CrossRef]
  42. Villagra, P.E.; Cavagnaro, J.B. Water stress effects on the seedling growth of Prosopis argentina and Prosopis alpataco. J. Arid Environ. 2006, 64, 390–400. [Google Scholar] [CrossRef]
  43. Johnson, D.M.; Domec, J.-C.; Carter Berry, Z.; Schwantes, A.M.; McCulloh, K.A.; Woodruff, D.R.; Wayne Polley, H.; Wortemann, R.; Swenson, J.J.; Scott Mackay, D.; et al. Co-occurring woody species have diverse hydraulic strategies and mortality rates during an extreme drought. Plant Cell Environ. 2018, 41, 576–588. [Google Scholar] [CrossRef]
  44. Bongers, F.J.; Olmo, M.; Lopez-Iglesias, B.; Anten, N.P.R.; Villar, R. Drought responses, phenotypic plasticity and survival of Mediterranean species in two different microclimatic sites. Plant Biol. 2017, 19, 386–395. [Google Scholar] [CrossRef]
  45. Pritzkow, C.; Williamson, V.; Szota, C.; Trouvé, R.; Arndt, S.K. Phenotypic plasticity and genetic adaptation of functional traits influences intra-specific variation in hydraulic efficiency and safety. Tree Physiol. 2020, 40, 215–229. [Google Scholar] [CrossRef]
  46. Rodriguez-Zaccaro, F.D.; Valdovinos-Ayala, J.; Percolla, M.I.; Venturas, M.D.; Pratt, R.B.; Jacobsen, A.L. Wood structure and function change with maturity: Age of the vascular cambium is associated with xylem changes in current-year growth. Plant Cell Environ. 2019, 42, 1816–1831. [Google Scholar] [CrossRef]
  47. Otieno, D.O.; Schmidt, M.W.T.; Adiku, S.; Tenhunen, J. Physiological and morphological responses to water stress in two Acacia species from contrasting habitats. Tree Physiol. 2005, 25, 361–371. [Google Scholar] [CrossRef]
  48. Ghosh, U.K.; Islam, M.N.; Siddiqui, M.N.; Khan, M.A. Understanding the roles of osmolytes for acclimatizing plants to changing environment: A review of potential mechanism. Plant Signal. Behav. 2021, 16, 1913306. [Google Scholar] [CrossRef]
  49. Sharma, P.; Dubey, R.S. Protein synthesis by plants under stressful conditions. In Handbook of Plant and Crop Stress, 4th ed.; CRC Press: Boca Raton, FL, USA, 2019; pp. 405–449. [Google Scholar] [CrossRef]
  50. Stiles, K.C.; Martin, C.E. Effects of drought stress on CO2 exchange and water relations in the CAM epiphyte Tillandsia utriculata (Bromeliaceae). J. Plant Physiol. 1996, 149, 721–728. [Google Scholar] [CrossRef]
  51. Saito, T.; Soga, K.; Hoson, T.; Terashima, I. The Bulk Elastic Modulus and the Reversible Properties of Cell Walls in Developing Quercus Leaves. Plant Cell Physiol. 2006, 47, 715–725. [Google Scholar] [CrossRef]
  52. Fan, S.; Blake, T.J.; Blumwald, E. The relative contribution of elastic and osmotic adjustments to turgor maintenance of woody species. Physiol. Plant. 1994, 90, 408–413. [Google Scholar] [CrossRef]
  53. Passera, C.B. Fisiología de Prosopis spp. Multequina 2000, 9, 53–80. [Google Scholar]
  54. Geydan, T.D.; Melgarejo, L.M. Metabolismo ácido de las crasuláceas. Acta Biológica Colomb. 2005, 10, 3–16. Available online: http://www.scielo.org.co/scielo.php?script=sci_arttext&pid=S0120-548X2005000200001&lng=en&tlng=es (accessed on 4 December 2024).
  55. Zavala Alcaña, J.C. Manejo Integral del Heno Motita (Tillandsia recurvata L.). Bachelor’s Thesis, Universidad Autónoma Agraria Antonio Narro, Saltillo, Mexico, 2019. Available online: http://repositorio.uaaan.mx:8080/xmlui/handle/123456789/46173 (accessed on 15 July 2024).
  56. Scholz, F.G.; Phillips, N.G.; Bucci, S.J.; Meinzer, F.C.; Goldstein, G. Hydraulic Capacitance: Biophysics and Functional Significance of Internal Water Sources in Relation to Tree Size. In Size- and Age-Related Changes in Tree Structure and Function; Meinzer, F., Lachenbruch, B., Dawson, T., Eds.; Tree Physiology; Springer: Dordrecht, The Netherlands, 2011; Volume 4. [Google Scholar] [CrossRef]
  57. McDowell, N.; Pockman, W.T.; Allen, C.D.; Breshears, D.D.; Cobb, N.; Kolb, T.; Plaut, J.; Sperry, J.; West, A.; Williams, D.G.; et al. Mechanisms of plant survival and mortality during drought: Why do some plants survive while others succumb to drought? New Phytol. 2008, 178, 719–739. [Google Scholar] [CrossRef]
  58. Cary, G.J.; Bradstock, R.A.; Gill, A.M.; Williams, R.J. Global change and fire regimes in Australia. In Flammable Australia: Fire Regimes, Biodiversity and Ecosystems in a Changing World; CSIRO Publishing: Victoria, Australia, 2012; pp. 149–169. [Google Scholar]
  59. Flannigan, M.D.; Wotton, B.M.; Marshall, G.A.; De Groot, W.J.; Johnston, J.; Jurko, N.; Cantin, A.S. Fuel moisture sensitivity to temperature and precipitation: Climate change implications. Clim. Change 2016, 134, 59–71. [Google Scholar] [CrossRef]
  60. Trenberth, K.; Dai, A.; van der Schrier, G.; Jones, P.D.; Barichivich, J.; Briffa, K.R.; Sheffield, J. Global warming and changes in drought. Nat. Clim. Change 2014, 4, 17–22. [Google Scholar] [CrossRef]
  61. Pimont, F.; Ruffault, J.; Martin-StPaul, N.K.; Dupuy, J.L. Why is the effect of live fuel moisture content on fire rate of spread underestimated in field experiments in shrublands? Int. J. Wildland Fire 2019, 28, 127–137. [Google Scholar] [CrossRef]
Figure 1. Location of the sampling site location at the Santo Domingo Ranch in Ojuelos de Jalisco, Jalisco, Mexico.
Forests 16 00568 g001
Figure 2. Field measurements of water potential measurements in field, and sampling of leaves and twigs for making pressure–volume curves in lab.
Forests 16 00568 g002
Figure 3. (a) Daily precipitation (PREC, mm), and relative humidity (RH, %), and (b) vapor pressure deficit (VPD, kPa), and air temperature (Tair, °C). The gray-shaded area indicates the study period.
Forests 16 00568 g003
Figure 4. Variation during the period of measurements in (a) midday leaf water potential (Ψmd) and (b) predawn leaf water potential (Ψpd) for three species, with ±1 SE (Standard Error) shown. Data were collected at the Santo Domingo Ranch site during the period May 2021–August 2021.
Forests 16 00568 g004
Figure 5. Correlation matrix of predawn (Pd) and midday (Md) water potentials and environmental variables: vapor pressure deficit (VPD), relative humidity (RH), mean air temperature (Tair), and soil water content at three depths (0–10, 10–20, and 20–30 cm). Data correspond to three plant species of a semiarid grassland, Vachellia schaffneri (Vs), Prosopis laevigata (Pl), and Tillandsia recurvata (Tr). ** stands for statistical significance (α = 0.05).
Forests 16 00568 g005
Figure 6. Variations in key hydraulic traits among the three studied species: (a) osmotic potential at full turgor (π0), (b) turgor loss point (ΨTLP), (c) bulk modulus of elasticity (ε), and (d) capacitance at turgor loss point (CTLP). Data are presented for two woody species (Vachellia schaffneri and Prosopis laevigata) and one epiphytic species (Tillandsia recurvata). Each bar represents measurements taken at different sampling times throughout the study period, with the mean values displayed along with ±1 SE.
Forests 16 00568 g006
Figure 7. Relationships between capacitance at full turgor (CFT) to other pressure volume parameters (a) water potential at turgor loss (CTLP); (b) osmotic potential at full turgor (π0); (c) bulk modulus of elasticity (ε); and (d) relationships between osmotic potential at full turgor (π0) and bulk modulus of elasticity (ε) for the two woody and one epiphytes. These relationships provide insights into species-specific hydraulic strategies and their capacity to adjust to drought stress in semiarid environments.
Forests 16 00568 g007
Figure 8. Modelled moisture content of live fine fuels during fire weather. Moisture content was calculated at wilting point (turgor loss point) for the three species. The MCTLP represents the estimated moisture content of live fuels under fire weather conditions, providing insights into how species-specific hydraulic traits influence flammability and potential fire behavior in semiarid ecosystems. Higher MCTLP values indicate greater water retention capacity, which may reduce ignition likelihood and fire spread.
Forests 16 00568 g008
Table 1. The mean value ± SE from pressure–volume curve traits (SWC, saturated water content; RWCTLP, relative water content at turgor loss point; π0, osmotic potential; ΨTLP, water potential at turgor loss point; ε, bulk modulus of elasticity; CFT, capacitance at full turgor; CTLP, capacitance at turgor loss point) and moisture content at turgor loss point for the three species. Superscripts indicate results of 2 × 2 ANOVA; ns, not significant; * p < 0.05.
Hydraulic Trait
SpecieMCTLP
(g/g)
SWC
(%)
IIo
(MPa)
ΨTLP
(MPa)
RWCTLP
(%)
ε *
(MPa)
CFT *
(MPa−1)
CTLP
(MPa−1)
V.
schaffneri
0.89 ± 0.351.12 ± 0.39−0.47 ± 0.07−0.91 ± 0.1276.17 ± 3.872.25 ± 0.6012.94 ± 0.080.24 ± 0.06
P.
laevigata
1.99 ± 0.292.28 ± 0.31−0.25 ± 0.04−0.45 ± 0.0687.63 ± 2.112.20 ± 0.5728.03 ± 0.110.31 ± 0.08
T.
recurvata
3.84 ± 0.713.67 ±0.82−0.33 ± 0.05−0.63 ± 0.0881.53 ± 2.411.91 ± 0.5121.48 ± 0.080.27 ± 0.08
Disclaimer/Publisher’s Note: The statements, opinions and data contained in all publications are solely those of the individual author(s) and contributor(s) and not of MDPI and/or the editor(s). MDPI and/or the editor(s) disclaim responsibility for any injury to people or property resulting from any ideas, methods, instructions or products referred to in the content.

