1. Introduction
In 2023, during the relocation of the Qiantang River Ancient Seawall (Linping section) as part of the Grand Canal’s third-phase navigation channel renovation project in Zhejiang, three previously unknown ancient seawalls were discovered: Chaitang, Zhulong Shitang, and Tiaokuai Shitang (stone structure). These seawalls represent significant examples of large-scale hydraulic engineering relics that historically protected the economically vibrant region of ancient China, specifically Hangzhou (120°12′ E, 30°16′ N), from flooding. Chaitang, constructed during the Kangxi reign of the Qing Dynasty (1662–1722 AD), utilized bundled firewood and rammed earth as the main structure. Zhulong Shitang, dating back to the Southern Song Dynasty (1127–1279 AD), was built with bamboo baskets filled with stones, supported by wooden piles with mortise-and-tenon joints (
Figure 1 and
Figure 2). The wooden stakes found at the site vary in size, with the smallest measuring approximately 1 m and the largest reaching up to 5 m. Although freeze-drying is widely used in waterlogged archaeological wood (WAW) dehydration, the objects studied in this paper are too long for the size of freeze-dryers available. Considering practical conservation needs, freeze-drying was not employed. The wooden stakes used for the Chaitang and Zhulong Shitang are primarily made of pine wood (
Pinus spp.). These structures hold substantial cultural and historical value. However, due to long-term burial underground, the WAW has been subjected to microbial erosion, such as from bacteria and fungi [
1], leading to severe degradation of its internal polysaccharides (cellulose and hemicellulose) [
2]. The cell wall structure is severely damaged, causing the wood to gradually degrade and become soft and brittle [
3,
4], which seriously impairs its physical and mechanical properties [
5,
6]. After excavation, the wood faces further threats from the dramatic changes in external environmental conditions, making it prone to chemical and biological decay, which weakens the wood further [
7]. This leads to severe deformation, cracking, or even total destruction of the artifacts within hours [
8]. This is primarily because the mechanical strength of the degraded cell walls is much lower than the capillary forces of moisture evaporation [
9], highlighting the urgent need for effective dehydration and consolidation treatments to protect these wood artifacts.
The dehydration and consolidation methods for WAW are typically divided into physical dehydration methods and chemical dehydration methods. Physical dehydration includes natural drying, vacuum drying, supercritical drying, and freeze-drying, among others [
10,
11,
12]. Since the 19th century, various attempts have been made to develop chemical dehydration and consolidation treatments for WAW. Materials such as polyethylene glycol (PEG), sugars, natural resins, ethylene glycol, paraffin, and volatile solvent substitutes have all been tried for the consolidation and protection of WAW [
13,
14,
15,
16]. Despite the testing of many different curing agents, only a few have been widely used in actual conservation [
17].
PEG has been widely used in the conservation of waterlogged archaeological wood due to its low cost, non-toxicity, and reversibility. PEG can be gradually dissolved and removed by washing with appropriate solvents. PEG can penetrate wood tissue, replace water molecules, and strengthen its structure, thereby improving dimensional stability [
18]. Since the 1960s, PEG has been used as a reinforcing material for WAW [
19]. Low-molecular-weight PEG is suitable for the preservation of well-preserved WAW, while high-molecular-weight PEG is more suitable for WAW that has undergone more decay [
18]. However, the preservation of WAW is complex, and relying on a single dehydration and consolidation method is insufficient for the protection needs. Therefore, a different dehydration and consolidation method can be combined to explore their dehydration and consolidation effects. Per Hoffmann and others employed a two-step method combining low-molecular-weight and high-molecular-weight PEG: first soaking with PEG200, then soaking with PEG3000, successfully stabilizing the dimensions of waterlogged ship wood [
20]. Jhon F. Herrera-Builes et al. soaked wood samples in a hot water bath at 95 °C for 8 h, followed by soaking with PEG at room temperature for 16 h. The results showed that the sample density increased by 21%–24%, with an anti-swelling efficiency of 60%, and its mechanical and physical properties improved [
21]. Jianjun Jiang et al. combined PEG impregnation with paraffin heat treatment (PEG-PH) for bamboo, achieving good results, which demonstrated that this method was effective and feasible for preventing cracking in bamboo [
22]. Ingrid Stelzner et al. stabilized the structure using fiberglass and epoxy resin molds, and then preserved Wells’ Wellwood in a high-molecular-weight PEG solution at room temperature, successfully preserving severely degraded wooden artifacts [
23]. Jun Jiang et al. used PEG and silica sol for 24 h impregnation treatments on wood with different moisture contents, enhancing dimensional stability [
24]. Namık Kılıç et al. performed PEG2000 impregnation before vacuum freeze-drying, and anti-shrink efficiency values indicated that PEG2000 impregnation combined with vacuum freeze-drying successfully protected the sunken ship YK1, outperforming using either method alone [
25]. Ladislav Reinprecht et al. preserved European beech wood by soaking it in PEG6000 melts for 1 to 4 h, and its corrosion resistance increased by 60.3% when treated with a modified 210 °C/4 h method, although this also led to a decline in its mechanical properties [
26]. In 2023, researchers removed hemicellulose and combined it with PEG impregnation, resulting in wood that exhibited better dimensional stability after treatment [
27]. Yuhan Liu et al. used a mixture of NaOH and Na
2SO
3 to remove lignin and hemicellulose, then impregnated the wood with PEG, nano-SiO
2, and silane coupling agents at room temperature and pressure, improving the wood’s thermal stability and dimensional stability to some extent [
28]. Jörg Stelzner et al. treated oak samples with a variety of materials, including alcohol-ether resin, PEG, and others, for preservation. The samples were subsequently freeze-dried and then evaluated. The evaluation results demonstrated that tree rings could be identified in all cases using micro-computed tomography (μCT), indicating that μCT is, overall, a powerful and accurate tool [
29]. The degree of decay in WAW can be characterized by basic parameters such as basic density, moisture content, porosity, wet and dry bulk densities [
30,
31,
32,
33]. Additionally, various anatomical features can be used to specify the degree of degradation. Scanning electron microscopy (SEM) can be used to capture the microstructure of ancient wood and the distribution of reagent penetration [
34,
35,
36,
37]. X-ray diffraction (XRD) can be used to test the crystallinity of cellulose in ancient wood and reflect changes in crystallinity through variations in diffraction peak intensity [
38,
39,
40,
41].
This study focuses on WAW from different periods of the Qiantang River Ancient Seawall. It compares different combinations of dehydration methods while controlling variables such as reagent combinations, reagent concentrations, and soaking time. The color changes before and after treatment are compared, and parameters such as shrinkage rate, weight percentage gain (WPG), and moisture content (MC) are measured to evaluate dimensional stability. In addition, the changes in wood crystallinity were analyzed using XRD, and the SEM microstructural changes in cells before and after treatment were observed and analyzed using scanning electron microscopy. These results, combined with factors such as shrinkage rate, WPG, MC, and colorimetric changes, were used to comprehensively evaluate the effectiveness of different dehydration and consolidation treatment combinations on the WAW from the Qiantang River Ancient Seawall. The research aims to determine a more suitable dehydration and consolidation protection method for Chaitang and Zhulong Shitang, providing valuable insights for the preservation of the Qiantang River Ancient Seawall, and establishing a basis for correlating the color, dimensional stability, strength, and distribution of consolidation material penetration in WAW.
2. Materials and Methods
2.1. Experimental Introduction
The preservation environment of the WAW from the Qiantang River Ancient Seawall site is unique, and the environment changes significantly after excavation. The formation of a complex ecosystem, including bacteria, fungi, and plants, accelerates the degradation of the WAW. The Qiantang River Ancient Seawall is located at the river’s estuary. Over the centuries, the construction of seawalls has been driven by the need to reclaim more arable land from the sea, resulting in the continuous expansion of newly built seawalls toward the ocean. Consequently, the older seawalls, which were initially submerged in seawater, gradually became buried under sediment over time and were subsequently exposed to freshwater erosion. Additionally, the alternating tidal movements of the Qiantang River cause cyclic erosion by both seawater and freshwater, leading to a more severe and complex preservation environment for the WAW of the ancient seawalls. Using natural drying or PEG dehydration alone cannot adequately meet the specific preservation needs, so this study combines natural drying with chemical reagent dehydration methods, and uses gradient ethanol pretreatment. Therefore, combining multiple methods can lead to more suitable dehydration and consolidation treatments for WAW. Before applying dehydration and consolidation treatments, a scientific diagnostic evaluation of the preservation state of the WAW from the Qiantang River Ancient Seawall was conducted, considering aspects such as microstructure, physical, and chemical characteristics. This evaluation helped understand the decay mechanisms and select the most appropriate conservation methods.
In the PEG method, a two-step treatment was used, where low-molecular-weight PEG was first applied to replace the water, followed by high-molecular-weight PEG for stabilization and reinforcement. Therefore, four dehydration methods were selected: ethanol dehydration, PEG400 dehydration, PEG4000 dehydration, and a two-step PEG400 + PEG4000 treatment. Prior to applying the reagent dehydration treatments, five samples each from the Zhulong Shitang and Chaitang (representing half of the total material) were naturally dried by wrapping them in plastic film for up to six months. The remaining half of the samples skipped the natural drying process and directly underwent reagent dehydration (
Figure 3).
Samples were collected from different parts of the wooden piles in Chaitang and Zhulong Shitang, with ten samples taken from each site. The reagents used in the experiment were anhydrous ethanol and PEG (molecular weights of 400 and 4000). The instruments used in the experiment include a vernier caliper, an electronic balance (Jimin Precision Balance A6-001, Zhejiang Jiming Technology Co., Ltd., Jinhua, China), a colorimeter (3nh handheld color difference meter, Shenzhen Sanentech Technology Co., Ltd., Shenzhen, China), a scanning electron microscope (SU1510, Hitachi Ltd., Tokyo, Japan), and an X-ray powder diffractometer (Rigaku Ultima IV, Rigaku Corporation, Tokyo, Japan). Additionally, plastic film was required to wrap the wood for slow natural drying.
2.2. Experiment Design and Procedures
The collected sample materials were first subjected to gradient ethanol dehydration treatment (with concentrations of 50%, 70%, 85%, and 95%, each treated once, followed by two treatments with anhydrous ethanol). The Chaitang and Zhulong Shitang samples were then treated according to one of the following four methods: anhydrous ethanol, PEG4000, PEG400, and a two-step PEG400 + PEG4000 method. These were divided into 4 groups, in addition to a control group with no protective treatment, making a total of 5 groups. At the same time, the Chaitang and Zhulong Shitang samples were further divided into two major groups based on whether or not they were naturally dried. Ten samples of WAW were collected from each of the Zhulong Shitang and Chaitang sites. The samples from Zhulong Shitang were labeled as Z1 to Z10, while those from Chaitang were labeled as C1-1 to C5-2. The specific dehydration treatment methods for each sample are detailed in
Table 1 and
Table 2.
Natural drying: After the excavation of WAW, the artifacts were immediately wrapped completely in plastic film to isolate them from air exposure. They were then placed in a storage facility with stable temperature and humidity conditions, avoiding sunlight and maintaining a dark environment. The wood was left in this environment for up to six months to undergo slow natural drying before proceeding with reagent-based dehydration (
Figure 4 and
Figure 5).
PEG4000 gradient concentration consolidation: PEG4000 was used to soak the Zhulong Shitang WAW samples. The initial concentration was 10 wt%, and the soaking solution was replaced every week, increasing the concentration by 20 wt% each time, until it reached 90 wt%, at which point no further increase was made. The solution replacement schedule was synchronized with other groups.
PEG400 and PEG4000 two-step gradient concentration consolidation: PEG400 was used to soak the Zhulong Shitang WAW samples. The initial concentration was 10 wt%, and the soaking solution was replaced every week, with the concentration increased by 40 wt% each time. When the concentration reached 90 wt% PEG400, the next soaking solution was changed to 45 wt% PEG4000, and the concentration was increased by 45 wt% each time until it reached 90 wt% PEG4000, after which no further increase was made. The solution replacement schedule was synchronized with other groups.
PEG400 gradient concentration consolidation: PEG400 was used to soak the Zhulong Shitang WAW samples. The initial concentration was 10 wt%, and the soaking solution was replaced every week, with the concentration increased by 20 wt% each time, until it reached 90 wt%, at which point no further increase was made. The solution replacement schedule was synchronized with other groups.
Anhydrous ethanol dehydration treatment: The samples were soaked in 100% ethanol, with the soaking solution replaced every week, and the solution replacement schedule was synchronized with other groups.
Control group: No dehydration protection treatment was applied.
2.3. Experiment Parameters
2.3.1. Moisture Content (MC) Test
Wooden pile samples from Chaitang and Zhulong Shitang in a water-saturated state were selected. The moisture on the surface of the wood samples was wiped off using rice paper and weighed. The samples were then placed in an oven at 105 °C for drying until the mass change was less than 0.0001 g. After removal, they were immediately weighed and recorded. The MC of the samples was calculated using the following Equation (1):
where
m1 (g) is the initial weight of the wooden sample, and
m2 (g) is the mass of the wooden sample after drying. The MC tests for Chaitang and Zhulong Shitang were each conducted with three sets of samples, and the average of the three measurements was taken as the average MC of the wooden samples.
2.3.2. Weight Percentage Gain (WPG)
Before reagent dehydration treatment, the surface moisture of the naturally dried and water-saturated wooden block samples from Chaitang and Zhulong Shitang was wiped off with rice paper and weighed. After the reagent dehydration treatment, the samples were air-dried in a fume hood and then placed in a drying chamber. After 48 h, the samples were weighed again. The average MC measured earlier was used as the MC for all the samples, and the WPG was calculated according to Equation (2):
where
mz (g) is the weight of the naturally dried wooden block sample, and
mzg (g) is the weight of the sample after drying for 48 h in the drying chamber.
2.3.3. Shrinkage Rate
For the wood samples that underwent natural drying treatment and the water-saturated samples, the dimensions in the longitudinal (L), radial (R), and tangential (T) directions were measured before reagent dehydration treatment. After the treatment, the samples were allowed to dry and the dimensions in each direction were measured again. The shrinkage rate in each direction can be calculated using Equation (3):
where
Su (mm) is the initial measured sample dimension before reagent dehydration, and
St (mm) is the dimension of the sample after drying and reagent treatment. A positive value of
R (%) indicates shrinkage, while a negative value indicates expansion.
2.3.4. Color Measurement
Before reagent dehydration treatment, two test surfaces of the naturally dried and water-saturated wood samples were selected, and the color measurements were taken five times on each surface and averaged. After treatment, the color was measured again. The color difference of the wood samples was calculated according to Equation (4):
where L*
un and L*
tr are the lightness values before and after treatment, respectively, a*
un and a*
tr, b*
un and b*
tr represent the red-green and yellow-blue chromaticity values before and after treatment, respectively.
2.3.5. Scanning Electron Microscopy (SEM) Observation
After treatment, the Chaitang and Zhulong Shitang samples were dried. Appropriate cross-sections were selected, mounted on sample holders with conductive adhesive, and marked. After fixation, the samples were placed in a sputter coater for 1 min of gold coating. The sample height was adjusted to be below 32 mm, and the samples were placed in the SU1510 vacuum system. The detection parameters were set as follows: Vacc of 15 kV, probe current of 40, and working distance of 10–15 mm. The sample was aligned and focused to obtain clear images, and an appropriate magnification was selected for observation and image capture.
2.3.6. X-Ray Diffraction (XRD)
Crystallinity refers to the ratio of the mass of the crystalline region of the wood to the total mass of the wood. Wood mainly consists of cellulose, lignin, and hemicellulose, with lignin and hemicellulose forming the amorphous regions. Cellulose contains both amorphous and crystalline regions, with the cellulose content accounting for 40%–50%. The higher the crystallinity of the wooden cultural relics, the higher their strength and dimensional stability.
Measuring the absolute crystallinity of wood is difficult, but changes in diffraction peak intensity can reflect trends in the crystallinity of wood, which in turn can indicate changes in the strength and dimensional stability of wooden cultural relics. In this study, X-ray diffraction patterns for each group of Chaitang and Zhulong Shitang WAW samples were measured, and the experimental data were analyzed to assess the impact of different dehydration treatments on the crystalline structure of the WAW from Chaitang and Zhulong Shitang.
The circulating water machine was turned on, and the XRD main unit was activated. The dried WAW samples from Chaitang and Zhulong Shitang were crushed and ground using a pulverizer. The treated samples were placed into the instrument for measurement. The measurement angle (2) range was set to 5–80°, with the tube voltage set to 40 kV and the tube current set to 40 mA.
4. Discussion
4.1. Analysis of Appearance and Color Results
The color values and color difference (ΔE) changes before and after treatment are shown in
Figure 12.
(1) Appearance and color: The anhydrous ethanol group (Chai 4-1, 4-2 and Zhu 4, 9) had the color most similar to that of the wood itself. The PEG group (Chai 1-1, 1-2, 2-1, 2-2, 3-1, 3-2 and Zhu 1, 2, 3, 6, 7, 8) showed a significant darkening in color, and the color in the PEG group without natural drying was darker than that in the PEG group with natural drying.
(2) Color difference: The color differences (ΔE) of the untreated wooden blocks from Zhulong Shitang and Chaitang after drying were 9.89, 9.78 and 9.55, 8.08. The overall changes in ΔE for each group were as follows: PEG4000 < PEG400 + 4000 < PEG400 < control group < anhydrous ethanol.
(3)
Figure 12A,B: The main factor affecting ΔE in the anhydrous ethanol group was the increase in L value. After treatment, each group showed varying degrees of increase in L, which led to a significant lightening in color and an increase in brightness. This indicates that anhydrous ethanol treatment enhanced the L value and produced a better brightening effect.
(4) Changes in a and b values: Compared to pre-treatment values, the a and b values significantly decreased overall. This caused the color to shift towards green and blue, resulting in a darker overall color after treatment.
4.2. Analysis of WPG and Shrinkage Rate Results
The WPG of the samples treated with PEG400 was significantly higher than that of the other PEG treatment groups, indicating that after natural drying, the MC of the WAW from Chaitang and Zhulong Shitang decreased to some extent, and PEG400 could penetrate well. This demonstrates the better affinity between the samples and PEG400.
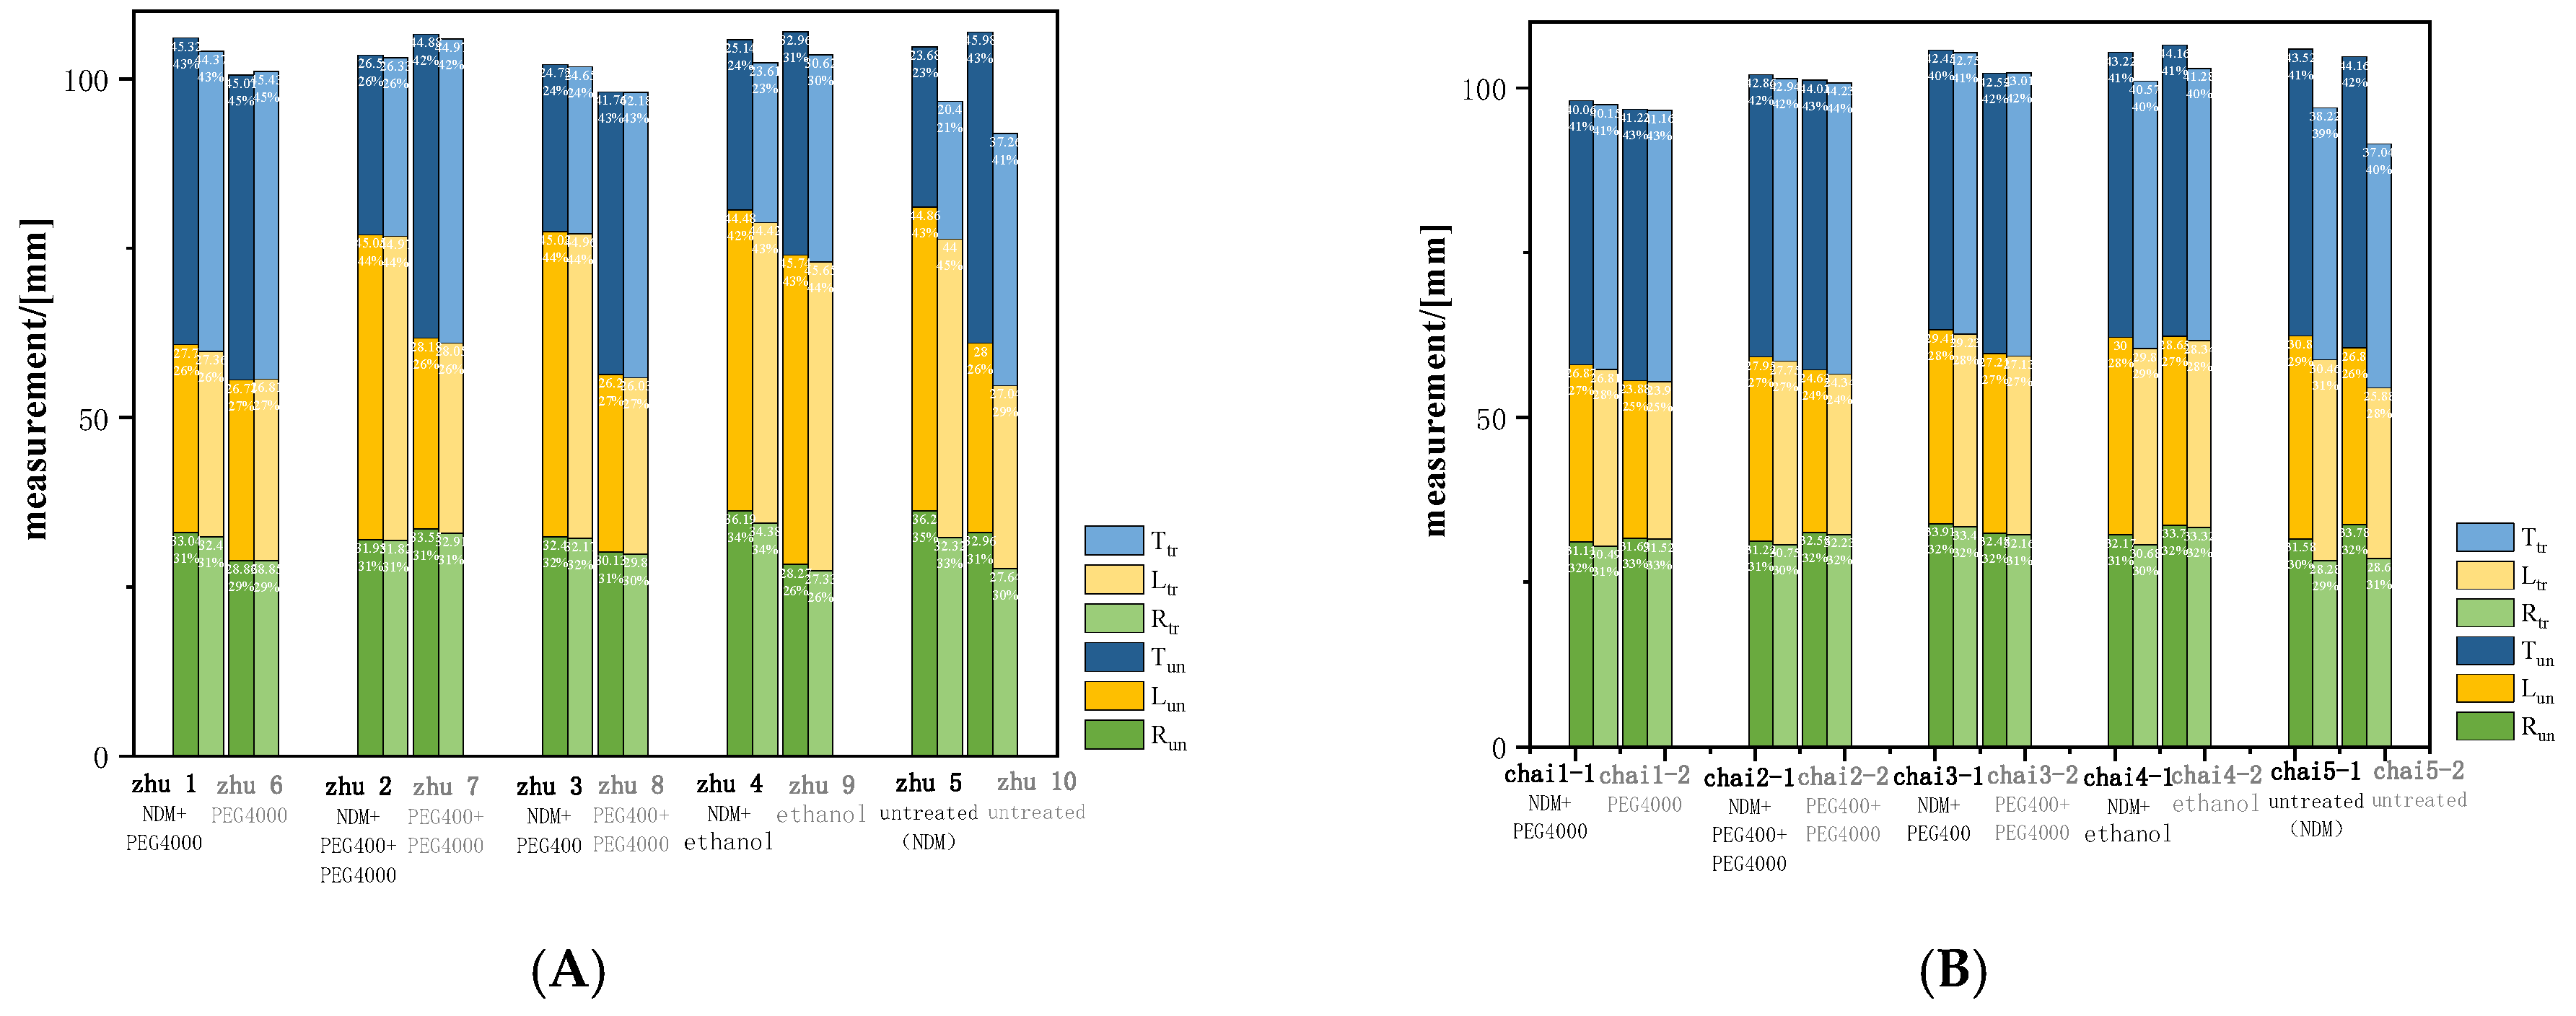
After natural drying and treatment with the two-step PEG400 + PEG4000 method, the samples showed smaller overall shrinkage rates, and the dimensional stability was significantly better than in the PEG4000 treatment group (
Figure 13). For the samples that did not pre-dry, those treated with PEG4000 exhibited relatively lower shrinkage rates [
5]. The dimensional stability of these samples was comparable to that of the group treated with the two-step PEG400 + PEG4000 method. Overall, the treatment effects of the two methods showed minimal differences. This is attributed to the higher MC and greater degree of decay in the samples. Without natural drying, the reagent dehydration process made it difficult for the reagents to penetrate and fill the cellular cavities. As a result, both methods showed lower WPG, leading to higher shrinkage rates and poorer stability.
The ethanol group exhibited the lowest WPG. Regardless of whether natural drying was combined, the ethanol-treated groups (Z 4, 9; C 4-1, 4-2) exhibited overall lower WPG, with some samples even approaching zero. This was because ethanol has a lower surface tension with wood than water, allowing ethanol to displace the water in the wood, thereby reducing internal stress and achieving dehydration and consolidation. Therefore, the ethanol method did not fill the cellular cavities with additional materials.
Compared to the groups treated with chemical reagent dehydration, the groups that solely used natural drying (Zhu 5; Chai 5-1) exhibited significantly higher shrinkage rates, resulting in deformation and cracking of the WAW. This may also be attributed to insufficient natural drying time.
The order of WPG from highest to lowest was: PEG400 > PEG4000 > PEG400 + PEG4000 > ethanol. The overall WPG in Zhulong Shitang was greater than that in Chaitang. The affinity between wood and materials in the order from high to low was PEG400 > PEG4000 > ethanol.
All the dehydration-treated groups exhibited better stabilization effects than the untreated group, with better dimensional stability. In contrast, the untreated group showed significant distortion and deformation. For the groups that underwent natural drying before treatment (Z5, C5-1), although the shrinkage rate was larger, their overall shrinkage rate was smaller than those without natural drying (Z10, C5-2). The PEG-treated groups from both Chaitang and Zhulong Shitang had minimal shrinkage, whereas the ethanol-treated groups still exhibited relatively high shrinkage rates and significant overall deformation. The negative shrinkage rate observed in some of the PEG groups was due to the sample not only failing to shrink but actually expanding. This was caused by excessive treatment time and a high WPG, leading to overfilling of the reinforcement agents. In future work, to address the issue of negative shrinkage rates observed in some PEG-treated groups, the relationship between the immersion time in different concentrations of PEG and the shrinkage rate, as well as the underlying mechanisms, could be investigated.
4.3. Analysis of Filling Morphology Results
It can be observed that the cell wall morphology of the Chaitang and Zhulong Shitang WAW samples (
Figure 9(C4-1),
Figure 10(Z4)) showed distinct signs of decay. The S2 and S3 layers of the fiber cell walls were degraded, and significant cavities appeared, which was due to bacterial erosion and other microbial degradation causing rot [
2].
(1) PEG4000-treated samples (C1-1, 1-2, 2-1, 2-2; Z1, 2, 6, 7): In these groups, the reagent fully filled the internal structure of the WAW samples, and the cell structure inside the samples was almost completely undetectable. In areas where the cell wall had degraded, PEG4000 could enter the cellular cavities through the remaining pores in the middle layer, filling the remaining wood framework. Thus, it effectively removed moisture and provided sufficient support for the cell walls of the WAW samples, ensuring good affinity with the samples. This allowed PEG4000 to fully penetrate the sample and resulted in a higher WPH for the samples [
18].
(2) PEG400-treated groups (C3-1, 3-2; Z3, 8): In these groups, the reagent almost completely filled the internal structure of the WAW sampless [
27], with nearly all types of cell lumens filled with PEG400. The cell wall shape remained relatively intact, and the internal structure of the WAW samples was clearly visible. However, the internal structure of the samples appeared in an oily state, in contrast to the block-like filling observed in the PEG4000-treated groups. Once PEG400 entered the cell walls, it maintained its structure and displaced some of the water within the cell wall’s ultrastructure. In areas where the cell wall had degraded, PEG4000 could enter the cellular cavities through the remaining pits and cracks in the middle layer, filling the remaining wood framework. At higher magnifications, it was observed that PEG400 filled the samples more completely in the C3-2 group than in the C3-1 group. This was because the MC of the Chaitang wooden piles was lower after natural drying, making it less suitable for PEG400 treatment. This resulted in a higher WPG in the C3-2 group than in the C3-1 group. When compared to the corresponding Chaitang groups (C3-1, 3-2), the Zhulong Shitang group (Z3, 8) generally had more thorough filling, but it was observed that the PEG400 filling was noticeably more complete and the WPG was highest in the Chaitang C3-2 group. This was because the MC of the Chaitang WAW samples was lower than that of Zhulong Shitang, making it easier for the smaller PEG400 molecules to penetrate.
(3) Ethanol-treated groups (C4-1, 4-2, Z4, 9): In these groups, the cell walls and lumens were clearly visible. Ethanol treatment reduced the degree of shrinkage in the Chaitang WAW samples to some extent, but some deformation of the cell cavity structure was still observed. Among the samples, C4-2 and Z9 showed more severe deformation than C4-1 and Z4, which is due to the fact that C4-1 underwent natural drying, reducing the MC of the samples [
33]. This allowed the cell walls to better withstand internal stress during drying and vacuum processes. Additionally, broken material was observed in the transverse section, which was caused by cellulose degradation.
(4) Naturally dried WAW samples (C5-1, Z5) maintained a certain shape of the cell walls, but the walls were very thin, and the cells exhibited a twisted appearance with varying degrees of deformation [
16]. After chemical treatment, PEG only filled the cell lumens, and upon drying, the cell walls showed no signs of collapse or distortion, maintaining good dimensional stability. Additionally, all cell walls remained intact for potential future re-treatment. The untreated WAW samples (C5-2) showed fragile cell walls that could not maintain their shape, with a very disordered cross-section and nearly no visible lumen structure. The untreated WAW samples from Zhulong Shitang (Z10) showed no visible lumen structure. Compared to the corresponding Chaitang groups (C5-1, 5-2), the Zhulong Shitang samples showed more severe drying deformation and more extensive damage due to their higher moisture content and more significant bacterial erosion [
7].
4.4. Analysis of Crystallinity Results
The diffraction peak intensity of the WAW samples from Zhulong Shitang (Southern Song Dynasty) was lower than that of Chaitang (Qing Dynasty). Compared to Chaitang, the older WAW samples from Zhulong Shitang contained less crystalline cellulose, and the ordered arrangement of crystalline cellulose was more severely disrupted. This was due to the degradation of cellulose and hemicellulose caused by bacterial and fungal invasion in the underground environment, leading to a reduction in cellulose crystallinity. Both Chaitang and Zhulong Shitang exhibited clear crystalline peaks, with the largest diffraction peak at 2θ and a relatively clear peak at 15°, indicating that the crystalline cellulose in the samples was not completely degraded and still retained some strength.
(1) Compared to untreated Chai5 and Zhu5, ethanol treatment enhanced the stiffness of cellulose, resulting in a smaller dimensional shrinkage rate for the ethanol group.
(2) The groups treated with PEG4000 and PEG400 + PEG4000 (Chai 1, 2; Zhu 1, 2) exhibited higher peak intensities, which to some extent reflects their higher crystallinity. Combined with SEM observations, these groups’ WAW samples were completely filled, showing the smallest overall dimensional shrinkage rate. After PEG4000 treatment, the wood structure remained in a crystalline form, which helped maintain good dimensional stability for the treated WAW samples from Chaitang and Zhulong Shitang. As the WPG increased, the diffraction peak intensity gradually increased, and the crystallinity of the samples also increased.
(3) In the PEG400-treated groups (Chai3, Zhu3), there were no major changes in peak positions compared to those in the untreated groups, but the shape and intensity of the peaks changed significantly. SEM observations revealed that PEG400 nearly completely filled the internal structure of the samples. In contrast to the filling observed with PEG4000, the internal structure of the wood was better preserved, and the cell wall shape was maintained. The diffraction pattern was different from the PEG diffraction peaks, with a significant increase in peak intensity compared to that in the untreated groups, rising from 2490, 2100 to 4373.33 and 3010, respectively. Macroscopically, compared to Chaitang, the treated Zhulong Shitang group had a higher overall WPG, smaller shrinkage rate, and better dimensional stability.
After treatment, the peak intensity of the Chaitang WAW samples was generally higher than that of the Zhulong Shitang WAW samples. This was likely due to more severe degradation of Zhulong Shitang wood. Therefore, for Zhulong Shitang, it is recommended to increase the duration of PEG immersion for better results.
In future work, the sample size for each experimental group could be increased, and immersion in a wider range of PEG concentrations could be attempted to achieve optimal dehydration results. In addition, further research could be conducted based on whether the samples were collected from the front or back side of the Qiantang River Ancient Seawall Site, as well as the specific part of the wooden stakes from which the samples were taken.
4.5. Discussion on Result Variations
In samples treated with natural drying + PEG4000 (Z1 and C1-1), although their shrinkage rates and SEM observations were similar, their WPG differed significantly. This discrepancy may be attributed to differences in moisture content. Despite undergoing natural drying, the Zhulong Shitang samples had higher MC and were more severely degraded by bacteria. Therefore, they may exhibit better affinity for PEG4000 compared to that of the Chaitang samples.
For samples of the same type treated with the same chemical reagents, Z6–Z8 showed negative shrinkage rates compared to those of Z1–Z3, which was likely due to the extended immersion period for the former. The only difference between the two groups was that Z6–Z8 combined natural drying, yet both groups exhibited similar dimensional stability. This suggests that combining natural drying can effectively shorten the PEG immersion period.
5. Conclusions
This study compares two dehydration methods: anhydrous ethanol dehydration and PEG dehydration, both combined with natural drying for comparative experiments, along with gradient-concentration ethanol pretreatment. PEG treatments were divided into three groups: PEG400, PEG4000, and PEG400 + PEG4000. By integrating SEM and XRD results, this study analyzes WAW samples from different periods of the Qiantang River Ancient Seawall, as well as the effects of different dehydration method combinations on samples from the same period. The following conclusions were drawn:
(1) Differentiated treatment efficacy: Zhulong Shitang exhibited better affinity for PEG4000 compared to that of Chaitang, while Chaitang showed better compatibility with PEG400 than Zhulong Shitang did. Regardless of whether natural drying was combined, under the same treatment method, Zhulong Shitang (Southern Song Dynasty) samples consistently achieved higher WPG than the corresponding Chaitang (Qing Dynasty) samples did.
(2) Color and structural outcomes: PEG400 and PEG4000 treatments reduced chromaticity values (a and b), shifting hues toward blue-green and darkening the appearance of WAW. However, they effectively filled cellular cavities, providing structural support and improving dimensional stability. Ethanol dehydration increased lightness (L), enhancing surface brightness, but resulted in high shrinkage rates, causing visible cellular deformation and compromising dimensional stability.
(3) Crystallinity and degradation: Low diffraction peak intensity and crystallinity confirmed severe degradation of cellulose and hemicellulose, directly correlating with the deterioration of the physical properties of WAW from the Qiantang River Ancient Seawall. PEG4000 gradient treatment filled cellular cavities, increasing peak intensity and crystallinity, thereby enhancing stability. PEG400 penetrated cell walls, preserving microstructure while having minimal impact on crystallinity.
(4) Advantages of combined methods: Compared to using PEG treatment alone, combining natural drying effectively shortened the PEG immersion period while achieving similar performance in shrinkage rate, chromaticity, and appearance. This approach achieved complete filling of cellular cavities, improved dimensional stability, enhanced subsequent PEG penetration depth, and ensured excellent compatibility between the filling material and the samples, effectively preventing cracking and deformation.
(5) Future research directions: Future research could increase the sample size for each experimental group and explore a wider range of PEG concentrations to determine the optimal concentration and immersion period for dehydration. Additionally, the relationship between the sampling location within the site and dehydration efficiency could be further investigated.


