1. Introduction
The accelerating pace of climate change and urbanization poses significant challenges to forest ecosystem stability, particularly in rapidly urbanizing regions such as Harbin, where nutrient imbalances—notably soil phosphorus (P) limitations—constrain tree growth and carbon sequestration capacity [
1,
2]. Forests, as critical carbon sinks, rely on efficient nutrient cycling to maintain ecological functions [
1]; however, extensive nutrient management practices in China’s expanding urban forests (3.5% annual growth since 2023) exacerbate stoichiometric imbalances in carbon (C), nitrogen (N), and phosphorus (C:N:P) [
3]. Globally, similar challenges are evident: soil P limitation reduces photosynthetic efficiency in
Acer rubrum in New York [
4], while long-term nitrogen deposition in Leipzig’s urban forests decreases the soil C:N ratio by 20%, accelerating organic matter decomposition [
5]. These examples underscore the urgent need to elucidate seasonal nutrient dynamics between tree species and understory vegetation for optimizing urban forest management.
Ecological stoichiometry provides a robust framework for quantifying elemental ratios (C:N:P) in plant–soil systems, revealing nutrient use efficiency and adaptation strategies [
6]. While existing studies have documented C:N:P dynamics in natural forests—such as shifts in coniferous leaf C:N ratios with stand age [
7] and seasonal regulation of soil phosphorus in
Quercus mongolica forests [
8]—three critical limitations hinder progress in urban forestry. First, neglect of understory vegetation persists, with most research narrowly focusing on tree layers and overlooking shrub–herb nutrient competition [
9]. Second, limited temporal resolution obscures critical seasonal thresholds, as few studies monitor nutrient dynamics continuously across growing seasons. Third, species-specific traits driving nutrient use efficiency remain poorly understood, despite evidence that
Phellodendron amurense exhibits high phosphorus resorption efficiency (63.2%) in low-P soils. For instance, while regional differences in carbon sequestration have been identified, their linkage to species-specific nutrient strategies remains unexplored, limiting practical applications.
This study addresses these gaps by investigating seasonal C:N:P stoichiometry in four deciduous broadleaf species (Fraxinus mandshurica, P. amurense, Q. mongolica, and Juglans mandshurica) and understory vegetation in Harbin’s urban plantations (2023–2024). Specific objectives include: (1) quantifying seasonal variations in nutrient content across plant organs (leaves, branches, trunks) and soil; (2) analyzing tree–understory competition through continuous multi-season monitoring; and (3) evaluating species-specific nutrient use efficiency in response to soil nutrient availability. By integrating multi-scale nutrient data and temporal resolution, this work aims to unravel chemical–ecological regulatory mechanisms, providing actionable insights for optimizing species selection and mitigating soil limitations in urban ecosystems.
2. Study Area
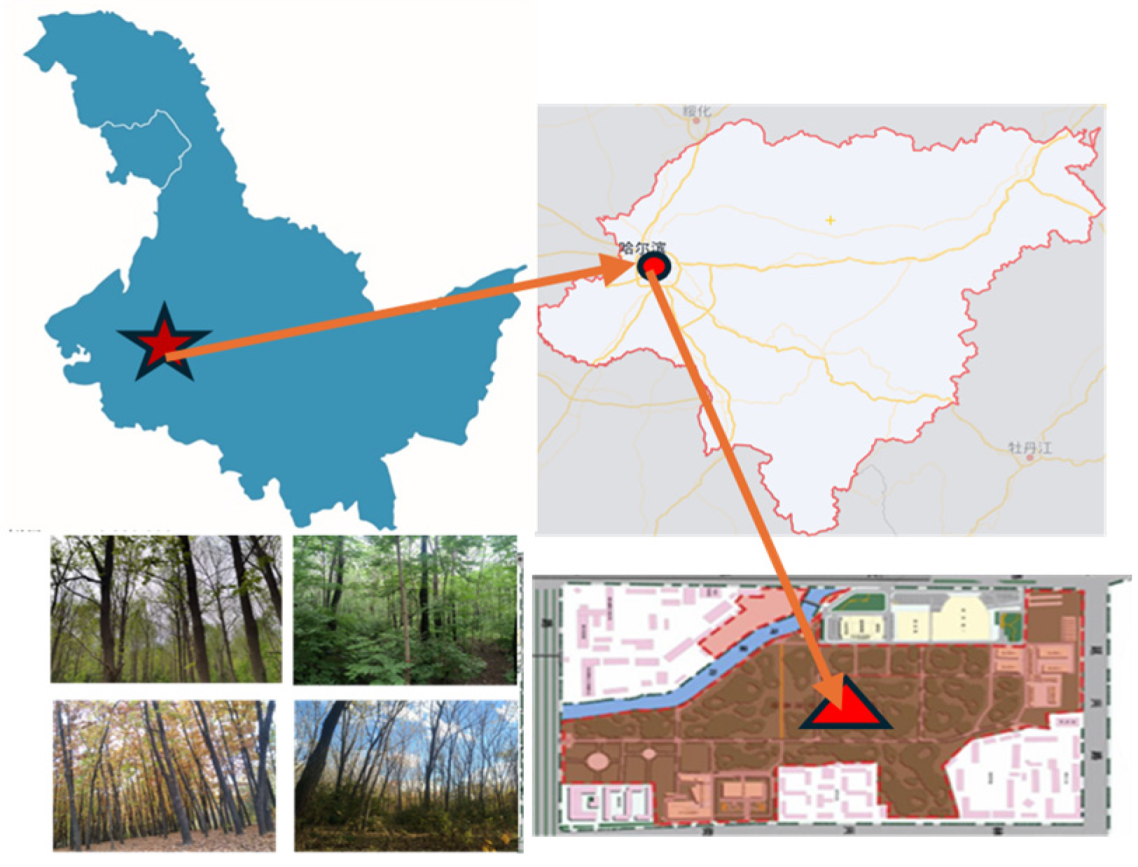
This study was conducted at the Harbin Urban Forestry Demonstration Base in Heilongjiang Province, China, characterized by a temperate continental monsoon climate with an average annual rainfall of 569 mm. The region experiences average temperatures of −19 °C in January and 23 °C in July, with precipitation and heat promoting humus formation in the predominantly black earth soils. Located near Northeast Forestry University, the base was established in 1948 and covers 43.95 hm
2, serving as a key site for education and scientific research. Its geographical coordinates are 45°43′10″ N and 126°37′15″ E, with elevations ranging from 136 to 148 m above sea level (
Figure 1). The area features warm, humid summers and cold, dry winters, with precipitation concentrated in July and August. The annual relative humidity is 67%, the dryness index is 1.1, and the mean annual temperature is 3.5 °C, with a growing season accumulated temperature of approximately 2757 °C. The artificial forests, planted between the late 1950s and early 1960s, were originally established for urban greening experiments.
The black soils in Harbin are classified as Chernozems (World Reference Base for Soil Resources, WRB) [
10], known for their high organic matter content and fertility, making them ideal for agriculture. The soil pH ranges from 6.5 to 7.8, indicating a slightly acidic to neutral reaction (
Table 1).
The Harbin Urban Forestry Demonstration Base includes over ten types of plantation forests, established between 1950 and 1960 using 1 to 2-year-old seedlings. After more than 60 years of management, these forests have developed into dense stands with a density of about 0.8, exhibiting distinct forest landscape characteristics. This study focused on four deciduous broadleaf forest stands: F. mandshurica, J. mandshurica, P. amurense, and Q. mongolica. These species, native to Northeast China, are well adapted to the region’s cold-temperate and temperate continental monsoon climate, demonstrating resilience to harsh winters. As representative deciduous broadleaf species, they play a significant role in the forest ecosystems of Northeast China. Research on these species provides critical insights into the ecological characteristics, growth patterns, and successional processes of deciduous broadleaf forests in the region, offering valuable references for broader forest ecosystem studies. Additionally, their high ecological and ornamental value makes them ideal models for urban forest construction, contributing to the enhancement of urban ecological environments.
3. Materials and Method
3.1. Sample Collection and Preparation
In the demonstration base, three sample plots of uniform size (20 m × 20 m) were established for each of the four deciduous broadleaf forests:
J. mandshurica,
P. amurense,
Q. mongolica. and
F. mandshurica. Each plot had a uniform tree density and area as well as similar topographic and geographic conditions (
Table 1). This experiment mainly focused on the mass fractions (the percentage content per unit mass) of C, N, and P in plants and soil, rather than the storage amounts (the total amounts per unit area or volume). The mass fractions can better reflect the relative concentration changes of nutrients in plants and soil and are suitable for small-sample analysis. The use of small samples for analysis, however, may have certain limitations in representing ecosystems with high spatial heterogeneity, such as forests.
3.2. Tree Layer Sampling
In each experimental plot (20 m × 20 m), five dominant healthy trees with uniform diameter at breast height (DBH: 15 ± 2 cm) and consistent growth habit (e.g., crown symmetry, absence of visible disease or mechanical damage) were selected monthly from May to November to capture seasonal dynamics. Trees exhibiting bark lesions, insect infestations, or abnormal growth patterns were excluded to minimize confounding effects.
3.3. Leaf Sampling Protocol
From each selected tree, sunlit leaves were collected from the upper (top 1/3 of the canopy), middle (central 1/3), and lower (bottom 1/3) canopy layers to account for vertical stratification. Within each layer, 10 fully expanded, undamaged leaves were systematically sampled from four cardinal directions (N, S, E, W) using long-handled pruning shears. A total of 120 leaves per tree (10 leaves × 3 layers × 4 directions) were pooled into a composite sample, immediately placed in pre-labeled breathable paper bags, and stored in a portable cooler (4 °C) to preserve tissue integrity.
3.4. Branch Sampling Protocol
Live branches (1–2 years old, diameter 2–5 cm) were collected from the same canopy layers and directions as leaf sampling. For each tree, three branches per layer (total 9 branches per tree) were excised using a pole-mounted pruning saw. Branches with evidence of herbivory, fungal infection, or bark peeling were excluded. Samples were wrapped in moist cheesecloth and transported to the laboratory within 4 h.
3.5. Trunk Sampling Protocol
Increment cores were extracted at breast height (1.3 m above ground) using a 5.15 mm diameter increment borer. Cores were oriented along the north–south axis to standardize environmental exposure. After extraction, cores were mounted in labeled grooved boards, air-dried for 48 h, and sanded (400–1200 grit) to enhance ring visibility. Annual growth increments were measured to the nearest 0.01 mm using a high-precision measurement system.
3.6. Shrub Layer
Five 1 m × 1 m quadrats were systematically established in each plot using the modified five-point sampling method (centroid + four corners). Within each quadrat, all shrub species were identified, and 10 mature leaves per species were randomly collected from the mid-canopy height (0.5–1.5 m). Leaves were pooled by species into composite samples, with a total of 500 g fresh weight per species per plot collected.
3.7. Herb Layer
Aboveground biomass of herb plants (including stems, leaves, and reproductive structures) was harvested at soil surface level using stainless steel scissors within the same quadrats. Samples were sorted by species, weighed fresh, and oven-dried at 65 °C for 72 h to determine dry mass.
3.8. Soil Sampling Protocol
Soil cores (0–10 cm depth) were collected beneath each selected tree using a stainless-steel soil auger (5 cm diameter). To avoid stemflow influence, sampling points were positioned 50 cm radially outward from the trunk along four cardinal directions. Five composite samples per plot were created by pooling three subsamples from each direction.
3.9. Sample Processing
Visible roots and organic debris were removed using 2 mm nylon sieves. Samples were divided into two aliquots: field-moist subsamples stored at 4 °C for microbial analysis within 24 h, and air-dried subsamples crushed with a porcelain mortar, passed through a 2 mm sieve, and stored in amber glass jars for physicochemical analysis.
Plant samples: quickly rinse the dust stuck to the surface of the leaf samples with water, remove the remaining water and place them in a drying oven at 60 °C to dry to a constant weight, crush them with a pulverize and pass through a 100-mesh nylon sieve, then place them in a plastic bag for storage for chemical analysis.
Soil sample processing: soil samples were placed in a well-ventilated area to air-dry naturally. After drying, any foreign materials and neonates present in the soil were removed through sieving. The samples were then crushed using a hardwood instrument and passed through a 100-mesh nylon sieve. The sieved soil was stored in plastic bags for further processing. The TC and TN contents of both plant and soil samples were determined using a carbon and nitrogen analyzer (VARIO Macro CN, Elementar, Langenselbold, Germany). The soil samples were 50 mg each, and the plant samples were 20 mg each, replicated three times. TP was measured after digestion with a mixture of HClO4 and H₂SO4, using an AA3 (Auto Analyzer 3, SEAL Analytical Co., Ltd., Norderstedt, Germany). The pH of the soil was determined by the potentiometric method, using distilled water as the solution.
3.10. Statistical Analysis
The data were statistically analysed using SPSS (v21.0) (IBM SPSS 21.0, Somers, NY, USA). After performing a Kolmogorov–Smirnov (K-S) test to check for normal distribution, a one-way analysis of variance (ANOVA) and the least significant difference (LSD) test were used to analyse the differences in C, N and P contents and ratios in plants and soils in the different growing seasons. Statistical significance was determined at p < 0.05. Correlations between different nutrients and between plant and soil nutrients were assessed using the Pearson correlation method. Data visualization was performed using Origin Pro 2021 software.
Nutrient use efficiency focuses on the physiological processes governing the allocation of potentially limiting nutrients, particularly N and P, between leaf litterfall and nutrient resorption, and their relationships with plant growth rates [
11,
12].
Calculation of the N/P ratio of plant nutrients: mean value of N content in the tree/mean value of P content in the tree.
Calculation of the C/P ratio of plant nutrients: mean value of C content in the tree/mean value of P content in the tree.
Calculation of the C/N ratio of plant nutrients: mean value of C content in the tree/mean value of N content in the tree (mean nutrient concentrations in plant tissue compartments over the growing season).
Nutrient resorption efficiency [
13]:
where RE is the nutrient resorption efficiency (%) of the leaves; XL and XG are the carbon, nitrogen, phosphorus and potassium content of the leaf litter and green leaves, respectively; and MLCF is the mass loss coefficient factor during leaf senescence. The MLCF for deciduous species such as
J. mandshurica,
P. amurense,
Q. mongolica and
F. mandshurica is 0.784.
4. Results
4.1. Seasonal Dynamics of Leaf Nutrients in the Tree Layer
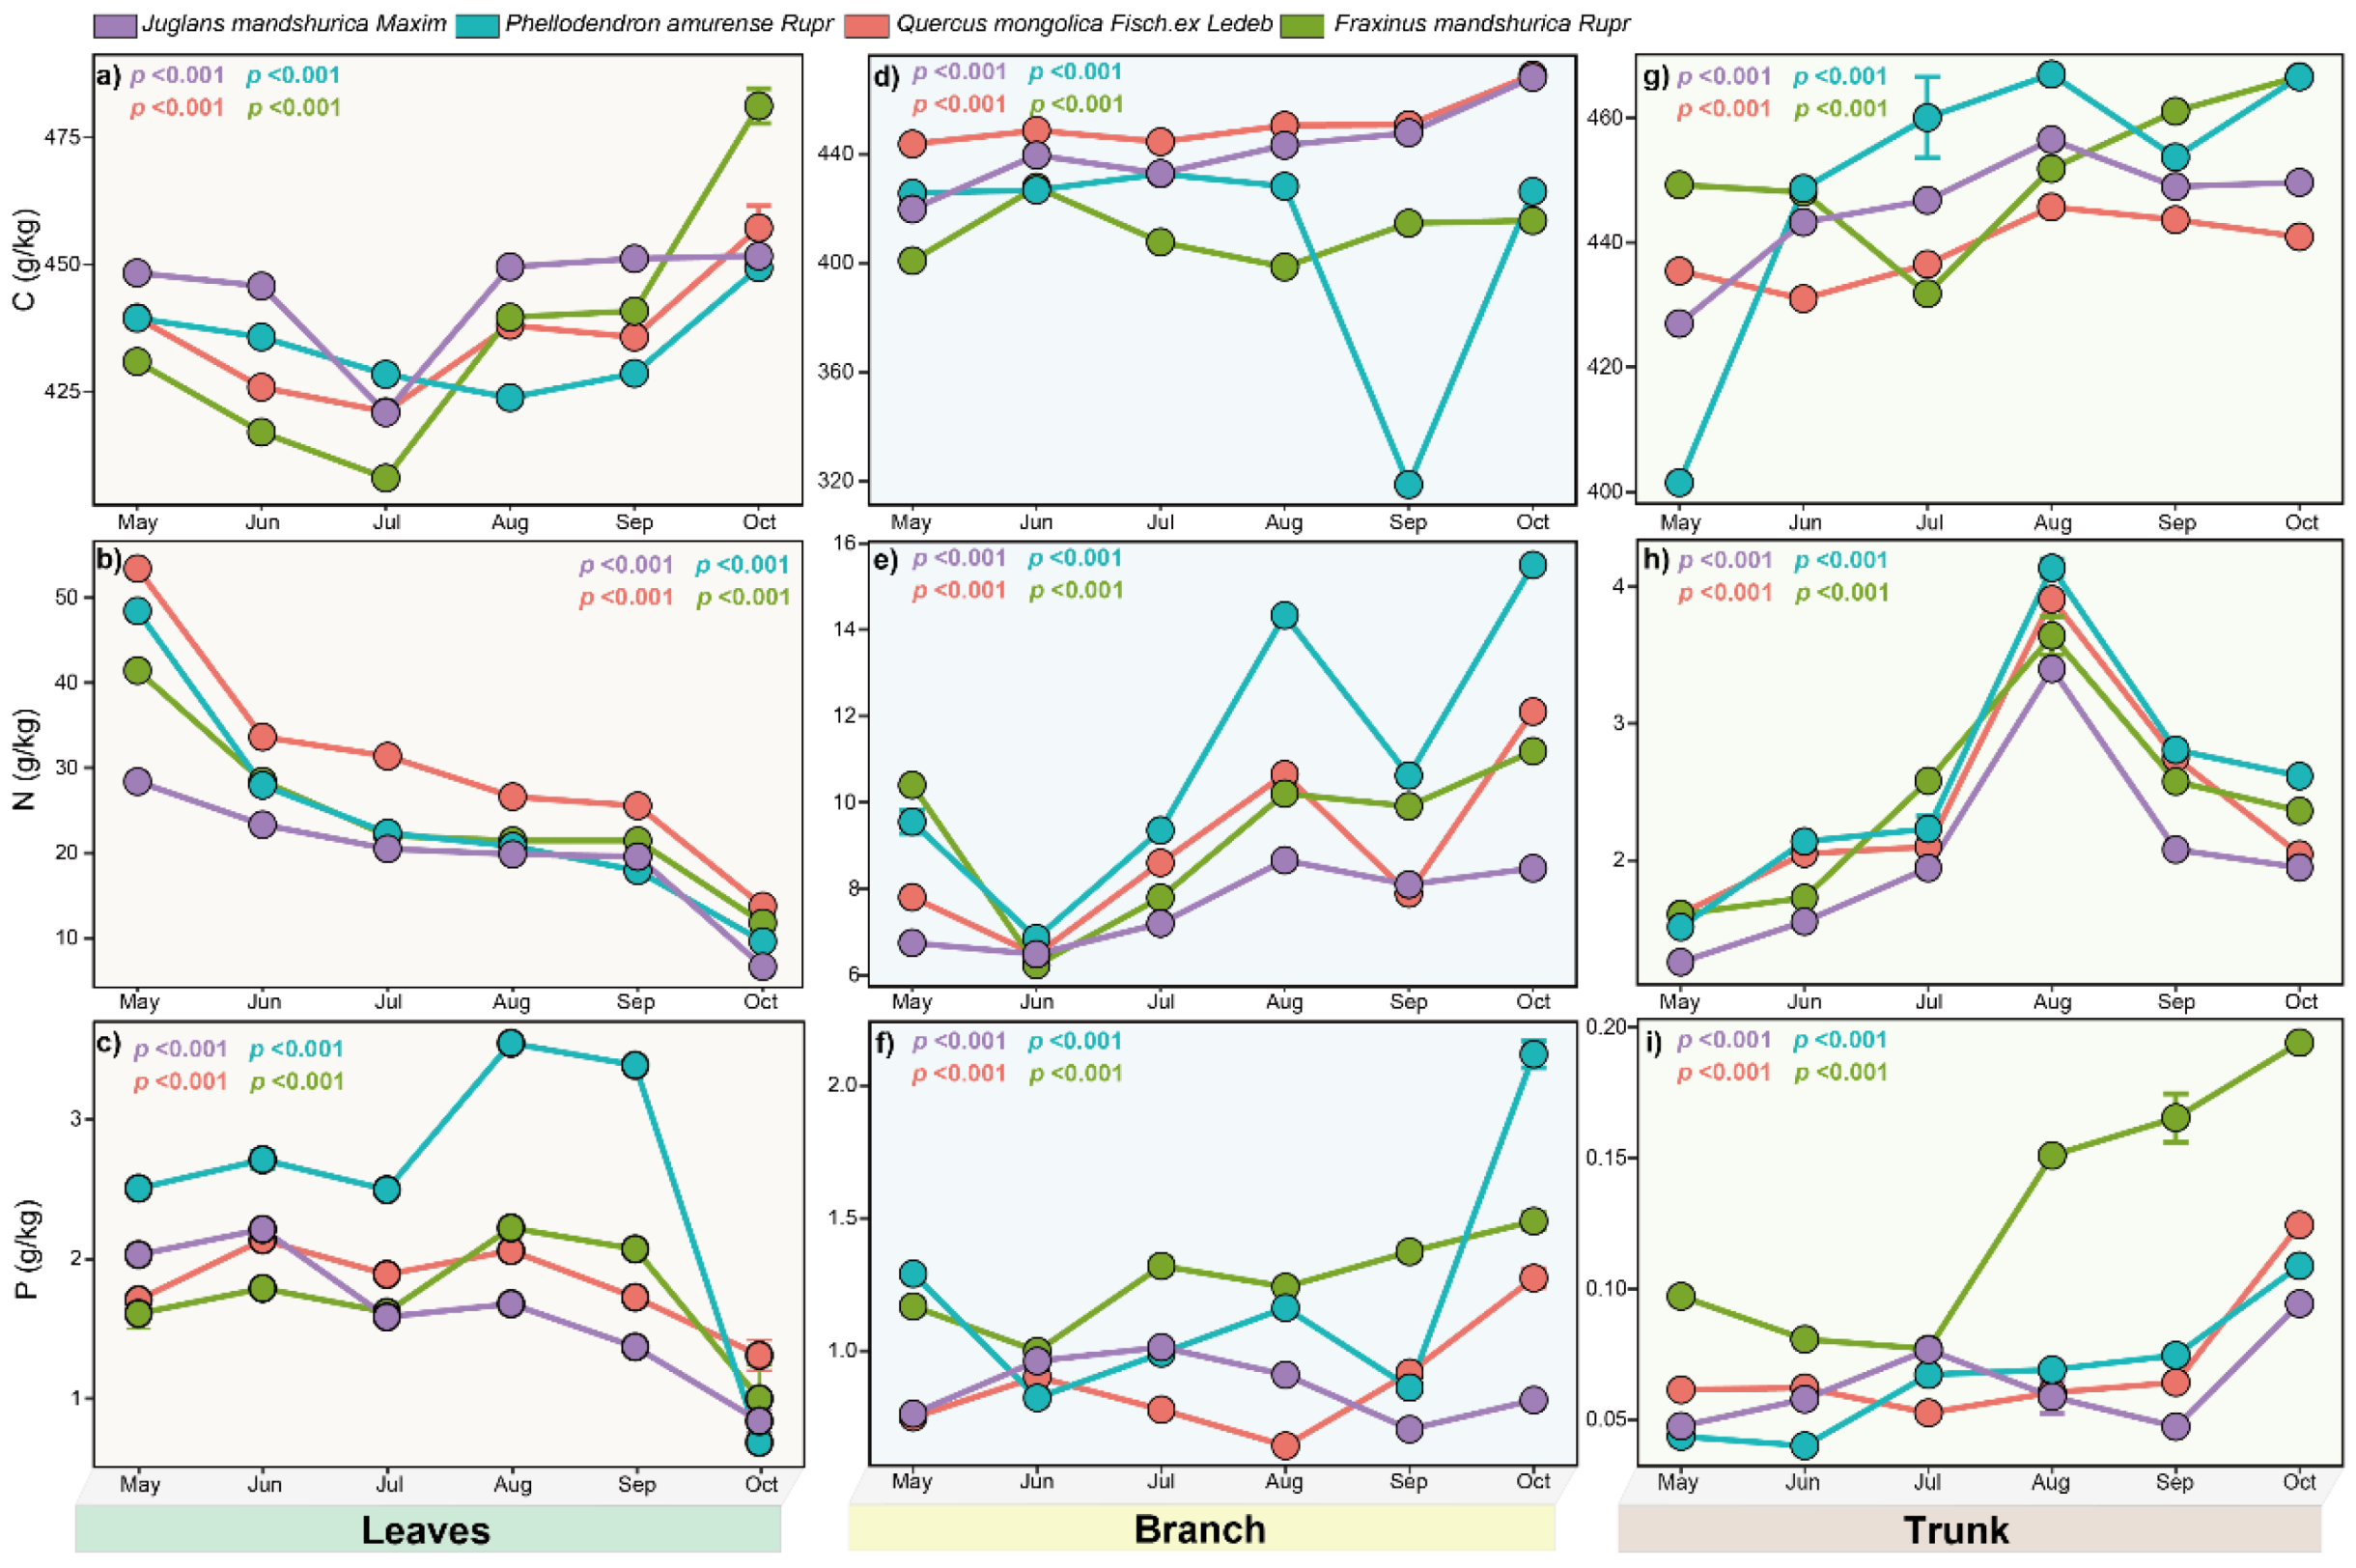
The leaf nutrient dynamics of the studied tree species exhibited consistent seasonal patterns. Leaf C content remained relatively stable, with
J. mandshurica, F. mandshurica, and P. amurense showing an initial decrease followed by a late-season increase. In contrast, leaf N content in these species demonstrated a continuous decline throughout the growing season.
Q. mongolica displayed distinct C and N patterns, with both peaking in June before decreasing. All four species shared a similar leaf P trajectory: an initial June increase, followed by a July decrease, subsequent peak, and final decline. Monthly variations in nutrient content were statistically significant (
p < 0.05) for each species (
Figure 2).
Branch nutrients showed distinct seasonal patterns.
J. mandshurica, P. amurense, and
F. mandshurica had two C peaks during the growing season. P content varied by species:
P. amurense peaked in May, August, and November;
J. mandshurica in May, July, and November; while
Q. mongolica and
F. mandshurica peaked twice (July/November and June/November, respectively). All species showed three N peaks (May, August, November) and two lows (June, September) (
Figure 2). Nutrient content differed significantly among forest components (
p < 0.05).
Trunk strain nutrient content varied seasonally.
P. amurense and
Q. mongolica showed increasing C content from May to August, peaking in August before declining, with a secondary peak in November. Conversely,
F. mandshurica and
J. mandshurica exhibited decreasing C content initially, reaching lows in June and July, respectively, before rising to a November peak. N content in
J. mandshurica,
P. amurense, and
Q. mongolica increased from May, peaking in August, while
F. mandshurica peaked in September. P content trends differed:
J. mandshurica and
F. mandshurica declined to July lows before peaking in November;
P. amurense decreased from May to a November peak;
Q. mongolica peaked in June and November. Significant nutrient differences were observed among forest components (
p < 0.05) (
Figure 2).
4.2. Seasonal Dynamics of Herb and Shrub Nutrients
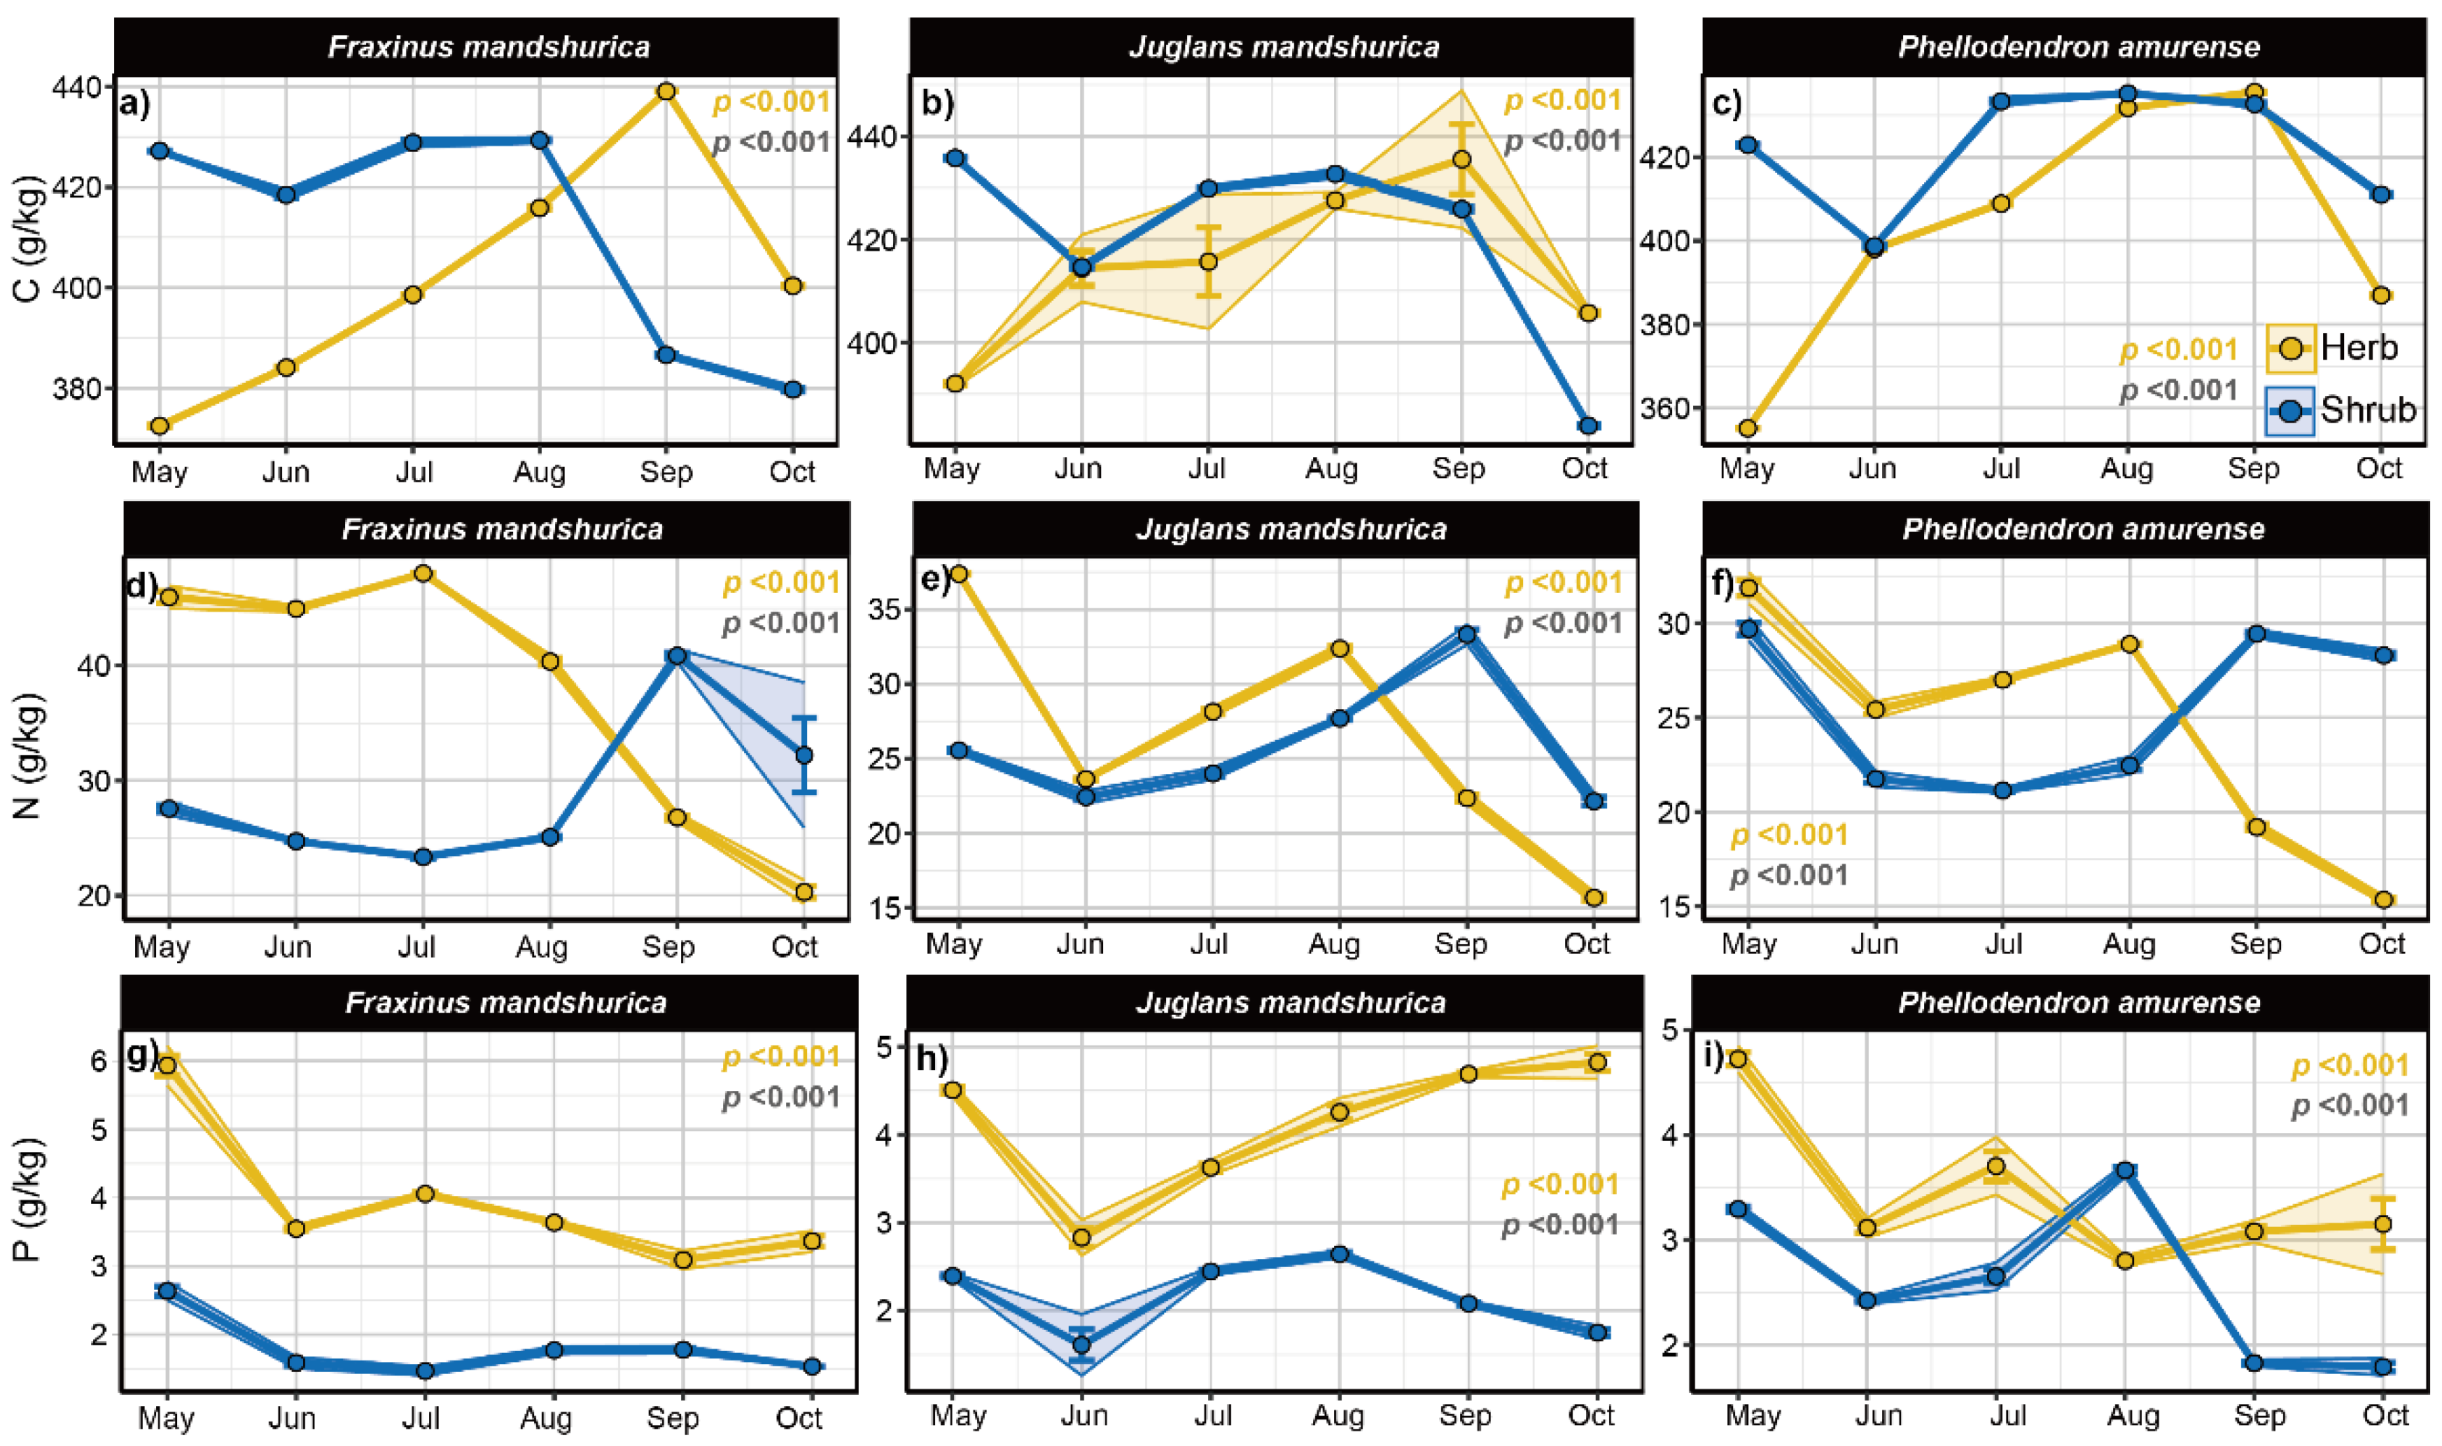
The nutrient content of shrub leaves served as an indicator of overall nutrient dynamics. Q. mongolica, lacking understorey vegetation, was excluded from this analysis. Shrub C content in the understorey of J. mandshurica, P. amurense, and F. mandshurica showed similar trends, decreasing in June, then increasing before declining again at the end of the growing season. Shrub N content followed a comparable pattern: P. amurense and F. mandshurica reached their lowest levels in July, while J. mandshurica reached its minimum in June, peaked in September, and then declined. Shrub P content also exhibited a similar trend, with F. mandshurica reaching its lowest level in July, and J. mandshurica and P. amurense in June, followed by an increase and peak in August before declining. Significant differences in shrub nutrient content were observed among the understorey plantations.
The C content of herbs in the understorey of
J. mandshurica,
P. amurense, and
F. mandshurica exhibited a similar seasonal pattern: it decreased in June, increased in July, and then declined again in
F. mandshurica, while peaking in August for the other species. Herb N content decreased in June and then increased in July, with
F. mandshurica showing a decline in July and the others peaking in August. Herb P content decreased in June, followed by a steady increase in
J. mandshurica, while
P. amurense and
F. mandshurica showed a decline, then increases in August and September, respectively. Significant differences in nutrient content were observed among herbaceous understorey species across the plantings (
p < 0.05) (
Figure 3).
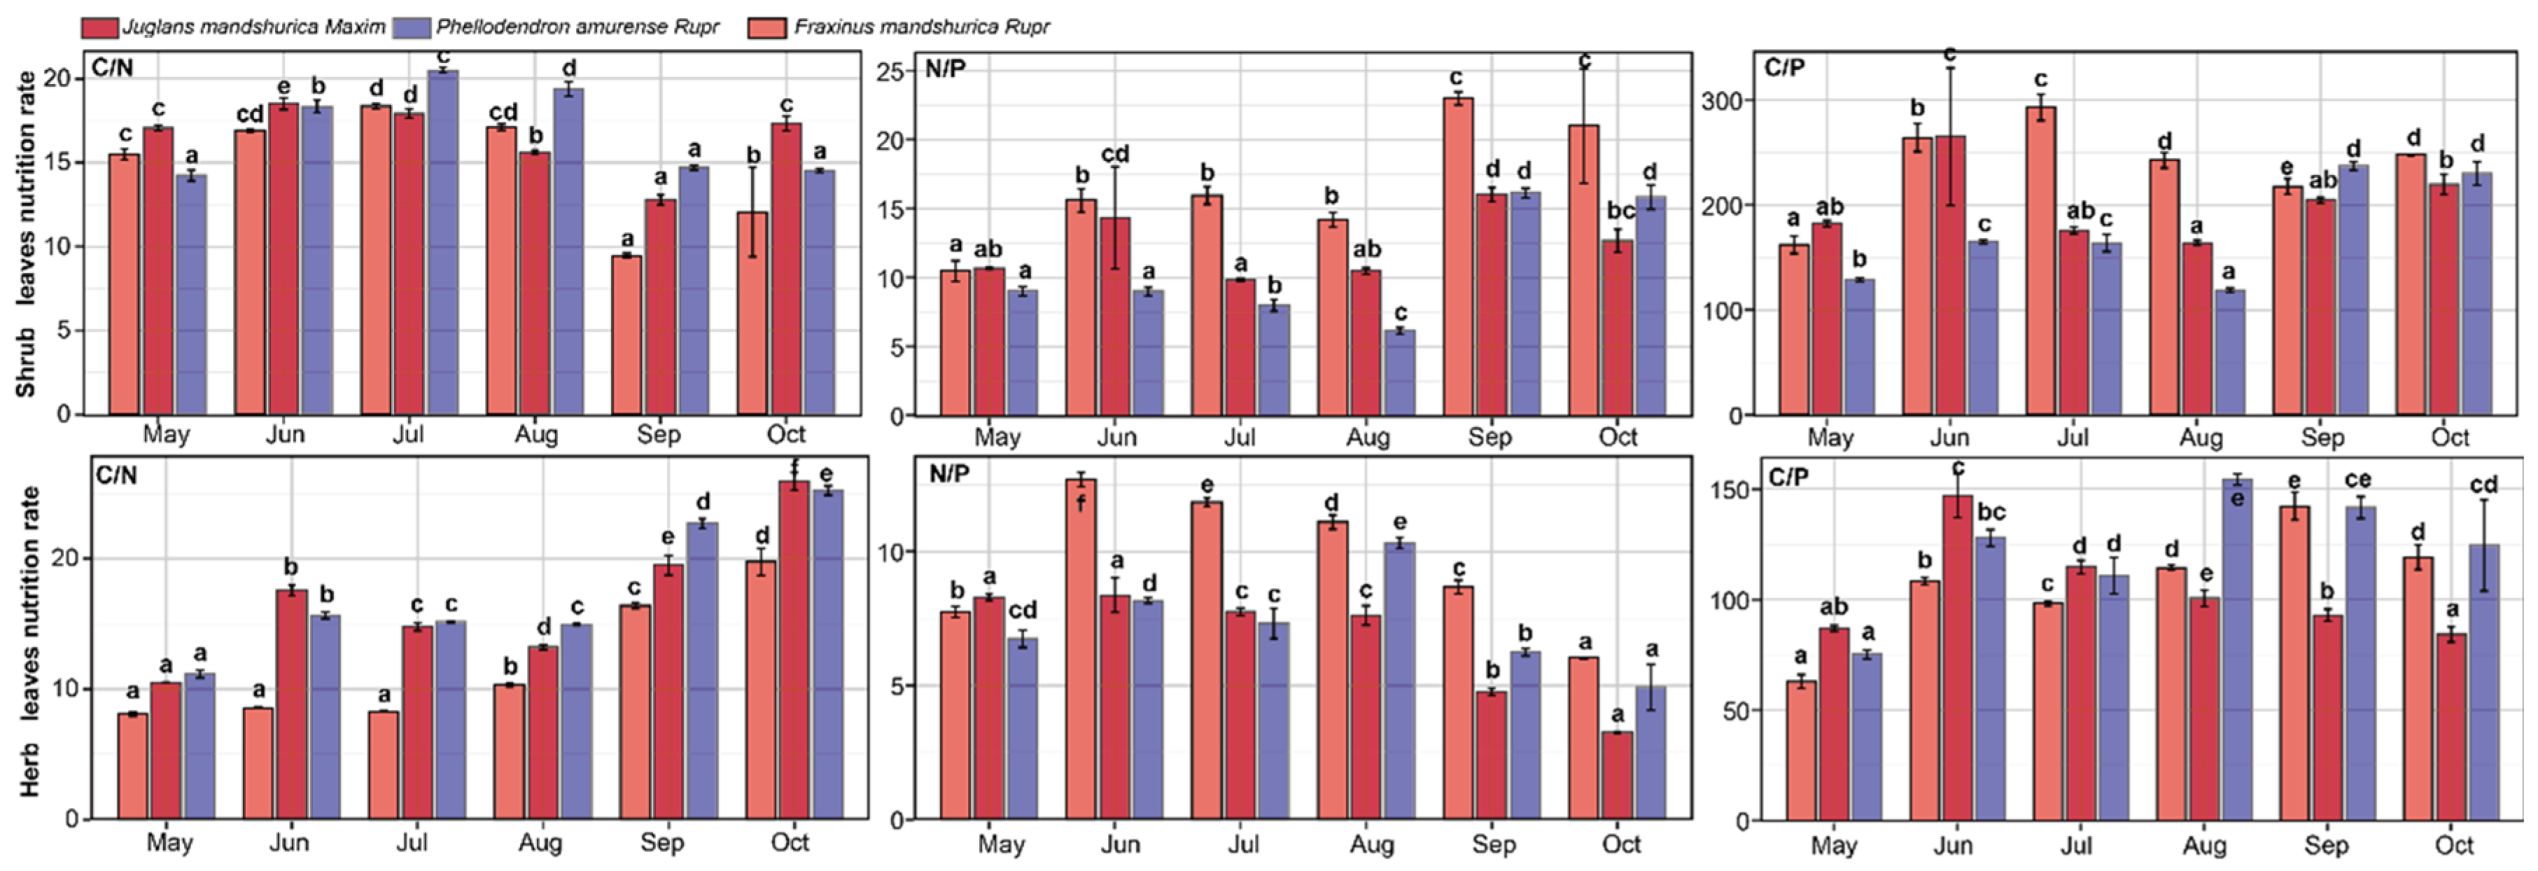
4.3. Seasonal Dynamics of Shrub and Herb Nutrient Ratios
The C/N ratios in understorey shrubs of
J. mandshurica,
P. amurense, and
F. mandshurica initially increased, decreased mid-season, and then rose again towards the end of the growing season. Peaks occurred in June for
J. mandshurica and in July for the other species. The N/P ratio in
J. mandshurica shrubs reached its lowest point in July, while
P. amurense and
F. mandshurica reached their minima in August. All three species peaked in September, with an additional peak in November. The C/P ratios followed similar seasonal trends, peaking in June for
J. mandshurica and
P. amurense and in July for
F. mandshurica, with the lowest values observed in August for all species. Significant differences in nutrient ratios were found among shrubs across the planting types (
p < 0.05;
Figure 4).
The C/P ratio of herbs in the understorey of
J. mandshurica,
P. amurense, and
F. mandshurica increased in June before declining. The C/N ratio of herbs in
J. mandshurica and
P. amurense reached a low in August, while
F. mandshurica showed a low in July, followed by an increase. The N/P ratio of herbs in all three species peaked in June and then declined, with
J. mandshurica and
F. mandshurica continuing to decrease, while
P. amurense reached another peak in August. The C/N ratio also peaked in June before declining. For
P. amurense and
F. mandshurica, C/N values rose again, peaking in August and September, respectively, while
J. mandshurica showed a continuous decline. Significant differences in nutrient ratios were observed among herbaceous understorey vegetation across the plantation types (
p < 0.05;
Figure 4).
4.4. Seasonal Dynamics of Soil Nutrients
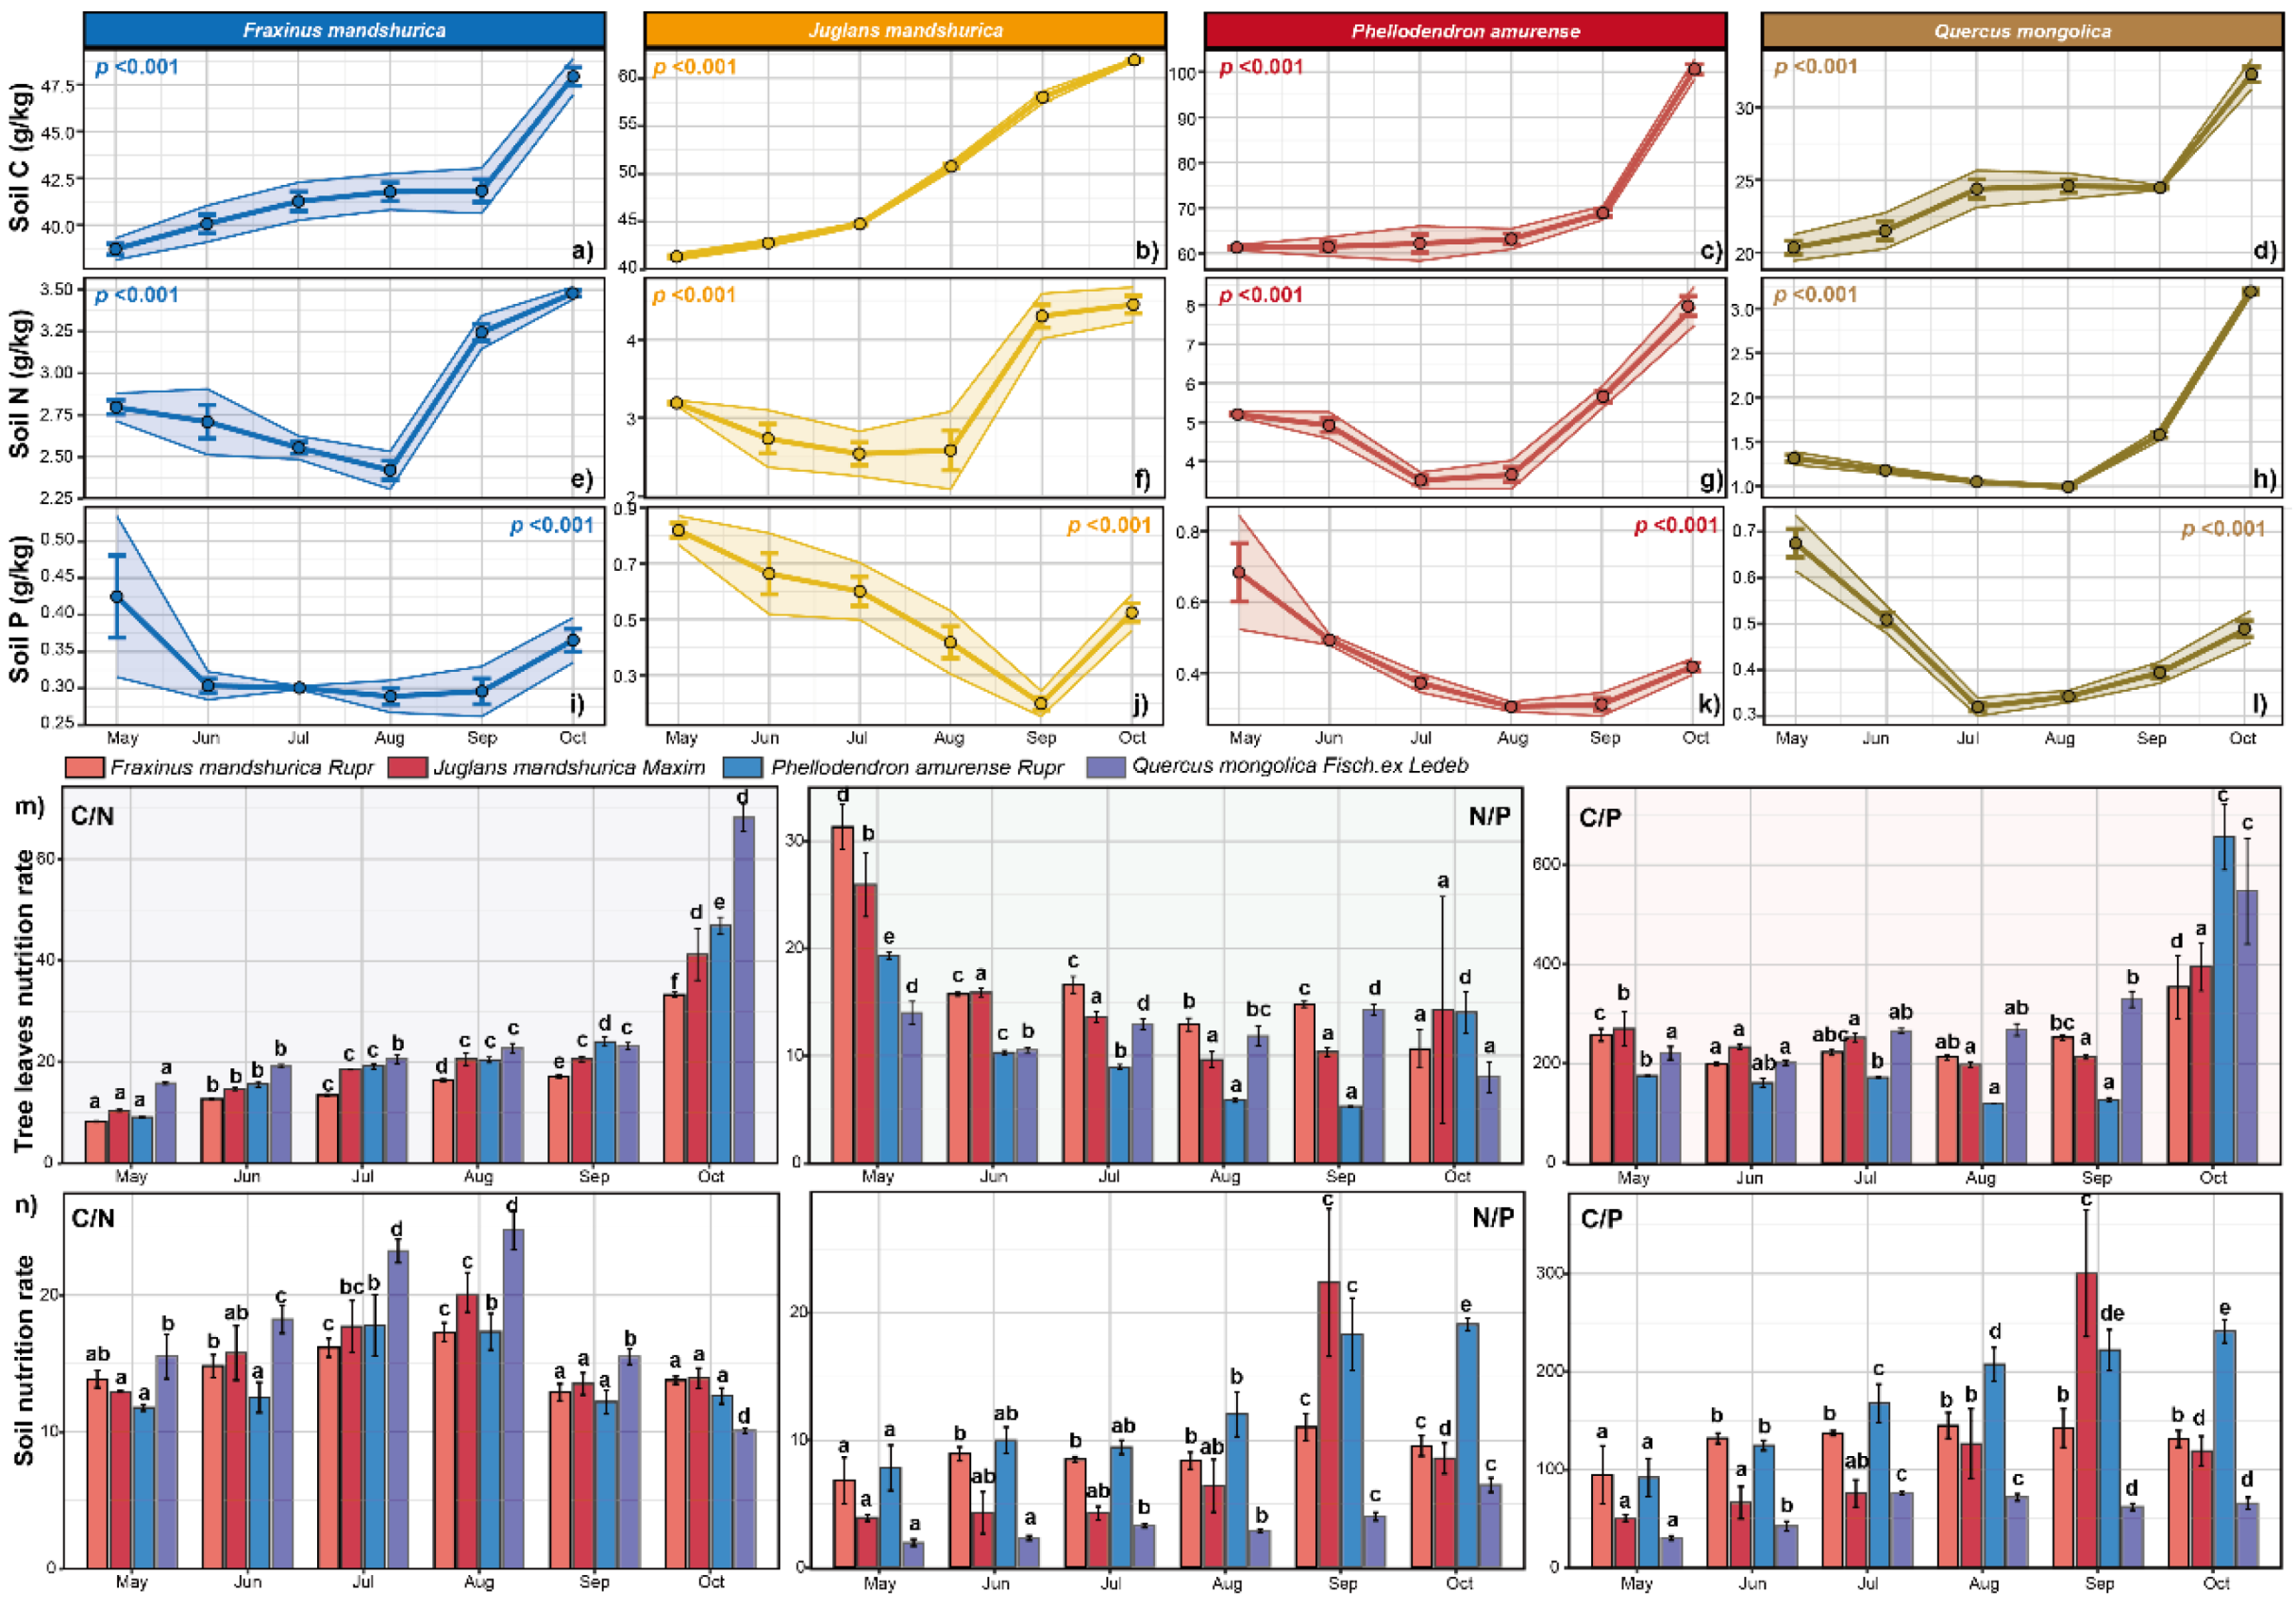
Soil nutrient dynamics under the four species exhibited distinct seasonal patterns. Soil C content increased gradually during the growing season, with
P. amurense, Q. mongolica, and
F. mandshurica showing accelerated increases late in the season, while
J. mandshurica increased rapidly early in the season. Soil N content initially decreased, reaching minima in July for
P. amurense and
J. mandshurica, and in August for
Q. mongolica and
F. mandshurica, before recovering later in the season. Soil P levels were highest at the start of the growing season, declining to minima in September (
J. mandshurica), August (
P. amurense,
F. mandshurica), and July (
Q. mongolica), with partial recovery by season’s end. Significant differences in soil nutrient content were observed among the sub-plantings (
Figure 5).
4.5. Seasonal Dynamics of Leaf Nutrient Ratios in the Tree Layer
Leaf C/N ratios of all four species increased gradually from May to September, followed by a steeper rise. N/P ratios exhibited species-specific patterns:
J. mandshurica and
P. amurense decreased initially, reaching minima in August and September, respectively, before peaking in November.
Q. mongolica and
F. mandshurica showed fluctuating N/P ratios, with sequential decreases and increases from June to November. Overall, N/P ratios declined throughout the growing season. C/P ratios displayed a consistent seasonal pattern across species, decreasing in June and August while increasing in July, September, and November, with
Q. mongolica showing a notable August increase. All species demonstrated an upward C/P trend during the observation period. Significant interspecific differences in nutrient ratios were observed (
Figure 5).
4.6. Seasonal Dynamics of Soil Nutrient Ratios
Soil C/N ratios increased at the start of the growing season, peaking in July for
P. amurense and in August for
J. mandshurica,
Q. mongolica, and
F. mandshurica, before declining. Both C/P and N/P ratios were lowest in May. N/P ratios generally increased during the growing season, with fluctuations and a late-season decrease.
Q. mongolica and
J. mandshurica showed declines from July and September, respectively, though values remained higher than at the season’s start. These variations reflect changes in soil nutrient availability for plant growth. Significant differences in soil nutrient ratios were observed among sub-plantations (
Figure 5).
4.7. Relationship Between Soil and Tree Nutrients Throughout the Growth Process
In
J. mandshurica stands, soil C was significantly negatively correlated with soil P (
p < 0.01) and positively correlated with soil N, leaf C, branch N and P, and stem C and P (
p < 0.01). It also showed a significant negative correlation with leaf N (
p < 0.01). Soil N was positively correlated with leaf N (
p < 0.01), branch N, branch P, and stem C and P (
p < 0.05). Soil P was positively correlated with leaf N (
p < 0.01) but negatively correlated with branch P (
p < 0.05) and stem N and P (
p < 0.01) (
Figure 6).
In
P. amurense understory, soil C was positively correlated with soil N (
p < 0.01) and negatively correlated with leaf N and P (
p < 0.01). It also showed positive correlations with leaf C, branch N and P, and stem P (
p < 0.01). Soil N was negatively correlated with leaf P (
p < 0.01) and positively correlated with leaf C, branch P, and stem P (
p < 0.01). Soil P was positively correlated with leaf C, leaf N, and stem C, N, and P (
p < 0.01/0.05) but negatively correlated with leaf C and N (
p < 0.01) (
Figure 6).
In
Q. mongolica understory, soil C was positively correlated with soil N (
p < 0.01) and negatively correlated with leaf N and P (
p < 0.01). It also showed positive correlations with branch N (
p < 0.01) and stem C (
p < 0.05). Soil N was negatively correlated with leaf N and P (
p < 0.01). Soil P was negatively correlated with branch N (
p < 0.05) and stem C and N (
p < 0.01) (
Figure 6).
In
F. mandshurica stands, soil C was positively correlated with soil N, leaf C, branch C, branch N and P, and stem P (
p < 0.01) and negatively correlated with leaf N and P (
p < 0.01). Soil N was positively correlated with leaf C, branch C, branch P, and stem C (
p < 0.01) but negatively correlated with leaf P (
p < 0.05). Soil P showed no significant correlations with other nutrients (
Figure 6).
4.8. Relationship Between Nutrients in Understory Vegetation and Soil Nutrients
In the understory of
J. mandshurica, shrub C content was significantly negatively correlated with soil C and N (
p < 0.01 or 0.05). Shrub N showed a significant negative correlation with soil P (
p < 0.01), while shrub P showed no significant correlation with soil nutrients (
Figure 7b). In
P. amurense, shrub C was negatively correlated with soil N (
p < 0.05). Shrub N showed a significant negative correlation with soil N (
p < 0.01), and shrub P was negatively correlated with soil C and N (
p < 0.01) (
Figure 7c). In
F. mandshurica, shrub C was significantly negatively correlated with soil C and N (
p < 0.01). Shrub N was positively correlated with soil N (
p < 0.01), while shrub P showed a negative correlation with soil C (
p < 0.05) and a positive correlation with soil P (
p < 0.01) (
Figure 7a).
In the herbaceous understory of
J. mandshurica, herb C was negatively correlated with soil P (
p < 0.01). Herb N was significantly negatively correlated with soil C and N (
p < 0.01), while herb P was positively correlated with soil C and N (
p < 0.01) (
Figure 7b). In
P. amurense, herb C was significantly negatively correlated with soil P (
p < 0.01), and herb N was negatively correlated with soil N and P (
p < 0.01). Herb P was positively correlated with soil P (
p < 0.01) (
Figure 7c). In
F. mandshurica, herb C showed a negative correlation with soil P (
p < 0.05), and herb N was negatively correlated with soil C and N (
p < 0.01). Herb P was negatively correlated with soil C (
p < 0.05) and positively correlated with soil P (
p < 0.01) (
Figure 7a).
4.9. Nutrient Use Efficiency and Nutrient Reabsorption Ratios of Different Tree Species
The results indicated higher P utilization efficiency compared to other nutrients across all species, with N use efficiency being the lowest. N use efficiency ranked as:
Q. mongolica >
P. amurense >
J. mandshurica >
F. mandshurica, while P use efficiency followed:
P. amurense >
J. mandshurica >
F. mandshurica >
Q. mongolica (
Table 2). Nutrient reabsorption rates showed consistent patterns, with P. amurense having the highest rates for both N and P, followed by
Q. mongolica, J. mandshurica, and F. mandshurica (
Table 3).
5. Discussion
The findings of this study reveal distinct seasonal and interspecific variations in C:N:P stoichiometry across four deciduous broadleaf species (
J. mandshurica, P. amurense, Q. mongolica, and
F. mandshurica) in Harbin’s urban plantations. Notably, leaf N and P content declined progressively during the growing season, aligning with the nutrient resorption hypothesis [
14,
15]. However, species-specific strategies emerged:
Q. mongolica exhibited a unique C and P accumulation phase in early summer [
8,
16] likely reflecting its adaptive prioritization of structural carbon over nutrient retention under fluctuating soil P availability (soil P declined from 0.12% in May to 0.06% in September;
Figure 7c). These patterns underscore the role of species traits in mediating nutrient allocation, as evidenced by
P. amurense’s superior P resorption efficiency (63.2%), which correlates with its ability to thrive in low-P soils—a critical adaptation in urban ecosystems where soil P limitation is prevalent [
17].
The divergent nutrient dynamics between plant organs further highlight functional differentiation. Trunk C content in
Q. mongolica increased from 45% in May to 52% in November, suggesting trunks serve as long-term carbon reservoirs, while branches displayed bimodal C peaks, indicating seasonal redistribution to support growth and senescence. Such organ-specific strategies may optimize resource allocation under urban stress, as hypothesized by Kozovits [
18], but our data uniquely quantify these dynamics in a managed urban forest context.
Soil nutrient interactions also exhibited species-specific drivers. In
J. mandshurica stands [
13,
17,
18], leaf C was positively correlated with soil C, implying strong plant–soil coupling for carbon cycling. Conversely,
Q. mongolica showed no significant soil–leaf nutrient correlations, possibly due to its reliance on internal nutrient recycling rather than soil uptake—a strategy consistent with its high NUE [
19,
20]. These results challenge the assumption that all species respond uniformly to soil nutrient availability and emphasize the need for species-specific management in urban forestry [
21,
22,
23].
The understory vegetation played a nuanced role in nutrient competition. While herbaceous P content was positively correlated with soil N in
J. mandshurica plantations, shrub P in
F. mandshurica stands correlated negatively with soil C, suggesting that understory plants may buffer or exacerbate nutrient limitations depending on species composition [
24,
25]. This aligns with Thrippleton et al. [
26], who emphasized understory dynamics in forest nutrient cycling, but our study extends this by linking specific correlations to management-relevant metrics.
Limitations and Future Directions
While this study provides novel insights, its two-year timeframe (2022–2024) limits the capacity to assess long-term trends, such as interannual variability in nutrient cycling [
13]. Additionally, the focus on aboveground nutrients necessitates future integration of root and microbial data to fully unravel plant–soil interactions [
27]. Expanding this work to diverse climatic regions (e.g., subtropical vs. temperate urban forests) could further validate the observed species-specific strategies [
28].
6. Conclusions
This study explored the effects of tree species on the stoichiometric characteristics of C, N, and P and nutrient resorption efficiency in the green leaves, branches, and trunks of the main urban plantation forest ecosystems in Harbin. The results showed that different tree species exhibited different nutrient seasonal variations in the same environment, and there were correlations between leaf nutrients and branch nutrients. Green leaves had higher N and P contents, and the direct variation in C content was not significant. The ratios of C:N and N:P in different components were in the order of trunk > branch > leaf and trunk > leaf > branch. The green leaves in P. amurense plantations had greater N and P resorption efficiency. P. amurense had the highest P nutrient use efficiency, and Q. mongolica had the highest N nutrient use efficiency. This indicates that different tree species in urban plantation forests exhibit different nutrient adaptation strategies when growing in the same habitat.
The C:N:P stoichiometry of plants and soils in the deciduous broad-leaved plantation forests of Harbin showed different seasonal patterns. Overall, the impact of seasonal changes on plant tissue nutrients, especially on the N and P contents of leaves, was greater than that on the soil. The N and P contents in the leaves of trees and shrubs gradually decreased during the growing season, while the N and P contents of herbaceous plants showed the opposite trend from June to July. The ratios of C:N, C:P, and N:P in tree leaves varied significantly in different growing seasons. The nutrient seasonal changes in trees were obvious, and the environmental changes were large. When using the C:N:P stoichiometry method to reflect plant functional traits, temporal and environmental factors should be considered.
In addition, there was a positive correlation between the C content in the leaves of J. mandshurica and that in the soil. There was a significant positive correlation between the P content of herbaceous plants and the N content of the soil, and a significant positive correlation between the N content of leaves and the P content of the soil. The N absorption of J. mandshurica leaves was affected by the soil P content, and the P content of herbaceous plants was affected by the soil N content. In the P. amurense plantation forest, there was a positive correlation between the soil nutrients and the C content of leaf nutrients and a positive correlation between the soil P and the leaf N, indicating that the N absorption of P. amurense leaves was affected by the soil P content, suggesting a lack of P in the soil in this area. There was no positive correlation between the soil nutrients and the tree leaf nutrients in the Q. mongolica plantation forest. In the F. mandshurica plantation forest, there was a significant positive correlation between the soil C and N and the tree leaf C, indicating that the growth of F. mandshurica was affected by the soil C and N. However, due to the influence of external environmental fluctuations and dependence on short-term data, the understanding of nutrient regulation mechanisms in such forest ecosystems may be limited. Future studies should prioritize long-term monitoring to further explore the survival and adaptation strategies in artificial forests.


