1. Introduction
Salt stress, as a primary abiotic stressor, severely restricts plant growth and productivity, posing significant challenges to global forestry and agricultural systems [
1]. It primarily results from the accumulation of soluble salts such as NaCl and Na
2SO
4, which disrupt water absorption and ion equilibrium, leading to osmotic and ionic stress, metabolic disturbances, and compromised photosynthesis [
2,
3]. As soil salinity expands and climate change exacerbates its effects [
4], addressing salt stress is vital for sustainability.
The hybrid willow
Salix matsudana ×
alba is notable for its adaptability and extensive applications in afforestation, ecological restoration, and bioenergy production [
5]. Renowned for its rapid growth and high resilience to salinity, drought, and waterlogging [
6], this species is widely utilized in salinized regions [
7]. Despite its recognized tolerance to salinity, the physiological mechanisms driving its stress responses remain inadequately explored, limiting its optimization in saline environments. Unraveling these mechanisms can benefit breeding efforts for stress-tolerant species and advance sustainable management practices.
Recent studies have uncovered various plant strategies for coping with salt stress, including the accumulation of osmoprotectants like proline and soluble sugars and the activation of antioxidant enzymes such as superoxide dismutase (SOD) and peroxidase (POD), which neutralize reactive oxygen species (ROS) and protect cellular structures [
8,
9,
10]. Advances in omics have revealed salt-responsive genes and pathways, providing opportunities for genetic enhancement [
11]. Despite these developments, early detection of salt stress remains a pressing challenge, necessitating innovative, non-destructive approaches [
12].
Hyperspectral imaging (HSI), particularly in the visible (Vis) and near-infrared (NIR) ranges, has emerged as a promising technology for detecting stress-related physiological changes in plants non-invasively and with high-resolution [
13]. By capturing spectral reflectance across a broad range of wavelengths, HSI can detect physiological alterations in plants well before visible symptoms appear [
14]. Previous studies have demonstrated HSI’s effectiveness in identifying various stressors, including water scarcity [
15], nutrient deficiencies [
13], and diseases [
16]. Its ability to quantify parameters such as chlorophyll content, water status, and biochemical composition positions HSI as a valuable tool for real-time stress monitoring in precision agriculture [
17]. However, its application in monitoring salt stress in woody species like
Salix matsudana ×
alba remains underexplored.
This research investigates the physiological responses of Salix matsudana × alba to salt stress and evaluates the utility of Vis/NIR-HSI for real-time stress detection. Key physiological indicators, including chlorophyll content, antioxidant enzyme activities, and osmotic adjustment substances, were analyzed under different concentrations of NaCl and Na2SO4. Hyperspectral data were processed using noise-reduction techniques, such as Savitzky-Golay (SG) smoothing, multiplicative scatter correction (MSC), standard normal variate (SNV), and successive projections algorithm (SPA), to enhance spectral quality. Predictive models, including Partial Least Squares Regression (PLSR) for quantitative analysis of photosynthetic parameters and Partial Least Squares Discriminant Analysis (PLS-DA), Support Vector Machine (SVM), and Convolutional Neural Network (CNN) models for qualitative classification of salt stress levels, were developed to link hyperspectral signatures to physiological responses, enabling precise stress detection and classification.
The hypothesis of this study is that HSI can accurately monitor physiological changes in Salix matsudana × alba under salt stress conditions, and machine learning models can be developed to classify stress levels based on these spectral data. The study aims to establish quantitative models linking physiological indicators with hyperspectral signatures for effective salt stress detection and management in forestry applications.
2. Materials and Methods
2.1. Samples
Cuttings of Salix matsudana × alba were obtained from mature plantations and propagated under controlled conditions in a greenhouse at Nanjing Forestry University. These cuttings were transplanted into plastic pots (30 cm diameter × 40 cm height) containing a substrate mixture of peat, perlite, and vermiculite in a 2:1:1 (v/v/v) ratio. Plants were watered regularly and grown under natural light conditions with a 14 h light/10 h dark photoperiod. The greenhouse was maintained at daytime and nighttime temperatures of 25 ± 2 °C and 20 ± 2 °C, respectively, with a relative humidity of approximately 60% to ensure optimal growth.
After a six-week acclimation period, plants with uniform height and well-developed leaves were selected and divided into four experimental groups: a control group (0 mM NaCl + 0 mM Na
2SO
4), low salt stress (50 mM NaCl + 50 mM Na
2SO
4), moderate salt stress (100 mM NaCl + 100 mM Na
2SO
4), and high salt stress (150 mM NaCl + 150 mM Na
2SO
4). Salt solutions (NaCl and Na
2SO
4 at 1:1 molar ratio) were prepared based on preliminary trials aiming to simulate common saline soil conditions frequently encountered in forestry practice. These concentrations also reflect typical salt concentrations found in salinized regions and are consistent with those used in similar studies investigating salt tolerance in woody species [
6].
Salt solutions were prepared using a 1:1 molar ratio of NaCl to Na2SO4 dissolved in deionized water to achieve the required concentrations. The treatments were administered by applying the salt solutions directly to the soil to simulate natural saline soil conditions. Each pot received a uniform volume of 500 mL of the designated salt solution per application to ensure consistent salt stress exposure. Salt treatments were applied every two days over a four-week period, progressively increasing the salinity stress while allowing plants to adjust to the conditions. During the experimental period, pots were regularly monitored to maintain soil moisture at optimal levels, preventing excessive drought stress that could interfere with the salt stress effects. The experimental design was completely randomized, with each treatment replicated three times, and each replicate consisting of six plants.
Under salt stress conditions, plants experience multiple physiological challenges, including osmotic stress, ion toxicity, and oxidative damage. The accumulation of Na⁺ and Cl⁻ ions can disrupt ion homeostasis, leading to nutrient imbalances and impaired metabolic activity [
2]. Additionally, reduced soil water availability due to increased salinity induces osmotic stress, restricting water uptake and affecting cell expansion. Over time, prolonged salt exposure can also lead to oxidative stress, which interferes with photosynthesis and other physiological processes [
8]. These combined effects contribute to growth inhibition, leaf chlorosis, and other stress symptoms, which were observed during the experimental period.
Leaf samples were collected at five specific intervals during the stress period: day 3 (T1), day 10 (T2), day 17 (T3), day 24 (T4), and day 31 (T5) following the initiation of salt treatments. These sampling points were selected to capture both early and late-stage physiological responses to salt stress, allowing for a comprehensive assessment of plant adaptation mechanisms. Early-stage responses (T1 and T2) reflect rapid physiological adjustments, while later stages (T3–T5) provide insights into prolonged stress adaptation.
At each time point, fully expanded leaves from the apex of each plant were harvested for HSI and physiological analysis. Consistency in leaf selection was ensured across all replicates to minimize variation in the results. In this study, to ensure the accuracy of hyperspectral measurements and maintain the physiological activity of the leaves, spectral measurements were completed within 30 min after harvesting. All samples were kept in a humid environment and shielded from direct strong light before measurement to minimize water loss and physiological changes. Additionally, environmental light, temperature, and humidity were strictly controlled during the measurement process to ensure data reliability and comparability.
2.2. Physiological Measurements
The physiological responses of Salix matsudana × alba to salt stress were assessed by analyzing 18 key indicators, which included net photosynthetic rate (Pn), transpiration rate (Tr), stomatal conductance (Gs), intercellular CO2 concentration (Ci), chlorophyll a (Chl a), chlorophyll b (Chl b), total chlorophyll content, chlorophyll a/b ratio, carotenoid content, membrane permeability, malondialdehyde (MDA) content, soluble sugar content, soluble protein content, proline content, leaf water content, and activities of antioxidant enzymes including peroxidase (POD), SOD, and catalase (CAT). These indicators were selected to provide a comprehensive understanding of the plant’s health and adaptive mechanisms under varying stress levels.
Key physiological parameters such as Pn, Tr, Gs, and Ci were measured using a portable photosynthesis system (LI-6400, Li-Cor, Lincoln, NE, USA). These measurements provide insights into the efficiency of gas exchange and photosynthesis, allowing us to gauge how primary metabolic processes are influenced by salt stress.
Additionally, pigment analysis was conducted to evaluate the levels of Chl a, Chl b, total chlorophyll, chlorophyll a/b ratio, and carotenoid content. These pigments are crucial for photosynthesis and photoprotection, and their concentrations reflect the plant’s capacity to sustain photosynthetic activity and minimize photodamage under salt stress. Chlorophyll content was measured using spectrophotometric methods, while carotenoid content was quantified through standard procedures [
18].
To assess osmotic adjustment, the levels of proline and soluble sugars were measured. Proline content was determined using a standard method [
19], while soluble sugar content was assessed using the phenol-sulfuric acid method [
20]. These osmolytes play a vital role in maintaining osmotic balance, and turgor pressure, and providing energy reserves under stress conditions, enhancing plant tolerance to saline environments.
The plant’s oxidative stress response was also studied by quantifying the activities of antioxidant enzymes, including SOD, CAT, and POD. These enzymes are essential for mitigating the damage caused by ROS generated during salt stress. Their activities were measured following standard protocols for each enzyme [
21].
Membrane stability and oxidative damage were analyzed through measurements of relative water content (RWC), membrane permeability, and MDA levels. RWC was measured, membrane permeability was quantified by assessing electrolyte leakage, and MDA levels were determined using a standard method [
22]. These indicators are used to evaluate membrane integrity and the extent of oxidative damage under stress conditions.
Lastly, soluble protein content was quantified using a colorimetric assay, which serves as an overall indicator of metabolic status and provides insights into the plant’s ability to adapt metabolically under salt stress [
23].
Each of these indicators was selected for its relevance to stress physiology and its ability to provide valuable insights into the plant’s adaptive responses to salt stress. The selection of these indicators and measurement methods aligns with established protocols and provides a comprehensive approach to studying the physiological mechanisms involved in salt tolerance.
2.3. Hyperspectral Data Acquisition
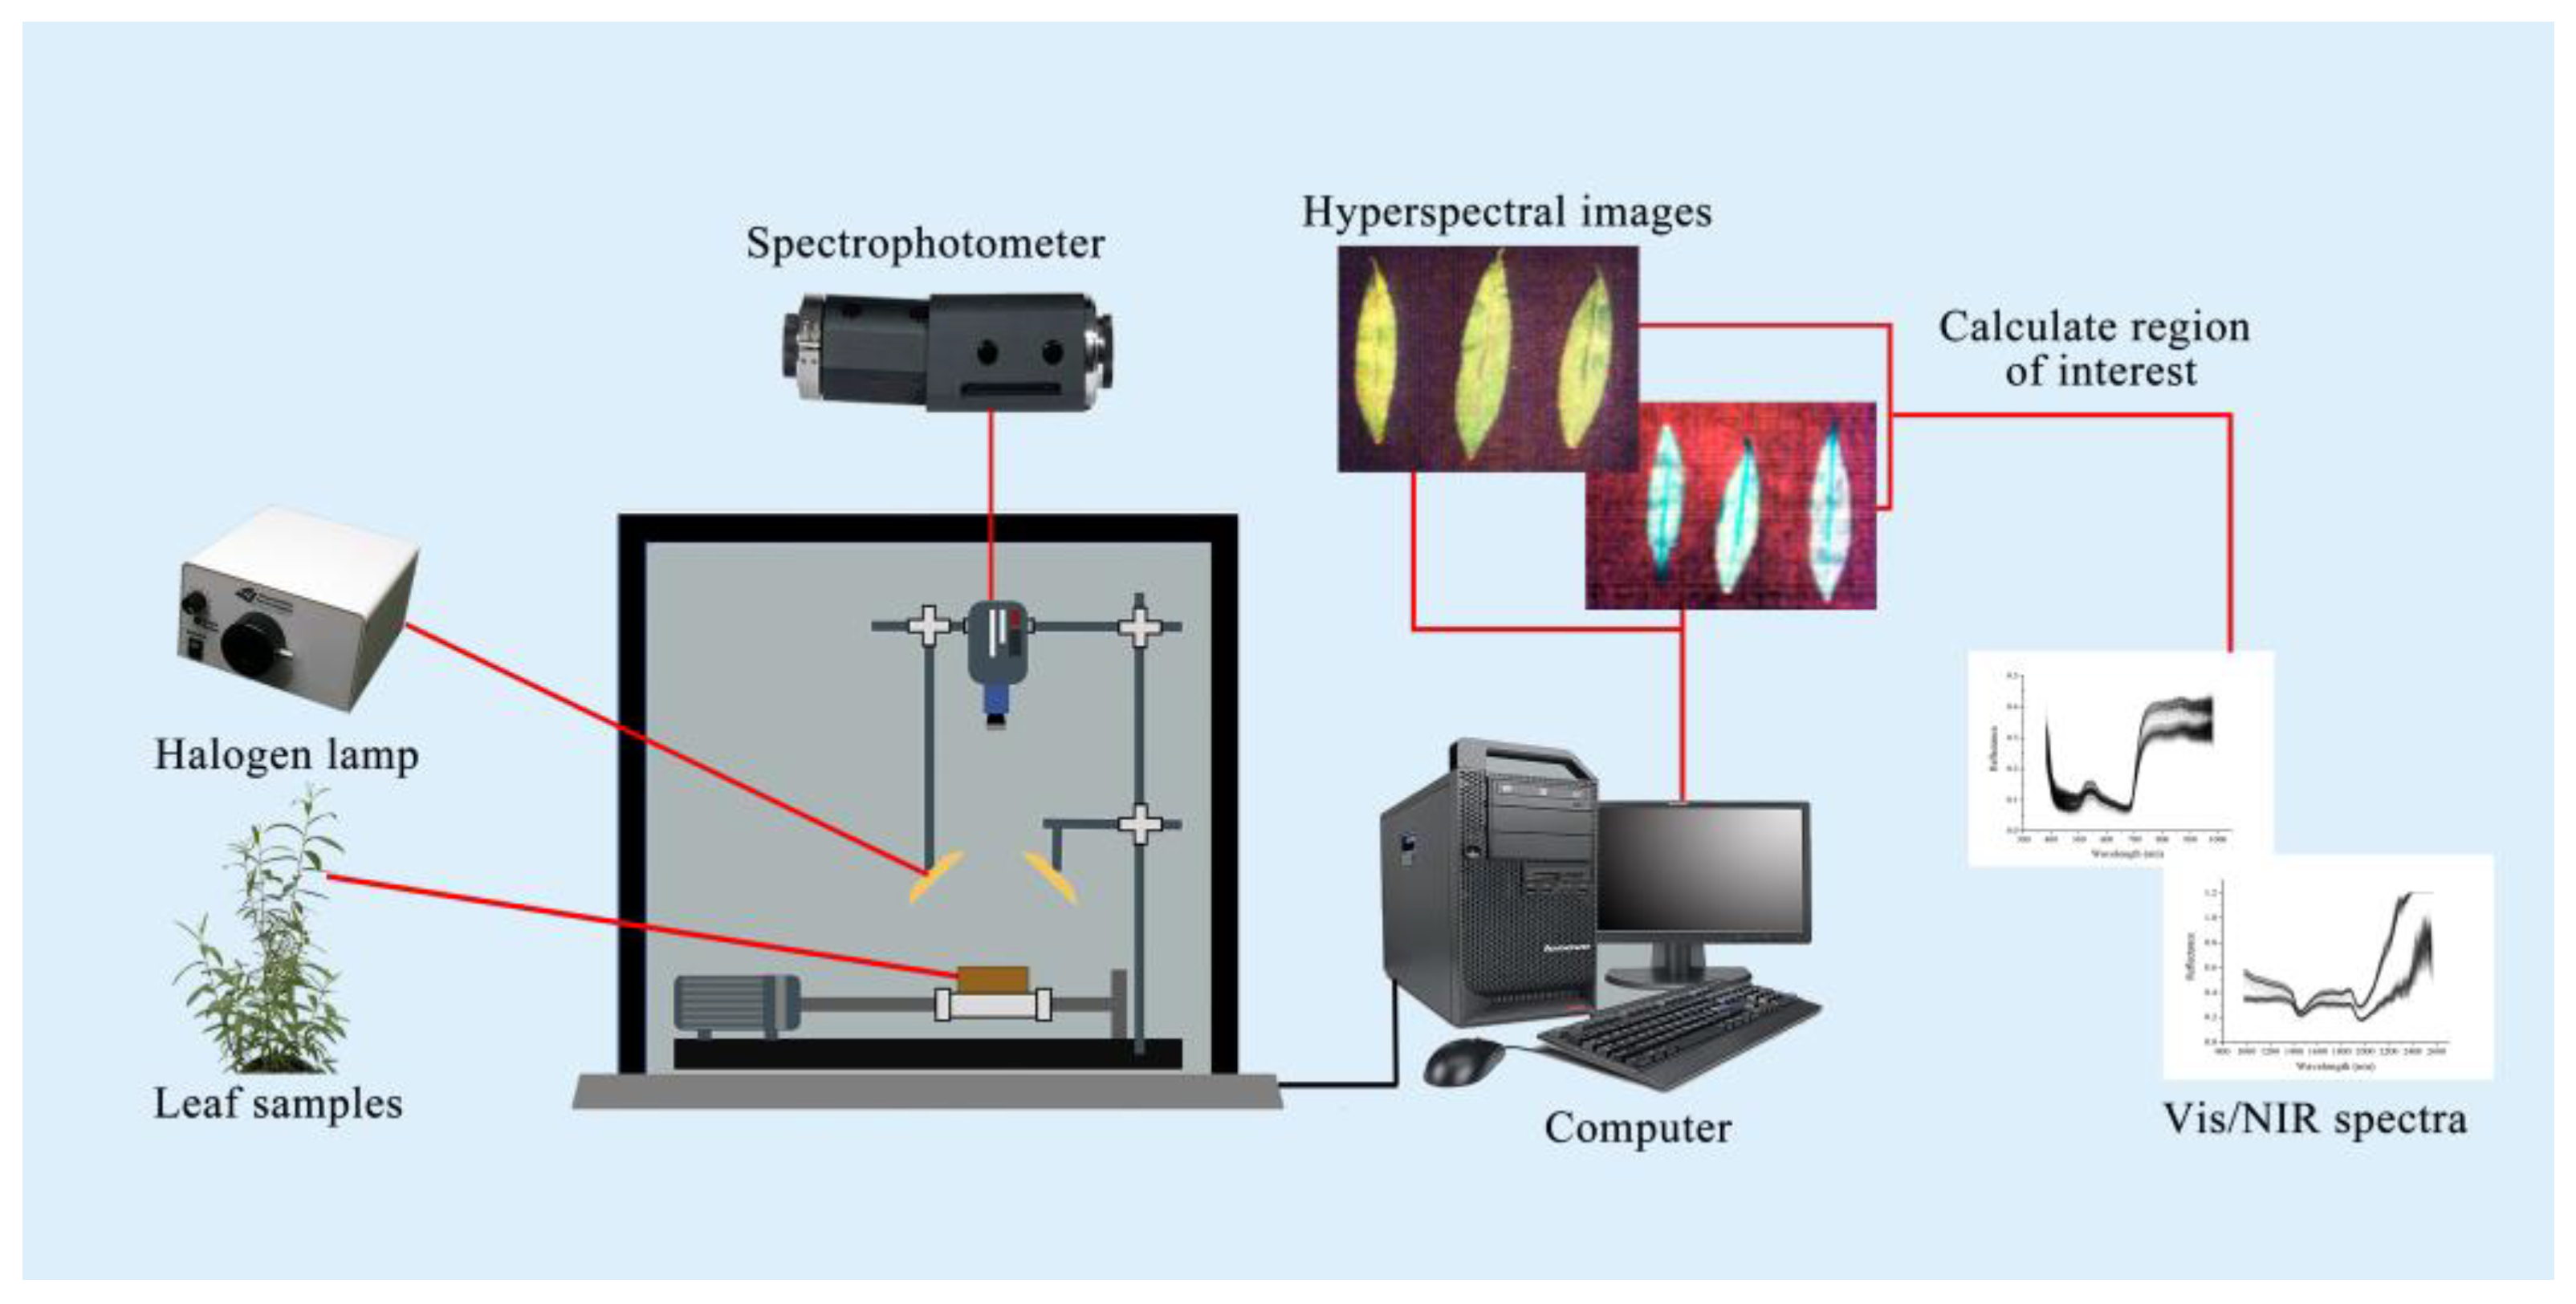
To acquire Vis/NIR spectra of leaf samples, the experiment was conducted in a controlled darkroom equipped with a Vis/NIR-HSI system (Headwall Photonics, Bolton, MA, USA). Illumination was provided by a 350 W halogen lamp (Illumination Technologies, Irvine, CA, USA), positioned at a 45-degree angle, with the leaf surface maintained 350 mm from the light source. The spectroradiometer, set approximately 170 mm from the leaf surface, recorded reflectance across a wavelength range of 383–2562 nm, with a spectral resolution of 1.4 nm for the Vis spectrum and 6.2 nm for the NIR spectrum. The spatial resolution of the HSI system was 0.5 mm/pixel.
To optimize imaging conditions, the halogen lamp was preheated for 15 min prior to data collection. Calibration involved capturing a black reference image (blocking the camera lens) and a white reference image (Teflon plate with 99.9% reflectance). During scanning, leaves were placed on a black background to ensure consistent reflectance measurements. After completing image correction, the Region of Interest (ROI) for each sample image was selected using ENVI 5.3 software, and the average reflectance spectrum of the ROI was calculated as the characteristic spectrum of the sample. The experimental configuration of the Vis/NIR-HSI system is depicted in
Figure 1.
Spectral data were collected to monitor physiological changes in Salix matsudana × alba under salt stress. The Vis spectrum (383–982 nm) captured pigment-related changes, such as variations in chlorophyll content, while the NIR spectrum (982–2562 nm) detected molecular vibrations indicative of water content, structural carbohydrates, and other cellular components. These features are critical for assessing leaf physiological status.
Sampling occurred at five time intervals: 3 days (T1), 10 days (T2), 17 days (T3), 24 days (T4), and 31 days (T5) after initiating salt stress. At each interval, fully expanded mature leaves (third to fourth from the apex) were scanned. To enhance data reliability, five spectra were collected per leaf and averaged to reduce noise and improve signal consistency. Spectral scanning was conducted within one hour of leaf collection to minimize water loss and ensure that the physiological state of the leaves was accurately reflected in the spectral data.
This approach enabled the detailed detection of spectral features, enhancing the precision and robustness of salt stress monitoring. The collected data serve as a foundation for predictive models, offering valuable insights into the physiological responses of Salix matsudana × alba to salt stress.
2.4. Data Analysis
The data analysis focused on exploring the relationships between physiological measurements and hyperspectral data to understand the impact of salt stress on Salix matsudana × alba and to develop predictive models for stress monitoring. The analysis process followed a series of steps, as outlined below.
First, Pearson correlation coefficients were calculated to examine the linear relationships between spectral reflectance values and physiological indicators. This analysis helped identify key wavelengths that were strongly correlated with specific physiological parameters, thus revealing the spectral regions most sensitive to different levels of salt stress.
Using these key wavelengths, PLSR was applied to develop models for predicting physiological parameters based on hyperspectral data. In this analysis, spectral data served as independent variables, while physiological indicators (e.g., chlorophyll content, proline concentration, and antioxidant enzyme activities) were the dependent variables. The performance of the PLSR models was evaluated using several metrics, including the coefficient of determination (R2), mean squared error (MSE), and mean absolute error (MAE), providing valuable insights into the complex relationships between spectral features and physiological responses under varying stress conditions.
In this study, spectral data preprocessing included SG smoothing for noise reduction, MSC to correct scattering effects, SNV transformation to remove baseline shifts and scaling differences, normalization to standardize reflectance intensity, and the SPA for optimal wavelength selection. These preprocessing steps enhanced spectral data quality, reduced variability unrelated to physiological conditions, and improved the robustness and accuracy of subsequent classification models.
Subsequently, three machine learning models (PLS-DA, SVM, and CNN) were employed to classify plant samples into different levels of salt stress. The dataset, consisting of 360 samples, was randomly divided into a clearly defined training set (240 samples) and an independent validation set (120 samples) to objectively evaluate model performance. Cross-validation was utilized during model training for hyperparameter optimization, while model robustness and overfitting were assessed through consistent performance across training and independent validation datasets. PLS-DA models effectively distinguished between control, low, moderate, and high salt stress groups, enabling accurate classification of stress levels. The SVM model, a supervised machine learning algorithm, was chosen for its ability to handle high-dimensional data, identifying optimal hyperplanes that maximized class separation.
The CNN model, which combines both spectral and spatial information from hyperspectral data, was designed to automatically extract features and perform hierarchical learning. As detailed in
Table 1, the CNN architecture consists of two 1D convolutional layers with 16 and 32 filters, respectively, followed by max-pooling layers with a pool size of 2. A fully connected layer with 128 neurons processes extracted features before classification in the output layer. The model was trained using the Adam optimizer with a learning rate of 0.0009 and cross-entropy as the loss function. The performance of all models was evaluated based on several metrics, including accuracy, precision, recall, and F1-score, demonstrating their robustness in identifying different levels of salt stress.
By integrating physiological measurements with statistical and machine learning techniques, this study provided a detailed understanding of Salix matsudana × alba’s physiological responses to salt stress. The combined use of correlation analysis, PLSR, preprocessing, PLS-DA, SVM, and CNN facilitated a comprehensive analysis of the intricate relationships between spectral data and plant physiology, highlighting the potential of HSI for precise stress detection and classification.
3. Results
3.1. Physiological Responses to Salt Stress
Salt stress induced significant changes in various physiological parameters of
Salix matsudana ×
alba (
Figure 2). Photosynthetic parameters, including Pn, Tr, and Gs, declined significantly with increasing salt stress. Specifically, Pn decreased from 14.5 µmol m⁻
2 s⁻
1 in the control group (CK) at T1 to 6.1 µmol m⁻
2 s⁻
1 under high salt stress (ST3) at T5, reflecting a marked reduction in photosynthetic efficiency as salt stress intensified.
Chlorophyll content also decreased significantly under salt stress. For example, Chl decreased from 1.28 mg g⁻1 fresh weight (FW) in CK at T1 to 0.75 mg g⁻1 FW in ST3 at T5. Similar trends were observed for Chl b and total chlorophyll, further indicating impaired photosynthetic pigment synthesis under salt stress conditions. These findings are consistent with the reduction in photosynthetic efficiency observed in the physiological data.
Osmotic adjustment substances, such as soluble sugar, generally decrease with increasing salt concentration. Soluble sugar content decreased from 416 µmol/g FW in CK at T1 to a lower value in ST3 at T5 (261 µmol/g FW). Conversely, proline content increased as an adaptive response to osmotic stress, from 20 µg g⁻1 FW in CK at T1 to 40.8 µg g⁻1 FW in ST3 at T5, reflecting the plant’s mechanism for maintaining cellular turgor and stability under salt stress.
The activities of key antioxidant enzymes, including POD, SOD, and CAT, initially increased in response to salt stress, reaching peak levels before declining over time. Specifically, POD activity rose from 73 U/g FW protein in CK at T1 to a peak of 133 U/g FW protein in ST3 at T3, before decreasing at T4. Similarly, SOD and CAT activities followed a similar pattern, initially increasing significantly to counteract oxidative damage and then declining as the stress persisted.
Membrane permeability, indicated by electrolyte leakage, increased with salt concentration and duration. At T1, it was 18.2% in CK, rising to 41.9% in ST3 by T5, highlighting the effect of salt stress on cell membrane integrity. MDA content, a marker for lipid peroxidation and oxidative stress, also increased from 34.2 nmol g⁻1 FW in CK at T1 to 85.6 nmol g⁻1 FW in ST3 at T5. Leaf water content decreased significantly in the salt-treated groups, from 84.5% in CK at T1 to 67.8% in ST3 at T5, further reflecting the detrimental effect of salt stress on water retention.
Correlation analysis revealed several significant relationships among the physiological indices under salt stress (
Figure 3). SOD and POD activities exhibited a strong positive correlation (r ≈ 0.8), suggesting that these enzymes cooperate in counteracting oxidative stress. Soluble protein content was positively correlated with photosynthetic parameters such as Pn and Gs, highlighting the critical role of soluble proteins in maintaining photosynthetic efficiency under stress conditions.
Ci and MDA content showed a positive correlation with chlorophyll content, suggesting that increased oxidative stress and CO2 retention might contribute to enhanced chlorophyll synthesis under certain stress conditions. Membrane permeability was strongly positively correlated with MDA content and proline content, emphasizing the role of membrane stability and osmotic adjustment in the plant’s stress response.
The chlorophyll a/b ratio was negatively correlated with soluble sugar content and water content, suggesting that changes in pigment composition are linked to alterations in the plant’s water and sugar regulation under salt stress. Tr and Pn were negatively correlated, indicating that the relationship between these two physiological processes is affected by salt stress, where reduced gas exchange may limit photosynthesis.
Overall, the analysis highlighted the intricate network of physiological adjustments that Salix matsudana × alba employs to cope with salt stress, emphasizing the interdependence of photosynthesis, antioxidant defense, and osmotic regulation mechanisms.
3.2. Spectral Curves
The spectral curves of
Salix matsudana ×
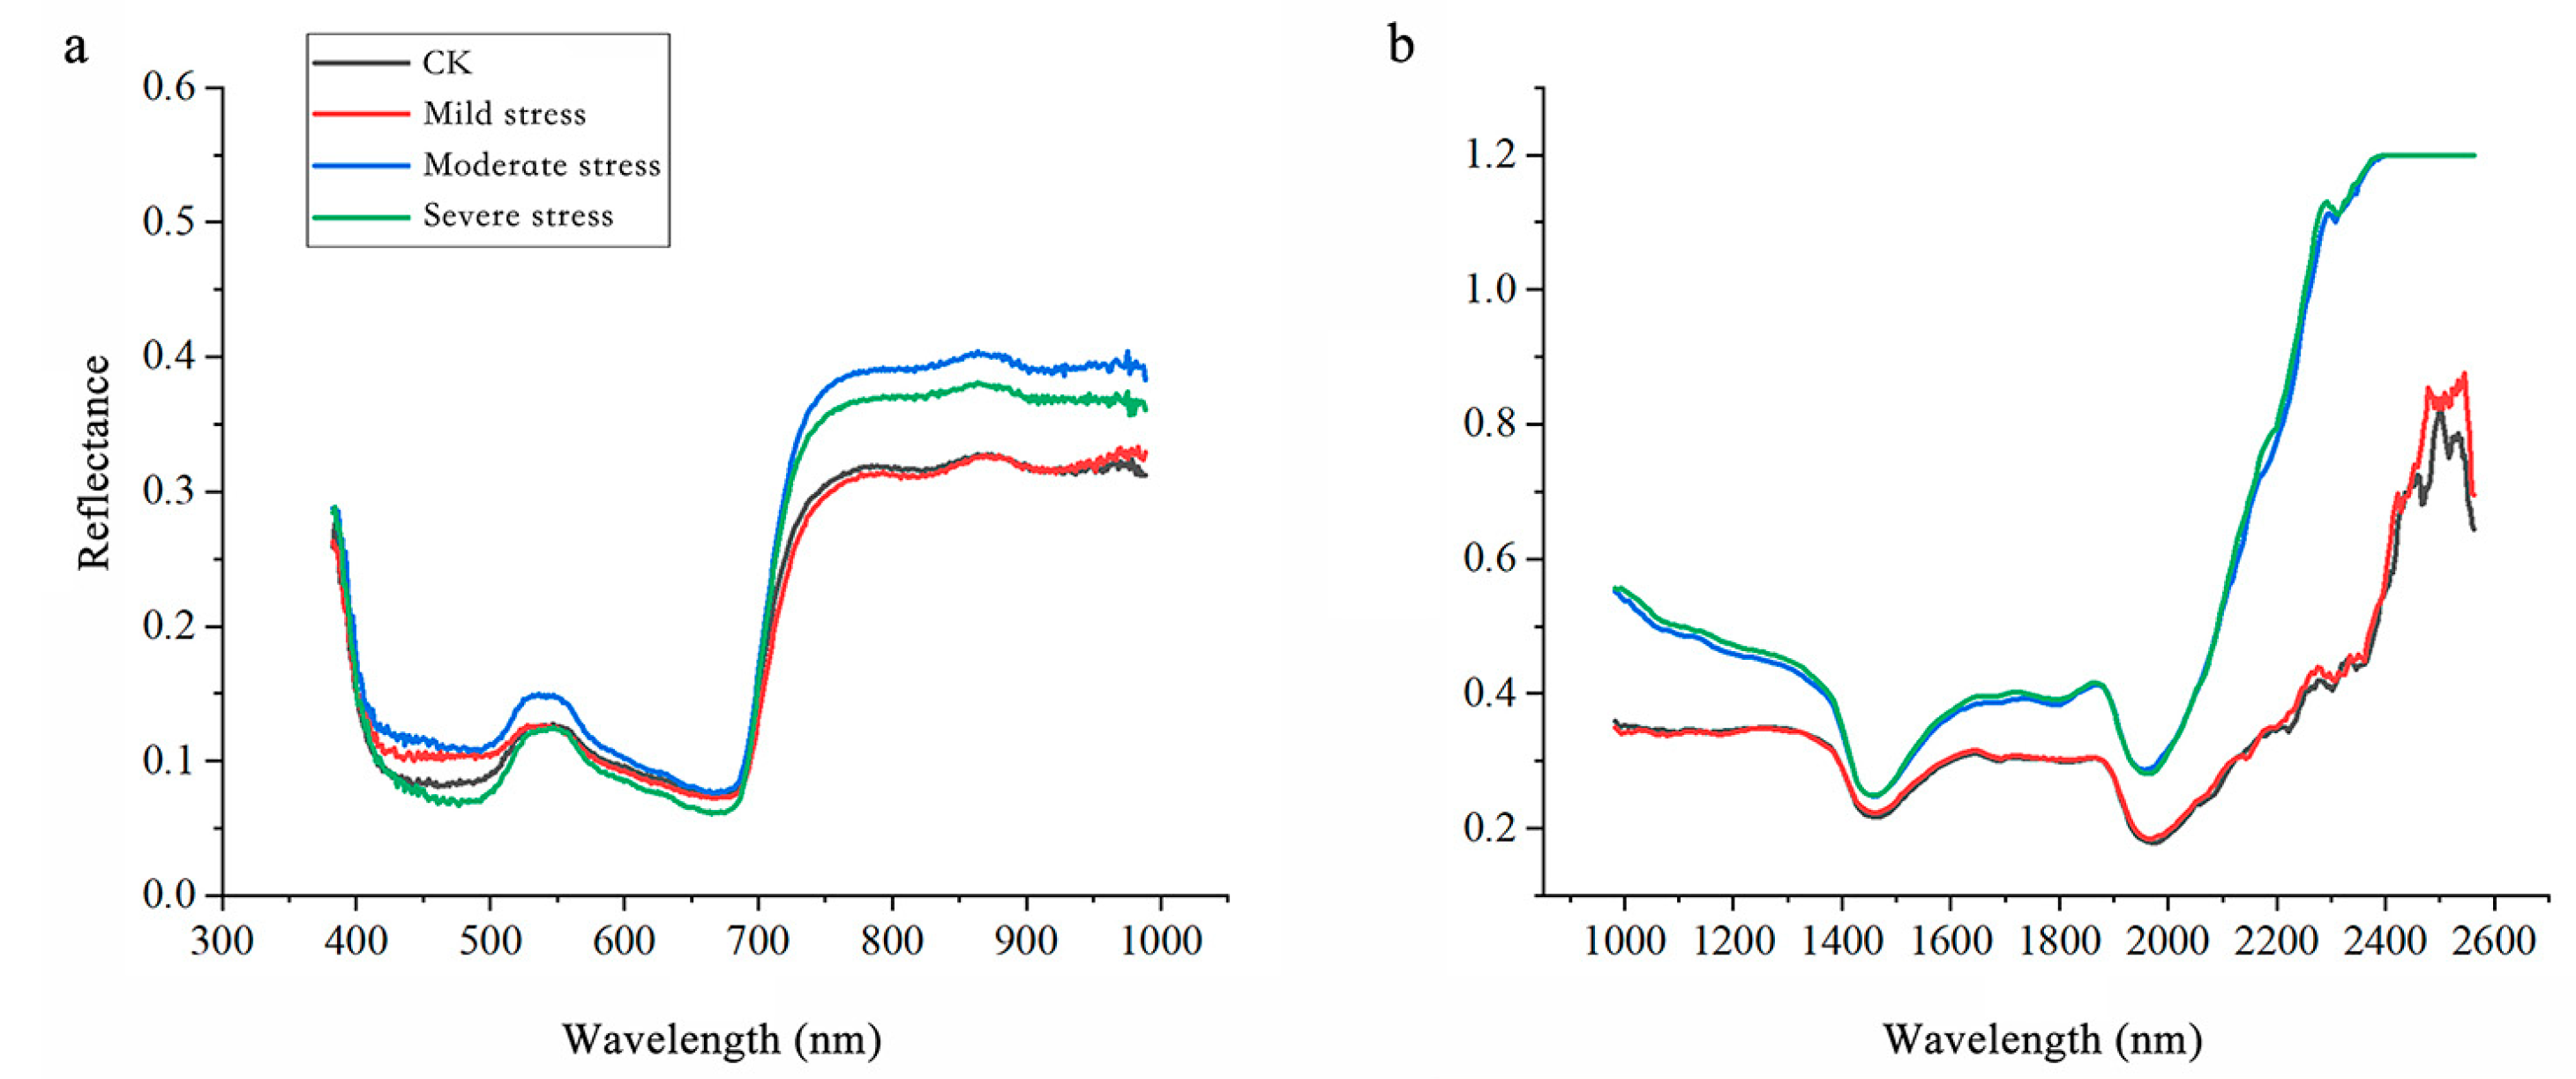
alba under salt stress exhibited noticeable changes, as illustrated in
Figure 4. In the Vis spectrum, reflectance increased consistently with higher stress levels, particularly in the green (550 nm) and red-edge (680 nm) regions. This trend reflects a reduction in chlorophyll content, as salt stress accelerates pigment degradation, impairing the leaf’s ability to absorb light in these wavelengths [
24]. The elevated reflectance aligns with physiological observations indicating a decrease in photosynthetic pigments, further corroborating the decline in photosynthetic efficiency [
25,
26].
In the NIR spectrum, reflectance also increased progressively with salt stress severity. This behavior is closely linked to structural and physiological changes in the leaves, including reduced water content and disrupted cellular integrity [
27,
28]. Under normal conditions, intact cell structures and adequate hydration result in higher NIR absorption, producing lower reflectance values [
29]. Conversely, salt-stressed leaves with diminished water retention and structural integrity reflect more NIR light, particularly under severe stress conditions. This trend underscores the profound impact of salt stress on leaf structural and water-related properties. Meanwhile, Reflectance peaks near 1450 nm and 1940 nm, corresponding to water absorption bands, increased under severe stress, reflecting significant water loss in the leaves. Additionally, the elevated reflectance in the 2200–2500 nm range, associated with cell wall components such as cellulose and lignin, highlights structural modifications induced by salt stress.
These spectral shifts emphasize the physiological and structural responses of Salix matsudana × alba to salt stress. The increased reflectance in the Vis spectrum indicates pigment degradation and reduced light absorption, while the NIR spectral changes reveal critical information about water content and leaf structure. By analyzing these patterns, it is possible to develop precise models for detecting and quantifying salt stress, aiding in effective monitoring and resource management for this species.
3.3. Correlation Between Hyperspectral Data and Physiological Parameters
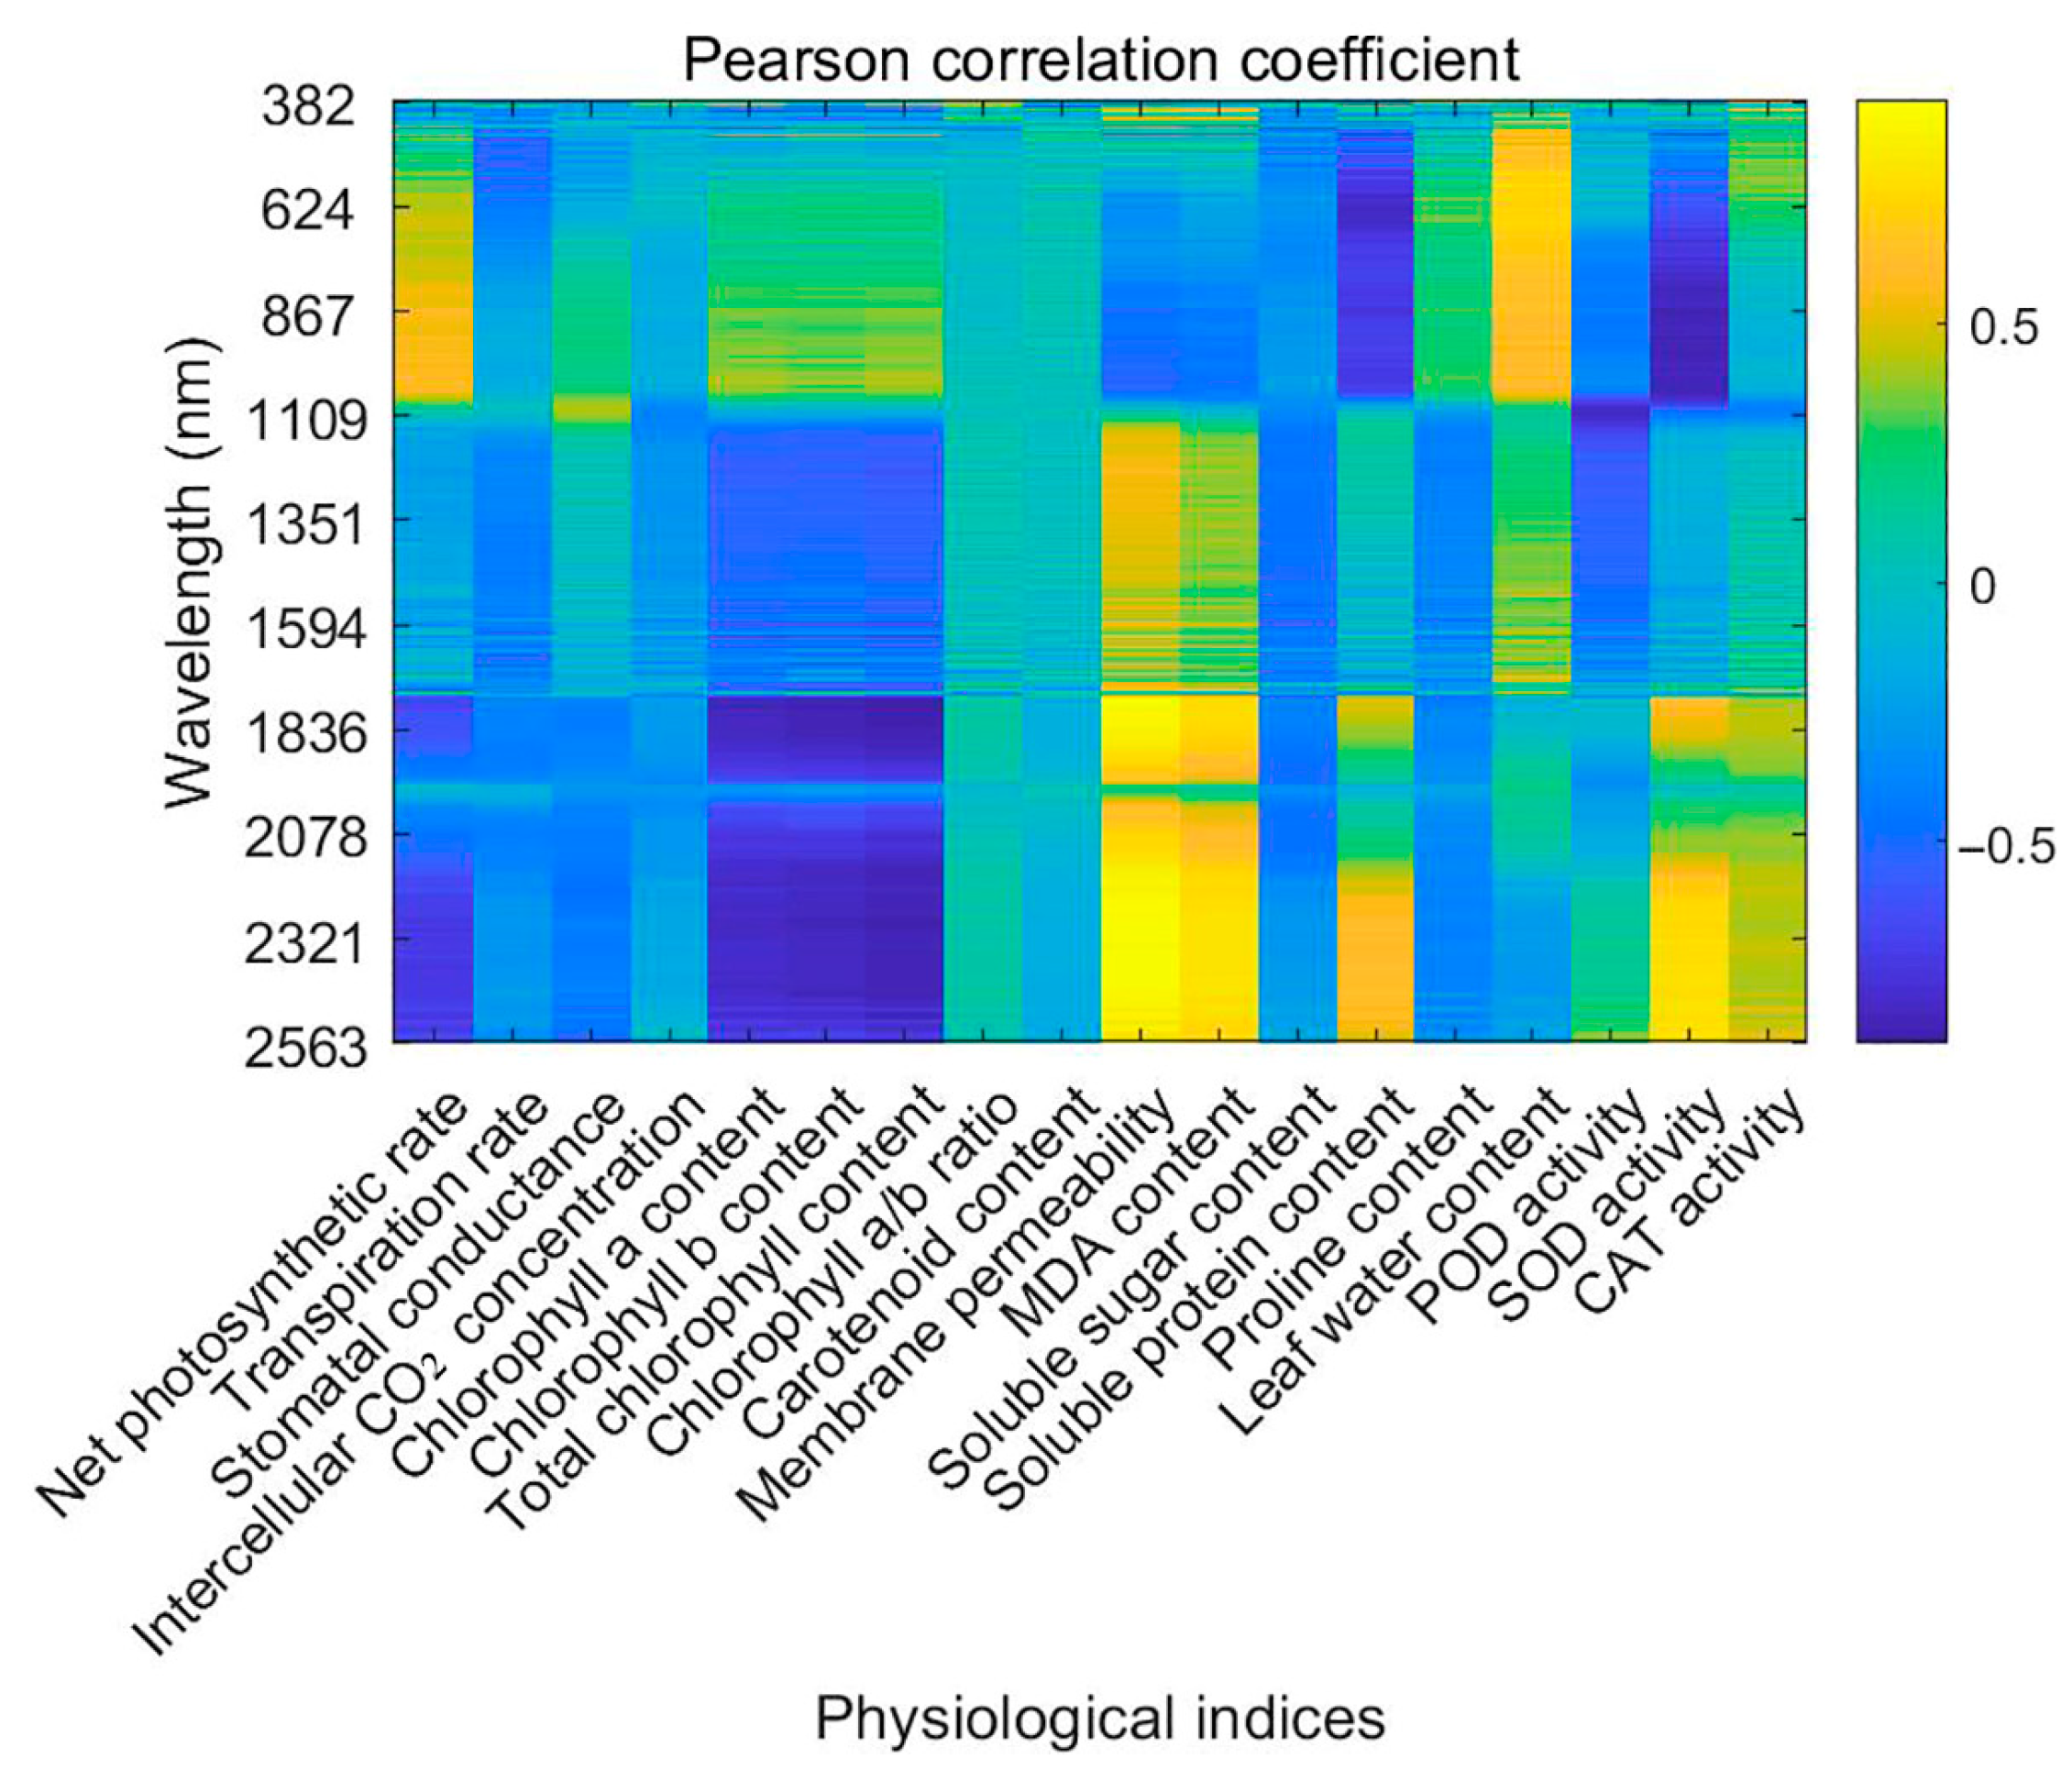
The correlation analysis between hyperspectral reflectance and physiological parameters under salt stress revealed significant associations, as summarized in
Figure 5. Pearson correlation coefficients were employed to quantitatively evaluate linear associations between spectral reflectance and physiological indicators, providing an objective and statistically robust method for identifying key wavelengths sensitive to physiological changes induced by salt stress. Reflectance within the 382–400 nm range exhibited a negative correlation with Pn, suggesting that salt stress reduces photosynthetic efficiency through mechanisms such as stomatal closure and pigment degradation. Conversely, Ci displayed a positive correlation in the same range, likely due to CO
2 accumulation caused by reduced Gs.
Chl a content demonstrated a strong positive correlation with reflectance in the 400–700 nm range, particularly at 450–470 nm, highlighting its influence on visible light absorption. In contrast, Chl b content showed a negative correlation in this range, indicating that reductions in Chl b under salt stress alter spectral reflectance patterns. Total chlorophyll content was closely linked to reflectance in the visible spectrum, further emphasizing the impact of stress on pigment concentration.
Carotenoid content showed negative correlations with reflectance at 450–470 nm, reflecting its role in protecting photosynthetic systems under stress. Tr presented complex correlations, with both positive and negative relationships across the 400–700 nm range, indicative of salt stress’s multifaceted effects on water use efficiency and Gs. Leaf water content correlated positively with reflectance at 750–800 nm, underlining the impact of water status on NIR reflectance.
Membrane permeability was strongly correlated with reflectance in the 1450–1550 nm range, indicating its sensitivity to stress-induced changes in cell membrane stability. MDA content, indicative of lipid peroxidation, exhibited a positive correlation with mid-infrared reflectance, linking oxidative stress to spectral characteristics.
Reflectance in the 1900–2100 nm range was highly correlated with soluble sugar and protein contents, reflecting changes in solute accumulation under stress. Proline content exhibited a positive correlation in the 750–800 nm range, highlighting its role as an osmotic regulator.
Specific spectral bands reflect biochemical changes related to enzyme activity [
30]. However, hyperspectral measurements cannot directly capture enzyme catalytic rates and rely on indirect indicators such as pigment content and oxidative stress markers. Environmental factors like temperature and humidity may also affect spectral signals, requiring biochemical validation for accuracy. In this study, POD activity correlated negatively with reflectance at 1900–2100 nm, while SOD and CAT activities showed strong correlations in both mid- and far-infrared regions, indicating their involvement in oxidative stress mitigation.
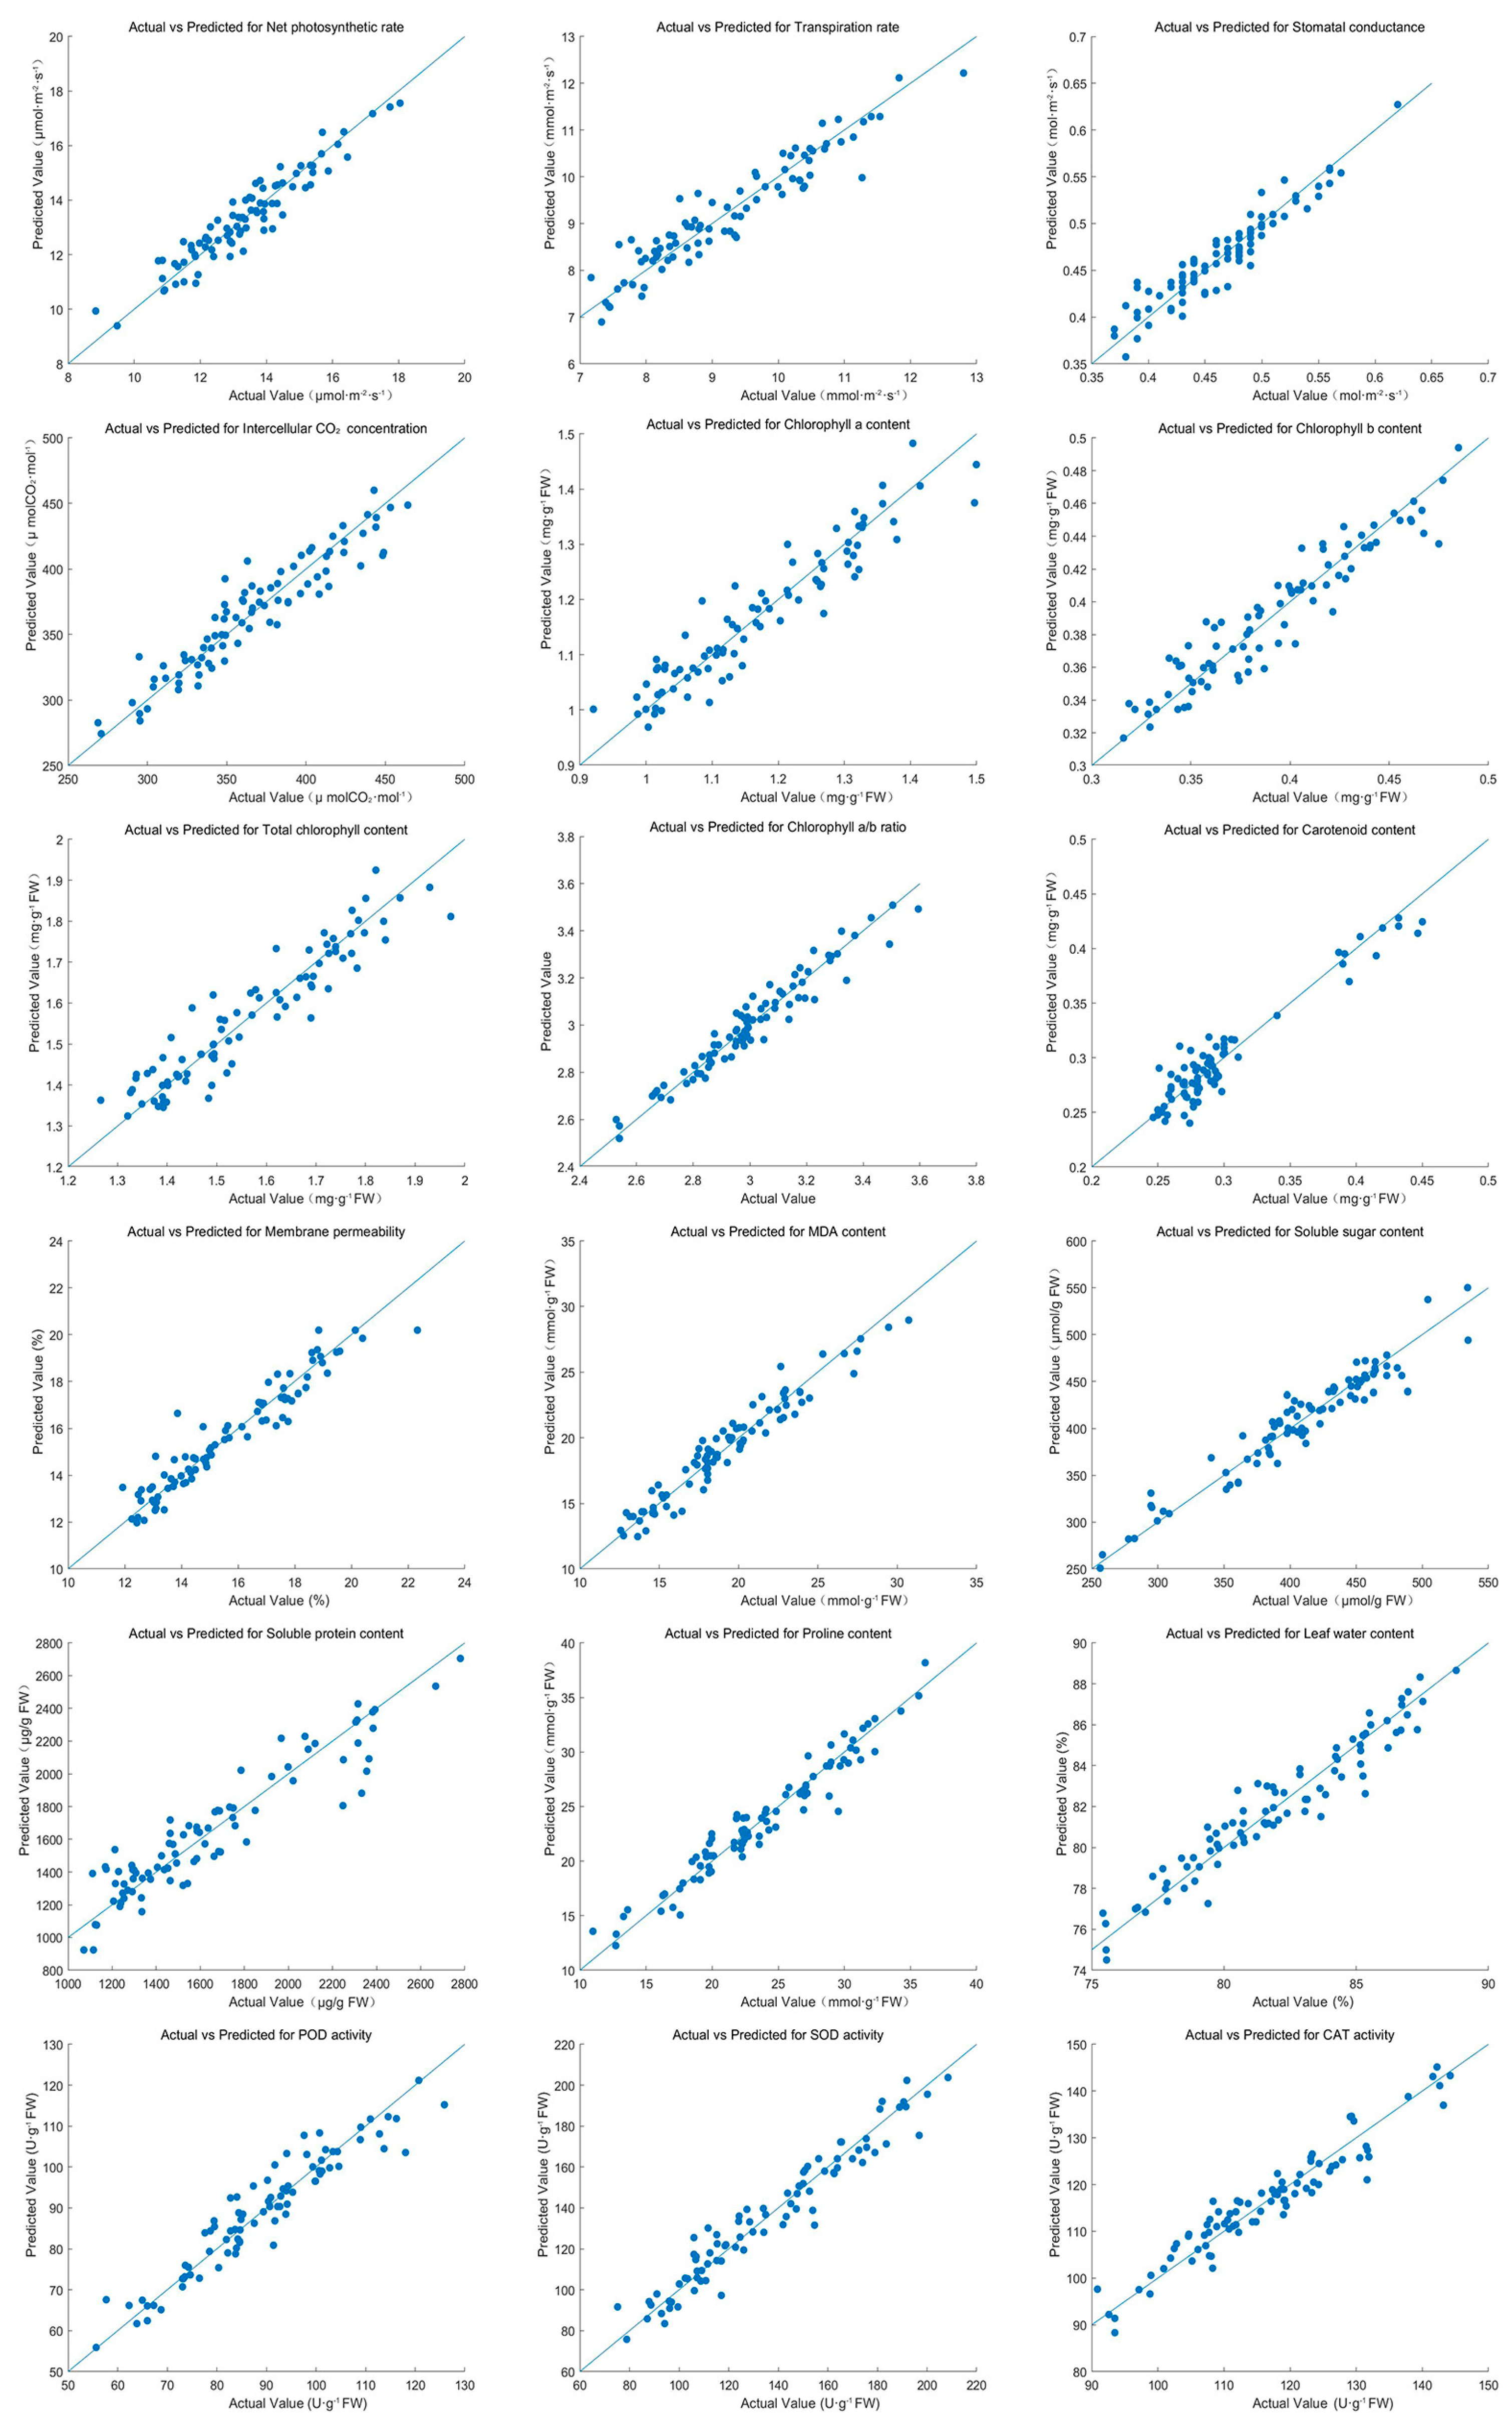
PLSR analysis revealed strong linear relationships between hyperspectral data and physiological indices under salt stress (
Figure 6,
Table 2). The predictive accuracy of the models was evaluated using R
2, MSE, and MAE values. Pn achieved an R
2 of 0.89, with corresponding MSE and MAE values of 0.11 and 0.25, respectively. Tr and Gs also exhibited high predictive accuracy, with R
2 values of 0.88 and 0.90.
Chl a and b, as well as total chlorophyll content, achieved R2 values of 0.95 and 0.96, reflecting excellent model performance. The chlorophyll a/b ratio had a slightly lower R2 of 0.82, but still demonstrated reasonable accuracy. Carotenoid content, membrane permeability, and MDA content were effectively predicted, with R2 values ranging from 0.92 to 0.96. Soluble sugar and protein contents achieved high R2 values of 0.94 and 0.96, respectively.
Proline content and leaf water content achieved R2 values of 0.93 and 0.92, underscoring the model’s capability to predict osmotic adjustment and water status. Antioxidant enzyme activities, including SOD, POD, and CAT, showed exceptionally high predictive accuracy, with SOD achieving an R2 of 0.97.
These findings demonstrate the efficacy of HSI in monitoring and predicting the physiological responses of Salix matsudana × alba under salt stress. The strong correlations between predicted and observed values across various indices highlight the potential of hyperspectral imaging for precise stress assessment and management. Due to experimental limitations, in situ hyperspectral measurements were not possible, and spectra were instead collected from freshly harvested leaves. While this approach ensured data reliability, future studies incorporating in situ measurements would provide even more accurate insights by capturing real-time physiological responses without potential post-harvest alterations.
3.4. Discriminative Modeling Results
Discriminative models, including PLS-DA, SVM, and CNN, were developed to classify salt stress levels in Salix matsudana × alba using spectral data from the Vis, NIR, and combined Vis+NIR ranges. To improve model performance, various preprocessing techniques—such as SG smoothing, MSC, SNV, normalization, and SPA—were systematically evaluated.
The results revealed that the choice of spectral range and preprocessing method significantly influenced model accuracy (
Table 3 and
Table 4). For PLS-DA and SVM models, the NIR spectral range demonstrated superior performance. This can be attributed to the NIR region’s ability to capture critical information about leaf water content and structural integrity, which are closely linked to salt stress. Notably, for PLS-DA, the raw NIR data provided the best classification results, indicating that the unprocessed spectra retained sufficient features for accurate discrimination of stress levels.
The CNN model achieved exceptional performance when combining Vis+NIR data with SNV preprocessing. It attained 100% classification accuracy for both training and validation datasets. SNV preprocessing proved highly effective in minimizing irrelevant spectral variations, enabling CNN to fully leverage the complex spectral-spatial relationships within the data. While MSC preprocessing also enhanced CNN performance, it fell short of the flawless accuracy observed with SNV.
The comparison of spectral ranges highlighted the advantages of combining Vis and NIR data for CNN models. The Vis range primarily captured pigment-related changes, such as variations in chlorophyll and carotenoid content, while the NIR range provided insights into structural and water-related changes. By integrating these two spectral regions, the combined Vis+NIR data offered a more comprehensive physiological representation of the plant’s response to salt stress, leading to superior classification outcomes.
Performance metrics further underscored the effectiveness of these models. The CNN model using Vis+NIR data achieved high accuracy, precision, recall, and F1 score, making it a robust choice for salt stress classification. In contrast, the SVM model, when applied to spectral data from the NIR band with appropriate preprocessing methods, showed relatively suboptimal performance. The CNN model, which outperformed all other models, demonstrated the power of deep learning in extracting and utilizing intricate patterns in hyperspectral data. The architecture of the CNN was specifically designed to handle hyperspectral datasets, allowing it to exploit both spectral and spatial features, which are critical for accurately detecting stress-induced changes.
These findings underline the potential of HSI combined with advanced machine learning techniques for precision monitoring of salt stress. The ability of the CNN model to achieve perfect classification accuracy demonstrates the utility of deep learning in handling complex plant stress responses. Such models offer significant advantages for real-time monitoring and early detection, which are essential for precision forestry management.
4. Discussion
4.1. Physiological Adaptations to Salt Stress
Salt stress had a profound impact on the physiological performance of
Salix matsudana ×
alba, as reflected by marked reductions in photosynthetic parameters (Pn, Tr, Gs) and chlorophyll content, coupled with significant increases in proline accumulation and the activities of key antioxidant enzymes (SOD, CAT, POD). These responses represent adaptive mechanisms that enable the plant to mitigate the osmotic and oxidative stress induced by salt exposure. The decline in photosynthetic capacity can be attributed to stomatal closure and disruptions in the photosynthetic apparatus, both of which restrict carbon dioxide assimilation and impair the synthesis of essential pigments [
31].
Proline accumulation and heightened antioxidant enzyme activities underscore the plant’s strategic adjustments to counteract osmotic imbalances and minimize oxidative damage. These adaptations help maintain cellular stability by scavenging ROS and preserving metabolic functions. Meanwhile, the observed increase in MDA levels and membrane permeability highlights the extent of lipid peroxidation and cell membrane disruption caused by salt-induced stress, pointing to significant cellular damage [
1].
The decline in chlorophyll content, a key indicator of photosynthetic efficiency, is particularly notable as it directly impacts plant growth and vitality. Chlorophyll degradation under saline conditions can be attributed to oxidative stress, where excess ROS leads to structural damage in chloroplasts, impairing photosynthetic capacity [
32]. Concurrently, the activation of antioxidant defenses, as evidenced by increased SOD, CAT, and POD activities, demonstrates the plant’s ability to neutralize ROS and protect cellular integrity.
These physiological responses provide crucial insights into how Salix matsudana × alba adapts to saline environments. By enhancing osmotic regulation and activating antioxidative defense systems, the plant demonstrates resilience in the face of adverse conditions. Understanding these mechanisms is vital for developing salt-tolerant plant varieties and contributing to sustainable agricultural and forestry practices in saline-affected regions.
4.2. Hyperspectral Indicators of Salt Stress in Plants
The correlation analysis between hyperspectral reflectance and physiological parameters revealed strong and significant relationships, highlighting the potential of HSI for assessing plant responses to salt stress. Among the spectral regions analyzed, the NIR range showed a particularly strong correlation with leaf water content. This finding underscores the sensitivity of NIR reflectance to changes in internal water status, as water molecules strongly absorb NIR radiation. Such a correlation makes NIR reflectance an effective and reliable indicator for detecting variations in leaf hydration levels under salt stress conditions [
30].
In the Vis spectrum, significant correlations were observed between reflectance and chlorophyll content, especially in the green (550 nm) and red-edge (680 nm) regions. These spectral bands are directly influenced by chlorophyll concentration, as chlorophyll absorbs light in these wavelengths for photosynthetic processes. Any reduction in chlorophyll content due to salt stress is, therefore, readily detectable through changes in reflectance in these regions.
The observed correlations between spectral data and physiological parameters provide a solid foundation for non-invasive monitoring of plant health. By detecting stress-induced changes in leaf pigments and water content before visible symptoms appear, HSI offers a powerful tool for real-time assessment of plant physiological status. Additionally, hyperspectral reflectance data were validated against biochemical and physiological measurements such as chlorophyll content, antioxidant enzyme activities, proline levels, and leaf water content, confirming the physiological relevance and reliability of spectral interpretations. These insights contribute to a deeper understanding of how environmental stressors, such as salinity, influence plant function, and they emphasize the utility of HSI in precision forestry.
4.3. Model Performance Across Spectral Ranges and Preprocessing Methods
The discriminative models developed in this study exhibited varied performance depending on the spectral range and preprocessing method employed. For PLS-DA and SVM, the NIR spectral range delivered the best results, demonstrating its sensitivity to changes in leaf water content and structural integrity. These physiological factors are pivotal under salt stress, as they indicate osmotic adjustments and cellular-level responses [
33]. The ability of the NIR region to capture these variations underscores its utility as a reliable indicator for assessing plant responses to salinity.
Interestingly, the PLS-DA model achieved optimal performance with raw NIR spectral data, without requiring any preprocessing. This suggests that the intrinsic features of the NIR spectra are inherently well-suited for distinguishing between different salt stress levels. The robustness of the raw NIR data makes it particularly valuable for rapid and straightforward applications in stress monitoring, minimizing the need for complex data processing.
In contrast, the CNN model attained its highest performance when combining Vis+NIR spectral data with SNV preprocessing, achieving 100% accuracy in both training and validation datasets. This result highlights the critical role of preprocessing in enhancing model performance, especially in deep learning tasks. SNV preprocessing effectively reduced noise and normalized the spectral data, enhancing the identification of relevant features [
34]. By leveraging this preprocessing technique, the CNN model was able to capture intricate spectral-spatial relationships associated with varying levels of salt stress.
The integration of Vis and NIR data proved to be a significant factor in improving model performance for CNN. While the Vis range primarily provided information on pigment-related changes, the NIR range captured variations in water content and leaf structure. This complementary information enabled the CNN to develop a more holistic understanding of plant physiological responses, leading to superior classification results. The combination of these spectral regions highlights the advantages of using multimodal data for nuanced and accurate stress classification tasks.
4.4. Practical Implications for Precision Agriculture and Forestry Management
The results of this study hold significant potential for advancing precision agriculture and forestry management. The integration of HSI with advanced machine learning models offers a robust approach to accurately identifying and classifying salt stress levels. Early detection of salt stress is critical for mitigating its impacts on crop yield and forest productivity. For example, the CNN model demonstrated exceptional accuracy, especially when utilizing combined Vis+NIR data with SNV preprocessing, showcasing its practical value in monitoring plant health and managing stress-prone areas.
The real-time application of HSI can revolutionize stress management by enabling precise and timely interventions. For instance, irrigation schedules can be adjusted dynamically based on stress severity, or targeted soil treatments can be implemented to counteract salinity. By focusing on stressed zones identified through HSI, land managers can avoid broad-spectrum measures, reducing costs and improving efficiency. These targeted actions not only enhance plant resilience and yield but also contribute to the sustainable use of natural resources by minimizing unnecessary interventions.
Moreover, the non-invasive nature of HSI aligns perfectly with modern sustainable agriculture practices. Unlike traditional destructive sampling techniques, HSI allows continuous monitoring without compromising plant health, offering a practical and environmentally friendly solution for large-scale plantations and forested areas. This capability is particularly valuable for managing ecosystems where early stress detection is essential to maintaining ecological balance and productivity. By integrating HSI into current agricultural and forestry workflows, stakeholders can adopt more informed and adaptive management strategies, ensuring long-term sustainability and resource optimization.
4.5. Limitations and Future Research Directions
The results of this study hold significant potential for advancing precision agriculture and forestry management. The integration of HSI with advanced machine learning models offers a robust approach to accurately identifying and classifying salt stress levels. Early detection of salt stress is critical for mitigating its impacts on crop yield and forest productivity. For example, the CNN model demonstrated exceptional accuracy, especially when utilizing combined Vis+NIR data with SNV preprocessing, showcasing its practical value in monitoring plant health and managing stress-prone areas.
The real-time application of HSI can revolutionize stress management by enabling precise and timely interventions. For instance, irrigation schedules can be adjusted dynamically based on stress severity, or targeted soil treatments can be implemented to counteract salinity. By focusing on stressed zones identified through HSI, land managers can avoid broad-spectrum measures, reducing costs and improving efficiency. These targeted actions not only enhance plant resilience and yield but also contribute to the sustainable use of natural resources by minimizing unnecessary interventions.
However, despite the promising results obtained in this laboratory study, several challenges exist when transitioning to practical field conditions. First, although the leaf sampling in this study was designed to simulate natural variability through random sampling from fully expanded mature leaves, the controlled laboratory conditions inevitably limited variability within treatments compared to actual field situations. In practical scenarios, increased variability among leaves, individual plants, and environmental conditions (e.g., differences in leaf angle, age, shading, and environmental stress levels) may significantly affect hyperspectral measurements and model performance. Additionally, shifting from leaf-level to canopy-level or satellite-level monitoring introduces substantial complexity, as the spectral signals will integrate multiple layers of leaves and possibly mixed vegetation types, further complicating stress detection. Moreover, the spatial resolution of HSI used in this study was sufficient for leaf-level detection but may present limitations for field-scale applications. In field conditions, heterogeneity in leaf morphology, overlapping vegetation, and mixed spectral signals from diverse plant structures could significantly reduce classification accuracy.
This study primarily utilized hyperspectral reflectance data and machine learning models to classify salt stress levels without explicitly testing traditional vegetation indices such as NDVI, PRI, or other spectral indices. While these indices have been widely applied in remote sensing for vegetation health assessment, HSI provides a more detailed spectral profile that enables direct data-driven classification of stress levels. Future studies could investigate the integration of hyperspectral-derived vegetation indices with machine learning models to further enhance salt stress detection accuracy. Additionally, expanding this methodology to other plant species with diverse morphological and physiological traits will require further validation, as variations in leaf structure, pigment composition, and stress response mechanisms may influence spectral reflectance patterns and classification performance. Species-specific calibration and model adaptation may be necessary to ensure accurate detection across different plant types and environmental conditions.
Therefore, future research should validate and optimize these laboratory-derived models under actual field conditions, possibly using field-based portable HSI systems or unmanned aerial vehicle (UAV)-mounted sensors. Addressing these limitations through field-scale trials will be critical to confirming the applicability and robustness of the developed methodology for broader agricultural and forestry management practices. Furthermore, future studies should assess the feasibility of applying this methodology across different plant species experiencing similar abiotic stress conditions. By incorporating diverse species and stress scenarios, researchers can refine classification models, improve generalizability, and enhance the potential of HSI for large-scale environmental monitoring and precision forestry.


