

Magnitude, Seasonality, and Drivers of Nocturnal Water Use in Three Subtropical and Tropical Plantations in Southern China

Abstract
1. Introduction

| Method | Theoretical Assumptions | Pros and Cons | Key References |
|---|---|---|---|
| Double sap flow curve separation | This method assumes the positive area of sap flow difference between the canopy and the base position to be nocturnal transpiration, while the negative area as assumed to be stem refilling. | This method has a solid physiological mechanism. However, installing the canopy probe is challenging as the position of the “canopy” is difficult to define, leading to a biased estimate of NT. | [9] |
| Empirical method based on VPD division | This method first identifies two consecutive days with similar daytime VPD but contrasting nighttime values (i.e., high VPD on the first day with low VPD on the second day). It then assumes the sap flow of the first night with high VPD to be the sum of both nocturnal transpiration and stem refilling, while the sap flow of the second night with low VPD is assumed to be stem refilling. | The method seems to overestimate both NT and SR. Moreover, its application is limited, as its necessitates two consecutive days with contrasting nighttime VPD. | [8] |
| Resistance network model separation | This method proposes a flow model that makes the ratio of storage to stem resistance a parameter based on a resistance network to separate stem refilling and nocturnal transpiration. | The method quantifies the time constant for refilling and not only infers integrals but also tracks the time courses of water loss. However, it requires two important model parameters that are difficult to obtain | [10] |
| Forecasted refilling | This method suggests that stem refilling and nocturnal transpiration can occur simultaneously. Based on the fitting curve of the declining part in the early nocturnal sap flow, it assumes the area below the curve to be stem refilling, while the area above is assumed to be nocturnal transpiration. | Owing to its reasonable mechanism and simplicity for operation, this method has been widely used to calculate stem refilling and nocturnal transpiration | [5,6,7,18,19,30] |
2. Materials and Methods
2.1. Study Sites and Plantations
2.2. Meteorological Data
2.3. Sap Flow Measurements
2.4. Sapwood Area
2.5. Calculation of Sap Flow
2.6. Calculation of Water Consumption
2.7. Differentiating Stem Refilling and Nocturnal Transpiration
2.8. Factor Analysis
3. Results
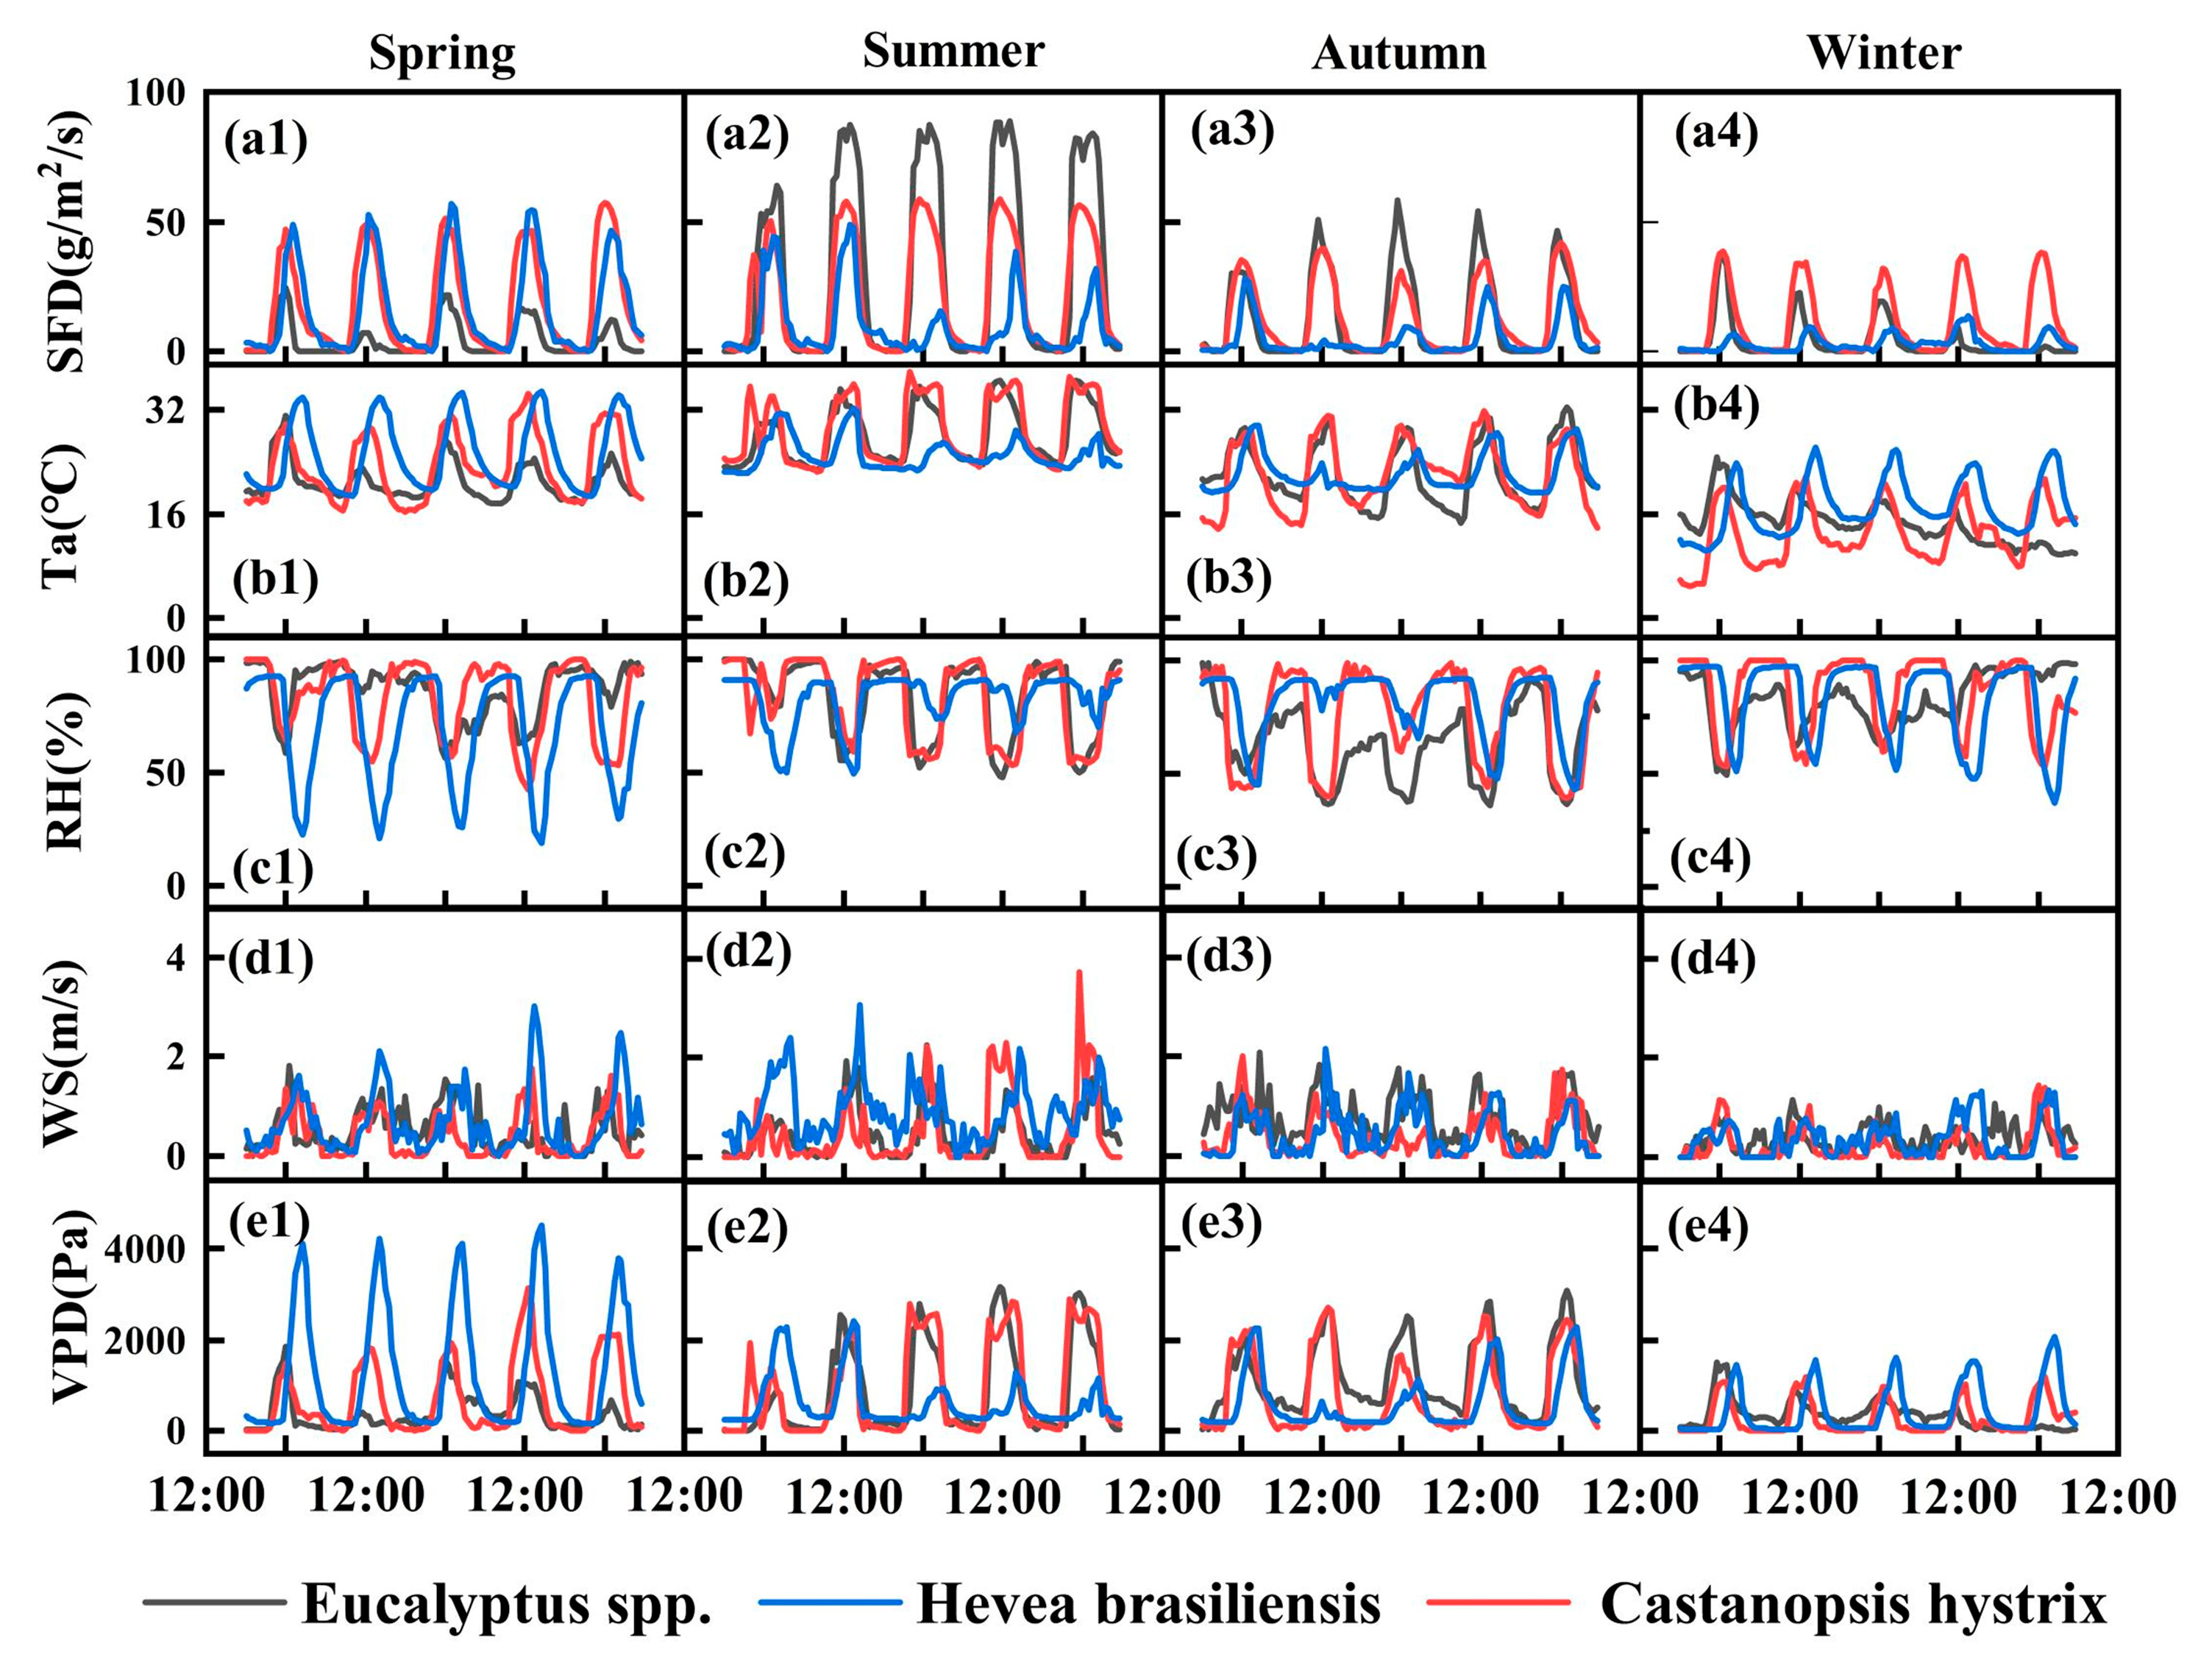
3.1. Climatic and Sap Flow Dynamics
3.2. Water Consumption of Different Plantations
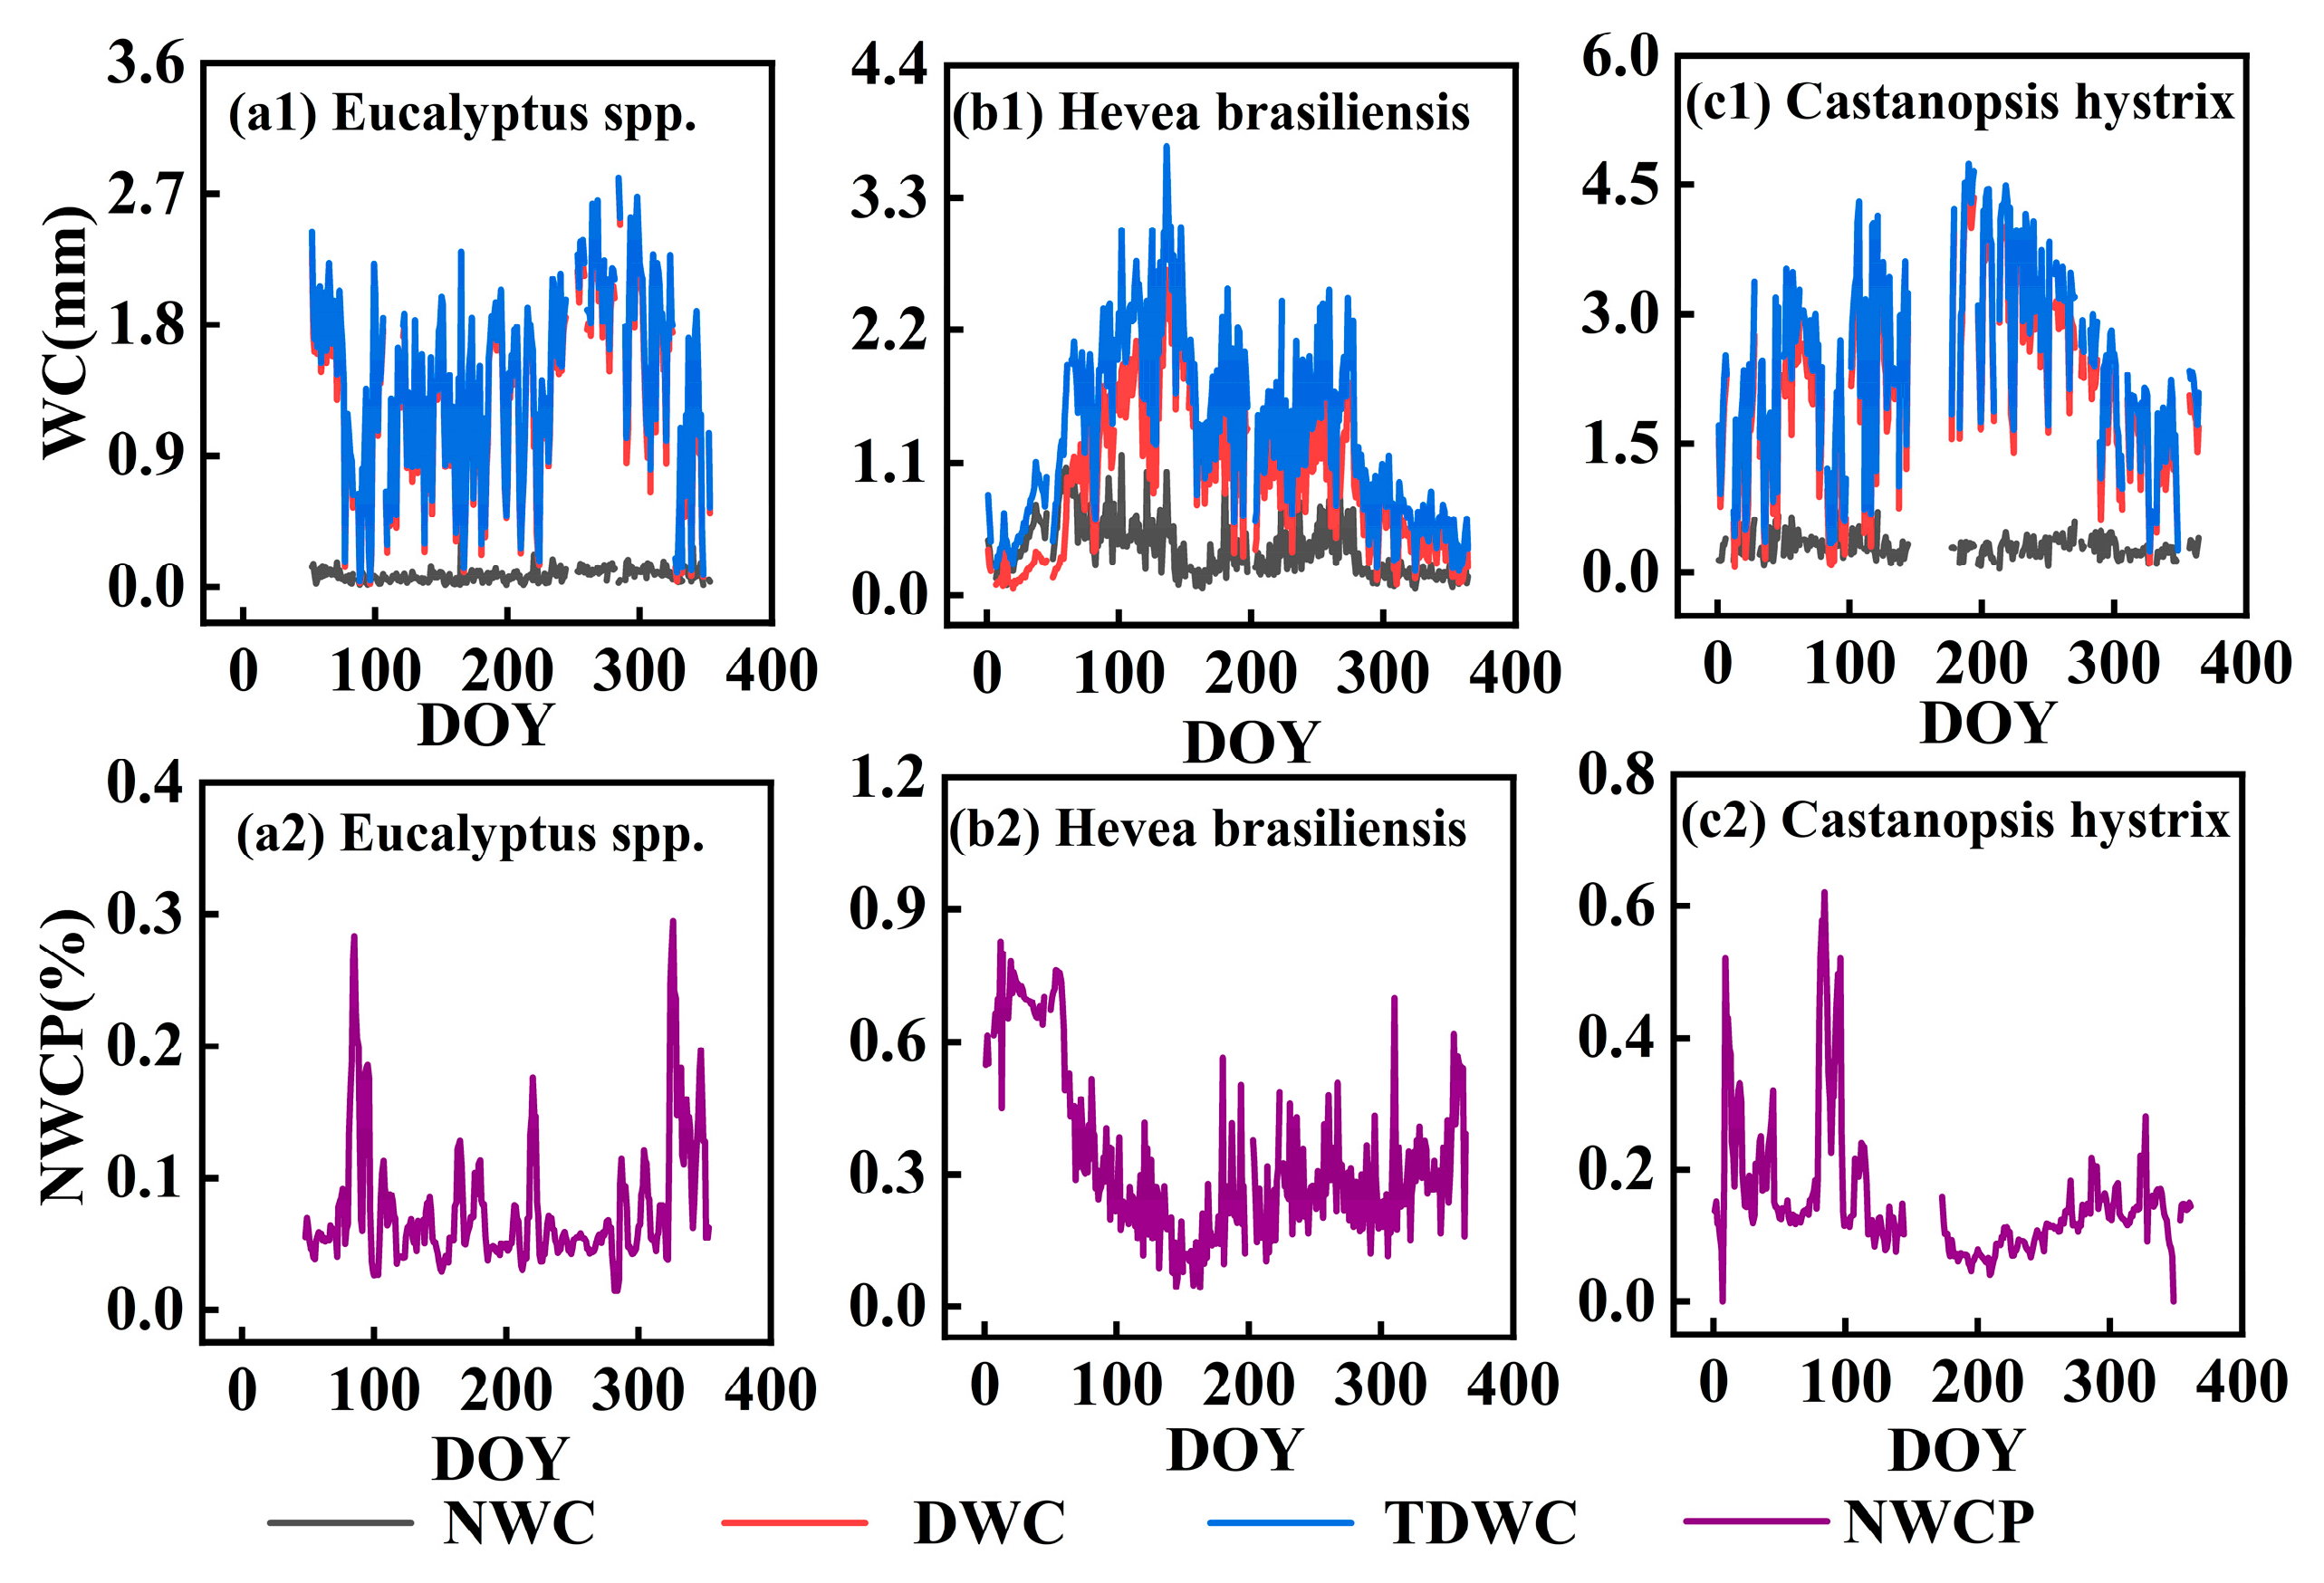
3.2.1. Nighttime, Daytime, and Total Daily Water Consumption
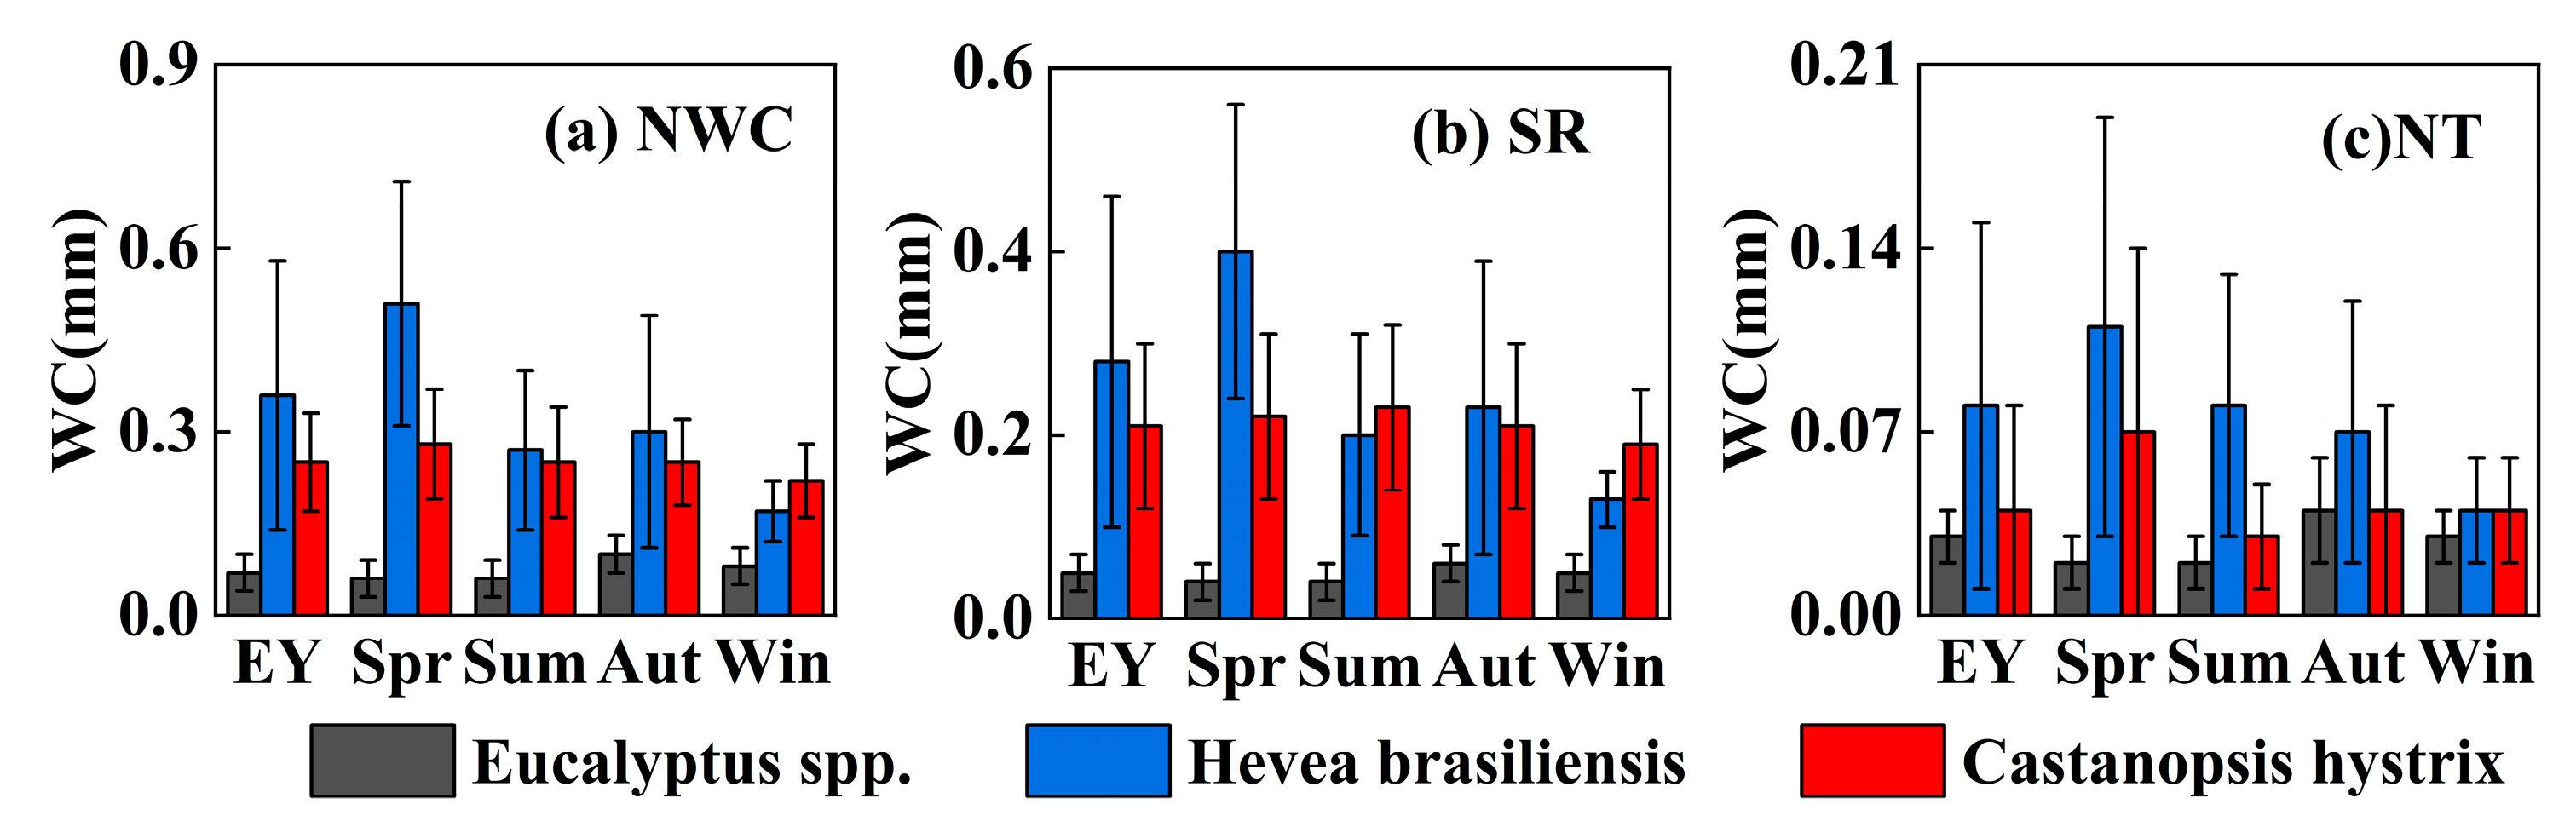
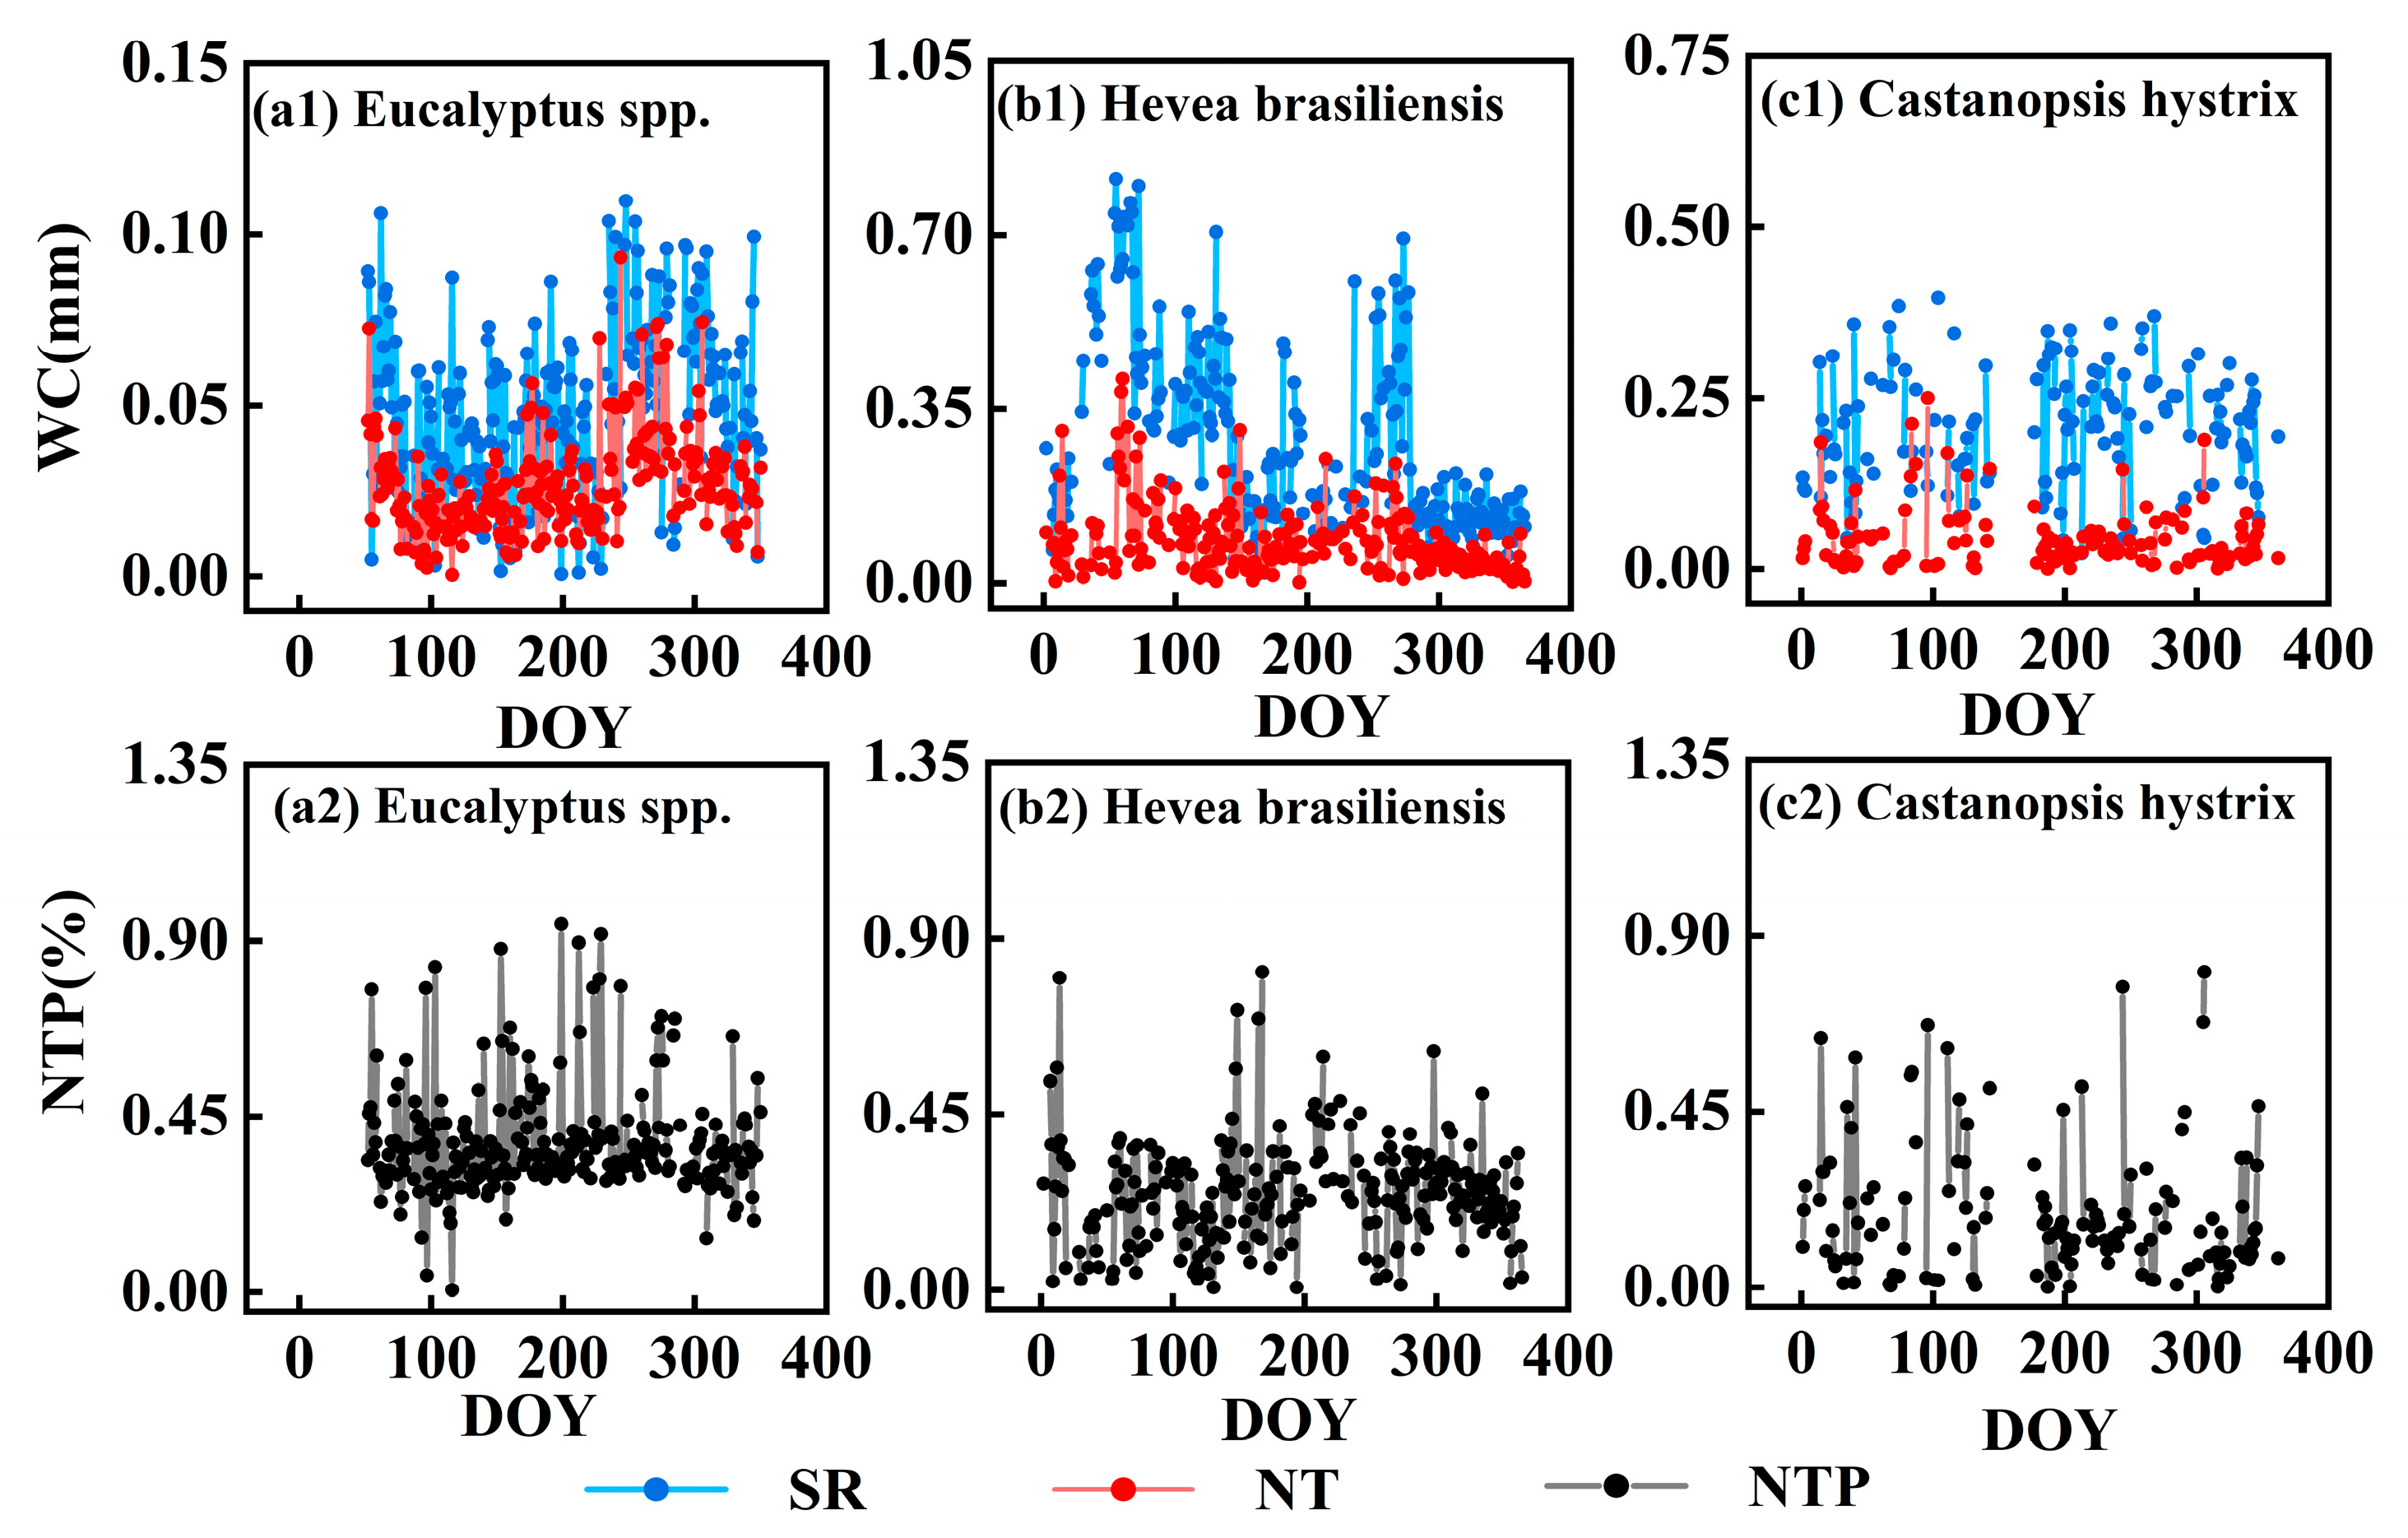
3.2.2. Nocturnal Transpiration and Stem Refilling
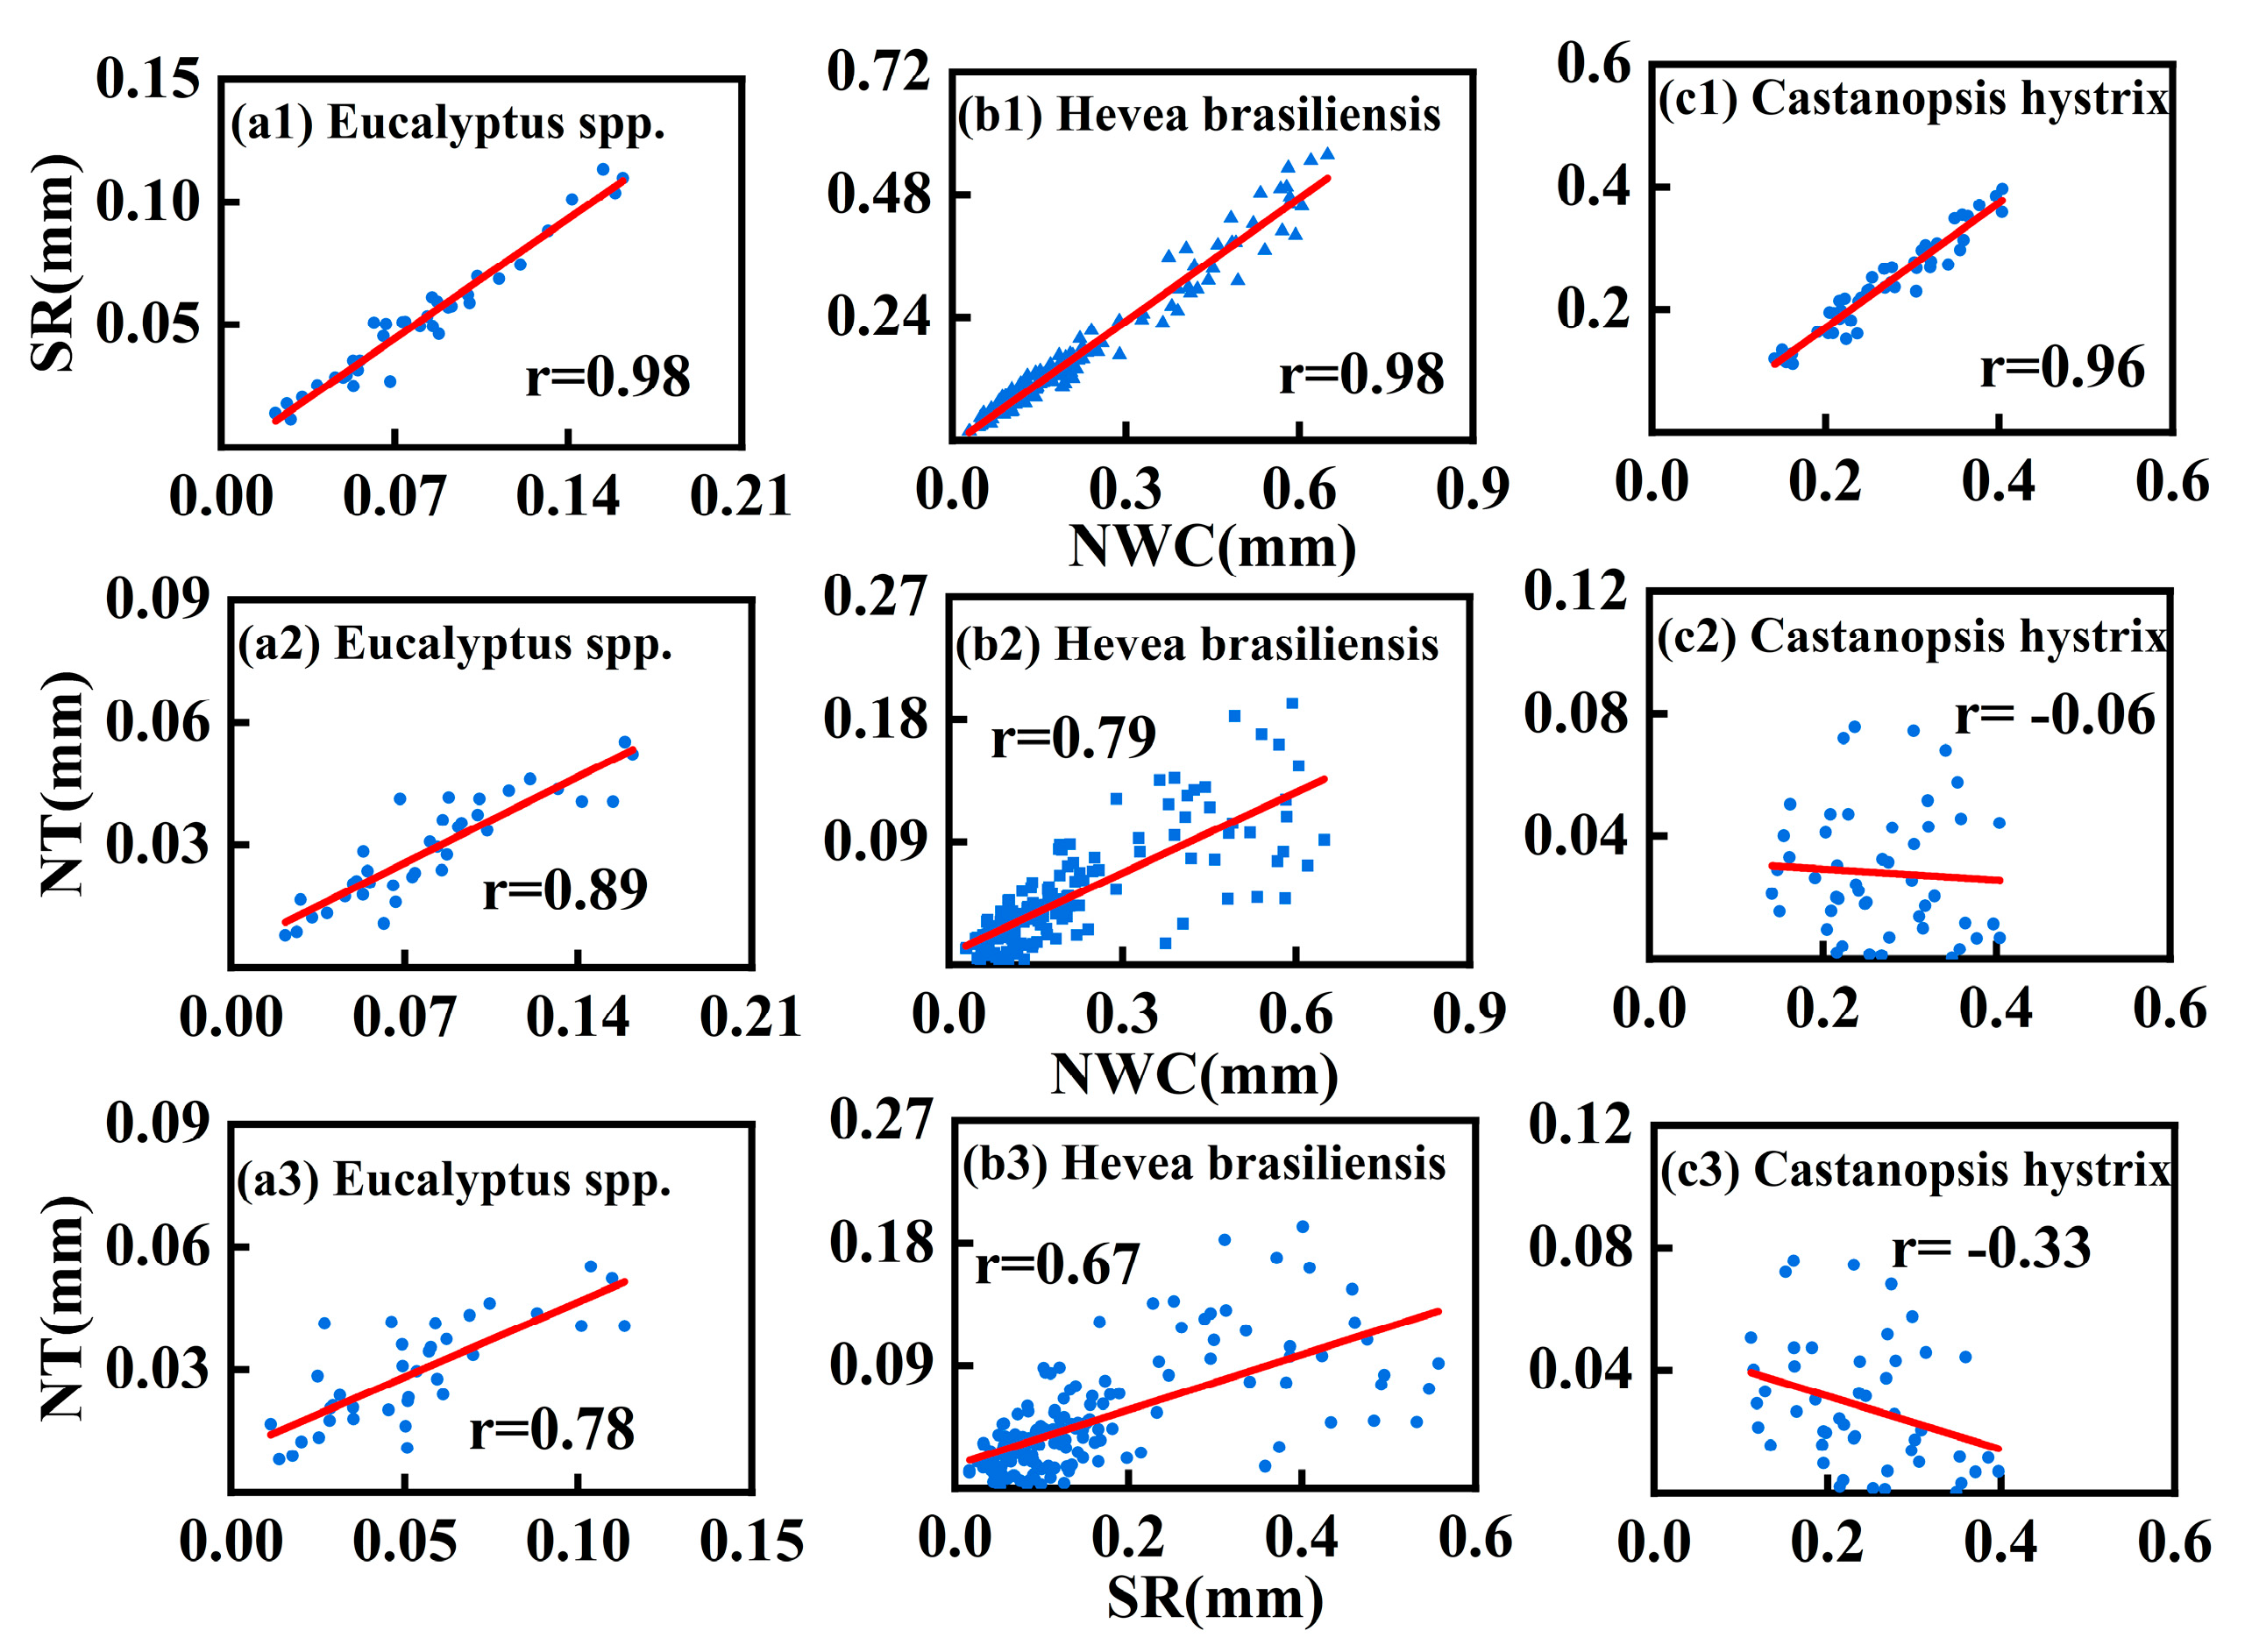
3.2.3. Correlations Between Nocturnal Water Consumption, Nocturnal Transpiration, and Stem Refilling
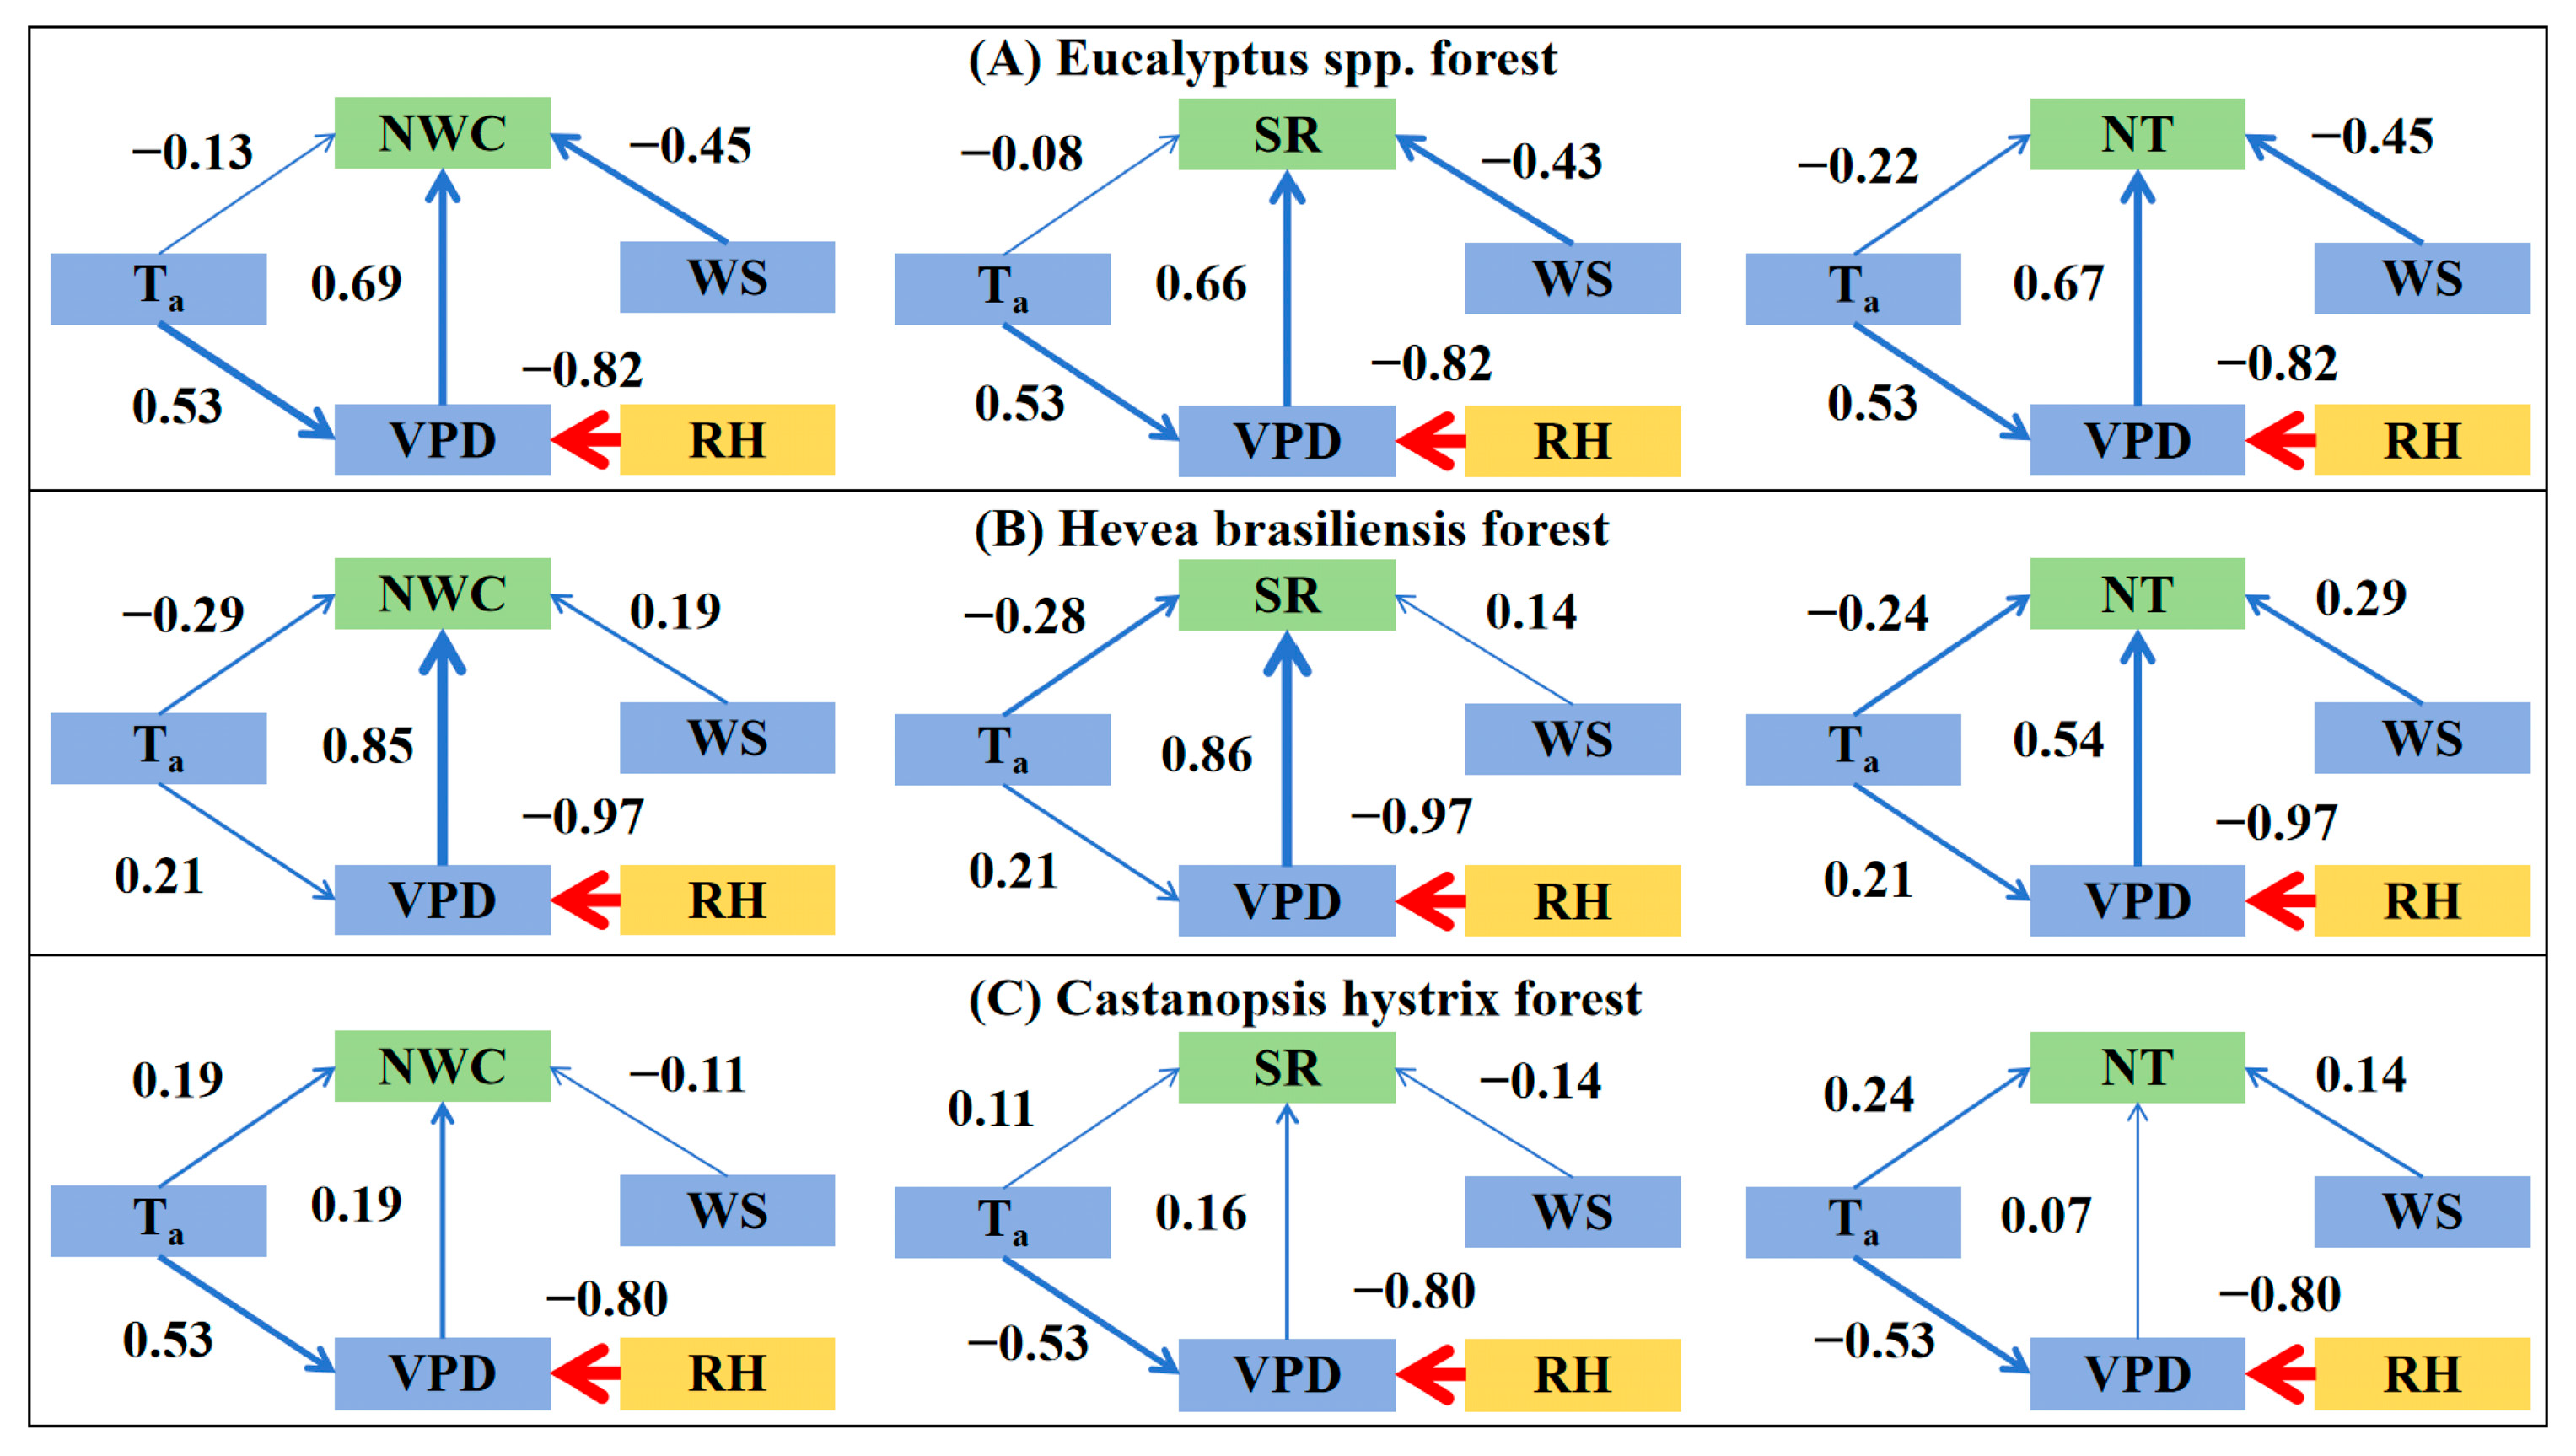
3.3. Driving Factors
3.3.1. Driving Factors for Nocturnal Water Consumption
3.3.2. Driving Factors for Nocturnal Transpiration
3.3.3. Driving Factors for Stem Refilling
4. Discussion
4.1. Nocturnal Water Consumption Behaviors Across Different Plantations
4.2. Driving Factors of Nighttime Water Consumption in Different Plantations
4.3. Implication and Future Direction
5. Conclusions
Author Contributions
Funding
Data Availability Statement
Acknowledgments
Conflicts of Interest
References
- Siddiq, Z.; Cao, K. Nocturnal Transpiration in 18 Broadleaf Timber Species under a Tropical Seasonal Climate. For. Ecol. Manag. 2018, 418, 47–54. [Google Scholar] [CrossRef]
- Goldstein, G.; Bucci, S.; Scholz, F. Why Do Trees Adjust Water Relations and Hydraulic Architecture in Response to Nutrient Availability? Tree Physiol. 2013, 33, 238–240. [Google Scholar] [CrossRef] [PubMed]
- Christman, M.; Donovan, L.; Richards, J. Magnitude of Nighttime Transpiration Does Not Affect Plant Growth or Nutrition in Well-Watered Arabidopsis. Physiol. Plant. 2009, 136, 264–273. [Google Scholar] [CrossRef] [PubMed]
- Zhao, C.; Si, J.; Feng, Q.; Yu, T.; Du Li, P. Comparative Study of Daytime and Nighttime Sap Flow of Populus Euphratica. Plant Growth Regul. 2017, 82, 353–362. [Google Scholar] [CrossRef]
- Fisher, J.; Baldocchi, D.; Misson, L.; Dawson, T.; Goldstein, A. What the Towers Don’t See at Night: Nocturnal Sap Flow in Trees and Shrubs at Two AmeriFlux Sites in California. Tree Physiol. 2007, 27, 597–610. [Google Scholar] [CrossRef]
- Yu, T.; Feng, Q.; Si, J.; Mitchell, P.; Forster, M.; Zhang, X.; Zhao, C. Depressed Hydraulic Redistribution of Roots More by Stem Refilling than by Nocturnal Transpiration for Populus Euphratica Oliv. in Situ Measurement. Ecol. Evol. 2018, 8, 2607–2616. [Google Scholar] [CrossRef]
- Wu, J.; Liu, H.; Zhu, J.; Gong, L.; Xu, L.; Jin, G.; Li, J.; Hauer, R.; Xu, C. Nocturnal Sap Flow Is Mainly Caused by Stem Refilling Rather than Nocturnal Transpiration for Acer Truncatum in Urban Environment. Urban For. Urban Green. 2020, 56, 126800. [Google Scholar] [CrossRef]
- Phillips, N.; Lewis, J.; Logan, B.; Tissue, D. Inter- and Intra-Specific Variation in Nocturnal Water Transport in Eucalyptus. Tree Physiol. 2010, 30, 586–596. [Google Scholar] [CrossRef]
- Zeppel, M.; Tissue, D.; Taylor, D.; Macinnis-Ng, C.; Eamus, D. Rates of Nocturnal Transpiration in Two Evergreen Temperate Woodland Species with Differing Water-Use Strategies. Tree Physiol. 2010, 30, 988–1000. [Google Scholar] [CrossRef]
- Buckley, T.; Turnbull, T.; Pfautsch, S.; Adams, M. Nocturnal Water Loss in Mature Subalpine Eucalyptus Delegatensis Tall Open Forests and Adjacent E. Pauciflora Woodlands. Ecol. Evol. 2011, 1, 435–450. [Google Scholar] [CrossRef]
- Pfautsch, S.; Keitel, C.; Turnbull, T.; Braimbridge, M.; Wright, T.; Simpson, R.; O’Brien, J.; Adams, M. Diurnal Patterns of Water Use in Eucalyptus Victrix Indicate Pronounced Desiccation-Rehydration Cycles despite Unlimited Water Supply. Tree Physiol. 2011, 31, 1041–1051. [Google Scholar] [CrossRef] [PubMed]
- Qiu, R.; Katul, G.; Wang, J.; Xu, J.; Kang, S.; Liu, C.; Zhang, B.; Li, L.; Cajucom, E. Differential Response of Rice Evapotranspiration to Varying Patterns of Warming. Agric. For. Meteorol. 2021, 298–299, 108293. [Google Scholar] [CrossRef]
- Snyder, K.A.; Richards, J.H.; Donovan, L.A. Night-time Conductance in C3 and C4 Species: Do Plants Lose Water at Night? J. Exp. Bot. 2003, 54, 861–865. [Google Scholar] [CrossRef]
- Caird, M.; Richards, J.; Donovan, L. Nighttime Stomatal Conductance and Transpiration in C3 and C4 Plants. Plant Physiol. 2007, 143, 4–10. [Google Scholar] [CrossRef]
- Matyssek, R.; Wieser, G.; Patzner, K.; Blaschke, H.; Häberle, K.H. Transpiration of Forest Trees and Stands at Different Altitude: Consistencies Rather than Contrasts? Eur. J. For. Res. 2009, 128, 579–596. [Google Scholar] [CrossRef]
- Wang, H.; Zhao, P.; Hölscher, D.; Wang, Q.; Lu, P.; Cai, X.; Zeng, X. Nighttime Sap Flow of Acacia Mangium and Its Implications for Nighttime Transpiration and Stem Water Storage. J. Plant Ecol. 2012, 5, 294–304. [Google Scholar] [CrossRef]
- Vandegehuchte, M.; Steppe, K. Sap-Flux Density Measurement Methods: Working Principles and Applicability. Funct. Plant Biol. 2013, 40, 213–223. [Google Scholar] [CrossRef]
- Kangur, O.; Tullus, A.; Sellin, A. Night-Time Transpiration, Predawn Hydraulic Conductance and Water Potential Disequilibrium in Hybrid Aspen Coppice. Trees Struct. Funct. 2020, 34, 133–141. [Google Scholar] [CrossRef]
- Li, W.; Zhang, Y.; Wang, N.; Liang, C.; Xie, B.; Qin, Z.; Yuan, Y.; Cao, J. Nocturnal Water Use Partitioning and Its Environmental and Stomatal Control Mechanism in Caragana Korshinskii Kom in a Semi-Arid Region of Northern China. Forests 2023, 14, 2154. [Google Scholar] [CrossRef]
- Kumagai, T.; Aoki, S.; Nagasawa, H.; Mabuchi, T.; Kubota, K.; Inoue, S.; Utsumi, Y.; Otsuki, K. Effects of Tree-to-Tree and Radial Variations on Sap Flow Estimates of Transpiration in Japanese Cedar. Agric. For. Meteorol. 2005, 135, 110–116. [Google Scholar] [CrossRef]
- Niu, F.; Röll, A.; Meijide, A.; Hendrayanto; Hölscher, D. Rubber Tree Transpiration in the Lowlands of Sumatra. Ecohydrology 2017, 10, e1882. [Google Scholar] [CrossRef]
- Chen, X.; Zhao, P.; Hu, Y.; Ouyang, L.; Zhu, L.; Ni, G. Canopy Transpiration and Its Cooling Effect of Three Urban Tree Species in a Subtropical City- Guangzhou, China. Urban For. Urban Green. 2019, 43, 126368. [Google Scholar] [CrossRef]
- Abreu, M.; Soares, A.; de Freitas, C.; Martins, F. Transpiration and Growth Responses by Eucalyptus Species to Progressive Soil Drying. J. For. Res. 2022, 33, 1529–1543. [Google Scholar] [CrossRef]
- Ouyang, L.; He, W.; Huang, K.; Zhou, C.; Gu, D.; Huang, Y.; Zhao, P. Seasonal Water Use Strategy of Canopy Tree Species and Possible Implication for Their Coexistence in a Subtropical Secondary Forest. Ecohydrology 2019, 12, e2129. [Google Scholar] [CrossRef]
- Song, X.; Lyu, S.; Wen, X. Limitation of Soil Moisture on the Response of Transpiration to Vapor Pressure Deficit in a Subtropical Coniferous Plantation Subjected to Seasonal Drought. J. Hydrol. 2020, 591, 125301. [Google Scholar] [CrossRef]
- Wang, Z.; Liu, S.; Xu, Y.; Zhu, W.; Du, A. Differences in Transpiration Characteristics among Eucalyptus Plantations of Three Species on the Leizhou Peninsula, Southern China. Forests 2022, 13, 1544. [Google Scholar] [CrossRef]
- Pérez, C.; Frangi, J.; Tesón, N.; Arturi, M. Transpiration Rates, Climate and Soil Water Balance of Eucalyptus Grandis Afforestation on Temperate Grasslands in Ne Argentina. J. Sustain. For. 2021, 40, 607–621. [Google Scholar] [CrossRef]
- Giambelluca, T.; Mudd, R.; Liu, W.; Ziegler, A.; Kobayashi, N.; Kumagai, T.; Miyazawa, Y.; Lim, T.; Huang, M.; Fox, J.; et al. Evapotranspiration of Rubber (Hevea brasiliensis) Cultivated at Two Plantation Sites in Southeast Asia. Water Resour. Res. 2016, 52, 660–679. [Google Scholar] [CrossRef]
- Kavanagh, K.; Pangle, R.; Schotzko, A. Nocturnal Transpiration Causing Disequilibrium between Soil and Stem Predawn Water Potential in Mixed Conifer Forests of Idaho. Tree Physiol. 2007, 27, 621–629. [Google Scholar] [CrossRef]
- Zhao, C.; Si, J.; Feng, Q.; Yu, T.; Li, P.; Forster, M. Nighttime Transpiration of Populus Euphratica during Different Phenophases. J. For. Res. 2019, 30, 435–444. [Google Scholar] [CrossRef]
- Song, Q. The Carbon Water Vapor Exchange of Rubber Plantation in Xishuangbanna Retrieved from ChinaNational Knowledge Infrastructure. Ph.D. Thesis, Chinese Academy of Sciences University, Xishuangbanna, China, 2013. [Google Scholar]
- Zhao, J.; Zhang, Y.; Song, F.; Xu, Z.; Xiao, L. Phenological Response of Tropical Plants to Regional Climate Change in Xishuangbanna, South-Western China. J. Trop. Ecol. 2013, 29, 161–172. [Google Scholar] [CrossRef]
- Murray, F.W. On the Computation of Saturation Vapor Pressure. J. Appl. Meterology 1967, 6, 203–204. [Google Scholar] [CrossRef]
- Mu, Q.; Zhao, M.; Running, S.W. Improvements to a MODIS Global Terrestrial Evapotranspiration Algorithm. Remote Sens. Environ. 2011, 115, 1781–1800. [Google Scholar] [CrossRef]
- Granier, A. Evaluation of Transpiration in a Douglas-Fir Stand by Means of Sap Flow Measurements. Tree Physiol. 1987, 3, 309–320. [Google Scholar] [CrossRef]
- Bai, Y.; Li, X.; Liu, S.; Wang, P. Modelling Diurnal and Seasonal Hysteresis Phenomena of Canopy Conductance in an Oasis Forest Ecosystem. Agric. For. Meteorol. 2017, 246, 98–110. [Google Scholar] [CrossRef]
- Jonard, F.; André, F.; Ponette, Q.; Vincke, C.; Jonard, M. Sap Flux Density and Stomatal Conductance of European Beech and Common Oak Trees in Pure and Mixed Stands during the Summer Drought of 2003. J. Hydrol. 2011, 409, 371–381. [Google Scholar] [CrossRef]
- Zhao, P.-Q.; Zhao, P.; Niu, J.-F.; Zhu, L.-W.; Ni, G.-Y.; Gao, J.-G.; Zhang, Z.-Z. Relationship between Vessel Characteristics and Sap Flow of Eight Subtropical Tree Species. J. Trop. Subtrop. Bot. 2014, 22, 537–548. [Google Scholar] [CrossRef]
- Lin, Y.X.; Zhang, Y.P.; Zhao, W.; Zhang, X.; Li, J. Comparison of Transpiration Characteristics in Different Aged Rubber Plantations. Chin. J. Ecol. 2016, 35, 855–863. [Google Scholar]
- Burgess, S.; Adams, M.; Turner, N.; Beverly, C.; Ong, C.; Khan, A.; Bleby, T. An Improved Heat Pulse Method to Measure Low and Reverse Rates of Sap Flow in Woody Plants. Tree Physiol. 2001, 21, 589–598. [Google Scholar] [CrossRef]
- Hayat, M.; Yan, C.; Xiang, J.; Xiong, B.; Qin, L.; Khan, A.; Wang, B.; Khan, M.; Zou, Z.; Qiu, G. Multiple-Temporal Scale Variations in Nighttime Sap Flow Response to Environmental Factors in Ficus Concinna over a Subtropical Megacity, Southern China. Forests 2022, 13, 1059. [Google Scholar] [CrossRef]
- Di, N.; Yang, S.; Liu, Y.; Fan, Y.; Duan, J.; Nadezhdina, N.; Li, X.; Xi, B. Soil-Moisture-Dependent Nocturnal Water Use Strategy and Its Responses to Meteorological Factors in a Seasonal-Arid Poplar Plantation. Agric. Water Manag. 2022, 274, 107984. [Google Scholar] [CrossRef]
- Barbeta, A.; Ogaya, R.; Peñuelas, J. Comparative Study of Diurnal and Nocturnal Sap Flow of Quercus Ilex and Phillyrea Latifolia in a Mediterranean Holm Oak Forest in Prades (Catalonia, NE Spain). Trees-Struct. Funct. 2012, 26, 1651–1659. [Google Scholar] [CrossRef]
- Zhang, H.; Levia, D.; He, B.; Wu, H.; Liao, A.; Carlyle-Moses, D.; Liu, J.; Wang, N.; Li, J.; Fu, C. Interspecific Variation in Tree- and Stand-Scale Stemflow Funneling Ratios in a Subtropical Deciduous Forest in Eastern China. J. Hydrol. 2020, 590, 125455. [Google Scholar] [CrossRef]
- Daley, M.; Phillips, N. Interspecific Variation in Nighttime Transpiration and Stomatal Conductance in a Mixed New England Deciduous Forest. Tree Physiol. 2006, 26, 411–419. [Google Scholar] [CrossRef]
- Scholz, F.; Bucci, S.; Goldstein, G.; Meinzer, F.; Franco, A.; Miralles-Wilhelm, F. Removal of Nutrient Limitations by Long-Term Fertilization Decreases Nocturnal Water Loss in Savanna Trees. Tree Physiol. 2007, 27, 551–559. [Google Scholar] [CrossRef]
- de Dios, V.; Díaz-Sierra, R.; Goulden, M.; Barton, C.; Boer, M.; Gessler, A.; Ferrio, J.; Pfautsch, S.; Tissue, D. Woody Clockworks: Circadian Regulation of Night-Time Water Use in Eucalyptus Globulus. New Phytol. 2013, 200, 743–752. [Google Scholar] [CrossRef]
- Fu, Y.; Liu, Y.; De Boeck, H.; Menzel, A.; Nijs, I.; Peaucelle, M.; Peñuelas, J.; Piao, S.; Janssens, I. Three Times Greater Weight of Daytime than of Night-Time Temperature on Leaf Unfolding Phenology in Temperate Trees. New Phytol. 2016, 212, 590–597. [Google Scholar] [CrossRef]
- Devi, M.; Reddy, V. Transpiration Response of Cotton to Vapor Pressure Deficit and Its Relationship With Stomatal Traits. Front. Plant Sci. 2018, 9, 1572. [Google Scholar] [CrossRef]
- Deng, J.; Zhu, H. Nocturnal Sap Flow of Hedysarum Scoparium and Its Response to Meteorological Factors in Semiarid Northwest China. IOP Conf. Ser. Earth Environ. Sci. 2018, 186, 012022. [Google Scholar] [CrossRef]


| Plantation Name | Location | Planted Year | Altitude (m) | DBH (cm) | Number of Probes | Stand Density (/ha) |
|---|---|---|---|---|---|---|
| Eucalyptus spp. | 24°30′ N, 117°24′ E | 2020 | 106 | 9.02 ± 0.92 | 20 | 2050 |
| Hevea brasiliensis | 21°55′ N, 101°15′ E | 1982 | 580 | 32.30 ± 4.67 | 6 | 370 |
| Castanopsis hysrix | 24°00′ N, 117°18′ E | 1960s, more than 60 years | 74 | 30.12 ± 11.20 | 14 | 755.56 |
| Water Use Component | Plantations | Ta | RH | WS | VPD | U × D |
|---|---|---|---|---|---|---|
| Nocturnal water consumption | EF (entire year) | 0.17 | −0.43 *** | −0.34 ** | 0.52 *** | −0.08 |
| EF (dry season) | −0.14 | −0.55 ** | 0.10 | 0.59 ** | 0.06 | |
| EF (rainy season) | 0.49 ** | −0.34 | −0.56 *** | 0.58 *** | −0.18 | |
| RF (entire year) | 0.29 *** | −0.85 *** | 0.67 *** | 0.84 *** | 0.81 *** | |
| RF (dry season) | 0.15 | −0.82 *** | 0.61 *** | 0.82 *** | 0.78 *** | |
| RF (rainy season) | 0.61 *** | −0.87 *** | 0.71 *** | 0.87 *** | 0.84 *** | |
| CHF (entire year) | 0.28 * | −0.06 | −0.03 | 0.26 * | 0.13 | |
| CHF (dry season) | 0.02 | −0.03 | 0.01 | 0.09 | 0.08 | |
| CHF (rainy season) | 0.22 | −0.36 | −0.05 | 0.37 | 0.28 | |
| Nocturnal transpiration | EF (entire year) | 0.05 | −0.41 ** | −0.32 | 0.45 *** | −0.03 |
| EF (dry season) | −0.51 * | −0.59 ** | 0.10 | 0.42 *** | 0.16 | |
| EF (rainy season) | 0.59 *** | −0.30 | −0.51 ** | 0.57 *** | −0.15 | |
| RF (entire year) | 0.20 ** | −0.65 *** | 0.57 *** | 0.62 *** | 0.57 *** | |
| RF (dry season) | 0.17 | −0.66 *** | 0.46 *** | 0.66 *** | 0.54 *** | |
| RF (rainy season) | 0.43 *** | −0.65 *** | 0.63 *** | 0.63 *** | 0.6 *** | |
| CHF (entire year) | 0.29 ** | −0.16 | 0.18 | 0.24 * | 0.15 | |
| CHF (dry season) | 0.19 | −0.32 * | −0.02 | 0.31 * | 0.00 | |
| CHF (rainy season) | 0.26 | −0.03 | 0.48 ** | 0.06 | 0.47 * | |
| Stem refilling | EF (entire year) | 0.21 | −0.40 ** | −0.32 * | 0.51 *** | −0.09 |
| EF (dry season) | 0.03 | −0.48 * | 0.10 | 0.60 ** | 0.02 | |
| EF (rainy season) | 0.42 * | −0.34 | −0.56 *** | 0.56 *** | −0.18 | |
| RF (entire year) | 0.290 *** | −0.85 *** | 0.65 *** | 0.84 *** | 0.82 *** | |
| RF (dry season) | 0.13 | −0.82 *** | 0.62 *** | 0.81 *** | 0.80 *** | |
| RF (rainy season) | 0.61 *** | −0.86 *** | 0.68 *** | 0.87 *** | 0.84 *** | |
| CHF (entire year) | 0.19 | −0.01 | −0.08 | 0.18 | 0.08 | |
| CHF (dry season) | −0.02 | 0.05 | 0.02 | 0.01 | 0.08 | |
| CHF (rainy season) | 0.13 | −0.31 | −0.18 | 0.32 | 0.13 |
| Water Use Component | Plantations | Multiple Stepwise Regression Equation | p Value | Adjusted R2 |
|---|---|---|---|---|
| Nocturnal water consumption | EF | NWC = 0.000226VPD *** − 0.094WS *** + 0.052 *** | <0.01 | 0.459 |
| RF | NWC = 0.000436VPD *** − 0.022731 * | <0.01 | 0.704 | |
| Nocturnal transpiration | EF | NT = 0.000067VPD *** − 0.03WS*** + 0.021 *** | <0.01 | 0.355 |
| RF | NT = 0.00008VPD *** + 0.007032 | <0.01 | 0.381 | |
| CHF | NT = 0.000624Ta ** + 0.004093 | <0.05 | 0.063 | |
| Stem refilling | EF | SR = 0.000159VPD *** − 0.064730WS ** + 0.031572 *** | <0.01 | 0.434 |
| RF | SR = 0.000356VPD *** − 0.029763 *** | <0.01 | 0.704 |
Disclaimer/Publisher’s Note: The statements, opinions and data contained in all publications are solely those of the individual author(s) and contributor(s) and not of MDPI and/or the editor(s). MDPI and/or the editor(s) disclaim responsibility for any injury to people or property resulting from any ideas, methods, instructions or products referred to in the content. |
© 2025 by the authors. Licensee MDPI, Basel, Switzerland. This article is an open access article distributed under the terms and conditions of the Creative Commons Attribution (CC BY) license (https://creativecommons.org/licenses/by/4.0/).
Share and Cite
Sun, Z.; Xu, H.; Wang, S.; Lin, H.; Song, Q.; Li, Y.; Lu, D.; Chen, Y. Magnitude, Seasonality, and Drivers of Nocturnal Water Use in Three Subtropical and Tropical Plantations in Southern China. Forests 2025, 16, 529. https://doi.org/10.3390/f16030529
Sun Z, Xu H, Wang S, Lin H, Song Q, Li Y, Lu D, Chen Y. Magnitude, Seasonality, and Drivers of Nocturnal Water Use in Three Subtropical and Tropical Plantations in Southern China. Forests. 2025; 16(3):529. https://doi.org/10.3390/f16030529
Chicago/Turabian StyleSun, Zhanpeng, Hongfeng Xu, Side Wang, Haohui Lin, Qinghai Song, Yun Li, Dengsheng Lu, and Yaoliang Chen. 2025. "Magnitude, Seasonality, and Drivers of Nocturnal Water Use in Three Subtropical and Tropical Plantations in Southern China" Forests 16, no. 3: 529. https://doi.org/10.3390/f16030529
APA StyleSun, Z., Xu, H., Wang, S., Lin, H., Song, Q., Li, Y., Lu, D., & Chen, Y. (2025). Magnitude, Seasonality, and Drivers of Nocturnal Water Use in Three Subtropical and Tropical Plantations in Southern China. Forests, 16(3), 529. https://doi.org/10.3390/f16030529