Article

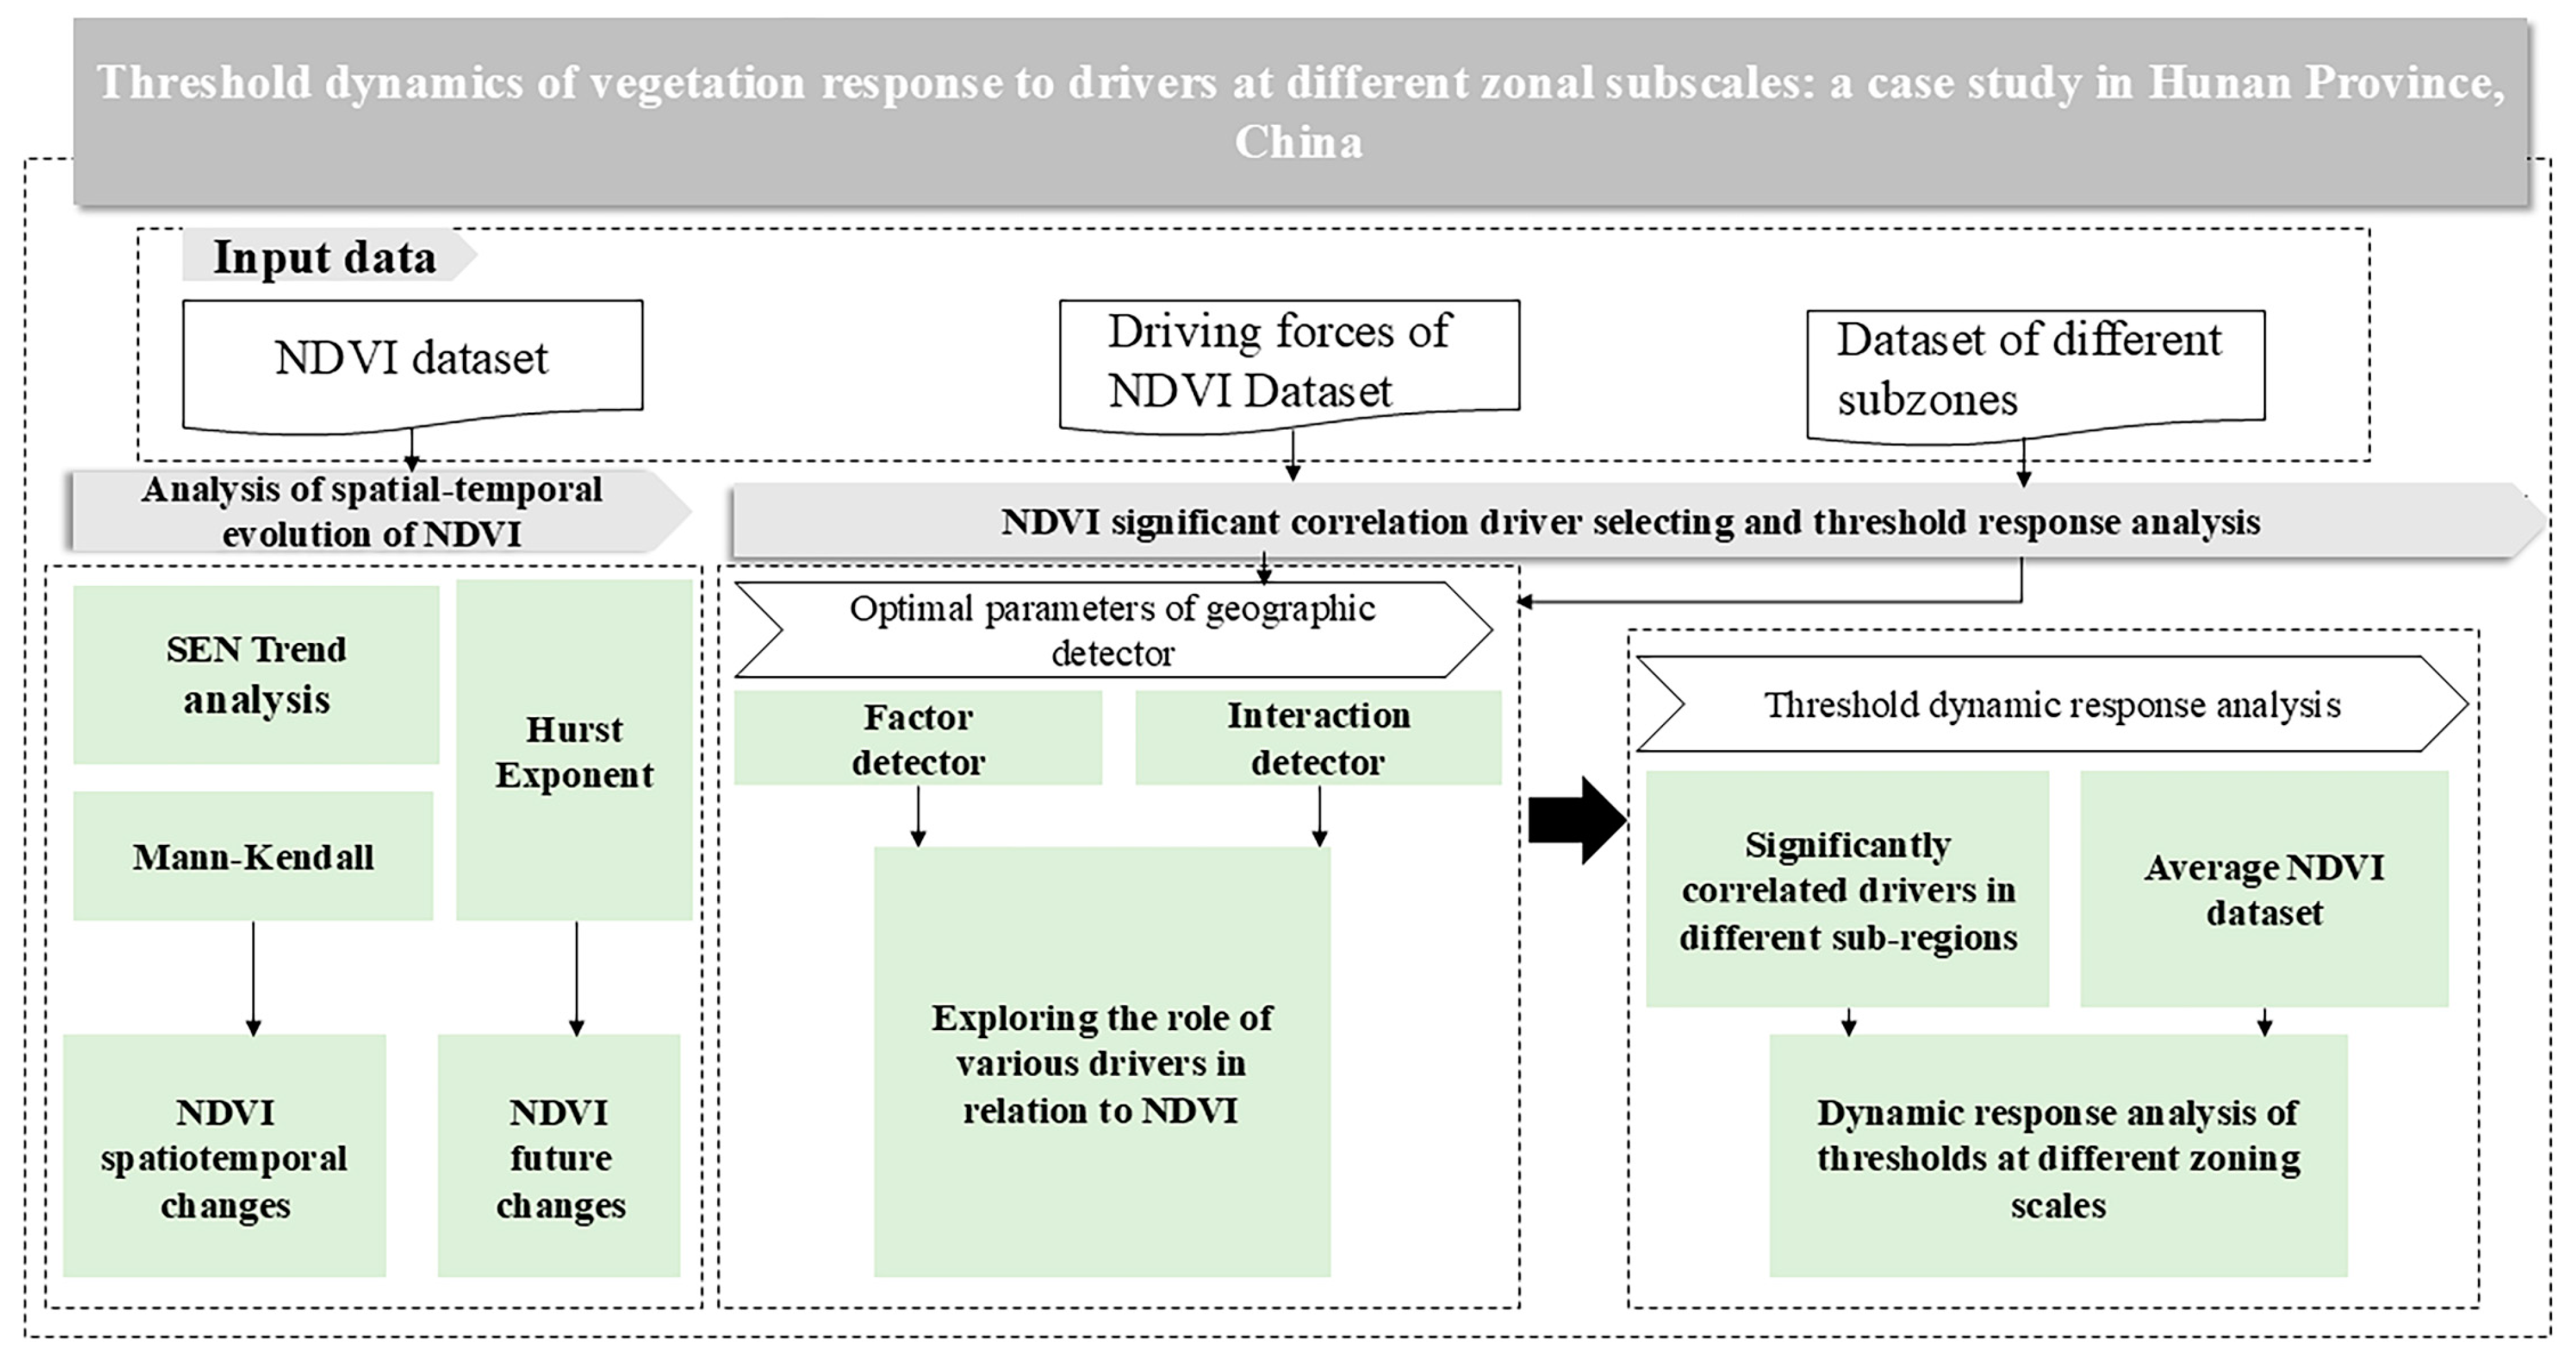
Spatial Heterogeneity Analysis of the Driving Mechanisms and Threshold Responses of Vegetation at Different Regional Scales in Hunan Province

1
College of Forestry, Xinyang Agriculture and Forestry University, Xinyang 464000, China
2
Key Laboratory of Ecological Safety and Sustainable Development in Arid Lands, Northwest Institute of Eco-Environment and Resources, Chinese Academy of Sciences, Lanzhou 730000, China
3
Key Research Insititute of Yellow River Civilization and Sustainable Development, Collaborative Innovation Center on Yellow River Civilization, Henan University, Kaifeng 475001, China
4
Ministry of Education Key Laboratory for Biodiversity Science and Ecological Engineering, School of Life Sciences, Fudan University, Shanghai 200438, China
*
Authors to whom correspondence should be addressed.
Forests 2025, 16(3), 515; https://doi.org/10.3390/f16030515
Submission received: 19 January 2025 / Revised: 27 February 2025 / Accepted: 10 March 2025 / Published: 14 March 2025
(This article belongs to the Topic Responses of Trees and Forests to Climate Change)

Abstract

:
This study aims to analyze the driving factors and threshold responses of the NDVI across different regional scales in Hunan Province, revealing the main influences on vegetation cover and the corresponding threshold effects and providing essential data for precise future afforestation planning. We use NDVI data and its associated driving factors, employing correlation analysis methods to investigate the spatial differentiation and threshold effects of vegetation driving factors at different regional scales. First, various analytical techniques, including Sen’s trend analysis, the Mann–Kendall significance test, and the Hurst index, are applied to assess changes in vegetation cover between 2000 and 2020 and to predict future trends. Second, to explore the differences in vegetation’s driving mechanisms at different regional scales, the optimal parameters-based geographic detector model is employed, which integrates continuous variable discretization methods and selects the optimal parameter set by maximizing explanatory power. This approach is particularly suitable for analyzing nonlinear relationships. Lastly, threshold regression analysis is conducted on the key driving factors identified through the optimal parameters-based geographic detector model. The results show that vegetation cover in most areas of Hunan significantly increased from 2000 to 2020; however, our predictions suggest slight degradation in the future. The optimal parameters-based geographic detector model identified topography and geomorphology as the primary factors affecting the spatial and temporal distribution of the NDVI, with notable regional differences in other factors. The influence of natural factors has weakened over time, while anthropogenic activities increasingly affect vegetation. Moreover, dual-factor influences exhibit stronger explanatory power than single-factor influences. The threshold response analysis reveals that slope is a key factor influencing the NDVI, with a positive threshold relationship observed at both the provincial and subregional scales, although the threshold points vary by subregion. The temperature and NDVI are negatively correlated, with varying threshold points across regions. The abovementioned research findings suggest that future afforestation efforts in Hunan should take into account the distinct characteristics of each subregion. Afforestation strategies should be tailored based on the specific threshold relationships observed in each area to enhance their effectiveness.

1. Introduction

The rapid global climate shifts and intensified human activities have placed ecosystems under significant stress. Over the past century, the global climate has undergone drastic changes, primarily characterized by global warming. Global temperatures have increased by approximately 0.74 °C, and the intensity of precipitation events is expected to rise, particularly in wet regions [1,2,3]. The China Climate Change Blue Book (2021) also points out that the global average temperature in 2020 was 1.2 °C higher than the pre-industrial level (average of 1850–1900), with the period from 2011 to 2020 being the warmest decade since 1850. Global climate change has led to rising sea levels, glacier melting, frequent extreme weather events such as heatwaves and heavy rainfall, intensifying drought and flood disasters, and a decline in biodiversity, all of which have had profound impacts on natural ecosystems and human society. Given these significant challenges to ecosystems, monitoring vegetation—a critical component of the environment—becomes even more crucial. As a key element in climate regulation and carbon balance management, vegetation’s dynamic coverage provides valuable insights into the health of regional ecosystems. However, traditional environmental monitoring techniques are unable to assess and monitor vegetation changes on a large scale [4,5]. Since the 20th century, the rapid advancement of remote sensing (RS) technology has facilitated the widespread application of various RS-derived indices for large-scale ecological monitoring. The normalized difference vegetation index (NDVI), among the various remote sensing vegetation indices, is widely used as a stable indicator for monitoring vegetation dynamics at different scales due to its extensive spatial coverage, clear physical interpretation, and high sensitivity to vegetation changes. Therefore, the NDVI serves as a fundamental tool for analyzing the driving forces behind vegetation changes [6].
Vegetation, a crucial component of terrestrial ecosystems, reflects regional environmental changes through its coverage. The factors influencing vegetation cover are both complex and variable, making it essential to understand the driving forces behind these changes. This understanding is vital as it provides the data necessary for developing effective regional environmental policies. Consequently, research into the complex mechanisms driving vegetation dynamics has become increasingly important [7,8]. At the same time, this study will explore the shortcomings of existing research from two aspects: the division of the study area and the analysis methods of the complex mechanisms driving vegetation dynamics. Firstly, many researchers have developed divisions based on the scale of administrative divisions to explore the changes in vegetation’s drivers. Feng et al. (2015) used pooled regression modeling to calculate the changes in vegetation cover between 1983 and 2012 based on changes in vegetation cover in four provinces in China’s arid regions [9]. Xu and Kong et al. [10,11] refined the scale analysis of the factors influencing vegetation drivers from the city and county perspectives. The abovementioned studies explored the reasons influencing vegetation changes from the perspective of administrative divisions. However, vegetation changes are also affected by the joint effects of topography and vegetation type. Therefore, zoning by administrative area for a specific study area is likely to result in the loss of detailed spatial information within the administrative unit. The subtropical region of Southern China contains a variety of complex terrain, such as hills and mountains, and is rich in vegetation types. Previous studies of vegetation’s driving forces in this region were mostly based on administrative divisions [11,12], with few comparative analyses of the driving forces across different terrain partitions. Therefore, research on the differences in vegetation drivers in the region, due to different topographic features, vegetation types, and other zoning scales, is not yet clear. Moreover, with respect to the analytical methods for studying vegetation drivers, previous research has explored the effects of anthropogenic and climatic influences on the role of the NDVI by means of residual analyses and correlation statistics. These methods are effective only under the assumption that the relationships between vegetation and its driving factors are linear and normally distributed [13,14]. In reality, vegetation’s responses to environmental changes vary across different scales and may not fully adhere to these assumptions [15]. In contrast, people have begun to use structural equation modeling [16], optimal parameter geoprobes [17], and other methods to explore the nonlinear effects of each driver on the NDVI. The abovementioned nonlinear statistical methods can distinguish the primary and secondary drivers, as well as the contribution rate of each driver to the change in the NDVI, but they are unable to quantify the specific threshold relationships between the main drivers and NDVI-related roles or to provide specific numerical references for relevant silvicultural policies. Therefore, the quantitative identification of significant vegetation drivers and their threshold relationships at different zonal scales will affect the actual scale of implementation of relevant forestry policies. This result is crucial for cross-scale studies aimed at planning and managing forestry projects in subtropical Southern China. Cross-scale studies for management are crucial. If the scales have little influence on drivers and thresholds, then uniform forestry renovation projects can be implemented under the same administrative divisions, and vegetation cover can be improved at all scales. Conversely, targeted forestry project renovation is needed according to different zoning characteristics. The aforementioned research shortcomings limit the understanding of the mechanisms driving the NDVI, and they are not conducive to a comprehensive understanding of the relationships among the NDVI’s drivers at both the temporal and spatial scales.
Because of these limitations, this study analyzes the threshold responses of key drivers of vegetation from 2000 to 2020 across three sub-zonal levels: topography, vegetation, and soil. The following questions are central to this analysis: (1) Are the significantly correlated drivers of vegetation consistent across different zonal scales within the same administrative boundaries? (2) Does the trend of the threshold response of the NDVI and its significantly correlated drivers remain consistent across various zoning scales, and are there any differences in the identified thresholds? These questions are particularly important for advancing the development of smart forestry and ensuring the sustainable management of forestry ecosystems in Hunan Province.

2. Materials and Methods

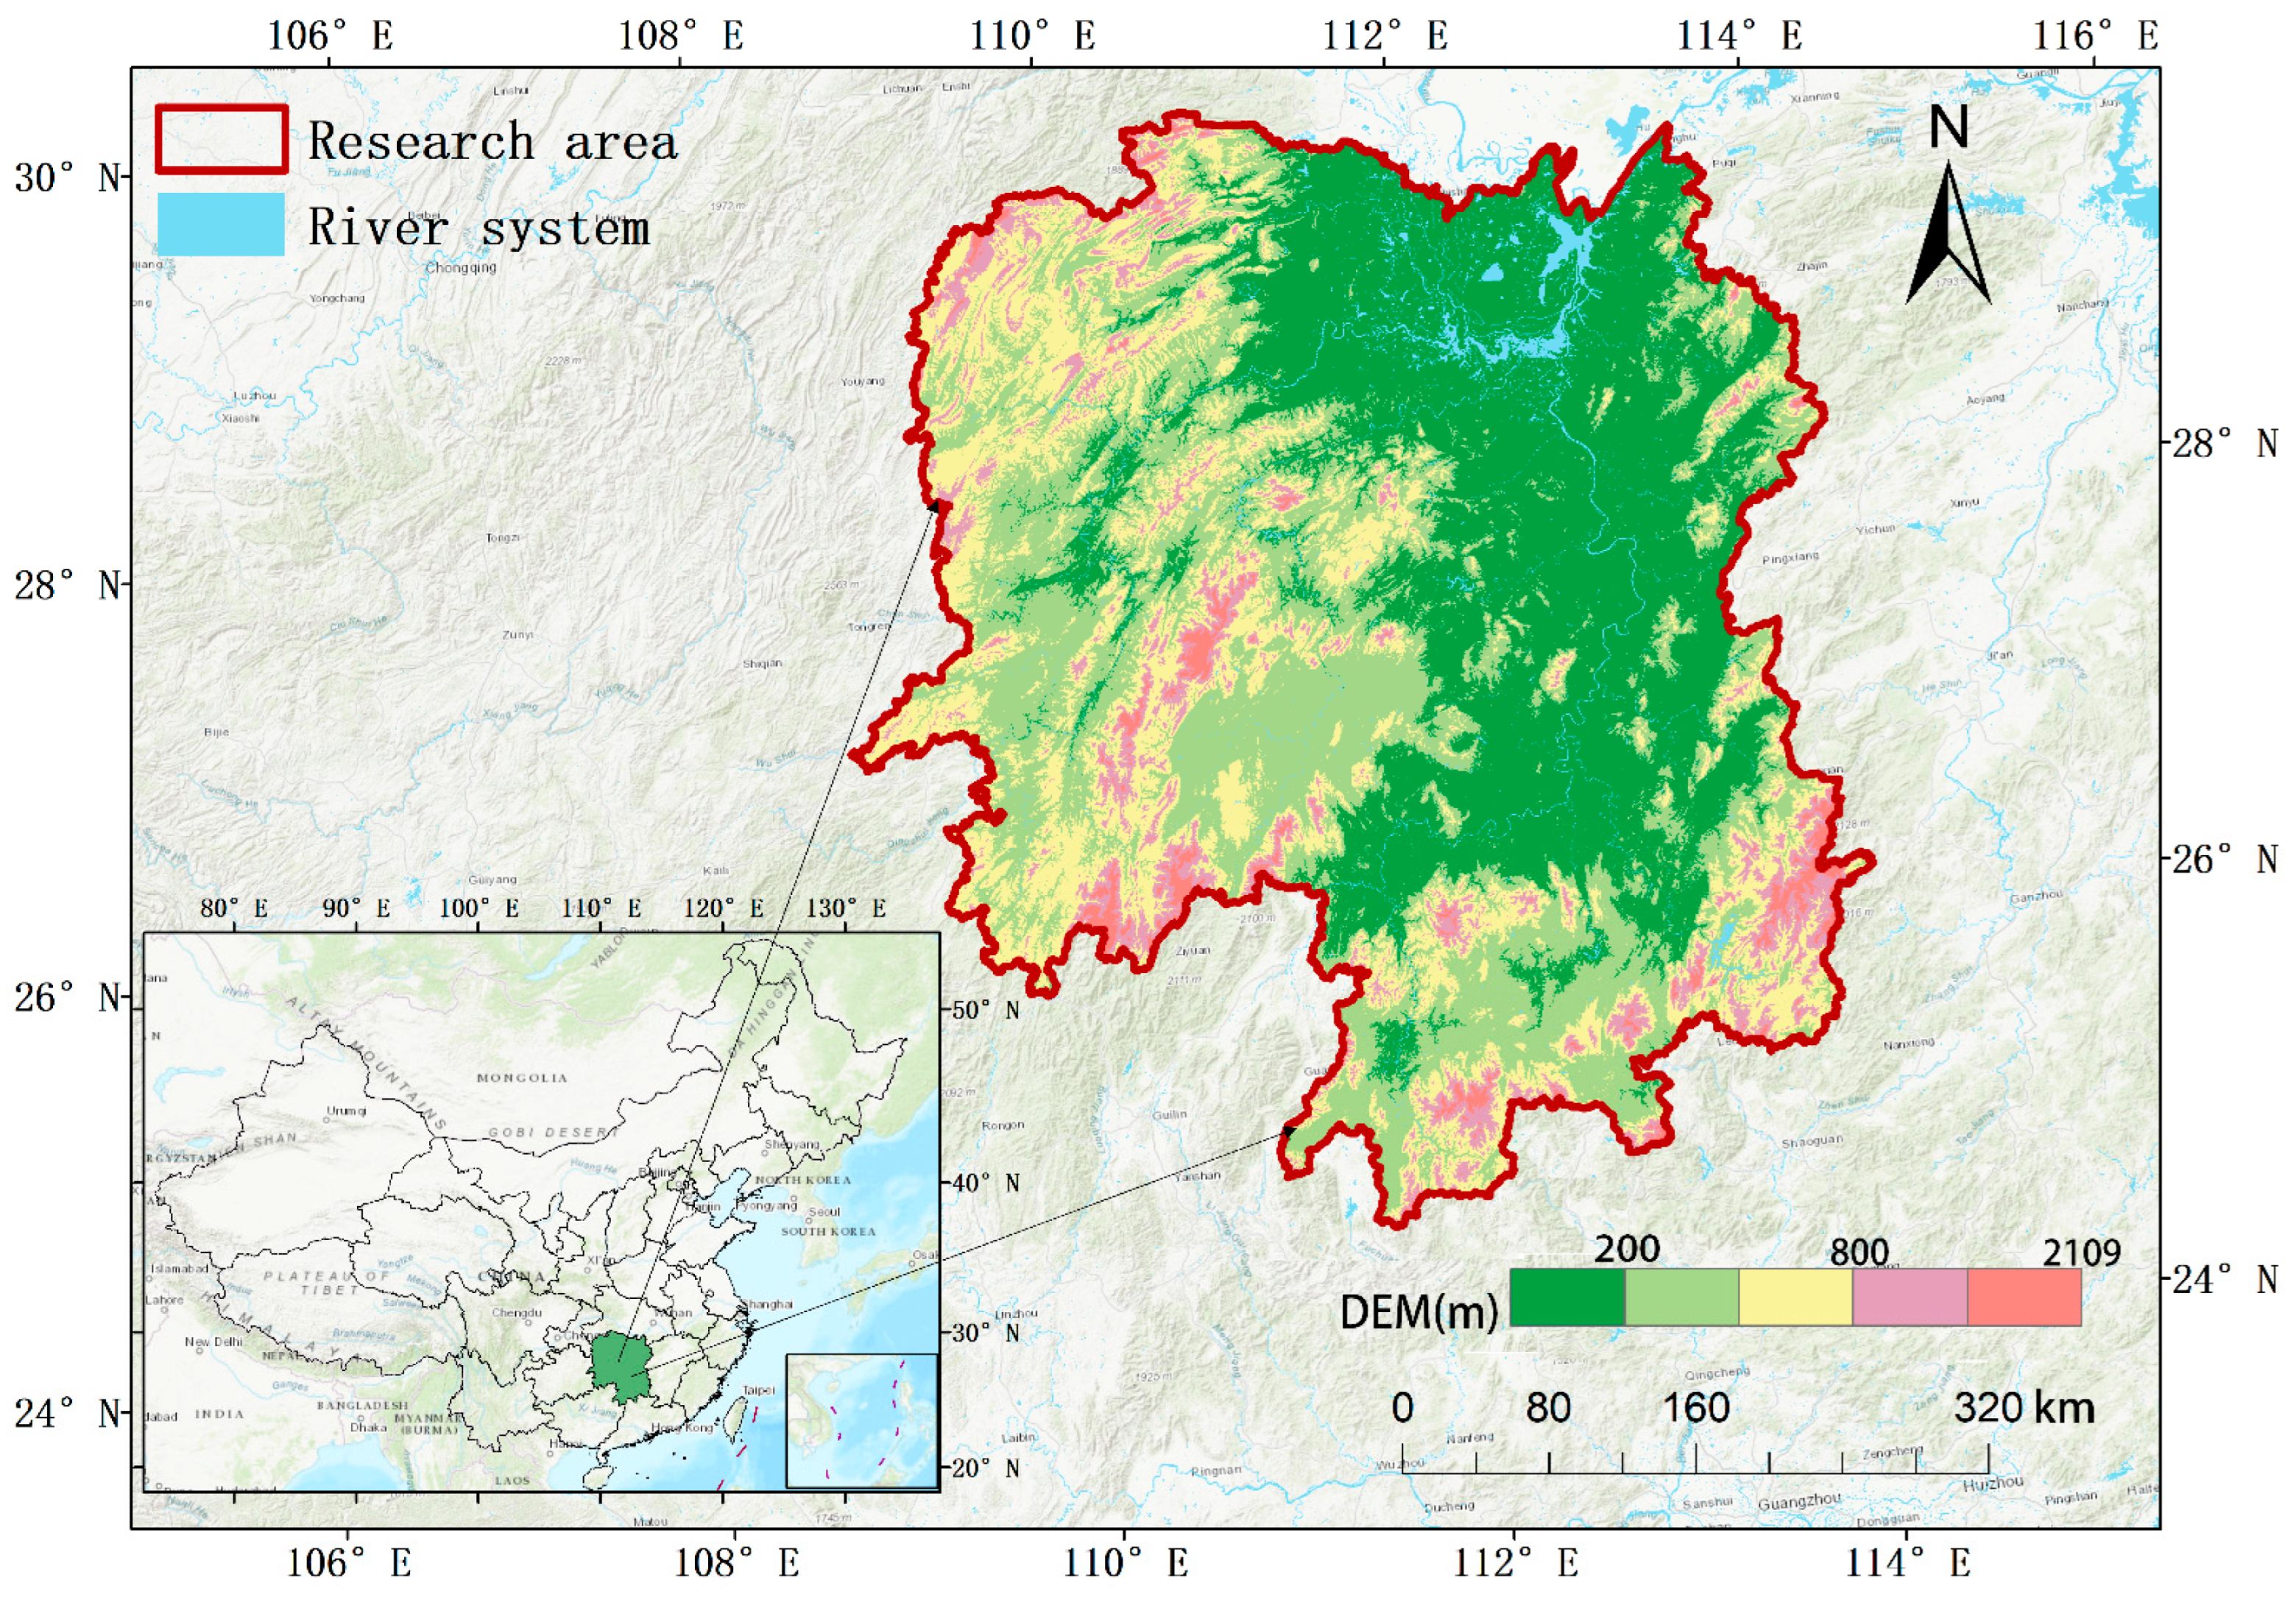
2.1. Overview of the Study Area

Hunan Province is situated in the middle reaches of the Yangtze River, spanning latitudes 24°38′ to 30°08′ N and longitudes 108°47′ to 114°15′ E, covering a total area of 2.118 × 10⁵ km2 (Figure 1), and has a population of 65.68 million in the study area. The province’s northern region features the Dongting Lake Plain, while the central area is predominantly hilly. The terrain gradually rises in the southwest and slopes downward toward the northeast, forming a distinctive horseshoe shape. Mountains dominate 51.20% of the province’s land area, with hills, plains, and water bodies covering 29.30%, 13.10%, and 6.40%, respectively. Hunan experiences a subtropical monsoon climate, characterized by dry winters with minimal rainfall and hot, rainy summers. This unique combination of topography and climate supports extensive subtropical evergreen broadleaf forests, making the province a rich and diverse ecological zone.
The map data were sourced from the China Vector Boundary Data, obtained from the National Geomatics Center of China (NGCC). This dataset provides accurate and detailed boundaries of China at various administrative levels, making it suitable for spatial analysis and mapping. The vector boundary data were processed in ArcGIS 10.4, with a transformation to the WGS 1984 coordinate system, ensuring spatial consistency for subsequent data analysis.

2.2. Data Sources and Preprocessing

All of the data and sources used in this study are presented in Table 1. In order to analyze the changes in vegetation drivers in Hunan Province, 21 potential variables were selected. These variables include datasets that are closely related to vegetation growth, such as rainfall, temperature, slope, and slope orientation. These variables were categorized into four main types: climatic factors, topography and geomorphology, vegetation types, and anthropogenic effects.

2.2.1. NDVI Dataset

Our study utilized the MOD13Q1 NDVI dataset for Hunan Province from 2000 to 2020. This dataset is a level 3 grid-based land vegetation product with a spatial resolution of 250 m and a temporal resolution of 16 days. Data processing, including projection and mosaicking, was performed using MODIS Reprojection Tool. Quality control files provided by the MODIS dataset were employed to remove poor-quality pixels, and the data were subsequently clipped to the Hunan region using ArcGIS 10.4. Normally, NDVI values range between [−1, 1], where values below 0 generally indicate the absence of vegetation [18]. During the data preprocessing stage, we filtered out pixels with NDVI values below 0. To more effectively analyze vegetation changes, we selected NDVI data from April to November each year to calculate the average NDVI values for each growing season, thereby generating annual NDVI datasets for the growing seasons from 2000 to 2020 [19]. Moreover, to better reflect the dynamic changes in vegetation cover, the NDVI values were classified into five categories using an equal-interval method: low (0 ≤ NDVI < 0.2), moderately low (0.2 ≤ NDVI < 0.4), medium (0.4 ≤ NDVI < 0.6), moderately high (0.6 ≤ NDVI < 0.8), and high (0.8 ≤ NDVI ≤ 1).

2.2.2. Driving Forces of the NDVI Dataset

The annual average temperature data were derived from the MODIS land surface temperature product (MOD11A2) [20], which provided LST data at an 8-day temporal resolution and a 1 km spatial resolution. The data originated from the NOAA’s global temperature dataset (https://www.ncei.noaa.gov/data/global-summary-of-the-day/archive/, accessed on 15 February 2024). Annual precipitation data were obtained from the CHIRPS daily dataset (Climate Hazards Group InfraRed Precipitation with Station Data, Version 2.0 Final) via the GEE platform [21], covering global precipitation data from 1981 to the present. Monthly-scale photosynthetically active radiation (PAR) data were sourced from the NASA Langley Research Center’s Clouds and the Earth’s Radiant Energy System (CERES), with a spatial resolution of 1° (data available at https://ceres.larc.nasa.gov/order_data.php, accessed on 15 February 2024).
The standardized precipitation evapotranspiration index (SPEI) dataset, which has a spatial resolution of 1° and a monthly temporal resolution, was obtained from (https://spei.csic.es/, accessed on 15 February 2024). Datasets X5 through X13 were sourced from the Global Land Evaporation Amsterdam Model (GLEAM) dataset (Table 1), including soil moisture data from the latest version (v3.5) [22]. This dataset provides monthly root zone soil moisture (SMroot) and surface soil moisture (SMsurf) data at a spatial resolution of 0.25°, covering a 41-year period based on satellite observations and reanalysis data of global soil moisture [22].
The digital elevation model (DEM) data were sourced from the NASA DEM 30m dataset (NASA/NASADEM_HGT/001), which is available on the GEE platform [23], with slope and aspect data derived from the DEM. Data on geomorphology, soil type, vegetation type, and land use (for the years 2000, 2005, 2010, 2015, and 2020) were obtained from the Resource and Environment Science and Data Centre of the Chinese Academy of Sciences (https://www.resdc.cn/, accessed on 15 February 2024), all with a spatial resolution of 1 km [24]. Population density data for the period 2000 to 2020 were sourced from the WorldPop Population Density dataset (https://www.worldpop.org/, accessed on 15 February 2024), which also has a 1 km spatial resolution [25].
Finally, all datasets were processed using ArcGIS 10.4 for mask extraction, projection conversion, and resampling to ensure spatial reference consistency and a uniform pixel size with the NDVI data, and the data sources for the abovementioned data can be found in Table 2.

2.2.3. Dataset of Different Sub-Zones

Vegetation zone data were sourced from the 1:1,000,000 Vegetation Atlas of China and Vegetation of China datasets, which provided the vegetation zoning system. The study area was divided into five major regions: grassland, coniferous forest, shrubbery, broadleaf forest, and cultivated forest. Soil zone data were obtained from the 1:1,000,000 Soil Map of the People’s Republic of China, covering the following soil types within the study area: semi-hydromorphic soil, alluvial soil, primary soil, and ferrallitic soil. Geomorphological zone data were sourced from the 1:1,000,000 Geomorphological Atlas of the People’s Republic of China, and after reclassification and integration, the study area was divided into four major geomorphological categories: plain, mesa, hill, and mountain.

2.3. Methodology

First, based on the NDVI dataset of Hunan Province from 2000 to 2020, the calculation of NDVI data was completed using ArcGIS10.4 and the MATLAB 2018a platform, and the trend of NDVI changes in Hunan Province from 2000 to 2020 was evaluated and analyzed. The Hurst index was calculated to predict future trends of vegetation changes in Hunan Province. Next, using the optimal parameter geoprobe and relevant national standard documents, the NDVI drivers were classified reasonably, and the effects of these drivers on the NDVI changes in Hunan Province were explored at different zonal scales. Subsequently, based on the results of the optimal parameter geoprobe, we screened out the drivers that were significantly related to the NDVI at different zonal scales, and we investigated the effects of the NDVI and its significant correlations at different zonal scales. The threshold dynamic response of the NDVI and its significant drivers at different zonal scales was investigated, and the trend of the threshold dynamic response was analyzed to determine if it was the same at different zonal scales. Finally, based on the results of the above analyses, relevant data references are provided for the formulation of forestry policies in different subregions of Hunan Province. The technical framework of this study is illustrated in Figure 2.

2.3.1. Sen + Mann–Kendall Trend Analysis

The methodology combines the Theil–Sen median, a non-parametric slope estimation, with the Mann–Kendall trend test [26,27]. This approach is robust against noise, does not require the sample to follow a normal distribution, and effectively avoids the interference of outliers. Using MATLAB 2018a, the NDVI trend across Hunan Province from 2000 to 2020 was determined on a per-pixel basis. The formula is as follows:
β = m e d i a n N D V I j N D V I i j i   j > i  
where median is the median function, while NDVIi and NDVIj represent the NDVI values for the i-th and j-th years, respectively. When β > 0, it indicates an upward trend in NDVI; conversely, β < 0 suggests a downward trend. For the test statistic Z, at a given confidence level α, if |Z| > Z1-α/2, it indicates a statistically significant change in the NDVI time series; otherwise, the change is considered insignificant.
In this study, the α values were set to 0.1, 0.05, and 0.01. Based on the values of β and |Z|, the NDVI trends were categorized into seven levels: highly significant degradation (β < 0, |Z| ≥ 2.58), significant degradation (β < 0, 1.96 ≤ |Z| < 2.58), weakly significant degradation (β < 0, 1.64 ≤ |Z| < 1.96), highly significant improvement (β > 0, |Z| ≥ 2.58), significant improvement (β > 0, 1.96 ≤ |Z| < 2.58), weakly significant improvement (β > 0, 1.64 ≤ |Z| < 1.96), and non-significant change (|Z| < 1.64). We utilized the Sen + Mann–Kendall test to explore changes in vegetation cover in Hunan Province and to provide reference data for regional changes in vegetation cover.

2.3.2. Hurst Exponent

The Hurst exponent, derived from the rescaled range (R/S) analysis method, quantitatively describes the long-term dependence of a time series and enables predictions of its future trends [28]. The principle is outlined as follows:
N D V I τ = 1 τ t = 1 τ N D V I t , τ = 1 , 2 , 3 , , n
X t , τ = t = 1 τ N D V I t N D V I τ , 1   t     τ
R τ = max t X t , τ m i n t X t , τ , 1 t τ , τ = 1 , 2 , n
S   τ = 1   τ t = 1 τ N D V I t N D V I τ 2 , τ = 1 , 2 , n
Equations (2)–(5) represent the NDVI mean, cumulative deviation, range, and standard deviation series, respectively. Considering the ratio R(τ)/S(τ) ≌ R/S, if the relationship R/S∝τH is satisfied, this indicates that the NDVI time series NDVI(t) exhibits the Hurst phenomenon. The value of H can be derived using least-squares fitting in a double logarithmic coordinate system (lnτ, lnR/S). Depending on the value of H, different behaviors of the NDVI time series are indicated as follows [29]:
  • When 0 < H < 0.5, the time series exhibits anti-persistence, meaning that increases are likely to be followed by decreases, and vice versa.
  • When 0.5 < H < 1, the time series shows persistence, implying that trends are likely to continue in the same direction.
  • When H = 0.5, the series behaves randomly, with no correlation between past and future values.
Through the calculation of the Hurst index, this study analyzes and predicts future changes in the NDVI in Hunan Province by classifying the Hurst values.

2.3.3. Indicator Selection and Information Extraction

(1)
Indicator selection:
Hunan Province’s complex geographical environment, coupled with significant human interference, means that its vegetation growth and distribution are influenced by a variety of factors [30]. Based on the principles of representativeness, dynamism, systematic relevance, scientific rigor, and quantifiability, and considering the specific conditions of the study area, our study developed an indicator system. This system includes five categories of factors—climate, geomorphology, soil, vegetation, and human activity—comprising a total of 21 variables used to explore the drivers of spatial variation in the NDVI in Hunan Province (see Table 1).
(2)
Information extraction:
Using the fishnet tool in ArcGIS 10.4, a 5 × 5 km grid was established across the study area, generating 8477 evenly distributed central points as sampling points. The NDVI values and attributes of each selected driving factor were extracted at these sampling points and spatially linked according to their geographic location, allowing for the quantification of the relationships between the NDVI and the selected indicators.

2.3.4. Optimal Parameters-Based Geographic Detector

To address the challenges posed by the nonlinear correlations among multiple factors and the spatial heterogeneity of these factors, our study applied the optimal parameters-based geographic detector (OPGD) model to quantitatively analyze the factors influencing the NDVI. The OPGD model combines different methods for discretizing continuous variables and selects the optimal discretization parameter set by maximizing explanatory power. This approach enables more accurate spatial analysis. The classification methods used include natural breaks, equal intervals, standard deviation breaks, geometric intervals, and quantile breaks. The number of classifications was set between 3 and 10, following the principle of avoiding an excessive number of classes.
The OPGD model consists of four primary modules: factor detector, parameter optimization, interaction detector, and risk detector. Our study primarily focused on three key modules—parameter optimization, factor detection, and interaction detection—to thoroughly explore the driving mechanisms behind the spatial variation in the NDVI in Hunan Province.
(1) Factor detection: Detect the spatial heterogeneity of the dependent variable Y and identify the extent to which the explanatory factors X explain the spatial differentiation of Y. The formula is as follows [31]:
q = 1 1 N σ 2 h = 1 L N h σ h       2
where L represents the stratification of the dependent variable, Y, or the factor, X, Nh and σ h   2 are the number of units and the variance of Y in layer h, respectively, and N and σ 2 represent the total number of units and the variance of Y across the study area, respectively. The q-value is in the range [0, 1], where a higher value indicates that the factor X explains a larger portion of the NDVI’s spatial differentiation.
(2) Parameter optimization: This step involves optimizing both the discretization parameters of variables and the spatial scale. Typically, optimal discretization parameters can be determined using the GD package in R, using equal intervals (equal), natural breaks (natural), quantiles (quantile), geometric intervals (geometric), and standard deviation (sd) classification methods. The number of breakpoints is set between 4 and 10 categories, and the combination that yields the highest q-statistic from the factor detector calculation is chosen as the optimal discretization parameter.
(3) Interaction detection: This step assesses whether the combined explanatory power of factors X1 and X2 on the spatial differentiation of Y is enhanced, weakened, or independent. The results of the interaction detection are classified into five categories, as shown in Table 3.

2.3.5. Data Discretization

As the optimal parameters-based geographic detector requires categorical variables as inputs, continuous variables must be discretized. Relevant studies suggest that classification effectiveness can be evaluated using the q-statistic, with higher q-values indicating better classification results. Based on prior research and considering both model accuracy and computational efficiency [31], we used the GD package in R software (v4.3.2) to classify climate factors, elevation, and population density. The parameter group with the highest q-statistic was selected as the optimal discretization. The number of categories for these variables ranged between 5 and 9.
For variables requiring classification based on industry standards or pre-discretized variables, the natural breaks method was used to classify other factors driving spatial variation in Hunan’s NDVI. According to the Comprehensive Control Plan for Soil and Water Conservation (GB/T 15772-2008) [32], slope was categorized into 6 classes. Aspect was classified into 9 categories, with 0° representing true north and each category covering a 45° interval. Additionally, geomorphology, soil type, vegetation type, and land use were categorized into 8, 13, 7, and 6 classes, respectively, based on general classification standards.

2.3.6. Threshold Response Analysis

The threshold response analysis was conducted using segmented regression in R’s “segment” package [33]. This analysis aimed to explore the spatial relationships between key driving factors and the NDVI across different partition scales. On the one hand, we examined the variations in the relationships between major driving factors and the NDVI across different value ranges. On the other hand, we identified inflection points in threshold changes, providing data-driven insights for afforestation policies in different regions.
Since the threshold analysis focused primarily on quantifying the effects of key driving factors on the spatiotemporal variation in the NDVI, and because our study aimed to analyze threshold responses across different partition scales, pre-discretized categorical variables (such as geomorphology, soil type, vegetation type, and land use) were excluded. Thus, the threshold response analysis concentrated on continuous variables.

3. Results

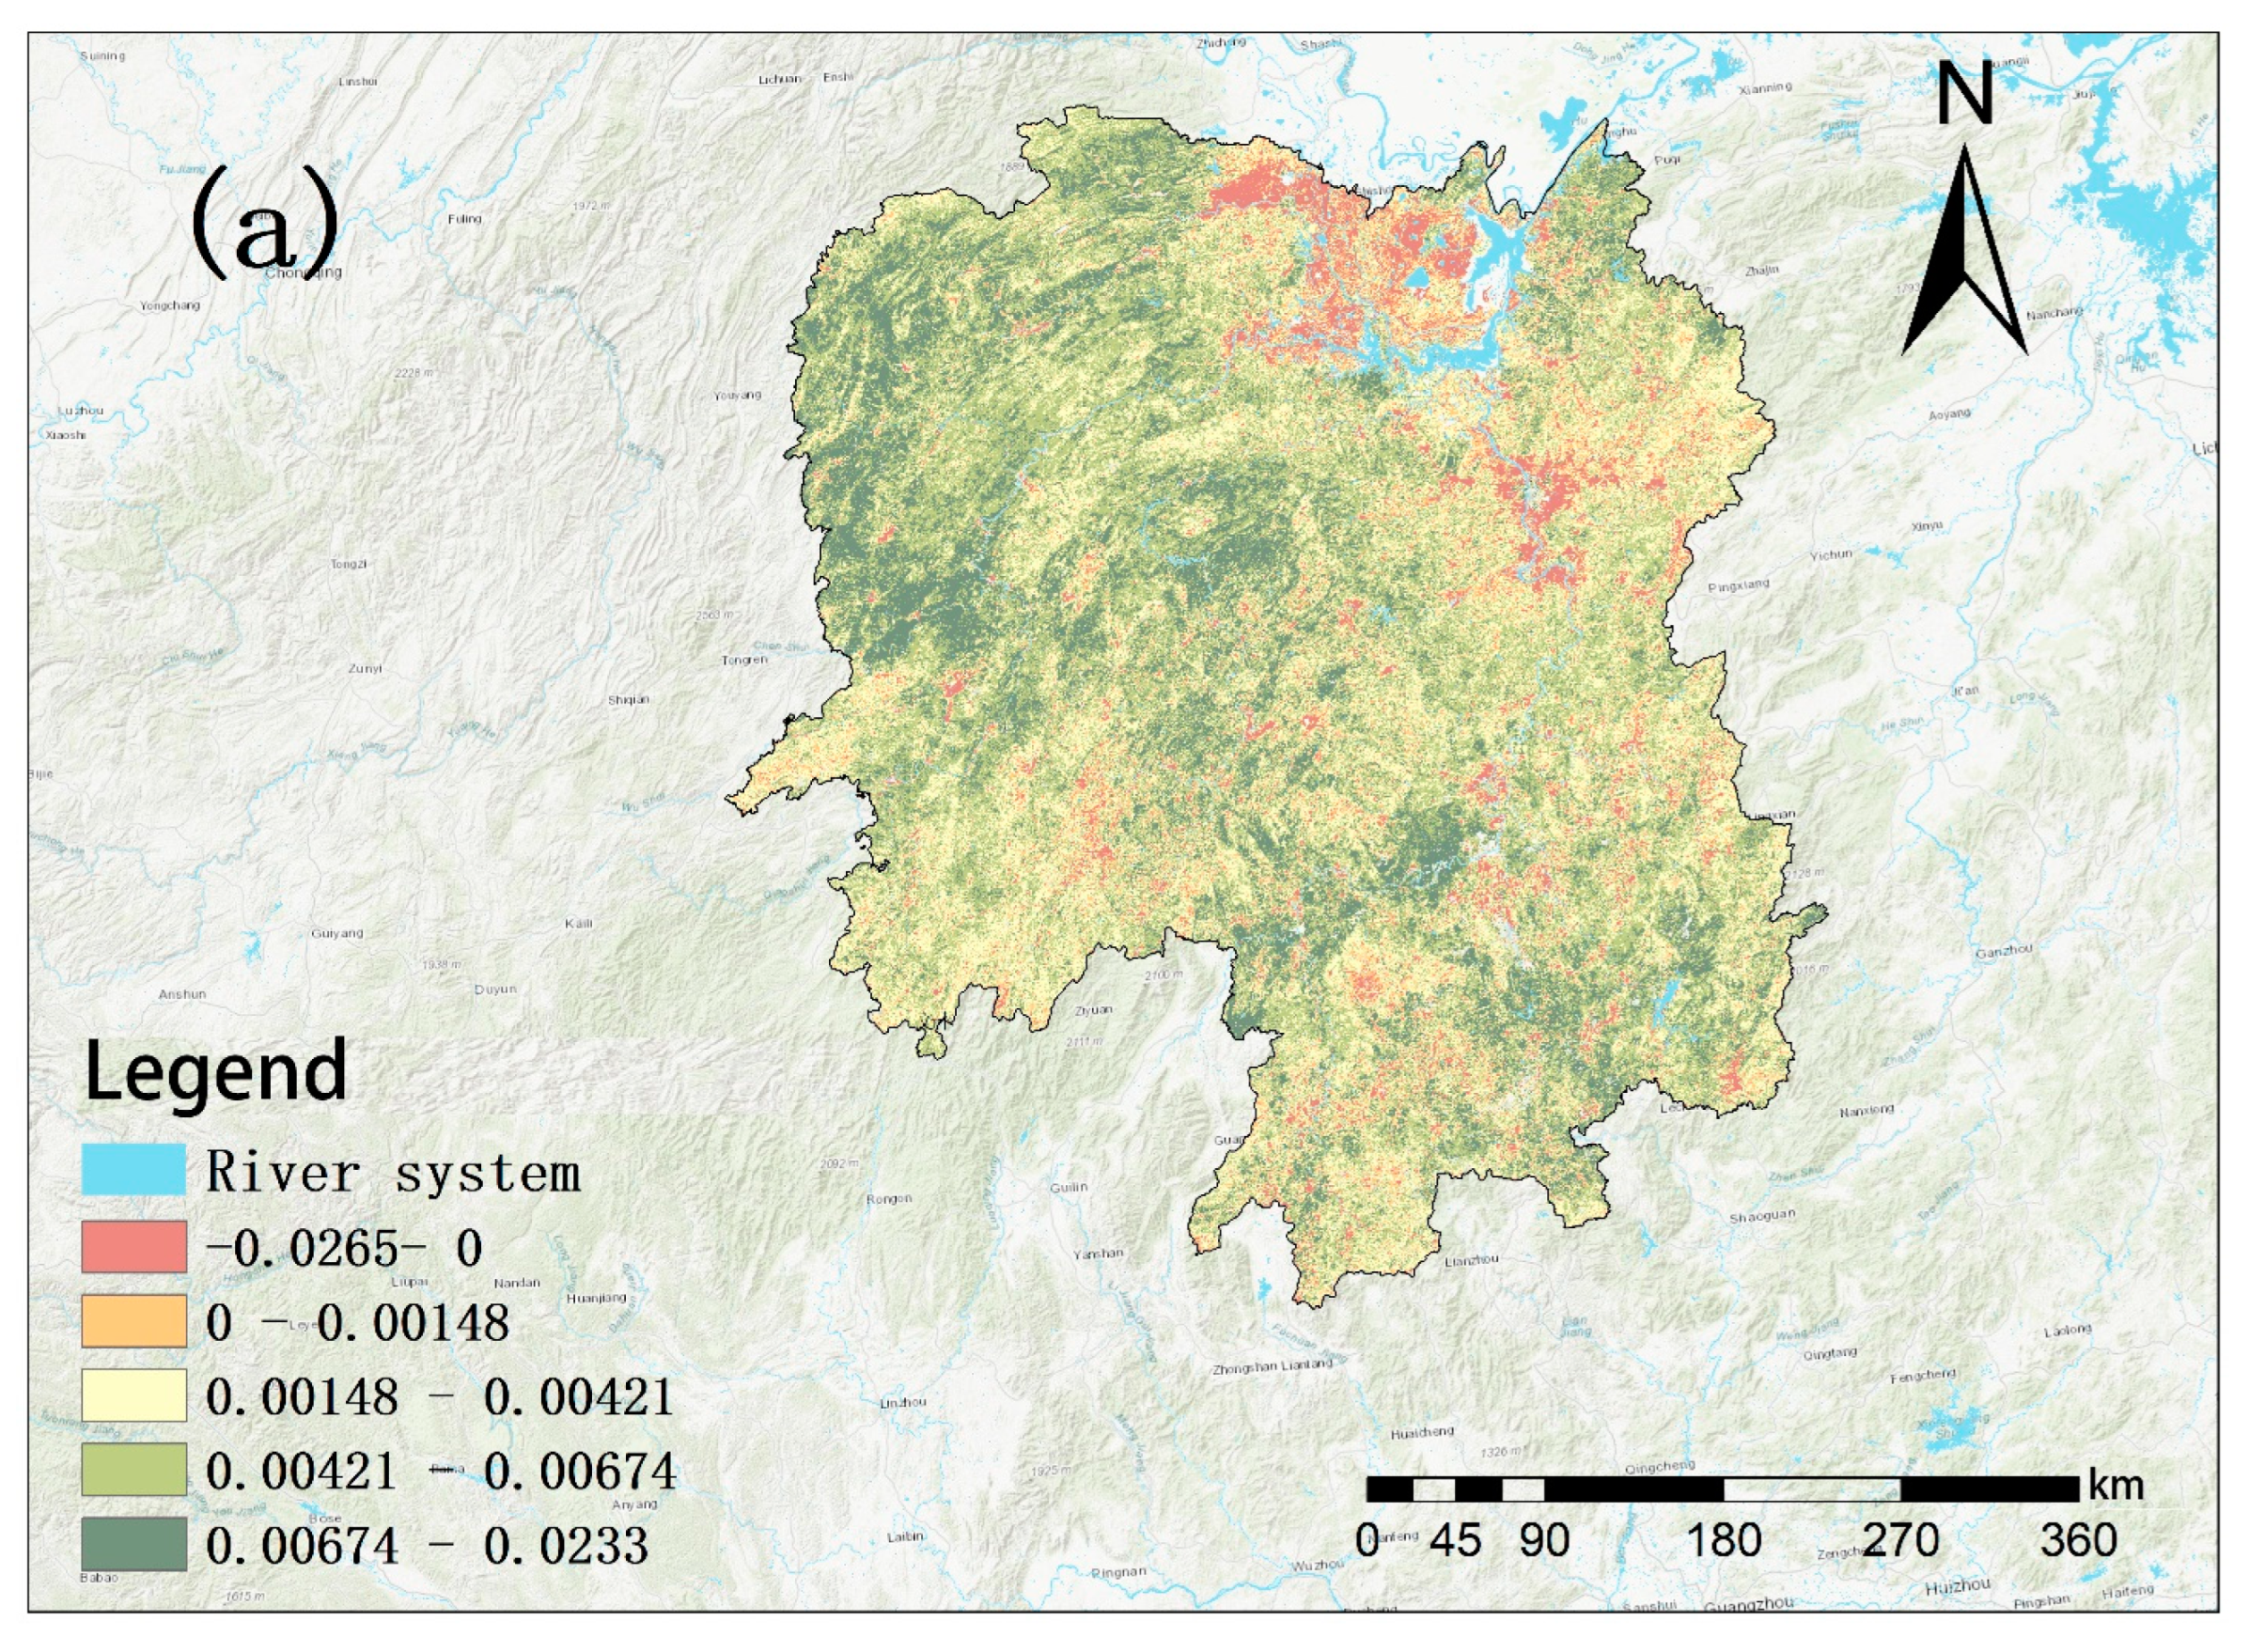
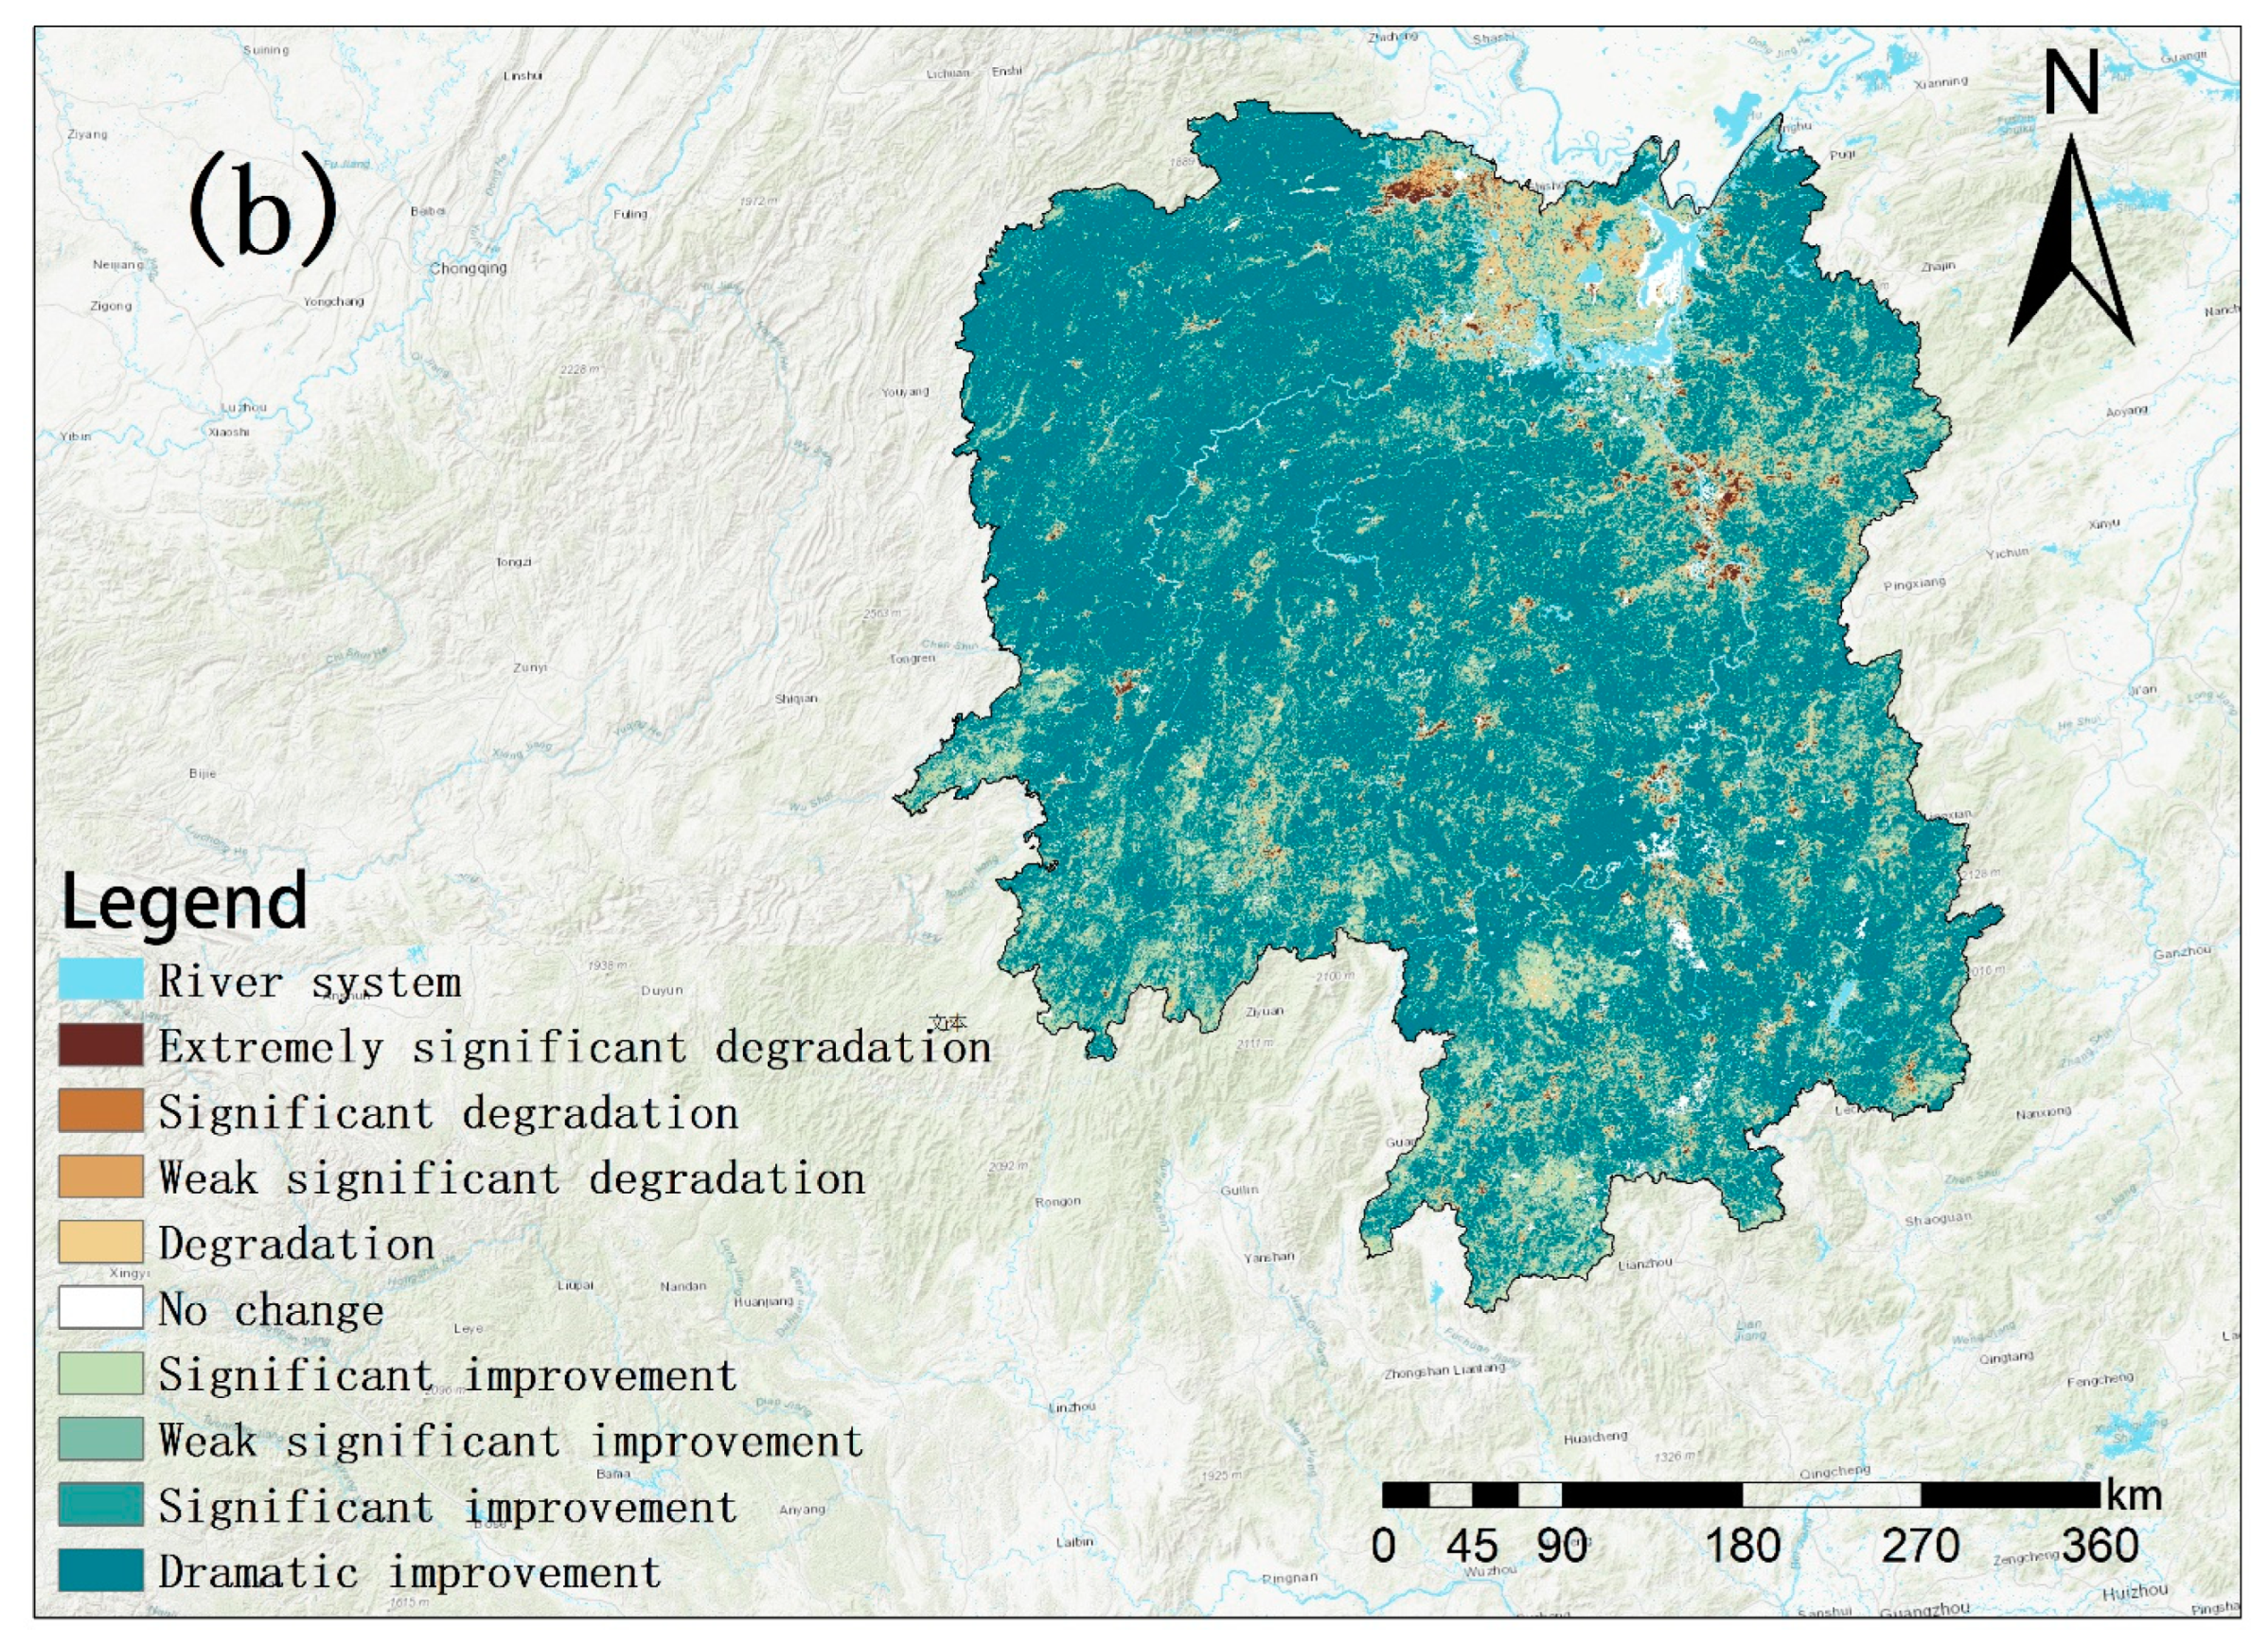
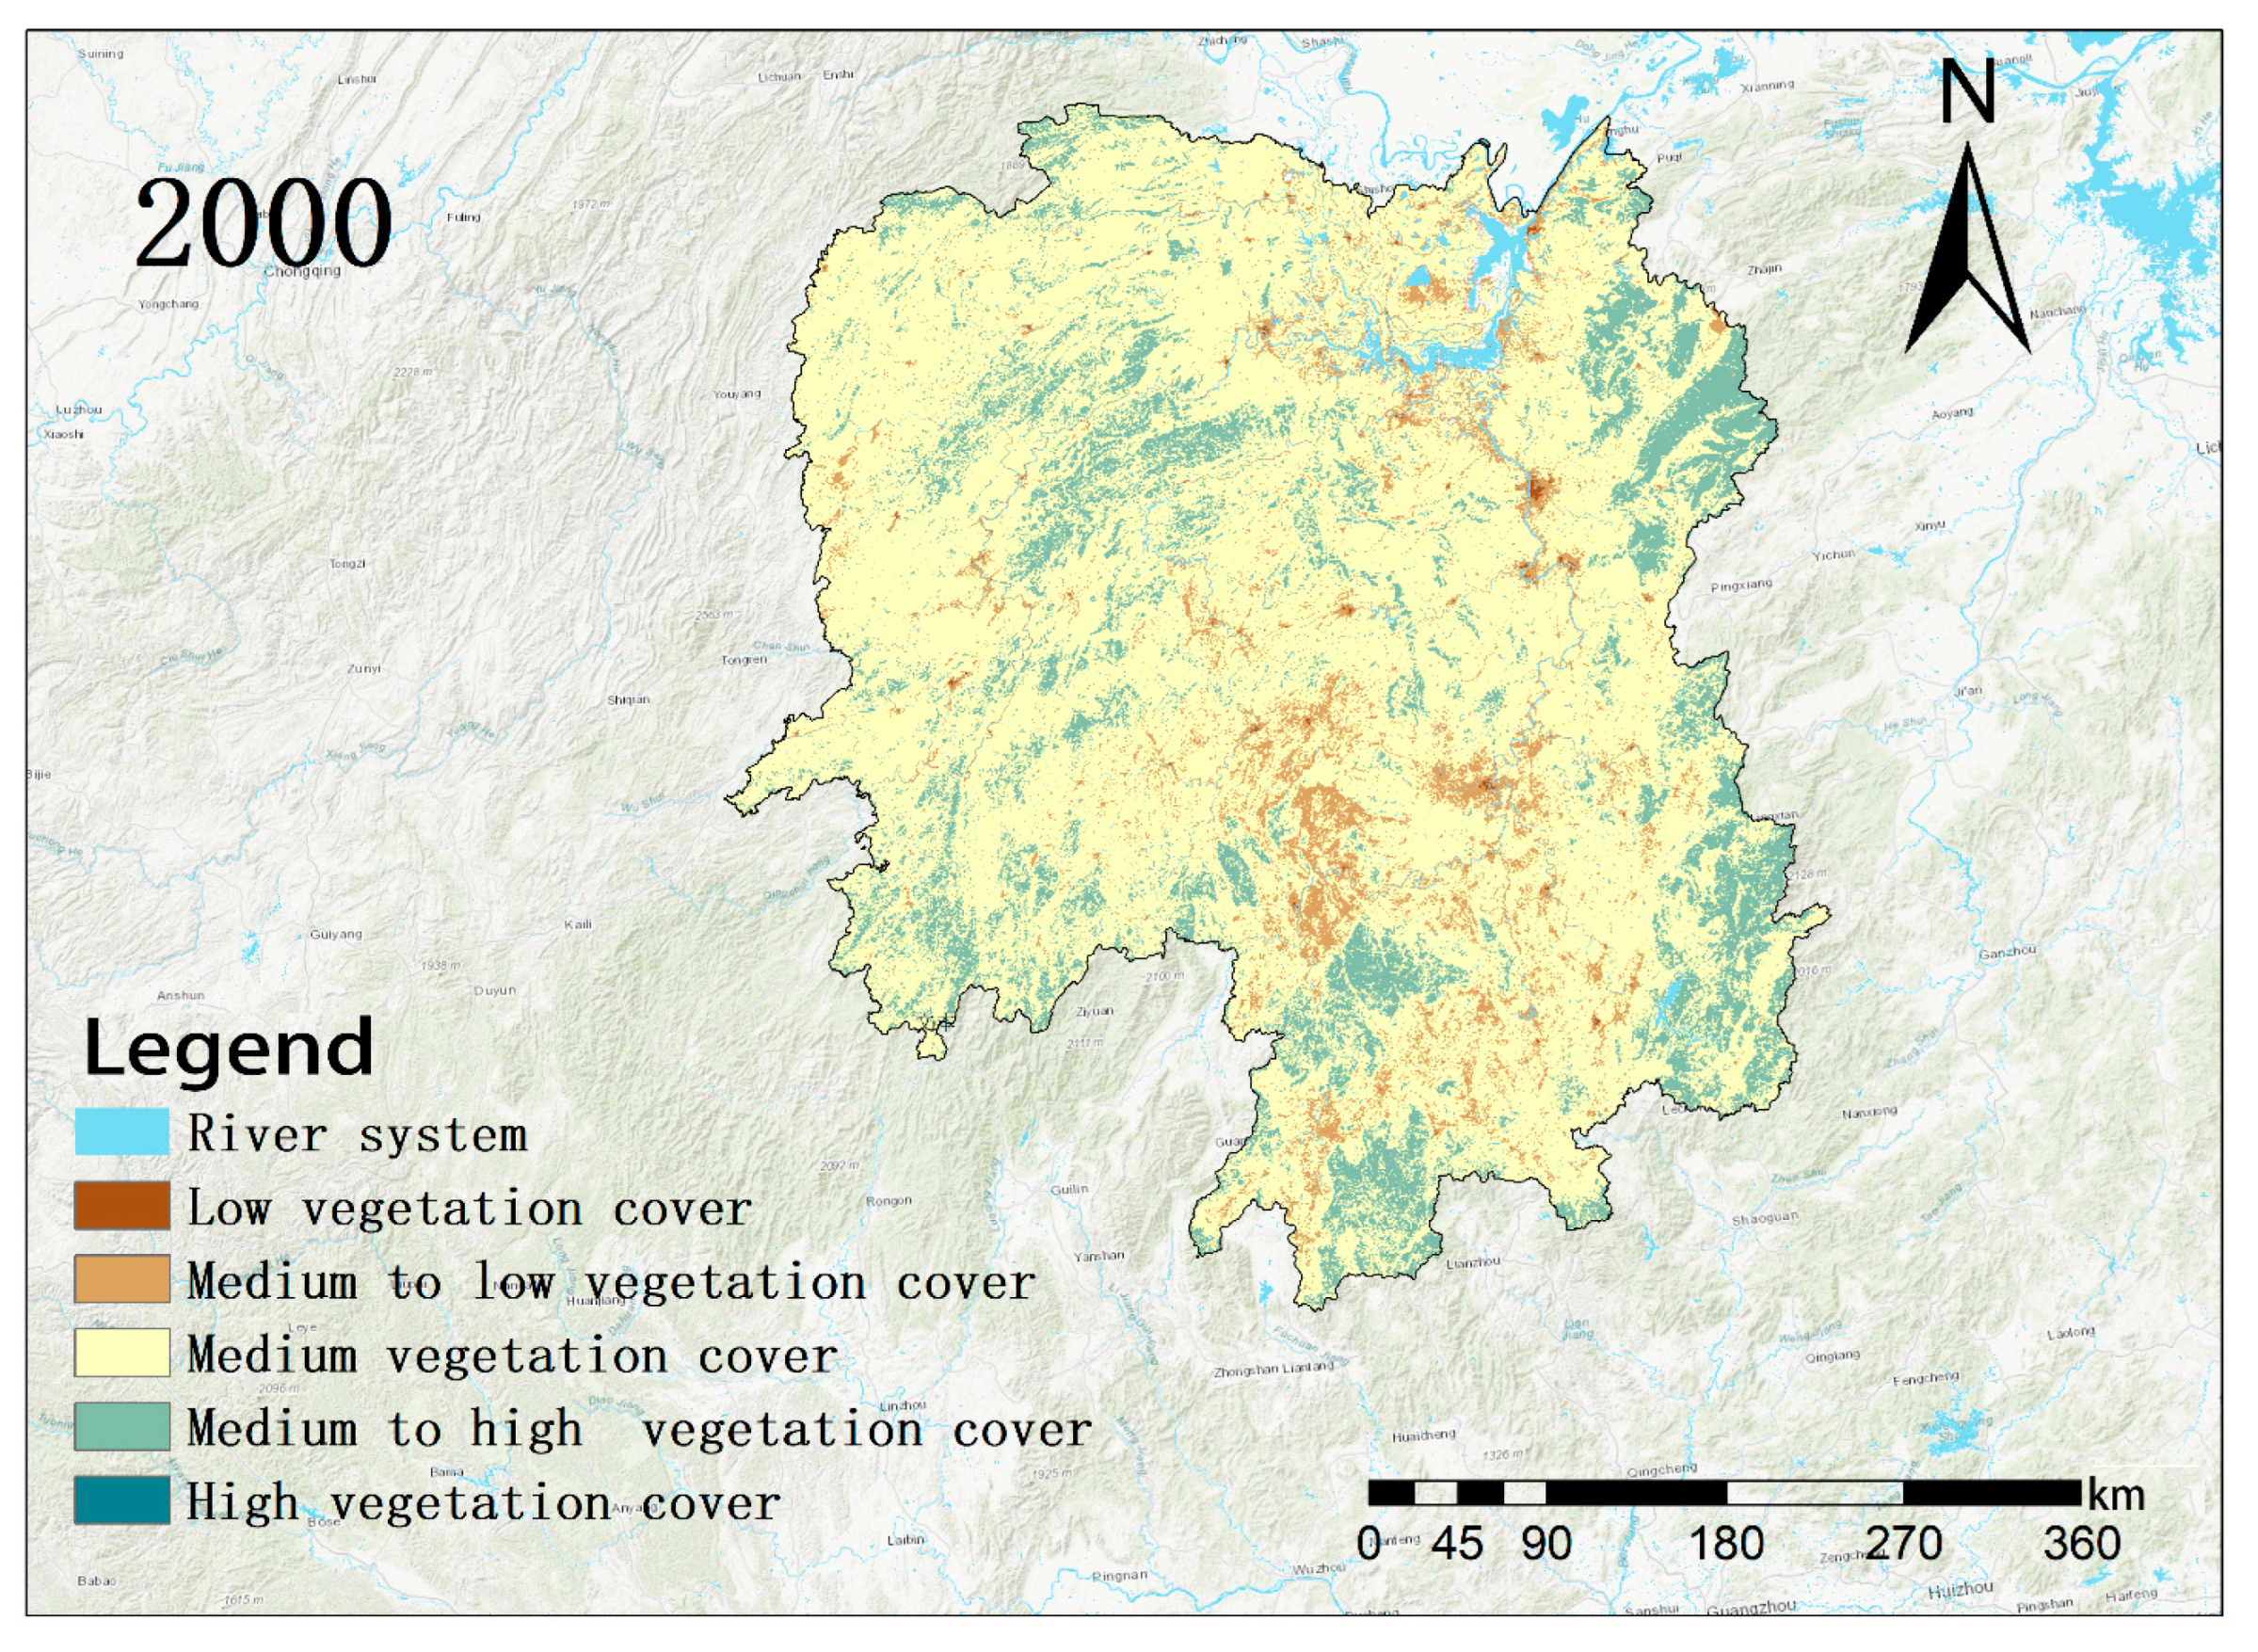
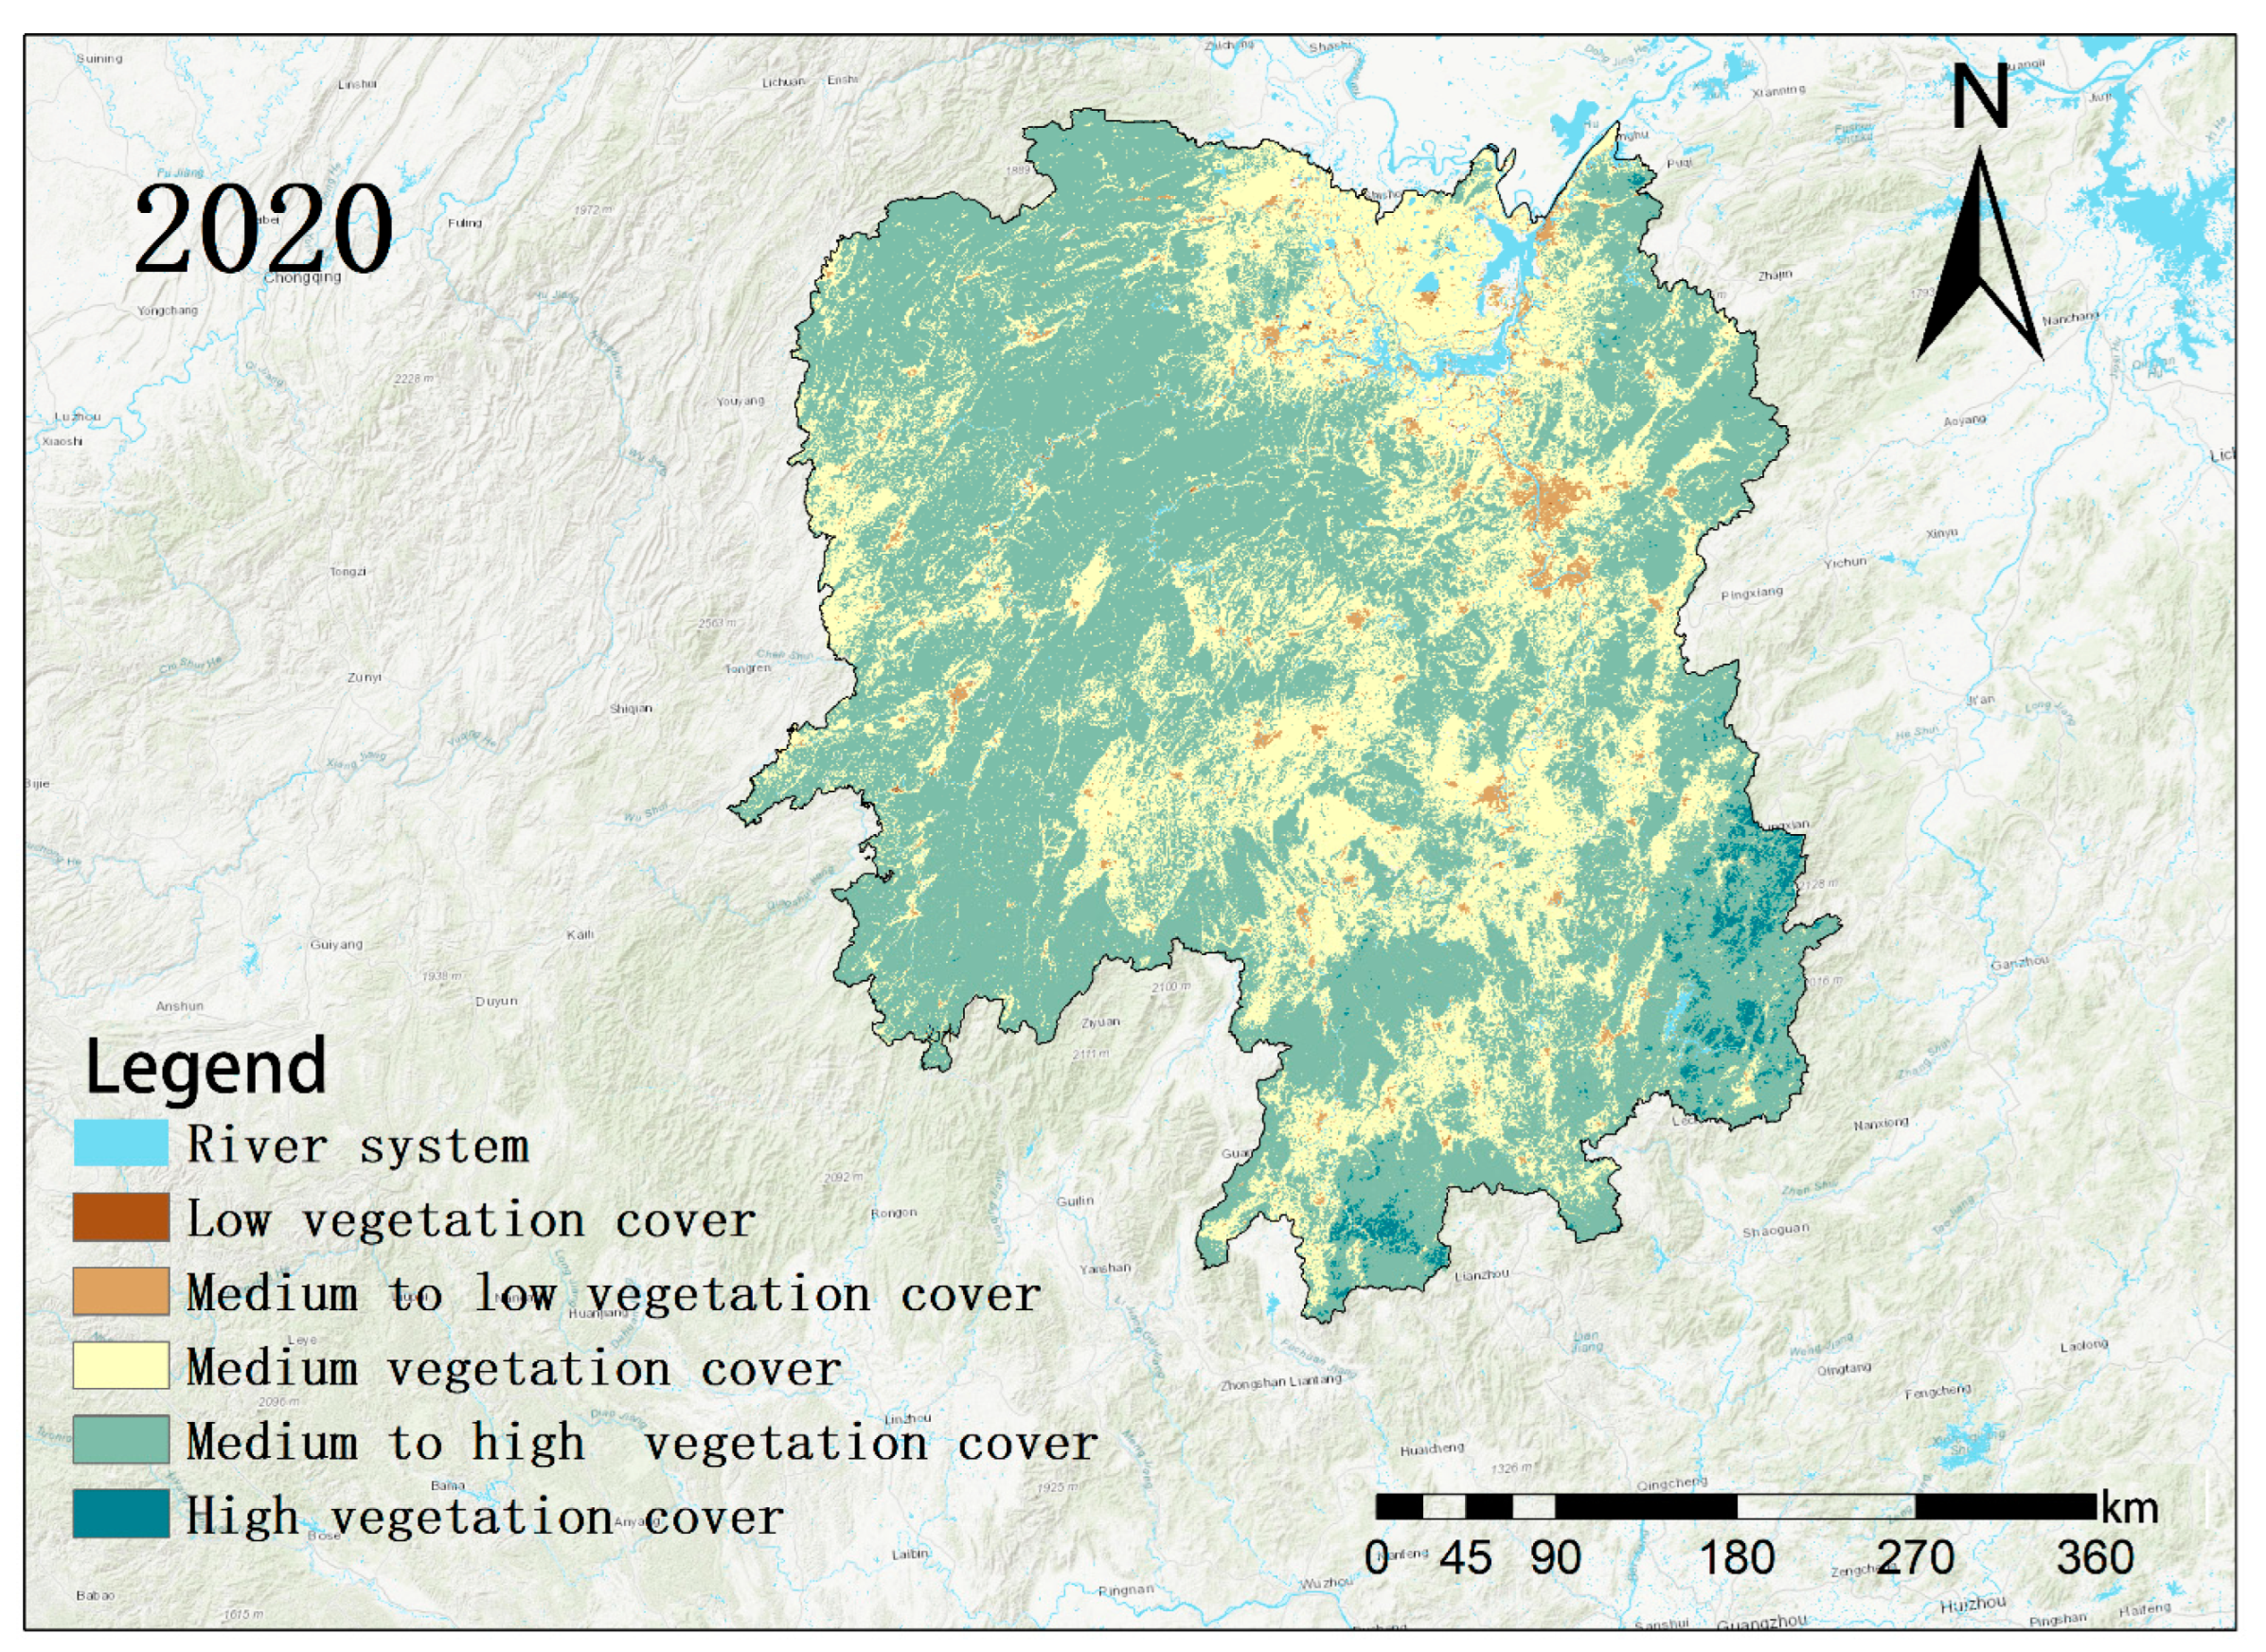
3.1. Analysis of Spatiotemporal Evolution of the NDVI

From 2000 to 2020, the spatial variation in the NDVI across Hunan Province exhibited significant differentiation, forming a pattern of “high in the east and west, low in the north and south”. High NDVI values were mainly concentrated in the Tujia–Miao Autonomous Prefecture, Zhangjiajie, Huaihua, and Yongzhou, while lower values were observed around the Chang-Zhu-Tan Region, Hengyang, and Changde. This pattern is attributable, on the one hand, to the distribution of vegetation types, and on the other, to the relatively flat terrain of the Chang-Zhu-Tan Region, where rapid urbanization—especially in the densely developed urban cores—has somewhat inhibited vegetation growth.
Regarding distributional changes from 2000 to 2020, areas with low, moderately low, and medium vegetation cover showed an overall decline, while areas with moderately high and high vegetation cover expanded. The transition matrix provides a detailed account of the shifts between different vegetation cover levels. Over the 21 years studied, the total transition area for the NDVI was 116,062.125 km2, accounting for 55.7% of the study area. Most transitions occurred toward adjacent higher levels of vegetation cover, with the primary shift being “medium vegetation cover → moderately high vegetation cover” (97,927.5 km2, representing 47%), followed by “moderately low vegetation cover → medium vegetation cover” (12,283 km2, representing 5.8%). Overall, between 2000 and 2020, 1.2% of the area saw a decline in the NDVI, while 54.5% of the area experienced an increase to a higher NDVI level. This indicates a predominant positive shift in vegetation cover across the study area, reflecting overall ecological improvement in Hunan Province (Table 4).
The vegetation cover change in Hunan Province from 2000 to 2020 is shown in Figure 3, the average Sen trend for the NDVI in Hunan Province was 0.0043 year−1 (ranging from −0.0265 to 0.0233 year−1), with improvements observed across a total area of 191,076 km2, accounting for 91.72% of the province. The majority of these areas (71.9%) exhibited significant or highly significant improvements, while areas with moderate improvements accounted for 14.6%. These areas, primarily in regions such as Chang-Zhu-Tan and Changde, have experienced varying degrees of vegetation cover enhancement, underscoring the need to continue strengthening forestry and ecological initiatives in these locations. The degraded areas covered 17,529 km2, representing only 8.28% of the total area, and were scattered mainly across Changsha, Xiangtan, and Zhuzhou. This degradation is primarily driven by urban expansion, highlighting the severe challenges of vegetation depletion faced in these areas, which warrant continued attention.
As noted above, over the 21-year period, the Sen trend values for the NDVI in northeastern Hunan were generally lower than those in the southwest, although the degree of vegetation improvement was higher in the northeast. The trend of NDVI change exhibited clear spatial heterogeneity, with areas of vegetation improvement far exceeding areas of degradation. The significant success in ecological restoration is consistent with the findings of the spatial distribution analyses (Figure 4).

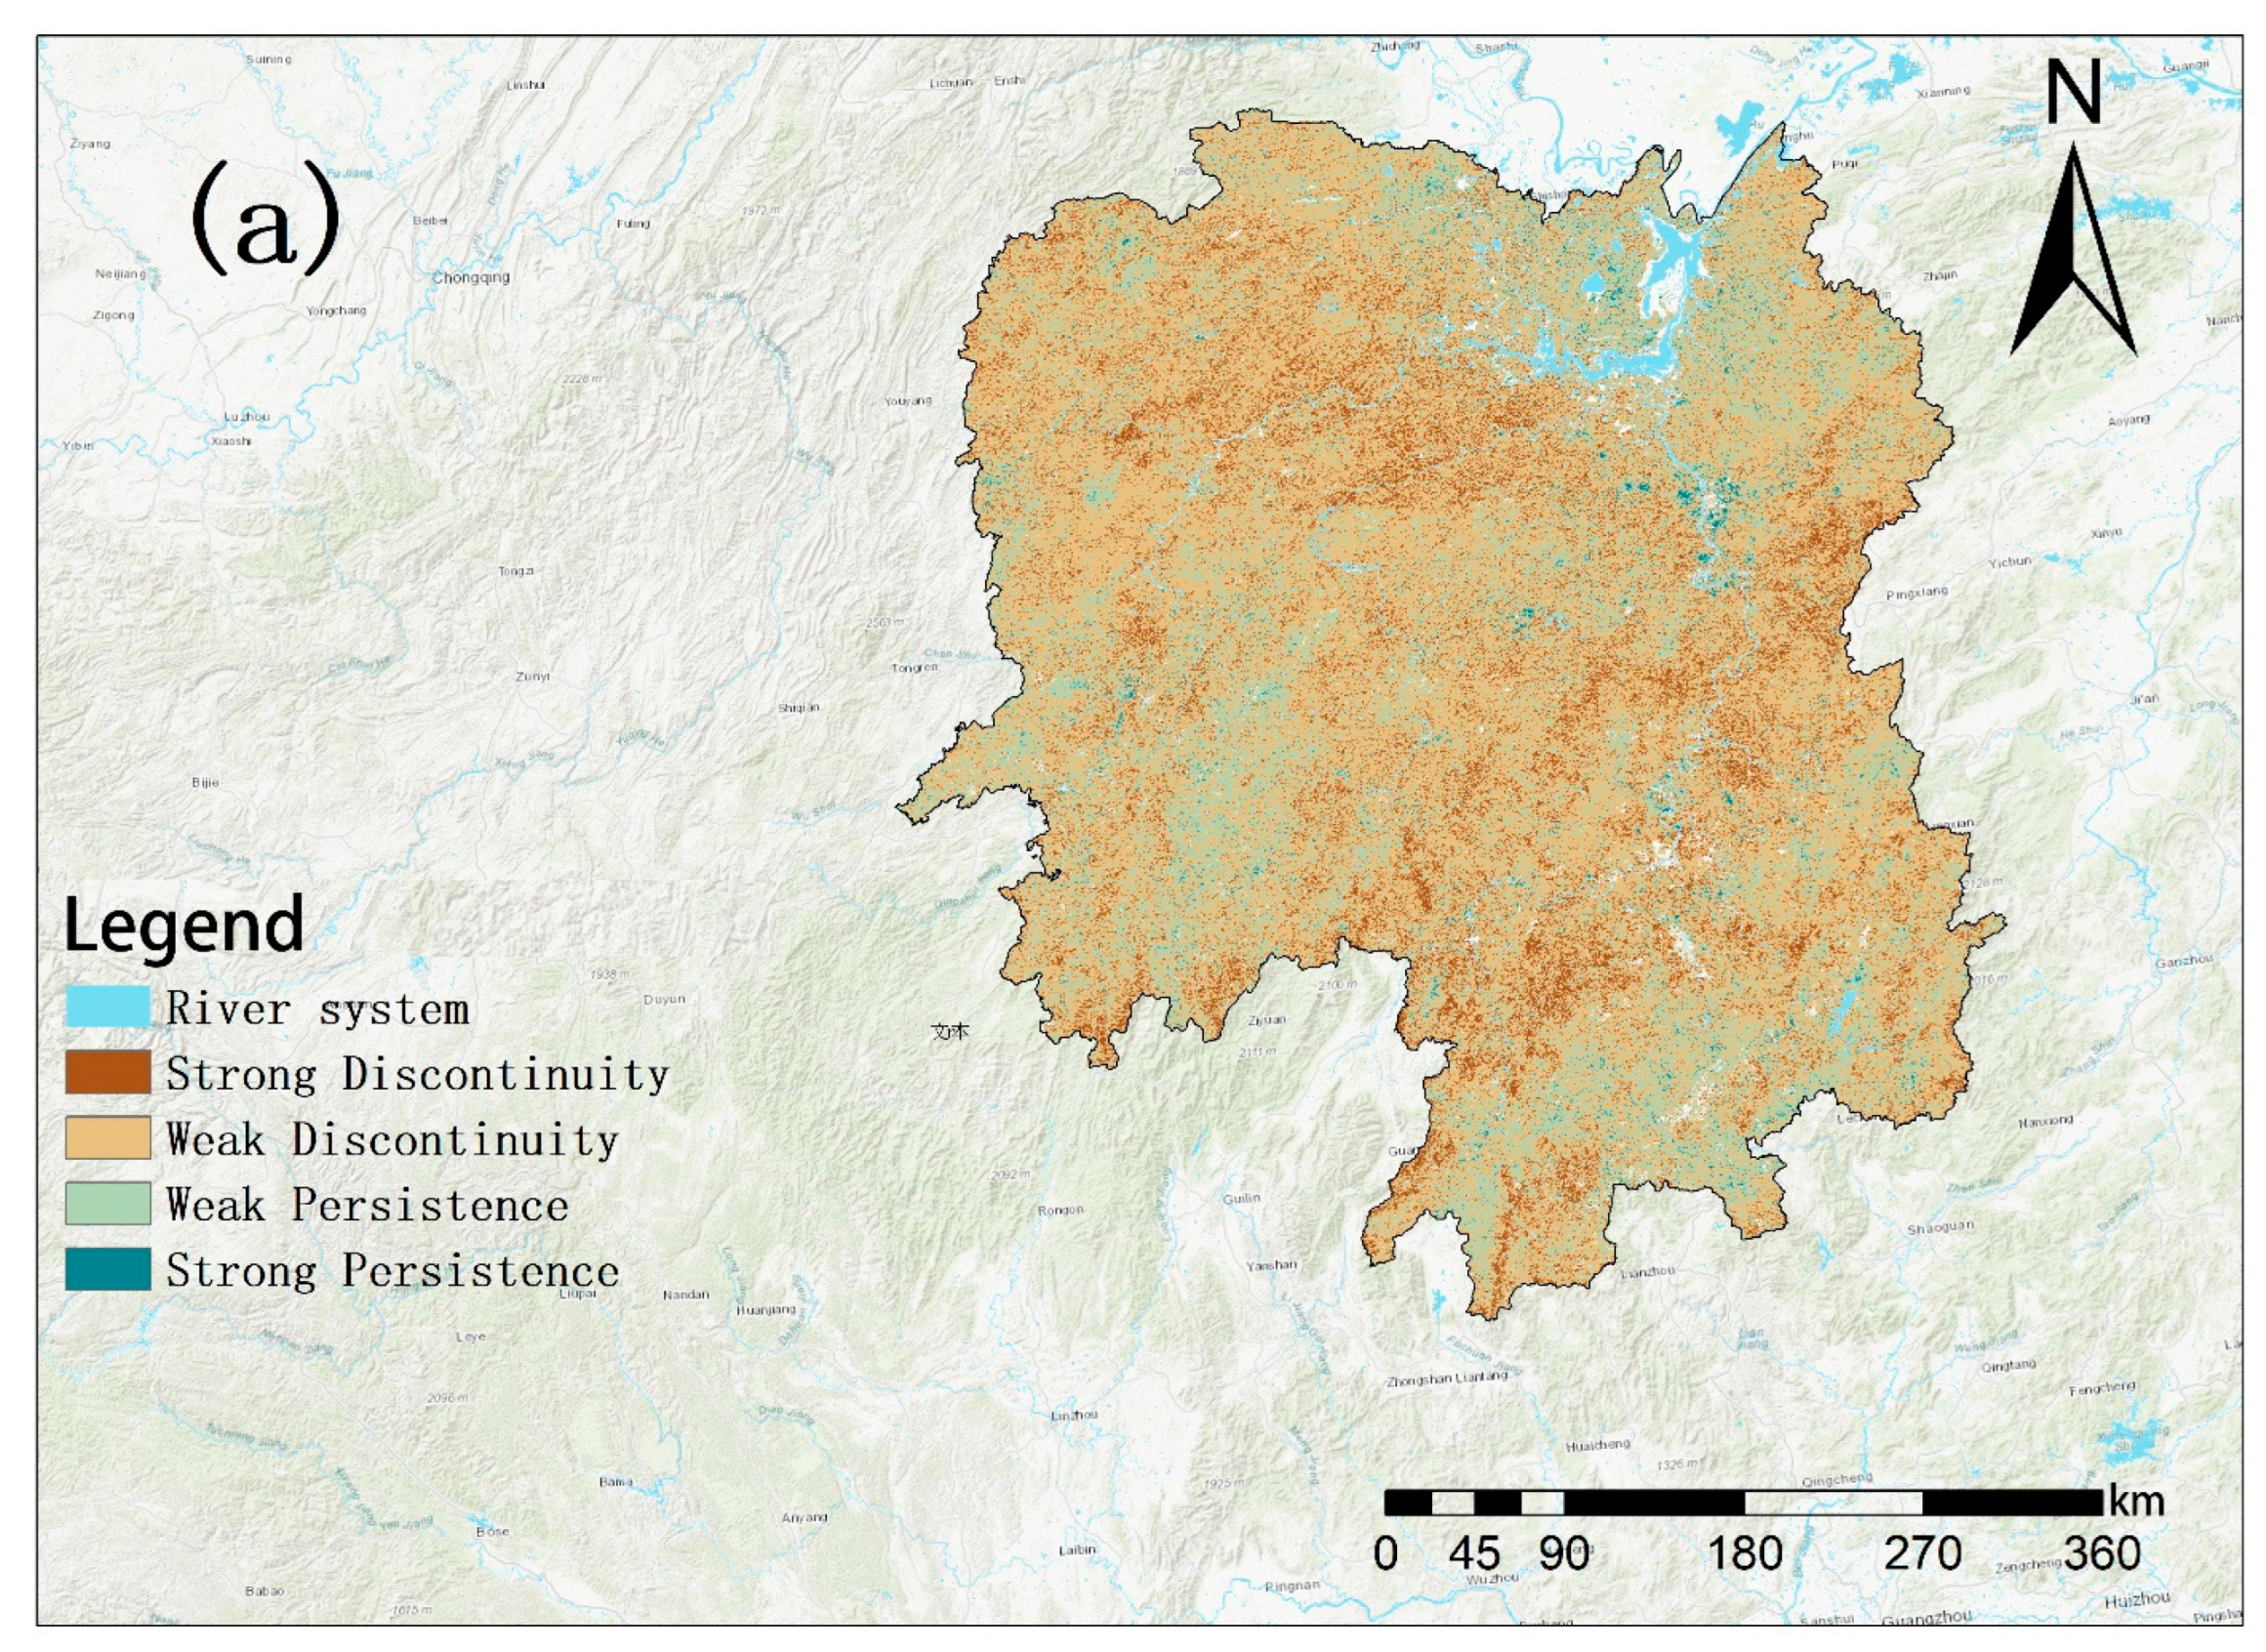
3.2. Future Evolution Characteristics

The mean H value of the NDVI for Hunan Province was 0.44 (ranging from 0.119 to 0.974), with 76.7% of pixels showing H < 0.5, indicating an overall anti-persistent trend for future NDVI dynamics (Figure 5). Based on the actual H values across the study area, four categories were established: strong and weak persistence and strong and weak anti-persistence. Weak anti-persistence was the most common category, accounting for 63.5% of the area and being widely distributed. Weak persistence followed, representing 21.9%, with weakly persistent degradation mainly concentrated in the Chang-Zhu-Tan Region, as well as the Changde and Yueyang areas, while weakly persistent improvement was more widely distributed. Strong persistence covered a smaller area, accounting for 14.47%, and appeared in scattered patches. Strong anti-persistence was also significant, covering 13.2% of the area.
To further elucidate the future evolution patterns of the NDVI in Hunan, a spatial coupling overlay analysis was conducted by combining the NDVI trends with H values (Figure 5). The analysis revealed that 24.3% of the area is likely to experience future improvements in NDVI, primarily driven by weak persistence, which accounts for 19.8% of the area, although this improvement will be scattered. In contrast, 75.6% of the area is expected to undergo future degradation, with weak anti-persistence dominating at 60.5%, and this trend is more widespread. Overall, the growth of the NDVI in Hunan Province may slow in the future, with weak persistence being the predominant trend. The spatial distribution of future changes is expected to remain fragmented. Notably, some areas around the Chang-Zhu-Tan junction showed a strong trend of persistent degradation, while strong anti-persistent improvement trends were observed along river corridors within the province.

3.3. Geodetector Analysis of the NDVI’s Driving Factors

3.3.1. Influence Detection

Global Influence Detection

From a stationary viewpoint, based on the NDVI and various influencing factors in Hunan Province from 2000 to 2020, we found that all factors passed the significance test (p < 0.001) in explaining spatial variation in the NDVI, indicating that the q-values for these factors were statistically significant. This indicates that these factors have a notable influence on the spatial differentiation of the NDVI and can effectively explain the spatial patterns of vegetation cover. The explanatory power was categorized into four levels: strong (0.5 ≤ q < 1), moderate (0.3 ≤ q < 0.5), weak (0.1 ≤ q < 0.3), and none (0 ≤ q < 0.1). Slope and geomorphology were found to have moderate explanatory power, while annual average temperature, photosynthetically active radiation, EI, Eb, Ew, S, SMS, elevation, soil type, vegetation type, and land use type were classified as having weak explanatory power. The remaining variables had no discernible impact on the NDVI’s spatial variation (Table 5).
In a dynamic analysis, the explanatory power of various factors influencing the spatial variation in the NDVI in Hunan Province showed distinct trends over time. During the periods of 2000–2005, 2005–2010, 2010–2015, and 2015–2020, notable increases were observed in the q-values for population density, Ei, and Ew, while the q-values for temperature, photosynthetically active radiation, and elevation displayed a downward trend. Other variables exhibited relatively stable q-values, with a general tendency toward growth. The pronounced rise in the q-value for population density highlights the increasing impact of urban population growth on vegetation cover, reflecting the effects of accelerated urbanization in Hunan. Meanwhile, the decline in q-values for temperature and photosynthetically active radiation may correspond to a gradual weakening of light and thermal conditions over the past 21 years. These trends illustrate that, as urban expansion and human activities intensify, the influence of natural factors on vegetation cover is diminishing, whereas the role of anthropogenic factors is becoming more prominent (Figure 6).

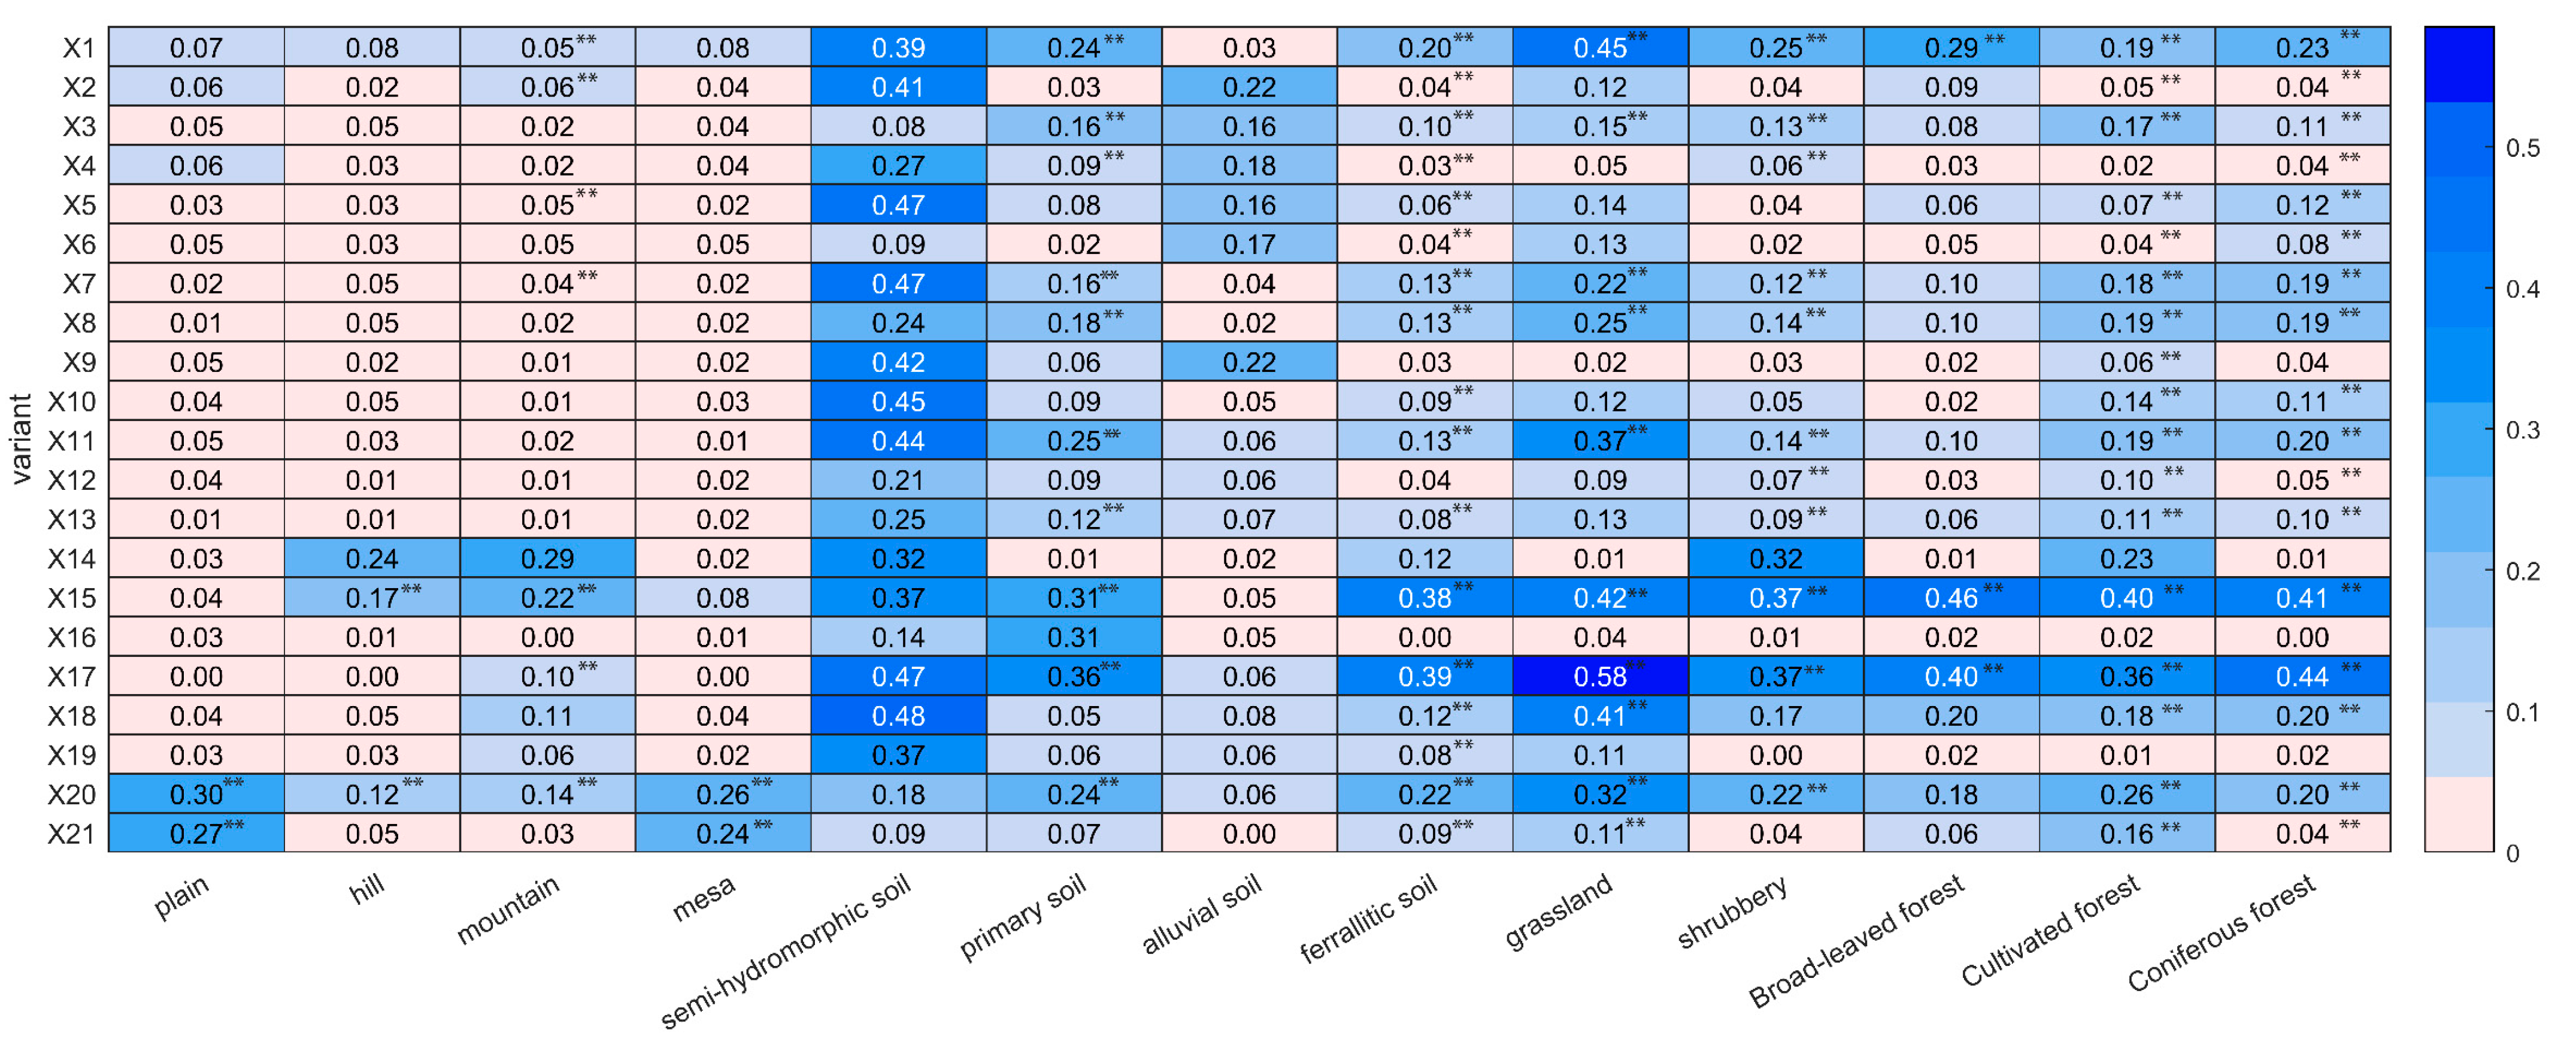
Regional Influence Detection

The explanatory power of various factors on the spatial variation in the NDVI exhibited significant differences across the different natural geographical subregions of Hunan Province (Figure 7). In the geomorphological divisions—plains, hills, mountains, and mesas—land use type was found to have the greatest influence on the NDVI’s spatial variation. Specifically, in the plains, population density and land use type were the primary drivers of variation in the NDVI. In the hilly and mountainous regions, slope and land use type emerged as the dominant factors influencing the NDVI’s spatial differentiation. For mesas, land use type and population density were the key variables shaping the NDVI’s spatial patterns. In general, terrain and human activity factors, such as land use and population density, demonstrated relatively strong explanatory power for spatial variation in the NDVI, whereas other factors exhibited comparatively weaker influence across the geographical divisions.
None of the influencing factors in the soil subregions passed the significance test in the alluvial and semi-hydromorphic soil areas. This outcome was likely due to the relatively small proportion of these soil types in the province, resulting in a limited sample size. In contrast, slope and geomorphological type were identified as the common primary drivers of the NDVI’s spatial variation in primary and ferrallitic soils, with q-values ranging between 0.3 and 0.4, indicating moderate explanatory power. In the primary soil subregion, other key factors influencing the NDVI’s spatial differentiation included temperature, S, and land use type. Geomorphology emerged as the primary driver of the NDVI’s spatial variation for juvenile and ferrallitic soils, which represent a larger proportion of the province’s soil.
Across different vegetation subregions, slope and geomorphological type consistently stood out as the dominant factors shaping the NDVI’s spatial patterns. In grassland areas, temperature, soil type, and land use type were the top three drivers of the NDVI’s spatial variation. In the shrubbery, broadleaf forest, cultivated forest, and coniferous forest subregions, slope and geomorphological type again proved to be the primary drivers. On the whole, across Hunan Province, whether considering geomorphological or other spatial stratifications, terrain and geomorphological factors played a key role in driving the NDVI’s spatial variation. Nevertheless, the variation in spatial stratifications highlights differences in the factors influencing the NDVI’s spatial distribution.

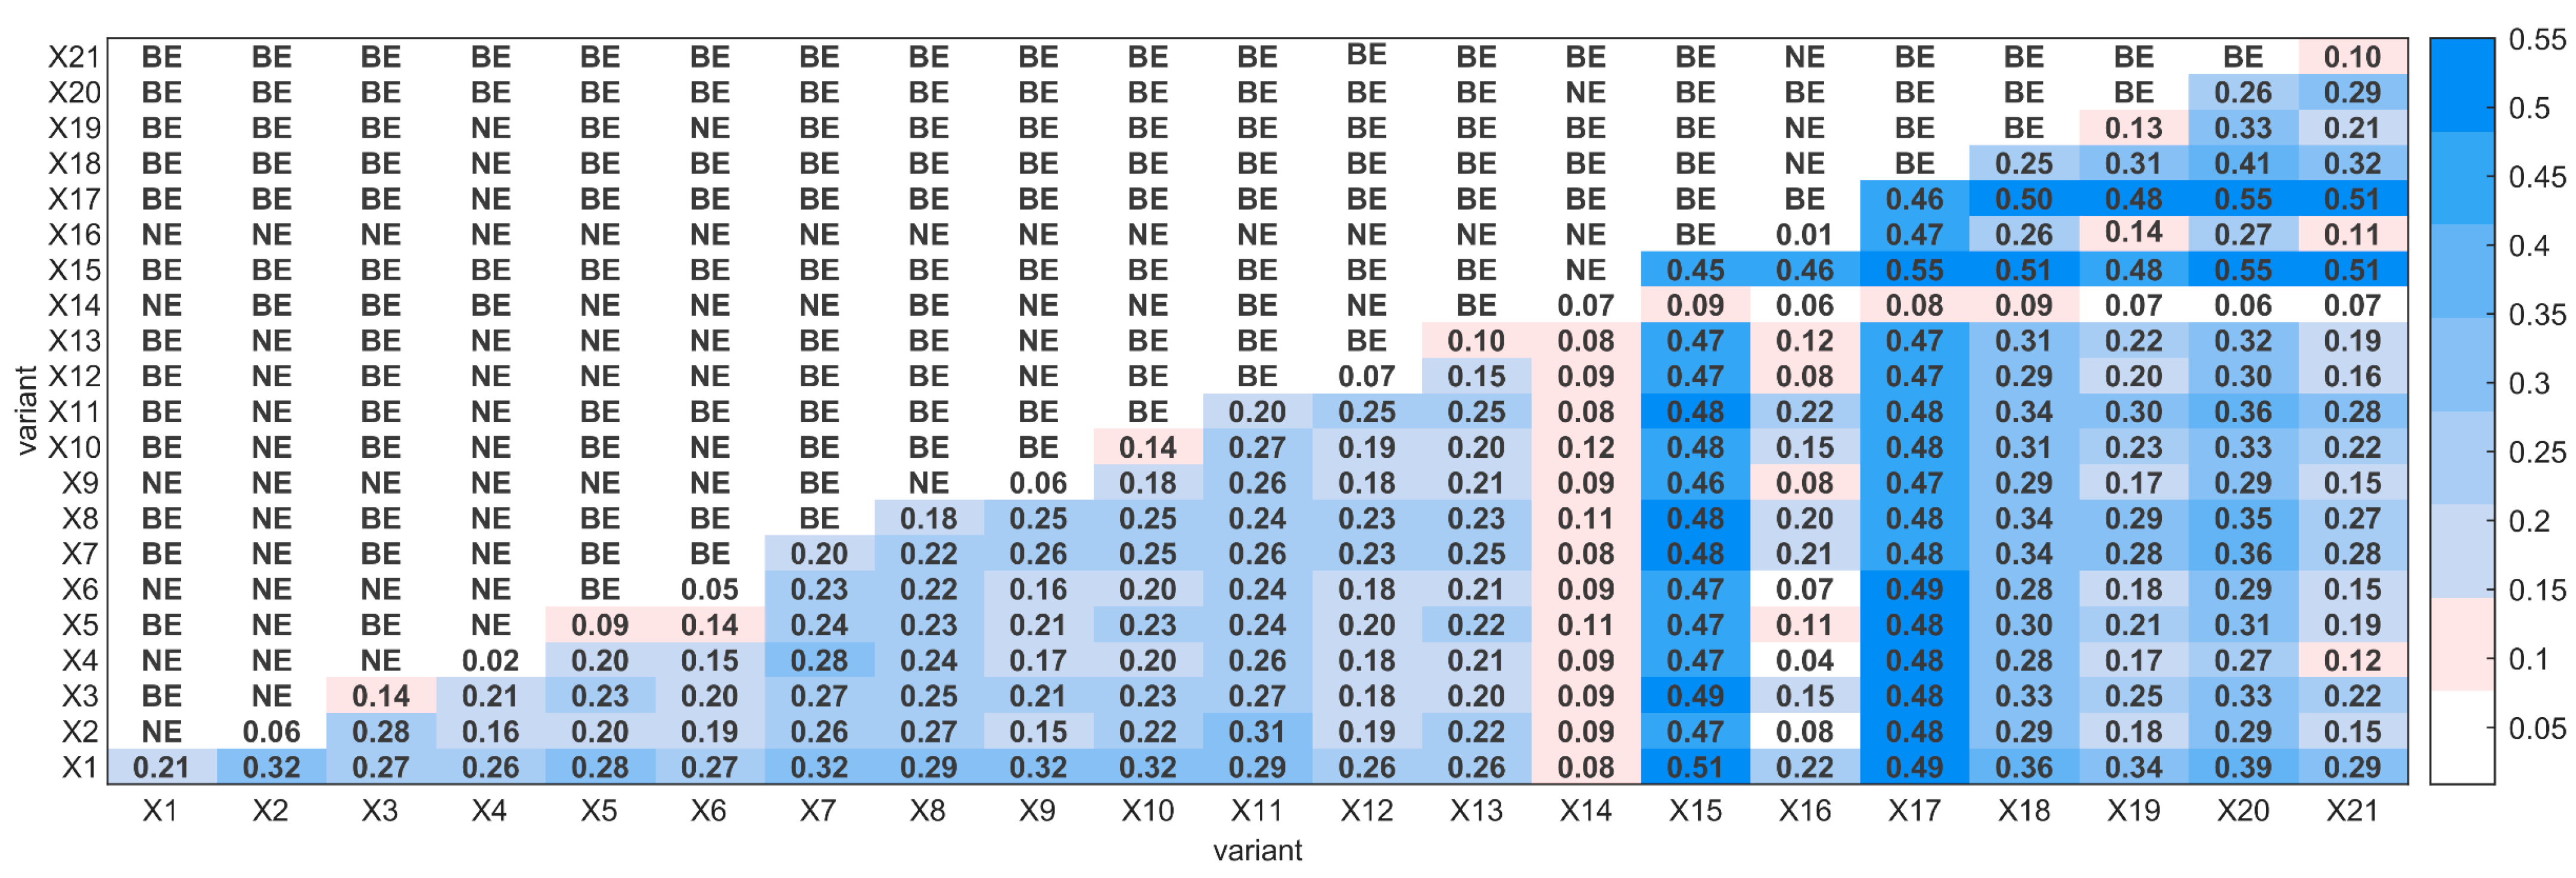
3.3.2. Interaction Detection

Global Interaction Detection

The interaction effects between different factors on the NDVI’s spatial variation in Hunan Province yielded q-values ranging from 0.01 to 0.55 (Figure 8). The top three interactions in terms of explanatory power were geomorphological type ∩ land use type, slope ∩ geomorphological type, and slope ∩ land use type, each with a q-value of 0.55. These results suggest that the spatial variation in the NDVI is primarily driven by the synergistic effects of geomorphology and land use type. Additionally, the interactions among slope, geomorphology, and other factors typically showed moderate explanatory power (0.4 ≤ q ≤ 0.55). Compared to the other factor interactions, these interactions had higher q-values, further confirming the dominant role of geomorphological factors in explaining the NDVI’s spatial variation, as revealed by the influence detection analysis.
Broadly speaking, the interactions between factors were predominantly of the bivariate enhancement type, with nonlinear enhancement playing a lesser role. There were no cases of diminishing or independent interactions between pairs of factors, indicating that the explanatory power of any two-factor interaction was significantly higher than that of the individual factors alone (Figure 8).

Zonal Interaction Detection

The dominant interactions driving the NDVI’s spatial variation differed across subregions, yet the results were largely consistent with the global interaction analysis. In the geomorphological divisions, temperature ∩ land use type was the leading interaction in both plains and mesas. In the plains, the three most dominant interactions showed nonlinear enhancement, while on the terraces, only the primary factor exhibited nonlinear enhancement, with the other two showing bivariate enhancement. In hilly and mountainous regions, slope ∩ land use type was the primary interaction, with the other dominant interactions resulting from the interplay between slope and other factors. Taken together, the NDVI’s spatial variation in plains and terraces was primarily driven by the combined effects of land use type, temperature, and terrain. In contrast, in hilly and mountainous regions, the NDVI’s spatial variation was largely governed by interactions between slope and other factors (Table 6).
In the soil subregions, the primary interaction for semi-hydromorphic soil and alluvial soil was E ∩ aspect, with the other two dominant interactions also being related to aspect. For primary soil and ferrallitic soil, the primary interaction was land use type ∩ geomorphological type, with both exhibiting bivariate enhancement. Similarly, the other two key interactions—slope ∩ geomorphological type and slope ∩ land use type—were also characterized by bivariate enhancement. Overall, geomorphology continued to be the dominant factor driving the NDVI’s spatial variation across the soil subregions.
In the vegetation subregions, the primary driving interaction for shrubbery and coniferous forests was slope ∩ geomorphological type, while the other two key factors were related to slope and land use type. For grassland, broadleaf forest, and cultivated forest, the main driving interactions involved slope, land use type, and their interactions with other factors.

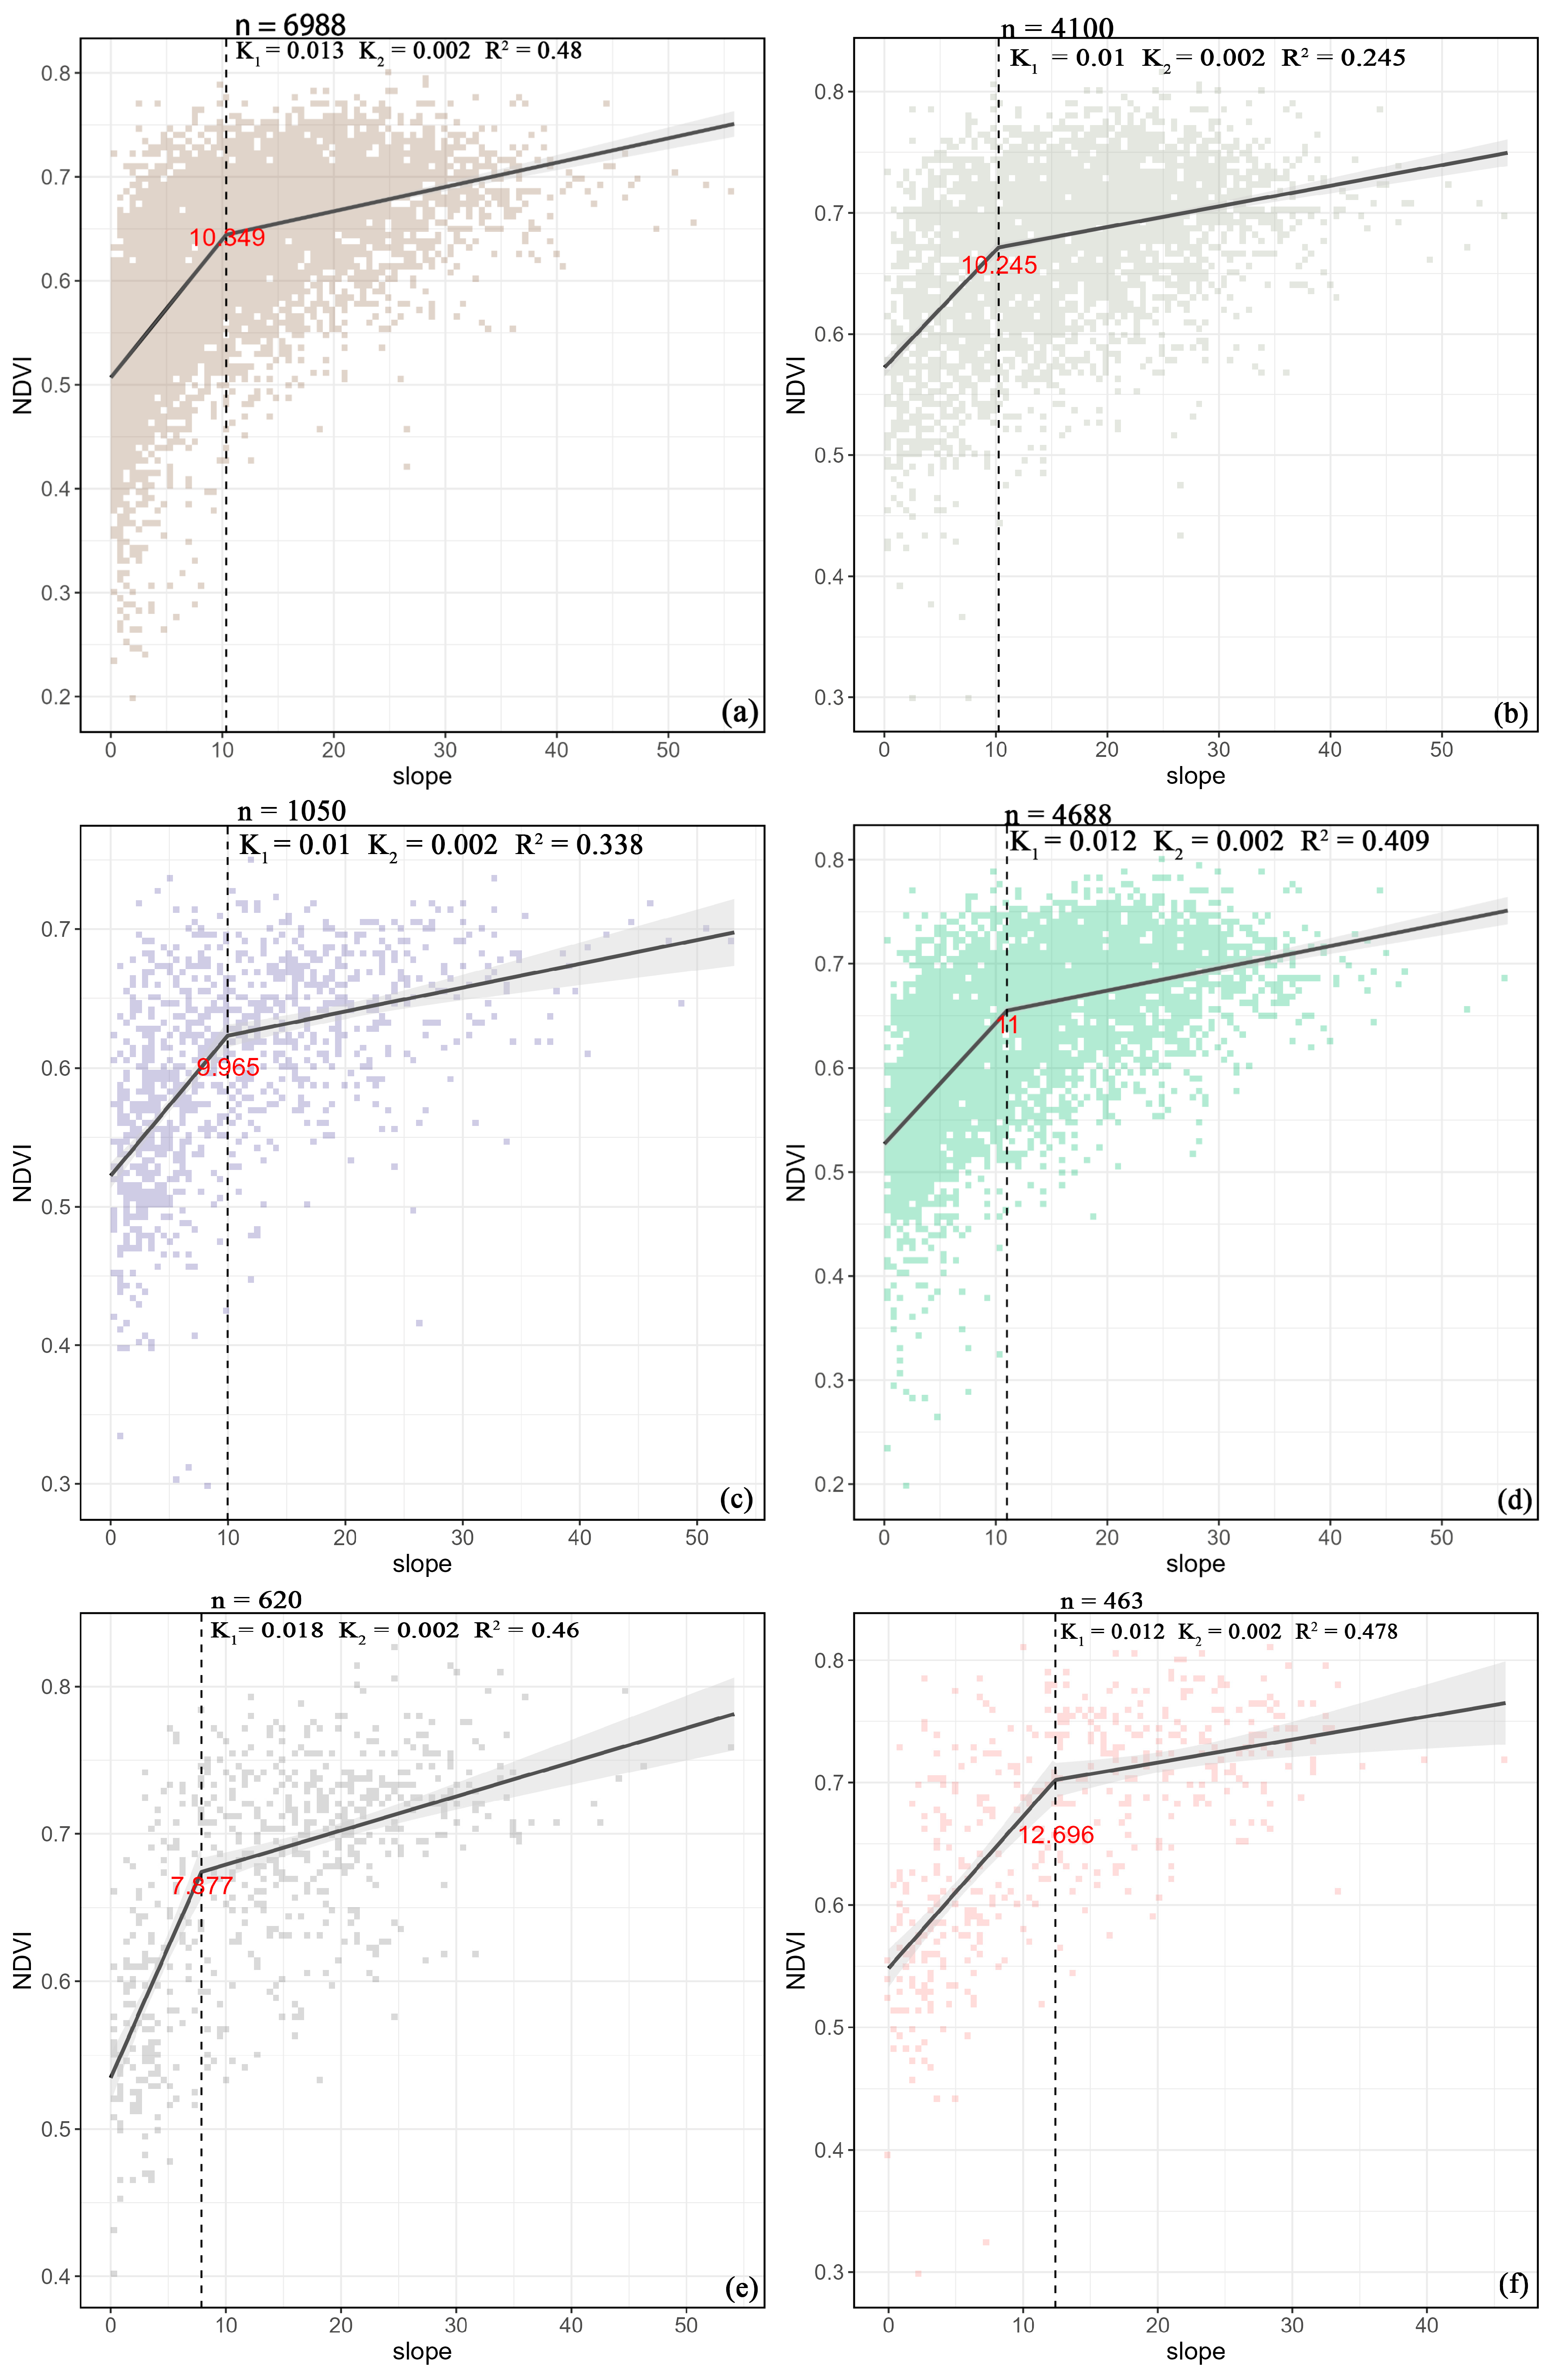
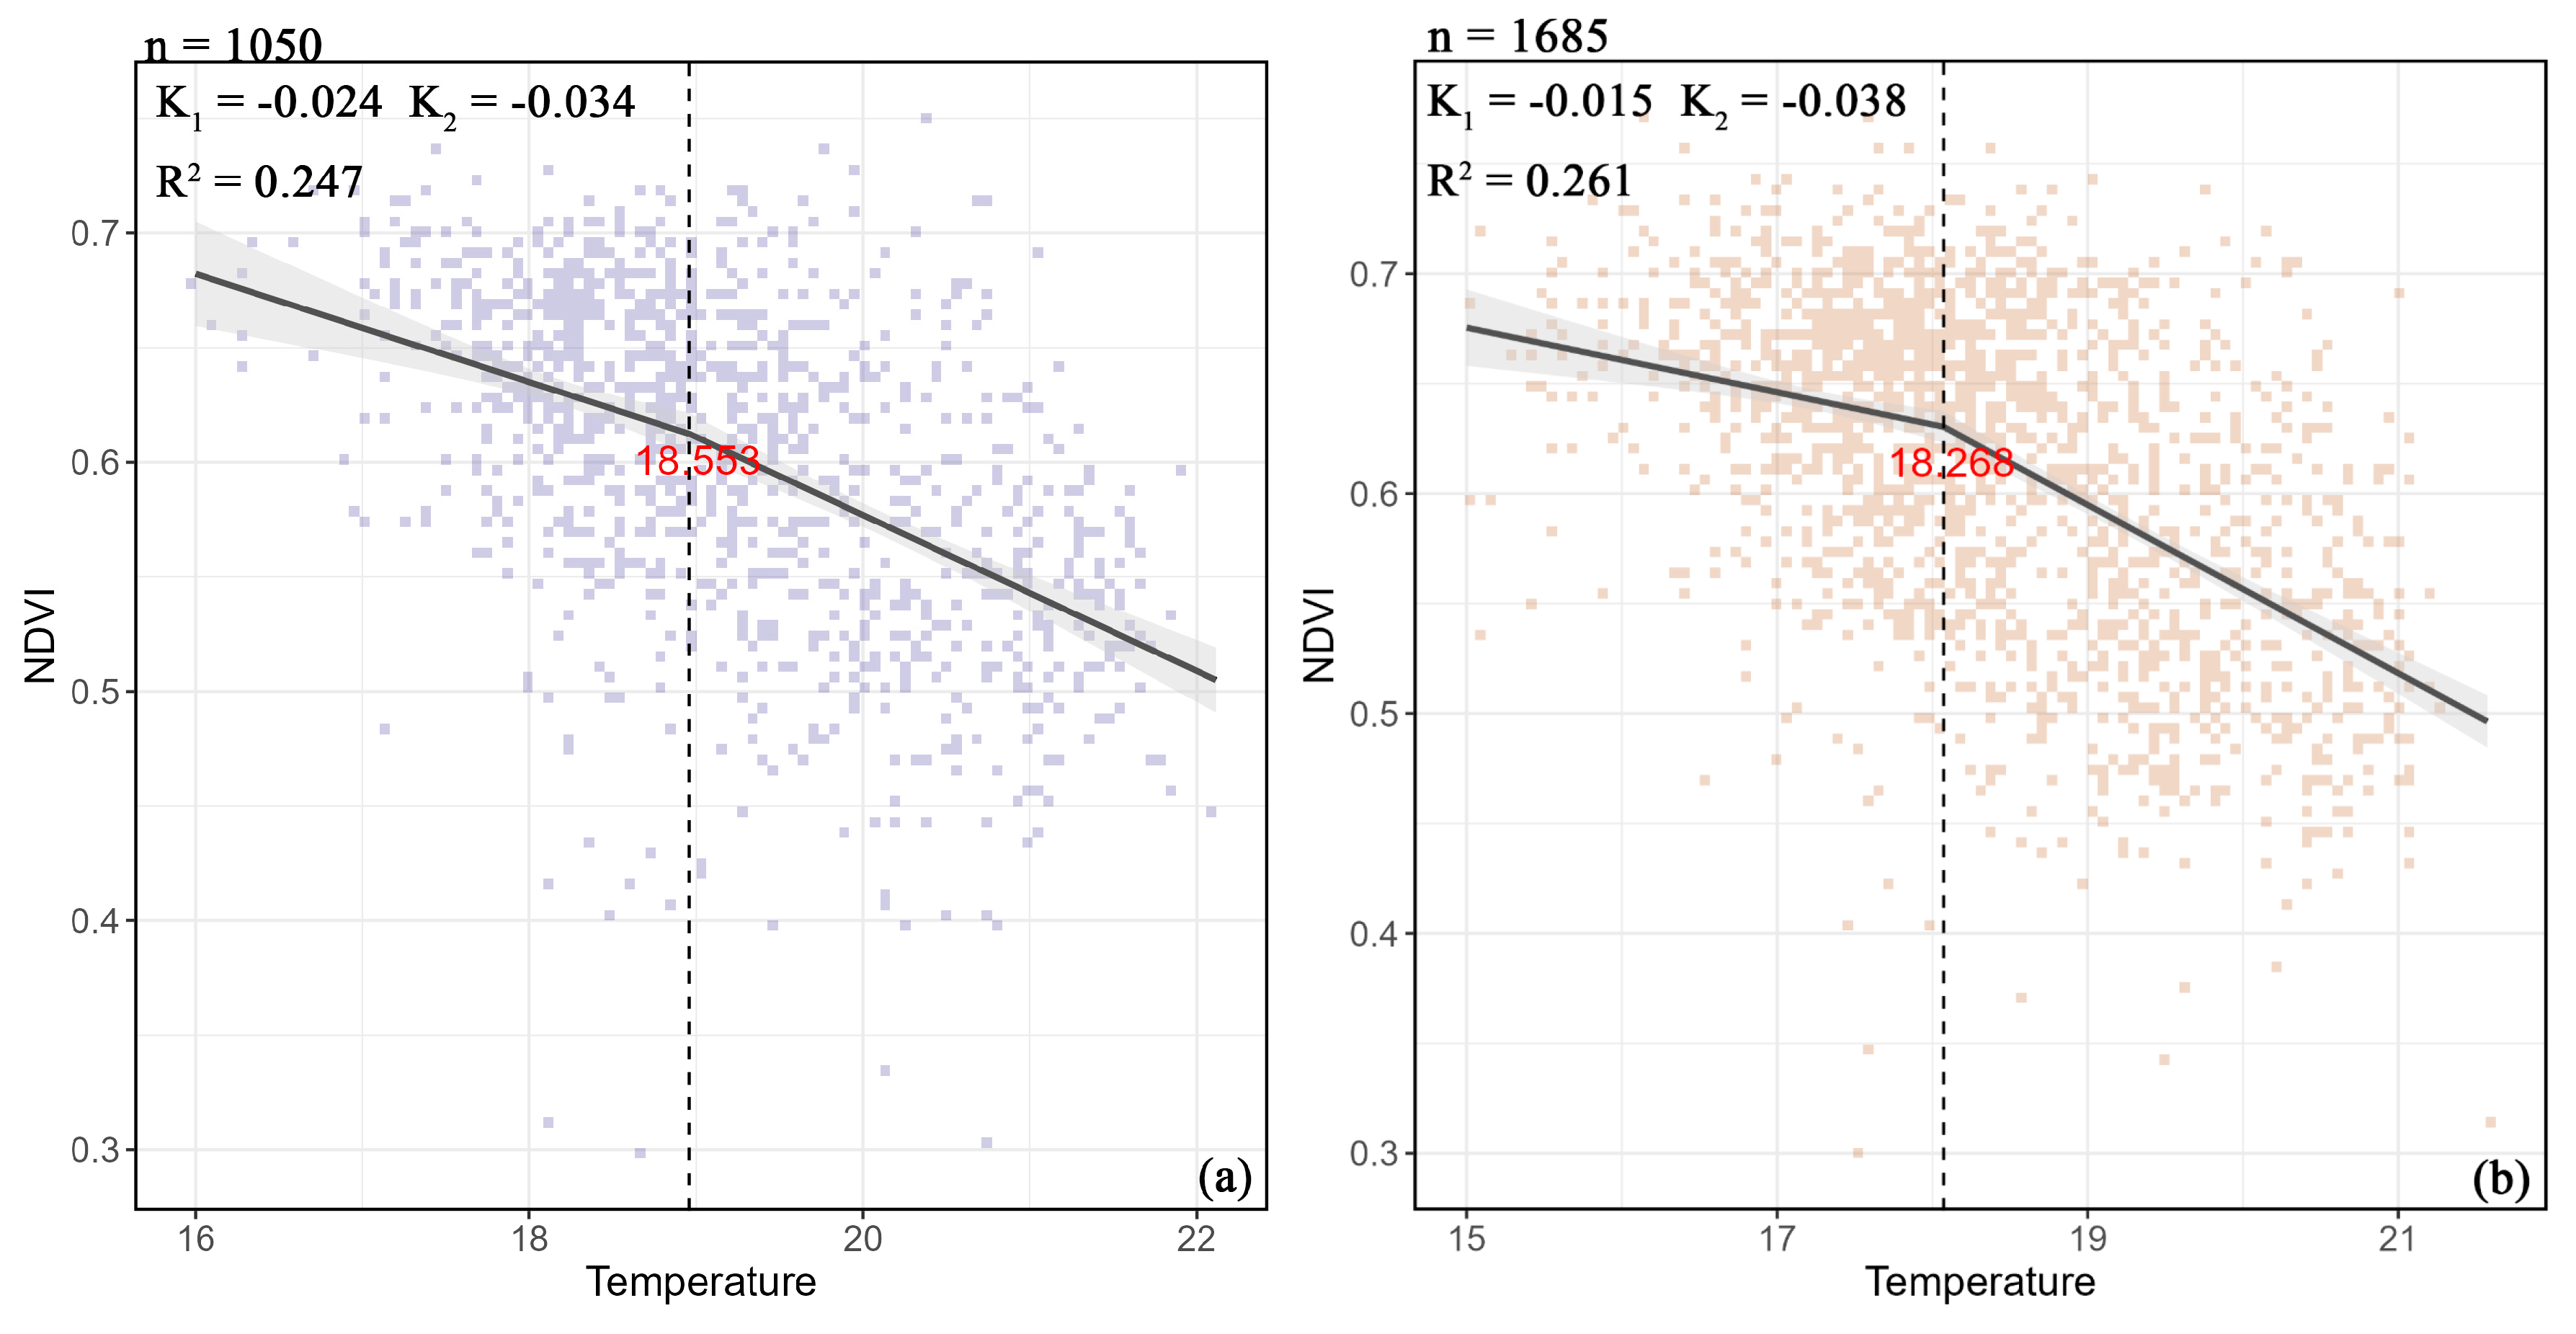
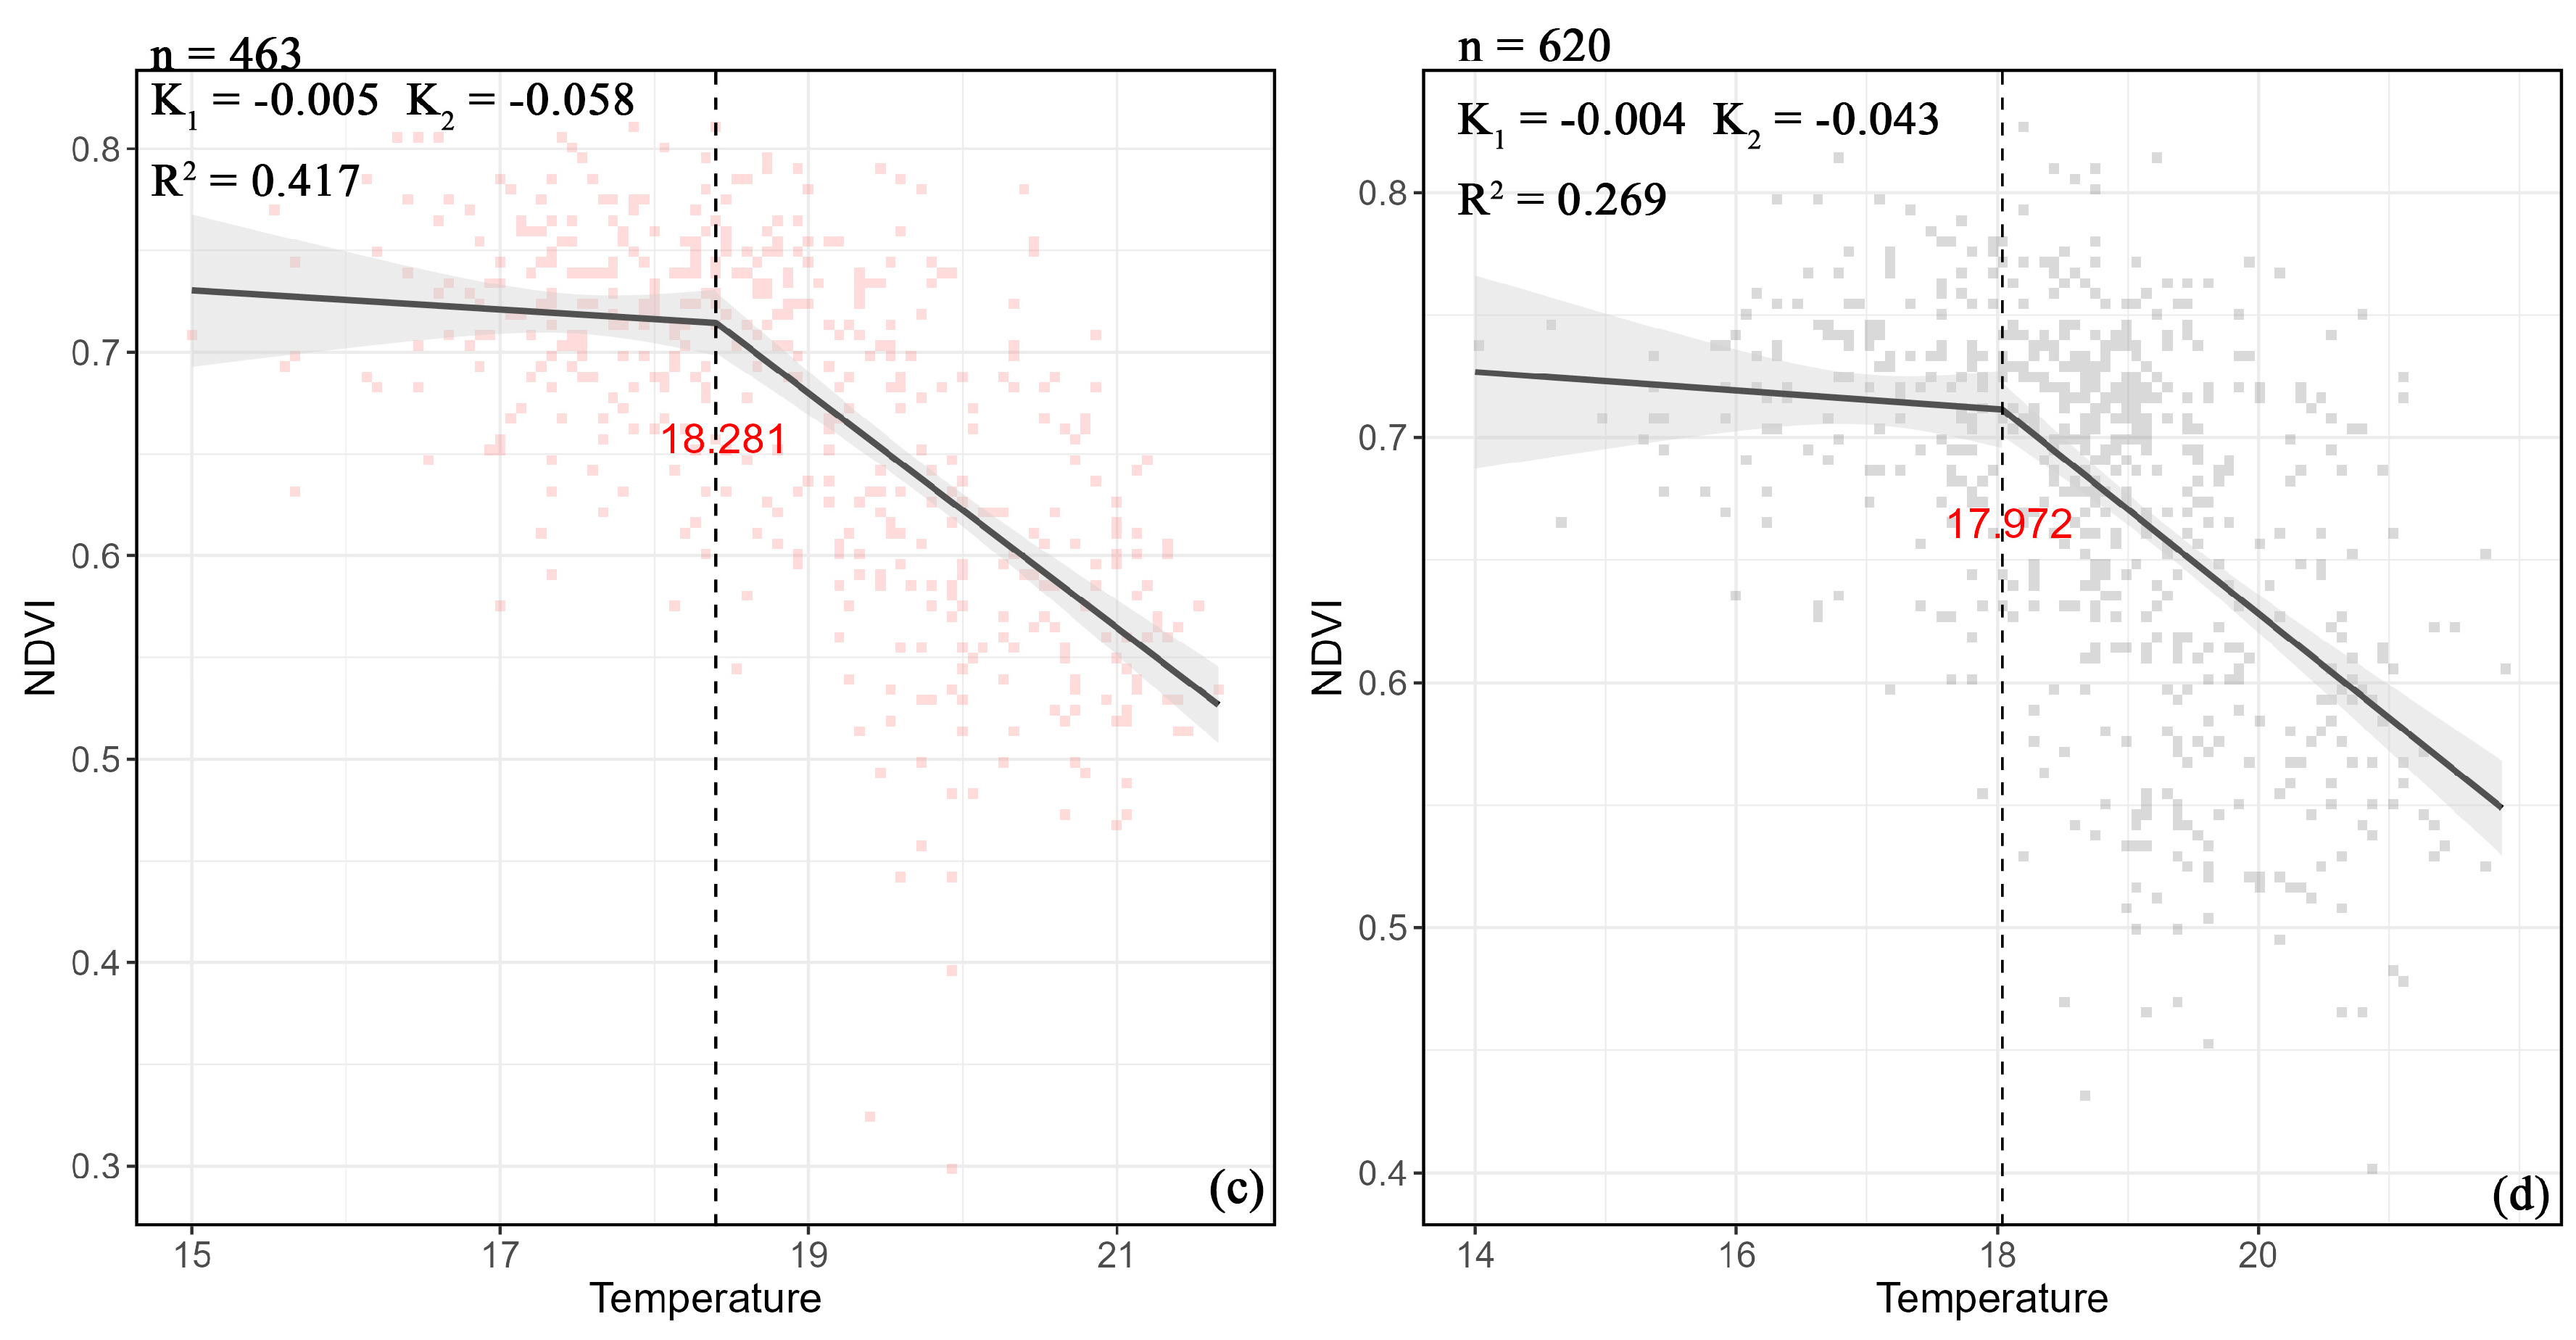
3.4. Threshold Response

Based on the results of the geographic detector analysis, a quantitative examination was conducted on the variables significantly related to the NDVI’s spatial variation, with the aim of revealing the influence trends of major factors at the regional scale and determining their thresholds. Our study selected variables with q-values greater than 0.25 and p-values less than or equal to 0.05 for threshold regression analysis.
As shown in Figure 9, Figure 10, Figure 11 and Figure 12, the relationships between the NDVI and slope, temperature, and population density varied significantly across different spatial scales. Broadly, the NDVI exhibited a positive correlation with slope; however, the threshold relationship between the two differed across scales. At the provincial scale in Hunan, when the slope was less than 10.349°, the rate of increase in the NDVI with slope was relatively high, with a correlation coefficient of 0.0133. Once the slope exceeded 10.349°, the impact of slope on the NDVI’s increasing trend diminished, with the correlation coefficient dropping to 0.002. In mountainous regions, the slope threshold for the NDVI was 10.245°, beyond which the influence of slope on the NDVI flattened. In terms of soil subregions, the slope threshold in the primary soil zone was 9.965°. Below this threshold, the correlation coefficient between the NDVI and slope was 0.01, while above this threshold, the coefficient dropped to 0.002, indicating that the influence of slope on the NDVI’s upward trend weakened considerably. In the ferrallitic soil zone, the slope threshold for the NDVI was 11°. In vegetation subregions, the relationship between slope and the NDVI generally aligned with the patterns observed at the provincial, geomorphological, and soil subregion scales—that is, slope had a stronger influence on the NDVI below a certain threshold, and this influence waned as the slope exceeded that threshold. In the grassland subregion, the slope threshold was 12.696°. In the shrubbery, broadleaf forest, cultivated forest, and coniferous forest subregions, the slope thresholds were 8.068°, 7.88°, 10.851°, and 11.824°, respectively.
Regarding the threshold effect of temperature on the NDVI, the general trend showed a decline in temperature as the NDVI values increased, although the specific temperature thresholds varied between subregions. In vegetation subregions, the areas significantly correlated with temperature occupied a larger proportion, suggesting a more pronounced cooling effect of vegetation on temperature. At the grassland scale, the temperature threshold for the NDVI was found to be 18.281 °C. Below this threshold, the correlation between the NDVI and temperature was relatively weak; however, once the temperature exceeded 18.281 °C, the cooling effect of the NDVI on temperature intensified significantly. A similar pattern was observed in the shrubbery, broadleaf forest, and primary soil subregions, where the NDVI’s cooling effect on temperature became significantly stronger after surpassing a certain temperature threshold. The thresholds for these subregions were 18.268 °C for shrubbery, 17.972 °C for broadleaf forest, and 18.553 °C for primary soil.
In examining the threshold relationship between population density and the NDVI, an inverse correlation was observed: as population density increased and urbanization intensified, vegetation cover decreased, leading to a corresponding decline in NDVI values. At the plains scale, the threshold for population density affecting the NDVI was identified as 2116 people/km2. Below this threshold, the impact on the NDVI was relatively weak; however, once the population density exceeded 2116 people/km2, the influence on the NDVI intensified significantly. A similar pattern was found at the mesa scale; when the population density was below 990 people/km2, its impact on the NDVI remained weak, but beyond this threshold, the strength of the influence increased markedly.
For other key factors influencing the NDVI’s spatial variation, at the primary soil scale, the threshold for the variable S was 0.951. When S was below 0.951, the relationship between S and the NDVI was negative; however, once S exceeded this threshold, the relationship became positive. At the grassland scale, S showed a linear positive correlation with the NDVI, while eb exhibited a negative correlation, with a threshold of 14.083 mm/day. Below this threshold, the impact of eb on the NDVI was stronger than when eb exceeded 14.083 mm/day.
In summary, the geographic detector analysis across different spatial scales in Hunan Province revealed that slope was the dominant factor influencing the NDVI’s spatial variation, consistently showing significant effects across all spatial scales. Additionally, variables such as temperature, population density, and S also contributed to the NDVI’s spatial variation to varying extents, indicating that multiple factors exert a combined influence on the spatial distribution of vegetation cover across different regions and scales.

4. Discussion

4.1. Long-Term Evolutionary Trends of the NDVI in Hunan Province

From 2000 to 2020, the NDVI in Hunan Province exhibited fluctuations in temporal growth, alongside a spatial trend of overall improvement. Notably, 91.27% of the region demonstrated increased vegetation cover, although these improvements were dispersed across the province. Analysis in conjunction with the Hurst forecast index revealed that 24.3% of Hunan’s vegetation showed a consistent upward trend, with these areas spatially aligning with regions experiencing increased vegetation cover. Areas projected to see strong, sustained improvements in the future are predominantly located in the Chang-Zhu-Tan area, which had previously undergone significant vegetation degradation. However, 75.7% of the province’s vegetation is predicted to face future degradation, with the majority exhibiting weak anti-persistent trends. Regions expected to endure strong, sustained degradation are largely concentrated in the Chang-Zhu-Tan urban cluster. The primary driver of this ongoing degradation is large-scale urban expansion, which has increasingly encroached upon vast areas of forest and grassland, creating significant ecological pressures. Several studies examining the relationship between NDVI and urbanization in various regions across China have identified a negative correlation between vegetation growth and the expansion of impervious urban surfaces. This suggests that, in certain areas, rapid urbanization has, to some extent, hindered vegetation growth [34,35]. These findings align with the results of our study on vegetation development trends in the Chang-Zhu-Tan Region.
Overall, from 2000 to 2020, vegetation cover in Hunan Province showed significant improvement, accompanied by notable spatial heterogeneity. This trend suggests that, since 1999, the nationwide implementation of forestry policies, such as the “Grain for Green” and “Forest Closure for Afforestation” programs, has played a key role in driving this progress [36]. Hunan Province has actively engaged with national initiatives by implementing a range of forestry and ecological restoration projects. These efforts, focused on combating issues such as rocky desertification and soil erosion, have led to a substantial increase in forest cover throughout the province [30,37]. However, based on the Hurst index calculations, future vegetation trends in Hunan suggest that a significant portion of the region is at risk of degradation. Only 24.3% of the area is expected to see continuous improvement, while a broad range of regions faces potential degradation, highlighting the urgent need for sustained afforestation efforts to further enhance vegetation cover across the province. Moreover, certain areas around the Chang-Zhu-Tan junction are projected to experience strong, sustained degradation in the future. This underscores the necessity for local governments to strike a balance between urban development in the Chang-Zhu-Tan Region and intensified greening efforts in areas showing signs of ongoing vegetation decline, thus aligning with the objectives of sustainable and green economic development.

4.2. Differential Analysis of the NDVI’s Driving Mechanisms at Different Zonal Scales

Previous studies have focused on evaluating vegetation’s drivers at the provincial, municipal, and county administrative scales by dividing regions based on administrative boundaries [11,38,39]. However, because vegetation growth is influenced by a variety of environmental factors, topography, landforms, and soil types can significantly impact plant growth due to differing hydrothermal and nutrient conditions [40,41,42]. The analysis of vegetation drivers within the same administrative divisions often overlooks the comparative analysis of those drivers that arise from differences in topography, geomorphology, and vegetation types. This lack of comparative analysis hinders the ability to implement rational afforestation strategies tailored to the unique geographical and ecological characteristics within the same administrative region. To address this gap, this study investigated the variations in vegetation drivers across different subregions of Hunan Province, exploring how each driver impacts vegetation at both the provincial and subregional scales using an optimal parameter geoprobe.
According to the geodetector analysis of the NDVI’s driving factors in Section 3.3, the primary factors influencing the NDVI’s spatiotemporal variation at the provincial scale were geomorphology and slope. Hunan, located in China’s southern subtropical climate zone, has diverse topography, including mountains, plateaus, hills, and plains, which significantly influence its vegetation distribution [43,44]. Studies by Hong and Sun on the northwestern Yunnan Plateau identified elevation as the second most influential factor affecting variations in the NDVI, after soil type [44]. Similarly, Tao et al.’s analysis of Southwestern China’s mountainous areas found that elevation and climate factors together drive variations in the NDVI [43]. These findings underscore the critical role of terrain and landforms in the NDVI’s spatiotemporal changes, as also confirmed by this study’s optimal parameter geodetector analysis [45,46]. In terms of climate, temperature had a stronger impact on the NDVI than rainfall in Hunan. Due to the region’s humid climate, abundant rainfall, and high soil moisture, rainfall exhibited a weaker influence on the NDVI’s variation. This is consistent with the findings of other studies suggesting that temperature plays a more significant role in NDVI changes in Southern China [47,48]. Over time, the q-values of natural factors remained consistently higher than those of human activities, indicating a stronger influence on the NDVI. However, human activities—especially population density and land use type—showed increasing q-values, while temperature, photosynthetically active radiation, and elevation exhibited decreasing trends. This shift likely reflects the positive impact of policies such as the “Grain for Green” program and “Natural Forest Protection”, which have stabilized vegetation and reduced sensitivity to natural environmental changes. Studies have shown that these policies, implemented since 1999, have improved soil conservation and mitigated soil erosion and desertification [49,50]. At the subregional scale, geomorphology continued to dominate variations in NDVI, but the primary driving factors varied across subregions. In the geomorphological divisions, land use type and population density were the main drivers in terraces and plains. In vegetation subregions, temperature, soil type, and land use type were the dominant factors in grasslands, while slope and geomorphology played a more prominent role in shrubland, broadleaf forests, cultivated forests, and coniferous forests. Grassland ecosystems, being more fragile, were influenced by a wider range of factors. Overall, while geomorphology was central to the variations in NDVI across subregions, the heterogeneity of the landscape led to varying dominant drivers within each subregion.
Combining the above analysis, topography and slope were found to be the dominant drivers of variation in NDVI at the provincial scale and across various subregional scales, including mountains, primary soil, ferrallitic soil, broadleaf forests, grasslands, cultivated forests, shrubland, and coniferous forests. Other single-factor influences also showed significant variability between the provincial and subregional scales. Regarding the role of interactions, the combination of two factors proved to be more effective than a single factor in explaining the NDVI’s variability. However, the types of interacting drivers varied greatly across Hunan Province and its subdivisions. The optimal parameter geoprobe analysis highlighted that Hunan’s complex topography and geomorphology, along with its diverse vegetation types, led to significant differentiation in the NDVI’s drivers. These differences in driving forces were evident both at the provincial level and within each subregion, influenced by variations in vegetation types.
Based on the above findings, topography and landforms are the primary drivers of the spatial and temporal variation in the NDVI in Hunan Province. Additionally, significant differences in driving factors exist across regional divisions. Therefore, future forestry planning in Hunan should not rely solely on a provincial-level approach or on plans for individual cities and towns. Instead, it is essential to incorporate the regional differences in driving mechanisms into policy formulation. Forestry policies should be tailored to the specific topographic, landscape, and vegetation characteristics of each zone. This approach, which aligns afforestation policies with regional environmental features, is supported by Fu’s research [51].

4.3. Threshold Responses of the NDVI’s Drivers Can Guide Future Plantation Forestry in Hunan

Since 1999, China has implemented various policies for ecological restoration and afforestation, leading to improvements in ecological conditions and vegetation cover [16,52]. However, not all afforestation policies have been equally beneficial. Some have focused solely on increasing the afforestation area, neglecting economic factors and failing to maximize the economic benefits of afforestation [51]. Therefore, the focus of afforestation policy needs to shift from large-scale planting to more targeted afforestation aimed at achieving structural transformation in forestry [53,54]. To achieve this, it will be necessary to refine the research on factors affecting vegetation dynamics. For example, in areas with steep slopes, soil erosion can occur, making it crucial to select appropriate slope ranges for afforestation. This not only prevents soil erosion but also improves tree survival rates [33]. In urban ecosystems, increasing impervious surfaces contribute to the formation of urban heat islands (UHIs) [55,56]. Urban afforestation can mitigate the UHI effect by reducing temperatures through increased vegetation cover [57,58]. While most studies focus on correlating urban green space with the heat island effect using regression analysis [59,60], it is essential to investigate whether there is a critical temperature threshold beyond which the cooling effect of vegetation cover weakens. If such a threshold exists, afforestation efforts should be intensified up to that temperature point to enhance cooling effects; however, beyond this critical value, afforestation should be moderated, considering the economic cost and the effectiveness of urban woodlands in mitigating the heat island effect. The relationship between silvicultural factors and vegetation cover involves analyzing inflection and threshold points. Traditional linear and nonlinear regression models only describe the primary and secondary factors influencing vegetation, without addressing these threshold relationships [14,16,17]. In summary, the limitations of previous studies can be overcome by introducing threshold regression analysis, which, as Hansen [61] pointed out, can identify mutation points. Given the complex and nonlinear nature of ecosystem and vegetation dynamics, predicting such changes quantitatively is challenging [62,63]. However, threshold regression analysis has been increasingly applied to study the dynamic changes in complex nonlinear systems [64,65,66]. Considering these factors, threshold attribution analysis of the main drivers of vegetation changes at both the regional and subregional scales in Hunan Province could provide valuable data for precision afforestation efforts in the future.
By analyzing Figure 9, Figure 10, Figure 11 and Figure 12, the threshold regression relationships were determined for the main drivers of vegetation across different subregions of Hunan Province. For slope, although the threshold values vary across subregions, the overall relationship between slope and the NDVI is consistent. We found that once the slope exceeds a certain threshold, its positive impact on the NDVI intensifies. Previous studies suggested that, under the Grain for Green program, afforestation on steep slopes beyond a certain limit can lead to vegetation failure due to difficulties in root establishment [67,68]. Hence, selecting the appropriate slope range for afforestation is critical. Based on the threshold values determined in our study, Hunan Province can target afforestation efforts in regions with slopes exceeding the identified thresholds, thereby enhancing afforestation efficiency. In terms of the threshold effect aspect of temperature, temperature plays a significant role in the NDVI’s spatiotemporal variation across different subregional scales. We found a negative correlation between the NDVI and temperature, indicating that higher vegetation cover leads to more pronounced cooling effects. However, the relationship between the NDVI and temperature varies across scales. When temperature does not exceed a certain threshold, the cooling effect brought about by increasing the NDVI is not particularly pronounced. Once the temperature surpasses this threshold, the cooling effect of the NDVI intensifies substantially. Previous research examining the relationship between temperature and vegetation has primarily focused on urban heat island (UHI) regression analysis or on large-scale investigations into the effects of various natural factors on the NDVI’s spatiotemporal variation [69,70]. Many studies analyzing UHI regression have explored the inverse relationship between vegetation cover and urban temperatures, which is consistent with the findings of this threshold regression analysis [57,58]. Based on the results of the temperature effect threshold analysis, cities across Hunan Province could implement targeted greening strategies to select appropriate vegetation types and achieve effective urban cooling through strategic afforestation. In relation to the threshold examination of other driving factors, the S and eb influences related to vegetation growth need to be noted, as these two indicators have a significant impact on grasslands. Combined with the province’s H-index, most areas of Hunan Province’s vegetation cover will be at risk of slight degradation, with future trends in the vegetation cover of the Chang-Zhu-Tan urban agglomeration being particularly concerning. In view of the future situation in Hunan, due to the existence of the threshold effect of vegetation drivers, Hunan Province needs to increase its afforestation efforts based on the existence of threshold mutation points, increase afforestation efforts in the threshold ranges that exhibit a strong correlation before and after the mutation points in order to increase vegetation cover, slow down afforestation efforts in the ranges that have weak correlation, and seek to maximize afforestation efficiency while taking into account the economic costs. The issue of achieving maximum ecological benefits with relatively low economic costs in afforestation projects remains underexplored. As previous studies have noted, quantitative cost–benefit analyses are lacking for many ecological restoration and afforestation projects in China [51]. This underscores the need for more research on the trade-offs between economic costs and ecological benefits—a critical area for future studies.

5. Conclusions

Previous studies have explored vegetation’s driving factors based on administrative divisions, whereas this study employed the optimal-parameter-based geographic detector model combined with a threshold regression model to analyze the differences in the driving mechanisms and threshold regression relationships across different subregions. The Hurst index analysis indicated that Hunan Province faces a potential risk of slight vegetation degradation in the future, necessitating sustained afforestation efforts. The findings reveal that slope is the primary factor influencing variation in the NDVI, exhibiting a positive correlation; however, this correlation weakens beyond the identified threshold. Therefore, afforestation efforts should be intensified when the slope remains below the threshold, while afforestation intensity beyond this point should be appropriately reduced. In urban afforestation, green spaces play a crucial role in mitigating the urban heat island effect, showing a negative correlation with temperature. However, this cooling effect diminishes once the threshold is exceeded, highlighting the need for optimized urban afforestation strategies based on vegetation–temperature threshold relationships.
This study expands our understanding of the interactions between the NDVI and its drivers at both temporal and spatial scales. In addition, by identifying spatial threshold effects between the NDVI and its drivers, future decision-makers can tailor afforestation and forestation efforts to the actual circumstances based on the threshold relationships of the drivers in different subregions. These results can help increase the productive capacity and sustainability of multiple local ecosystems and improve the sustainability of regional development. In future research, we will employ structural equation modeling to investigate the spatial interactions among slope, topography, and the NDVI, aiming to elucidate their underlying mechanisms. Additionally, we will conduct an in-depth analysis of the proportional relationship between urban green space coverage and land surface temperature (LST) at the city scale [71], providing more precise data support for urban afforestation planning in Hunan Province. Finally, we will integrate the data from the abovementioned analyses and, combined with the investment in afforestation costs, provide a basis for the cost budgeting of future afforestation projects in Hunan Province.

Author Contributions

Conceptualization, Q.Z. and J.X.; methodology, P.H. and X.M.; formal analysis, Q.Z. and P.H.; writing—original draft preparation, P.H., Q.Z. and J.X.; writing—review and editing, Q.Z., J.M., J.X. and P.H.; project administration, J.M. and J.X.; funding acquisition, J.X. and J.M. All authors have read and agreed to the published version of the manuscript.

Funding

This research was funded by the National Natural Science Foundation (grant number 32271659), Youth Fund Project of Xinyang Agriculture and Forestry University (grant number QN2022017), China Postdoctoral Science Foundation (grant number 2023M730944), West Light Foundation of The Chinese Academy of Science (grant number XBZGLZB2022018).

Data Availability Statement

The data supporting the conclusions of this article will be made available by the authors upon request.

Acknowledgments

We would like to thank the editor and anonymous reviewers for their constructive comments and suggestions for improving this manuscript.

Conflicts of Interest

The authors declare no financial or scientific conflicts of interest.

References

  1. Jiang, L.; Guli, J.; Bao, A.; Guo, H.; Ndayisaba, F. Vegetation dynamics and responses to climate change and human activities in Central Asia. Sci. Total. Environ. 2017, 599–600, 967–980. [Google Scholar] [CrossRef]
  2. Meehl, G.A.; Stocker, T.F.; Collins, W.D.; Friedlingstein, P.; Gaye, A.T.; Gregory, J.M.; Kitoh, A.; Knutti, R.; Murphy, J.M.; Noda, A. Global Climate Projections; Cambridge University Press: Cambridge, UK, 2007; Chapter 10. [Google Scholar]
  3. Ren, J.T.; Xiao, J.H.; Ma, J.; He, P.X. Quantitative assessment of the potential benefits of global afforestation on ecosystem productivity. Environ. Res. Lett. 2025, 20, 034055. [Google Scholar] [CrossRef]
  4. Xia, J.; Chen, J.; Piao, S.; Ciais, P.; Luo, Y.; Wan, S. Terrestrial carbon cycle affected by non-uniform climate warming. Nat. Geosci. 2014, 7, 173–180. [Google Scholar] [CrossRef]
  5. Yang, L.; Guan, Q.; Jinkuo, L.; Tian, J.; Tan, Z.; Li, H. Evolution of NDVI secular trends and responses to climate change: A perspective from nonlinearity and nonstationarity characteristics. Remote Sens. Environ. 2021, 254, 112247. [Google Scholar] [CrossRef]
  6. Muir, C.; Southworth, J.; Khatami, R.; Herrero, H.; Akyapı, B. Vegetation Dynamics and Climatological Drivers in Ethiopia at the Turn of the Century. Remote Sens. 2021, 13, 3267. [Google Scholar] [CrossRef]
  7. Mishra, N.B.; Crews, K.A.; Neeti, N.; Meyer, T.; Young, K.R. MODIS derived vegetation greenness trends in African Savanna: Deconstructing and localizing the role of changing moisture availability, fire regime and anthropogenic impact. Remote Sens. Environ. 2015, 169, 192–204. [Google Scholar] [CrossRef]
  8. Wu, Y.; Tang, G.; Gu, H.; Liu, Y.; Yang, M.; Sun, L. The variation of vegetation greenness and underlying mechanisms in Guangdong province of China during 2001–2013 based on MODIS data. Sci. Total. Environ. 2019, 653, 536–546. [Google Scholar] [CrossRef]
  9. Feng, Q.; Ma, H.; Jiang, X.; Wang, X.; Cao, S. What Has Caused Desertification in China? Sci. Rep. 2015, 5, 15998. [Google Scholar] [CrossRef]
  10. Kong, C.; Huang, J.; Du, S.; Li, G. Exploring the Driving Forces of Vegetation Greening on the Loess Plateau at the County Scale. Forests 2024, 15, 486. [Google Scholar] [CrossRef]
  11. Xu, X.; Zhang, D. Comparing the long-term effects of artificial and natural vegetation restoration strategies: A case-study of Wuqi and its adjacent counties in northern China. Land Degrad. Dev. 2021, 32, 3930–3945. [Google Scholar] [CrossRef]
  12. Liu, H.; Zhang, M.; Lin, Z.; Xu, X. Spatial heterogeneity of the relationship between vegetation dynamics and climate change and their driving forces at multiple time scales in Southwest China. Agric. For. Meteorol. 2018, 256–257, 10–21. [Google Scholar] [CrossRef]
  13. He, G.; Zhen, X.; Li, Z.; Shen, W.; Han, J.; Zhang, L.; Li, X.; Zhang, R. Influence of Variations of Hydrothermal Conditions on Normalized Difference Vegetation Index in Typical Temperature Zones Along the East Coast of China. Front. Earth Sci. 2020, 8, 574101. [Google Scholar] [CrossRef]
  14. Malhi, Y.; Franklin, J.; Seddon, N.; Solan, M.; Turner, M.G.; Field, C.B.; Knowlton, N. Climate change and ecosystems: Threats, opportunities and solutions. Philos. Trans. R. Soc. B Biol. Sci. 2020, 375, 20190104. [Google Scholar] [CrossRef]
  15. Meng, X.; Pi, H.; Gao, X.; He, P.; Lei, J. A high-accuracy vegetation restoration potential mapping model integrating similar habitat and machine learning. Land Degrad. Dev. 2022, 34, 1208–1224. [Google Scholar] [CrossRef]
  16. Yang, L.; Shen, F.; Zhang, L.; Cai, Y.; Yi, F.; Zhou, C. Quantifying influences of natural and anthropogenic factors on vegetation changes using structural equation modeling: A case study in Jiangsu Province, China. J. Clean. Prod. 2021, 280, 124330. [Google Scholar] [CrossRef]
  17. Meng, X.; Gao, X.; Lei, J.; Li, S. Development of a multiscale discretization method for the geographical detector model. Int. J. Geogr. Inf. Sci. 2021, 35, 1650–1675. [Google Scholar] [CrossRef]
  18. He, P.; Sun, Z.; Ma, J.; Han, Z.; Dong, Y.; Liu, H.; Meng, X.; Ma, J. Dynamic characteristics and driving factors of vegetation greenness under changing environments in Xinjiang, China. Environ. Sci. Pollut. Res. 2021, 28, 42516–42532. [Google Scholar] [CrossRef]
  19. Tong, X.; Wang, K.; Brandt, M.; Yue, Y.; Liao, C.; Fensholt, R. Assessing Future Vegetation Trends and Restoration Prospects in the Karst Regions of Southwest China. Remote Sens. 2016, 8, 357. [Google Scholar] [CrossRef]
  20. Wan, Z. New refinements and validation of the MODIS Land-Surface Temperature/Emissivity products. Remote Sens. Environ. 2008, 112, 59–74. [Google Scholar] [CrossRef]
  21. Funk, C.; Peterson, P.; Landsfeld, M.; Pedreros, D.; Verdin, J.; Shukla, S.; Husak, G.; Rowland, J.; Harrison, L.; Hoell, A.; et al. The climate hazards infrared precipitation with stations—A new environmental record for monitoring extremes. Sci. Data 2015, 2, 150066. [Google Scholar] [CrossRef]
  22. Martens, B.; Miralles, D.G.; Lievens, H.; van der Schalie, R.; de Jeu, R.A.M.; Fernández-Prieto, D.; Beck, H.E.; Dorigo, W.A.; Verhoest, N.E.C. GLEAM v3: Satellite-based land evaporation and root-zone soil moisture. Geosci. Model Dev. 2017, 10, 1903–1925. [Google Scholar] [CrossRef]
  23. ASADEM Merged DEM Global 1 arc Second V001 [Data Set]. NASA EOSDIS Land Processes Distributed Active Archive Center: Washington, DC, USA. 2020. Available online: https://lpdaac.usgs.gov/products/nasadem_hgtv001/ (accessed on 15 February 2024).
  24. Yang, Z.; Hu, J.; Wang, Z.; Chen, S. A new model based on coupling coordination analysis incorporates the development rate for urbanization and ecosystem services assessment: A case of the Yangtze River Delta. Ecol. Indic. 2024, 159, 111596. [Google Scholar] [CrossRef]
  25. Tatem, A.J. WorldPop, open data for spatial demography. Sci. Data 2017, 4, 170004. [Google Scholar] [CrossRef]
  26. Mann, H.B. Nonparametric Tests Against Trend. Nonparametric 1945, 13, 245–259. [Google Scholar] [CrossRef]
  27. Alashan, S. Non-monotonic trend analysis using Mann–Kendall with self-quantiles. Theor. Appl. Climatol. 2024, 155, 901–910. [Google Scholar] [CrossRef]
  28. Mandelbrot, B.B.; Wallis, J.R. Robustness of the rescaled range R/S in the measurement of noncyclic long-run statistical dependence. Water Resour. Res. 1969, 5, 967–988. [Google Scholar] [CrossRef]
  29. Gu, Z.; Duan, X.; Shi, Y.; Li, Y.; Pan, X. Spatiotemporal variation in vegetation coverage and its response to climatic factors in the Red River Basin, China. Ecol. Indic. 2018, 93, 54–64. [Google Scholar] [CrossRef]
  30. Tan, F.; Lu, Z.; Zeng, F. Study on the trade-off/synergy spatiotemporal benefits of ecosystem services and its influencing factors in hilly areas of southern China. Front. Ecol. Evol. 2024, 11, 1342766. [Google Scholar] [CrossRef]
  31. Song, Y.; Wang, J.; Ge, Y.; Xu, C. An optimal parameters-based geographical detector model enhances geographic characteristics of explanatory variables for spatial heterogeneity analysis: Cases with different types of spatial data. GISci. Remote Sens. 2020, 57, 593–610. [Google Scholar] [CrossRef]
  32. GB/T 15772-2008; General Principles for Comprehensive Planning of Soil and Water Conservation. General Administration of Quality Supervision, Inspection and Quarantine of the People’s Republic of China: Beijing, China, 2008.
  33. Luo, Y.; Lü, Y.; Guo, X.; Liu, Y.; Zhang, L.; Li, T. The thresholds of forest-to-grassland ratios can be critical for harmonizing ecosystem service relationships spatiotemporally in dryland regions. Appl. Geogr. 2024, 169, 103334. [Google Scholar] [CrossRef]
  34. Ma, J.; Wang, J.; He, S.; Zhang, J.; Liu, L.; Zhong, X. Direct and indirect effects of urbanization on vegetation: A survey of Yunnan central urban Economic Circle, China. Ecol. Indic. 2024, 166, 112536. [Google Scholar] [CrossRef]
  35. Yang, S.; Yang, X.; Zhang, J.; Gao, X.; Zhou, J.; Wu, X. Assessing the impacts of rural depopulation and urbanization on vegetation cover: Based on land use and nighttime light data in China, 2000–2020. Ecol. Indic. 2024, 159, 111639. [Google Scholar] [CrossRef]
  36. Ma, J.; Xiao, X.; Miao, R.; Li, Y.; Chen, B.; Zhang, Y.; Zhao, B. Trends and controls of terrestrial gross primary productivity of China during 2000–2016. Environ. Res. Lett. 2019, 14, 084032. [Google Scholar] [CrossRef]
  37. Jiang, Z.; Lian, Y.; Qin, X. Rocky Desertification in Southwest China: Impacts, Causes, and Restoration. Earth Sci. Rev. 2014, 132, 1–12. [Google Scholar] [CrossRef]
  38. Han, W.; Chen, D.; Li, H.; Chang, Z.; Chen, J.; Ye, L.; Liu, S.; Wang, Z. Spatiotemporal Variation of NDVI in Anhui Province from 2001 to 2019 and Its Response to Climatic Factors. Forests 2022, 13, 1643. [Google Scholar] [CrossRef]
  39. Cheng, J.; Qian, M.; Liu, J.; Chen, X.; Zuo, Y.; Zhao, Z.; Zhang, J. How Did the Southwest China Mountains Turn Green from 2000 to 2020? A Case Study in Chongqing. Forests 2023, 14, 1563. [Google Scholar] [CrossRef]
  40. Piao, S.; Wang, X.; Park, T.; Chen, C.; Lian, X.; He, Y.; Bjerke, J.W.; Chen, A.; Ciais, P.; Tømmervik, H.; et al. Characteristics, drivers and feedbacks of global greening. Nat. Rev. Earth Environ. 2019, 1, 14–27. [Google Scholar] [CrossRef]
  41. Guo, E.; Wang, Y.; Wang, C.; Sun, Z.; Bao, Y.; Mandula, N.; Jirigala, B.; Bao, Y.; Li, H. NDVI Indicates Long-Term Dynamics of Vegetation and Its Driving Forces from Climatic and Anthropogenic Factors in Mongolian Plateau. Remote Sens. 2021, 13, 688. [Google Scholar] [CrossRef]
  42. Fang, J.; Kato, T.; Guo, Z.; Yang, Y.; Hu, H.; Shen, H.; Zhao, X.; Kishimoto-Mo, A.W.; Tang, Y.; Houghton, R.A. Evidence for environmentally enhanced forest growth. Proc. Natl. Acad. Sci. USA 2014, 111, 9527–9532. [Google Scholar] [CrossRef]
  43. Tao, J.; Xu, T.; Dong, J.; Yu, X.; Jiang, Y.; Zhang, Y.; Huang, K.; Zhu, J.; Dong, J.; Xu, Y.; et al. Elevation-dependent effects of climate change on vegetation greenness in the high mountains of southwest China during 1982–2013. Int. J. Climatol. 2017, 38, 2029–2038. [Google Scholar] [CrossRef]
  44. Jiang, S.; Chen, X.; Smettem, K.; Wang, T. Climate and land use influences on changing spatiotemporal patterns of mountain vegetation cover in southwest China. Ecol. Indic. 2021, 121, 107193. [Google Scholar] [CrossRef]
  45. Liu, Y.; Huang, H.; Meng, L.; Liu, M.; Wu, Z.; Liu, T.; Labat, D. Spatial-temporal evolution of vegetation coverage and its relationship with terrain and human factors in the upper reaches of Ganjiang River Basin, China. Front. Earth Sci. 2023, 10, 1043403. [Google Scholar] [CrossRef]
  46. Du, J.; Quan, Z.; Fang, S.; Liu, C.; Wu, J.; Fu, Q. Spatiotemporal changes in vegetation coverage and its causes in China since the Chinese economic reform. Environ. Sci. Pollut. Res. 2020, 27, 1144–1159. [Google Scholar] [CrossRef] [PubMed]
  47. Li, B.; Wang, Y.; Wang, W.; Wang, C.; Lin, A. Satellite remote sensing analysis to monitor revegetation in the Yangtze River basin, China. Land Degrad. Dev. 2021, 33, 68–78. [Google Scholar] [CrossRef]
  48. Hou, W.; Gao, J.; Wu, S.; Dai, E. Interannual Variations in Growing-Season NDVI and Its Correlation with Climate Variables in the Southwestern Karst Region of China. Remote Sens. 2015, 7, 11105–11124. [Google Scholar] [CrossRef]
  49. Wenming, A.; Zongshan, L.; Shuai, W.; Xing, W.; Yihe, L.; Guohua, L.; Bojie, F. Exploring the effects of the “Grain for Green” program on the differences in soil water in the semi-arid LoessPlateau of China. Ecol. Eng. 2017, 107, 144–151. [Google Scholar] [CrossRef]
  50. Fu, B.; Wu, X.; Wang, Z.; Wu, X.; Wang, S. Coupling human and natural systems for sustainability: Experience from China’s Loess Plateau. Earth Syst. Dyn. 2022, 13, 795–808. [Google Scholar] [CrossRef]
  51. Fu, B.; Liu, Y.; Meadows, M.E. Ecological restoration for sustainable development in China. Natl. Sci. Rev. 2023, 10, nwad033. [Google Scholar] [CrossRef]
  52. You, G.; Liu, B.; Zou, C.; Li, H.; McKenzie, S.; He, Y.; Gao, J.; Jia, X.; Altaf Arain, M.; Wang, S.; et al. Sensitivity of vegetation dynamics to climate variability in a forest-steppe transition ecozone, north-eastern Inner Mongolia, China. Ecol. Indic. 2021, 120, 106833. [Google Scholar] [CrossRef]
  53. Lee, B.X.; Kjaerulf, F.; Turner, S.; Cohen, L.; Donnelly, P.D.; Muggah, R.; Davis, R.; Realini, A.; Kieselbach, B.; MacGregor, L.S.; et al. Transforming Our World: Implementing the 2030 Agenda Through Sustainable Development Goal Indicators. J. Public Health Policy 2016, 37, 13–31. [Google Scholar] [CrossRef]
  54. Vaz, A.S.; Amorim, F.; Pereira, P.; Antunes, S.; Rebelo, H.; Oliveira, N.G. Integrating conservation targets and ecosystem services in landscape spatial planning from Portugal. Landsc. Urban Plan. 2021, 215, 104213. [Google Scholar] [CrossRef]
  55. Jamei, E.; Rajagopalan, P.; Seyedmahmoudian, M.; Jamei, Y. Review on the impact of urban geometry and pedestrian level greening on outdoor thermal comfort. Renew. Sustain. Energy Rev. 2016, 54, 1002–1017. [Google Scholar] [CrossRef]
  56. Tan, Z.; Christopoulos, G.; Roberts, A.C.; Ren, G.; Ouyang, W.; Lo, K.; Ho, C. The comparative thermal experience of young and old pedestrians in urban green spaces and in densely built areas. Urban For. Urban Green. 2025, 105, 128712. [Google Scholar] [CrossRef]
  57. Yao, R.; Cao, J.; Wang, L.; Zhang, W.; Wu, X. Urbanization effects on vegetation cover in major African cities during 2001–2017. Int. J. Appl. Earth Obs. Geoinf. 2019, 75, 44–53. [Google Scholar] [CrossRef]
  58. Li, W.; Cao, Q.; Lang, K.; Wu, J. Linking potential heat source and sink to urban heat island: Heterogeneous effects of landscape pattern on land surface temperature. Sci. Total. Environ. 2017, 586, 457–465. [Google Scholar] [CrossRef]
  59. Rahaman, Z.A.; Kafy, A.A.; Saha, M.; Rahim, A.A.; Almulhim, A.I.; Rahaman, S.N.; Fattah, M.A.; Rahman, M.T.; Kalaivani, S.; Al Rakib, A. Assessing the impacts of vegetation cover loss on surface temperature, urban heat island and carbon emission in Penang city, Malaysia. Build. Environ. 2022, 222, 109335. [Google Scholar] [CrossRef]
  60. Jamei, Y.; Rajagopalan, P.; Sun, Q.C. Spatial structure of surface urban heat island and its relationship with vegetation and built-up areas in Melbourne, Australia. Sci. Total. Environ. 2019, 659, 1335–1351. [Google Scholar] [CrossRef]
  61. Hansen, B. Threshold Effects in Non-Dynamic Panels: Estimation, Testing, and Inference. J. Econom. 1999, 93, 345–368. [Google Scholar] [CrossRef]
  62. Wallington, T.J.; Hobbs, R.J.; Moore, S.A. Implications of Current Ecological Thinking for Biodiversity Conservation: A Review of the Salient Issues. Ecol. Soc. 2005, 10, 15. [Google Scholar] [CrossRef]
  63. Tangjialeke, W.; Zou, J.; Ding, J.; Yahefujiang, H.; Huang, S.; Li, J. Analysis of drought response thresholds and drought-causing factors of central Asian vegetation. Ecol. Indic. 2024, 169, 112926. [Google Scholar] [CrossRef]
  64. Zi, C.; Jie, W.; Hong-Bo, C. CO2 emissions and urbanization correlation in China based on threshold analysis. Ecol. Indic. 2016, 61, 193–201. [Google Scholar] [CrossRef]
  65. Byers, J.E.; Cuddington, K.; Jones, C.G.; Talley, T.S.; Hastings, A.; Lambrinos, J.G.; Crooks, J.A.; Wilson, W.G. Using ecosystem engineers to restore ecological systems. Trends Ecol. Evol. 2006, 21, 493–500. [Google Scholar] [CrossRef] [PubMed]
  66. Suding, K.N.; Gross, K.L.; Houseman, G.R. Alternative states and positive feedbacks in restoration ecology. Trends Ecol. Evol. 2004, 19, 46–53. [Google Scholar] [CrossRef] [PubMed]
  67. Xie, Y.; Wang, L.; An, R.; Luo, X.; Lu, Y.; Liu, Y.; Yao, S.; Liu, Y. The Effect of Sloping Land Conversion Program on Soil Erosion in Shaanxi Province, China: A Spatial Panel Approach. Front. Environ. Sci. 2022, 10, 913712. [Google Scholar] [CrossRef]
  68. Yin, R.; Rothstein, D.; Qi, J.; Liu, S. Methodology for an Integrative Assessment of China’s Ecological Restoration Programs. In An Integrated Assessment of China’s Ecological Restoration Programs; Springer: Berlin/Heidelberg, Germany, 2009; pp. 39–54. [Google Scholar]
  69. Guha, S.; Govil, H. Land surface temperature and normalized difference vegetation index relationship: A seasonal study on a tropical city. SN Appl. Sci. 2020, 2, 1661. [Google Scholar] [CrossRef]
  70. Ullah, W.; Ahmad, K.; Ullah, S.; Tahir, A.A.; Javed, M.F.; Nazir, A.; Abbasi, A.M.; Aziz, M.; Mohamed, A. Analysis of the relationship among land surface temperature (LST), land use land cover (LULC), and normalized difference vegetation index (NDVI) with topographic elements in the lower Himalayan region. Heliyon 2023, 9, e13322. [Google Scholar] [CrossRef]
  71. Zhu, S.Y.; Xu, J.; Zeng, J.Y.; He, P.X.; Wang, Y.P.; Bao, S.N.; Ma, J.; Shi, J.C. UFLUX-GPP: A Cost-Effective Framework for Quantifying Daily Terrestrial Ecosystem Carbon Uptake Using Satellite Data. IEEE Trans. Geosci. Remote Sens. 2024, 62, 4107917. [Google Scholar] [CrossRef]
Figure 1. Map of the study area.
Forests 16 00515 g001
Figure 2. Technical roadmap.
Forests 16 00515 g002
Figure 3. Change trend of NDVI in Hunan from 2000 to 2020 (Note: (a) represents the Sen trend values (b) represents the vegetation cover change).
Forests 16 00515 g003aForests 16 00515 g003b
Figure 4. Spatial distribution of NDVI in Hunan in 2000 and 2020.
Forests 16 00515 g004aForests 16 00515 g004b
Figure 5. Future NDVI trends and Hurst index in Hunan Province (Note: (a) represents the classification of H values (b) represents the future evolution trend types of NDVI).
Forests 16 00515 g005aForests 16 00515 g005b
Figure 6. Temporal changes in the explanatory power of various factors on the spatial differentiation of the NDVI in Hunan Province (1 to 21 on the x-axis of the independent variable represent variables x1 to x21, respectively).
Forests 16 00515 g006
Figure 7. Explanatory power of different factors for NDVI’s spatial differentiation in different regions of Hunan Province (Note: ** p < 0.01).
Forests 16 00515 g007
Figure 8. Detection results of the interaction of various factors in Hunan Province (BE denotes two-factor enhancement; NE denotes nonlinear enhancement).
Forests 16 00515 g008
Figure 9. Threshold effects of slope and NDVI at different regional scales (Note: n means sample sizes). (a) Hunan Province. (b) Mountain. (c) Primary soil. (d) Ferrallitic soil. (e) Broadleaf forest (f) Grassland. (g) Cultivated forest (h) Shrubbery. (i) Coniferous forest.
Forests 16 00515 g009aForests 16 00515 g009b
Figure 10. Threshold effects of temperature and NDVI at different regional scales (Note: n means sample sizes). (a) Primary soil (b) Shrubbery. (c) Grassland (d) Broadleaf forest.
Forests 16 00515 g010aForests 16 00515 g010b
Figure 11. Threshold effects of population and NDVI at different regional scales (Note: n means sample sizes). (a) Mesa (b) Plain.
Forests 16 00515 g011
Figure 12. Threshold effects of other factors on NDVI (Note: n means sample sizes). (a) Primary soil (b,c) Grassland.
Forests 16 00515 g012
Table 1. Data description, source, and processing methods.
CategoriesVariantDatasetAbbreviationYear
Range
Time
Resolution
Data
Source
/YNormalized difference
vegetation index
NDVI2000–202016dNASA
Climatic
factors
X1Mean annual
temperature
TEM2000–20208dNOAA
X2Mean annual
precipitation
PRE2000–20201dGEE
X3Effective photosynthetic
radiation
PAR2000–20201MNASA
X4Aridity indexSPEI2000–20201MSPEI
X5Actual evaporationE2000–20201aGLEAM
X6Potential evaporationEp2000–20201aGLEAM
X7Interception lossEi2000–20201aGLEAM
X8Bare soil evaporationEb2000–20201aGLEAM
X9TranspirationEt2000–20201aGLEAM
X10Open-water
evaporation
Ew2000–20201aGLEAM
X11Evaporative stress
factor
S2000–20201aGLEAM
X12Root zone soil moistureSMroot2000–20201aGLEAM
X13Surface soil
moisture; 0–10
SMsurf2000–20201aGLEAM
Topographical
geomorphology
X14ElevationDEM2000 GEE
X15SlopeSlope2000 GEE
X16AspectAspect2000 GEE
X17Geomorphological typeGeomorphy type2009 RESDC
SoilX18Soil typeSoil type RESDC
VegetationX19Vegetation typeVegetation type2001 RESDC
Human activityX20Land use typeLand use type2000–20205aRESDC
X21Population densityPopulation density2000–20201aWPOP
Note: “16d” refers to a temporal resolution of 16 days, “8d” refers to a temporal resolution of 8 days, “1d” refers to a temporal resolution of 1 day, “1M” refers to a temporal resolution of 1 month, “5a “means a time span of every five years, “1a” indicates an annual temporal resolution, and “GEE” stands for Google Earth Engine, a cloud-based platform for Earth observation and data analysis. “NASA” is the National Aeronautics and Space Administration, “NOAA” is the National Oceanic and Atmospheric Administration, “SPEI” is the standardized precipitation evapotranspiration index, “GLEAM” is the Global Land Evaporation Amsterdam Model, “RESDC” is the Resource and Environment Science and Data Centre of the Chinese Academy of Sciences, and “WPOP” is the WorldPop Population Density dataset.
Table 2. Driving forces of the NDVI dataset.
VariantDatasetAbbreviationYear
Range
Time
Resolution
Data
Source
X1Mean annual
temperature
TEM2000–20208dNOAA
X2Mean annual
precipitation
PRE2000–20201dGEE
X3Effective photosynthetic
radiation
PAR2000–20201MNASA
X4Aridity indexSPEI2000–20201MSPEI
X5Actual evaporationE2000–20201aGLEAM
X6Potential evaporationEp2000–20201aGLEAM
X7Interception lossEi2000–20201aGLEAM
X8Bare soil evaporationEb2000–20201aGLEAM
X9TranspirationEt2000–20201aGLEAM
X10Open-water
evaporation
Ew2000–20201aGLEAM
X11Evaporative stress
factor
S2000–20201aGLEAM
X12Root zone soil moistureSMroot2000–20201aGLEAM
X13Surface soil
moisture; 0–10
SMsurf2000–20201aGLEAM
X14ElevationDEM2000 GEE
X15SlopeSlope2000 GEE
X16AspectAspect2000 GEE
X17Geomorphological typeGeomorphy type2009 RESDC
X18Soil typeSoil type RESDC
X19Vegetation typeVegetation type2001 RESDC
X20Land use typeLand use type2000–20205aRESDC
X21Population densityPopulation density2000–20201aWPOP
Note: “8d” refers to a temporal resolution of 8 days, “1d” refers to a temporal resolution of 1 day, “1M” refers to a temporal resolution of 1 month, “5a” means a time span of every five years, “1a” indicates an annual temporal resolution, and “GEE” stands for Google Earth Engine, a cloud-based platform for Earth observation and data analysis. NASA, National Aeronautics and Space Administration; NOAA, National Oceanic and Atmospheric Administration; SPEI, standardized precipitation evapotranspiration index; GLEAM, Global Land Evaporation Amsterdam Model; RESDC, Resource and Environment Science and Data Centre of the Chinese Academy of Sciences; WPOP, WorldPop Population Density dataset.
Table 3. Types of two-factor interaction.
Basis of JudgmentInteraction
q(X1∩X2) < Min[q(X1), q(X2)]Nonlinear attenuation
Min[q(X1), q(X2)] < q(X1∩X2) < Max[q(X1), q(X2)]Single-factor nonlinear attenuation
q(X1∩X2) > Max[q(X1), q(X2)]Two-factor enhancement
q(X1∩X2) = q(X1) + q(X2)Standalone
q(X1∩X2) > q(X1) + q(X2)Nonlinear enhancement
Table 4. NDVI grade transfer matrix/km2 in Hunan in 2000 and 2020.
NDVI RatingLow
Vegetation Cover
Medium–Low Vegetation CoverMedium
Vegetation Cover
Medium–High Vegetation CoverHigh
Vegetation Cover
Total 2020Shift
Low vegetation cover551634600263208
Medium–low vegetation cover334287820092052232345
Medium
vegetation cover
4912,28359,389293072,01512,625
Medium–high
vegetation cover
188197,92829,9510128,75998,809
High
vegetation cover
004171658020752075
Total 200043816,205159,78931,9030
Transfer out38413,326100,39919530
Magnitude of change−175−10,981−87,77396,8562075
Table 5. Explanatory power of vegetation cover factors for spatial variation in NDVI in Hunan.
FactorX1X2X3X4X5X6X7X8X9X10
q0.2100.05960.1360.02030.09350.05270.1950.1850.06050.141
p0.000.000.000.000.000.000.000.000.000.00
FactorX11X12X13X14X15X16X17X18X19X20X21
q0.2020.06830.1040.2210.4530.00890.4620.2510.1310.2580.096
p0.000.000.000.000.000.00240.000.000.000.000.00
Table 6. Interaction detection results of the top three factors in different regions of Hunan Province.
Partition TypeZoning UnitDominant
Interactions 1
q-ValueDominant
Interactions 2
q-ValueDominant
Interactions 3
q-Value
GeologyPlainsX1∩X200.421 **X16∩X200.402 **X11∩X200.399 **
HillsX15∩X200.274 *X1∩X150.234 *X15∩X210.215 *
MountainsX15∩X200.310 *X15∩X180.295 *X15∩X190.273 *
MesasX1∩X200.352 **X15∩X200.340 *X1∩X210.320 *
Soil areaSemi-hydromorphic soilX5∩X160.771 **X9∩X160.751 **X10∩X160.740 **
Primary soilX17∩X200.463 *X15∩X200.450 *X15∩X170.440 *
Alluvial soilX5∩X160.523 **X6∩X160.460 **X4∩X160.450 **
Ferrallitic soilX17∩X200.490 *X15∩X170.487 *X15∩X200.483 *
Vegetation zoneGrasslandX11∩X170.674 *X17∩X200.671 *X8∩X170.663 *
ShrubberyX15∩X170.478 *X15∩X200.470 *X1∩X150.451 *
Broadleaf forestX1∩X150.575 *X15∩X170.559 *X2∩X150.534 **
Cultivated forestX15∩X200.541 *X15∩X210.520 *X17∩X200.515 *
Coniferous forestX15∩X170.527 *X17∩X200.505 *X15∩X200.498 *
Note: ** p < 0.01; * p < 0.05.
Disclaimer/Publisher’s Note: The statements, opinions and data contained in all publications are solely those of the individual author(s) and contributor(s) and not of MDPI and/or the editor(s). MDPI and/or the editor(s) disclaim responsibility for any injury to people or property resulting from any ideas, methods, instructions or products referred to in the content.

