Article

Water and Vegetation as a Source of UAV Forest Road Cross-Section Survey Error

1
Department of Forest Engineering, Faculty of Forestry and Wood Technology, University of Zagreb, Svetošimunska Cesta 23, 10000 Zagreb, Croatia
2
Matije Gupca 45, 31550 Harkanovci, Croatia
*
Author to whom correspondence should be addressed.
Forests 2025, 16(3), 507; https://doi.org/10.3390/f16030507
Submission received: 16 February 2025 / Revised: 4 March 2025 / Accepted: 10 March 2025 / Published: 13 March 2025
(This article belongs to the Special Issue New Research Developments on Forest Road Planning and Design)

Abstract

:
Planning in forestry should be based on accurate and reliable data. UAVs equipped with RGB cameras can enable fast and relatively cheap surveys, but their accuracy depends on many factors. Therefore, it is necessary to determine when UAVs can be used and when this type of survey gives data that does not reflect the true ground situation. This research analyzed the usability of a UAV, equipped with a RGB camera, for recording normal cross-sections and side ditch depths of the forest road in a lowland forest. The research was conducted in two time periods: during winter and spring, i.e., outside and during the vegetation season. DTMs of the area researched were created based on aerial photographs taken with the UAV, Z values of terrain points were read, and the depths of side ditches were calculated based on read Z values. The water depth in the side ditches and the vegetation height on the entire road body width were recorded to determine the influence of these two variables on the UAV survey error. Terrain points were recorded with the total station, which was the reference measurement method. An analysis of the obtained (read) DTM Z values revealed RMSE values of 10.09 cm for winter (outside vegetation) and 36.41 cm for spring (vegetation) UAV survey. The side ditch, calculated based on the DTM of the winter and spring periods of UAV recording, were statistically significantly different from the side ditch depths measured using the total station. Correcting the obtained data with water depth and vegetation height lowered the differences in Z values, as well as the ditch depths visible from R M S E Z (7.70 cm) for the winter UAV survey, with no statistically significant difference in side ditch depths. In the case of the correction of spring recording data, R M S E Z was smaller (23.41 cm) than before correction (36.41 cm), and the depth of the side ditches was still statistically significantly different. The authors conclude that water and ground vegetation can significantly affect UAV survey accuracy. In the winter period, side ditch depth measurement is possible in areas where water is not present. If water is present, manual measurement of water height and correction of obtained UAV data can improve data accuracy. On the other hand, spring or vegetation period UAV surveys are highly affected by ground vegetation height and the authors do not recommend surveys in that period.

1. Introduction

With today’s labor shortage in all sectors and activities [1], it is extremely important to find an efficient and effective solution to fully or partially replace it. In forestry, this can be achieved by greater mechanization of forest work [2]. To achieve this, the currently available machines on the market, used for logging, primarily require a denser and more efficient network of forest transport infrastructure [3,4,5]. Heinimann [6] writes about forest road importance and states that the network of forest roads represents the basis (backbone) of forestry activities. An optimally placed network of forest roads enables the fulfillment of all management plan tasks [7,8] but also numerous other functions such as fire protection [9,10] and recreational use [11]. On the other hand, a poorly planned and constructed forest road often has a negative impact on wood transport costs [12,13,14], maintenance costs [15,16] and the environment [17,18]. For the above reasons, it is extremely important to adapt the forest road to the relief area in which it is located [19,20] during forest road planning, as well as adapt forest road networks to the current dominant harvesting systems [21].
Pentek et al. [22] highlighted the main characteristics of the lowland forest road network as follows:
  • Regular shape with long lines and few horizontal curves.
  • Comparable forest roads are located at approximately the same distance.
  • Pass through existing averages and close regularly shaped surfaces.
Pičman [23] emphasized the importance of forest road construction in said areas, and as the main characteristic, he pointed out cross-profile construction of the embankment in order to ensure road trafficability throughout the whole year. This normal cross-section enables easier runoff of surface water, prevents flooding during intense rains, and reduces the erosion of fine surface materials [23]. In addition to the normal cross-section profile, it is necessary to ensure good surface water drainage to remove or reduce the destructive power of water, which consists of the surface crossfall (which depends on the surface type), side ditches (trapezoidal, rounded and pointed) and culverts [7].
On the other hand, once a forest road network is optimally established, it must be regularly maintained [24] to maintain trafficability, i.e., to keep the forest road in technically good condition, enabling it to fulfill all its functions [14]. Poorly performed, untimely or unimplemented maintenance of existing well-made forest roads can cause negative consequences [25,26]. Some of these negative effects are reductions in vehicle speed or in extreme cases, the impossibility of traffic on such roads, the increase in vehicle maintenance costs, the soil loss from road segments and the traffic safety reduction [27,28]. From this point of view, it is crucial for forest managers to have up-to-date information on the technical condition of the forest road infrastructure for all emergency circumstances.
An extremely important forest road maintenance work is the maintenance of the water drainage system [29]. Study [28] emphasized that the maintenance of the drainage system is a key part of forest road maintenance and that it consists of surface and crown maintenance, side ditch maintenance and culvert cleaning. The importance of maintaining the drainage system is also emphasized by Reid and Dunne [27], who determined that sediment deposits in side ditches can be up to 500 metric tons per kilometer during the rainy season. Such phenomena can cause flooding during heavy rainfall or water retention in side ditches, which can lead to water soaking in the pavement structure [26].
Based on the above and the fact that forest road maintenance, along with construction, is the most expensive process in forest harvesting [30], it is necessary to carry it out with extreme care and rigorous quality control. The strategy and plan for forest road maintenance is the basis for sustainable and long-term management of forest ecosystems [31,32]. Furthermore, it is necessary to establish a fast and reliable survey method for the forest road cross-section with special attention to the detection of side ditch conditions, which will allow us to unambiguously determine the current condition and accurately detect the places where maintenance work on drainage elements needs to be carried out, all with the aim of increasing the efficiency and quality of maintenance work.
In the last 10 years, unmanned aerial vehicle (UAV) imaging has made many forestry tasks easier and faster, as confirmed by numerous studies [33,34,35]. The precision and accuracy of UAV measurements are affected by many parameters that can be influenced, such as flight altitude [36,37], photo overlap [37], correction methods (ground control points (GCPs) and their number, post-processing kinematics (PPKs) and real-time kinematics (RTKs) [38,39,40,41,42], and those that cannot be influenced, such as lighting conditions and scene [43]. The root mean square error (RMSE) of spatial coordinates of point clouds or digital terrain models (DTMs) based on photogrammetric methods of drone image processing in forest conditions ranges between 2.3 and 123 cm horizontally and 3 and 79.4 cm vertically [39,40,41,42,44,45]. Smaller RMSE values of coordinate Z (0.0198 m) were obtained by Hruza et al. [46] with flights 4–6 m above the forest road. The authors of the mentioned research claimed that the achieved results allow an accurate detection of surface damage of the forest road asphalt layer. Hasegawa et al. [47] achieved a Z coordinate value RMSE in the amount of 0.098 m while investigating the applicability of UAVs during the reconstruction (repair) of a forest road, and based on the recorded amounts of earthworks, they concluded that a UAV, equipped with a camera, can be used to quantify the forest road (re)construction earthwork.
Since the use of photogrammetric methods of field surveying is limited to the reconstruction of surfaces visible in image data, true ground reconstruction is only possible where there is no water, vegetation (high and low) and other obstacles [43,48,49]. The aim of this research is to determine whether a UAV equipped with a high-resolution camera can be used for normal cross-section surveys and for side ditch depth detection during and outside the vegetation period, i.e., to determine the influence of the water depth in side ditches and the vegetation height on the forest road surface on the accuracy of the collected data.

2. Materials and Methods

The research was conducted in state forests of the Republic of Croatia managed by the company Hrvatske šume ltd. Zagreb, Croatia, Forest Administration Bjelovar, Forestry Office Vrbovec, Management Unit Česma (Figure 1). The management unit can be described as a characteristic area of lowland forests in which water is a significant factor, which in some parts lies for several weeks. For this reason, the depth of side ditches is greater, in some places, than the minimum 30–40 cm prescribed by the technical specifications [7]. The highest point of the management unit is located at 125 m above sea level (m.a.s.l.) and the lowest at 103 m.a.s.l. The researched road section goes through forest sections: 75 a, 75 b, 75 c, 75 d, 75 d, 69 a, 69 b and 69 c. All forest sections were 125-year-old forest stands, except 69 c which was 5 years old. The phytocenoses of the mentioned forest sections are Genisto elatae-Quercetum roboris cari-cetosum remotae (Horvat 1938.) and Carpino betuli-Quercetum roboris (Anić 1959). The dominant tree species in these phytocenoses are narrow-leaved ash (Fraxinus angustifolia Vahl.), pedunculate oak (Quercus robur L.) and common hornbeam (Carpinus betulus L). Depending on the forest age, also known as section age, tree height ranges between 5 and 40+ meters. All normal cross-sections on the investigated section of the forest road are in the form of embankments (fill) with trapezoidal side ditches. The researched forest road has a 3.5 m wide asphalt road surface, with an average slope gradient of 0.5%. The clear zone on each side of the forest road is 13 m wide on average (total of 30 m). The lowest vertical road clearance is 15 m.
The recorded length of the existing forest road route was 910 m. A field data survey was carried out with a Stonex R35 total station (Stonex, Milan, Italy) and a DJI Mavic 3 Enterprise (Nanshan, Shenzhen, China) unmanned aerial vehicle (UAV) equipped with a DJI Mavic 3E Wide camera. With the Stonex R35 total station (Table 1), which was used as a reference measurement method, a normal cross-section profile of the forest road was recorded every 10 m as shown in Figure 2. A total of 92 normal cross-section profiles were recorded on the surveyed section of the forest road. The coordinates of the points for georeferencing the total station were determined using a GNSS device (Stonex S900A (Stonex, Milan, Italy)) in RTK mode according to the instructions explained in Mihelič et al. [50]. The total station was moved once during the survey, i.e., the survey was carried out at two locations, which ensured the accuracy of the data and minimized human influence on the positioning error of the total station [51]. A minimum of 11 points were recorded on each cross-section (Figure 2), while on some profiles, where sudden changes in the cross-section of the terrain were observed, more points were recorded to present the terrain as clearly as possible. A total of 1108 field points were recorded and used in further analysis. The total station survey was carried out during February 2024. The total station survey time for 2 people was 6 h.
The UAV survey was carried out using the DJI Mavic 3 Enterprise UAV (Table 1) in two time periods: February 2024 (winter aspect) and April 2024 (spring aspect), i.e., outside and during the vegetation period. The flight operation mission was created in the DJI Pilot 2 application. The same flight and recording parameters were used in both flight operations: the flight altitude was 60 m with an 80% front and side overlap of aerial photographs. The shooting time was 19:35 min for the winter survey and 18:34 min for the spring survey. Although the used UAV was equipped with an RTK module for more precise positioning of aerial photographs, a total of 12 GCPs (ground control points) were also used. GCPs were recorded with a GNSS device (Stonex S900A).
The photogrammetric analysis of the recorded aerial photographs and the creation of DTMs were performed in the Pix4d mapper software (v. 4.8.4). As a result of the photogrammetric analysis, DTMs were created for the winter and spring surveys, and the data of the photogrammetric analysis are shown in Table 2.
The water depth in side ditches was measured for each cross-section during the winter and spring field surveys, while the vegetation (grass) height was only measured during the spring field survey (Figure 2). Both values were measured with a geodetic rod with an accuracy of one centimeter. For the vegetation height in spring, several measurements were made, between field points on the embankment slopes, in side ditches and at the top of side ditches. Snow was not present on the research site in the winter period. Vegetation height measurement in the winter period survey was not conducted, as the ground vegetation (grass) height was below 1 cm. The water depths were measured in the middle of the side ditch (Figure 2). Measurements were made on each cross-section profile on the left and right sides of the forest road. For the purposes of the research, no regular maintenance work was carried out between the two surveys, including grass mowing [23], to ensure that the recorded height of vegetation was as high as possible and thus the impact on the UAV survey error was as significant as possible.
The Z values of the winter and spring survey field points, tested in this study and used to calculate the side ditch depths, were read from the obtained DTMs in the ArcMap software (v. 10.8). Based on the created winter and spring survey DTMs and the Add Surface Information function, the Z values of the created DTMs were read at the positions where the field points were recorded with the total station.
The side ditch depths were calculated on each cross-section, on the left and right sides, as the difference between the height of the side ditch top and the average side ditch bottom height (Figure 3). The height of the ditch top was the actual foundation soil height before forest road construction.
Statistical analyses were performed in IBM SPSS Statistics (v.29.0). The root mean square error (RMSE) used to measure the combined vertical errors emphasizing the accuracy of the UAV data in capturing terrain elevation was calculated by the following formula:
R M S E Z = Z d 2 n
where Z d is the vertical difference and n is the number of terrain points used to excrete Z values.

3. Results

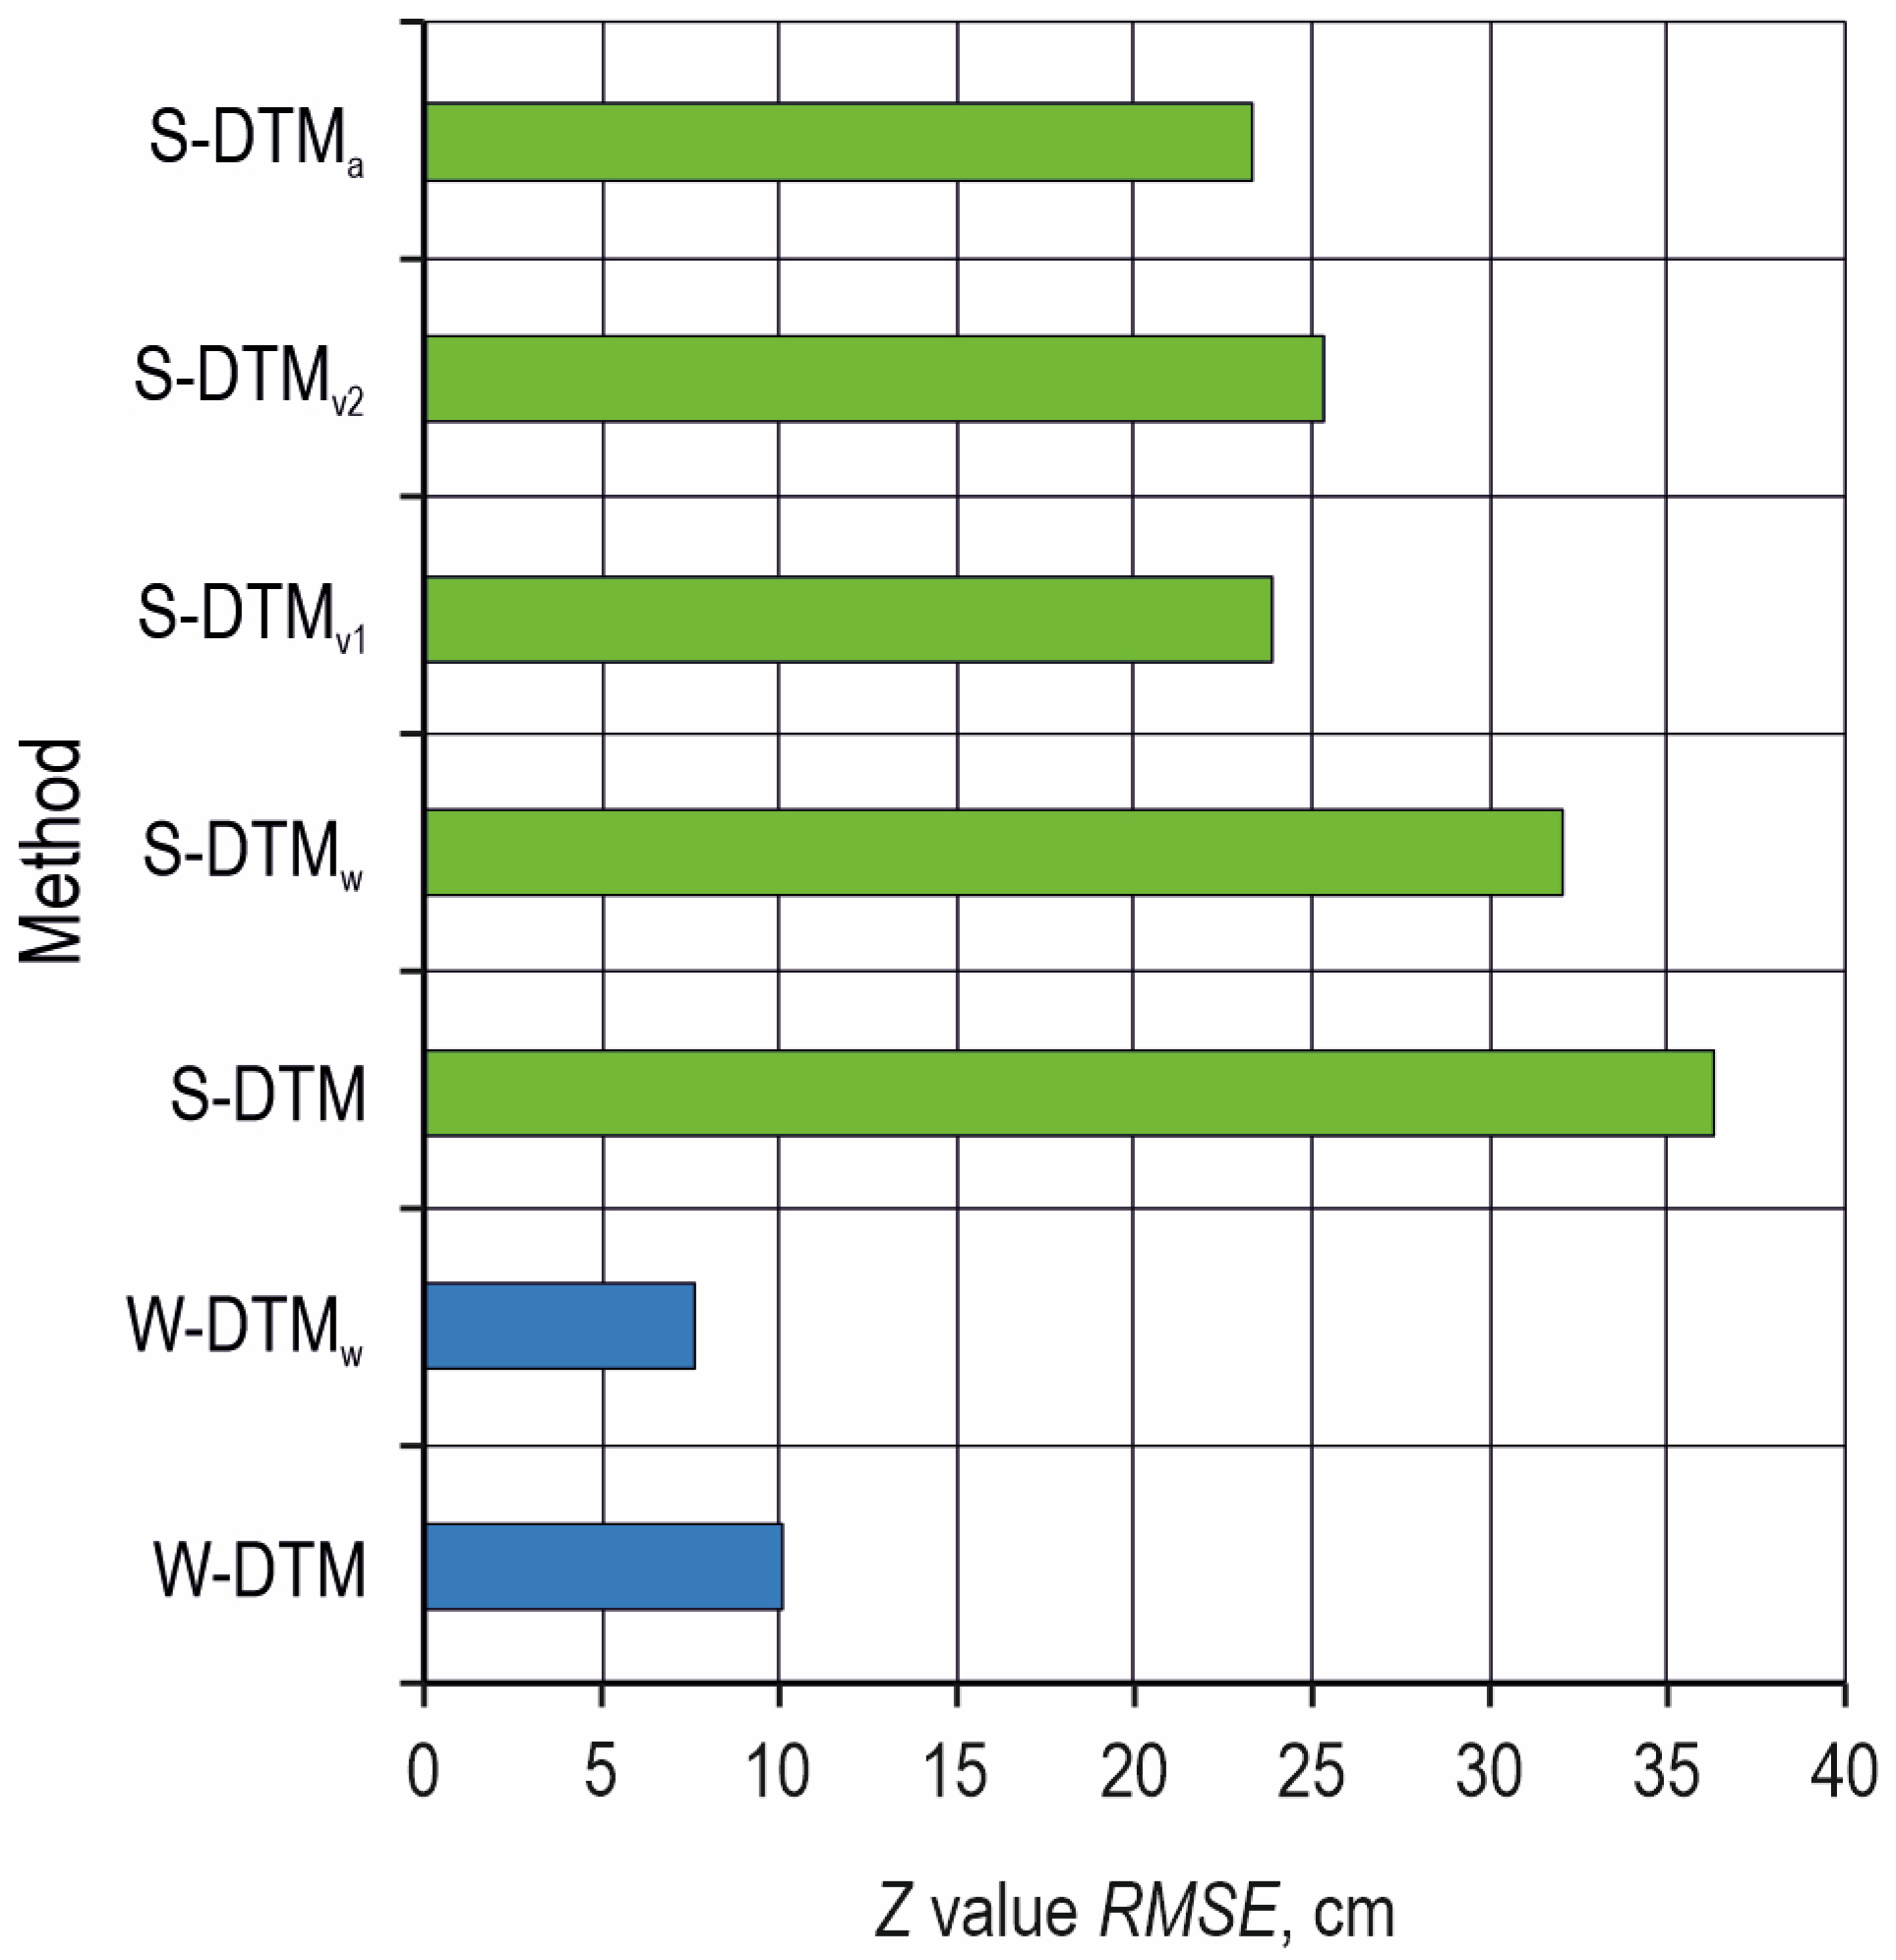
3.1. DTM Terrain Points Z Values

The Z value (elevation) error of the DTM created, based on aerial photographs taken using the UAV, was tested on a total of 1108 field points recorded with the total station. The highest elevation of total station field points was 110.01 m (profile 1) and the lowest was 104.51 m (profile 91), while the average Z value of the recorded field points was 106.71 m. The highest elevation of the analyzed field points, read from the DTM created, based on aerial photographs taken with the UAV during the winter survey (W-DTM), was 110.03 m (profile 1), and during the spring survey (S-DTM), it was 110.15 m (profile 1). The lowest elevations of the analyzed field points, read from the DTM created, based on aerial photographs taken with the UAV during the winter period, were 104.82 m (W-DTM) and 105.11 m (S-DTM) recorded in profile 92. The average elevation of the field points of the W-DTM differed by 0.2 cm, compared to those taken using the total station (106.71 m). On the other hand, the average elevation of the field points of the S-DTM was 106.95 m, a difference in average elevation of 25.01 cm compared to the average elevation of the points taken with the total station. The R M S E Z of the W-DTM was 10.09 cm, while the value for the S-DTM was 36.41 cm. The largest recorded difference in Z values, read from field points for the W-DTM, was 41.36 cm, and for the S-DTM, it was 311.50 cm. It is important to note that errors > 100 cm in the S-DTM were recorded at locations below the canopy cover (endpoints of the forest road cross-section) or in side ditches (see Figure 4 for example).
During the winter UAV survey, water was recorded in forest road side ditches of 85.87% of the surveyed cross-sections. At a total of 316 field survey points, the presence of water in the side ditches was recorded with an average depth of 17.18 cm. Data on the recorded water depths inside side ditches are shown in Table 3. The R M S E Z of the points where no water was recorded (792 in total) was 7.16 cm.
For the points where water was recorded during the winter survey, a dependence analysis of the Z difference, i.e., the error of the field points read from the DTM, and the recorded water depth was conducted. The obtained correlation coefficient (R) was 0.813, i.e., the coefficient of determination ( R 2 ) was 0.661, which according to the Chaddok scale [52] represents a strong correlation (Figure 5). The coefficient analysis indicated that the water depth in side ditches had a statistically significant influence on the occurrence and magnitude of the Z value error during the winter UAV survey.
The influence of the recorded water depth in side ditches and the vegetation height (Table 4) on the Z value error of the field points, read from the S-DMT, was also analyzed. Since the end field points of the normal cross-section of the forest road (the first and last field points in each profile (Figure 4)), during the spring survey, were in most cases “invisible” to the UAV, they were not included in the regression analysis. Namely, in these places, the obtained DTM had much higher elevation values (Z value) because the view was obscured by nearby tree canopies. Influence analysis of the ground vegetation height on DTM error could not determine the real dependence on the Z value error for the mentioned points. The correlation coefficient (R) was 0.716; that is, the coefficient of determination ( R 2 ) was 0.513, which according to Chaddok [52] represents a strong correlation (Figure 6). Both the water depth in side ditches and the vegetation height had a statistically significant effect on the incidence of the Z value error of the analyzed field points.
When Z value correction was conducted (by subtracting the measured water depth in side ditches and/or the measured vegetation height from the read Z values of the DTMs), the R M S E Z (in relation to the Z values of the field points measured using the total station) decreased. The R M S E Z of the field points, read from the W-DTM after correction with water depth (W-DTMw), was 7.70 cm. Higher R M S E Z values calculated for field points, read from the S-DTM (Figure 7), ranged from 23.41 cm after correction with water depth and vegetation height (S-DTMa) to 32.07 cm (correction only with the water depth in side ditches (S-DTMw)). The correction of field points, read from the S-DTM with only vegetation height S-DTMv1, affected the R M S E Z almost as much as the correction of field point Z values with the water depth and the vegetation height, i.e., the R M S E Z for the mentioned correction was 23.98 cm. The Z value correction of the field points, with vegetation height above the water in side ditches S-DTMv2 resulted in a R M S E Z value of 25.35 cm.
The largest difference in the compared Z values of field points between W-DTMw and Z values, measured with the total station, was 30.18 cm on profile 60. It is interesting that the mentioned field point is located outside the ditch, and water had no influence on this error. The largest difference in field points Z values after spring survey correction was 266.50 cm and it was recorded on profile 16 at a location below the tree canopy.

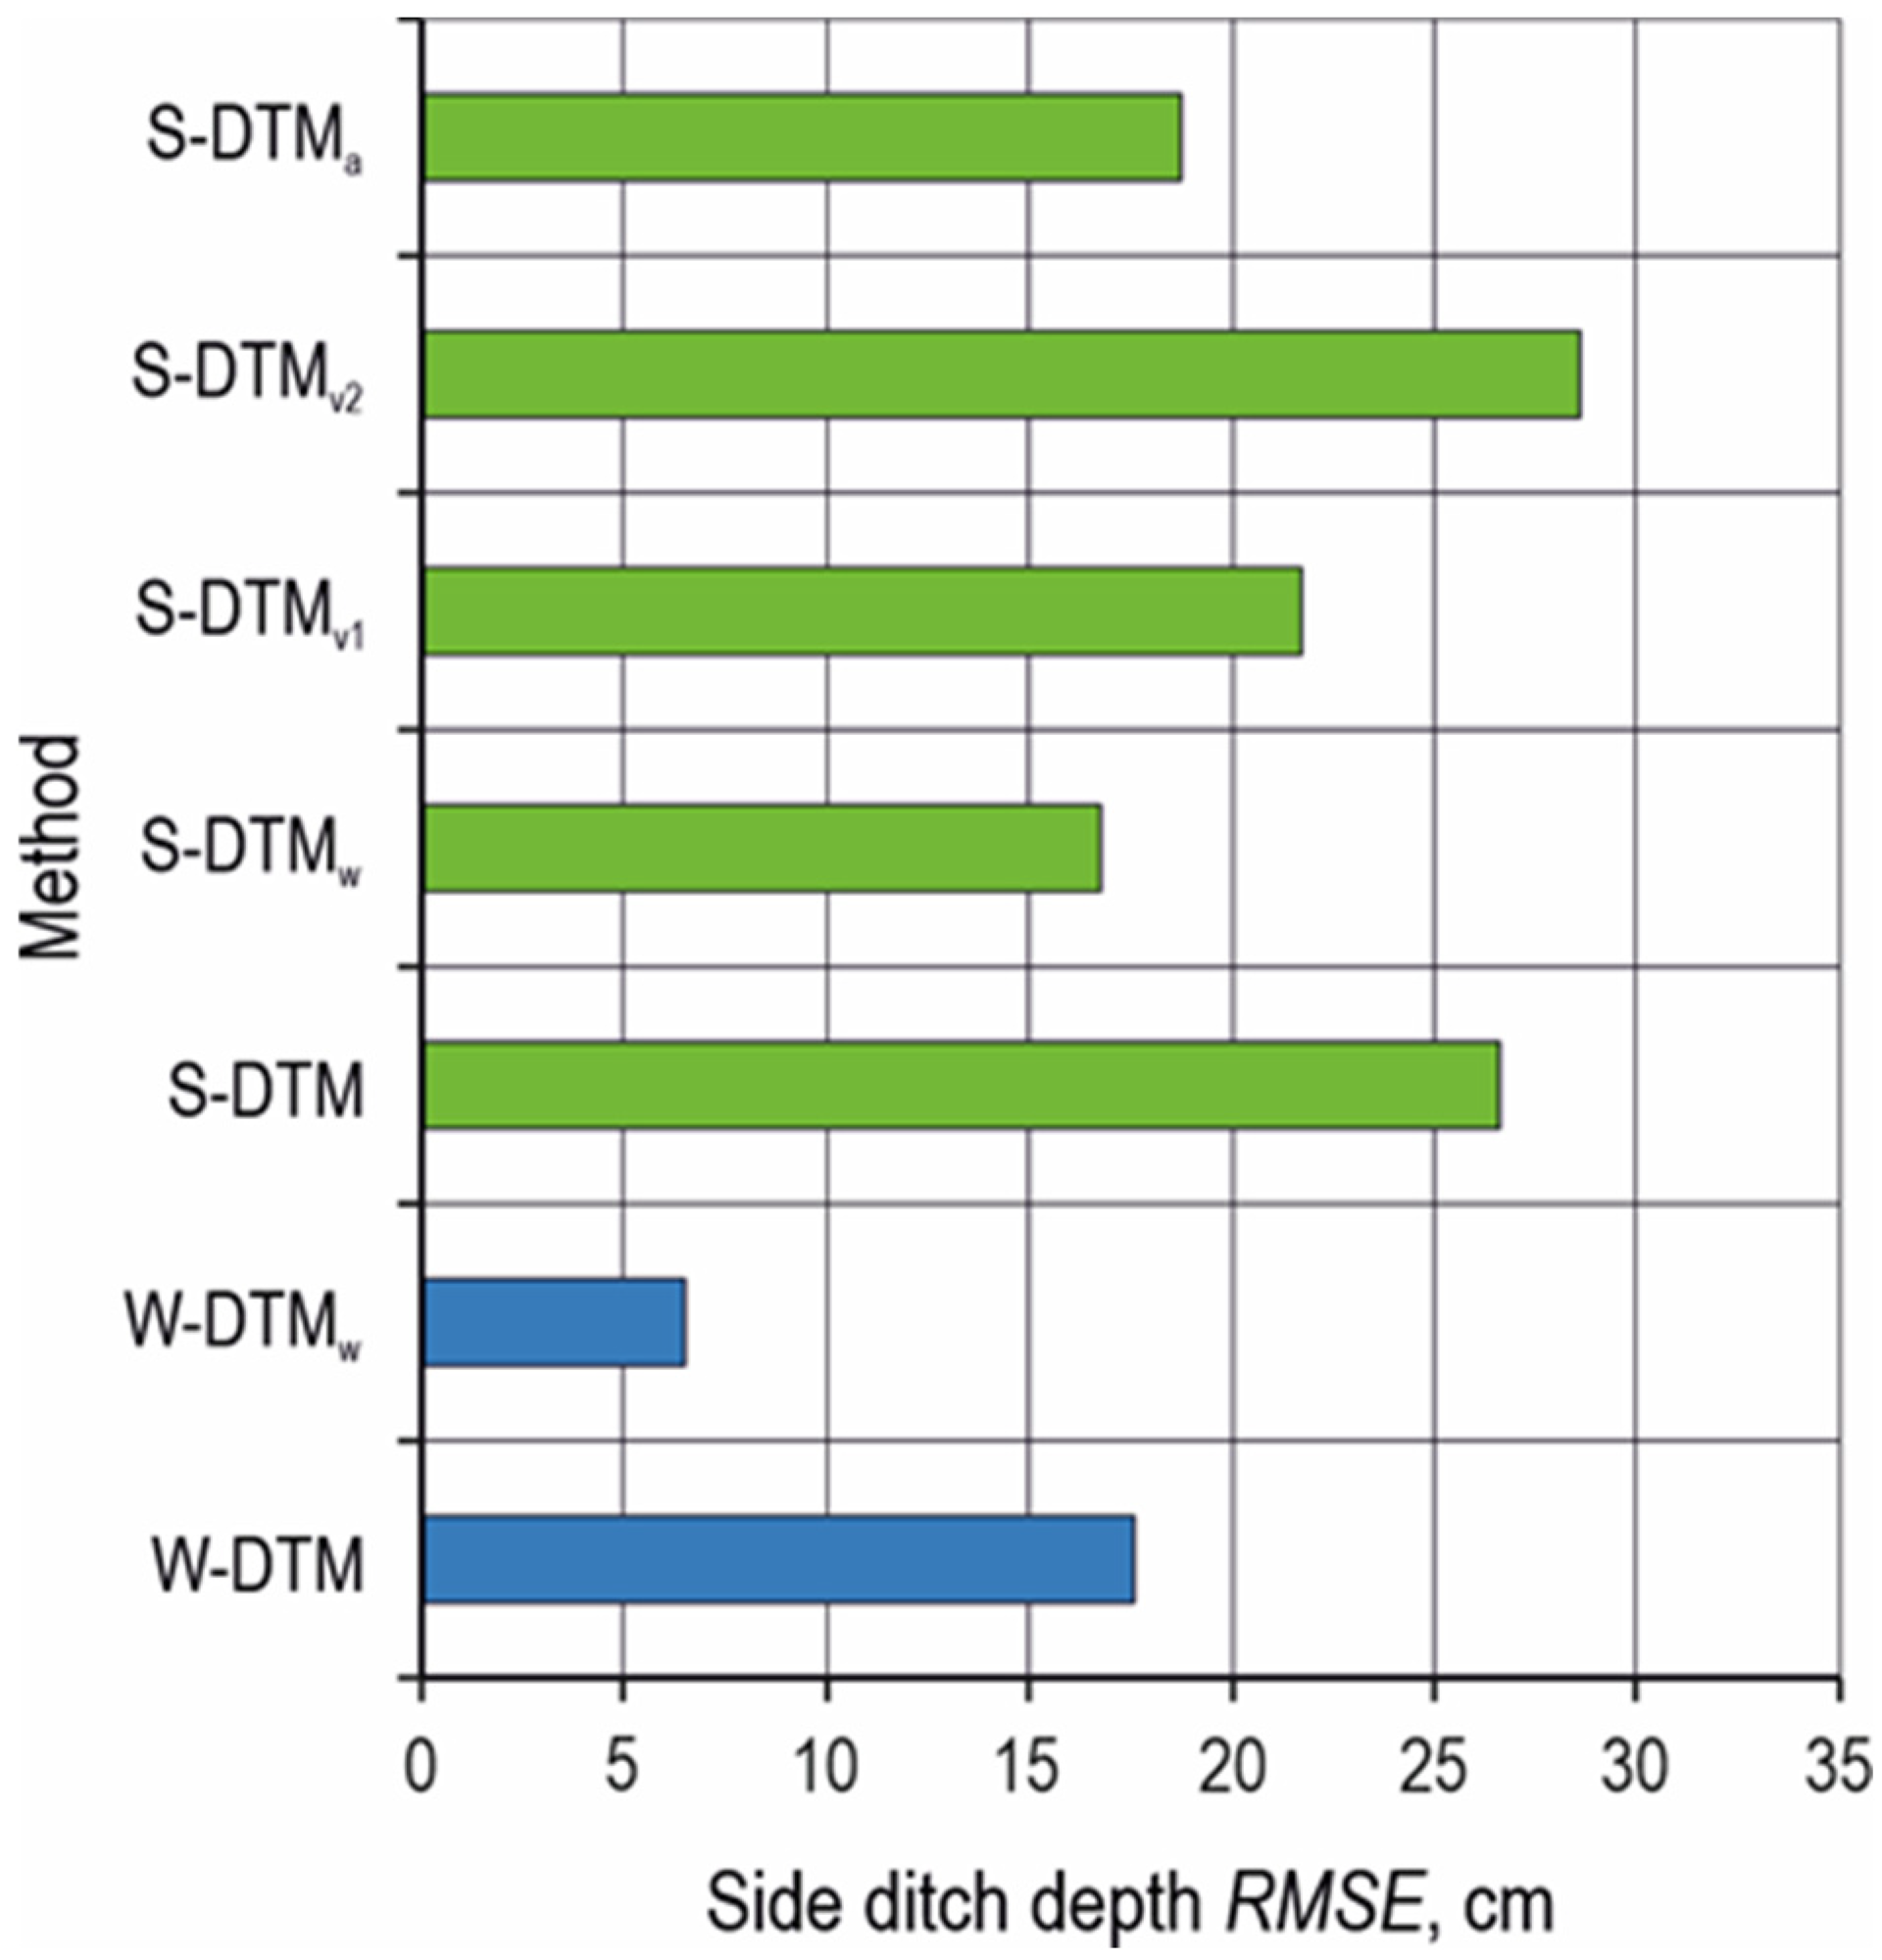
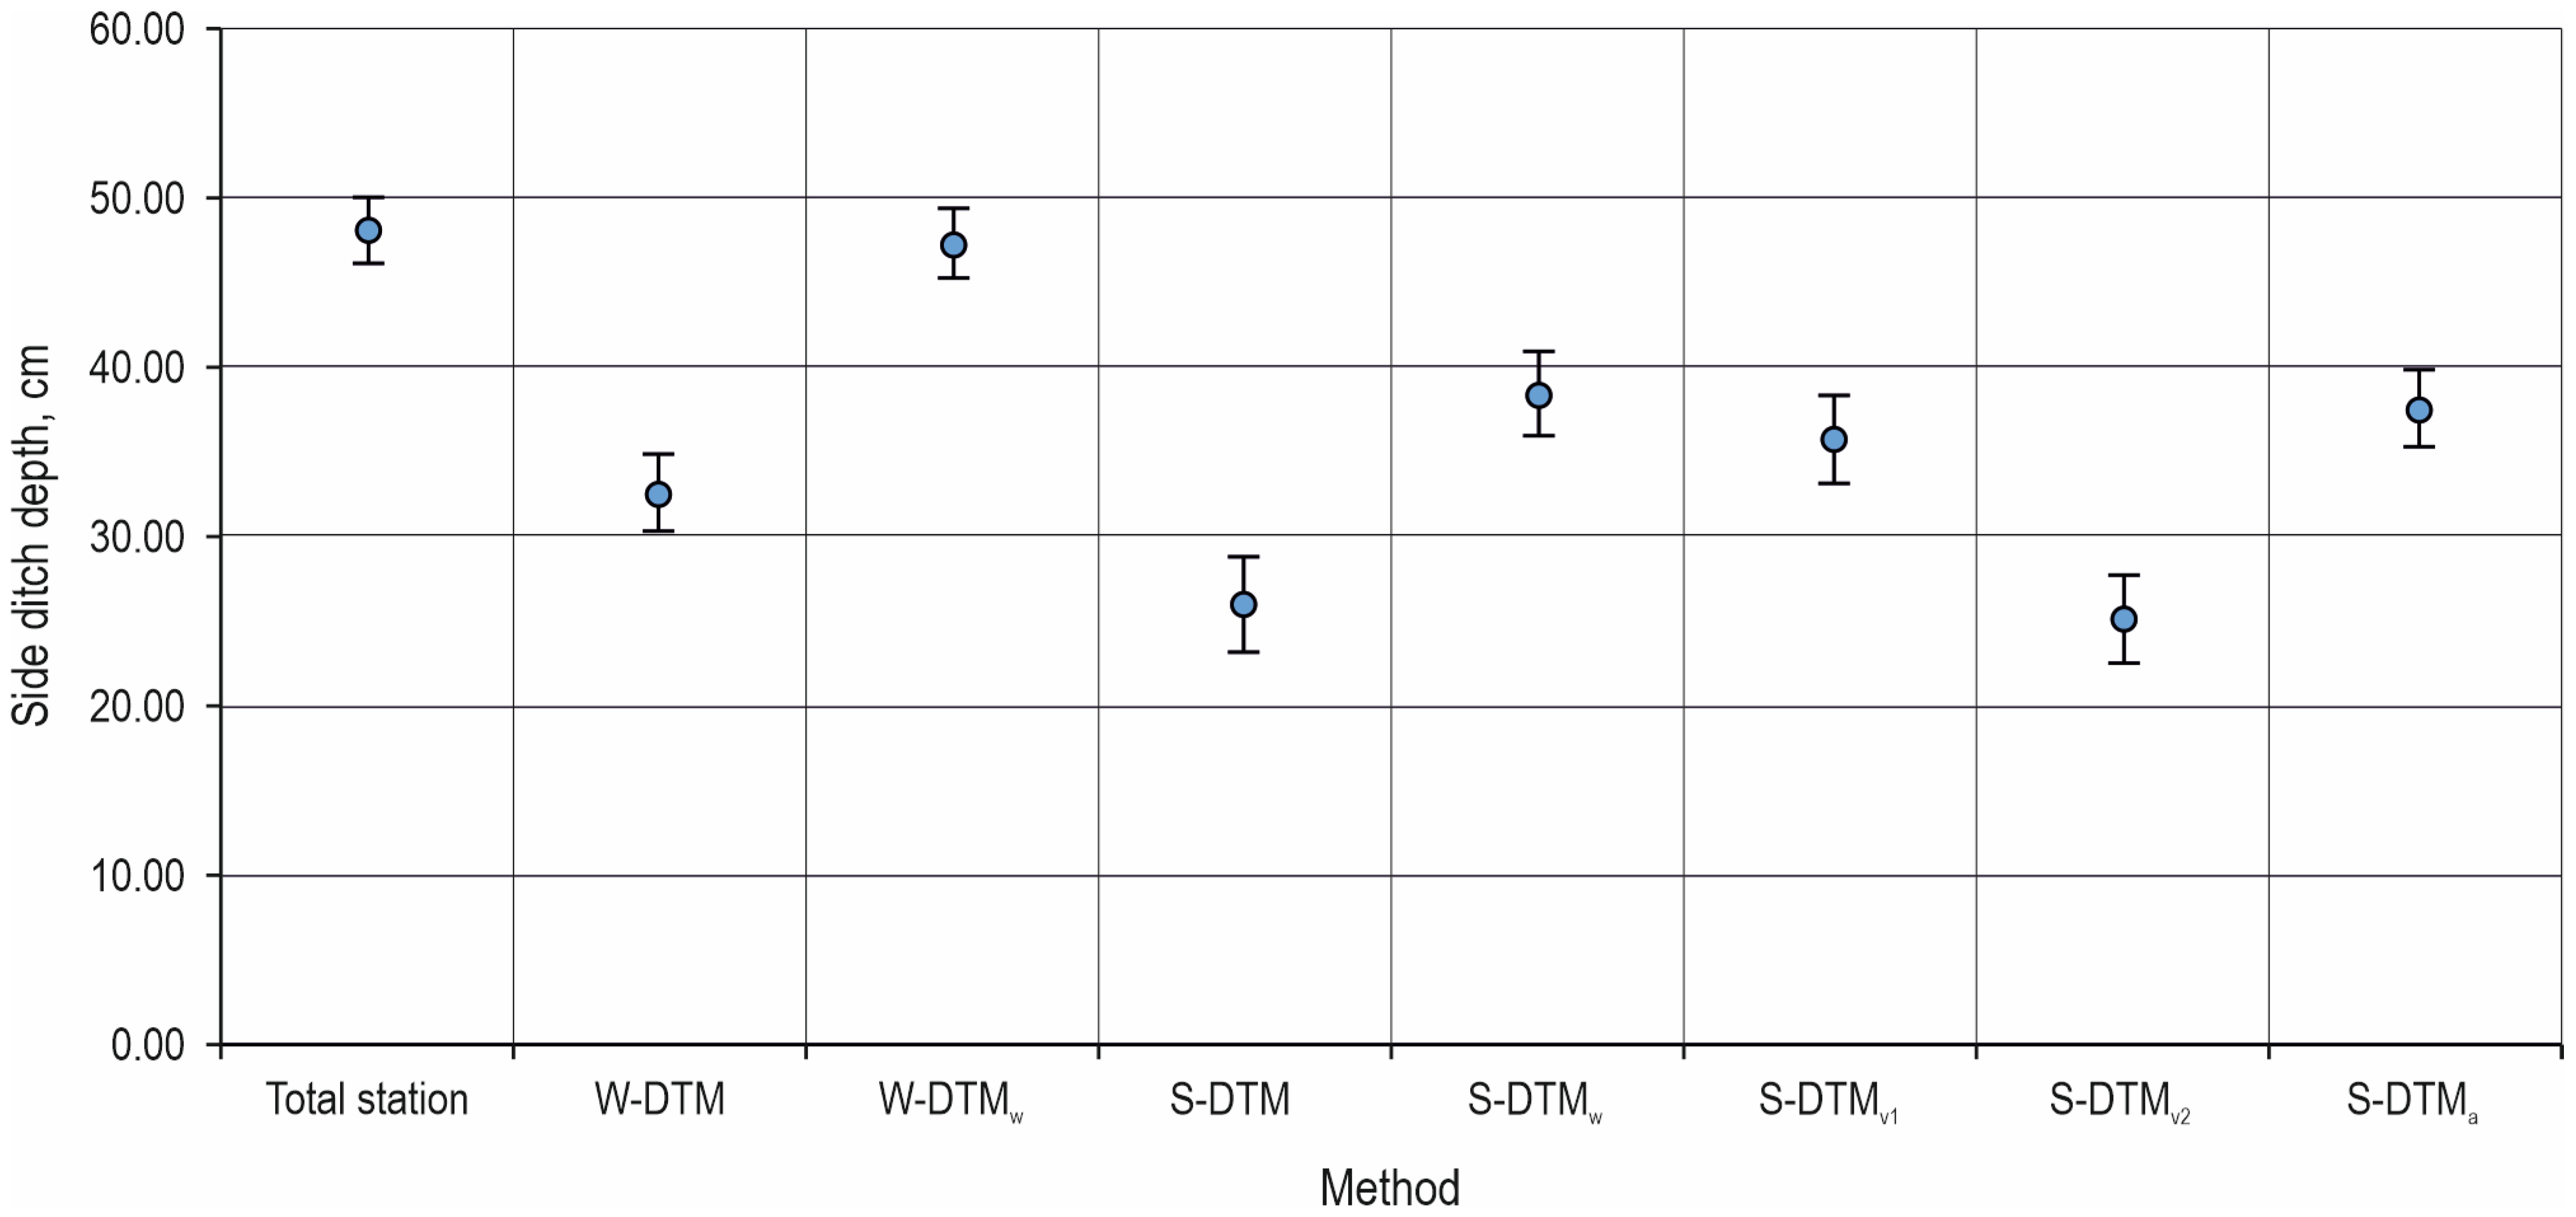
3.2. Forest Road Side Ditch Depth

In order to emphasize the errors caused by the water in side ditches and/or vegetation, an analysis was conducted based on the calculated side ditch depths using the total station and values calculated from the DTM readings (Table 5). A total of 184 side ditches were measured using each survey method. The average side ditch depth measured with the total station was 48.08 cm, while the minimum depth using the total station was 13.63 cm. Only 10 side ditches on the researched forest road had a measured depth less than the minimum defined depth of 30 cm [7]. W-DTM side ditches had an average depth of 32.58 cm, while the average depth of side ditches for the S-DTM was 25.99 cm. A total of 76 side ditches, measured on the W-DTM, had a smaller depth than the minimum depth of 30 cm, while the number for side ditches measured on the S-DTM was 106. The data were normally distributed as Kolmogorov–Smirnov and Shapiro—Wilk tests showed sig. > 0.05. ANOVA followed by a post hoc Tukey HSD (honestly significant difference) test indicated statistically significant differences for side ditch depth between the total station, W-DTM and S-DTM (Figure 8). The calculated RMSE of side ditch depth ( R M S E S D D ) (Figure 9) for the W-DTM was 17.60 cm, while for the S-DTM it was 26.58 cm.
Based on the corrected Z values for the W-DTM and S-DTM, new side ditch depths were calculated (Table 5). Depending on the type of correction, the average depth values came more or less close to the actual values measured with the total station. For W-DTMw, the average side ditch depth was 47.33 cm, which was 0.75 cm lower than the values measured with the total station. For S-DTMa, the average side ditch depth was 37.53 cm. ANOVA (Figure 10) showed that there was no statistically significant difference between the total station measurement and the corrected values for W-DTMw. On the other hand, in relation to the total station, even after corrections, the side ditch depths calculated from S-DTMa differed statistically significantly. The number of side ditches where the depth was less than the prescribed minimum of 30 cm also decreased after corrections. For W-DTMw, this was nine side ditches, while for S-DTMa, this was measured at fifty-six side ditches.
By correcting the Z values and calculating the new side ditch depths, the R M S E S D D changed in relation to the total station (Figure 10). After correction, the R M S E S D D calculated based on W-DTMw was 6.46 cm, and for S-DTMa it was 18.79 cm. The smallest R M S E S D D value of the corrected data for the spring UAV measurement was observed for S-DTMw (16.76 cm).

4. Discussion

The R M S E Z of all analyzed field points, read from the W-DTM, in relation to field points recorded by a total station, was 10.09 cm. The R M S E Z was further reduced to 7.16 cm when only field points where water was not detected were analyzed, which is in accordance with the research of other authors [38,53,54]. Although the achieved R M S E Z was in accordance with the research of the same authors, it should be noted that our recording area was elongated in shape, which poses a challenge for optimally placing GCPs, especially in the case of analyzing the Z coordinate [55]. The potential of UAVs, equipped with RGB cameras, was particularly evident during winter measurements, especially when field points that were not affected by water were considered, as it was observed that R M S E Z values were similar to those normally achieved by more expensive systems, such as LIDAR technology [56]. The water in side ditches significantly affected the recorded Z values of the analyzed field points during the winter survey (W-DTM) compared to the reference field measurement method (Figure 5). By correcting the data read from the W-DTM with the water depths measured in side ditches, the calculated R M S E Z was reduced to a value of 7.69 cm, 0.53 cm higher than the R M S E Z calculated for the field points read from the W-DTM, for which there was no need to make a correction due to the absence of water during the survey.
The spring survey (S-DTM) analysis on field points, as expected, gave higher R M S E Z values compared to the field points measured with the total station. The reason for this lies in the fact that forest road maintenance in the form of mowing grass on the embankment slopes and in the side ditches was not carried out between field data UAV surveys. As a result, the average vegetation height measured on the embankment slope, in the side ditches and at the top of the side ditch, during the spring survey, was 32.25 cm and even higher if only side ditches were considered (42.74 cm). By correcting the Z values of the field points with the measured water depths and vegetation heights, the R M S E Z still represented a statistically significant difference compared to the data collected with the total station. The authors point out that a possible reason for this phenomenon is the inability to accurately measure the height of low vegetation at a particular field point or the inability to accurately estimate the heights that will be calculated for a particular field point by later analyses based on aerial photogrammetric measurements.
The water depth and/or the vegetation height had a significant impact on the aerial photogrammetric survey. The problem of water and vegetation UAV surveys of depths (most commonly ruts) in forestry has also been emphasized by other authors [48,49,57,58]. Water in side ditches during the winter UAV survey significantly affected the calculated W-DTM side ditch depths, compared to the depths measured with the total station survey. After correcting the originally derived W-DTM with water depths (W-DTMw), side ditch depths did not differ statistically significantly compared to the total station.
Data correction does not necessarily provide accurate data, and this was shown in the case of the spring measurement correction, which was performed only at field points where water was recorded in side ditches (S-DTMw). For the S-DTMw, the recorded R M S E S D D was 16.77 cm, which is the lowest RMSE value for the spring measurement.
This occurred because the correction was performed only with the measured water depth, which was almost at the same level in some places as the vegetation height in the side ditches. The height of the vegetation of the underlying soil or the height of the vegetation at the top of the side ditch in this case provided “false” data about the side ditch top, which consequently affected the calculation of its depth.
The number of side ditches measured with the total station that had a depth less than the defined minimum of 30 cm [7] was 10, which also represents the number of side ditches for which it is necessary to carry out the maintenance. Side ditch depths measured on the W-DTM that were smaller than the prescribed minimum (30 cm) were recorded in 76 side ditches, which in relative terms represents 41.3% of the total number of side ditches included in the study. For the S-DTM, this number was even greater (106 side ditches or 57.6% of the total number of analyzed side ditches). The cause of the error in both cases was the water (W-DTM; S-DTM) or the vegetation (S-DTM). After correcting the readings with the measured water depth (winter survey) or with the measured water depth and vegetation height (spring survey), the number of side ditches with a depth lower than the prescribed minimum of 30 cm also decreased. For the W D T M w , it was only nine side ditches, while for the S-DTMa, it still amounted to 30.43% of the total number of side ditches analyzed, i.e., it was recorded in fifty-six side ditches.

5. Conclusions

Unmanned aerial vehicles enable fast and, from the perspective of labor used and time taken, cheaper measurement of the cross-sections of forest roads, while their accuracy largely depends on the conditions on the ground or on the method and time of collecting field data. Due to the very nature of recording with RGB cameras, which unmanned aerial vehicles can be equipped with, water in the side ditches of the forest road and ground vegetation on the embankment slopes can significantly affect the accuracy of the created digital terrain model or the accuracy of the measured forest road cross-sections. Based on the analyzed data, it can be concluded that the highest recorded Z coordinate accuracy of the analyzed field points was observed on digital terrain models created using aerial photographs, collected during the winter survey with the recommendation that this type of field survey be carried out during the winter months, i.e., during the vegetation dormancy period, which significantly affects the accuracy of the obtained data. It should be emphasized that recording the height of the vegetation for correction purposes is extremely difficult. Unlike the depth of the water, which is constant if it is calm, the density and height of the vegetation are very variable in a small area. This prevents quality data correction.
The authors draw very similar conclusions from the analyzed measured side ditch depths. It is not possible to have trustworthy maintenance planning based on data from the original DTM created using aerial photographs (winter and spring aspect) if water or vegetation (grass mostly) is present. The reason lies in the fact that the data obtained in this way differs statistically significantly from the reference method of field survey (total station), which can contribute to the creation of a distorted picture that differs greatly from the actual situation on the ground. The only DTM for which no statistically significant difference in the values of the depths of side ditches was observed, in relation to the side ditch depths measured using the total station, is the W-DTMw, which was created using aerial photographs collected during the winter survey and which was subsequently corrected with the water depths measured directly on the ground. Like the analyzed Z coordinate values of the field points, here too, the S-DTM, regardless of the correction (water depth and/or vegetation height), did not yield statistically insignificant results. The reason lies in the fact that it is almost impossible to define its exact vegetation height, due to the observed high variability in the heights of low vegetation at a particular field point, while on the other hand, the aforementioned variability in height greatly affects the result of photogrammetric analyses. Due to all of the above, the authors suggest that UAV imaging for the purpose of determining side ditch depths must be performed exclusively during the winter months, with the mandatory collection of water depth in side ditches in order to be sure of the accuracy and reliability of the results obtained.
Based on the research conducted, the authors conclude that unmanned aerial vehicles offer advantages and quick solutions for field surveys dealing with cross-sections of forest roads, but only when used in conditions that will not have a statistically significant impact on the accuracy of the survey. Of course, each unmanned aerial vehicle operator and/or forestry expert responsible for conducting the field survey remains responsible for eliminating all factors that could potentially significantly affect the accuracy and reliability of the field survey. In future research, it is necessary to test the influence of UAV flight altitude when collecting this type of data. Although the clear zone around the surveyed forest road was 30 m wide, some branches prevented recording from a lower altitude during this research. Also, as elongated area shape can pose a challenge for good GCP placement [55], future research should also analyze the impact of GCP placement on ditch depth accuracy.

Author Contributions

Conceptualization, I.P. and M.L.; methodology, I.P.; software, M.L.; validation, T.P. and A.Đ.; formal analysis, M.P., M.H. and L.H.; investigation, L.H. and M.L.; resources, A.Đ.; data curation, L.H. and M.H.; writing—original draft preparation, I.P. and M.L.; writing—review and editing, I.P., M.P. and A.Đ.; visualization, I.P., M.L. and M.H.; supervision, A.Đ.; project administration, T.P.; funding acquisition, A.Đ. All authors have read and agreed to the published version of the manuscript.

Funding

The research was carried out as a part of the “Conservation of narrow-leaved ash stands (Fraxinus angustifolia Vahl) in the Republic of Croatia with an emphasis on harmful biotic factors” project, funded by the Ministry of Agriculture of the Republic of Croatia from the Funds for the Multifunctional Role of Forests. This work was supported by the Croatian Science Foundation under project number HRZZ-UIP-2019-04-7766.

Data Availability Statement

Data are contained within the article.

Acknowledgments

The authors wish to thank the University of Zagreb, Faculty of Forestry and Wood Technology, for their support during the research.

Conflicts of Interest

The authors declare no conflicts of interest.

References

  1. He, M.; Smidt, M.; Li, W.; Zhang, Y. Logging Industry in the United States: Employment and Profitability. Forests 2021, 12, 1720. [Google Scholar] [CrossRef]
  2. Šporčić, M.; Landekić, M.; Šušnjar, M.; Pandur, Z.; Bačić, M.; Mijoč, D. Deliberations of Forestry Workers on Current Challenges and Future Perspectives on Their Profession—A Case Study from Bosnia and Herzegovina. Forests 2023, 14, 817. [Google Scholar] [CrossRef]
  3. Talbot, B.; Suadicani, K. Quantifying the influence of geo-spatial forest distribution on machinery management. Baltic For 2015, 21, 340–348. Available online: https://balticforestry.lammc.lt/bf/PDF_Articles/2015-21[2]/Baltic%20Forestry%202015%2021(2)%20%20340_348%20Talbot.pdf (accessed on 10 February 2025).
  4. Enache, A.; Kühmaier, M.; Visser, R.; Stampfer, K. Forestry operations in the European mountains: A study of current practices and efficiency gaps. Scand. J. For. Res. 2016, 31, 412–427. [Google Scholar] [CrossRef]
  5. Simões, D.; Cavalcante, F.S.; Lima, R.C.A.; Rocha, Q.S.; Pereira, G.; Miyajima, R.H. Optimal forest road density as decision-making factor in wood extraction. Forests 2022, 13, 1703. [Google Scholar] [CrossRef]
  6. Heinimann, H.R. Forest road network and transportation engineering–state and perspectives. Croat. J. For. Eng. 2017, 38, 155–173. Available online: https://crojfe.com/site/assets/files/4077/heinimann.pdf (accessed on 10 February 2025).
  7. Šikić, D.; Babić, B.; Topolnik, D.; Knežević, I.; Božičević, D.; Švabe, Ž.; Piria, I.; Sever, S. Tehnički Uvjeti za Gospodarske Ceste, 1st ed.; Znanstveni Savjet za Promet Jugoslavenske Akademije Znanosti i Umjetnosti: Zagreb, Croatia, 1989; pp. 1–78. [Google Scholar]
  8. Gumus, S.; Acar, H.H.; Toksoy, D. Functional forest road network planning by consideration of environmental impact assessment for wood harvesting. Environ. Monit. Assess. 2008, 142, 109–116. [Google Scholar] [CrossRef]
  9. Laschi, A.; Foderi, C.; Fabiano, F.; Neri, F.; Cambi, M.; Mariotti, B.; Marchi, E. Forest road planning, construction and maintenance to improve forest fire fighting: A review. Croat. J. For. Eng. 2019, 40, 207–219. Available online: https://crojfe.com/site/assets/files/4308/laschi.pdf (accessed on 10 February 2025).
  10. Thompson, M.P.; Gannon, B.M.; Caggiano, M.D. Forest roads and operational wildfire response planning. Forests 2021, 12, 110. [Google Scholar] [CrossRef]
  11. Bamwesigye, D.; Fialová, J.; Kupec, P.; Łukaszkiewicz, J.; Fortuna-Antoszkiewicz, B. Forest recreational services in the face of COVID-19 pandemic stress. Land 2021, 10, 1347. [Google Scholar] [CrossRef]
  12. Murray, A.T. Route planning for harvest site access. Can. J. For. Res. 1998, 28, 1084–1087. [Google Scholar] [CrossRef]
  13. Cavalli, R.; Grigolato, S. Influence of characteristics and extension of a forest road network on the supply cost of forest woodchips. J. For. Res. 2010, 15, 202–209. [Google Scholar] [CrossRef]
  14. Keramati, A.; Lu, P.; Sobhani, A.; Haji Esmaeili, S.A. Impact of Forest Road Maintenance Policies on Log Transportation Cost, Routing, and Carbon-Emission Trade-Offs: Oregon Case Study. J. Transp. Eng. A Syst. 2020, 146, 04020028. [Google Scholar] [CrossRef]
  15. Akay, A.E.; Sessions, J. Applying the decision support system, TRACER, to forest road design. West. J. Appl. For. 2005, 20, 184–191. [Google Scholar] [CrossRef]
  16. Açıl, A.; Aydın, A.; Eker, R.; Duyar, A. Use of UAV data and HEC-RAS model for dimensioning of hydraulic structures on forest roads. Croat. J. For. Eng. 2023, 44, 171–188. [Google Scholar] [CrossRef]
  17. Çalişkan, E.; Karahalil, U. Evaluation of forest road network and determining timber extraction system using GIS: A case study in Anbardağ planning unit. Sumar. List 2017, 141, 163–171. [Google Scholar] [CrossRef]
  18. Siqueira-Gay, J.; Sonter, L.J.; Sánchez, L.E. Exploring potential impacts of mining on forest loss and fragmentation within a biodiverse region of Brazil’s northeastern Amazon. Resour. Policy 2020, 67, 101662. [Google Scholar] [CrossRef]
  19. Kato, S. Studies on the forest road system. Preliminary report on the road density. Bull. Tokyo Univ. 1967, 63, 215–223. Available online: https://www.cabidigitallibrary.org/doi/full/10.5555/19670604450 (accessed on 10 February 2025).
  20. Dražić, S.; Danilović, M.; Ristić, R.; Stojnić, D.; Antonić, S. Evaluation of Morphometric Terrain Parameters and Their Influence on Determining Optimal Density of Primary Forest Road Network. Croat. J. For. Eng. 2023, 44, 301–312. [Google Scholar] [CrossRef]
  21. Lyons, C.K.; Borz, S.A.; Harvey, C.; Ramantswana, M.; Sakai, H.; Visser, R. Forest roads: Regional perspectives from around the world. Int. J. Eng. 2023, 34, 190–203. [Google Scholar] [CrossRef]
  22. Pentek, T.; Đuka, A.; Papa, I.; Damić, D.; Poršinsky, T. Elaborat učinkovitosti primarne šumske prometne infrastrukture—Alternativa studiji primarnog otvaranja šuma ili samo prijelazno rješenje? Sumar. List 2016, 140, 435–452. [Google Scholar] [CrossRef]
  23. Pičman, D. Šumske Prometnice, 1st ed.; Šumarski Fakultet Sveučilišta u Zagrebu: Zagreb, Croatia, 2007. [Google Scholar]
  24. Pentek, T.; Nevečerel, H.; Ecimović, T.; Lepoglavec, K.; Papa, I.; Tomašić, Ž. Strategijsko planiranje šumskih prometnica u Republici Hrvatskoj–raščlamba postojećega stanja kao podloga za buduće aktivnosti. Nova Meh. Šumarstva 2014, 35, 63–78. Available online: https://hrcak.srce.hr/121858 (accessed on 10 February 2025).
  25. Skaugset, A.E.; Allen, M. Forest Road Sediment and Drainage Monitoring Project Report for Private and State Lands in Western Oregon; Oregon Department of Forestry: Salem, OR, USA, 1998. Available online: https://coast.noaa.gov/data/czm/pollutioncontrol/media/Technical/D49%20-%20Skaugset%201998%20Forestry%20Road%20Sedimentation%20Drainage.pdf (accessed on 10 February 2025).
  26. Douglas, R.A. Road construction. In Low-Volume Road Engineering: Design, Construction, and Maintenance, 1st ed.; CRC Press: Boca Raton, FL, USA, 2016; p. 256. [Google Scholar] [CrossRef]
  27. Reid, L.M.; Dunne, T. Sediment Production from Forest Road Surfaces. Water Resour. Res. 1984, 20, 1753–1761. [Google Scholar] [CrossRef]
  28. Sessions, J. Forest Road Construction. In Forest Road Operations in the Tropics, 1st ed.; Springer: Berlin/Heidelberg, Germany; New York, NY, USA, 2007; p. 124. [Google Scholar] [CrossRef]
  29. Ryan, T.; Phillips, H.; Ramsay, J.; Dempsey, J. Forest Road Manual: Guidelines for the Design, Construction and Management of Forest Roads, 1st ed.; COFORD: Dublin, Ireland, 2004; Available online: https://www.unirc.it/documentazione/materiale_didattico/598_2007_39_832.pdf (accessed on 10 February 2025).
  30. Akay, A.E. Minimizing Total Cost of Construction, Maintenance, and Transportation Costs with Computer-Aided Forest Road Design. Ph.D. Thesis, Oregon State University, Corvallis, OR, USA, 2003. [Google Scholar] [CrossRef]
  31. Coulter, E.D.; Sessions, J.; Wing, M.G. Scheduling forest road maintenance using the analytic hierarchy process and heuristics. Silva Fenn. 2006, 40, 143. Available online: https://www.researchgate.net/profile/Elizabeth-Dodson/publication/260171486_Scheduling_Forest_Road_Maintenance_Using_the_Analytic_Hierarchy_Process_and_Heuristics/links/553950230cf2239f4e7d8fa6/Scheduling-Forest-Road-Maintenance-Using-the-Analytic-Hierarchy-Process-and-Heuristics.pdf (accessed on 10 February 2025). [CrossRef]
  32. Motlagh, A.R.; Parsakhoo, A.; Najafi, A.; Mohammadi, J. Development of a Sustainable Maintenance Strategy for Forest Road Wearing Courses in Different Climate Zones. Croat. J. For. Eng. 2024, 45, 139–156. [Google Scholar] [CrossRef]
  33. Torresan, C.; Berton, A.; Carotenuto, F.; Di Gennaro, S.F.; Gioli, B.; Matese, A.; Miglietta, F.; Vagnoli, C.; Zaldei, A.; Wallace, L. Forestry applications of UAVs in Europe: A review. Int. J. Remote Sens. 2017, 38, 2427–2447. [Google Scholar] [CrossRef]
  34. Dainelli, R.; Toscano, P.; Di Gennaro, S.F.; Matese, A. Recent advances in Unmanned Aerial Vehicles forest remote sensing—A systematic review. Part II: Research applications. Forests 2021, 12, 397. [Google Scholar] [CrossRef]
  35. Tomljanović, K.; Kolar, A.; Đuka, A.; Franjević, M.; Jurjević, L.; Matak, I.; Ugarković, D.; Balenović, I. Application of uas for monitoring of forest ecosystems–a review of experience and knowledge. Croat. J. For. Eng. 2022, 43, 487–504. [Google Scholar] [CrossRef]
  36. Swayze, N.C.; Tinkham, W.T.; Vogeler, J.C.; Hudak, A.T. Influence of flight parameters on UAS-based monitoring of tree height, diameter, and density. Remote Sens. Environ. 2021, 263, 112540. [Google Scholar] [CrossRef]
  37. Dhruva, A.; Hartley, R.J.; Redpath, T.A.; Estarija, H.J.C.; Cajes, D.; Massam, P.D. Effective UAV Photogrammetry for Forest Management: New Insights on Side Overlap and Flight Parameters. Forests 2024, 15, 2135. [Google Scholar] [CrossRef]
  38. Tomaštík, J.; Mokroš, M.; Saloň, Š.; Chudý, F.; Tunák, D. Accuracy of photogrammetric UAV-based point clouds under conditions of partially-open forest canopy. Forests 2017, 8, 151. [Google Scholar] [CrossRef]
  39. Zhang, H.; Aldana-Jague, E.; Clapuyt, F.; Wilken, F.; Vanacker, V.; Van Oost, K. Evaluating the potential of post-processing kinematic (PPK) georeferencing for UAV-based structure-from-motion (SfM) photogrammetry and surface change detection. Earth Syst. Dyn. 2019, 7, 807–827. [Google Scholar] [CrossRef]
  40. Tomaštík, J.; Mokroš, M.; Surový, P.; Grznárová, A.; Merganič, J. UAV RTK/PPK method—An optimal solution for mapping inaccessible forested areas? Remote Sens. 2019, 11, 721. [Google Scholar] [CrossRef]
  41. Miller, Z.M.; Hupy, J.; Chandrasekaran, A.; Shao, G.; Fei, S. Application of postprocessing kinematic methods with UAS remote sensing in forest ecosystems. J. For. 2021, 119, 454–466. [Google Scholar] [CrossRef]
  42. Đuka, A.; Tomljanović, K.; Franjević, M.; Janeš, D.; Žarković, I.; Papa, I. Application and Accuracy of Unmanned Aerial Survey Imagery after Salvage Logging in Different Terrain Conditions. Forests 2022, 13, 2054. [Google Scholar] [CrossRef]
  43. Iglhaut, J.; Cabo, C.; Puliti, S.; Piermattei, L.; O’Connor, J.; Rosette, J. Structure from motion photogrammetry in forestry: A review. Curr. For. Rep. 2019, 5, 155–168. [Google Scholar] [CrossRef]
  44. Stöcker, C.; Nex, F.; Koeva, M.; Gerke, M. Quality assessment of combined IMU/GNSS data for direct georeferencing in the context of UAV-based mapping. ISPRS 2017, 42, 355–361. [Google Scholar] [CrossRef]
  45. Padró, J.C.; Muñoz, F.J.; Planas, J.; Pons, X. Comparison of four UAV georeferencing methods for environmental monitoring purposes focusing on the combined use with airborne and satellite remote sensing platforms. Int. J. Appl. Earth Obs. Geoinf. 2019, 75, 130–140. [Google Scholar] [CrossRef]
  46. Hrůza, P.; Mikita, T.; Janata, P. Monitoring of forest hauling roads wearing course damage using unmanned aerial systems. Acta Univ. Agric. Silvic. Mendel. Brun. 2016, 64, 1537–1546. [Google Scholar] [CrossRef]
  47. Hasegawa, H.; Sujaswara, A.A.; Kanemoto, T.; Tsubota, K. Possibilities of Using UAV for Estimating Earthwork Volumes during Process of Repairing a Small-Scale Forest Road, Case Study from Kyoto Prefecture, Japan. Forests 2023, 14, 677. [Google Scholar] [CrossRef]
  48. Marra, E.; Cambi, M.; Fernandez-Lacruz, R.; Giannetti, F.; Marchi, E.; Nordfjell, T. Photogrammetric estimation of wheel rut dimensions and soil compaction after increasing numbers of forwarder passes. Scand. J. For. Res. 2018, 33, 613–620. [Google Scholar] [CrossRef]
  49. Gülci, S.; Şireli, S. The evaluation of SfM technique in the determination of surface deformation on skidding roads following timber harvesting. Eur. J. For. Eng. 2019, 5, 52–60. [Google Scholar] [CrossRef]
  50. Mihelič, J.; Robek, R.; Kobal, M. Determining bulk factors for three subsoils used in forest engineering in Slovenia. Croat. J. For. Eng. 2022, 43, 303–311. [Google Scholar] [CrossRef]
  51. Lasić, Z. Praktični Rad s Geodetskim Instrumentima, Interna Skripta, 1st ed.; Sveučilište u Zagrebu, Geodetski Fakultet: Zagreb, Croatia, 2008. [Google Scholar]
  52. Chaddock, R.E. Principles and Methods of Statistics, 1st ed.; Houghton Miffin Company: Boston, MA, USA; The Riverside Press: Cambridge, UK, 1925; pp. 248–303. [Google Scholar] [CrossRef]
  53. Agüera-Vega, F.; Carvajal-Ramírez, F.; Martínez-Carricondo, P. Assessment of photogrammetric mapping accuracy based on variation ground control points number using unmanned aerial vehicle. Measurement 2017, 98, 221–227. [Google Scholar] [CrossRef]
  54. Uysal, M.; Toprak, A.S.; Polat, N. DEM generation with UAV Photogrammetry and accuracy analysis in Sahitler hill. Measurement 2015, 73, 539–543. [Google Scholar] [CrossRef]
  55. Awasthi, B.; Karki, S.; Regmi, P.; Dhami, D.S.; Thapa, S.; Panday, U.S. Analyzing the effect of distribution pattern and number of GCPs on overall accuracy of UAV photogrammetric results. In Proceedings of UASG 2019: Unmanned Aerial System in Geomatics 1; Springer International Publishing: Cham, Switzerland, 2020; pp. 339–354. [Google Scholar] [CrossRef]
  56. Tamimi, R.; Toth, C. Accuracy Assessment of UAV LiDAR Compared to Traditional Total Station for Geospatial Data Collection in Land Surveying Contexts. ISPRS 2024, 48, 421–426. [Google Scholar] [CrossRef]
  57. Ferenčík, M.; Dudáková, Z.; Kardoš, M.; Sivák, M.; Merganičová, K.; Merganič, J. Measuring Soil Surface Changes after Traffic of Various Wheeled Skidders with Close-Range Photogrammetry. Forests 2022, 13, 976. [Google Scholar] [CrossRef]
  58. Marra, E.; Wictorsson, R.; Bohlin, J.; Marchi, E.; Nordfjell, T. Remote measuring of the depth of wheel ruts in forest terrain using a drone. IJFE 2021, 32, 224–234. [Google Scholar] [CrossRef]
Figure 1. Study area—Management Unit Česma.
Forests 16 00507 g001
Figure 2. Recorded normal cross-section field points (winter and spring aspect) and measuring location of water depth and vegetation height.
Forests 16 00507 g002
Figure 3. Side ditch depth calculation.
Forests 16 00507 g003
Figure 4. Forest road cross-section recorded with total station and read from DTMs.
Forests 16 00507 g004
Figure 5. Values of regression model predicted for dependent variable (Z value difference) (blue dots) based on recorded water depth in side ditches.
Forests 16 00507 g005
Figure 6. Values of regression model predicted for dependent variable (Z value difference) (green dots) based on recorded water depth in side ditches and vegetation height on embankment slope.
Forests 16 00507 g006
Figure 7. R M S E Z of all recorded terrain points by surveying methods. Blue bars represent winter survey, green bars represent spring survey.
Forests 16 00507 g007
Figure 8. Difference in side ditch depth by surveying methods. Data are presented as mean (blue dots) ± SE (standard error).
Forests 16 00507 g008
Figure 9. R M S E S D D by methods. Blue bars represent winter survey, green bars represent spring survey.
Forests 16 00507 g009
Figure 10. Difference in side ditch depth by surveying methods and their corrections. Data are presented as mean (blue dots) ± SE.
Forests 16 00507 g010
Table 1. Technical specification of total station Stonex R35 and UAV DJI Mavic 3 enterprise.
Total Station Stonex R35UAV DJI Mavic 3 Enterprise
Angle measurement (angle units)DEG 360°/GON 400/MIL 6.400/
Distance measurement rangeStandard mode prism
3.000 m
Long mode prism
5.000 m
/
Distance measurement accuracyStandard mode prism
2 mm + 2 ppm
Long mode prism
2 mm + 2.5 ppm
/
Laser plummet
(laser type)
635 nm semiconductor laser/
Power supply (battery)7.4 V/3.400 mAh Li-ion5000 mAh LiPo 4S type battery
15.4 V (standard voltage)
Power supply (working time
(angle + distance meas.)
Up to 5 h45 min (no wind)
Physical specification
(dimensions)
206 × 203 × 360 mm347.5 × 283 × 107.7 mm (without propellers)
Physical specification
(weight including battery
and tribrach)
6.1 kg915 g
Measurement unit
(camera)
/DJI Mavic 3E Wide Camera:
20 MP sensor
FOV: 84°
Format Equivalent: 24 mm
Aperture: f/2.8-f/11
Focus: 1 m to ∞
Electronic Shutter: 8-1/8000 s
Mechanical Shutter: 8-1/2000 s
GNSS/GPS + Galileo + BeiDou + GLONASS (GLONASS is supported only when the RTK module is enabled)
RTK (Positioning accuracy)/Horizontal: 1 cm + 1 ppm; Vertical: 1.5 cm + 1 ppm
Table 2. Photogrammetric analysis of winter and spring UAV surveys.
Survey Period
WinterSpring
Number of photographs687687
Area16.23 ha13.97 ha
GSD1.76 cm1.78 cm
RMS GCP error0.026 m0.027 m
DTM resolution5 × GSD (1.76 [cm/pixel])5 × GSD (1.78 [cm/pixel])
Processing time (total)4 h, 37 min, 39 s4 h, 16 min, 46 s
Table 3. Recorded water depths in side ditches—winter survey.
Water Depth Inside Ditches (cm)
Average value17.18
Minimum value2.8
Maximum value42.9
Number of terrain points316
Table 4. Recorded water depth in side ditches and vegetation height on embankment slope—spring survey.
Water Depth Inside Ditches (cm)Vegetation Height Outside Side Ditches (cm)Vegetation Height Inside Ditches (cm)
Average value13.9825.5242.74
Minimum value155
Maximum value459090
Number of terrain points368646310
Table 5. Recorded side ditch depths by used surveying methods.
Total StationW-DTM W D T M w S-DTM S D T M w S D T M V 1 S D T M V 2 S D T M a
Average value (cm)48.0832.5847.3325.9938.4535.7225.0737.53
Maximum value (cm)98.0478.3796.2480.2897.6685.2885.2885.28
Minimum value (cm)13.63−1.4713.77−18.75−7.29−11.99−23.711.01
Disclaimer/Publisher’s Note: The statements, opinions and data contained in all publications are solely those of the individual author(s) and contributor(s) and not of MDPI and/or the editor(s). MDPI and/or the editor(s) disclaim responsibility for any injury to people or property resulting from any ideas, methods, instructions or products referred to in the content.

