
Drought Driving Factors as Revealed by Geographic Detector Model and Random Forest in Yunnan, China

 , and
, and
Abstract
1. Introduction
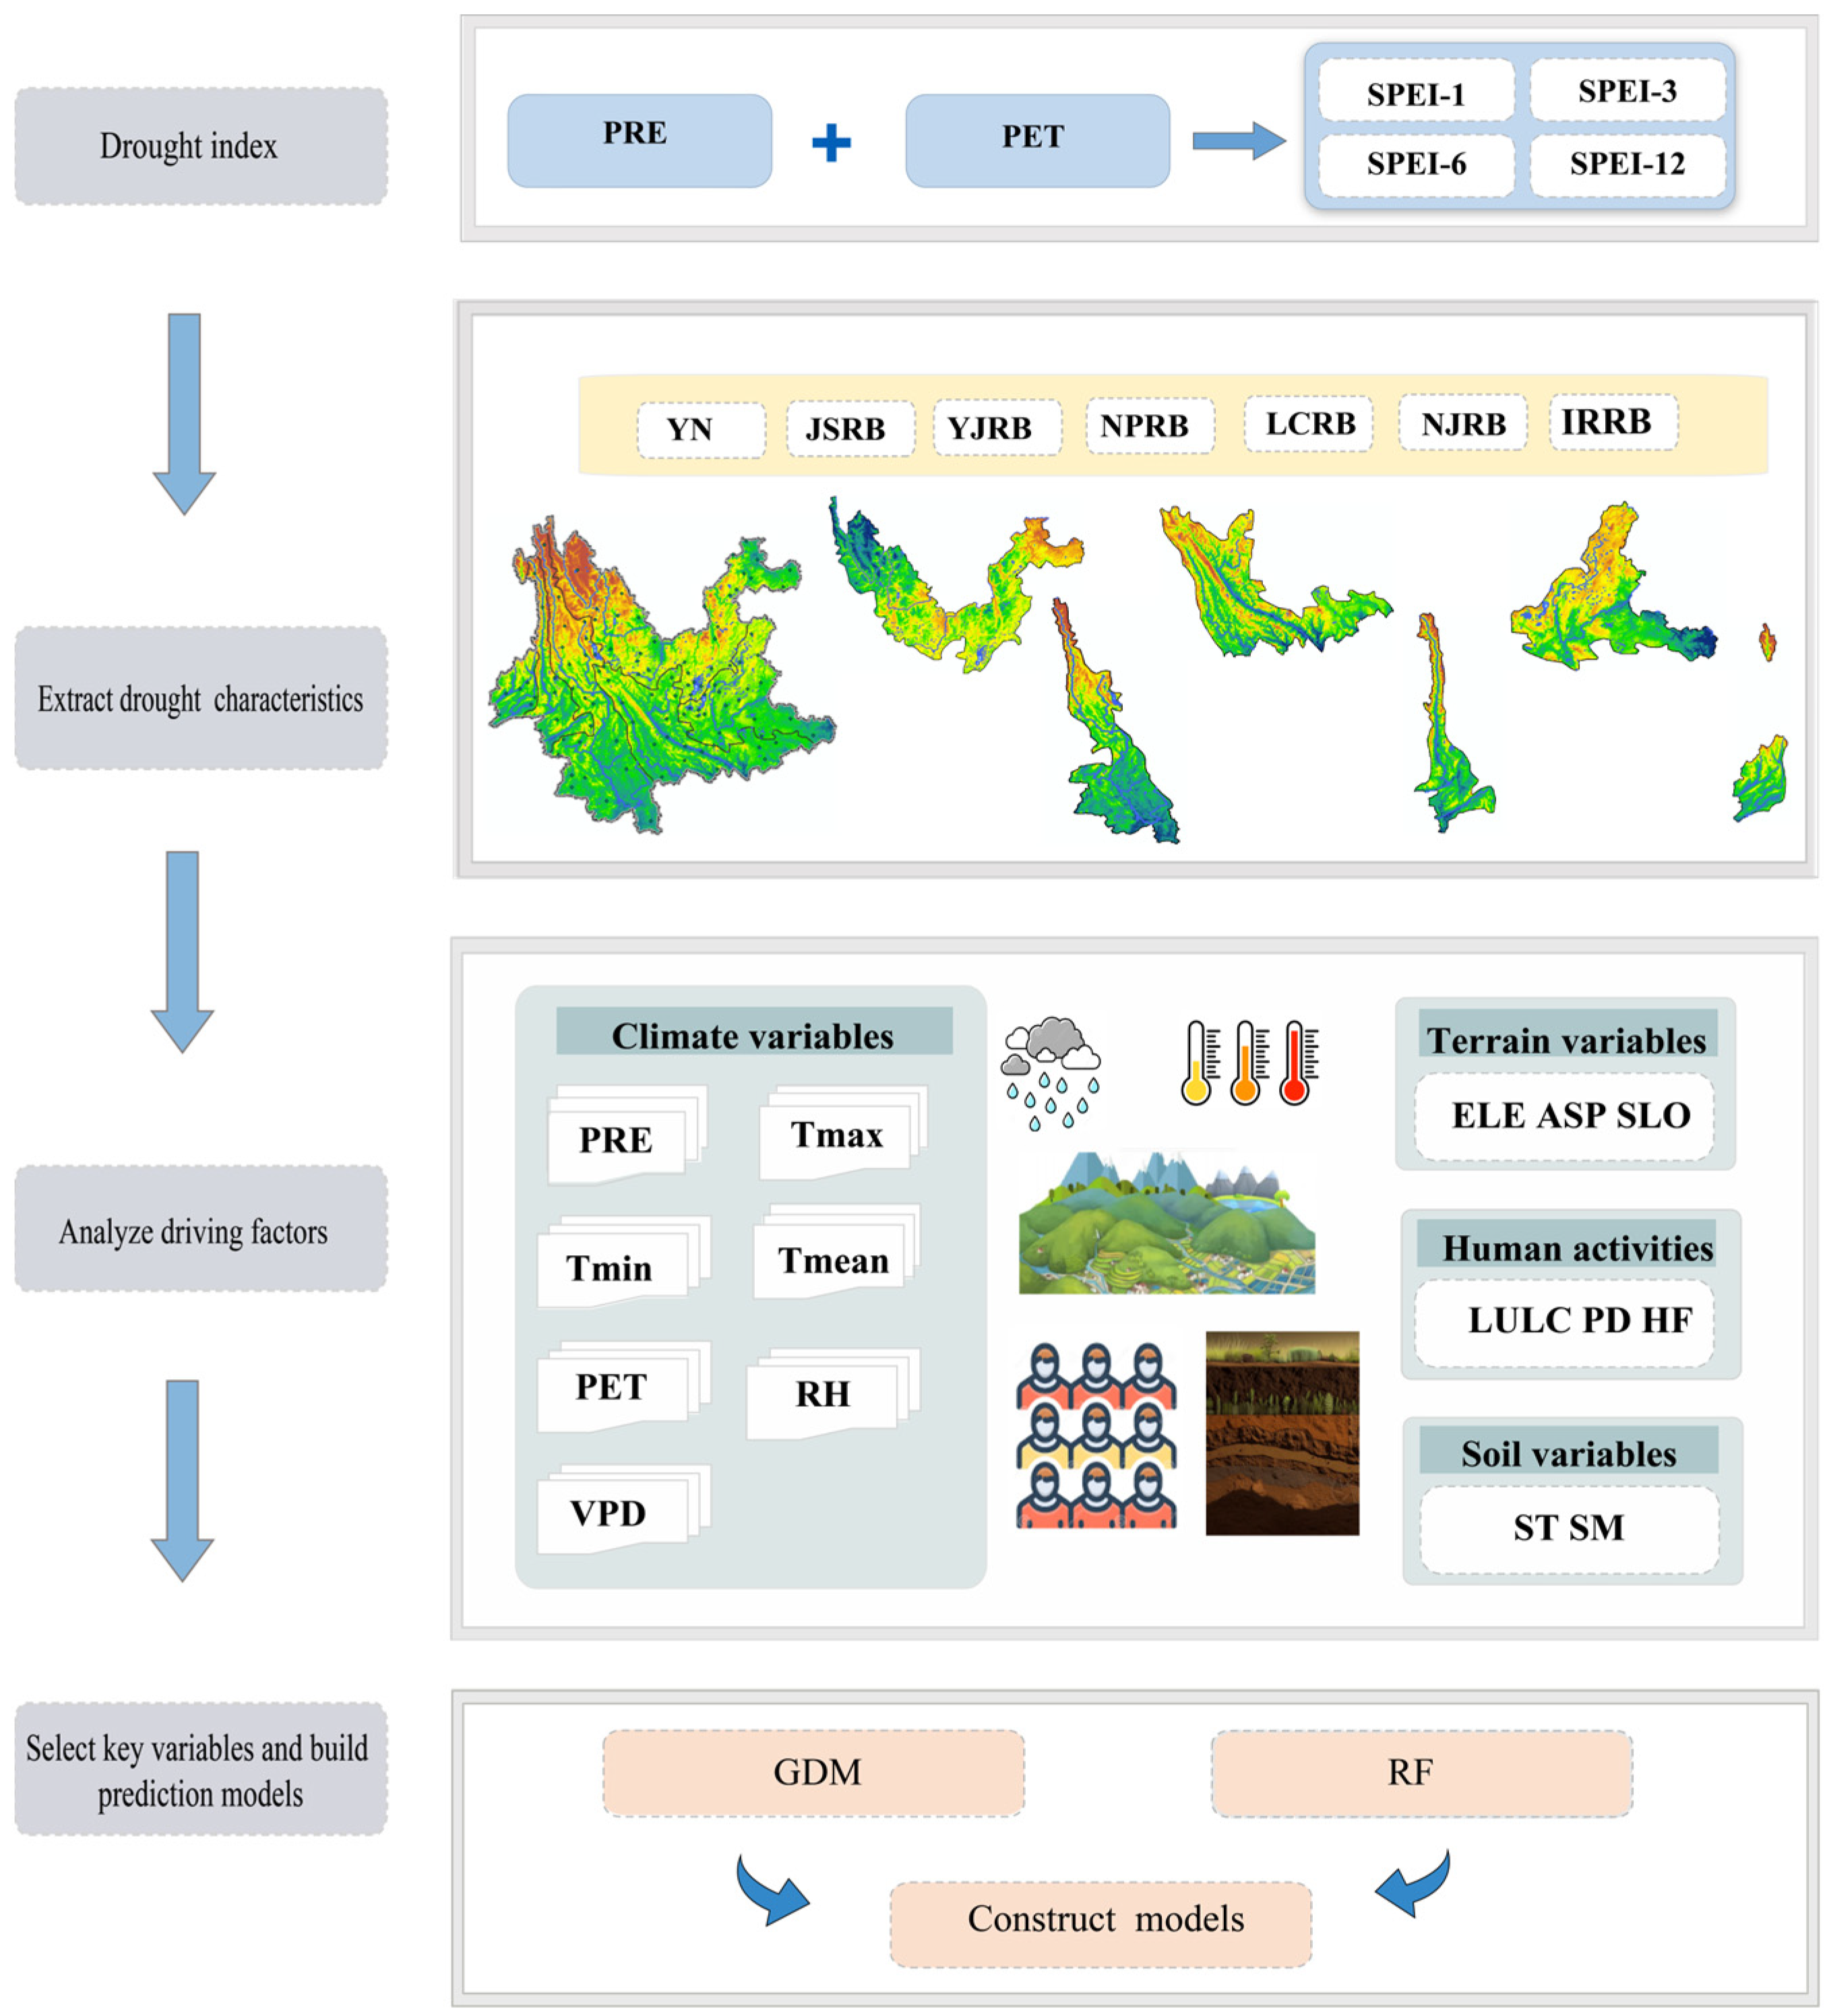
2. Methods
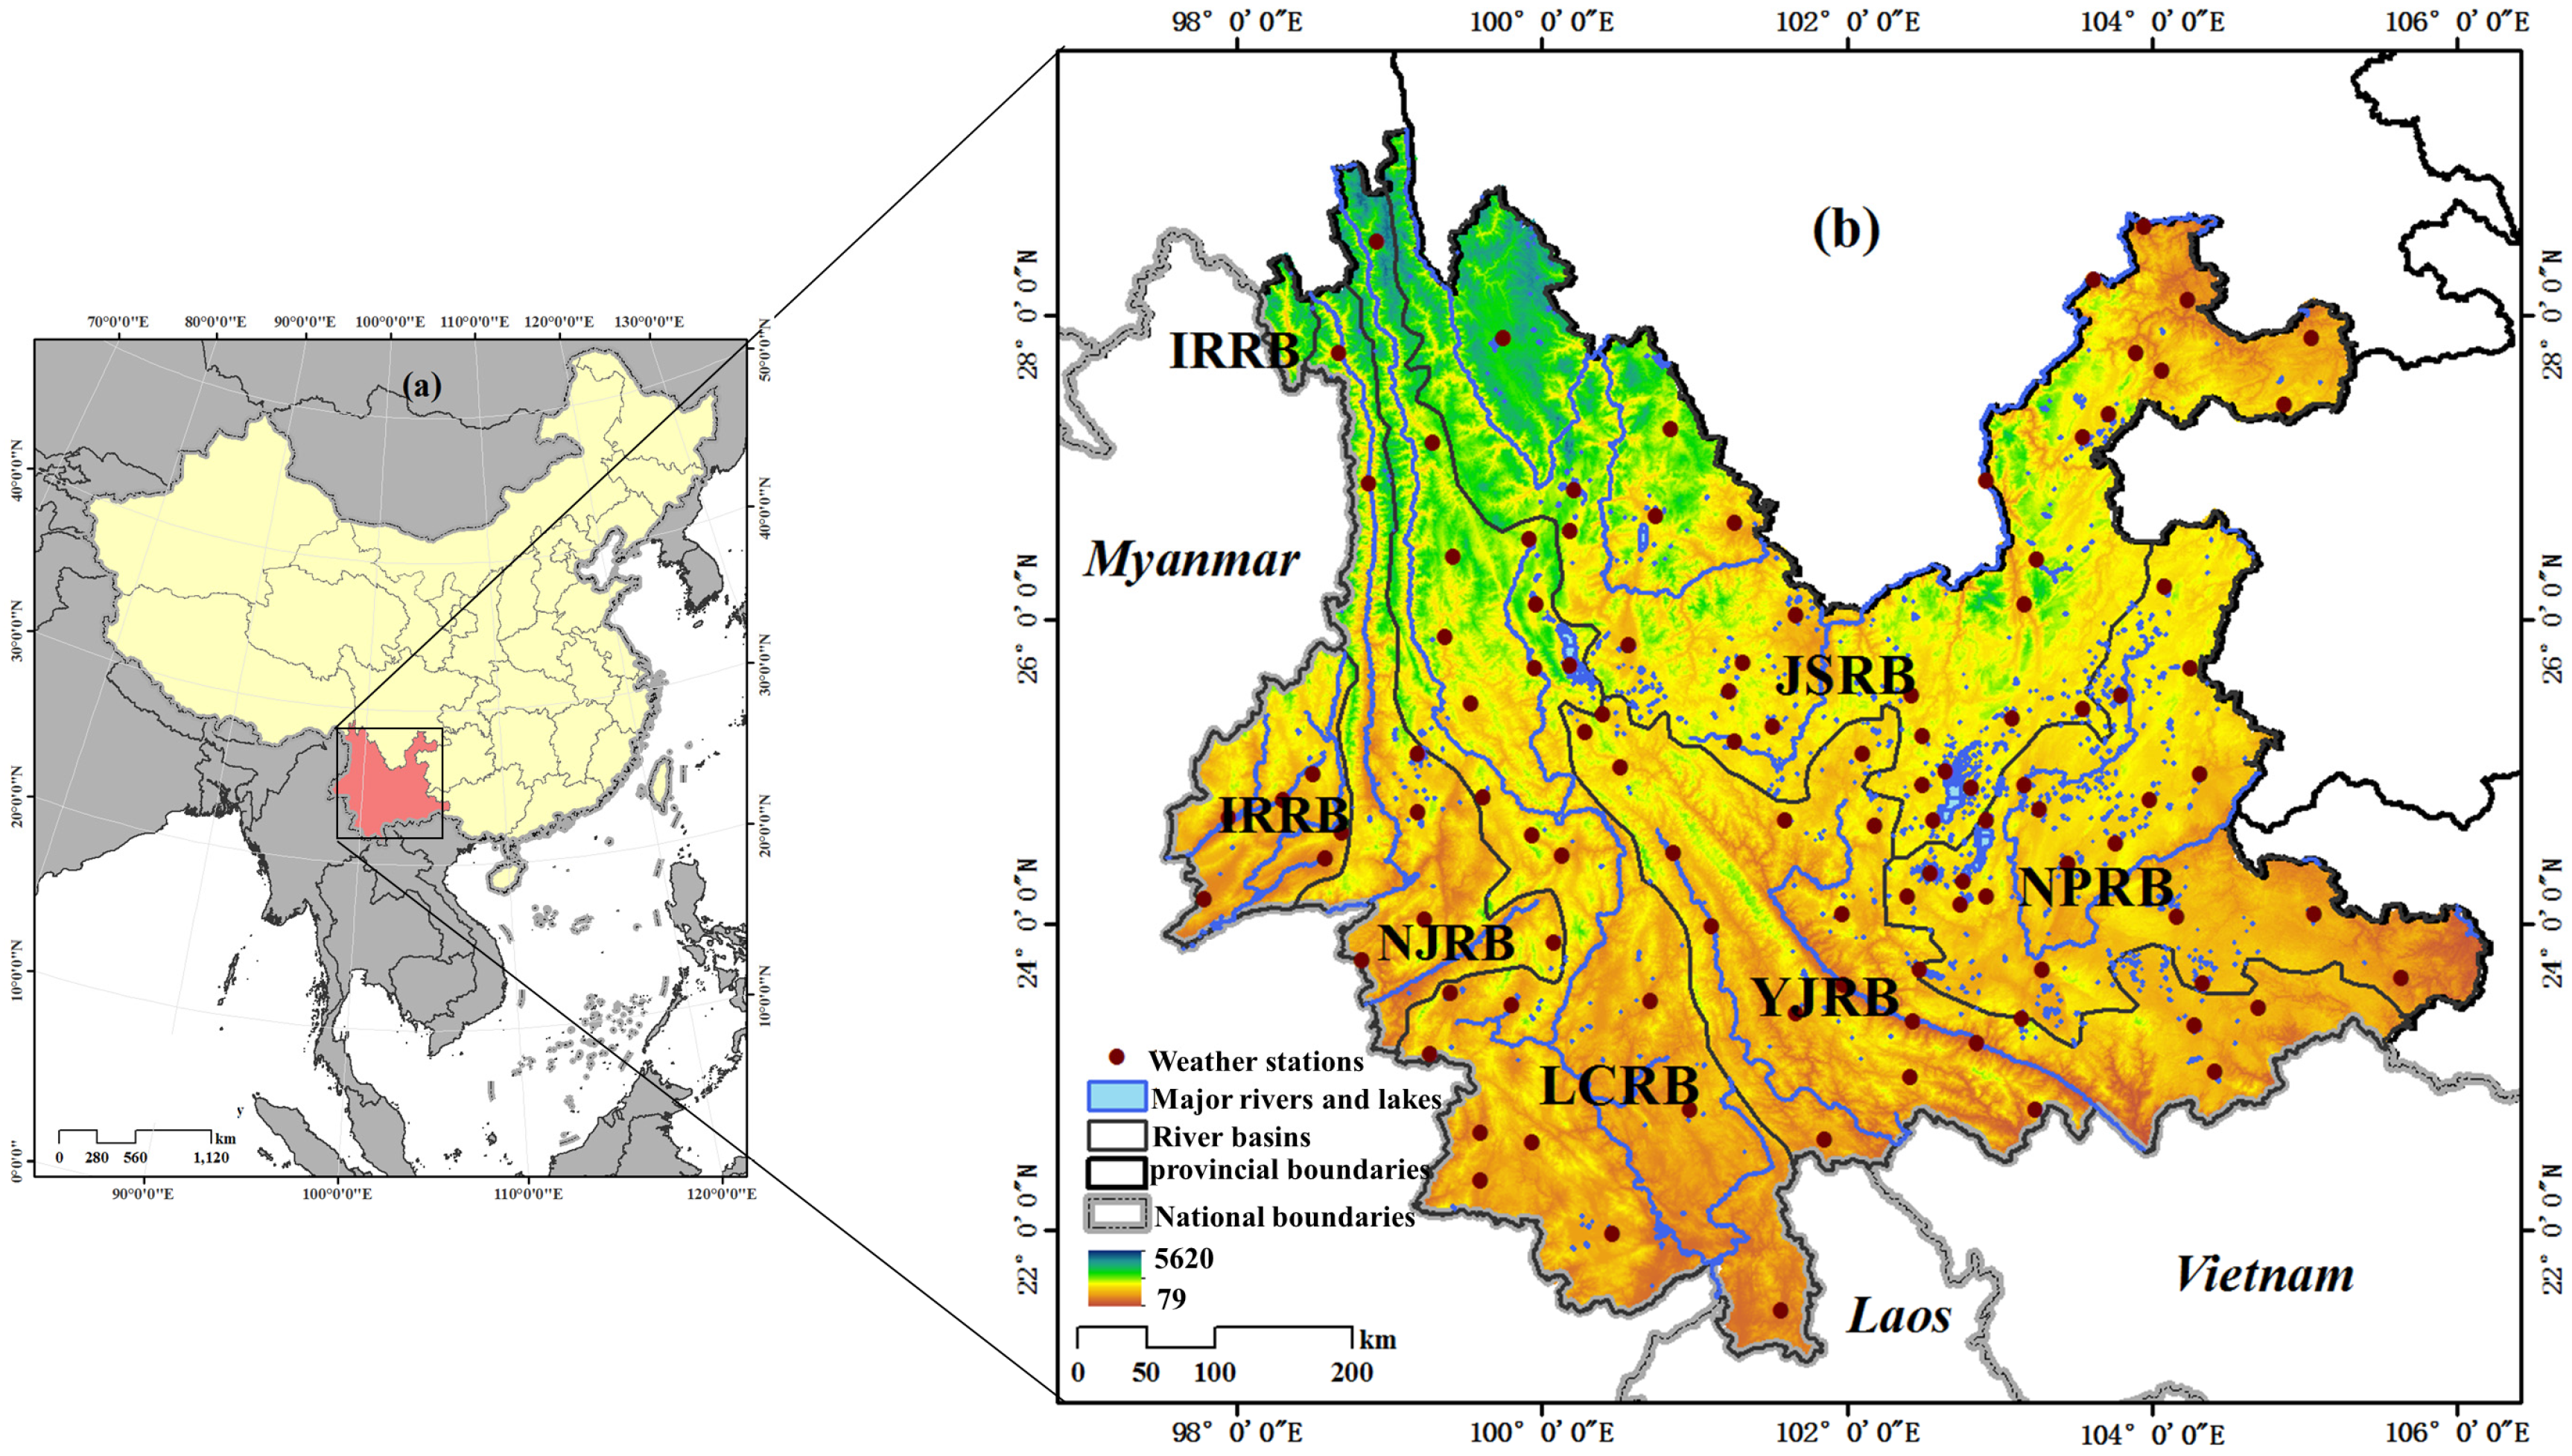
2.1. Study Area
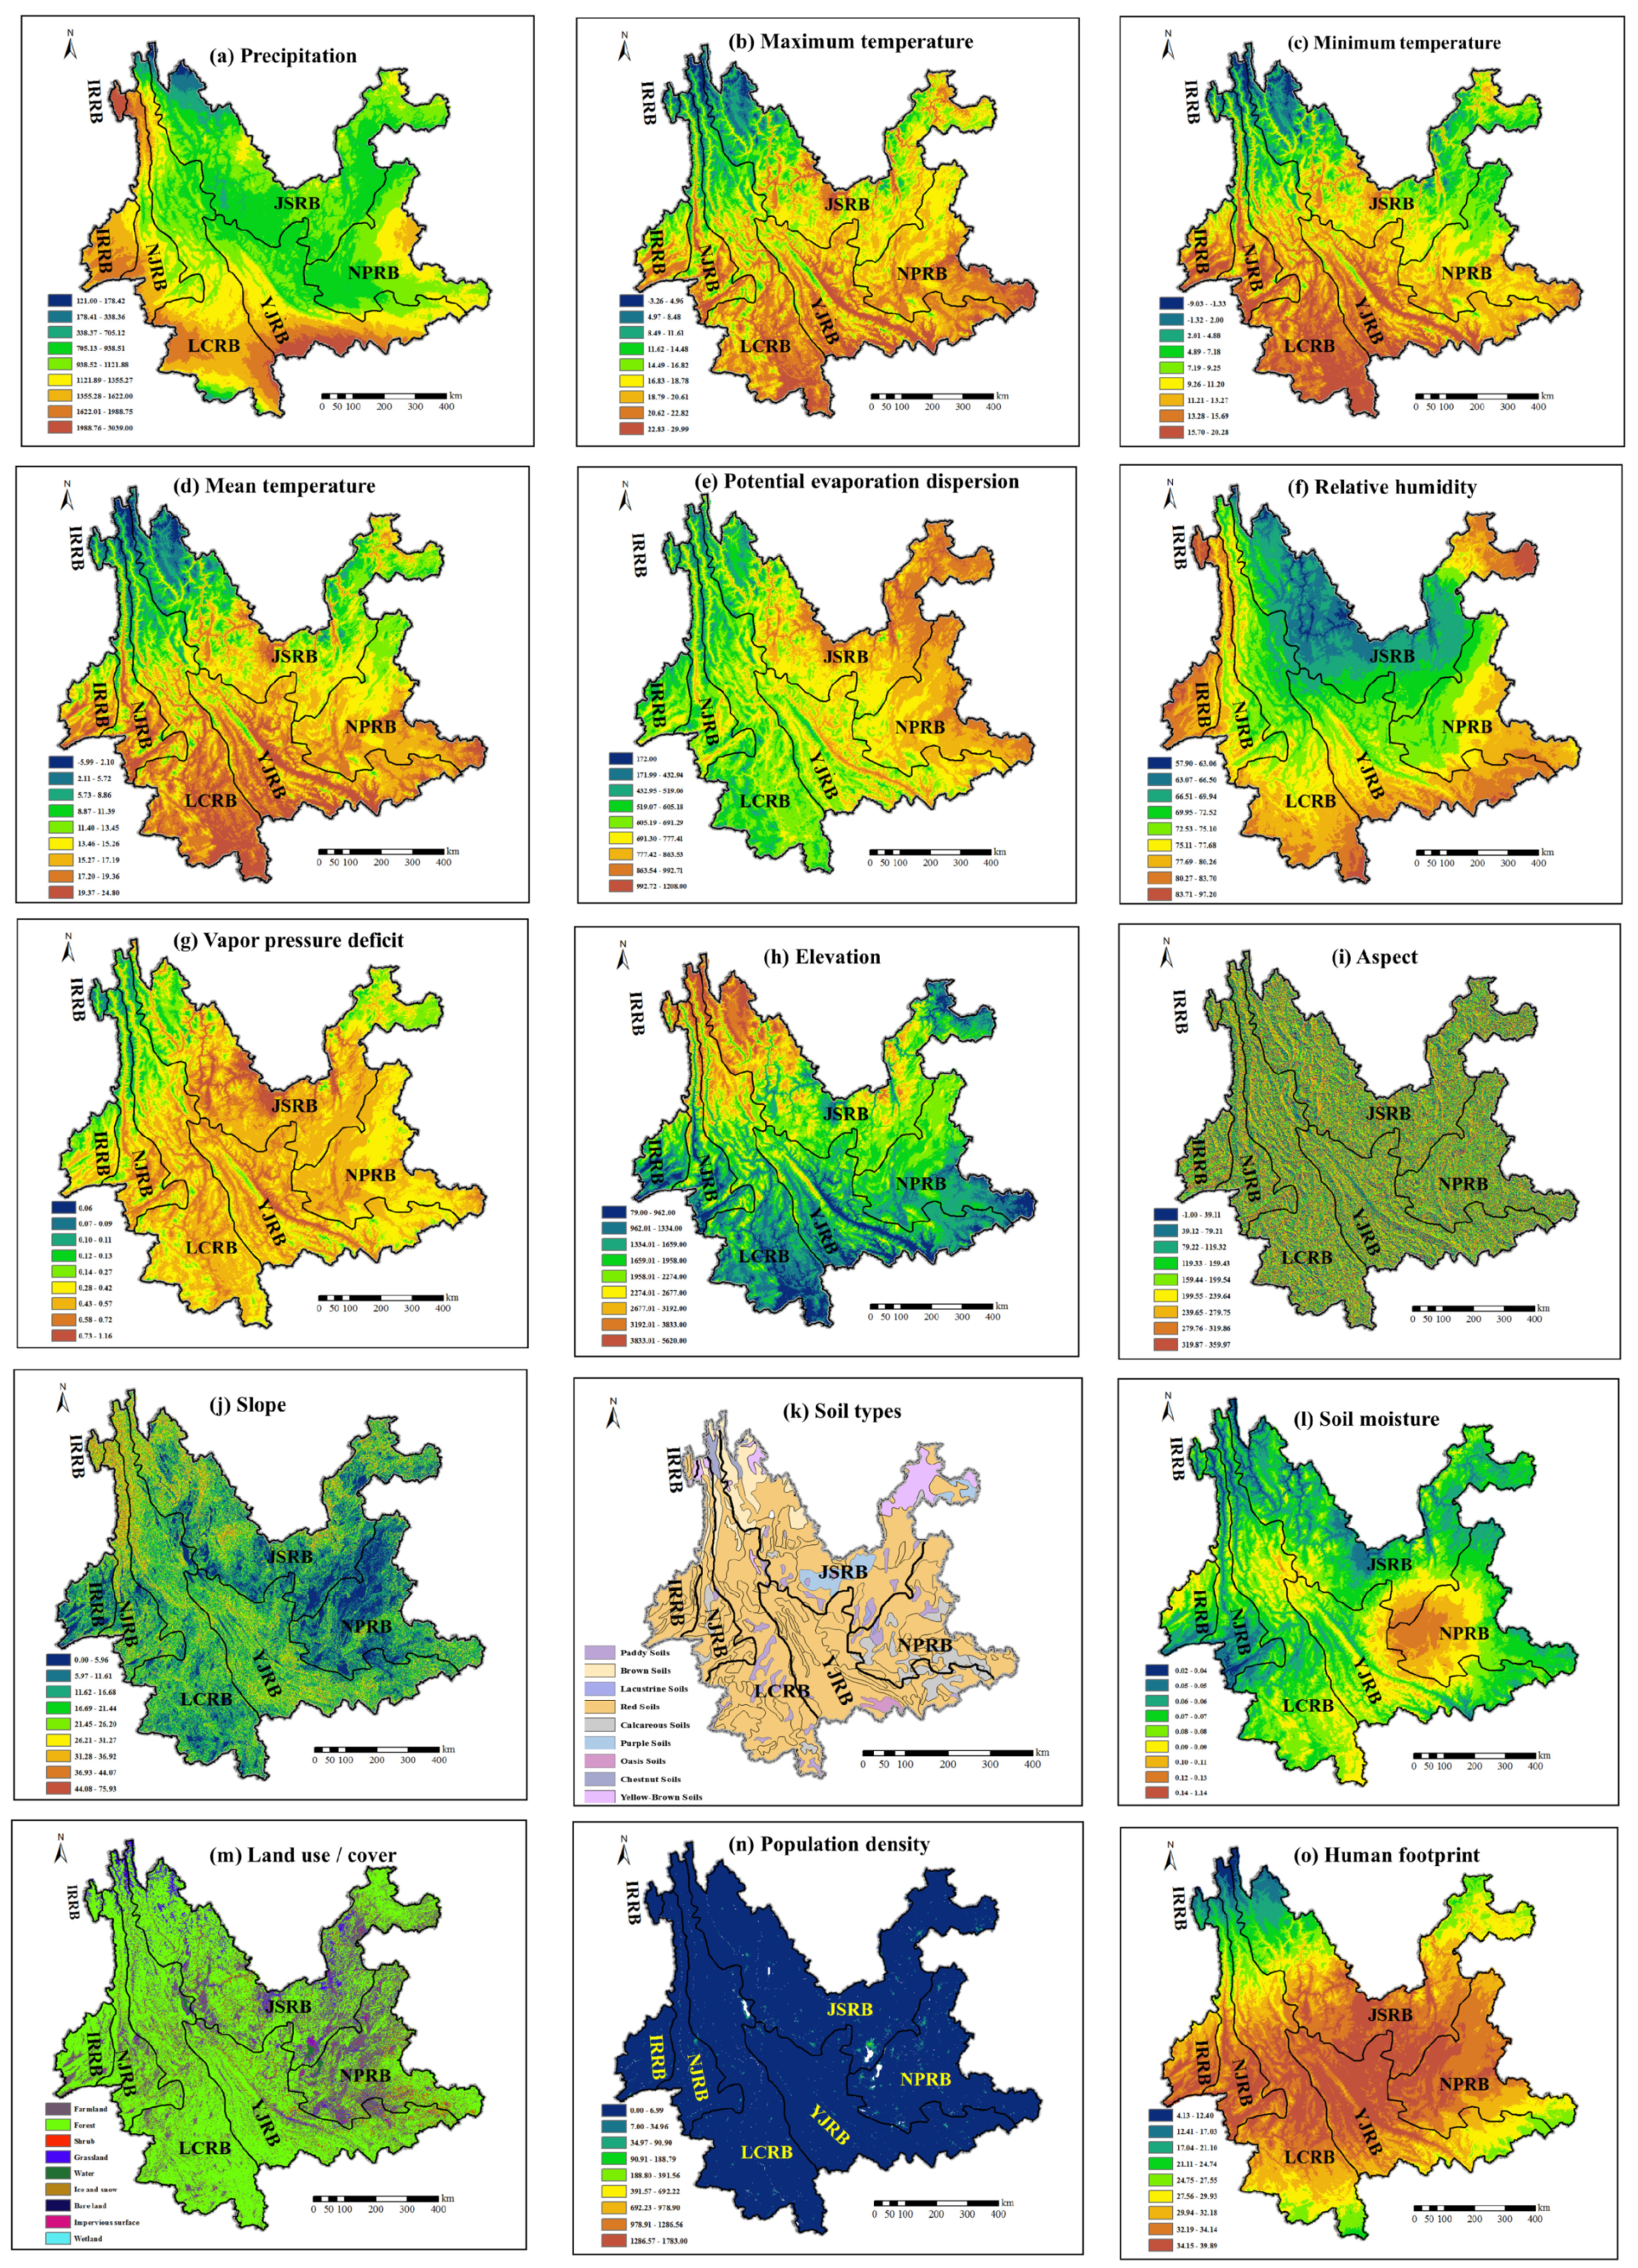
2.2. Data Description
2.3. Drought Index
2.4. Analysis of Drought Trends
2.5. Geographical Detector Model (GDM)
2.6. Random Forest (RF)
3. Results
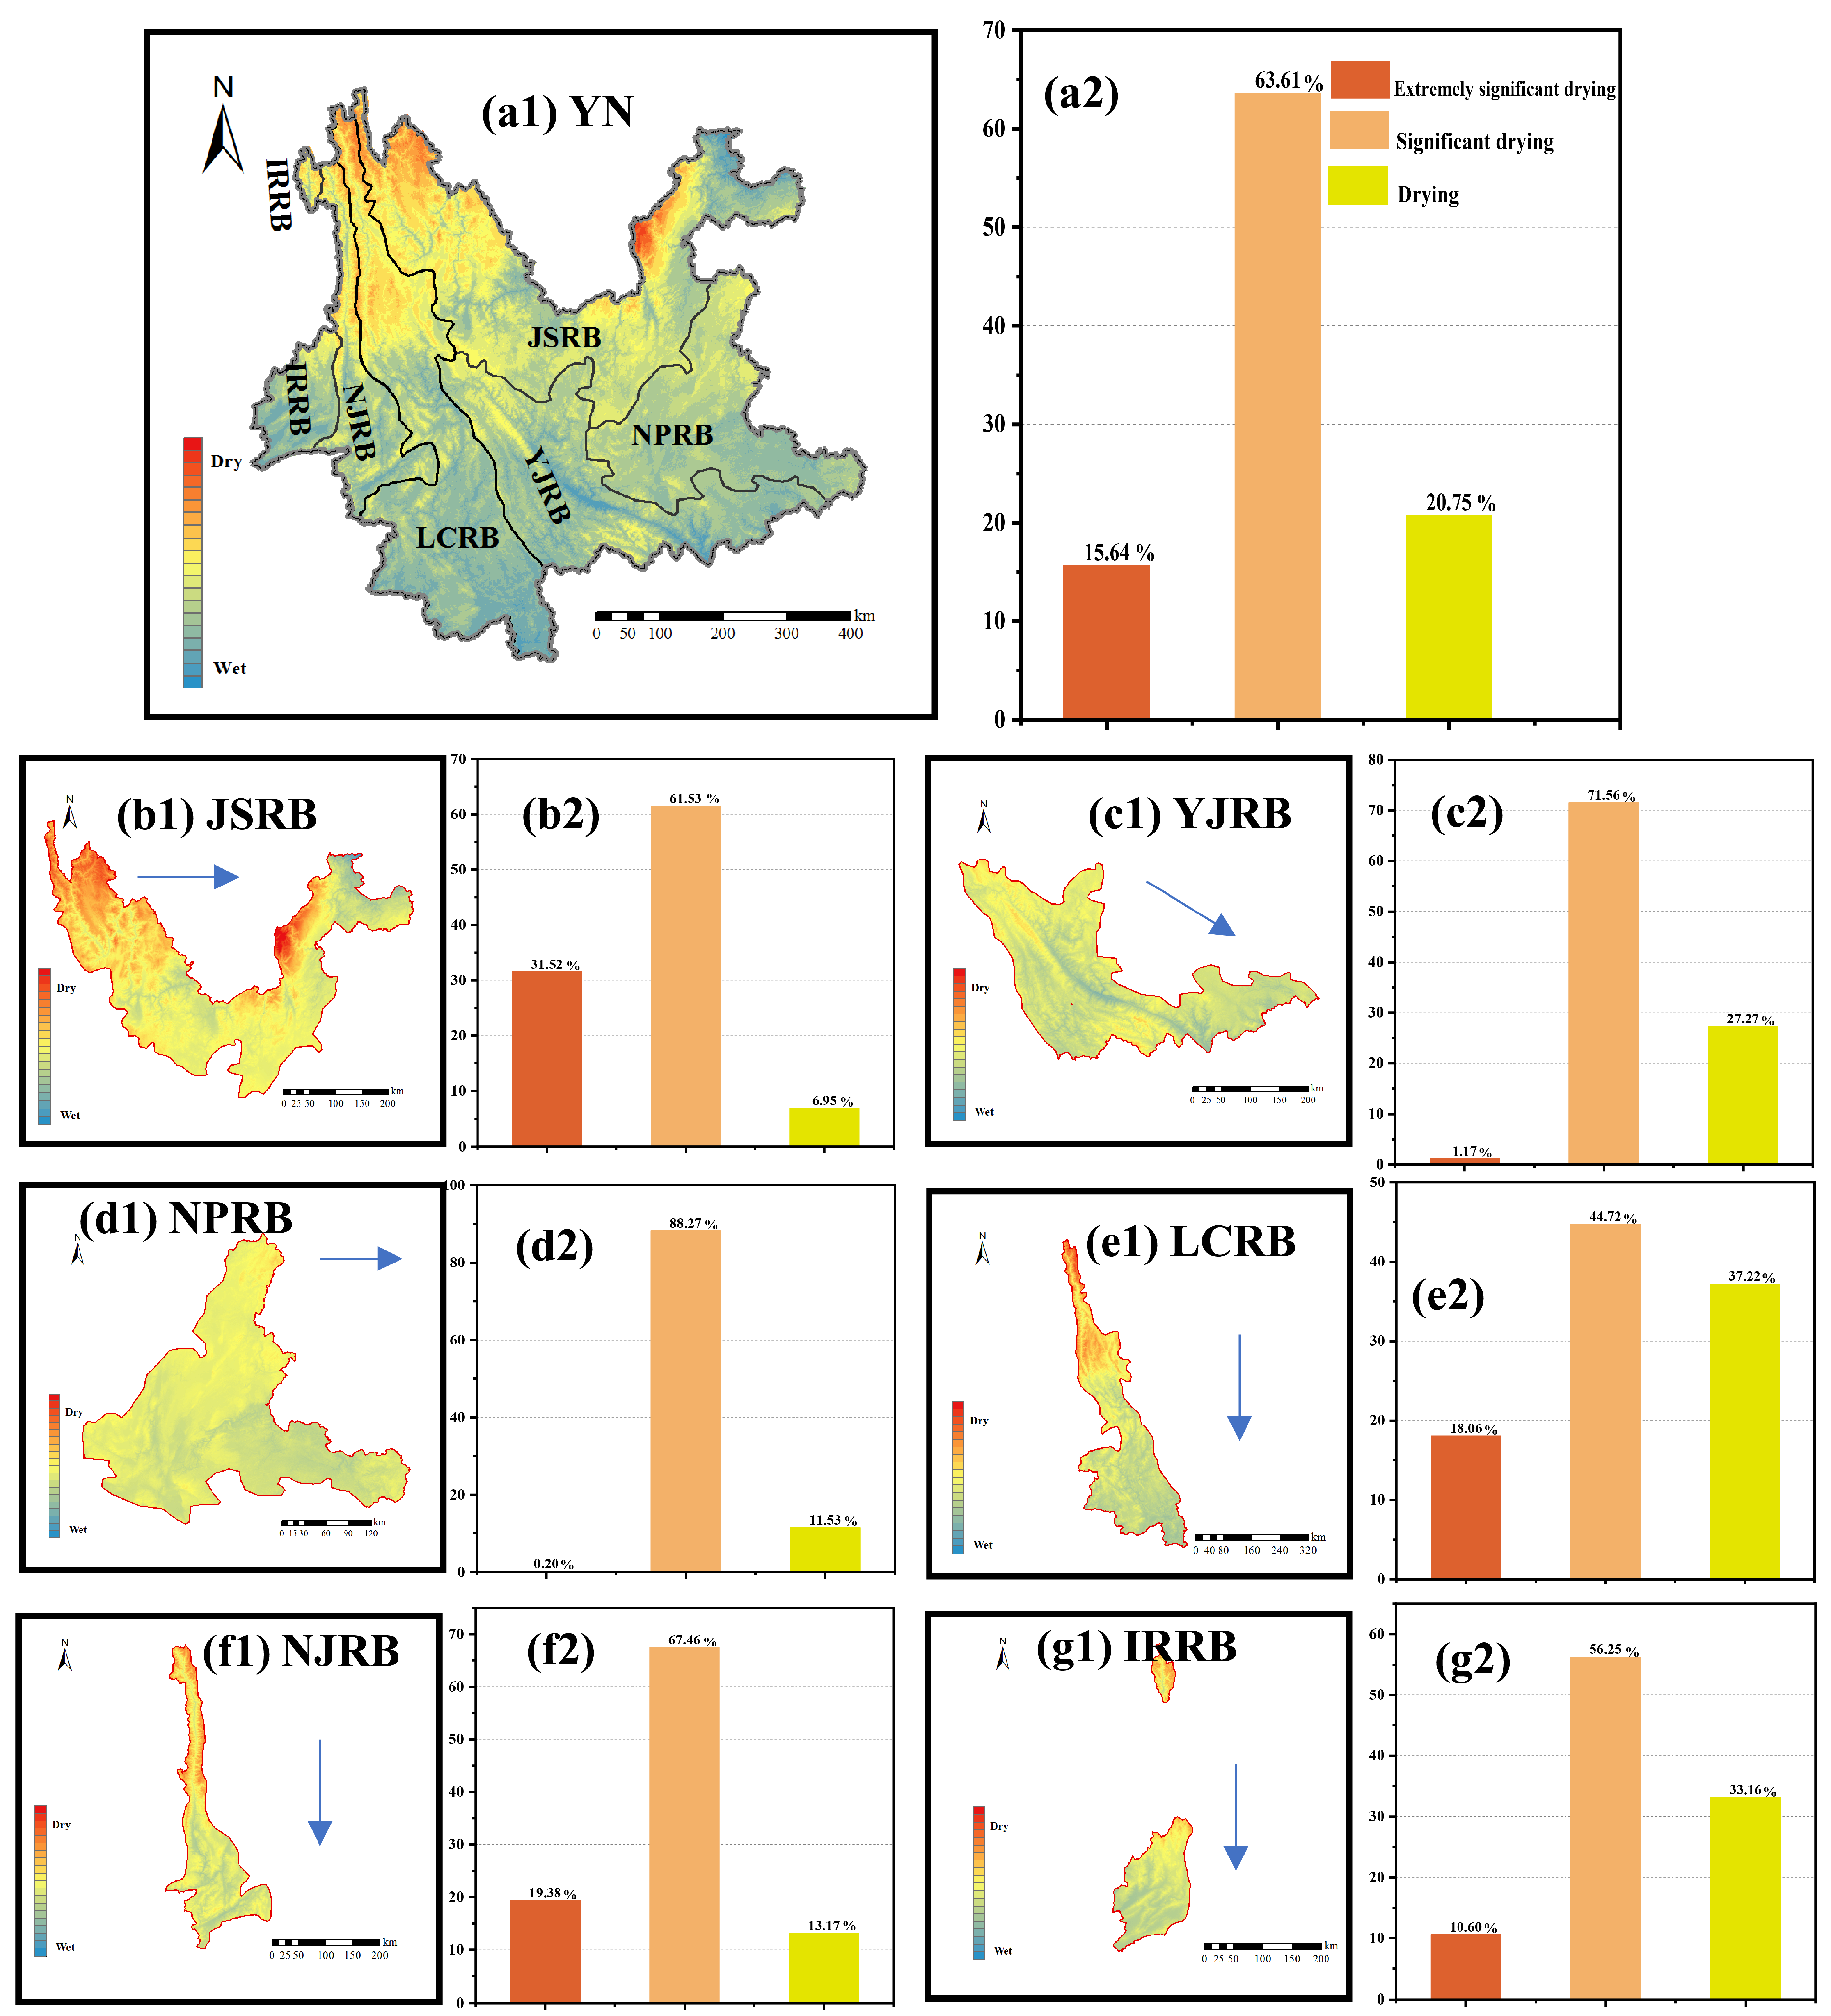
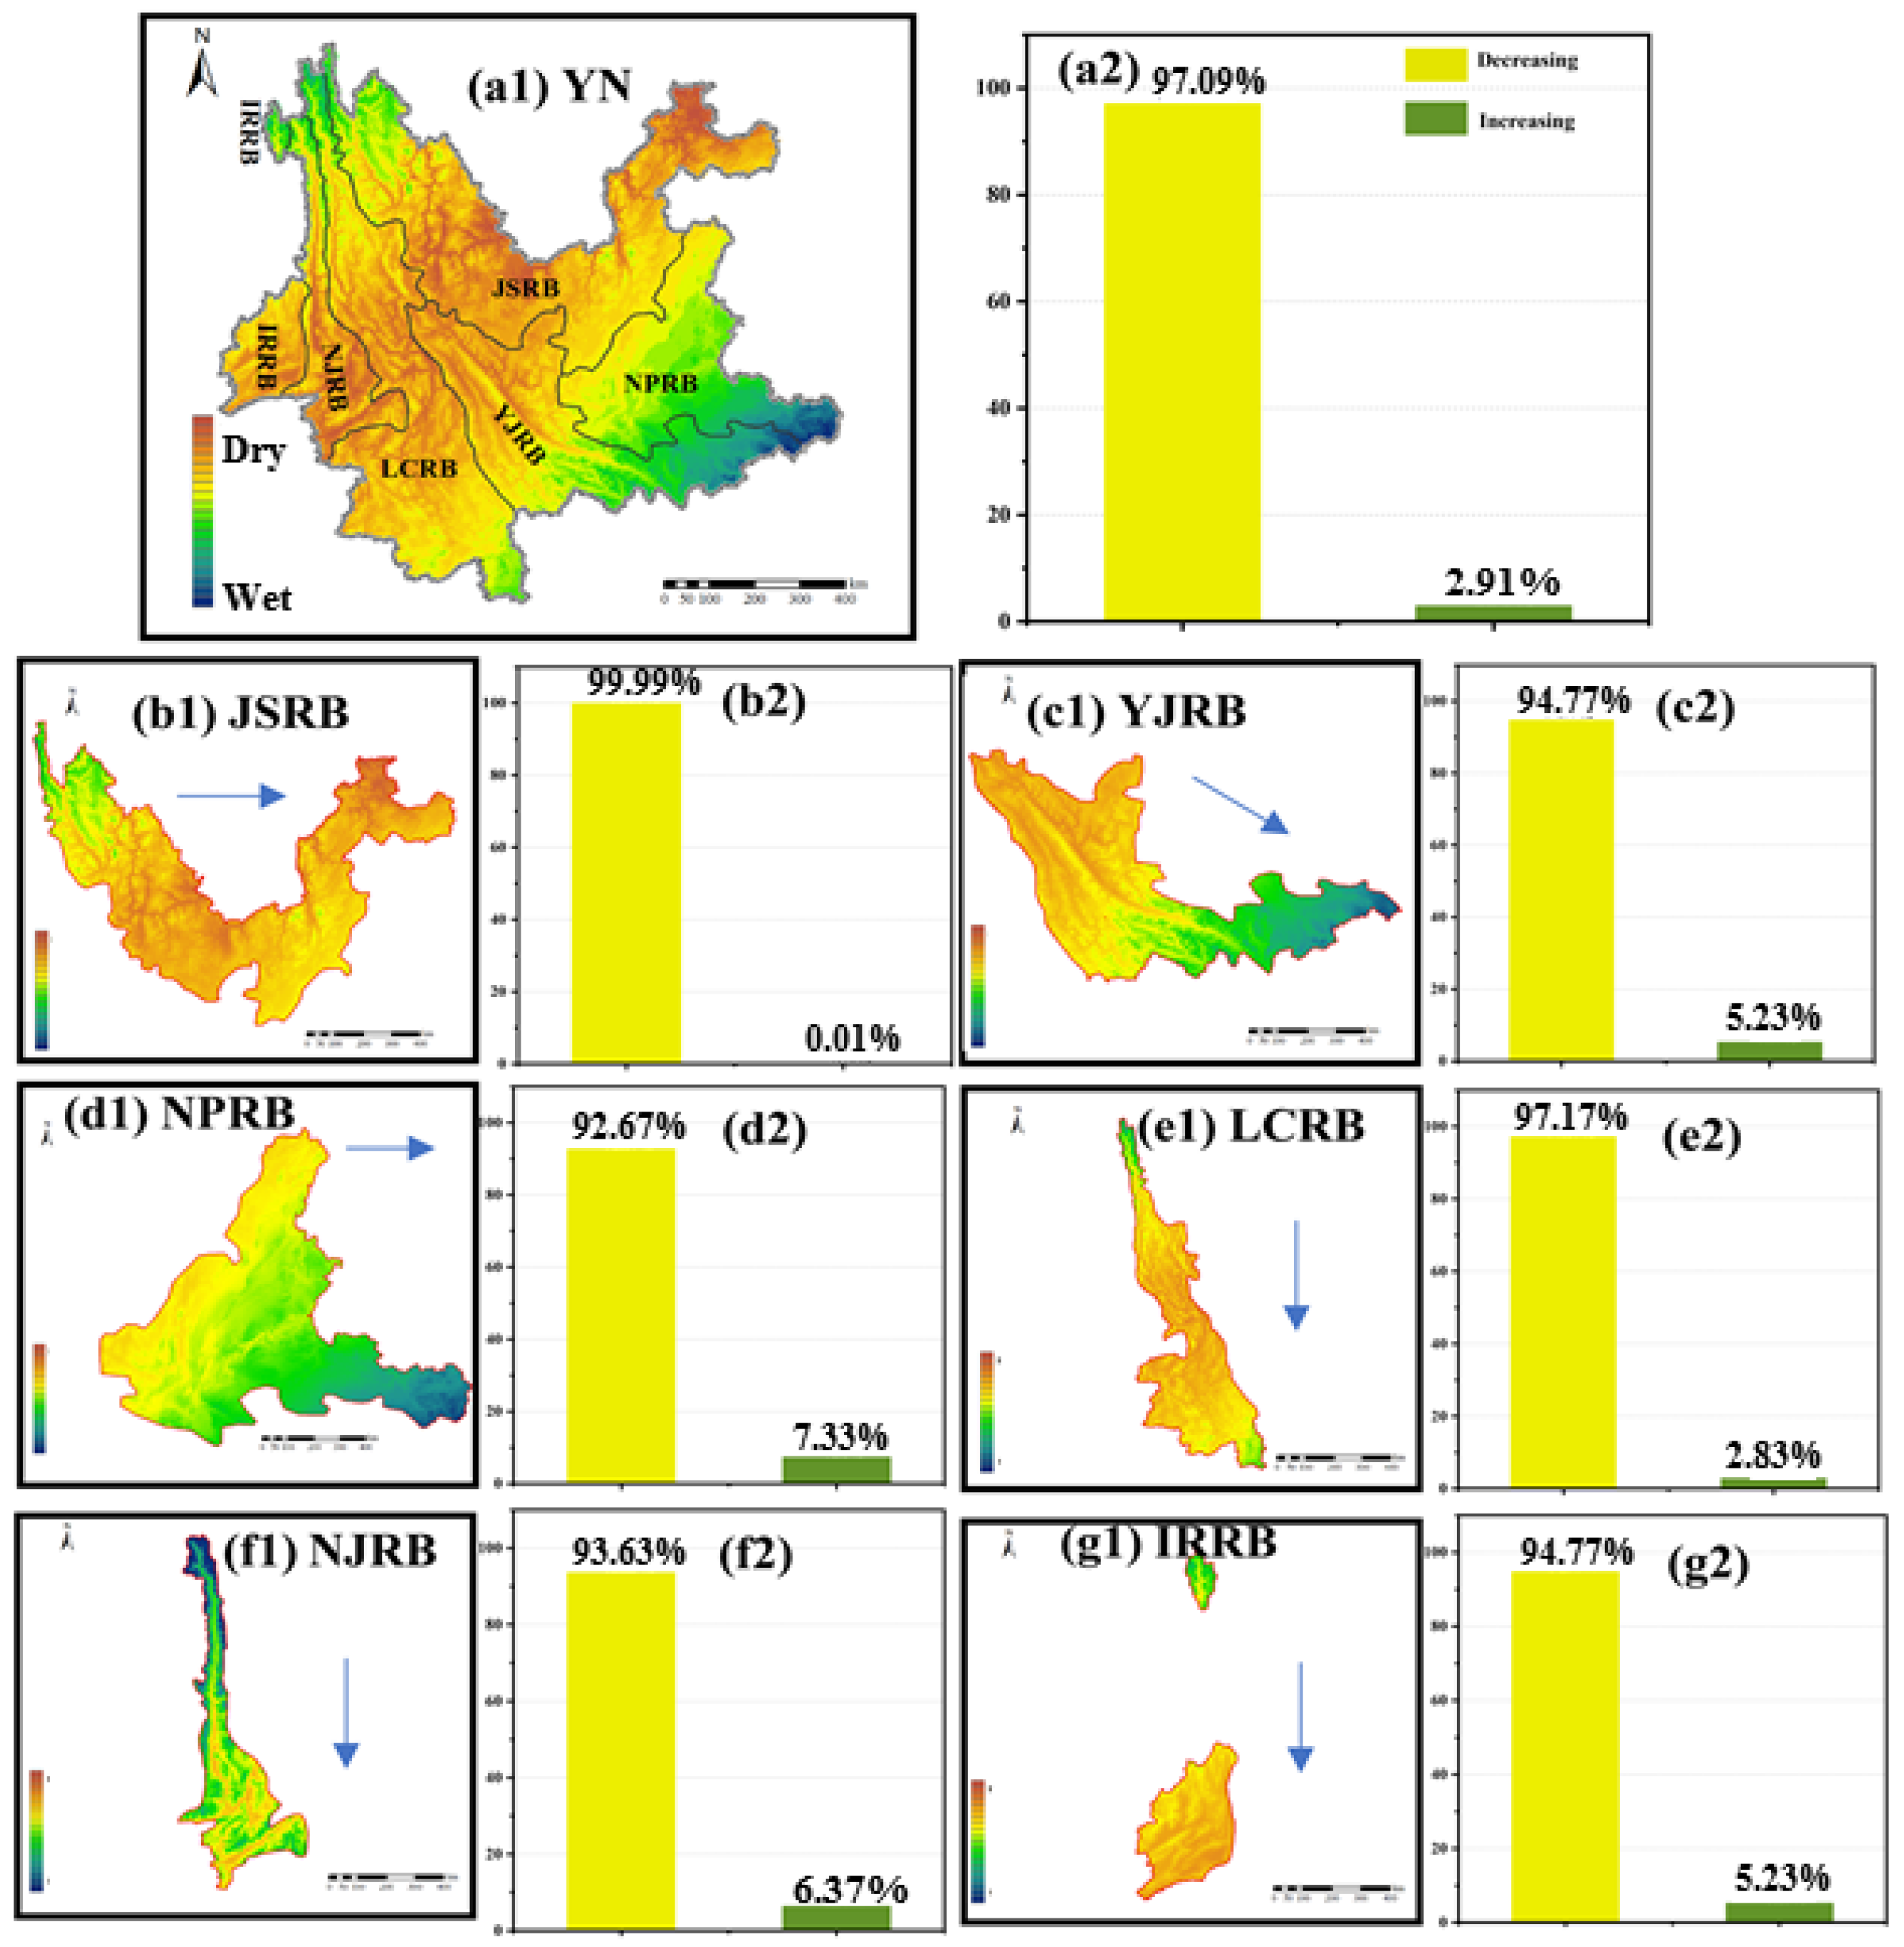
3.1. The Spatiotemporal Characteristics of SPEI
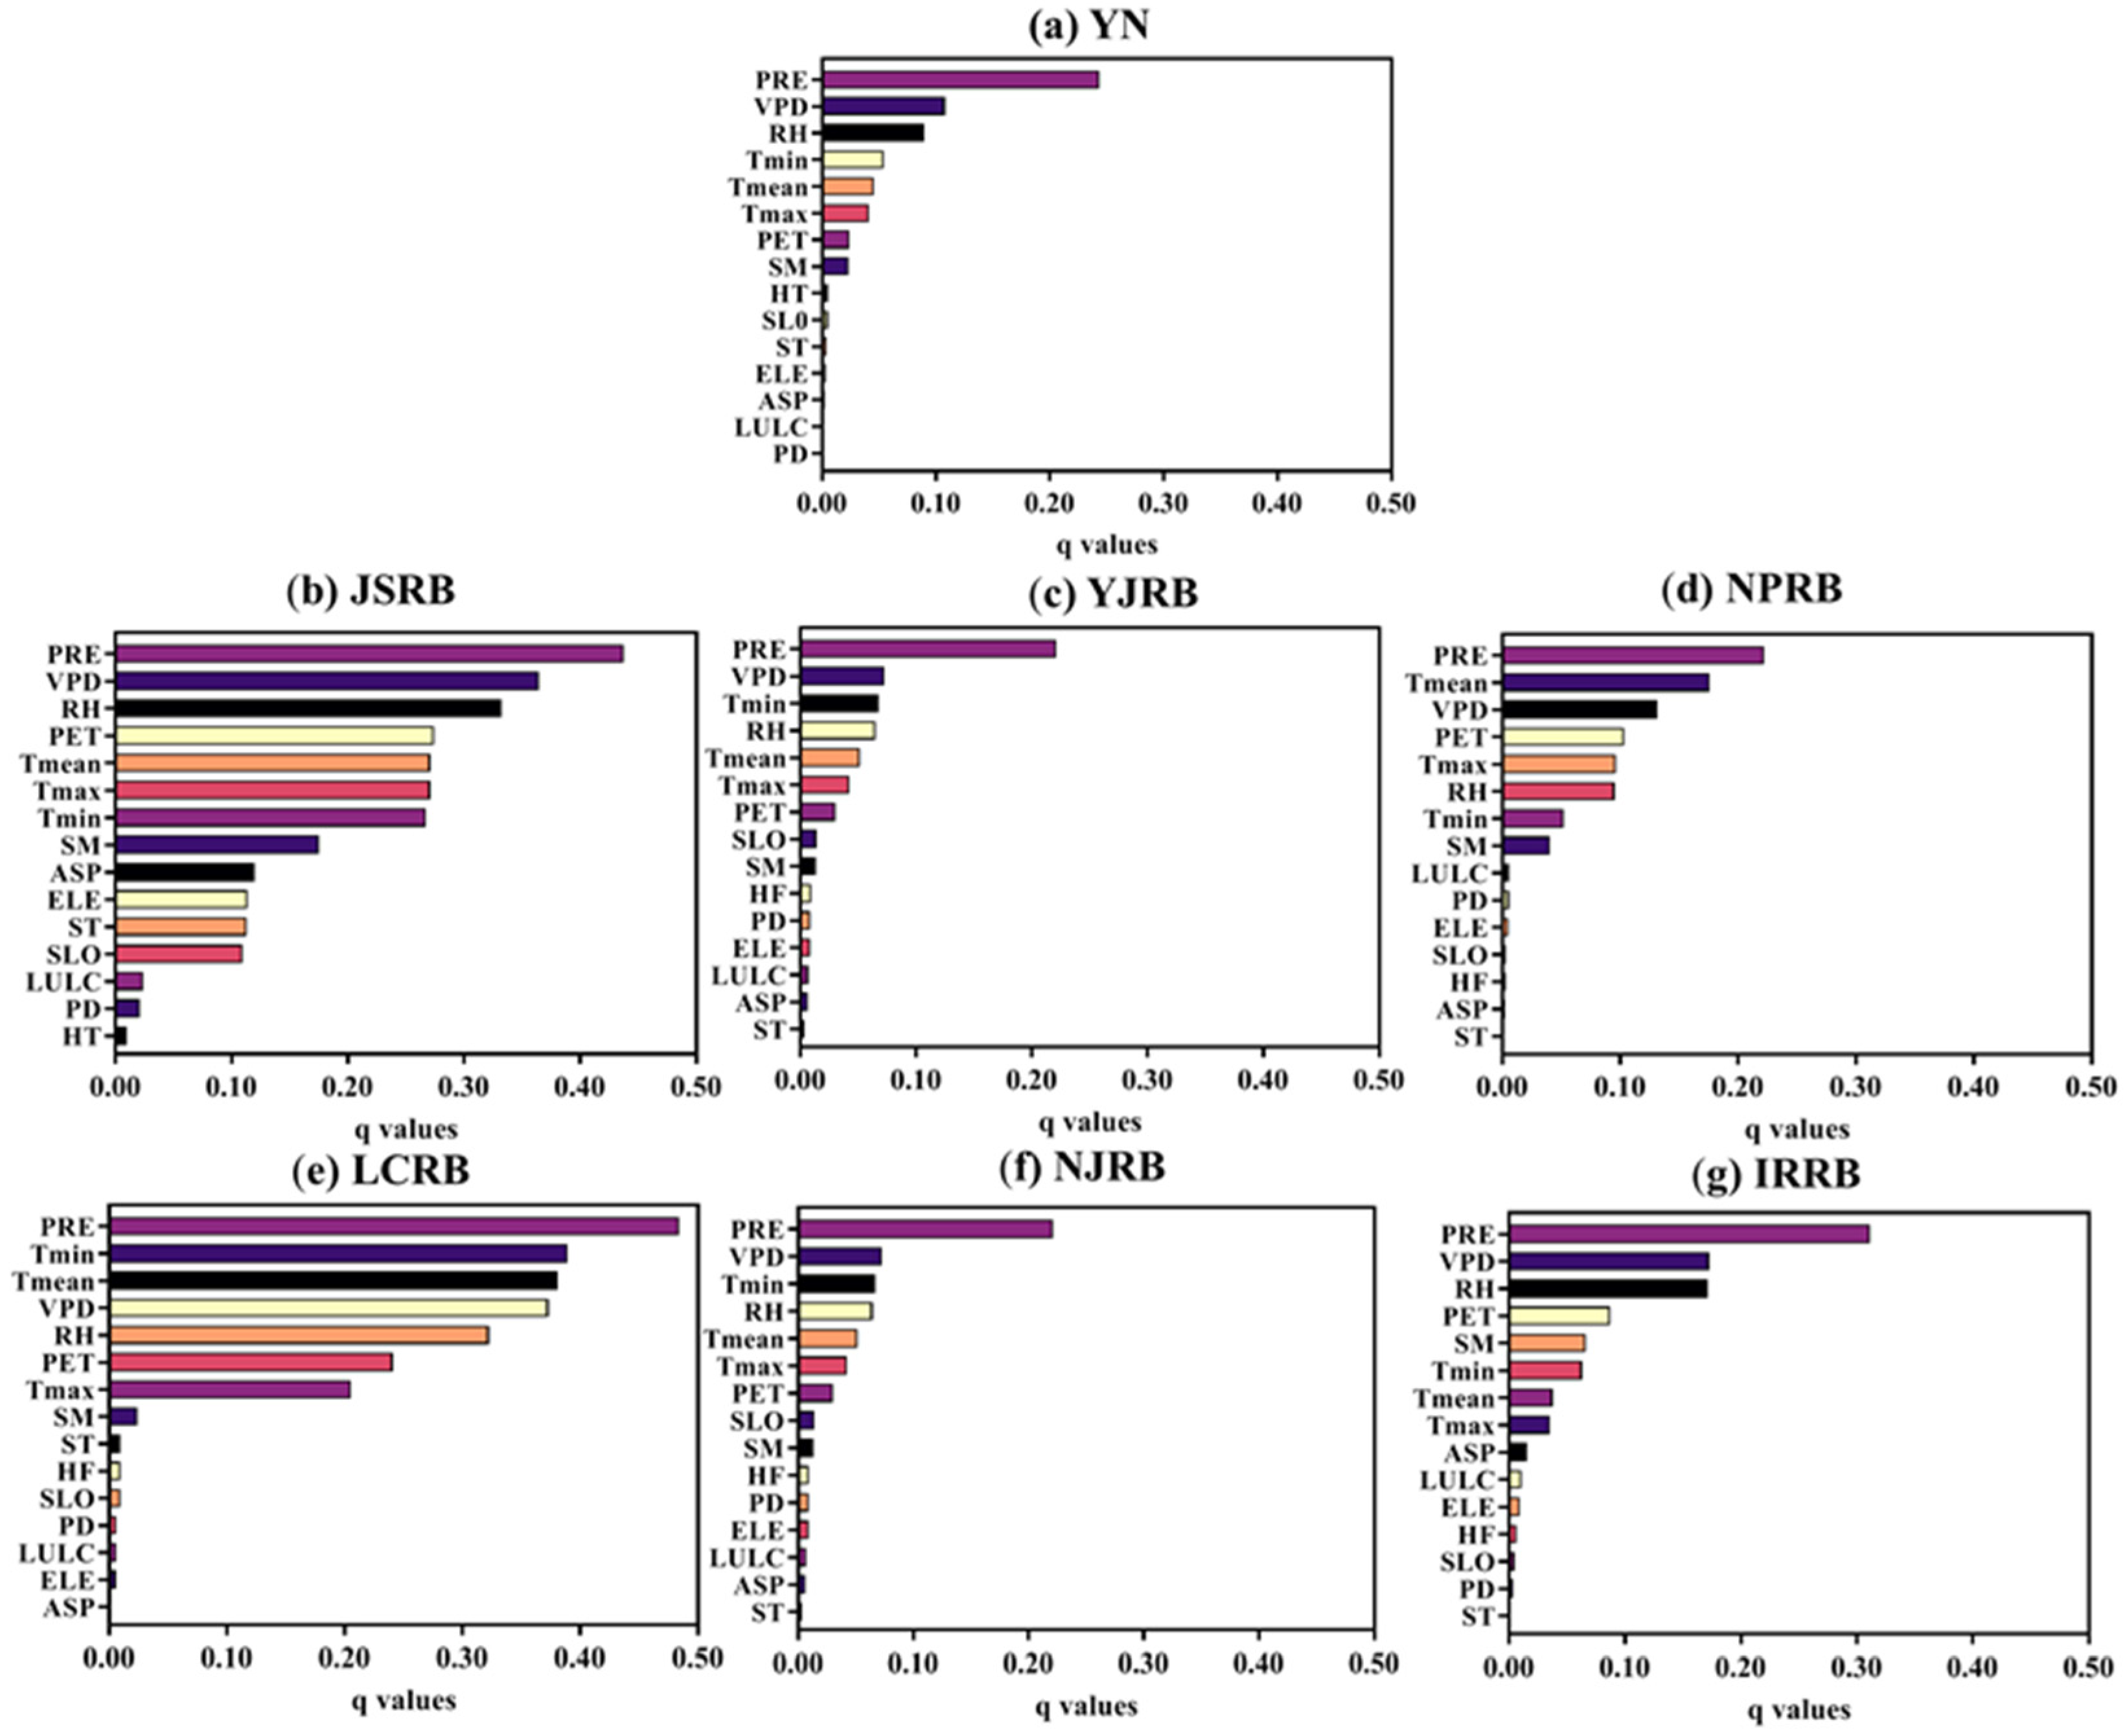
3.2. Drought Driving Factors Analysis Based on GDM
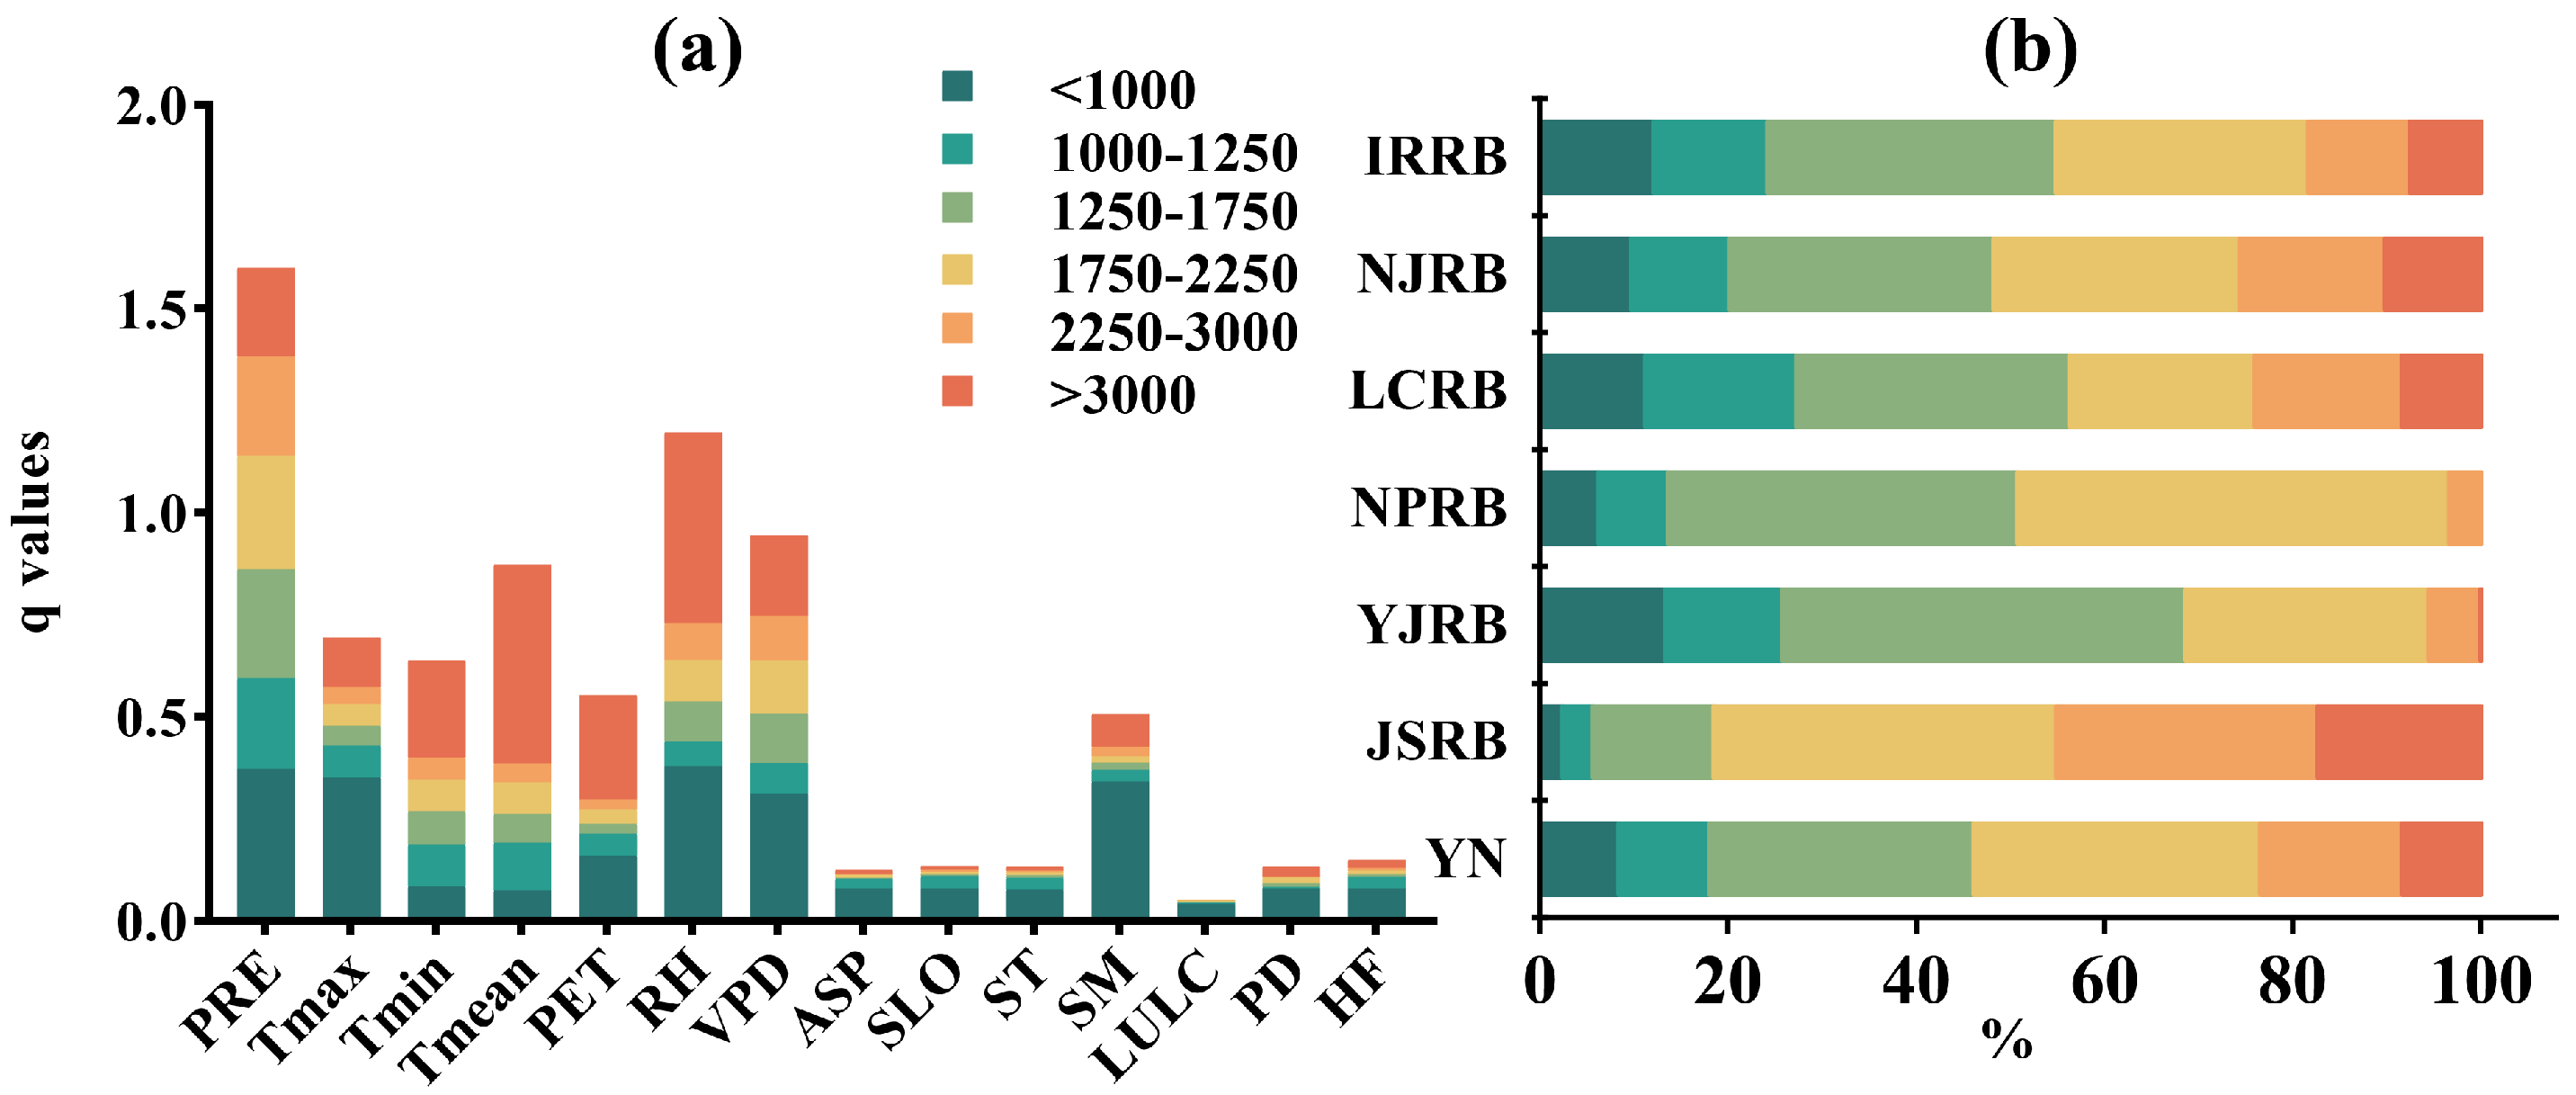
3.2.1. Factors Detection
3.2.2. Interaction Among Factors
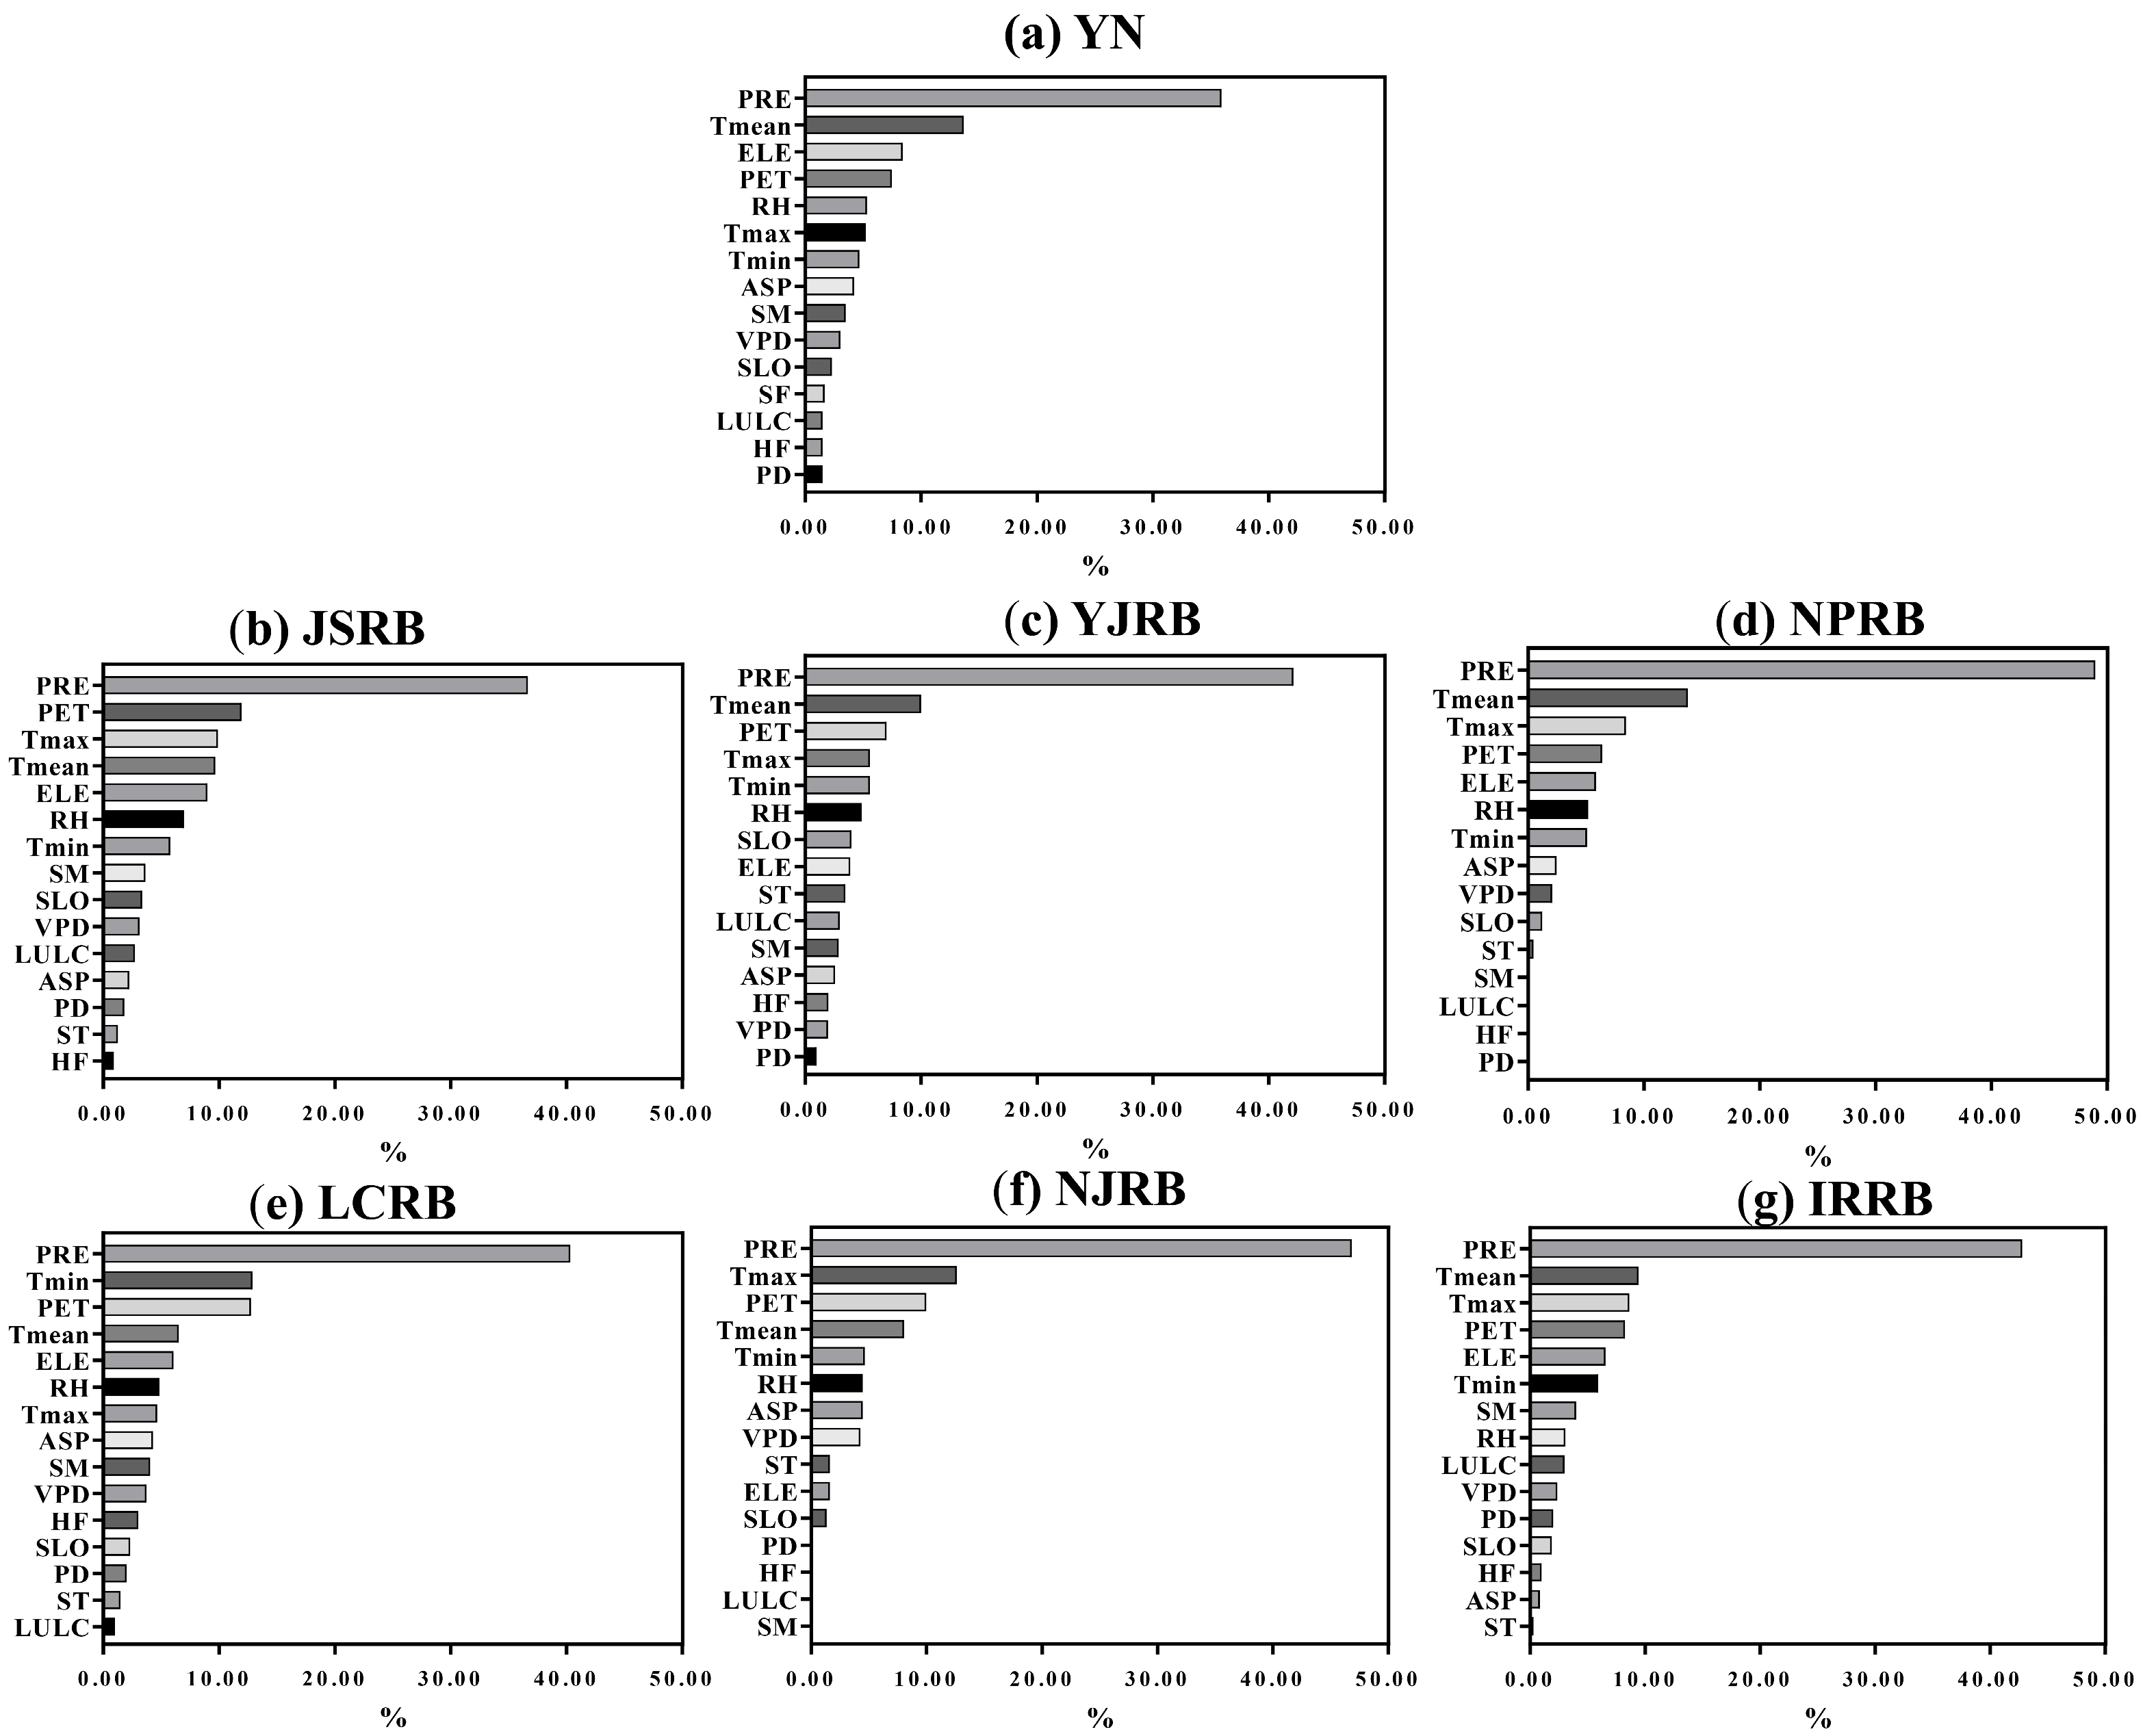
3.3. Drought Driving Factors Analysis Based on RF
3.3.1. Driving Factors Analysis
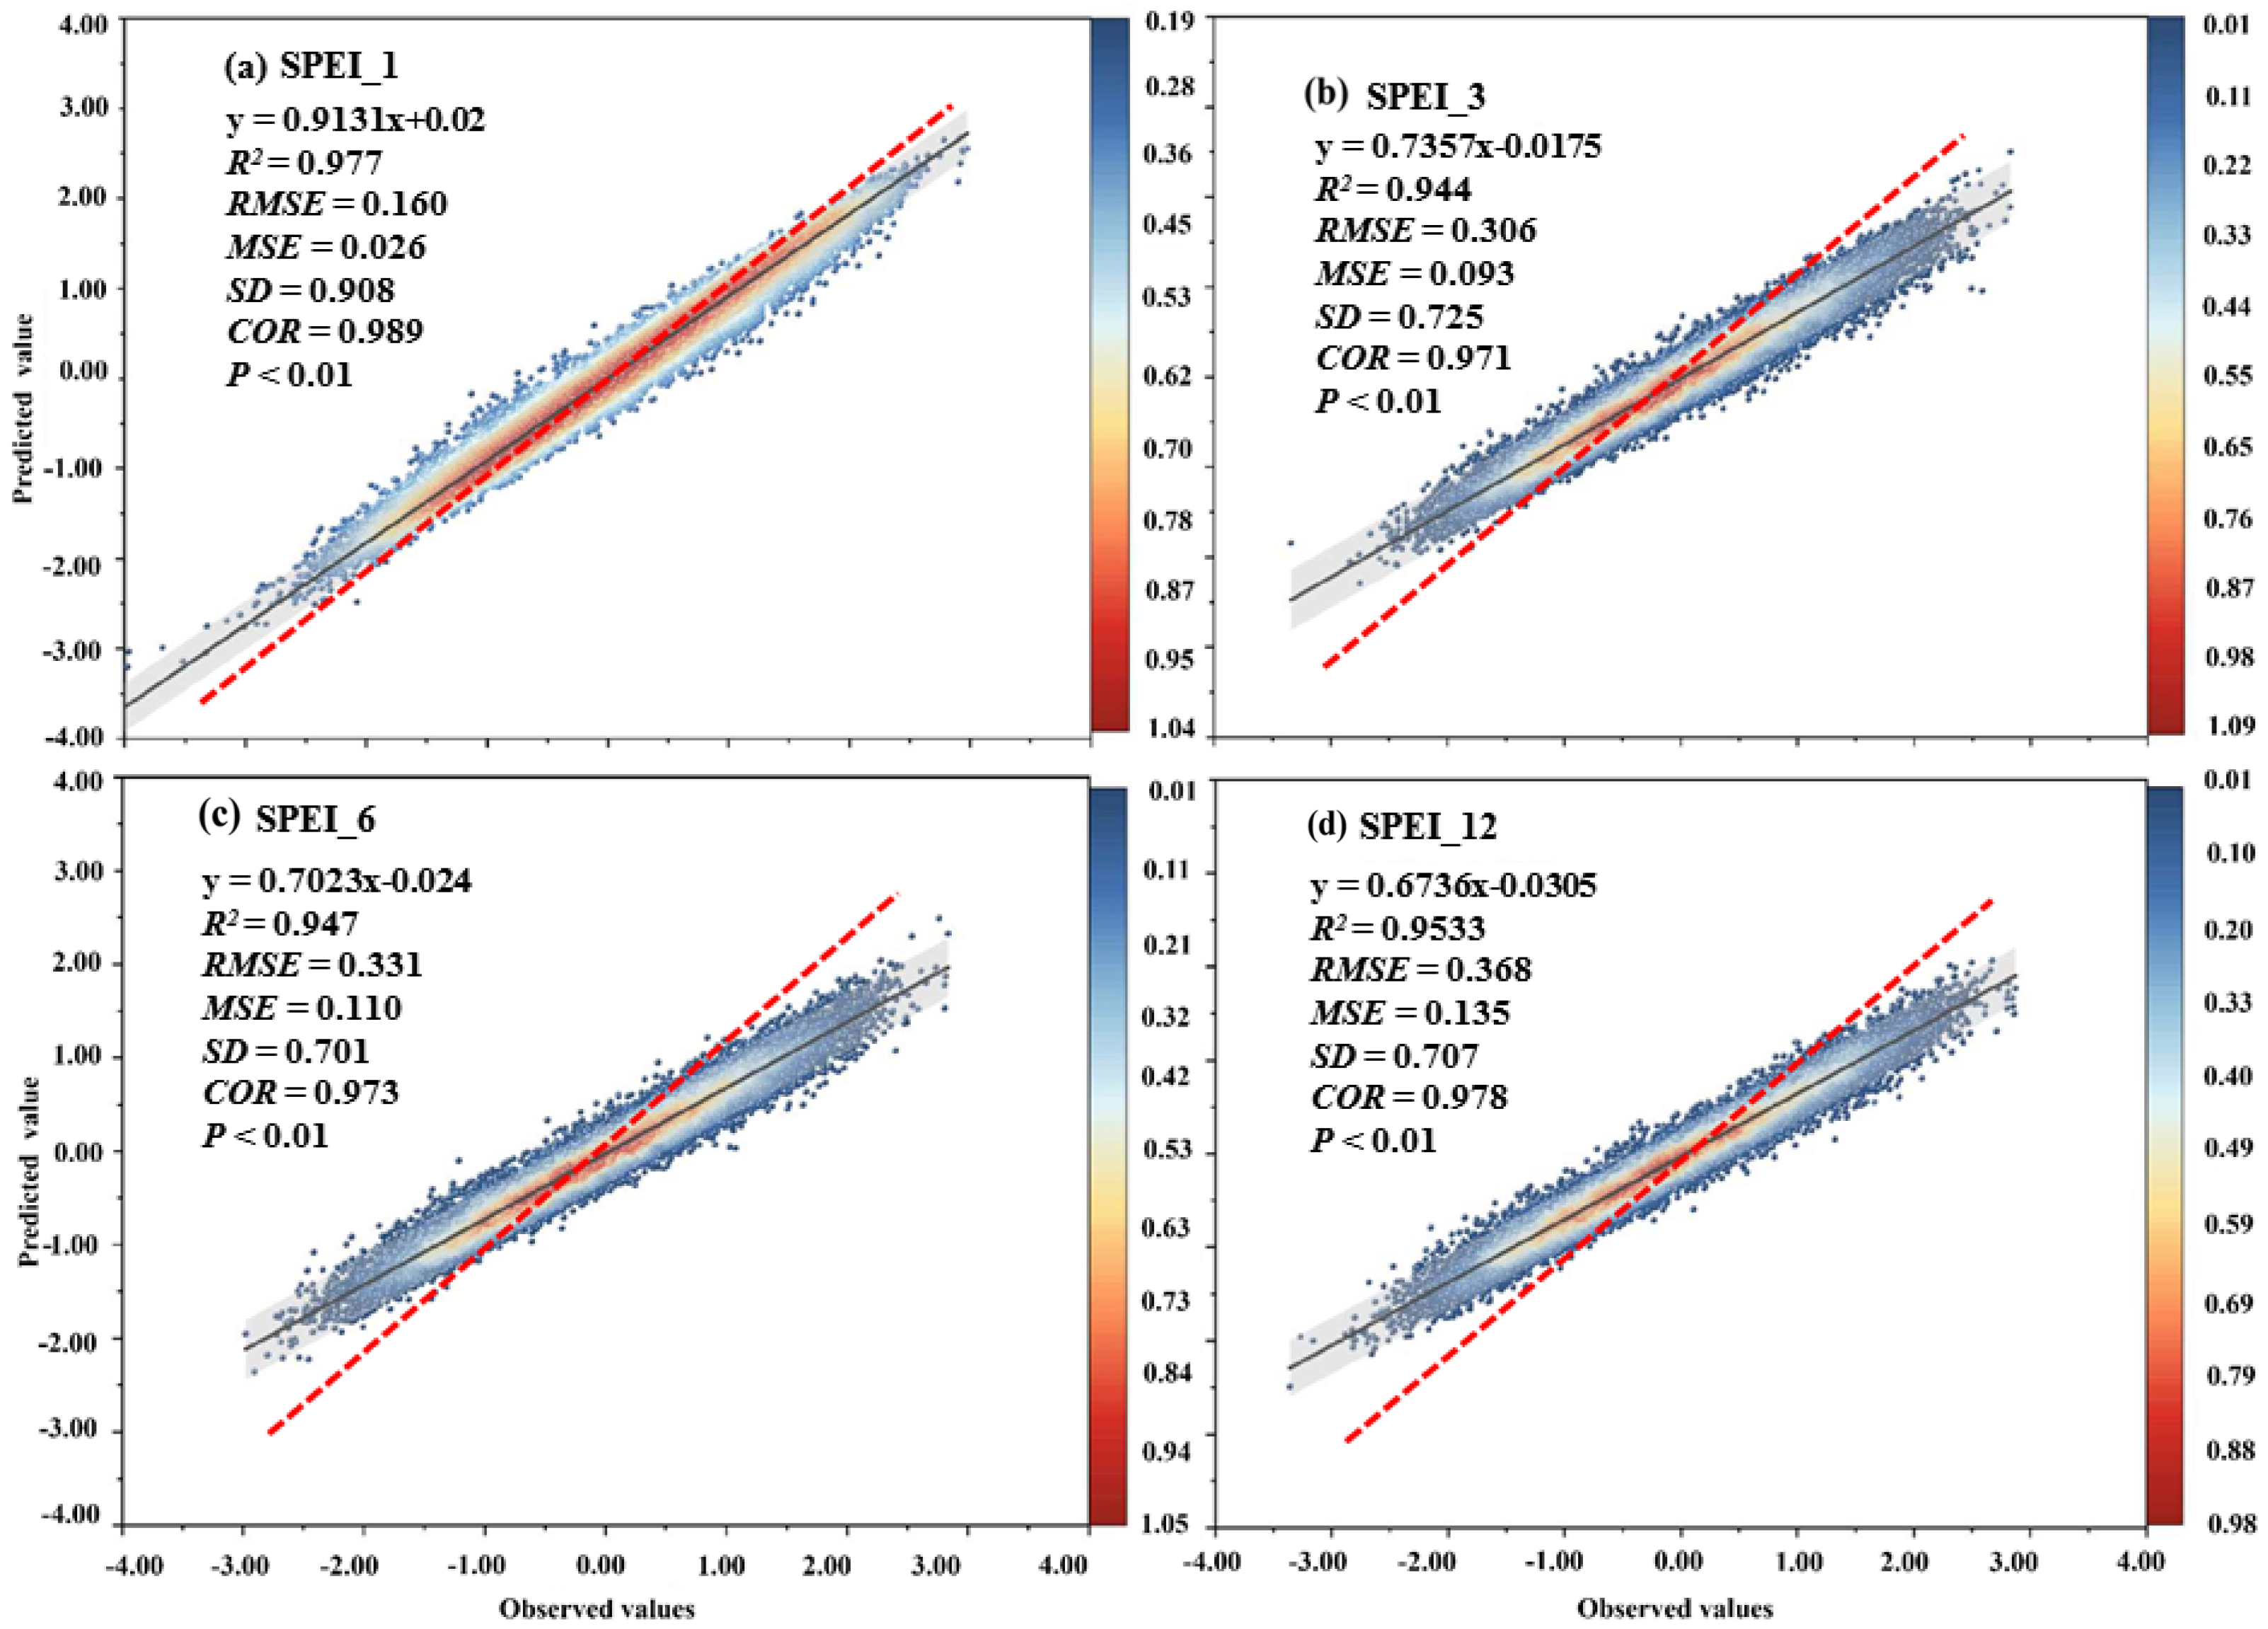
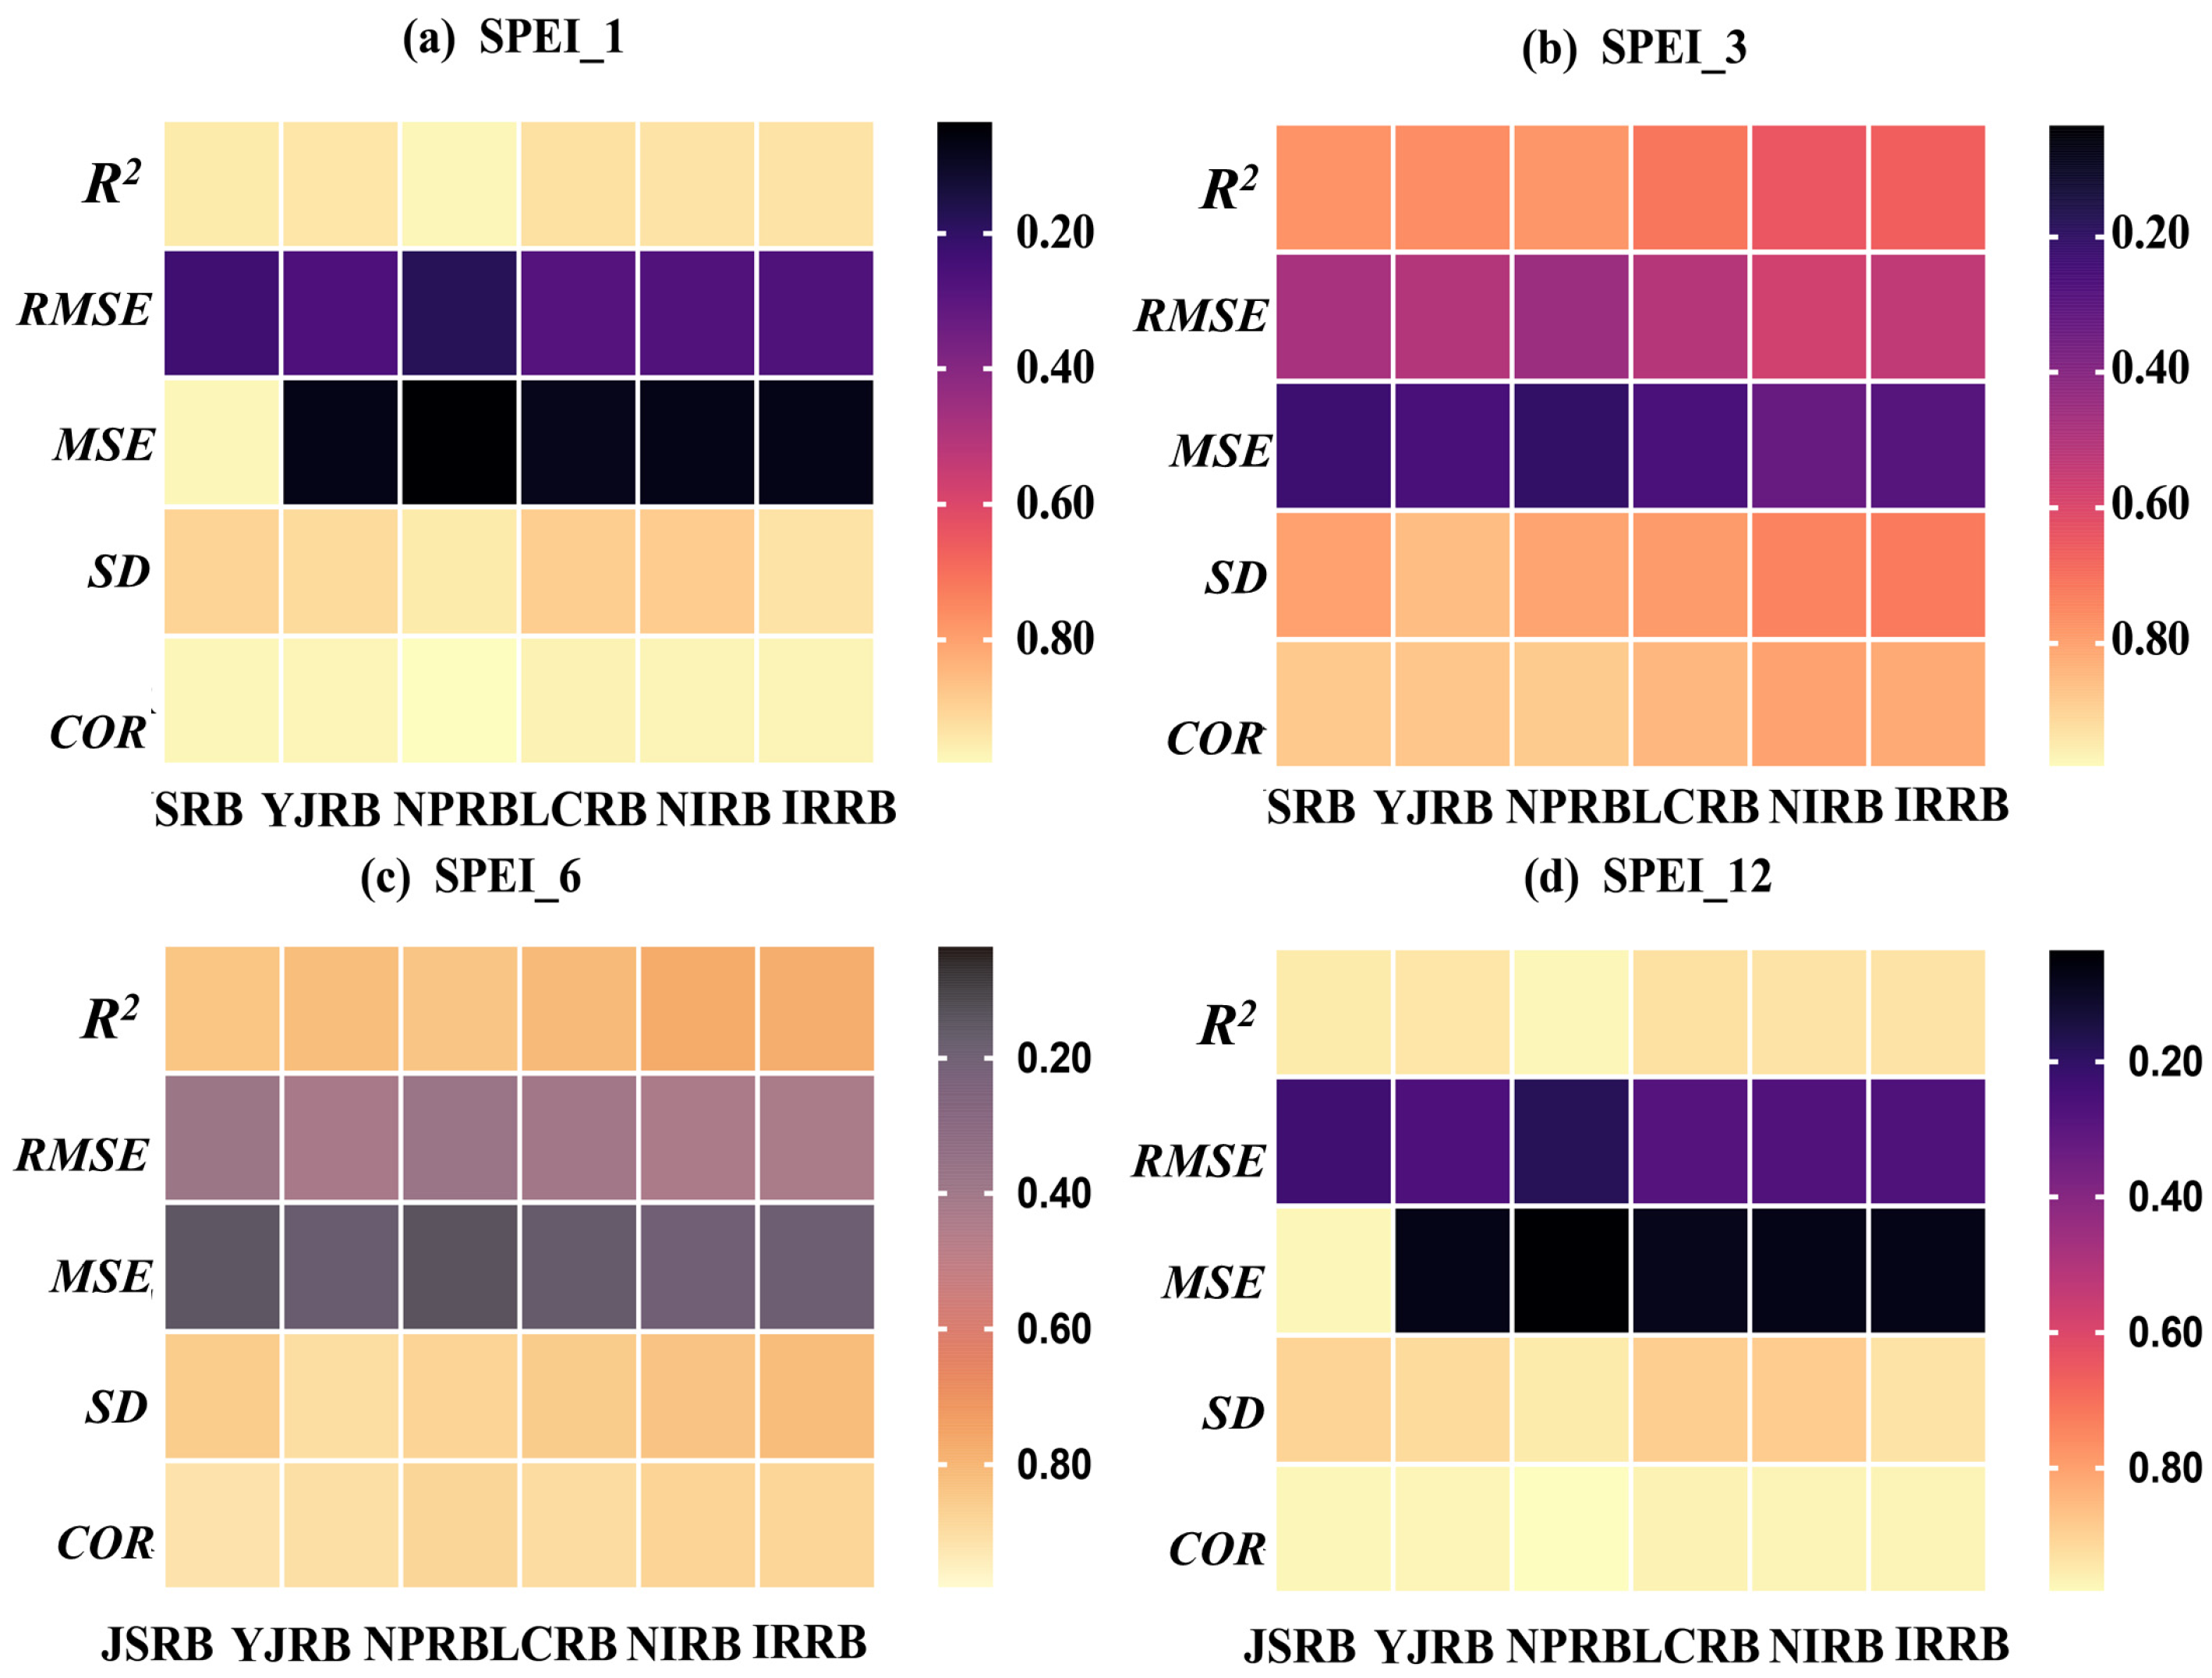
3.3.2. Drought Modeling Based on Driving Factors
4. Discussion
4.1. Multifactor Driven Drought Patterns
4.2. Practical Implications of Regional Drought Monitoring Model
4.3. Limitations and Future Work
5. Conclusions
Author Contributions
Funding
Data Availability Statement
Conflicts of Interest
Abbreviations
| ASP | Aspect |
| ELE | Elevation |
| GDM | Geographical Detector Model |
| HF | Human Footprint |
| IRRB | Irrawaddy River Basin |
| JSRB | Jinsha River Basin |
| LCRB | Lancang River Basin |
| LULC | Land use/cover |
| NJRB | Nujiang River Basin |
| NPRB | Nanpan River Basin |
| PD | Population density |
| PET | Potential evapotranspiration |
| PRE | Precipitation |
| RF | Random forest |
| RH | Relative humidity |
| SLO | Slope |
| SM | Soil moisture |
| SPEI | Standardized Precipitation Evapotranspiration Index |
| ST | Soil Type |
| SW | Southwestern |
| Tmax | Maximum temperature |
| Tmean | Mean temperature |
| Tmin | Minimum temperature |
| VPD | Vapor pressure deficit |
| YJRB | Yuanjiang River Basin |
References
- Muthuvel, D.; Sivakumar, B. Spatial Propagation of Different Drought Types and Their Concurrent Societal Risks: A Complex Networks-Based Analysis. J. Hydrol. 2024, 636, 131247. [Google Scholar] [CrossRef]
- Cheng, Q.; Gao, L.; Zhong, F.; Zuo, X.; Ma, M. Spatiotemporal Variations of Drought in the Yunnan-Guizhou Plateau, Southwest China, during 1960–2013 and Their Association with Large-Scale Circulations and Historical Records. Ecol. Indic. 2020, 112, 106041. [Google Scholar] [CrossRef]
- Zhu, Z.; Duan, W.; Zou, S.; Zeng, Z.; Chen, Y.; Feng, M.; Qin, J.; Liu, Y. Spatiotemporal Characteristics of Meteorological Drought Events in 34 Major Global River Basins during 1901–2021. Sci. Total Environ. 2024, 921, 170913. [Google Scholar] [CrossRef] [PubMed]
- Wu, X.; Tang, W.; Chen, F.; Wang, S.; Bakhtiyorov, Z.; Liu, Y.; Guan, Y. Attribution and Risk Projections of Hydrological Drought over Water-scarce Central Asia. Earth’s Future 2025, 13, e2024EF005243. [Google Scholar] [CrossRef]
- Zhou, X.; Li, Y.; Xiao, C.; Chen, W.; Mei, M.; Wang, G. High-Impact Extreme Weather and Climate Events in China: Summer 2024 Overview. Adv. Atmos. Sci. 2025. [Google Scholar] [CrossRef]
- Dai, A. Increasing Drought under Global Warming in Observations and Models. Nat. Clim Change 2013, 3, 52–58. [Google Scholar] [CrossRef]
- Ding, Y.; Lu, Z.; Wu, L.; Zhou, L.; Ao, T.; Xu, J.; Wei, R. Evaluating the Spatiotemporal Dynamics of Driving Factors for Multiple Drought Types in Different Climate Regions of China. J. Hydrol. 2024, 640, 131710. [Google Scholar] [CrossRef]
- Zhu, Y.; Yang, P.; Xia, J.; Huang, H.; Chen, Y.; Li, Z.; Sun, K.; Song, J.; Shi, X.; Lu, X. Drought Propagation and Its Driving Forces in Central Asia under Climate Change. J. Hydrol. 2024, 636, 131260. [Google Scholar] [CrossRef]
- Song, J.Y.; Abbaszadeh, P.; Deb, P.; Moradkhani, H. Unraveling the Relationship between Tropical Storms and Agricultural Drought. Earth’s Future 2022, 10, e2021EF002417. [Google Scholar] [CrossRef]
- Jiang, J.; Zhou, T. Agricultural Drought over Water-Scarce Central Asia Aggravated by Internal Climate Variability. Nat. Geosci. 2023, 16, 154–161. [Google Scholar] [CrossRef]
- Wang, T.; Tu, X.; Singh, V.P.; Chen, X.; Lin, K.; Zhou, Z.; Tan, Y. Assessment of Future Socioeconomic Drought Based on CMIP6: Evolution, Driving Factors and Propagation. J. Hydrol. 2023, 617, 129009. [Google Scholar] [CrossRef]
- Li, X.; He, B.; Quan, X.; Liao, Z.; Bai, X. Use of the Standardized Precipitation Evapotranspiration Index (SPEI) to Characterize the Drying Trend in Southwest China from 1982–2012. Remote Sens. 2015, 7, 10917–10937. [Google Scholar] [CrossRef]
- Wang, F.; Wang, Z.; Yang, H.; Zhao, Y. Study of the Temporal and Spatial Patterns of Drought in the Yellow River Basin Based on SPEI. Sci. China Earth Sci. 2018, 61, 1098–1111. [Google Scholar] [CrossRef]
- Ma, B.; Zhang, B.; Jia, L.; Huang, H. Conditional Distribution Selection for SPEI-Daily and Its Revealed Meteorological Drought Characteristics in China from 1961 to 2017. Atmos. Res. 2020, 246, 105108. [Google Scholar] [CrossRef]
- Wan, L.; Bento, V.A.; Qu, Y.; Qiu, J.; Song, H.; Zhang, R.; Wu, X.; Xu, F.; Lu, J.; Wang, Q. Drought Characteristics and Dominant Factors across China: Insights from High-Resolution Daily SPEI Dataset between 1979 and 2018. Sci. Total Environ. 2023, 901, 166362. [Google Scholar] [CrossRef]
- Vicente-Serrano, S.M.; Beguería, S.; López-Moreno, J.I. A Multiscalar Drought Index Sensitive to Global Warming: The Standardized Precipitation Evapotranspiration Index. J. Clim. 2010, 23, 1696–1718. [Google Scholar] [CrossRef]
- Pei, Z.; Fang, S.; Wang, L.; Yang, W. Comparative Analysis of Drought Indicated by the SPI and SPEI at Various Timescales in Inner Mongolia, China. Water 2020, 12, 1925. [Google Scholar] [CrossRef]
- Meseguer-Ruiz, O.; Serrano-Notivoli, R.; Aránguiz-Acuña, A.; Fuentealba, M.; Nuñez-Hidalgo, I.; Sarricolea, P.; Garreaud, R. Comparing SPI and SPEI to Detect Different Precipitation and Temperature Regimes in Chile throughout the Last Four Decades. Atmos. Res. 2024, 297, 107085. [Google Scholar] [CrossRef]
- Salehan, H.S.M.; Bahari, N.E.; Zulcafli, A.S. Statistical Comparison of SPEI-1 Month and SPEI-3 Month: Enhancing Consistency in Drought Assessment. AIP Conf. Proc. 2024, 3189, 100006. [Google Scholar]
- Feng, K.; Wang, Y.; Li, Y.; Wang, F.; Su, X.; Zhang, Z.; Wu, H.; Zhang, G.; Li, Y.; Wang, X. Three-Dimensional Perspective on the Characterization of the Spatiotemporal Propagation from Meteorological to Agricultural Drought. Agric. For. Meteorol. 2024, 353, 110048. [Google Scholar] [CrossRef]
- Xie, L.; Li, Y.; Biswas, A.; Wu, S.; Song, X. Assessing the Dynamics and Trigger Factors of Drought Propagation in the China-Pakistan Economic Corridor: A Three-Dimensional Perspective. J. Environ. Manag. 2024, 366, 121730. [Google Scholar] [CrossRef] [PubMed]
- Du, M.; Huang, S.; Singh, V.P.; Leng, G.; Huang, Q.; Li, Y. Quantifying the Effects of Direct Human Activities and Climate Change on the Spatial Propagation of Hydrological Drought in the Yellow River Basin, China. J. Hydrol. 2024, 643, 131931. [Google Scholar] [CrossRef]
- Luo, X.; Luo, X.; Ji, X.; Ming, W.; Wang, L.; Xiao, X.; Xu, J.; Liu, Y.; Li, Y. Meteorological and Hydrological Droughts in the Lancang-Mekong River Basin: Spatiotemporal Patterns and Propagation. Atmos. Res. 2023, 293, 106913. [Google Scholar] [CrossRef]
- Wang, Z.; Chang, J.; Wang, Y.; Yang, Y.; Guo, Y.; Yang, G.; He, B. Temporal and Spatial Propagation Characteristics of Meteorological Drought to Hydrological Drought and Influencing Factors. Atmos. Res. 2024, 299, 107212. [Google Scholar] [CrossRef]
- Wang, T.; Tu, X.; Singh, V.P.; Chen, X.; Lin, K.; Zhou, Z.; Zhu, J. A CMIP6-Based Framework for Propagation from Meteorological and Hydrological Droughts to Socioeconomic Drought. J. Hydrol. 2023, 623, 129782. [Google Scholar] [CrossRef]
- Wang, W.; Du, Q.; Yang, H.; Jin, P.; Wang, F.; Liang, Q. Drought Patterns and Multiple Teleconnection Factors Driving Forces in China during 1960–2018. J. Hydrol. 2024, 631, 130821. [Google Scholar] [CrossRef]
- Ma, T.; Chen, W.; Cai, Q.; Dong, Z.; Wang, L.; Hu, P.; Gao, L.; Garfinkel, C.I. Attribution Analysis of the Persistent and Extreme Drought in Southwest China during 2022–2023. Environ. Res. Lett. 2024, 19, 114056. [Google Scholar] [CrossRef]
- Song, X.; Chen, H.; Chen, T.; Huang, Q.; Deng, S.; Yang, N. Spatial and Temporal Variations of Spring Drought in Southwest China and Its Possible Teleconnection with the Global Climate Events. J. Hydrol. Reg. Stud. 2024, 51, 101655. [Google Scholar] [CrossRef]
- Wang, L.; Ma, S. Extreme Winter-Spring Drought in Southwest China in 2023: Response to the Phase Transition from La Niña to El Niño. Environ. Res. Lett. 2024, 19, 84042. [Google Scholar] [CrossRef]
- Lan, T.; Yan, X. Analysis of Drought Characteristics and Causes in Yunnan Province in the Last 60 Years (1961–2020). J. Hydrometeorol. 2024, 25, 177–190. [Google Scholar] [CrossRef]
- Qin, H.; Tan, Y.; Shen, T.; Schaefer, D.A.; Chen, H.; Zhou, S.; Xu, Q.; Zhu, Y.; Cheng, J.; Zhao, G.; et al. Spatiotemporal Trends of Atmospheric Dryness during 1980–2021 in Yunnan, China. Front. For. Glob. Chang. 2024, 7, 1397028. [Google Scholar] [CrossRef]
- Haile, G.G.; Tang, Q.; Li, W.; Liu, X.; Zhang, X. Drought: Progress in Broadening Its Understanding. WIREs Water 2020, 7, e1407. [Google Scholar] [CrossRef]
- Schwartz, N.B.; Feng, X.; Muscarella, R.; Swenson, N.G.; Umaña, M.N.; Zimmerman, J.K.; Uriarte, M. Topography and Traits Modulate Tree Performance and Drought Response in a Tropical Forest. Front. For. Glob. Change 2020, 3, 596256. [Google Scholar] [CrossRef]
- Zhang, Y.; Zhang, L.; Wang, J.; Dong, G.; Wei, Y. Quantitative Analysis of NDVI Driving Factors Based on the Geographical Detector Model in the Chengdu-Chongqing Region, China. Ecol. Indic. 2023, 155, 110978. [Google Scholar] [CrossRef]
- Xie, B.; Jones, P.; Dwivedi, R.; Bao, L.; Liang, R. Evaluation, Comparison, and Unique Features of Ecological Security in Southwest China: A Case Study of Yunnan Province. Ecol. Indic. 2023, 153, 110453. [Google Scholar] [CrossRef]
- Qian, W.; Ning, J. How Do Driving Factors Affect the Ecological Restoration Degree in Different Basins? A Case Study of Six River Basins in Yunnan, China. Land 2024, 13, 2091. [Google Scholar] [CrossRef]
- Lu, H.; Wu, Y.; Li, Y.; Liu, Y. Effects of Meteorological Droughts on Agricultural Water Resources in Southern China. J. Hydrol. 2017, 548, 419–435. [Google Scholar] [CrossRef]
- Ding, T.; Gao, H. The Record-Breaking Extreme Drought in Yunnan Province, Southwest China during Spring-Early Summer of 2019 and Possible Causes. J. Meteorol. Res. 2020, 34, 997–1012. [Google Scholar] [CrossRef]
- Yang, J.; Gong, D.; Wang, W.; Hu, M.; Mao, R. Extreme Drought Event of 2009/2010 over Southwestern China. Meteorol. Atmos. Phys. 2012, 115, 173–184. [Google Scholar] [CrossRef]
- Wen, Z.; Yu, R.; Zhai, P.; Yin, Y.; Li, L.Z.X. The Evolution Process of a Prolonged Compound Drought and Hot Extreme Event in Southwest China during the 2019 Pre-Monsoon Season. Atmos. Res. 2023, 283, 106551. [Google Scholar] [CrossRef]
- Zomer, R.J.; Xu, J.; Spano, D.; Trabucco, A. CMIP6-Based Global Estimates of Future Aridity Index and Potential Evapotranspiration for 2021-2060. Open Res. Eur. 2024, 4, 157. [Google Scholar] [CrossRef] [PubMed]
- Peng, S.; Ding, Y.; Liu, W.; Li, Z. 1 Km Monthly Temperature and Precipitation Dataset for China from 1901 to 2017. Earth Syst. Sci. Data 2019, 11, 1931–1946. [Google Scholar] [CrossRef]
- Peng, S.; Ding, Y.; Wen, Z.; Chen, Y.; Cao, Y.; Ren, J. Spatiotemporal Change and Trend Analysis of Potential Evapotranspiration over the Loess Plateau of China during 2011–2100. Agric. For. Meteorol. 2017, 233, 183–194. [Google Scholar] [CrossRef]
- He, Y.; Yan, W.; Cai, Y.; Deng, F.; Qu, X.; Cui, X. How Does the Net Primary Productivity Respond to the Extreme Climate under Elevation Constraints in Mountainous Areas of Yunnan, China? Ecol. Indic. 2022, 138, 108817. [Google Scholar] [CrossRef]
- Wang, H.; Rogers, J.C.; Munroe, D.K. Commonly Used Drought Indices as Indicators of Soil Moisture in China. J. Hydrometeorol. 2015, 16, 1397–1408. [Google Scholar] [CrossRef]
- Sha, S.; Cai, G.; Liu, S.; Ahmed, M.A. Roots to the Rescue: How Plants Harness Hydraulic Redistribution to Survive Drought across Contrasting Soil Textures. Adv. Biotechnol. 2024, 2, 43. [Google Scholar] [CrossRef]
- Yang, L.; Xu, Y.; Cao, Q.; Niu, Z.; Luo, Z.; Wang, L. Hydrological Response to Future Changes in Climate and Land Use/Land Cover in the Hanjiang River Basin. Nat. Hazard. 2024. [Google Scholar] [CrossRef]
- Liu, J.; Zhou, Z.; Yan, Z.; Gong, J.; Jia, Y.; Xu, C.-Y.; Wang, H. A New Approach to Separating the Impacts of Climate Change and Multiple Human Activities on Water Cycle Processes Based on a Distributed Hydrological Model. J. Hydrol. 2019, 578, 124096. [Google Scholar] [CrossRef]
- Simeng, W.; Dazhao, W.; Chang, H. A Comparative Study of Using ANUSPLIN and GWR Models for Downscaled GPM Precipitation. In Proceedings of the 2019 8th International Conference on Agro-Geoinformatics (Agro-Geoinformatics), Istanbul, Turkey, 16–19 July 2019; pp. 1–5. [Google Scholar]
- Hirsch, R.M.; Slack, J.R.; Smith, R.A. Techniques of Trend Analysis for Monthly Water Quality Data. Water Resour. Res. 1982, 18, 107–121. [Google Scholar] [CrossRef]
- Sen, P.K. Estimates of the Regression Coefficient Based on Kendall’s Tau. J. Am. Stat. Assoc. 1968, 63, 1379–1389. [Google Scholar] [CrossRef]
- Mann, H.B. Nonparametric Tests against Trend. Econometrica 1945, 13, 245. [Google Scholar] [CrossRef]
- Wang, W.; Yang, Y. Spatial-Temporal Differentiation Characteristics and Driving Factors of China’s Energy Eco-Efficiency Based on Geographical Detector Model. J. Clean. Prod. 2024, 434, 140153. [Google Scholar] [CrossRef]
- Li, X.; Jia, H.; Wang, L. Remote Sensing Monitoring of Drought in Southwest China Using Random Forest and eXtreme Gradient Boosting Methods. Remote Sens. 2023, 15, 4840. [Google Scholar] [CrossRef]
- Ma, W.; Feng, Z.; Cheng, Z.; Chen, S.; Wang, F. Identifying Forest Fire Driving Factors and Related Impacts in China Using Random Forest Algorithm. Forests 2020, 11, 507. [Google Scholar] [CrossRef]
- Yuan, W.; Zheng, Y.; Piao, S.; Ciais, P.; Lombardozzi, D.; Wang, Y.; Ryu, Y.; Chen, G.; Dong, W.; Hu, Z.; et al. Increased Atmospheric Vapor Pressure Deficit Reduces Global Vegetation Growth. Sci. Adv. 2019, 5, eaax1396. [Google Scholar] [CrossRef]
- Ji, B.; Qin, Y.; Zhang, T.; Zhou, X.; Yi, G.; Zhang, M.; Li, M. Analyzing Driving Factors of Drought in Growing Season in the Inner Mongolia Based on Geodetector and GWR Models. Remote Sens. 2022, 14, 6007. [Google Scholar] [CrossRef]
- Xiao, Z.; Zhou, X.; Yang, P.; Liu, H. Variation and Future Trends in Precipitation over Summer and Autumn across the Yunnan Region. Front. Earth Sci. 2016, 10, 498–512. [Google Scholar] [CrossRef]
- Fan, H.; Hu, J.; He, D. Trends in Precipitation over the Low Latitude Highlands of Yunnan, China. J. Geogr. Sci. 2013, 23, 1107–1122. [Google Scholar] [CrossRef]
- Jin, H.; Zhang, K.; Zhang, P.; Liu, G.; Liu, M.; Chen, X.; Willems, P. Spatiotemporal Evolution of Drought Status and Its Driving Factors Attribution in China. Sci. Total Environ. 2025, 958, 178131. [Google Scholar] [CrossRef]
- Shah, D.; Shah, H.L.; Dave, H.M.; Mishra, V. Contrasting Influence of Human Activities on Agricultural and Hydrological Droughts in India. Sci. Total Environ. 2021, 774, 144959. [Google Scholar] [CrossRef]
- Xu, Y.; Zhang, X.; Wang, X.; Hao, Z.; Singh, V.P.; Hao, F. Propagation from Meteorological Drought to Hydrological Drought under the Impact of Human Activities: A Case Study in Northern China. J. Hydrol. 2019, 579, 124147. [Google Scholar] [CrossRef]
- Blahušiaková, A.; Matoušková, M.; Jenicek, M.; Ledvinka, O.; Kliment, Z.; Podolinská, J.; Snopková, Z. Snow and Climate Trends and Their Impact on Seasonal Runoff and Hydrological Drought Types in Selected Mountain Catchments in Central Europe. Hydrol. Sci. J. 2020, 65, 2083–2096. [Google Scholar] [CrossRef]
- Su, F.; Pritchard, H.D.; Yao, T.; Huang, J.; Ou, T.; Meng, F.; Sun, H.; Li, Y.; Xu, B.; Zhu, M.; et al. Contrasting Fate of Western Third Pole’s Water Resources under 21st Century Climate Change. Earth’s Future 2022, 10, e2022EF002776. [Google Scholar] [CrossRef]
- Gao, B.; Yang, D.; Qin, Y.; Wang, Y.; Li, H.; Zhang, Y.; Zhang, T. Change in Frozen Soils and Its Effect on Regional Hydrology, Upper Heihe Basin, Northeastern Qinghai–Tibetan Plateau. Cryosphere 2018, 12, 657–673. [Google Scholar] [CrossRef]
- Cheng, G.; Jin, H. Permafrost and Groundwater on the Qinghai-Tibet Plateau and in Northeast China. Hydrogeol. J. 2013, 21, 5–23. [Google Scholar] [CrossRef]
- Zhang, T.; Su, X.; Zhang, G.; Wu, H.; Wang, G.; Chu, J. Evaluation of the Impacts of Human Activities on Propagation from Meteorological Drought to Hydrological Drought in the Weihe River Basin, China. Sci. Total Environ. 2022, 819, 153030. [Google Scholar] [CrossRef] [PubMed]
- Zhao, W.; Wu, J.; Du, E.; Deng, X.; Sun, G.; Wang, G. Deciphering the Influence of Climate Change and Human Activities on the Drought Propagation. J. Hydrol. Reg. Stud. 2024, 51, 101654. [Google Scholar] [CrossRef]
- Wilson, B.R.; Koen, T.B.; Barnes, P.; Ghosh, S.; King, D. Soil Carbon and Related Soil Properties along a Soil Type and Land-use Intensity Gradient, New South Wales, Australia. Soil Use Manag. 2011, 27, 437–447. [Google Scholar] [CrossRef]
- Wang, Y.; Hu, W.; Sun, H.; Zhao, Y.; Zhang, P.; Li, Z.; Zhou, Z.; Tong, Y.; Liu, S.; Zhou, J.; et al. Soil Moisture Decline in China’s Monsoon Loess Critical Zone: More a Result of Land-Use Conversion than Climate Change. Proc. Natl. Acad. Sci. USA 2024, 121, e2322127121. [Google Scholar] [CrossRef]
- Tang, Y.; Shao, Q.; Liu, J.; Zhang, H.; Yang, F.; Cao, W.; Wu, D.; Gong, G. Did Ecological Restoration Hit Its Mark? Monitoring and Assessing Ecological Changes in the Grain for Green Program Region Using Multi-Source Satellite Images. Remote Sens. 2019, 11, 358. [Google Scholar] [CrossRef]
- Wang, D.; Yue, D.; Zhou, Y.; Huo, F.; Bao, Q.; Li, K. Drought Resistance of Vegetation and Its Change Characteristics before and after the Implementation of the Grain for Green Program on the Loess Plateau, China. Remote Sens. 2022, 14, 5142. [Google Scholar] [CrossRef]
- Xu, X.; Chen, F.; Wang, B.; Harrison, M.T.; Chen, Y.; Liu, K.; Zhang, C.; Zhang, M.; Zhang, X.; Feng, P.; et al. Unleashing the Power of Machine Learning and Remote Sensing for Robust Seasonal Drought Monitoring: A Stacking Ensemble Approach. J. Hydrol. 2024, 634, 131102. [Google Scholar] [CrossRef]
- Zhang, Y.; Hao, Z.; Feng, S.; Zhang, X.; Xu, Y.; Hao, F. Agricultural Drought Prediction in China Based on Drought Propagation and Large-Scale Drivers. Agric. Water Manage. 2021, 255, 107028. [Google Scholar] [CrossRef]
- Dikshit, A.; Pradhan, B. Interpretable and Explainable AI (XAI) Model for Spatial Drought Prediction. Sci. Total Environ. 2021, 801, 149797. [Google Scholar] [CrossRef]
- Hou, Z.; Wang, B.; Zhang, Y.; Zhang, J.; Song, J. Drought Prediction in Jilin Province Based on Deep Learning and Spatio-Temporal Sequence Modeling. J. Hydrol. 2024, 642, 131891. [Google Scholar] [CrossRef]
- Xiao, X.; Ming, W.; Luo, X.; Yang, L.; Li, M.; Yang, P.; Ji, X.; Li, Y. Leveraging Multisource Data for Accurate Agricultural Drought Monitoring: A Hybrid Deep Learning Model. Agric. Water Manag. 2024, 293, 108692. [Google Scholar] [CrossRef]
- Li, Z.; Sun, F.; Wang, H.; Wang, T.; Feng, Y. Detecting the Interactions between Vegetation Greenness and Drought Globally. Atmos. Res. 2024, 304, 107409. [Google Scholar] [CrossRef]
- Pieper, P.; Düsterhus, A.; Baehr, J. Improving Seasonal Predictions of Meteorological Drought by Conditioning on ENSO States. Environ. Res. Lett. 2021, 16, 94027. [Google Scholar] [CrossRef]


| Variable Number | Indexes | Abbreviations | Time Coverage | Data Types | Sources |
|---|---|---|---|---|---|
| 1 | Precipitation (mm) | PRE | 1979–2023 | Observed | http://data.cma.cn/ |
| 2 | Maximum temperature (°C) | Tmax | 1979–2023 | Observed | http://data.cma.cn/ |
| 3 | Minimum temperature (°C) | Tmin | 1979–2023 | Observed | http://data.cma.cn/ |
| 4 | Mean temperature (°C) | Tmean | 1979–2023 | Observed | http://data.cma.cn/ |
| 5 | Potential evapotranspiration (mm) | PET | 1979–2023 | Derived | - |
| 6 | Relative humidity (%) | RH | 1979–2023 | Observed | http://data.cma.cn/ |
| 7 | Vapor pressure deficit (kpa) | VPD | 1979–2023 | Derived | - |
| 8 | Elevation (m) | ELE | - | Raster | https://www.resdc.cn/ |
| 9 | Aspect | ASP | - | Raster | - |
| 10 | Slope (°) | SLO | - | Raster | - |
| 11 | Soil types | ST | - | Vector | https://www.resdc.cn/ |
| 12 | Soil moisture (cm3/cm3) | SM | 2000–2020 | Raster | https://www.gleam.eu/ |
| 13 | Land use/cover | LULC | 1985–2020 | Raster | http://doi.org/10.5281/zenodo.4417809 (accessed on 16 January 2025) |
| 14 | Population density (population/km2) | PD | 2000–2020 | Raster | https://www.resdc.cn/ |
| 15 | Human footprint | HF | 2000–2020 | Raster | https://www.resdc.cn/ |
| |Z| | Types of Drought and Wetness |
|---|---|
| ≥0 | Wetting |
| ≥1.96 | Significant wetting |
| ≥2.58 | Extremely significant wetting |
| <0 | Drying |
| ≤−1.96 | Significant drying |
| ≤−2.58 | Extremely significant drying |
| Judgment Criteria | Interactivity Types |
|---|---|
| q(X1 ∩ X2) < Min ((q(X1), q(X2)) | Nonlinear—weakened |
| Min ((q(X1), q(X2)) < q(X1 ∩ X2) < Max ((q(X1), q(X2)) | Nonlinear—weakened by one |
| q(X1 ∩ X2) > Max ((q(X1), q(X2)) | Mutually enhanced |
| q(X1 ∩ X2) = q(X1) + q(X2)) | Independent effect |
| q(X1 ∩ X2) > q(X1) + q(X2)) | Nonlinear—enhanced |
Disclaimer/Publisher’s Note: The statements, opinions and data contained in all publications are solely those of the individual author(s) and contributor(s) and not of MDPI and/or the editor(s). MDPI and/or the editor(s) disclaim responsibility for any injury to people or property resulting from any ideas, methods, instructions or products referred to in the content. |
© 2025 by the authors. Licensee MDPI, Basel, Switzerland. This article is an open access article distributed under the terms and conditions of the Creative Commons Attribution (CC BY) license (https://creativecommons.org/licenses/by/4.0/).
Share and Cite
Qin, H.; Schaefer, D.A.; Shen, T.; Wang, J.; Liu, Z.; Chen, H.; Hu, P.; Zhu, Y.; Cheng, J.; Wu, J.; et al. Drought Driving Factors as Revealed by Geographic Detector Model and Random Forest in Yunnan, China. Forests 2025, 16, 505. https://doi.org/10.3390/f16030505
Qin H, Schaefer DA, Shen T, Wang J, Liu Z, Chen H, Hu P, Zhu Y, Cheng J, Wu J, et al. Drought Driving Factors as Revealed by Geographic Detector Model and Random Forest in Yunnan, China. Forests. 2025; 16(3):505. https://doi.org/10.3390/f16030505
Chicago/Turabian StyleQin, Haiqin, Douglas Allen Schaefer, Ting Shen, Junchuan Wang, Zhaorui Liu, Huafang Chen, Ping Hu, Yingmo Zhu, Jinxin Cheng, Jianping Wu, and et al. 2025. "Drought Driving Factors as Revealed by Geographic Detector Model and Random Forest in Yunnan, China" Forests 16, no. 3: 505. https://doi.org/10.3390/f16030505
APA StyleQin, H., Schaefer, D. A., Shen, T., Wang, J., Liu, Z., Chen, H., Hu, P., Zhu, Y., Cheng, J., Wu, J., & Xu, J. (2025). Drought Driving Factors as Revealed by Geographic Detector Model and Random Forest in Yunnan, China. Forests, 16(3), 505. https://doi.org/10.3390/f16030505