Article

Carbon Sequestration Capacity of Key State-Owned Forest Regions from the Perspective of Benchmarking Management

1
School of Digital Economics and Trade, Guangzhou Huashang College, Guangzhou 511300, China
2
College of Economics and Management, Nanjing Forestry University, Nanjing 210037, China
3
College of Management, Hebei GEO University, Shijiazhuang 050031, China
*
Author to whom correspondence should be addressed.
Forests 2025, 16(3), 488; https://doi.org/10.3390/f16030488
Submission received: 24 January 2025 / Revised: 21 February 2025 / Accepted: 6 March 2025 / Published: 11 March 2025
(This article belongs to the Section Forest Ecology and Management)

Abstract

:
The sustainable management of state-owned forest regions is significant for improving the nationally determined contribution and achieving carbon neutrality. The administrative area of key state-owned forest regions in northeast China and Inner Mongolia, hereafter referred to as forest regions, spans a forested area of 27.16 million hectares and a forest coverage rate of 82.97%. This represents China’s largest state-owned forest resource base, with extensive and concentrated forest areas. However, despite this vast forest coverage, the region’s forest stand density remains below the national and global average, underscoring the need for improved carbon sequestration performance. This study used the Stochastic Frontier Analysis (SFA) method to measure the carbon sequestration efficiency of key state-owned forest regions in northeast China and Inner Mongolia. A spatiotemporal Geographically and Temporally Weighted Regression model (GTWR) was employed to reveal the spatiotemporal non-stationarity of the driving mechanism of carbon sequestration efficiency. Finally, the benchmarking management method was applied to predict the carbon sequestration potential. The results indicated that the carbon sequestration efficiency of forest regions exhibited an overall increasing trend over time, with significant spatial and temporal heterogeneity among forest industry enterprises (forest farms). Specifically, the carbon sequestration efficiency ranked from highest to lowest is as follows: Greater Khingan Forestry Group, Inner Mongolia Forestry Industry Group, Longjiang Forestry Industry Group, Changbai Mountain Forestry Industry Group, Jilin Forestry Industry Group, and Yichun Forestry Industry Group. Furthermore, carbon sequestration efficiency was driven by both natural and socioeconomic factors, but the effects of these factors were spatiotemporally non-stationary. Generally, enterprise output value, labor compensation, tending, and accumulated temperature had positive effects on carbon sequestration efficiency, while capital structure, altitude, and precipitation had negative effects. Finally, our findings revealed that the carbon sequestration potential of forest regions is substantial. If technical efficiency is improved, the carbon sequestration potential of forest regions could expand by 0.86 times the current basis, reaching 31.29 mtCO2 by 2030. These results underscore the importance of respecting the differences and conditionality of forest development paths and promoting the sustainable management of key state-owned forest regions through scientific approaches, which is crucial for achieving carbon neutrality goals.

1. Introduction

As the most important carbon pool in terrestrial ecosystems, forests account for 86% of the global vegetation carbon stock [1]. Increasing forest area, reducing deforestation, and improving forest management have become key natural solutions for mitigating climate change [2]. China’s state-owned forest regions encompass approximately 16% of China’s forest area and 25% of its forest stock volume. Their sustainable management is crucial in enhancing ecosystem carbon storage, increasing the country’s capacity for nationally determined contributions (NDCs), achieving the “carbon neutrality” goal, and promoting modernization that fosters harmony between humans and nature. However, the long-term functions of state-owned forest regions in protecting and cultivating forest resources have not been fully realized. There is still considerable potential to improve forest quality and carbon sequestration capacity [3]. For example, the state-owned forest regions in northeast China and Inner Mongolia (hereinafter referred to as the forest regions) are the largest and most extensive state-owned forest regions in China, but their forest stock per hectare has not reached the national average level of natural forests and is far lower than the world average level [4,5]. The productivity of forest vegetation in these regions has not been fully utilized, meaning that their carbon sequestration capacity per unit area has yet to be effectively unlocked.
The assessment of carbon sequestration capacity, which includes carbon sequestration potential and efficiency, has become a key scientific issue in enhancing the carbon absorption capacity of forest regions. Carbon sequestration potential is typically assessed and simulated using several methods, including the time-series inventory method, the limiting factor method, the maximum potential model under similar scenarios, and the efficiency benchmarking management approach. The time-series inventory method involves using long-term survey or observation data, forest inventory data, or forest growth equations to obtain time-series data on ecosystem carbon sequestration. This allows for estimating the ecosystem’s carbon sequestration rate and potential [6,7]. The limiting factor method posits that the actual carbon sequestration potential of an ecosystem is determined by the cumulative impact of various limiting factors. It uses forest carbon density as a reference for carbon capacity, which reflects the balance between forest productivity and respiratory consumption under constraints like light, temperature, and water availability [8]. However, the time-series inventory method is constrained by the duration of observations [9], while the limiting factor method is limited by observation sites [10,11] and climate variability [12]. Both methods face challenges in acquiring large-scale, continuous temporal data [13]. The maximum potential model under similar scenarios primarily encompasses the space-for-time substitution method and the similar habitat potential model. The space-for-time substitution method posits that ecosystems in locations with similar environmental conditions and disturbance patterns will follow a similar successional trajectory [14]. This method posits that the carbon density of mature forests can represent the maximum biomass carbon density for nearby regions with similar conditions, using this as a reference for biomass carbon capacity. The difference between the current ecosystem carbon stock and the maximum potential biomass carbon capacity represents the ecosystem’s carbon sequestration potential. The similar habitat potential model assumes that areas with similar natural conditions exhibit similar landscapes and vegetation cover. By calculating the difference between the vegetation index of each location and the maximum vegetation index within that habitat, this method evaluates the potential vegetation growth at specific locations [15]. Although this approach addresses the spatial heterogeneity of environmental variables, it assumes that the optimal vegetation levels (of carbon sequestration) within similar habitats can serve as a reference. This assumption overlooks the possibility of abrupt changes in vegetation, which may lead to an overestimation of vegetation potential of carbon sequestration. The methods mentioned above primarily assess the carbon sequestration potential of future forests or vegetation under natural growth conditions, but they also overlook the additional carbon sink increments resulting from human interventions or management practices. Unlike purely natural science-based approaches to estimating carbon sink potential, the benchmarking management method calculates carbon sequestration potential by incorporating adjustments for non-technical efficiency factors [16]. This method, based on production functions, integrates socioeconomic factors, such as labor, capital, and land, while also considering the impacts of temporal, spatial, and climatic conditions. Consequently, it provides a more accurate assessment of regional carbon sequestration potential.
Efficiency estimation primarily uses two methods: Data Envelopment Analysis (DEA) and Stochastic Frontier Analysis (SFA) [17]. The DEA model is based on the concept of relative efficiency and employs mathematical programming models to estimate the objective function. It is capable of evaluating the relative efficiency of decision-making units (DMUs) with multiple inputs and outputs. However, DEA attributes all deviations between actual output and frontier output to technical inefficiency, thereby disregarding the impact of random factors on output [18]. Moreover, its results tend to lack stability and are highly sensitive to outliers. The Stochastic Frontier Analysis (SFA) method takes into account the presence of random errors, thereby avoiding significant errors caused by outliers and considering the impact of stochastic factors on output [19]. Traditional regression methods, such as Ordinary Least Squares (OLS) [20], Tobit regression models [5], and threshold regression [21], can reveal the mechanisms driving efficiency improvements. However, these methods often overlook the spatiotemporal non-stationarity characteristics in the process of carbon sequestration efficiency drivers [22]. The Geographically and Temporally Weighted Regression (GTWR) model extends the Geographic Weighted Regression (GWR) model by incorporating temporal characteristics into the regression framework. This allows it to fully account for the spatiotemporal non-stationarity of different influencing factors [23], enabling the model to intuitively and comprehensively capture the magnitude and direction of spatiotemporal variations in the impact of each factor on the target [24].
Therefore, from the perspective of benchmarking management, this study takes the key state-owned forest regions in northeast China and Inner Mongolia as the research object, exploring their carbon sequestration capacity from two aspects: carbon sequestration efficiency and potential. First, the SFA model incorporates natural factors to measure the carbon sequestration efficiency of forest regions and analyzes the spatiotemporal evolution and patterns of this efficiency. Second, the GTWR model is employed to investigate the spatiotemporal non-stationarity of the driving mechanisms affecting carbon sequestration efficiency, capturing the magnitude and direction of spatiotemporal variations in the influence of various factors on the efficiency of forest regions. Finally, the study employs the Autoregressive Moving Average (ARMA) model to predict the future carbon sequestration potential of key state-owned forest regions in northeast China and Inner Mongolia. This study aims to provide decision-making references for enhancing the carbon absorption capacity and sustainable management of state-owned forest regions, thereby contributing to the achievement of carbon neutrality goals.

2. Materials and Methods

2.1. Overview of the Study Area

The key state-owned forest regions in northeast China and Inner Mongolia (97°12′–135°05′ E, 37°24′–53°33′ N, Figure 1) are primarily characterized by a cold temperate and temperate continental monsoon climate, with an annual average precipitation of 400–600 mm and an average temperature ranging from −5 °C to 8 °C. The terrain mainly consists of mountains, hills, and plains. The forest management area covers 32.7 million hectares, of which the forested area accounts for 27.2 million hectares, with a forest coverage rate of 82.97%. This region serves as a vital source and water conservation area for the Songhua River, Nen River, and Heilongjiang River systems, their main tributaries, and numerous lakes and reservoirs. It protects over 10% of the nation’s arable land and includes China’s largest grassland, the Hulunbuir Grassland [25].
The state-owned forest regions in northeast China and Inner Mongolia consist of six major forestry groups: Jilin Forestry Industry Group, Changbai Mountain Forestry Industry Group, Inner Mongolia Forestry Industry Group, Longjiang Forestry Industry Group, Yichun Forestry Industry Group, and Greater Khingan Forestry Group. These groups encompass a total of 87 relatively independent forestry farms or enterprises. The primary activities in these regions include tree breeding and seedling cultivation, afforestation, timber and bamboo harvesting and transportation, economic forest product planting and collection, floriculture, forest tourism, and under-forest economy. As of the end of 2022, the region employed nearly 209,200 workers, with a total industrial output value of CNY 32.28 billion and a main timber output of 327,861 m3.

2.2. Research Methods

2.2.1. Forest Carbon Sequestration Model Based on Net Primary Productivity (NPP)

Obtaining long-term, large-scale carbon sequestration data is often challenging. However, by estimating carbon sinks through the inversion of Net Primary Productivity (NPP), it is possible to acquire detailed information on vegetation growth and carbon sequestration capacity at regional or global scales, as well as a series of continuous time-series data [26]. Net Primary Productivity of vegetation (NPP) refers to the total amount of organic matter synthesized through photosynthesis by green plants per unit area and per unit time, minus the amount consumed by their respiration [27]. According to the chemical equation of photosynthesis in green vegetation (6CO2 + 6H2O → C6H12O6 + 6O2), it is known that every 1 kg of dry matter produced by vegetation can fix 1.63 kg of CO2. Therefore, the formula for calculating the amount of CO2 fixed by vegetation is
W C O 2 = N P P × 1.63
C a r b o n = W C O 2 × S / 10 12
In the formula, Carbon represents the vegetation carbon sink (mt), W C O 2 is the vegetation carbon sink density (g/m2), NPP represents the Net Primary Productivity of vegetation (g C/m2), S is the pixel area (m2), and 1012 is the unit conversion factor (g/mt).

2.2.2. Carbon Sequestration Efficiency Model Based on SFA

The Stochastic Frontier Analysis (SFA) method considers the potential impact of random errors on the results, enabling an unbiased and efficient estimation while analyzing the factors affecting technical efficiency. The results estimated using the Maximum Likelihood Estimation (MLE) method in SFA are consistent with large samples, making it more suitable for large-scale data analysis, and less susceptible to the influence of outliers [28]. Additionally, SFA describes the production process of individual units through the estimation of a production function, ensuring better control over the estimation of technical efficiency. Therefore, this study adopts the SFA method to calculate the carbon sequestration efficiency of forest regions. Its basic form is as follows:
Y i t = f ( X i t , β ) exp ( v i t u i t )
In the formula, Yit represents the actual carbon sequestration value of forest industrial enterprises (forestry farms) i in period t; f ( X i t , β ) represents the deterministic optimal frontier output in the stochastic production function; Xit is the input vector of production factors for forest industrial enterprises (forestry farms) i in period t; and β denotes the parameters to be estimated. exp ( v i t u i t ) is the composite disturbance term of the production function, where vit is the random error term, following a normal distribution (0, σ 2 ) and uit is the technical inefficiency term, following a truncated normal distribution. t indicates the year, and i represents the forest industrial enterprises (forestry farms). The carbon sequestration efficiency of forest industrial enterprises (forestry farms) is expressed as the ratio of the expected output to the Stochastic Frontier expectation:
T E i t = E [ f ( X i t , β ) exp ( v i t u i t ) ] E [ f ( X i t , β ) exp ( v i t u i t ) | u i t = 0 ] = exp ( u i t )
In the formula, TEit represents the carbon sequestration efficiency of forest industrial enterprises (forestry farms) i in period t. Other variables are as defined above.

2.2.3. Carbon Sequestration Potential Estimation Model Based on Benchmarking Management

Due to the influence of random noise and technical inefficiency, it is difficult for real-world scenarios to reach the frontier level of the production function. When the technical inefficiency term u i t equals 0, Equation (1) can be transformed into
Y i t * = f ( X i t , β ) exp ( v i t )
In the formula, Y i t * represents the maximum carbon sequestration value of the i-th forest industrial enterprise (forestry farm) in the forest region during period t.
The carbon sequestration potential of each forest industrial enterprise (forestry farm) in the forest region can be obtained by subtracting the actual carbon sequestration value from the maximum carbon sequestration value. The formula is as follows:
P i t = Y i t * Y i t
In the formula, Pit represents the carbon sequestration potential of the forest industrial enterprise (forestry farm) i in period t. The other variables are as defined above.

2.2.4. Geographically and Temporally Weighted Regression (GTWR)

Traditional statistical models can reveal the mechanisms of efficiency improvement but often fail to capture the spatiotemporal non-stationarity of the driving mechanisms behind carbon sequestration efficiency. The Geographically Weighted Regression (GWR) model addresses the shortcomings of traditional statistical models. However, the limited number of cross-sectional samples restricts its explanatory stability, and it fails to reflect temporal variations in the analysis. In the GTWR model, the regression parameters of independent variables vary with spatiotemporal positions, allowing for a better description of the complex causal relationships between variables and effectively capturing the spatiotemporal non-stationarity of the driving mechanisms of carbon sequestration efficiency [29]. Therefore, this study adopts the GTWR model to explore the spatiotemporal response relationship of carbon sequestration efficiency in forest regions and its influencing factors. The basic formula is as follows:
T E i t = δ 0 ( o i , a i , t i ) + k = 1 δ k ( o i , a i , t i ) x i t + ε i
In the formula, o i represents the longitude of the forest industrial enterprise (forestry farm) i; a i represents the latitude of the forest industrial enterprise (forestry farm) i; ti represents the observation time of the forest industrial enterprise (forestry farm) i; T E i t represents the carbon sequestration potential value of the forest industrial enterprise (forestry farm) i; x i t represents the influencing variable in the model; ε i represents the error term estimated in the model; δ 0 ( o i , a i , t i ) represents the intercept term in the model; and δ k ( o i , a i , t i ) represents the regression coefficient of the k-th control variable for the forest industrial enterprise (forestry farm) i, which reflects the weight of the constructed function at the spatiotemporal coordinates.

2.2.5. Time Prediction of Carbon Sequestration Potential Based on the ARMA Model

The Autoregressive Moving Average (ARMA) model is one of the most commonly used models for fitting stationary time series. The ARMA model combines the strengths of the Autoregressive (AR) and Moving Average (MA) models, offering good adaptability and interpretability. It can effectively capture the periodicity and trends of data [30]. The formal representation of the ARMA model is ARMA (p,q), where p and q denote the maximum orders of the autoregressive and moving average components, respectively. To estimate an ARMA (p,q) model, it is often necessary to examine the Autocorrelation Function (ACF) and the Partial Autocorrelation Function (PACF) of the data. When p = 0, the model reduces to a Moving Average (MA) model. When q = 0, it simplifies to an Autoregressive (AR) model. The mathematical expression of the ARMA (p,q) model is
P t = ω 0 + ω 1 P t 1 + + ω p P t p + ε t + θ 1 ε t 1 + + θ q ε t q
In the formula, ε t represents white noise.

2.3. Variable Design

(1)
Selection of Input–Output Variables
The objective of this study is to calculate the carbon sequestration efficiency of forest regions, with the vegetation carbon sequestration of forest industrial enterprises (forestry farms) serving as the output indicator. Based on basic economic theory, capital, labor, and land are selected as input factors. Specifically, these include the following. (1) Output Indicator (Carbon): The vegetation carbon sequestration in state-owned forest regions serves as the output indicator. (2) Capital Input (K): Cumulative total investment is used as a proxy for capital input, calculated using the perpetual inventory method with 2000 as the base year, following the approach of Shan Haojie et al. [31]. (3) Labor Input (L): The number of on-duty employees at the end of the year is used as a substitute for labor input. (4) Land Input (N): The cumulative afforestation area, as recorded in the “China Forestry and Grassland Statistical Yearbook”, is used as a proxy for land input.
(2)
Influencing Factors of Vegetation Carbon Sequestration Efficiency
The factors influencing carbon sequestration efficiency include the following. (1) Output Value (GEP): The primary industry (primarily, timber production) and tertiary industries (mainly, forest tourism, leisure services, and forestry public management) account for the largest share of the output value of state-owned forest enterprises. These business activities not only increase the total enterprise output but also affect the carbon sequestration capacity of forest vegetation [32]. (2) Wages (Wage): Wage levels influence employee motivation and efficiency, thereby affecting vegetation carbon sequestration efficiency in various ways, making it an important factor to consider [33]. (3) Tending (Tend): The forest tending area helps adjust the age structure, species composition, and spatial structure of forest stands. Proper and reasonable forest tending can enhance the carbon stock of mature forest ecosystems and increase cumulative carbon sequestration in vegetation [34]. (4) Capital Structure (Rate): The capital structure is the ratio of state-owned capital investment (grants from central and local authorities) to the total investment amount. Capital structure significantly impacts organizational efficiency. While state investment remains a major driver of forest resource growth, inefficient government investment can reduce scale efficiency in state-owned forest regions [35]. Transforming the structure of forestry investment and balancing the proportion of social capital and state-owned capital in the total investment will have a certain impact on carbon sequestration efficiency. (5) Precipitation (Pre): Precipitation plays a key role in the terrestrial ecosystem’s water cycle and significantly affects the water balance of forest ecosystems and vegetation growth. The temporal and spatial variability in precipitation can have varying impacts on vegetation carbon sequestration, thereby influencing carbon sequestration efficiency [36]. (6) Accumulated Temperature (Temp): Changes in accumulated temperature affect material cycling processes within forest ecosystems and influence photosynthesis rates and growing seasons, thereby impacting vegetation Net Primary Productivity [37]. (7) Altitude (ASL): Higher altitudes not only reduce the likelihood of human disturbances to vegetation but also slow the decomposition of plant litter and underground dead roots due to lower temperatures. Changes in altitude can significantly impact the carbon sequestration efficiency of vegetation in state-owned forest regions [38].

2.4. Data Sources and Processing

(1)
Carbon Sequestration Data: Carbon sequestration data are calculated based on the carbon content of vegetation dry matter corresponding to Net Primary Productivity (NPP). The NPP data used in this study are derived from the MOD17A3HGF product released by NASA, based on the MODIS satellite, with a spatial resolution of 500 m. First, the data were preprocessed using MRT 2.1.10.1 and ArcGIS 10.7 software to perform tasks like mosaicking, clipping, and projection. Then, the Raster Calculator tool was used to remove outliers from the NPP data. Finally, annual NPP sequence data for China from 2000 to 2020 were obtained, with units of (g C/m2). Using the zoning maps of the 87 forest industrial enterprises (forestry farms) in the forest region, ArcGIS 10.7 was used to extract the vegetation carbon sequestration density for each forest enterprise (forestry farm) from 2000 to 2020. These values were then multiplied by the area of each forest enterprise (forestry farm) to calculate their respective carbon sequestration data.
(2)
Socioeconomic Data: Data on forest management investment, total enterprise output value, number of employees, and total wages for each forest industrial enterprise were obtained from the 2001–2021 editions of the China Forestry and Grassland Statistical Yearbook. Forest management investment and total enterprise output values were adjusted using relevant price indices.
(3)
Natural Data: Precipitation and temperature data for each forest region were obtained from the Resource and Environment Science and Data Center of the Chinese Academy of Sciences (https://www.resdc.cn/, accessed on 20 February 2025), with a resolution of 1000 m × 1000 m. The annual average precipitation and temperature of each forest enterprise (forestry farm) were extracted yearly by using ArcGIS 10.7. The accumulated temperature data were calculated by selecting daily temperatures greater than 10 °C and summing them annually. Digital Elevation Model (DEM) data were also sourced from the Resource and Environment Science and Data Center of the Chinese Academy of Sciences (https://www.resdc.cn/, accessed on 20 February 2025), with a resolution of 250 m × 250 m. The descriptive statistics of the data are shown in Table 1.

3. Results

3.1. Carbon Sequestration Efficiency Calculation for Key State-Owned Forest Regions in Northeast China and Inner Mongolia

3.1.1. Stochastic Frontier Analysis Based on the Trans-Log Production Function

The Trans-log production function is a flexible and easily estimated variable elasticity production function model that can capture substitution effects, interactions between input factors, and the impact of time variations [39]. Therefore, this study constructs a time-varying SFA model based on the Trans-log production function and uses Stata 17.0 software to calculate the carbon sequestration efficiency of forest regions. The regression results are shown in Table 2.
The model passed the Wald test at the 1% significance level, indicating that it possesses a certain degree of explanatory power. Most of the estimated parameters for the input variables passed the significance test, suggesting that the model is well-specified and capable of identifying key input variables. Additionally, the parameter η passed the 5% significance test, indicating that technical efficiency decreases over time. Therefore, a time-varying decay model is needed for parameter estimation and efficiency measurement. The parameter γ is 97.77% at the 1% significance level, suggesting that the majority of output loss is due to technical inefficiency. Only 2.23% of the output loss is attributable to random errors and other external influences.
This study employs the Trans-log production function, where the output elasticities of input factors cannot be directly inferred from the regression results. To conduct a comparative analysis of the output elasticities of carbon sequestration input factors, additional calculations based on the regression results are necessary [40]. Additional calculations based on the regression results are essential to conduct a comparative analysis of the output elasticities of carbon sequestration input factors. From the annual average values of the output elasticities, it is evident that land and capital inputs contribute to an increase in carbon sequestration output, while the output elasticity of labor is negative. This could be attributed to excessive or misallocated labor inputs in forest industrial enterprises (forestry farms). The trends in the output elasticities of capital, labor, and land from 2000 to 2020 are shown in Figure 2. The average annual values of output elasticity of capital labor and land are 0.01, −0.37, and 0.40, respectively. During the sample period, the output elasticity of land input is significantly higher than that of capital and labor inputs, indicating that land input remains the primary driver of carbon sequestration output. From the trends in the output elasticities of the three input factors, the output elasticities of land and labor exhibit an upward trend, suggesting that their contributions to carbon sequestration output are gradually increasing, while the output elasticity of capital fluctuates.
Based on the calculation method for the technical progress bias index proposed by Diamond (1965) [41], the factor bias of technical progress in forest regions is obtained, as shown in Table 3. Over the 21 years, in 95% of the forest regions, the order of factor bias in technical progress is capital, labor, and land. This indicates that, in general, forest regions have tended to substitute labor and land with capital. This suggests that the marginal productivity growth rate of capital driven by technical progress has exceeded that of labor and land. This may be attributed to differences in factor supply; since the reform and opening-up, the rate of capital accumulation in China has significantly outpaced that of labor accumulation [29]. In this context, forest regions have exhibited a preference for capital-enhancing technologies. Specifically, in 2013 and 2015, technical progress shifted towards greater labor utilization, indicative of a labor-intensive production mode in these years, characterized by labor bias.

3.1.2. Spatiotemporal Evolution of Carbon Sequestration Efficiency in Forest Regions

From a temporal perspective (Figure 3a), the carbon sequestration efficiency of each forest industry group has exhibited a continuous upward trend over time, albeit at a relatively slow pace. Between 2000 and 2020, the average carbon sequestration efficiency in forest areas was 0.353, with an annual growth rate of approximately 0.16%. In this context, forest regions have demonstrated a preference for capital-enhancing technologies. Specifically, in 2013 and 2015, technical progress shifted towards increased labor utilization, indicative of a labor-intensive production mode during these years, characterized by labor bias. From a spatial perspective (Figure 3b), the Greater Khingan Forestry Group, the Longjiang Forestry Industry Group, and the Inner Mongolia Forestry Industry Group exhibit above-average carbon sequestration efficiencies, with the Greater Khingan Forestry Group leading at 0.712, followed by the Longjiang Forestry Industry Group at 0.354 and the Inner Mongolia Forestry Industry Group at 0.380. Conversely, the Jilin Forestry Group, the Yichun Forestry Industry Group, and the Changbai Mountain Forestry Industry Group have lower efficiencies at 0.219, 0.306, and 0.200, respectively. These groups experience substantial technical efficiency losses, and enhancing technical efficiency could effectively improve carbon sequestration efficiency, thereby promoting the development of forest areas.

3.1.3. Non-Stationarity of the Driving Mechanisms of Carbon Sequestration Efficiency in Forest Regions

To ensure the robustness of the regression analysis and avoid spurious results, multicollinearity among the explanatory variables was assessed using Stata. The Variance Inflation Factor (VIF) for all variables was found to be less than two, with the average VIF also below two. These results confirm that the variables are sufficiently independent of each other, thereby ensuring the stability and reliability of the model. To compare the performance of the models, the GTWR module was implemented in ArcGIS 10.7 software, and the effectiveness of the three models—OLS, GWR, and GTWR—was tested (Table 4).
The R2 and Adj-R2 values of the GTWR model reached 0.7310 and 0.7302, respectively, indicating a higher degree of fit that surpasses the other two models. Additionally, the Residual Sum of Squares (Rss) and Akaike Information Criterion (AICc) values were relatively smaller, demonstrating better model fit and explanatory power. According to the regression results, the average regression coefficients for wages, forest tending area, total enterprise output value, and accumulated temperature were 0.0166, 0.0131, 0.0393, and 0.1637, respectively, indicating that these factors positively influence the carbon sequestration efficiency in forest regions. In contrast, the proportion of state capital investment, altitude, and precipitation had a suppressive effect on carbon sequestration efficiency, with average regression coefficients of −0.0170, −0.0715, and −0.0404, respectively (Table 5).
The factors influencing carbon sequestration efficiency in different forest regions exhibit spatiotemporal non-stationarity, requiring a localized consideration of their spatial and temporal heterogeneity. To facilitate visualization, the regression coefficients of the influencing factors in the GTWR model were averaged by forest industrial enterprises (forestry farms) and years and visualized in ArcGIS 10.7. This allowed for identification of the spatial heterogeneity of the driving mechanisms of different factors on the carbon sequestration efficiency of each forest enterprise (forestry farm) (Figure 4).
(1)
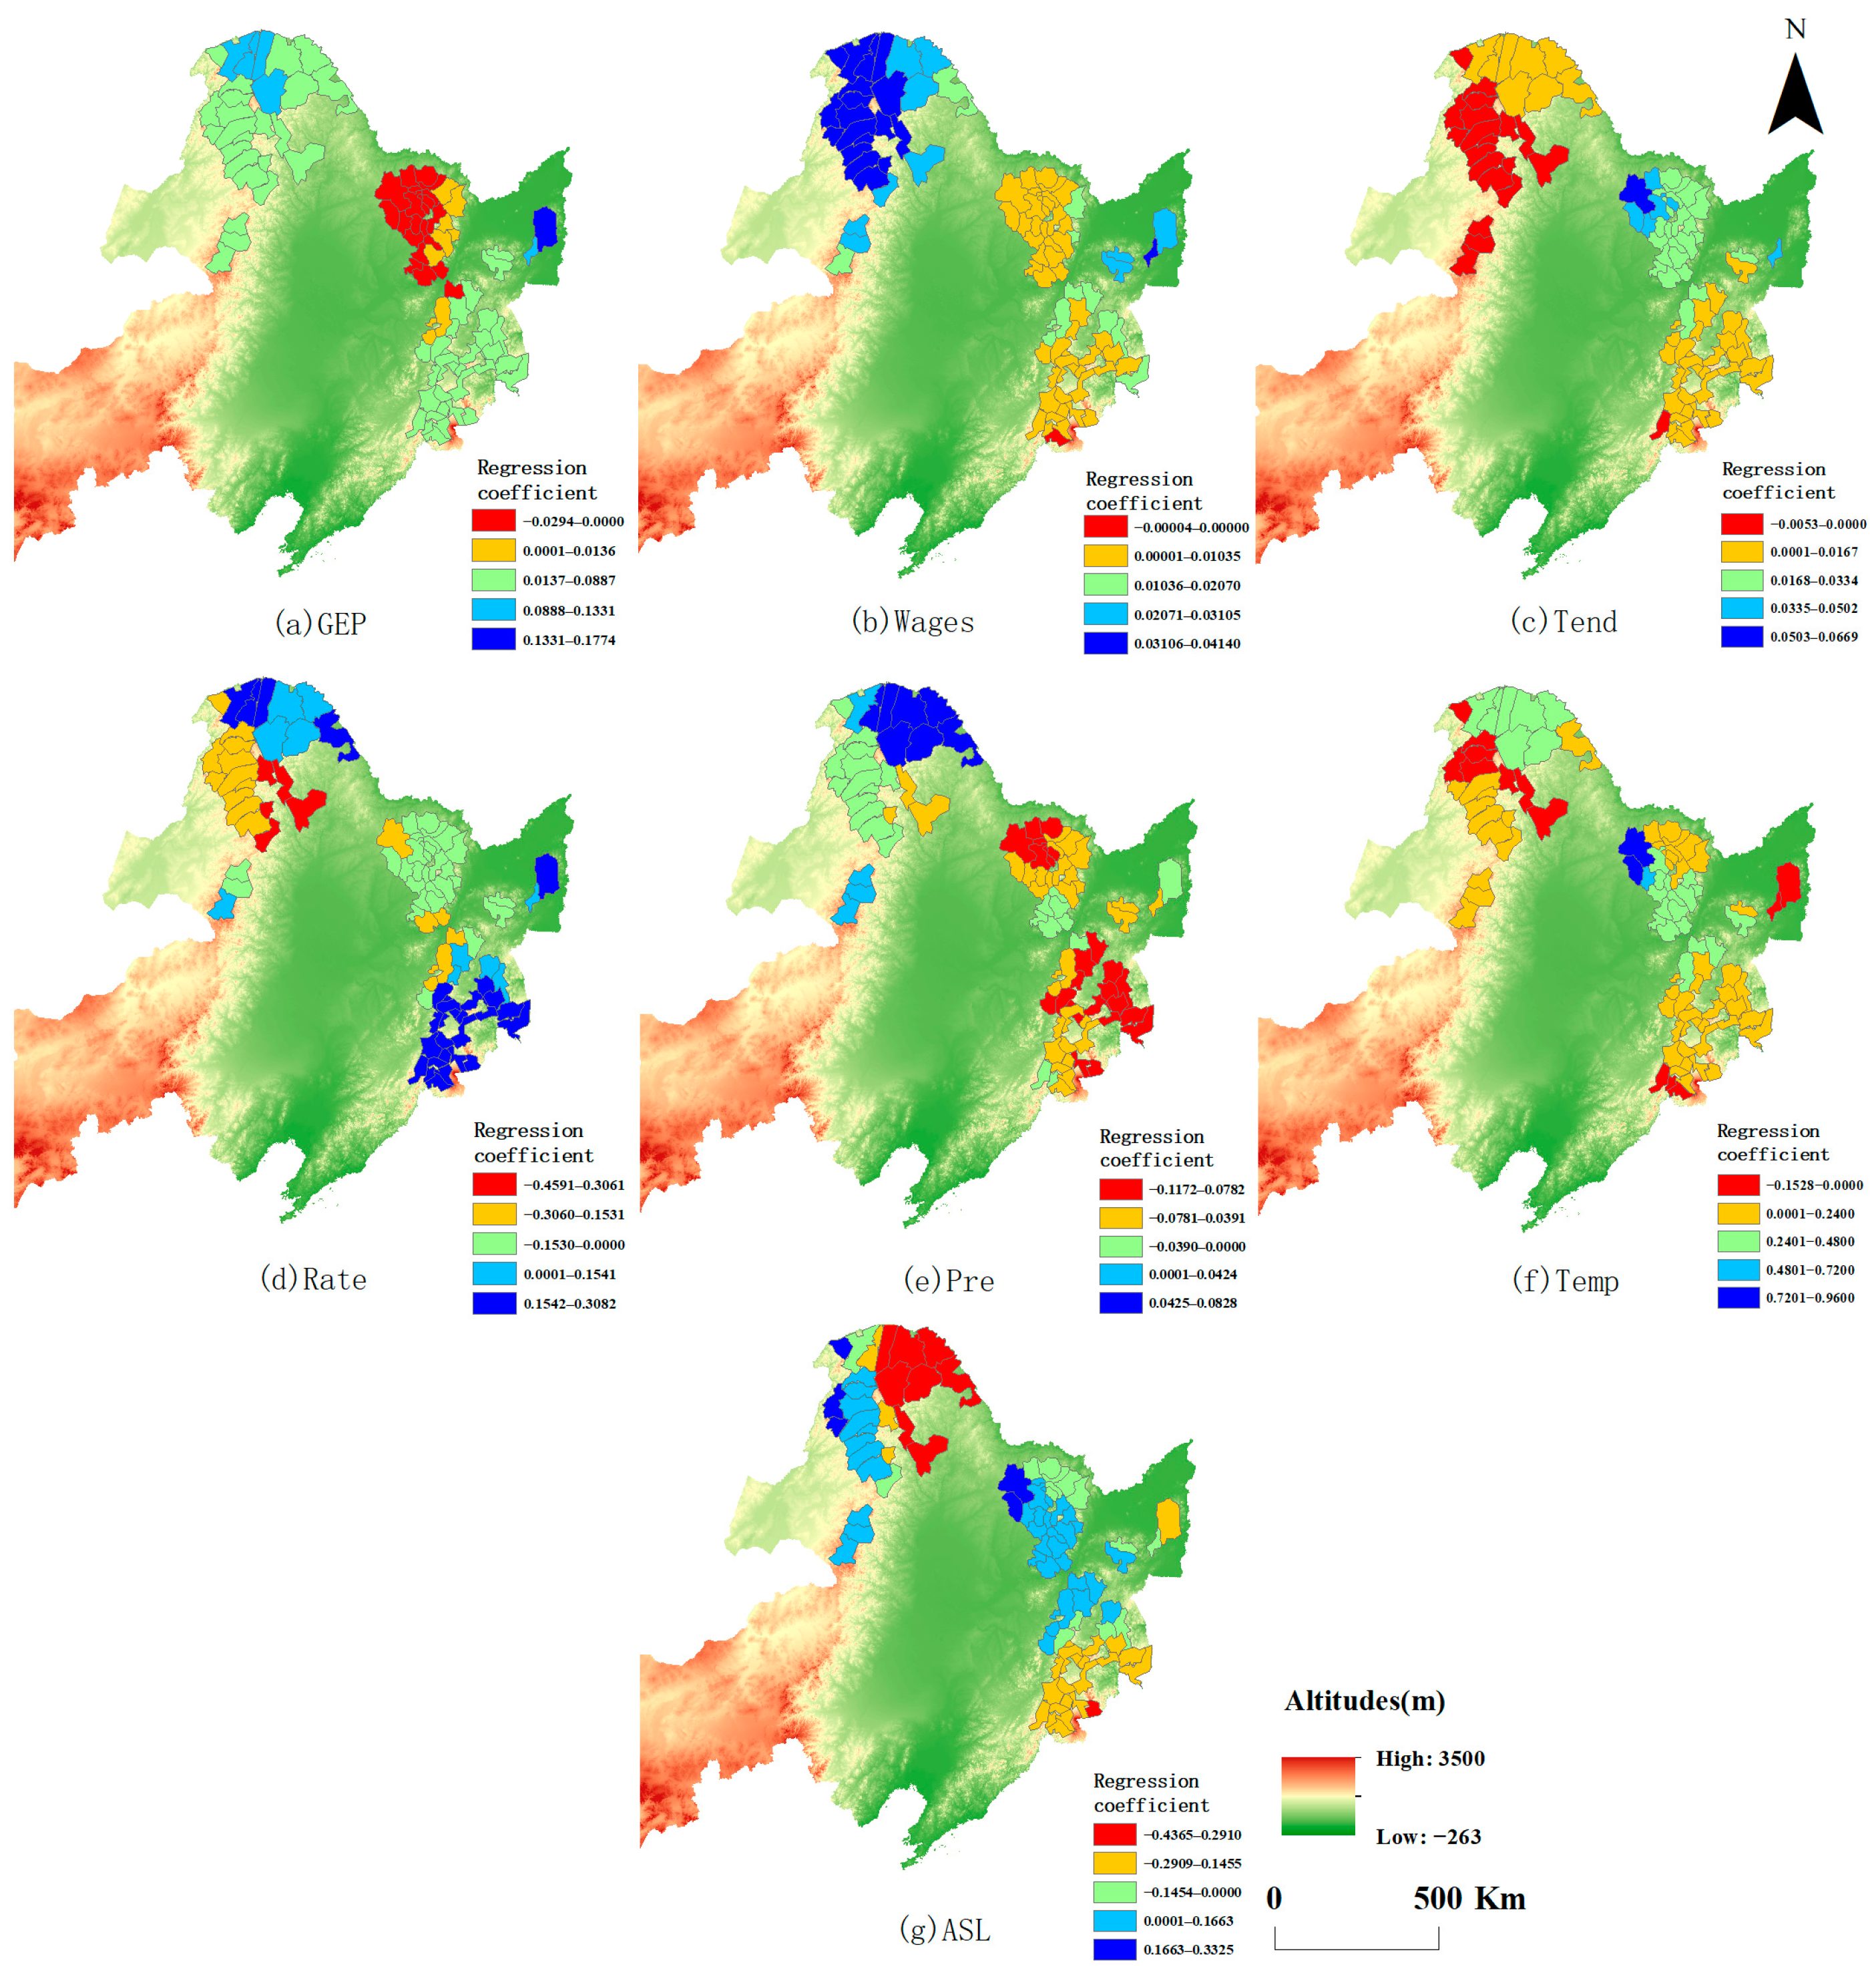
The output value positively influences the carbon sequestration efficiency of forest regions, with an average regression coefficient of 0.0393 (Figure 4a). Statistics indicate that 78.16% of forest enterprises (forestry farms) in forest regions exert a positive influence on the output value of carbon sequestration efficiency. The reason for the positive regression coefficient of total enterprise output in most areas may be that China’s forestry industry structure is gradually transitioning from the primary forestry sector to the secondary and tertiary sectors. This transition has reduced timber production while increasing forest management and protection efforts [42], thereby improving the carbon sequestration efficiency of state-owned forest regions. Regions with positive regression coefficients for output value are mainly concentrated in the northwestern part of the Greater Khingan Forestry Group and the eastern part of the Longjiang Forestry Industry Group, while areas with negative coefficients are primarily distributed among the subordinate forestry enterprises (forestry farms) of the Longjiang Forestry Industry Group and the Yichun Forestry Industry Group.
(2)
The impact of labor remuneration on the carbon sequestration efficiency of forest regions generally exhibits a “higher in the north, lower in the south” pattern (Figure 4b). The average regression coefficient of labor remuneration on carbon sequestration efficiency is 0.0166, indicating that increasing wages can boost employee motivation and enhance the carbon sequestration efficiency of state-owned forest regions. Labor remuneration positively affects carbon sequestration efficiency in 98.85% of forest enterprises (forestry farms), with high-value regions mainly concentrated in the Inner Mongolia Forestry Industry Group and the Greater Khingan Forestry Group.
(3)
The impact of forest tending on the carbon sequestration efficiency of forest regions is predominantly positive (Figure 4c) and shows a “continuous” spatial pattern. According to statistics, 77.01% of forest enterprises (forestry farms) have positive regression coefficients for the forest tending area, indicating the finding that the larger the forest tending area, the higher the carbon sequestration efficiency of the forest region. Positive-value areas are mainly distributed across forest enterprises (forestry farms) outside of the Inner Mongolia Forestry Industry Group. Tending measures, such as soil loosening, weeding, irrigation, fertilization, pruning, vine removal, and thinning, improve the survival rate of young forests, enhance the productivity of mature forests, promote tree growth, optimize tree composition, and improve tree quality [43]; they also effectively adjust tree competition, optimize community structure, and improve forest quality, ultimately influencing the carbon sequestration efficiency of forest regions.
(4)
The capital structure negatively impacts the carbon sequestration efficiency of the Inner Mongolia, Yichun, and Longjiang Forestry Industry Groups, while it positively drives the carbon sequestration efficiency of the Greater Khingan Forestry Group, Jilin, and parts of the Longjiang Forestry Industry Group (Figure 4d). According to statistical results, the average regression coefficient of capital structure related to carbon sequestration efficiency is −0.0170, with a fluctuation range of −0.4591 to 0.3081. The proportion of spatiotemporal units with positive regression coefficients is 56.32%, primarily distributed in the Jilin, Changbai Mountain, and Greater Khingan Forestry Groups. State capital investment contributes to enhancing forest resource protection, innovating management methods, and improving regulatory systems, thereby increasing the carbon sequestration efficiency of forest enterprises (forestry farms). However, in forestry farms affiliated with the Inner Mongolia, Yichun, and Longjiang Forestry Industry Groups, a higher proportion of state investment is associated with reduced carbon sequestration efficiency. This suggests that within a reasonable range, an increase in capital input positively affects carbon sequestration efficiency. However, beyond a certain threshold, other forms of capital become more significant in enhancing the carbon sequestration efficiency of forest regions.
(5)
Precipitation generally exerts a negative influence on the carbon sequestration efficiency of forest regions (Figure 4e). For 85.05% of forest enterprises (forestry farms), the regression coefficient is negative, indicating that increased precipitation tends to inhibit improvements in carbon sequestration efficiency. These areas are mainly distributed in the Yichun, Longjiang, Changbai Mountain, and Jilin Forestry Industry Groups. Precipitation affects plant growth and distribution by regulating photosynthesis, respiration, and soil organic carbon decomposition through its influence on available water. Increased rainfall reduces solar radiation, decreases photosynthesis, and increases soil carbon consumption, which is unfavorable for vegetation carbon sequestration [44]. However, in the southern parts of the Greater Khingan Forestry Industry Group and the Inner Mongolia Forestry Industry Group, increased precipitation enhances carbon sequestration efficiency. Under relatively arid conditions, moderate precipitation increases soil moisture, promotes plant metabolism, and improves carbon sequestration efficiency in forest regions.
(6)
Accumulated temperature has a predominantly positive impact on the carbon sequestration efficiency of forest regions, with an average regression coefficient of 0.1637 and a fluctuation range of −0.1528 to 0.9599 (Figure 4f). Statistical analysis indicates that 85.25% of forest enterprises (forestry farms) exhibit enhanced carbon sequestration efficiency in response to increased accumulated temperature. Temperature increases lead to changes in vegetation distribution, phenological characteristics, and factors that constrain litter decomposition, thereby affecting forest litter dynamics [45] and ultimately influencing the carbon sequestration capacity of vegetation. Additionally, higher temperatures enhance photosynthesis and nutrient utilization efficiency in trees, which increases the NPP and carbon sequestration capacity of forest vegetation. Only 14.75% of forest enterprises (forestry farms) have negative regression coefficients for accumulated temperature, mainly concentrated in the northeastern part of the Inner Mongolia Forestry Industry Group, the southern part of the Jilin Forestry Industry Group, and the eastern part of the Longjiang Forestry Industry Group.
(7)
In the northeastern parts of the Jilin Forestry Industry Group, the Changbai Mountain Forestry Industry Group, the Greater Khingan Forestry Industry Group, and the Yichun Forestry Industry Group, elevation predominantly negatively affects the carbon sequestration efficiency of 54.03% of forest enterprises (forestry farms) (Figure 4g). The trend in carbon sequestration changes around an elevation of approximately 353 m. Below this elevation, vegetation carbon sequestration increases with elevation, but, beyond this point, it begins to decrease. In high-altitude areas, as elevation increases, solar radiation intensity rises while temperature decreases, which is unfavorable for vegetation growth, leading to a reduction in carbon sequestration [46]. However, in most areas of the Inner Mongolia Forestry Industry Group, the Longjiang Forestry Industry Group, and the Yichun Forestry Industry Group, elevation has a positive impact on carbon sequestration efficiency. With the increase in altitude, the carbon sequestration efficiency of forest areas also increases. The likely reason is that as elevation increases, there is less human activity, which reduces negative interference with forest growth.

3.2. Prediction and Analysis of Carbon Sequestration Potential in Forest Regions

3.2.1. Potential Estimation

Based on Formulas (9) and (10), the carbon sequestration potential and expansion space of vegetation in forest regions from 2000 to 2020 can be calculated. For simplicity, only the carbon sequestration potential and expansion space of various forest enterprises in forest regions for 2020 are presented (Table 6).
The forest regions have significant carbon sequestration potential and expansion space. In 2020, the overall carbon sequestration potential of the forest regions was approximately 488.19 mt CO2. Through benchmarking management, the carbon sequestration potential could be enhanced by 86% from the current level. Ranked by carbon sequestration potential, the forestry industry groups are as follows: Longjiang Forestry Industry Group (130.00 mt CO2), Yichun Forestry Industry Group (125.72 mt CO2), Inner Mongolia Forestry Industry Group (95.71 mt CO2), Jilin Forestry Industry Group (56.83 mt CO2), Changbai Mountain Forestry Industry Group (56.52 mt CO2), and Greater Khingan Forestry Industry Group (23.38 mt CO2). In terms of expansion space, the Jilin Forestry Industry Group and the Yichun Forestry Industry Group exhibit the greatest potential for improvement, while the Greater Khingan Forestry Group has the smallest expansion space. As the largest key state-owned forest region in China, Greater Khingan has a high forest coverage rate and rich carbon sink reserves. It has achieved significant ecological results in forest management technologies, workforce, infrastructure, and comprehensive management, giving it unique institutional and managerial advantages, resulting in higher carbon sequestration efficiency. At the forestry farm level, regions with relatively low carbon sequestration potential include Huzhong, Jiagedaqi, Tahe, Xinlin, Dongfanghong, and Suiyang. Conversely, forestry farms, such as Heli, Shuangfeng, Wumahe, Wuying, and Dunhua, exhibit greater expansion space. By enhancing management technologies and implementing other measures, these regions can effectively unlock their carbon sequestration potential.

3.2.2. Prediction of Carbon Sequestration Potential in Forest Regions

This study employs the Autoregressive Moving Average (ARMA) model to forecast the carbon sequestration potential of forest regions for the period of 2021–2030. Before applying the ARMA model, the stationarity of the carbon sequestration potential data for the years 2000–2020 was assessed using the Augmented Dickey–Fuller (ADF) unit root test. The test results show that the t-statistic for the ADF test is −4.322 and the p-value is 0.0029, indicating that the null hypothesis of non-stationarity is rejected at the 5% significance level, thus confirming the stationarity of the data. Second, based on the autocorrelation coefficient trailing off after the first lag and the partial autocorrelation coefficient cutting off after the first lag, the model was initially set as an AR(1) model. Finally, to more accurately determine the optimal lag order for the AR model, lag orders ranging from one to four were evaluated. By calculating statistical metrics, such as the Likelihood Ratio (LR) and the Akaike Information Criterion (AIC), it was determined that a lag order of one is the optimal choice. Based on this, an AR(1) predictive model for the carbon sequestration potential of forest regions was reconstructed (Figure 5). Using the predicted values of carbon sequestration potential for 2019 and 2020 compared with the actual values, the average prediction accuracy of the model reached 0.78% and 4.08%, respectively.
From 2021 to 2030, the carbon sequestration potential in forest regions is projected to exhibit a declining trend, stabilizing around 2025. This trend is primarily attributed to improvements in carbon sequestration efficiency. By 2030, it is estimated that approximately 31.29 mt CO2 of carbon sequestration potential could be unlocked through benchmarking management. From 2021 to 2025, the release of carbon sequestration potential is relatively significant, with an average annual potential of 6.10 mt CO2. However, between 2025 and 2030, the remaining potential that can be released is approximately 0.15 mt CO2, and further improvements in carbon sequestration levels cannot be achieved solely through benchmarking management. Instead, external and effective driving mechanisms must intervene to enhance the carbon sequestration efficiency of forest regions.

4. Conclusions and Implications

4.1. Conclusions

This study investigated the carbon sequestration capacity of forest regions. First, the Stochastic Frontier model based on the Trans-log production function was used to calculate the carbon sequestration efficiency of forest regions. Second, the Geographically and Temporally Weighted Regression (GTWR) model was employed to identify the spatiotemporal non-stationary variations in the driving mechanisms. Finally, the Autoregressive Moving Average model (ARMA) was applied to predict the carbon sequestration potential of forest regions. The main conclusions are as follows:
(1)
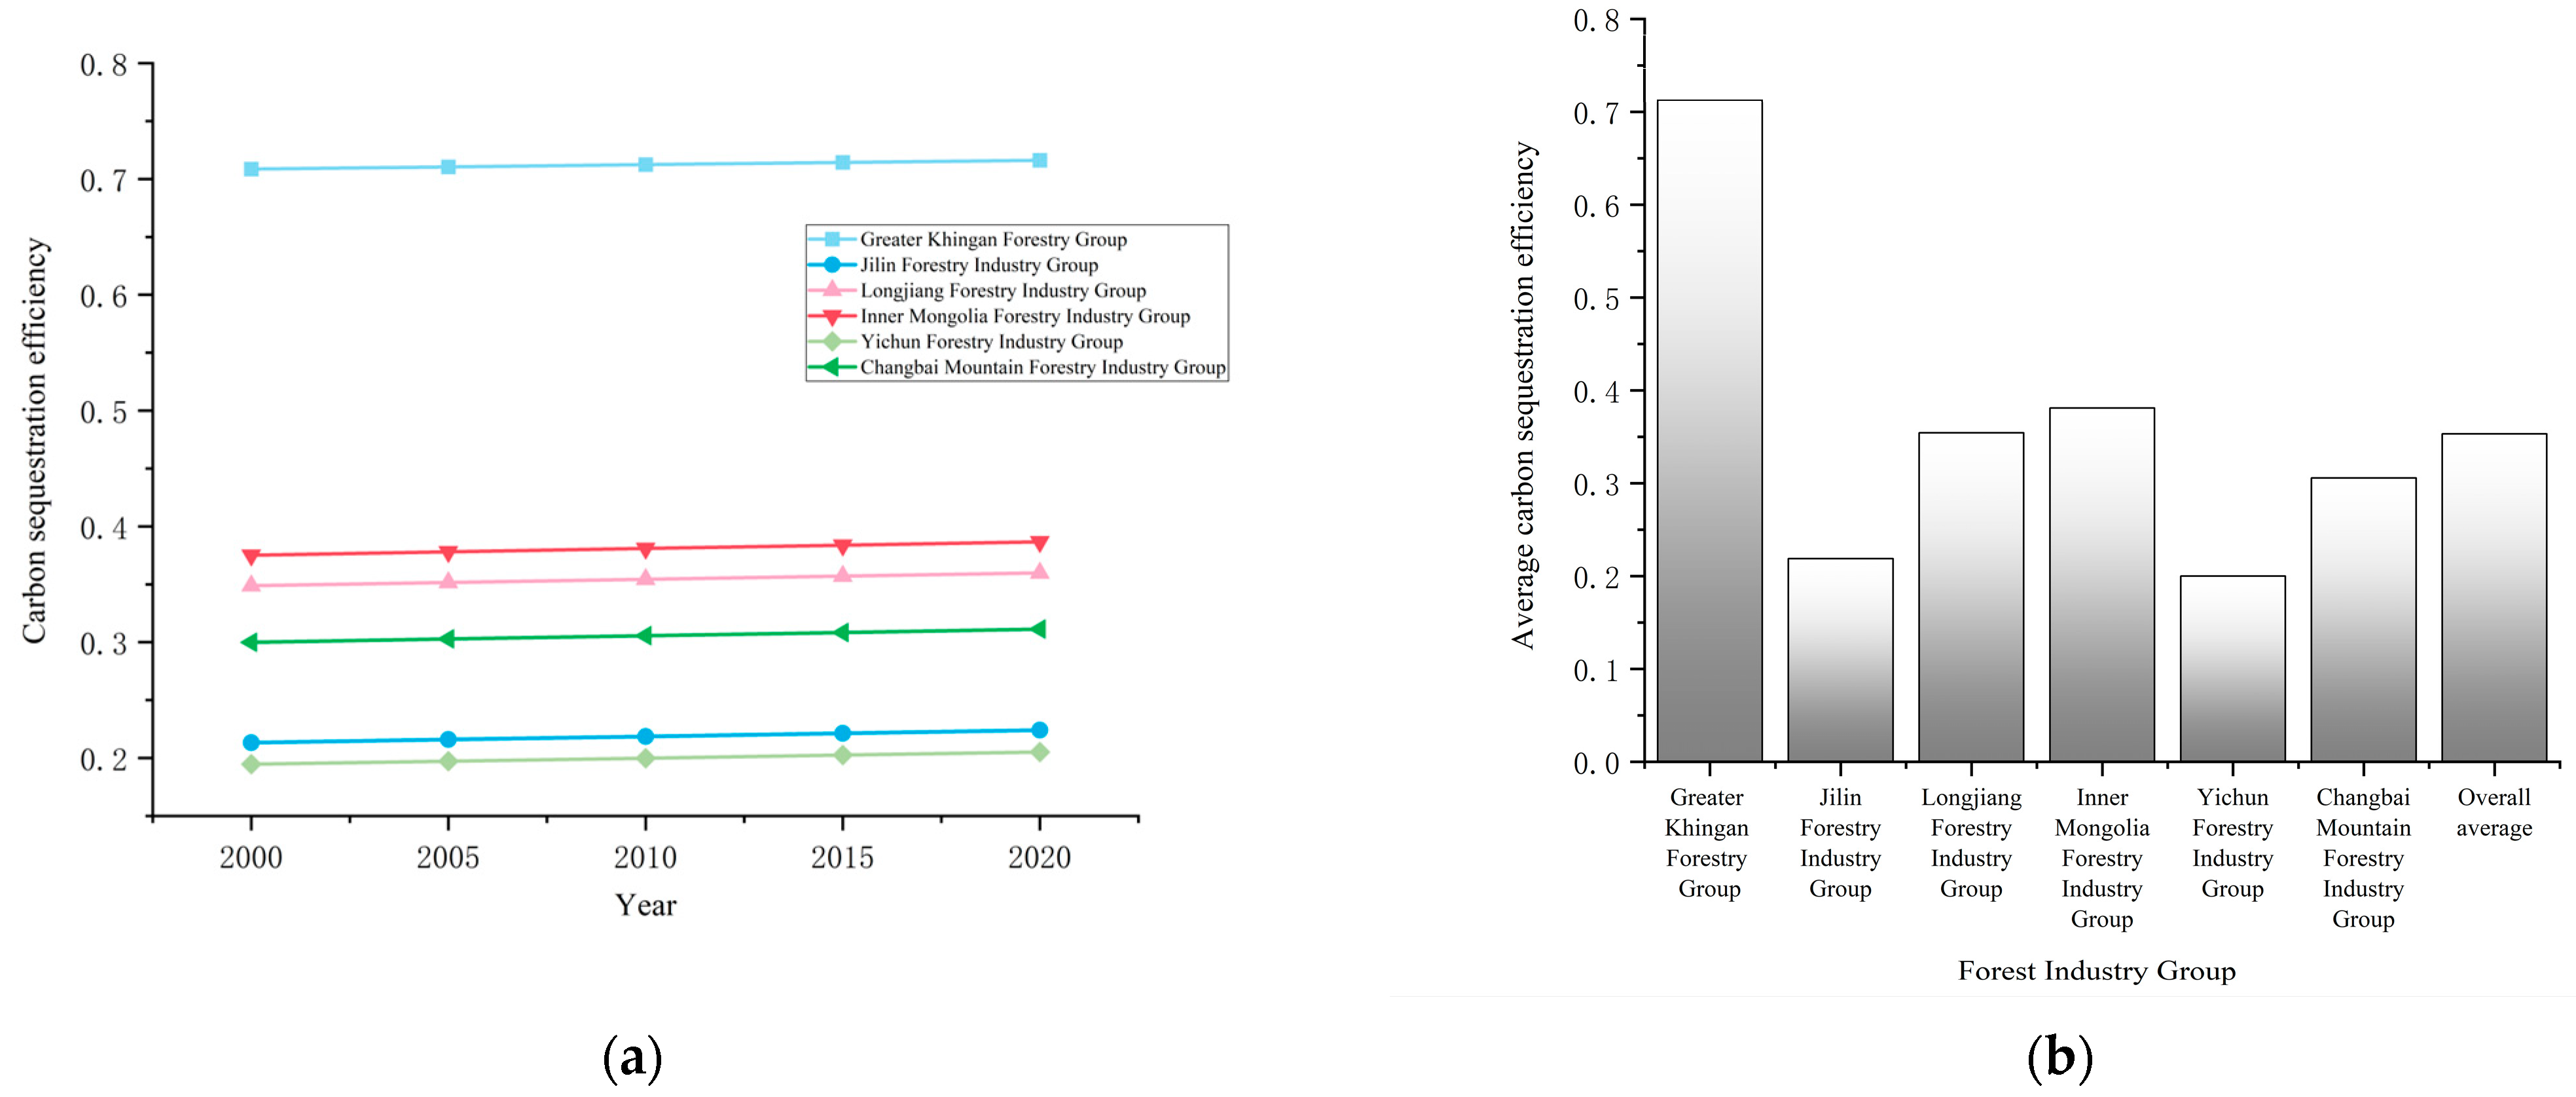
From 2000 to 2020, the annual average carbon sequestration efficiency in forest regions exhibited a growing trend, yet substantial spatial heterogeneity was observed. The average carbon sequestration efficiency across forest regions was 0.353, with an annual growth rate of 0.15%. Among the six major forestry groups, the Greater Khingan Forestry Group had the highest average carbon sequestration efficiency at 0.712, while the Jilin Forestry Industry Group had the lowest efficiency. The majority of forest enterprises (forestry farms) exhibit considerable potential for improving carbon sequestration efficiency, with 70.39% of forest enterprises falling within the medium to low efficiency range.
(2)
The factors influencing the carbon sequestration efficiency of forest enterprises (forestry farms) in forest regions exhibit significant spatiotemporal heterogeneity. Among them, factors like output value, labor remuneration, forest tending, and accumulated temperature mainly have a positive driving effect on carbon sequestration efficiency, while capital structure, altitude, and precipitation primarily exert a negative inhibitory effect. Additionally, the impact of these factors shows a “clustered” spatial pattern.
(3)
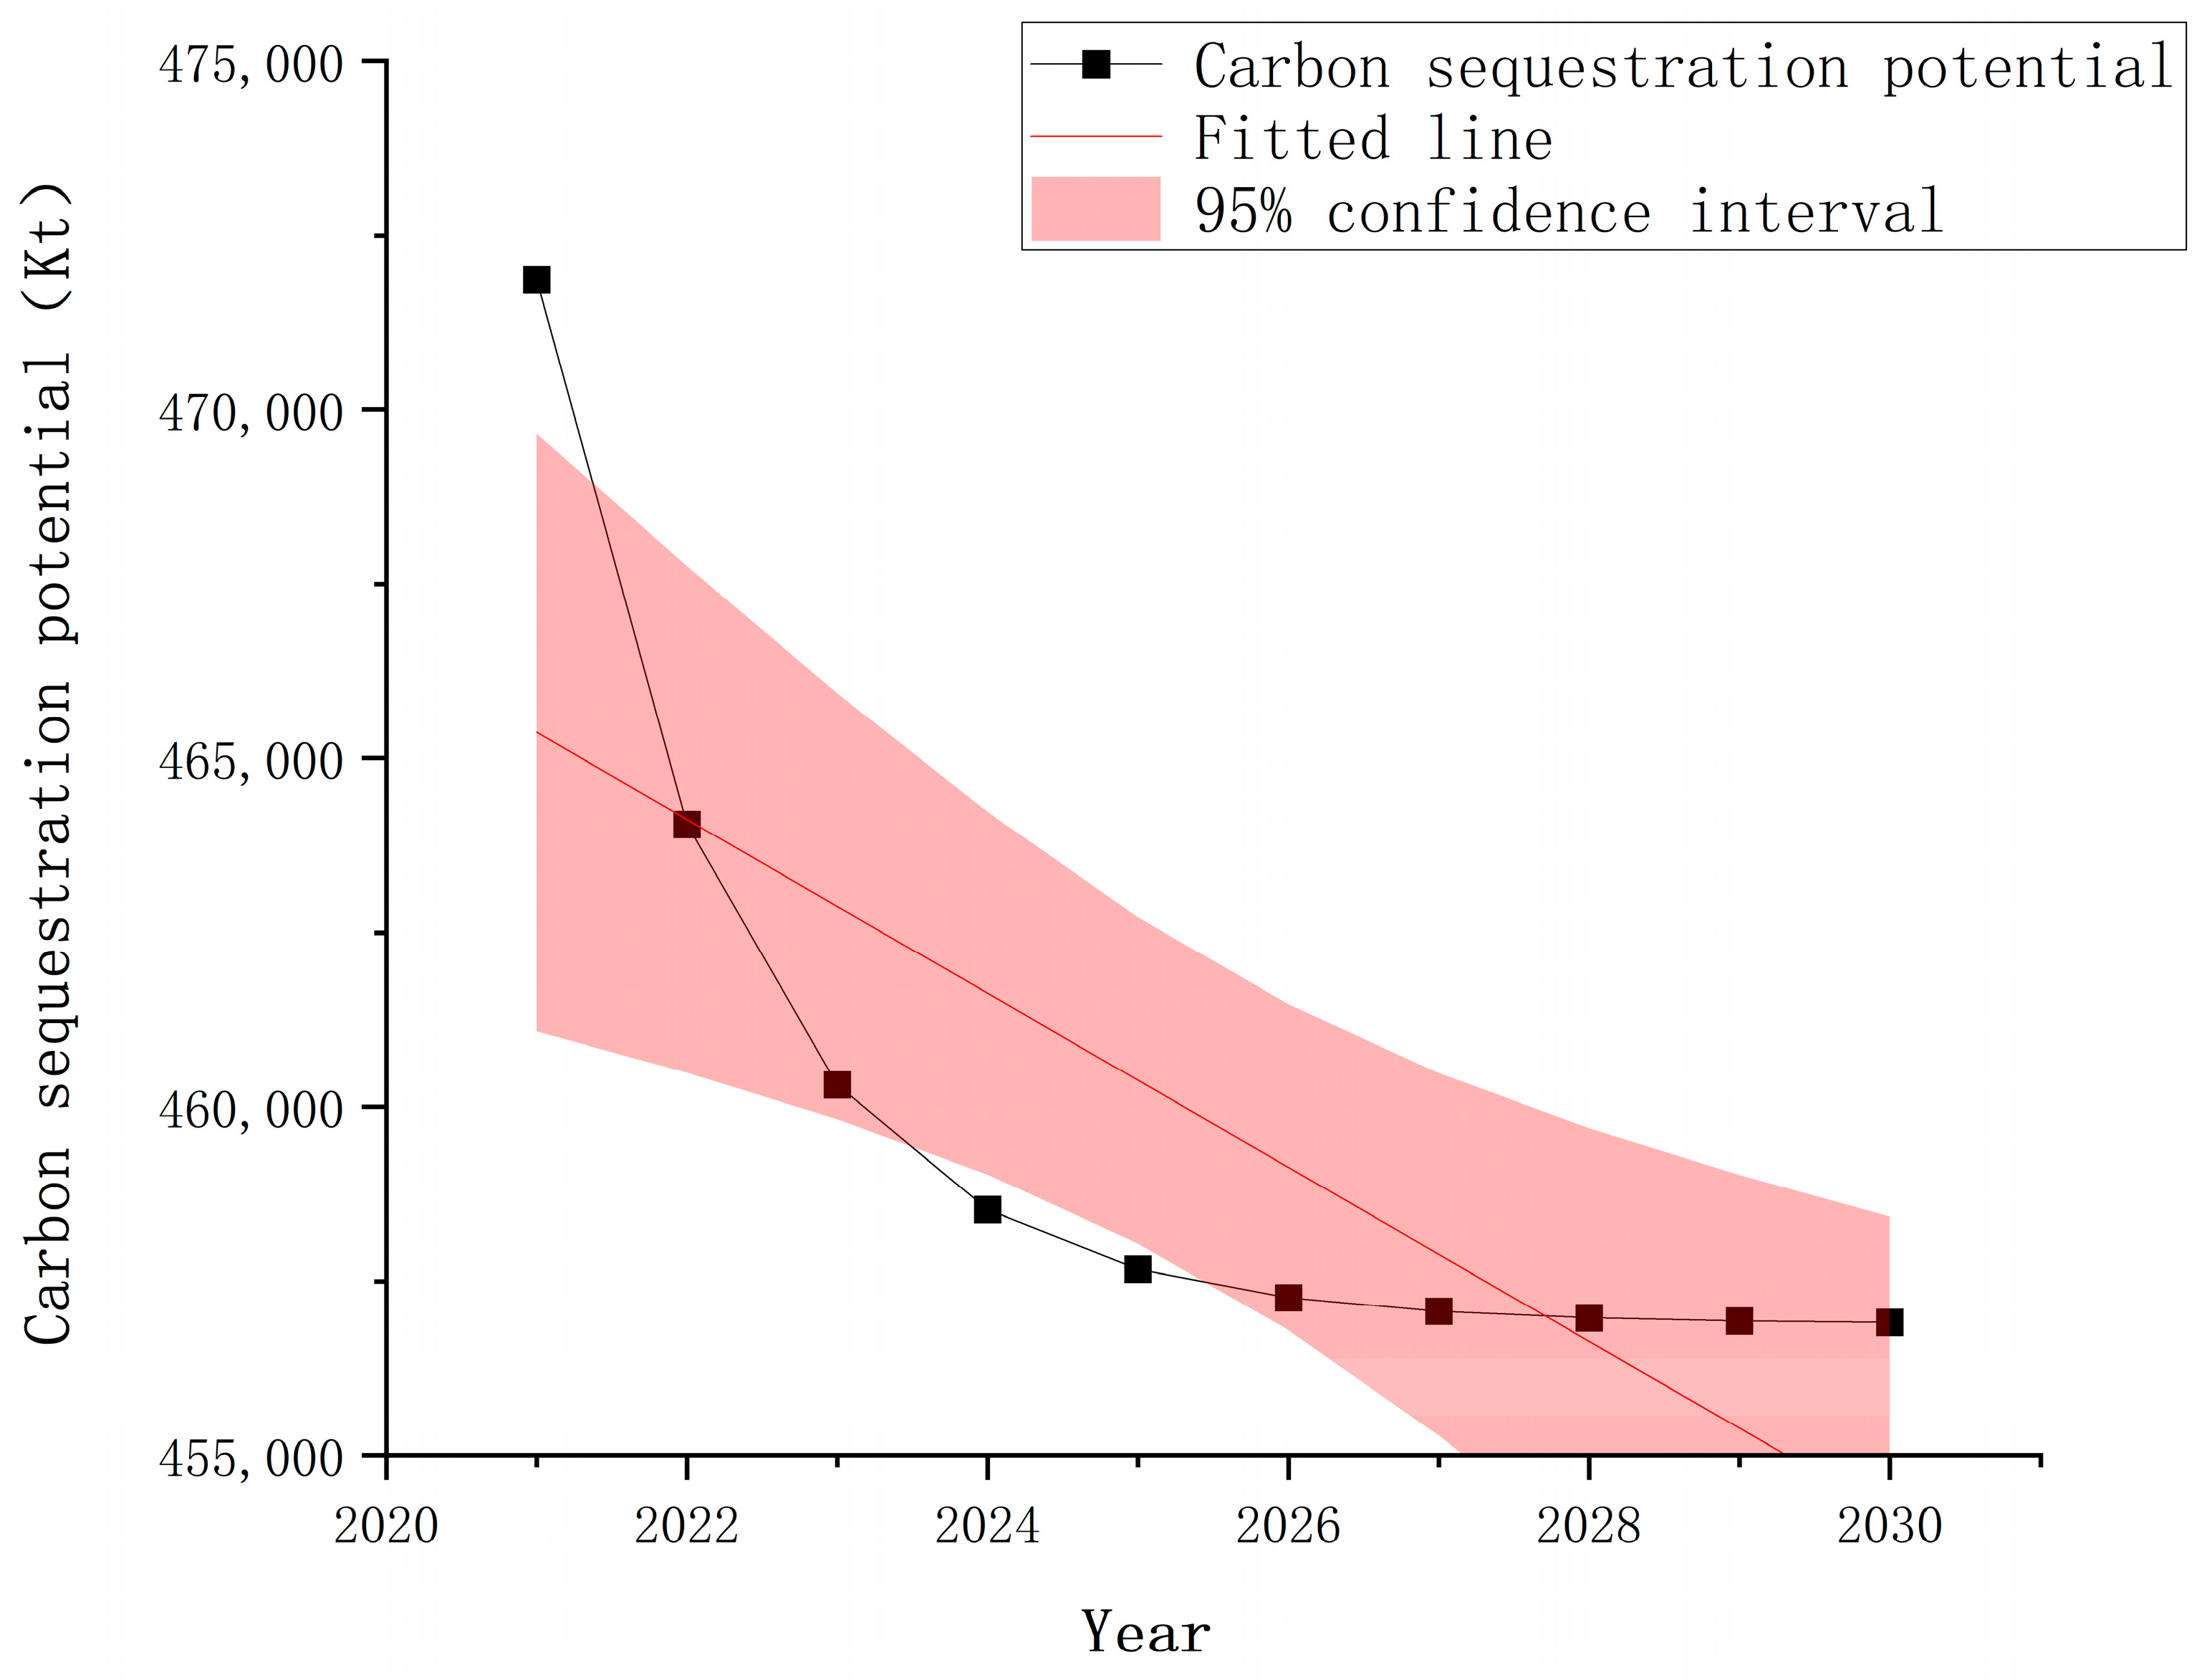
Forest enterprises (forestry farms) in forest regions exhibit substantial potential for carbon sequestration and possess considerable capacity for expansion. Through benchmarking management, a total carbon sequestration potential of 31.29 mt CO2 can be unlocked. Among the forestry industry groups, the Jilin Forestry Industry Group and the Yichun Forestry Industry Group have the largest expansion space, followed by the Longjiang, Changbai Mountain, and Inner Mongolia Forestry Industry Groups, while the Greater Khingan Forestry Group has the smallest expansion space. Regions with relatively low carbon sequestration potential include Huzhong, Jiagedaqi, Tahe, Xinlin, Dongfanghong, and Suiyang forest enterprises (forestry farms). From 2021 to 2030, the carbon sequestration potential in forest regions is expected to decrease annually at a declining rate, with the potential predicted to reach 456.91 mt CO2 by 2030. However, this will require reliance on external driving mechanisms to be fully realized.

4.2. Implications

This article provides important insights for optimizing state-owned forest regions’ management, improving forest quality, enhancing carbon sequestration capacity, and advancing China’s goal of achieving carbon neutrality.
(1)
Implement sustainable forest management tailored to local conditions. By adopting scientific methods and measures, the productivity and diversity of forest ecosystems can be enhanced while protecting and strengthening the ecological carbon sequestration functions of forests. Forest regions located in Jilin, Heilongjiang, and Inner Mongolia face significant variations in natural conditions and socioeconomic factors, which necessitate the adoption of location-specific strategies. These strategies should be aimed at enhancing carbon sequestration through sustainable forest management, improving carbon sequestration efficiency, and promoting the release of carbon sequestration potential in forest regions.
(2)
Promote the participation of social capital in forest management and optimize the capital structure of forest areas. An inadequate investment structure leads to lower carbon sequestration efficiency. Forest areas should actively attract social capital, such as non-governmental organizations, social groups, and private enterprises, to invest in forestry land and construction while innovating the organizational models of forest management and operations. This approach is essential for improving the efficiency and sustainability of forest resource utilization.
(3)
Utilize market mechanisms and trading platforms and incentivize societal participation in carbon sequestration and emission reduction efforts in forest regions. Market mechanisms are essential for motivating greenhouse gas emission reductions and enhancing carbon sequestration capabilities. Through mandatory and voluntary carbon trading markets, various stakeholders can effectively contribute to achieving carbon sequestration and emission reduction targets in forest regions.

Author Contributions

Conceptualization, Z.D. and S.Y.; methodology, software, data curation, writing—original draft preparation, Z.D. and X.S.; writing—review and editing, S.L. and X.S.; supervision, S.Y. and S.L.; funding acquisition, Z.D. All authors have read and agreed to the published version of the manuscript.

Funding

This research was funded by the National Natural Science Foundation of China (Project No. 72303099), Innovation Team of the Guangdong Hong Kong Macao Greater Bay Area Smart Health and Elderly Care Industry Research Center Team (Project No. 2024WCXTD017) and the Scientific Research Fee for Metasequoia Teachers of Nanjing Forestry University (Project No.163060201).

Data Availability Statement

The data presented in this study are available upon request from the corresponding author.

Acknowledgments

We are grateful for the very helpful comments provided by all reviewers.

Conflicts of Interest

The authors declare no conflicts of interest.

References

  1. Liu, X.M.; Wang, C.; Gao, J.X.; Liu, X.M.; Wang, C.; Gao, J.X.; Yan, J.F.; Huang, Y.; Wang, B.; Peng, Y. Pathways to Enhance Carbon Sequestration in China’s Plantation Ecosystems to Serve the Dual-Carbon Goals. Acta Ecol. Sin. 2023, 43, 5662–5673. [Google Scholar]
  2. Guan, D.; Nie, J.; Zhou, L.; Chang, Q.; Cao, J. How to Simulate Carbon Sequestration Potential of Forest Vegetation? A Forest Carbon Sequestration Model Across a Typical Mountain City in China. Remote Sens. 2023, 15, 5096. [Google Scholar] [CrossRef]
  3. Ke, S.; Qiao, D.; Zhang, X.; Feng, Q. Changes of China’s Forestry and Forest Products Industry over the Past 40 Years and Challenges Lying Ahead. For. Policy Econ. 2021, 123, 102352. [Google Scholar] [CrossRef]
  4. Liu, S.; Liu, X.; Ding, Z.; Yao, S. Impact of the management scale on the technical efficiency of forest vegetation carbon sequestration: A case study of state-owned forestry enterprises in Northeast China. Remote Sens. 2022, 14, 5528. [Google Scholar] [CrossRef]
  5. Liang, C.; Wei, X.; Meng, J.; Chen, W. How to improve forest carbon sequestration output performance: An evidence from state-owned forest farms in China. Forests 2022, 13, 778. [Google Scholar] [CrossRef]
  6. Yu, G.R.; Wang, Q.F.; Liu, Y.C.; Liu, Y.H. Conceptual Framework and Scientific Basis for Quantitative Certification of Carbon Sequestration Rates and Potential in Terrestrial Ecosystems at Regional Scale. Prog. Geogr. 2011, 30, 771–787. [Google Scholar]
  7. Fang, J.Y.; Chen, A.P.; Peng, C.H.; Zhao, S.; Ci, L. Changes in Forest Biomass Carbon Storage in China Between 1949 and 1998. Science 2001, 292, 2320–2322. [Google Scholar] [CrossRef]
  8. Zhou, G.S.; Wang, Y.H.; Jiang, Y.L.; Yang, Z. Estimating Biomass and Net Primary Production from Forest Inventory Data: A Case Study of China’s Larix Forests. For. Ecol. Manag. 2002, 169, 149–157. [Google Scholar] [CrossRef]
  9. Thomas, S.; Malczewski, G.; Saprunoff, M. Assessing the Potential of Native Tree Species for Carbon Sequestration Forestry in Northeast China. J. Environ. Manag. 2007, 85, 663–671. [Google Scholar] [CrossRef]
  10. Tan, Z.H.; Zhang, Y.P.; Schaefer, D.; Yu, G.R.; Liang, N.; Song, Q.H. An Old-Growth Subtropical Asian Evergreen Forest as a Large Carbon Sink. Atmos. Environ. 2011, 45, 1548–1554. [Google Scholar] [CrossRef]
  11. Yan, J.H.; Zhang, Y.P.; Yu, G.R.; Zhou, G.; Zhang, L.; Li, K.; Tan, Z.; Sha, L. Seasonal and Inter-Annual Variations in Net Ecosystem Exchange of Two Old-Growth Forests in Southern China. Agric. For. Meteorol. 2013, 182, 257–265. [Google Scholar] [CrossRef]
  12. Lewis, S.L.; Lopez-Gonzalez, G.; Sonke, B.; Affum-Baffoe, K.; Baker, T.R.; Ojo, L.O.; Phillips, O.L.; Reitsma, J.M.; White, L.; Comiskey, J.A.; et al. Increasing Carbon Storage in Intact African Tropical Forests. Nature 2009, 457, 1003–1006. [Google Scholar] [CrossRef] [PubMed]
  13. Liu, Y.C.; Yu, G.R.; Wang, Q.F.; Zhang, Y.; Xu, Z. Estimation of Forest Carbon Capacity and Sequestration Potential in China Based on Biomass Integration Analysis of Mature Forests. Sci. China Life Sci. 2015, 45, 210–222. [Google Scholar]
  14. Chen, K.Y.; Wang, J.K.; He, Y.J.; Zhang, L. Assessment of Forest Carbon Storage and Sequestration Potential in the Key State Forest Area of the Greater Khingan Range, Heilongjiang. J. Environ. Ecol. 2022, 31, 1725–1734. [Google Scholar]
  15. Yin, R.; Zhang, D.; Xu, X.; Yao, S.; Zhang, J.; Hou, X. A Novel Similar Habitat Potential Model Based on Sliding-Window Technique for Vegetation Restoration Potential Mapping. Land Degrad. Dev. 2020, 32, 2101–2114. [Google Scholar]
  16. Strange, N.; Bogetoft, P.; Aalmo, G.O.; Talbot, B.; Holt, A.H.; Astrup, R. Applications of DEA and SFA in Benchmarking Studies in Forestry: State-of-the-Art and Future Directions. Int. J. For. Eng. 2021, 32, 87–96. [Google Scholar] [CrossRef]
  17. Moutinho, V.; Madaleno, M.; Macedo, P. The effect of urban air pollutants in Germany: Eco-Efficiency analysis through fractional regression models applied after DEA and SFA efficiency predictions. Sustain. Cities Soc. 2020, 59, 102204. [Google Scholar] [CrossRef]
  18. Moutinho, V.; Madaleno, M.; Macedo, P.; Robaina, M.; Marques, C. Efficiency in the European agricultural sector: Environment and resources. Environ. Sci. Pollut. Res. 2018, 25, 17927–17941. [Google Scholar] [CrossRef]
  19. Liu, H.; Liu, H.; Geng, L. Analysis of Industrial Water Use Efficiency Based on SFA–Tobit Panel Model in China. Sustainability 2024, 16, 8708. [Google Scholar] [CrossRef]
  20. Li, Y.; Yan, B.; Qin, Y.; Shi, W.; Yan, J. Analysis of the Types of Animal Husbandry and Planting That Influence Household Biogas in Rural China. J. Clean. Prod. 2022, 332, 130025. [Google Scholar] [CrossRef]
  21. Li, S.S.; Ma, Y.Q. The Impact of Environmental Regulation on the Decomposition Factors of Total Factor Carbon Emission Efficiency: A Perspective Based on Threshold Effects. J. Shanxi Financ. Econ. Univ. 2019, 41, 50–62. [Google Scholar]
  22. Huang, B.; Wu, B.; Barry, M. Geographically and Temporally Weighted Regression for Modeling Spatio-Temporal Variation in House Prices. Int. J. Geogr. Inf. Sci. 2010, 24, 383–401. [Google Scholar] [CrossRef]
  23. Wu, S.; Wang, Z.; Du, Z.; Huang, B.; Zhang, F.; Liu, R. Geographically and Temporally Neural Network Weighted Regression for Modeling Spatiotemporal Non-Stationary Relationships. Int. J. Geogr. Inf. Sci. 2020, 35, 582–608. [Google Scholar] [CrossRef]
  24. Hu, J.; Zhang, J.; Li, Y. Exploring the spatial and temporal driving mechanisms of landscape patterns on habitat quality in a city undergoing rapid urbanization based on GTWR and MGWR: The case of Nanjing, China. Ecol. Indic. 2022, 143, 109333. [Google Scholar] [CrossRef]
  25. Feng, D.W.; Liu, X.Y.; Cao, Y.K. Study on the Latecomer Advantage of Key State Forest Areas under the “Dual-Carbon” Goals. Stud. Theor. Pract. 2022, 04, 148–152. [Google Scholar]
  26. Ke, J.; Zhou, D.; Hai, C.; Yu, Y.; Hao, J.; Li, B. Temporal and spatial variation of vegetation in net primary productivity of the shendong coal mining area, inner Mongolia autonomous region. Sustainability 2022, 14, 10883. [Google Scholar] [CrossRef]
  27. Shi, Z.Y.; Wang, Y.T.; Zhao, Q.; Zhang, L.; Zhu, C. Analysis of the Spatiotemporal Variations and Driving Mechanisms of Vegetation Net Primary Productivity in China from 2001 to 2020. J. Environ. Ecol. 2022, 31, 2111–2123. [Google Scholar]
  28. Chen, C.L.; Ma, Z.Z.; Shan, J.Q. Technological Progress Bias, Factor Allocation Efficiency, and Industrial Structure Upgrading in China. Ind. Econ. Rev. 2021, 12, 47–58. [Google Scholar]
  29. Zhang, Z.; Li, J.; Fung, T.; Yu, H.; Mei, C.; Leung, Y.; Zhou, Y. Multiscale Geographically and Temporally Weighted Regression with a Unilateral Temporal Weighting Scheme and Its Application in the Analysis of Spatiotemporal Characteristics of House Prices in Beijing. Int. J. Geogr. Inf. Sci. 2021, 35, 2262–2286. [Google Scholar] [CrossRef]
  30. Wang, Z.J.; Wang, B.H. Forecasting of Retail Sales of Consumer Goods Based on the ARMA Model. Stat. Decis. 2014, 11, 77–79. [Google Scholar]
  31. Shan, H.J. Re-Estimation of China’s Capital Stock K: 1952–2006. Quant. Econ. Tech. Econ. Stud. 2008, 25, 17–31. [Google Scholar]
  32. Li, M. Carbon Stock and Sink Economic Values of Forest Ecosystem in the Forest Industry Region of Heilongjiang Province, China. J. For. Res. 2022, 33, 875–882. [Google Scholar] [CrossRef]
  33. Yildirim, I.; Han, M. Determining the Motivation Levels of Employees in the Forest Products Industry. BioResources 2023, 18, 7856–7876. [Google Scholar] [CrossRef]
  34. Wu, S.; Li, J.; Zhou, W.; Lewis, B.J.; Yu, D.; Zhou, L.; Jiang, L.; Dai, L. A Statistical Analysis of Spatiotemporal Variations and Determinant Factors of Forest Carbon Storage under China’s Natural Forest Protection Program. J. For. Res. 2018, 29, 415–424. [Google Scholar] [CrossRef]
  35. Han, X.; Frey, G.E.; Geng, Y.; Cubbage, F.W.; Zhang, Z. Reform and Efficiency of State-Owned Forest Enterprises in Northeast China as “Social Firms”. J. For. Econ. 2018, 32, 18–33. [Google Scholar] [CrossRef]
  36. Sun, Y.; Yang, F.; Huang, J.; Zheng, X.; Mamtimin, A.; Zhou, C.; Abudukade, S.; Gao, J.; Li, C.; Ma, M.; et al. Precipitation Controls on Carbon Sinks in an Artificial Green Space in the Taklimakan Desert. Adv. Atmos. Sci. 2024, 41, 2300–2312. [Google Scholar] [CrossRef]
  37. Lu, S.; Zhang, P.; Zhang, J.; Wang, R.; Hu, S.; Ma, C. Spatial Pattern and Influence Mechanisms of Forest Land Quality under the Background of Carbon Peaking and Carbon Neutrality: A Case Study in Kaizhou District, Chongqing, China. Land 2024, 13, 1645. [Google Scholar] [CrossRef]
  38. Massaccesi, L.; De Feudis, M.; Leccese, A.; Agnelli, A. Altitude and Vegetation Affect Soil Organic Carbon, Basal Respiration and Microbial Biomass in Apennine Forest Soils. Forests 2020, 11, 710. [Google Scholar] [CrossRef]
  39. Zhong, M.R.; Cao, M.Y.; Zou, H. The Carbon Reduction Effect of ICT: A Perspective of Factor Substitution. Technol. Forecast. Soc. Chang. 2022, 181, 121754. [Google Scholar] [CrossRef]
  40. Zhang, H.; Zhang, Y.M. Does Agricultural Subsidy Improve Technical Efficiency of Grain Production?—An Empirical Study Based on the Data of 552 Grain Production Family Farms in Jiangsu Province. J. Huazhong Agric. Univ. (Soc. Sci. Ed.) 2022, 6, 58–67. [Google Scholar]
  41. Diamond, P.A. Disembodied Technical Change in a Two-Sector Model. Rev. Econ. Stud. 1965, 32, 161–168. [Google Scholar] [CrossRef]
  42. Du, Y.W.; Wan, Z.F. Evaluation of Forestry Industry Transformation Efficiency Based on DEA-Malmquist Index: A Case Study of the State Forest Region in Heilongjiang Province. J. For. Econ. 2019, 41, 32–37. [Google Scholar]
  43. Fu, Y.J.; Tian, D.; Hou, Z.Y. Research Progress on the Assessment of Global Forest Carbon Sink Function. J. Beijing For. Univ. 2022, 44, 1–10. [Google Scholar]
  44. Liu, F.; Zeng, Y.N. Spatiotemporal Patterns and Changes of Vegetation Carbon Sources/Sinks on the Qinghai Plateau from 2000 to 2015. Acta Ecol. Sin. 2021, 41, 5792–5803. [Google Scholar]
  45. Yang, Q.M.; Yuan, D.P.; Deng, C.B.; Wang, Y.; Qiao, L. Research Progress on the Net Carbon Sequestration Capacity of Plants under Carbon Neutrality. Chin. J. Ecol. 2023, 42, 1484–1496. [Google Scholar]
  46. Zu, K.L.; Wang, Z.H. Research Progress on the Response of Mountain Species Elevation Distribution to Climate Change. Biodivers. Sci. 2022, 30, 123–137. [Google Scholar] [CrossRef]
  47. Yang, J.; Qi, C.J. Research on the Export Trade Potential of Chinese Agricultural Products to Countries Along the “Silk Road Economic Belt”: An Analytical Framework Based on TPI and an Extended Stochastic Frontier Gravity Model. J. Int. Trade Issues 2020, 06, 127–142. [Google Scholar]
Figure 1. Geographic location map of 87 forest enterprises in state-owned forest regions.
Forests 16 00488 g001
Figure 2. Trends in the evolution of output elasticity in state forest regions, 2000−2020.
Forests 16 00488 g002
Figure 3. (a) Time trend of carbon sequestration efficiency in key state-owned forest regions of northeast China and Inner Mongolia, 2000–2020. (b) Spatial distribution of carbon sequestration efficiency in key state-owned forest regions in northeast China and Inner Mongolia.
Forests 16 00488 g003
Figure 4. Spatial distribution of GTWR regression coefficients for carbon sequestration efficiency in state forest regions.
Forests 16 00488 g004
Figure 5. Forecast of carbon sequestration potential in key state-owned forest regions in northeast China and Inner Mongolia, 2021–2030.
Forests 16 00488 g005
Table 1. Variable design and descriptive statistics.
StageVariable CodeVariable NamesVariable MeasurementUnitMeanStd. Dev.Obs
Efficiency MeasurementYCarbon sinksVegetation carbon sinksmt6.433.801827
KInvestmentThe total amount of cumulative investmentCNY 1089.045.011827
LLaborThe number of employees on the jobperson4589.174589.171827
NLandCumulative afforestation areahm25740.507474.581827
Influencing FactorsTeqCarbon sequestration efficiencyThe value can be determined using Equation (4) 0.350.201827
WageWageRemuneration for working staffCNY 10376,682.6250,179.951827
GEPOutputGross enterprise productCNY 10819,397.7014,145.831827
TendTendingForest tending areahm210,139.597793.861827
RateCapital structureProportion of state investment 0.790.131827
PrePrecipitationAverage precipitation of forest enterprises (forest farms)mm606.17141.761827
ASLElevationAverage elevation of forest enterprises (forest farms)m602.03228.291827
TempAccumulated temperatureAccumulated temperature of forest enterprise (forest farm) (cumulative temperature >10 °C)°C2658.89390.531827
Table 2. Stochastic Frontier estimation results.
VariableRegression CoefficientStandard Errorp-Value
lnK0.4183 ***0.14400.0040
lnL−0.6229 ***0.22100.0000
lnN−0.2445 ***0.06690.0050
t0.01000.01710.5590
(lnK)2−0.0171 *0.00910.0600
(lnN)20.0268 **0.01270.0350
(lnL)20.00180.00120.1260
t2−0.0003 **0.00020.0330
lnK × lnL−0.01650.01630.3120
lnK × lnN−0.0326 ***0.00620.0000
lnL × lnN0.0335 ***0.00820.0000
t × lnK0.0056 ***0.00210.0100
t × lnL−0.00110.00220.6020
t × lnN0.00050.00100.5880
Constant12.6400 ***1.01500.0000
μ1.1372 ***0.08870.0000
η0.0017 **0.00070.0120
γ0.9777 ***
Obs182718271827
Wald chi2 (14)200.1100 ***
Log-likelihood1466.7996
Note: ***, **, and * indicate significance at the levels of 1%, 5%, and 10%, respectively.
Table 3. Factor bias in technological progress.
YearBias—KLBias—KNBias—LNFactor Bias Order
20000.13270.13370.0010K > L > N
20010.29420.29550.0013K > L > N
20020.71770.71920.0015K > L > N
20030.53890.54040.0016K > L > N
20040.34750.34910.0016K > L > N
20050.25970.26130.0016K > L > N
20060.21890.22040.0015K > L > N
20070.19790.19940.0015K > L > N
20080.20370.20520.0015K > L > N
20090.25270.25420.0015K > L > N
20100.34210.34370.0015K > L > N
20110.54940.55100.0016K > L > N
20122.31842.32010.0017K > L > N
2013−21.3060−21.30430.0018L > N > K
20146.66936.67110.0018K > L > N
2015−11.7368−11.73490.0019L > N > K
20161.59851.60050.0020K > L > N
20170.72510.72720.0021K > L > N
20180.58510.58720.0021K > L > N
20190.39930.40140.0022K > L > N
20200.28540.28760.0022K > L > N
Table 4. OLS, GWR, and GTWR estimation results.
ModelOLSGWRGTWR
R20.19800.71000.7310
Adj-R20.20370.70940.7302
Rss59.954021.661920.1080
AICc−1041.7800−2794.6200−2911.5700
Table 5. GTWR model estimation results.
VariableMeanStd. Dev.MinMaxObs
GEP0.0393 **0.0356−0.02940.17741827
Wage0.0166 **0.01300.00000.04141827
Tend0.0131 *0.0154−0.00530.06691827
Rate−0.0170 **0.2079−0.45910.30811827
Pre−0.0404 **0.0478−0.11720.08271827
Temp0.1637 **0.1804−0.15280.95991827
Als−0.0715 ***0.1833−0.43650.33251827
Note: ***, **, and * indicate significance at the levels of 1%, 5%, and 10%, respectively.
Table 6. Carbon sequestration potential and expansion space in key state forest regions of northeast China and Inner Mongolia in 2020.
State-Owned
Forest
Regions
Carbon
Sequestration
Potential (mt)
Expansion
Space
State-Owned
Forest
Regions
Carbon
Sequestration
Potential (mt)
Expansion
Space
State-Owned
Forest
Regions
Carbon
Sequestration
Potential (mt)
Expansion
Space
Longjiang
Forestry Industry Group
130.02178.94%Tieli7.94456.85%Jilin
Forestry
Industry Group
56.83414.03%
Heli7.96820.62%Jinshantun7.77500.66%Sanchazi15.55647.13%
Suiling7.77438.05%Tangwanghe7.50533.32%Baishishan12.82412.84%
Qinghe7.76462.99%Shanggan-
ling
7.46628.01%Lushuihe6.28621.40%
Xinglong7.05246.48%Langxiang7.23287.49%Quanyang6.28600.10%
Shangyashan6.88369.12%Youhao7.04254.97%Songjianghe5.77325.95%
Weihe6.81355.41%Meixi7.01306.76%Linjiang5.54284.84%
Hailin6.79450.26%Nancha6.95233.77%Hongshi2.39161.97%
Yingchun6.76459.81%Xinqing6.23213.31%Wangou2.20226.77%
Fangzheng6.61278.64%Wuyiling5.86220.38%Changbai
Mountain
Forestry
Industry Group
56.52233.88%
Shanhetun6.24273.83%Hongxing5.84188.72%Baihe9.38312.82%
Tongbei6.22239.32%Inner
Mongolia
Forestry Industry Group
95.71157.41%Daxinggou9.00334.69%
Bamiantong5.74203.96%Keyihe7.16547.18%Dunhua7.06892.64%
Huanan5.66173.22%Yitulihe6.62625.46%Dashitou6.06377.26%
Linkou5.64179.54%Deerbuer6.21317.61%Helong5.75339.97%
Hebei5.61155.41%Aershan6.20272.84%Huangnihe5.28194.93%
Dahailin5.60207.68%Ganhe5.43199.11%Bajiazi5.14153.47%
Muling5.20163.38%Tulihe5.27181.03%Tianqiaoling3.50199.58%
Chaihe5.07137.17%Dayangshu5.22169.40%Huichun2.9459.93%
Yabuli4.43100.33%Bilahe5.20186.80%Wangqing2.42143.87%
Zhanhe3.0250.46%Moerdaoga5.167144.17%Greater Khingan Forestry Group23.3839.74%
Dongjing-
cheng
2.7947.48%Alongshan5.11192.10%Tuqiang4.25111.04%
Dongfang-
hong
2.4639.18%Alihe5.05148.66%Amuer4.0096.69%
Suiyang1.9630.48%Mangui5.01184.99%Xilinji3.0855.36%
Yichun
Forestry
Industry Group
125.72387.01%Chuoyuan4.71131.05%Shibazhan3.0358.02%
Shuangfeng8.47620.02%Kuduer4.55117.09%Songling2.6948.07%
Wumahe8.311032.17%Chuoer4.37109.82%Hanjiayuan1.9230.22%
Dailing8.16711.00%Jinhe4.18108.76%Xinlin1.8229.23%
Cuiluan8.04554.01%Wuerqihan3.9484.52%Tahe1.4821.18%
Wuying7.97893.79%Genhe3.5074.56%Jiagedaqi0.9012.52%
Taoshan7.95457.49%Jiwen2.8149.24%Huzhong0.222.90%
Note: Carbon sequestration potential = forest regions’ carbon sequestration frontier amount − actual forest carbon sequestration. Expansion space = carbon sequestration potential/actual forest carbon sequestration [47].
Disclaimer/Publisher’s Note: The statements, opinions and data contained in all publications are solely those of the individual author(s) and contributor(s) and not of MDPI and/or the editor(s). MDPI and/or the editor(s) disclaim responsibility for any injury to people or property resulting from any ideas, methods, instructions or products referred to in the content.

