Article

Spatiotemporal Evolution and Driving Mechanisms of Forest Tourism in Henan, Central China

1
College of Forestry, Henan Agricultural University, Zhengzhou 450046, China
2
Postdoctoral Research Station of Landscape Architecture, Henan Agricultural University, Zhengzhou 450046, China
3
College of Art and Design, University of Wales Trinity Saint David, Swansea SA1 8EW, UK
*
Authors to whom correspondence should be addressed.
Forests 2025, 16(3), 483; https://doi.org/10.3390/f16030483
Submission received: 14 January 2025 / Revised: 28 February 2025 / Accepted: 8 March 2025 / Published: 10 March 2025
(This article belongs to the Section Forest Economics, Policy, and Social Science)

Abstract

:
Forest tourism is a vital avenue for promoting green consumption and constitutes a significant part of ecotourism in China. Its development offers substantial economic, social, and ecological benefits. Balancing regional economic growth and ecological conservation requires analyzing its spatiotemporal evolutionary patterns and driving factors. This study established a comprehensive and dynamic index system to evaluate the forest tourism development level (FTDL) in 18 prefecture-level cities in Henan Province from 2018 to 2021. Exploratory spatial data analysis and the geographical detector model were employed to examine spatiotemporal evolution patterns and identify the underlying driving mechanisms. The key findings are as follows: (1) the temporal evolution of FTDL in Henan Province exhibited “stratified heterogeneity and small fluctuations”, while its spatial distribution followed a “high in the southwest and low in the east” pattern; (2) over time, the spatial autocorrelation of FTDL in Henan Province shifted from positive to negative, with a gradual decline in correlation strength; and (3) eight dominant drivers categorized into four groups were identified, revealing a shift in the driving forces of forest tourism in Henan Province from environmental to economic factors. This study supports the formulation of political strategies to harmonize ecological conservation and economic development.

1. Introduction

On 1 March 2024, the United Nations Environment Programme released the Global Resources Outlook 2024 report, emphasizing the need to integrate sustainable consumption into industrial transformation to address the conflict between environmental protection and economic development. In recent years, China has actively promoted green consumption, encouraging low-carbon production and lifestyles to build ecological civilization and develop new quality productive forces [1]. As living standards improve and leisure demand increases, tourism has become an integral part of modern life and a key driver of economic growth [2]. Forest tourism, a distinctive and sustainable form of tourism, has gained increasing global attention for its integration of recreation, sightseeing, and tourism in natural environments [3]. It not only meets individual travel demands and promotes green consumption but also contributes to local economic and social development [4]. Therefore, comprehensive analysis of spatiotemporal evolution and driving factors of regional forest tourism is essential. Such insights can serve as valuable references for guiding future development strategies and enhancing regional competitiveness based on local conditions.
The Millennium Ecosystem Assessment (MEA) (2005) defines four types of ecosystem services: provisioning, regulating, supporting, and cultural, making it one of the most widely referenced frameworks [5]. Forest ecosystem services, as a crucial subset, provide essential life-supporting functions, such as biodiversity conservation, habitat provision, climate regulation, air purification, and carbon sequestration [6]. Additionally, forests supply essential materials for human use, including timber, non-timber forest products (e.g., medicinal plants and resins) [7], and biomass resources that support industries, construction, and households [8]. Beyond material benefits, forests offer space for nature-based tourism, recreation, and spiritual enrichment, contributing to human well-being, education, and cultural identity [9]. Forest tourism has gradually emerged as a distinct and growing sector [10]. However, owing to the varying research perspectives and methodologies, its definition remains debatable. Some scholars define forest tourism as an appreciation of forest ecosystems [11], whereas others describe it as the direct or indirect utilization of forests for their natural and cultural attractions [12]. The synergy between forest ecosystems and forest tourism fosters a mutually reinforcing cycle. A well-preserved forest ecosystem with scenic landscapes, immersive environments, and rich cultural heritage enhances visitor satisfaction, boosts tourism sustainability, and supports regional economic growth [13]. Although forest tourism has both positive and negative impacts, adopting a conservation-oriented approach ensures economic benefits while maintaining ecological integrity [14]. To sustain the long-term appeal of forest tourism resources, stakeholders (e.g., tourism operators and governments) actively implement innovative conservation strategies rather than merely restricting visitor numbers or limiting development [13]. Furthermore, forest tourism fosters public awareness of ecosystem protection by offering direct engagement with nature and creating local employment. Additionally, its economic contributions can fund conservation initiatives such as the establishment of special funds for nature reserves and national forest parks [15].
As forest tourism remains in its developmental stage, it faces multiple challenges. Its growth exhibits significant regional heterogeneity with notable spatial disparities in development levels [16]. The lack of a systematic evaluation framework for regional forest tourism development level (FTDL) has led to a convergence in development strategies and entrenched path dependency among localities [17]. This homogenized approach not only weakens the market competitiveness of forest tourism but also fails to highlight the ecological value and cultural uniqueness of regional forest ecosystems [18], ultimately hindering its sustainable development. Therefore, to overcome these challenges, it is essential to systematically assess FTDL from multiple dimensions, including forest tourism resources [19], forest tourism market [20], socioeconomic development [21], ecological environment development [22], and local residents’ support [23]. By identifying spatiotemporal evolutionary patterns and underlying driving mechanisms, this study can provide valuable insights for local governments and stakeholders to formulate sustainable development strategies that align with regional ecological and cultural characteristics.
With the rapid development of forest tourism and its growing role in balancing economic and ecological interests, this field has garnered increasing attention. As an emerging interdisciplinary domain, forest tourism remains in an exploratory phase. In terms of research focus, scholars in the natural sciences have primarily investigated forest resources (both tangible and intangible) and their effects on human health, including immune function [24], endocrine regulation [25], blood pressure [26], and psychological well-being [27]. These studies employed experimental approaches and empirical indicators to assess the efficacy and safety of forest environments in enhancing physical and mental health [28]. In contrast, researchers in the humanities and social sciences emphasize conceptual frameworks, resource evaluation, planning and management strategies, tourist behavior patterns, and community participation mechanisms [29]. For instance, Lu and Chen [30] highlighted forest tourism resources as the foundation for its development. Darda and Bhuiyan [21] argued that socioeconomic conditions affected investment capacity and infrastructure development in the sector. Lee and Youn [31] discussed how the ecological environment supported local forest tourism and attracted visitors. Shi etc. [23] emphasized the critical role of local residents as creators, inheritors, and promoters of regional forest tourism. Methodologically, studies on FTDL have increasingly shifted from qualitative summaries to rigorous quantitative analyses. Researchers frequently employ methods such as regional climate models (REMO) [32], factor analysis, data envelopment analysis [33], stochastic multi-criteria acceptability analysis [34], preference ranking organization method for enrichment evaluations [35], and multiple regression analysis [36]. Additionally, emerging technologies, including big data mining, virtual reality (VR) [37], augmented reality (AR) [38], and artificial intelligence (AI) [39], are progressively being integrated into forest tourism research.
In summary, although significant research has been conducted on FTDL, many studies lack a comprehensive perspective, have incomplete indicator systems, and rely on singular research methods, leading to fragmented findings [40]. Additionally, much of the existing research is based on static data [10,41], neglecting the role of relative competitiveness and long-term trends in shaping FTDL evolution. Given the regional heterogeneity of FTDL, several key questions arise. What are the spatial distribution characteristics of FTDL? How has its evolutionary trajectory developed over time? What underlying mechanisms drive these patterns, and do they align with traditional perceptions? These questions are not only critical for forest tourism stakeholders and policymakers but also form the core research focus of this study. Compared with static assessments, dynamic evaluations based on historical data offer a more comprehensive understanding of FTDL [42]. By conceptualizing the components of regional forest tourism as an integrated and iterative feedback process, FTDL is framed as a dynamic transition rather than a static, isolated state for management purposes [30]. Based on this approach, it is essential for local decision-makers to implement a systematic framework for assessing FTDL and identifying its spatiotemporal evolution and underlying mechanisms from a holistic perspective to tailor forest tourism strategies to local conditions effectively. Furthermore, most existing studies on FTDL have focused on developed regions [43], with limited attention given to developing areas. Henan Province, an economically developing region in central China, remains particularly understudied. As a traditional agricultural province, Henan faces the dual challenges of economic modernization and ecological conservation [44]. However, with forest coverage reaching 25.47% in 2024 and rich cultural heritage, forest tourism in Henan has experienced steady growth in recent years, serving as a strategic pathway for rural revitalization and ecological sustainability.
Therefore, this study focused on 18 prefecture-level cities in Henan Province using dynamic data from 2018 to 2021. FTDL was systematically investigated through quantitative assessment, spatiotemporal evolution analysis, and the identification of driving forces. The objectives of this study were to (1) develop a comprehensive and dynamic indicator system to assess FTDL in each prefecture-level city from 2018 to 2021; (2) identify the spatiotemporal distribution pattern of FTDL across the 18 prefecture-level cities using exploratory spatial data analysis; and (3) reveal and generalize the driving mechanisms behind the spatiotemporal evolution of FTDL employing geographical detector model. The findings can provide a theoretical foundation and decision-making support for forest tourism planning, policy formulation, and high-quality regional tourism development, ultimately promoting sustainable development of both forest tourism and the economy in Henan Province.

2. Materials and Methods
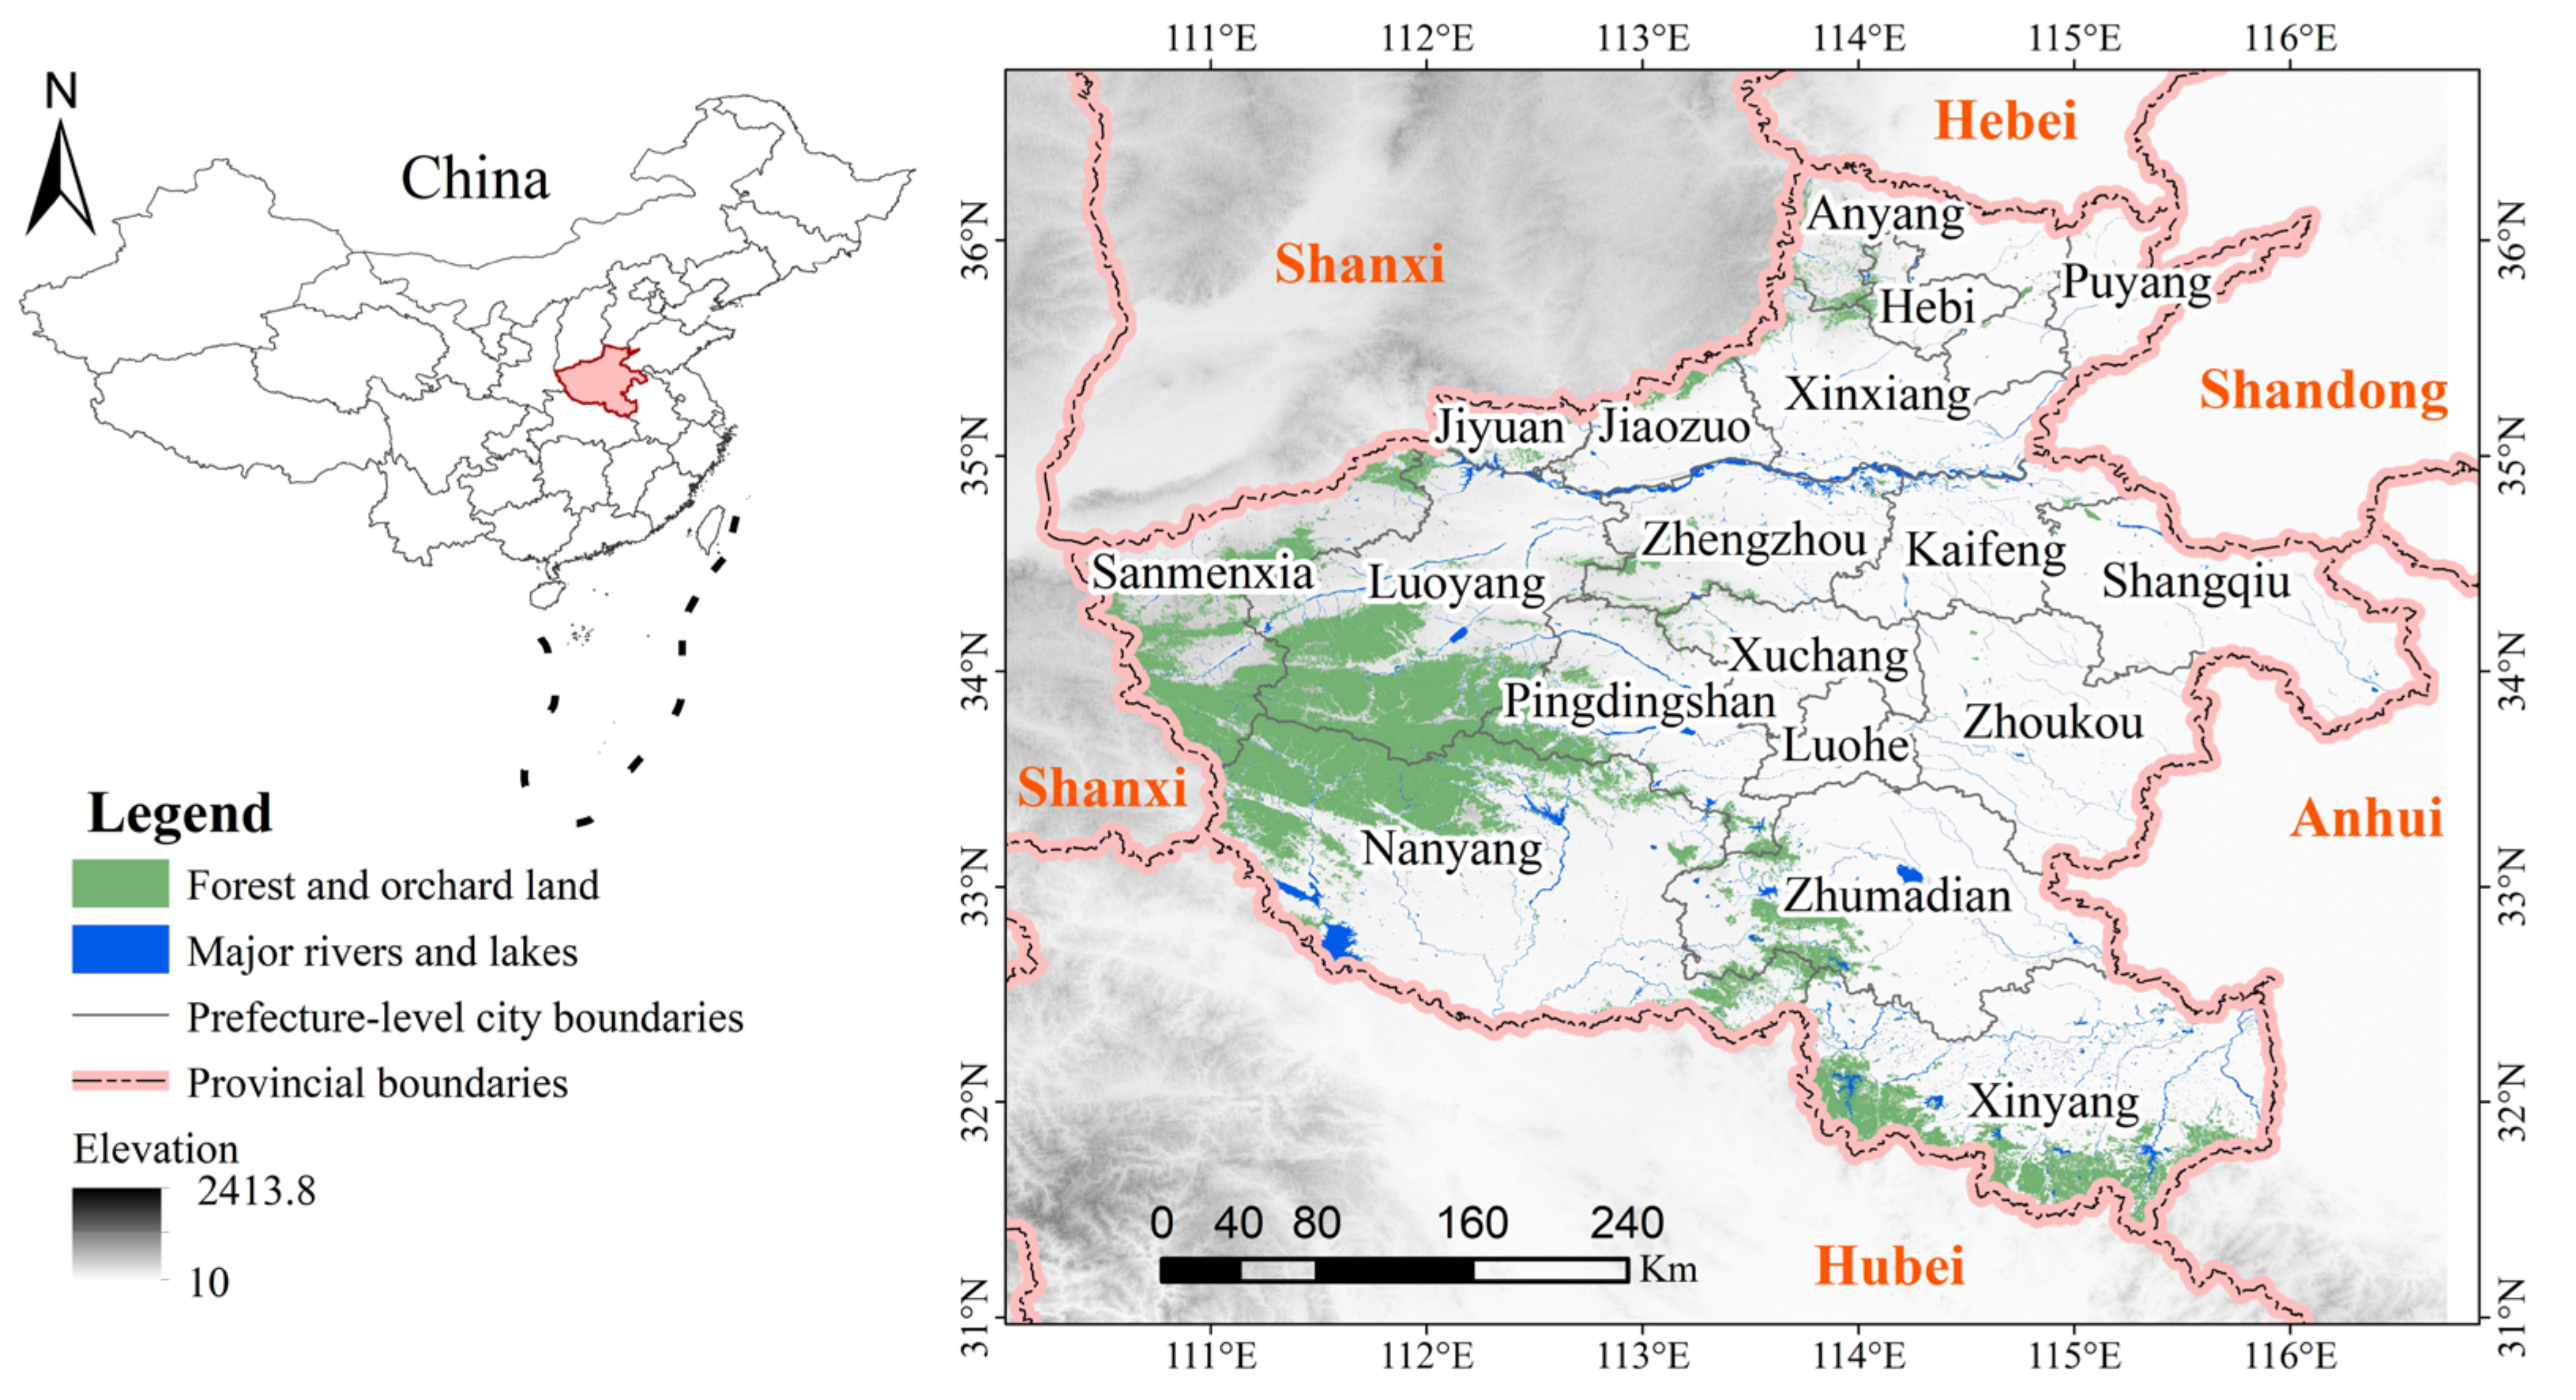
2.1. Study Area

Henan Province (31°23′–36°22′ N, 110°21′–116°39′ E), located in central China, covers an area of approximately 167,000 km2 (Figure 1). Its topography features higher elevations in the west and lower elevations in the east, with mountains to the north, west, and south, and a plain in the east. This study focused on 18 prefecture-level cities in Henan, including Zhengzhou, Kaifeng, Luoyang, Pingdingshan, Jiaozuo, Hebi, Xinxiang, Anyang, Puyang, Xuchang, Luohe, Sanmenxia, Nanyang, Shangqiu, Xinyang, Zhoukou, Zhumadian, and Jiyuan (a county-level city under provincial jurisdiction). According to 2023 data from the National Land Survey Results Sharing Application Service Platform, Henan Province contains 42,999.1 km2 of forest land, comprising tree woodland, bamboo woodland, shrub woodland, and other types. Rich and diverse forest resources provide a solid basis for forest tourism development. In recent years, the provincial government has prioritized this sector, implementing supportive measures such as preferential policies in finance, taxation, and land use, ensuring robust support for its growth. Additionally, significant investments have been made in forest tourism infrastructure, including transportation, accommodation, catering, and entertainment facilities, thereby enhancing the quality and standards of forest tourism services [45].

2.2. Indicator System and Data Sources

Regional FTDL results from a variety of factors; therefore, constructing an evaluation index system requires comprehensive consideration of multiple elements. Drawing on existing research [3,19,46], this study developed an index evaluation system with 33 indicators across 5 dimensions: forest tourism resources, forest tourism market, socioeconomic development level, ecological environment conditions, and local residents’ support (Table 1).
The data for market and economic indicators were sourced from the 2018–2021 Statistical Yearbooks of Henan Province (https://tjj.henan.gov.cn, accessed on 5 April 2023) and its prefecture-level cities (https://tjj.zhengzhou.gov.cn, etc., accessed on 18 May 2023), the National Economic and Social Development Statistical Bulletins (2018–2021) (https://www.henan.gov.cn/, accessed on 3 April 2023), and the government work reports of 18 prefecture-level cities (http://www.zhengzhou.gov.cn/, etc., accessed on 13 June 2023). Environmental data were obtained from the Annual Report on the Quality of Ecological Environment (2018–2021) published by the Henan Department of Ecology and Environment (https://sthjt.henan.gov.cn/, accessed on 18 May 2023), and the Land Survey Results Sharing and Application Platform (2018–2021) (https://gtdc.mnr.gov.cn/Share#/, accessed on 24 July 2023). Data on forest tourism resources were collected from the Ministry of Culture and Tourism of the People’s Republic of China (https://www.mct.gov.cn/, accessed on 18 June 2023), Department of Culture and Tourism of Henan Province (https://hct.henan.gov.cn/, accessed on 18 July 2023), official website of the State Forestry Administration (https://www.forestry.gov.cn/, accessed on 18 May 2023), and official website of the Forestry Administration of Henan Province (https://lyj.henan.gov.cn/, accessed on 18 April 2023). Seven indicators (B2 resource visibility, B3 resource diversity, B5 recreational value of resources, B6 scientific research value of resources, B29 resident participation, B30 resident satisfaction, and B31 tourism income of residents) were derived from questionnaires, and two indicators (B1 resource richness and B4 number of special resources) were obtained through direct communication with relevant departments via email, phone, manual Internet searches, or interpolation methods. In cases of discrepancies between sources for the same indicator, data from higher-level statistical authorities were prioritized. The FTDL for 18 prefecture-level cities in Henan Province from 2018 to 2021 was calculated with the period divided into three segments: 2018–2019, 2019–2020, and 2020–2021.

2.3. Methods

2.3.1. Forest Tourism Niche Model

The concept of niche originated in ecology was initially proposed by Johnson and later refined by Grinnell [47] and Elton [48]. Hutchinson [49] further developed this theory through the multidimensional hypervolume model, which conceptualized the niche as the combined effects of multiple environmental factors on organisms. Over time, the application of niche theory has expanded beyond ecology into interdisciplinary fields, particularly tourism [50]. In this study, based on the principles of the niche model, the forest tourism niche was divided into “state” and “potential”. The “state” refers to the evaluation of the current forest tourism condition, including resource quantity and quality, market potential, and socioeconomic development level. In this study, the “state”   S i   of FTDL in region i, was evaluated through the normalized weighted summation of multi-dimensional indices based on Table 1. The “potential” measures the dominance of a forest tourism unit in its system or region, including factors such as productivity and growth rate. The “potential” P i of FTDL in region i, was assessed through the weighted average annual change of each indicator in Table 1 during the same period. The weights were obtained by the entropy method [51,52].
Combined with the “state” and “potential” of the forest tourism niche, the comprehensive niche value is calculated as the basis for judging FTDL. The calculation formula is as follows [50]:
N i = S i + A i P i j = 1 n ( S j + A j P j )
where   N i   is the comprehensive FTDL in region i; S i   and   P i   and are the state and potential of region i, respectively;   S j   and   P j   are the state and potential of region j, respectively; and   A i   and   A j   are the dimensional conversion coefficients. Moreover, a time scale of one year was selected. Therefore, the dimensional conversion coefficient was 1.

2.3.2. Exploratory Spatial Data Analysis

Exploratory spatial data analysis is a widely used methodology for delineating and visualizing spatial distribution [53]. The global spatial autocorrelation index (global Moran’s I, IFT) was employed to assess the spatial clustering of forest tourism development across prefecture-level cities in Henan Province. This index is a critical foundation for pattern analysis because it reflects the overall spatial agglomeration characteristics [54]. The IFT values range from −1 to 1. Values exceeding 0 indicate positive spatial autocorrelation, suggesting spatial agglomeration; values below 0 indicate negative spatial autocorrelation, implying spatial dispersion; and a value of 0 indicates the absence of spatial autocorrelation among the prefecture-level cities.
Although global Moran’s I provides an overarching view of spatial patterns, it overlooks localized spatial heterogeneity, limiting its ability to capture specific spatial correlation patterns within a region in detail [55]. As a result, local spatial autocorrelation was employed to examine variations in the spatial distributions of features between local and neighboring areas [56]. When the local spatial autocorrelation index surpasses 0, it indicates that the value of prefecture-level city is similar to that of its neighboring prefecture-level cities, signifying either a high–high or low–low value combination. Conversely, when the index is below 0, it indicates a significant divergence in the feature value of a prefecture-level city compared with its neighboring cities, signifying either a low–high or high–low value combination. In this study, the LISA clustering plot was used to identify the form and types of local spatial autocorrelation of FTDL across 18 prefecture-level cities over three periods.

2.3.3. Geographical Detector Model

Geographical detector is a statistical tool designed to identify the driving factors associated with geographic phenomena [57]. When a geographic phenomenon exhibits a spatial distribution pattern consistent with that of a specific factor, it indicates that the factor has explanatory power for that phenomenon. Compared with the traditional regression methods used in previous studies, the geographical detector can not only effectively analyze the spatial influence of various factors but also identify the core ones. This method employs the q-statistic to quantify the explanatory power of factor X on the dependent variable Y, providing a more accurate analysis of causal relationships than general statistical methods. The p-value indicates the significance level.

2.4. Study Steps

The study steps were as follows (Figure 2): (1) an evaluation index system for FTDL in Henan Province was established, and data from 2018 to 2021 for each indicator were collected and analyzed using StataMP 17 to obtain the weights and standardized values. The evaluation results for the 18 prefecture-level cities over the three periods were then calculated using Excel 2023; (2) the FTDL of each prefecture-level city in Henan Province was analyzed in ArcGIS 10.6 to determine the spatiotemporal evolution patterns. Using the Jenks Natural Breaks method, the FTDL in Henan Province was categorized into four grades for each period. A spatial weight matrix was constructed using Geoda software to reveal the spatial autocorrelation characteristics through the LISA clustering plot; and (3) the geographical detector model in Geoda software was employed to investigate the driving mechanisms behind spatiotemporal evolution patterns.

3. Results

3.1. FTDL Temporal Evolution in Henan Province

The evaluation results and rankings of the FTDL in each prefecture-level city in Henan Province are presented in Figure 3 and Table 2. FTDL demonstrates a temporal evolutionary pattern characterized by “hierarchical heterogeneity and slight fluctuations”. Zhengzhou, Luoyang, and Nanyang consistently ranked high and remained stable throughout the three study periods. In contrast, Anyang, Puyang, and Luohe, which initially had lower rankings, exhibited significant improvements. For instance, Anyang rose from 17th place in 2018–2019 to 12th place in 2019–2020, and 4th place in 2020–2021. Jiaozuo, Jiyuan, Hebi, and Kaifeng exhibited a downward trend followed by an upward rebound in ranking, whereas Zhumadian, Xuchang, and Zhoukou experienced an initial increase followed by a decline. Xinyang and Sanmenxia maintained stable rankings in 2018–2019 and 2019–2020 but declined in 2020–2021. Xinxiang showed improvement from 2018–2019 to 2019–2020, with its ranking stabilizing from 2019–2020 to 2020–2021.

3.2. FTDL Spatial Evolution Patterns in Henan Province

In terms of the spatial distribution pattern of FTDL (Figure 4), prefecture-level cities with high-grade FTDL were predominantly found in the western and southern hilly regions, whereas lower-grade FTDL cities were concentrated in the eastern plains. In particular, Xinyang, Nanyang, Luoyang, and Jiaozuo ranked at the top for all three periods. In terms of evolutionary characteristics, FTDL in cities in the western and southern regions (excluding Zhengzhou) gradually decreased with a reduction in the number of prefecture-level cities in the first and second grades. In the northern region, FTDL rankings have steadily increased, with most prefecture-level cities showing consistent improvement from 2018–2019 to the 2019–2020 and 2020–2021 periods. In the eastern region, the number of fourth-grade prefecture-level cities gradually increased, forming a contiguous pattern.

3.3. FTDL Spatial Correlation in Henan Province

3.3.1. Global Spatial Autocorrelation Analysis

As shown in Table 3, IFT for the three periods were 0.1963, −0.1840, and −0.0083, respectively. Global Moran’s I indices and Z-values for 2018–2019 were greater than zero, indicating a positive spatial correlation and clustering pattern in the spatial distribution of FTDL across the 18 prefecture-level cities in Henan Province during this period. IFT and Z-value in 2019–2020 were less than zero, indicating a negative spatial correlation and an absence of clustering in the spatial distribution of FTDL across the 18 prefecture-level cities in Henan Province during this period. In 2020–2021, IFT remained less than zero, while the Z-value was greater than zero, signifying a negative spatial correlation with a clustering pattern in the distribution of FTDL. Additionally, the absolute value of IFT across these three periods exhibited a decreasing trend.

3.3.2. Local Spatial Autocorrelation Analysis

In Henan Province, FTDL in fewer prefecture-level cities passed the confidence test in the local spatial autocorrelation analysis in each period (Figure 5). First, Pingdingshan in central Henan Province demonstrated low–high (L–H) clustering across all three periods. The eastern region generally had low FTDL, with Zhoukou being a typical low–low (L–L) clustering type in 2018–2019 and 2020–2021. Second, in northern Henan Province, Jiyuan displayed a high–high (H–H) clustering type during 2018–2019 and 2020–2021. In 2019–2020, Jiyuan belonged to L–H clustering. Jiaozuo and Xinxiang shifted from non-significant in 2018–2019 and 2019–2020 to significant H–H in 2020–2021. In the south of Henan Province, Xinyang belonged to high–low (H–L) clustering in 2020–2021.

3.4. FTDL Driving Mechanism in Henan Province

The factors influencing FTDL across the three periods are listed in Table 4. Eight factors were recognized as dominant drivers of FTDL spatiotemporal dynamics over the three periods, with a confidence level of 0.05. These factors were categorized into four groups: scientific research value, forest tourism market efficiency, forest tourism economic support, and environmental quality. (1) Scientific research value was primarily reflected by indicator B6 (scientific research value of resources). The q-value for B6 declined from 0.4543 in 2018–2019 to 0.2477 in 2019–2020 and then rose to 0.5562 in 2020–2021. (2) Forest tourism market efficiency was characterized by indicators B8 (lodging and catering revenues) and B9 (number of star-rated hotels), which represent its “quality” and “quantity”, respectively, in this study. The q-value of B9 gradually decreased in each period, while the q-value of B8 increased from 2018–2019 to 2019–2020 and then decreased from 2019–2020 to 2020–2021. (3) Forest tourism economic support was primarily represented by B14 (GDP), B16 (total value of the tertiary industry), B17 (total retail value of consumer goods), and B19 (infrastructure scale and completeness) in this study. The q-values of all four indicators exhibited an increasing trend from 2018–2019 to 2019–2020 and then decreased from 2019–2020 to 2020–2021. Moreover, the q-values of these 4 indicators were relatively high among all 32 indicators, particularly for B14 (0.7161, 0.9029, 0.7548) and B16 (0.7938, 0.9027, 0.7538), which ranked first and second, respectively, in the periods of 2019–2020 and 2020–2021. (4) Environmental quality was represented by indicator B21 (area covered by greenery) in this study. The q-value of B21 increased from 0.8045 in 2018–2019 to 0.9024 in 2019–2020 and then declined to 0.6449 in 2020–2021, indicating that the impact of B21 on FTDL was initially strong but later weakened.

4. Discussion

4.1. Research Findings

Using 18 prefecture-level cities in Henan Province as research subjects, this study conducted a comprehensive and dynamic assessment of FTDL in these prefecture-level cities from 2018 to 2021. We then analyzed the spatiotemporal dynamics and driving factors of FTDL using exploratory spatial data analysis and a geographical detector model. The main conclusions are as follows.
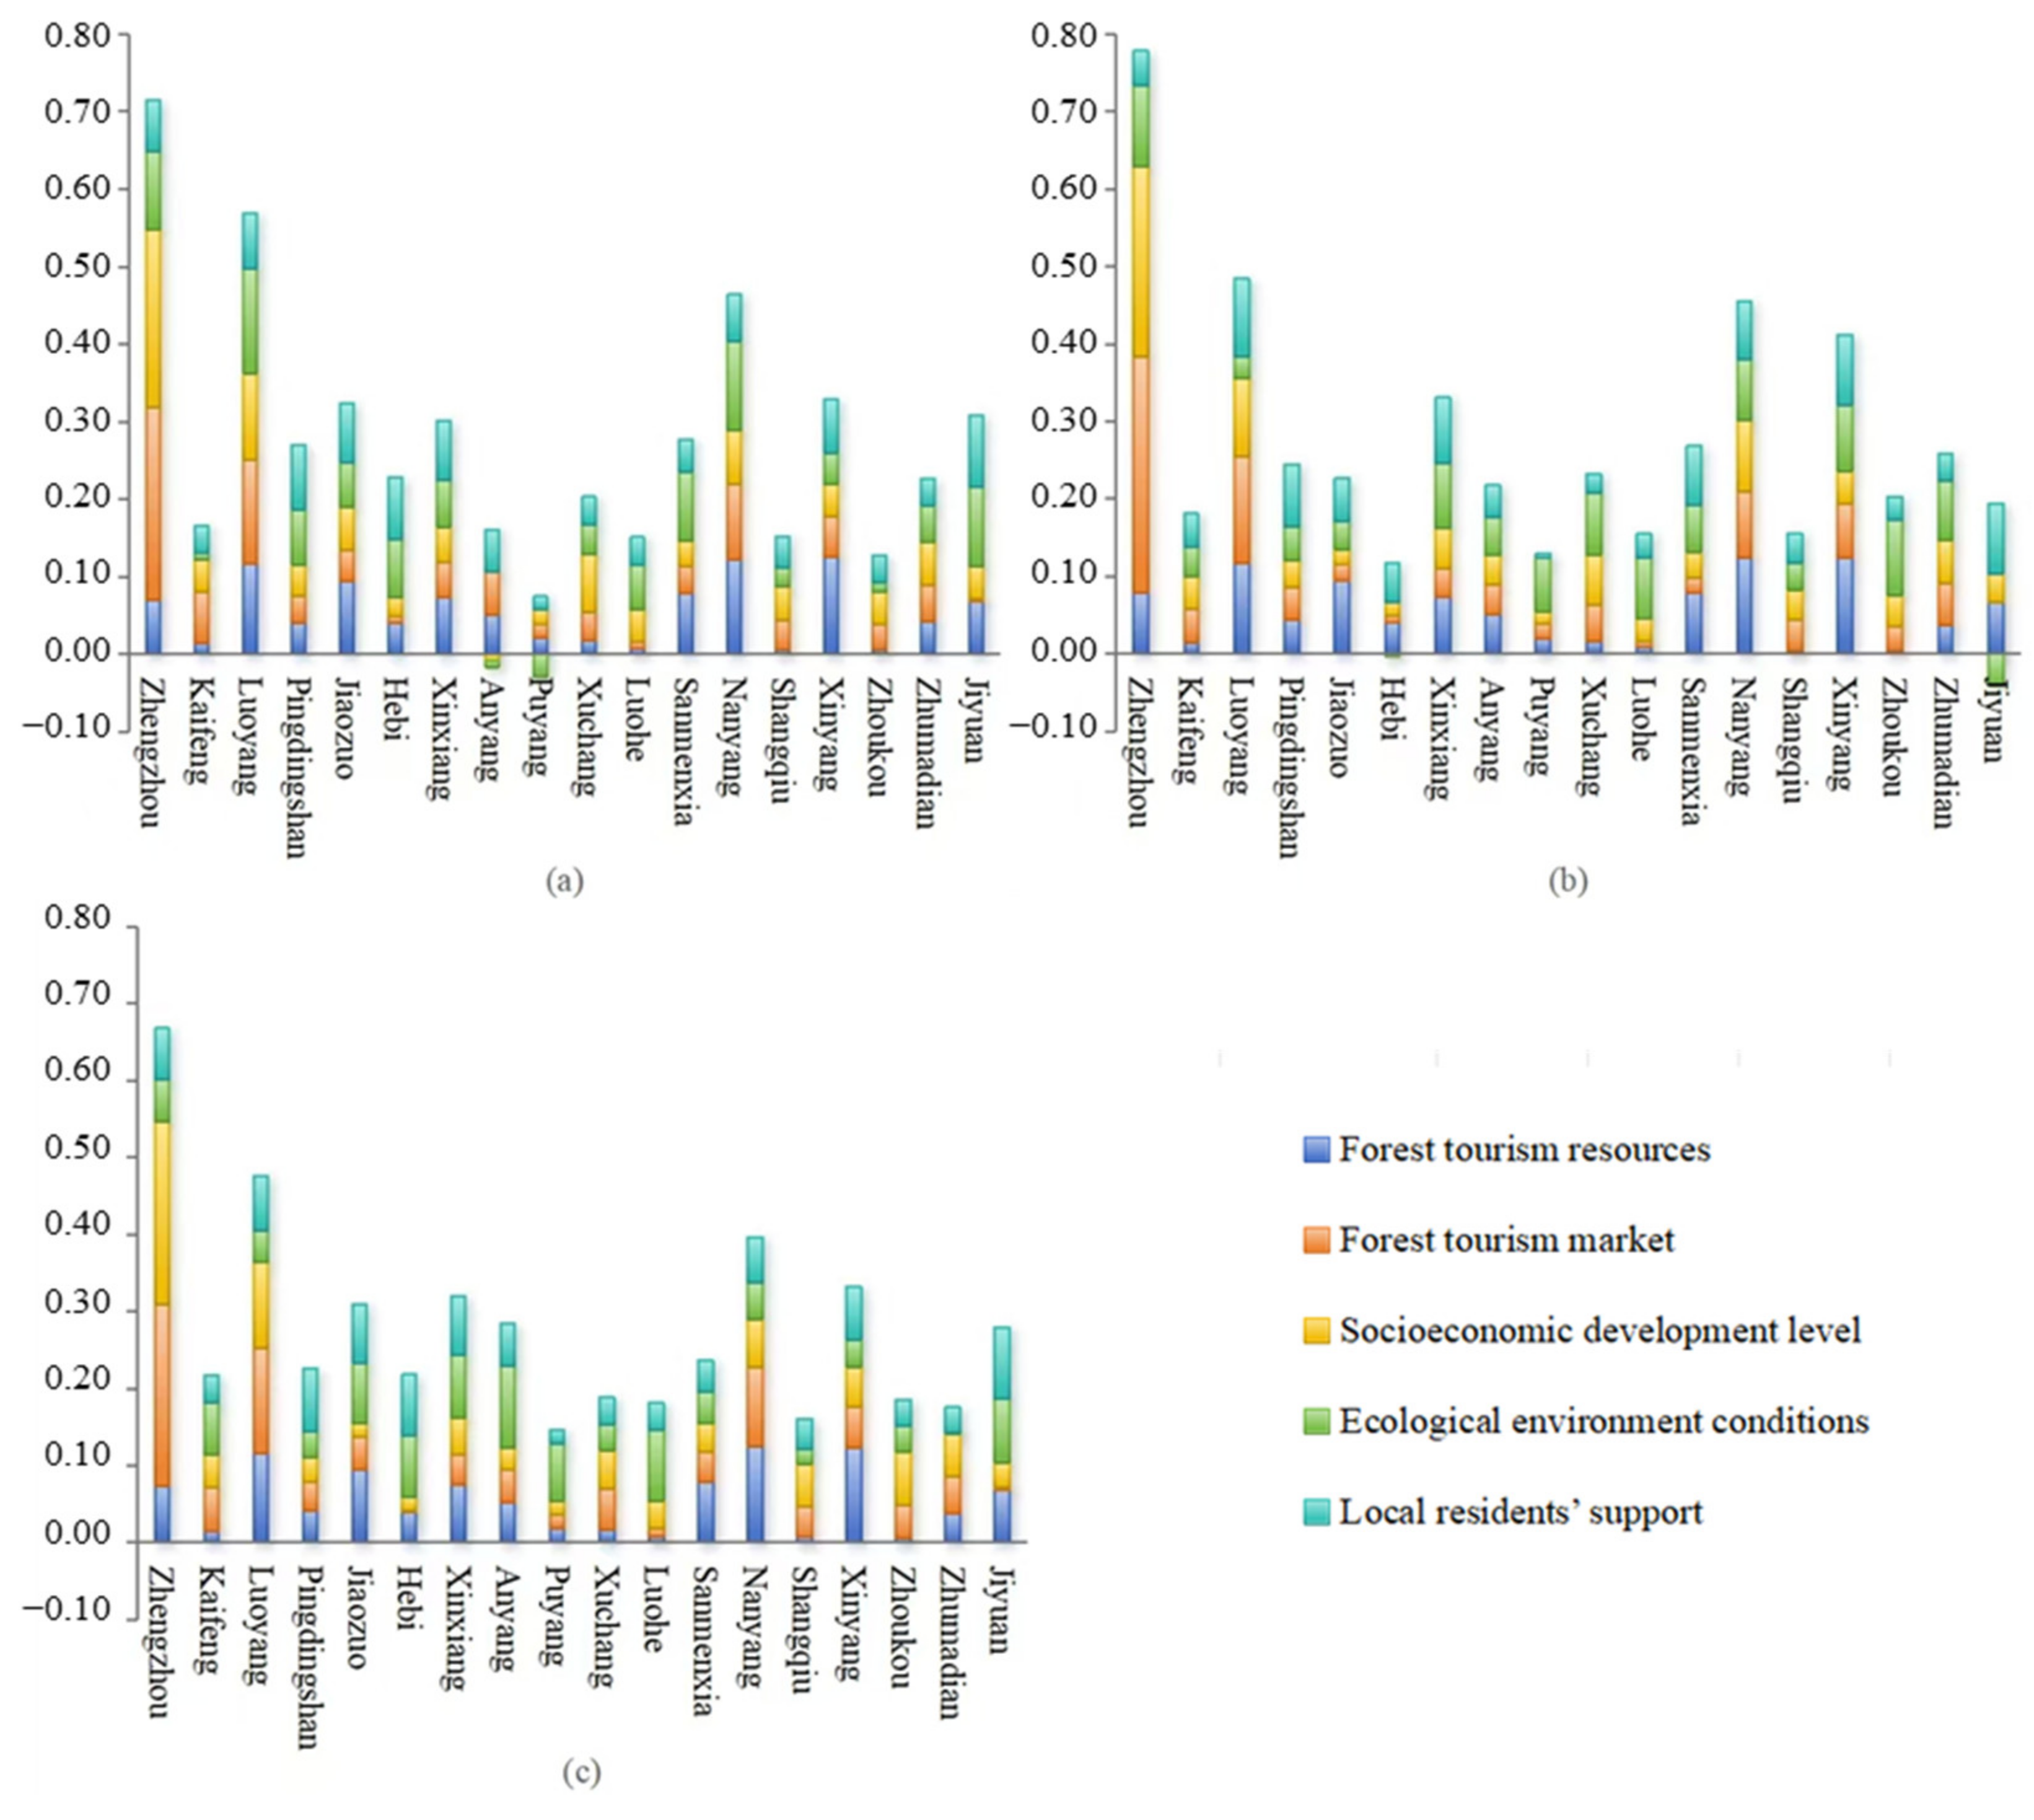
  • The FTDL in Henan Province from 2018 to 2021 exhibited “hierarchical heterogeneity and slight fluctuations”. Benefiting from high economic development and abundant forest tourism resources, Zhengzhou, Luoyang, and Nanyang had absolute advantages in FTDL rankings, with Zhengzhou consistently ranking first in all three periods. This was due to Zhengzhou’s strategic position, surrounded by Songshan Mountain to the west and the Yellow River to the north, as well as its status as the political, economic, and cultural center of Henan Province, which supported the development of forest tourism and ensured economic, market, and environmental stability [58]. FTDL in other prefecture-level cities such as Jiaozuo, Jiyuan, and Hebi showed fluctuations in the rankings. These prefecture-level cities, which are rich in forest tourism resources, experienced a decline followed by recovery, particularly owing to the significant impact of the COVID-19 pandemic on tourism, transportation, and related industries during 2019–2020, which led to lower FTDL rankings. However, in the 2020–2021 period, with the effective control of the pandemic and gradual recovery of the tourism industry, the rankings of these prefecture-level cities rebounded, highlighting the vulnerability of forest tourism in tourist prefecture-level cities, especially in remote areas [59].
  • FTDL in Henan Province was characterized by “high in the southwest and low in the east”. The southwestern region is mountainous, hilly, and rich in forest tourism resources, thus offering an ideal ecological environment for forest tourism [60]. In the northern region, FEDL declined from the 2018–2019 period to the 2019–2020 period but increased from the 2019–2020 period to the 2020–2021 period. This shift was attributed to the enhancement of the ecological environment and support of local residents in the northern region during the third period. The prefecture-level cities in this area have actively protected their ecological environments, with Anyang being a notable example. Since 2020, Anyang has significantly improved its ecological environment by optimizing its industrial structure, developing clean energy, and strengthening precise controls [61]. As a result, Anyang ranked first in ecological environment development during 2020–2021, up from eleventh place in 2019–2020. Meanwhile, its FTDL ranking rose from 12th in 2019–2020 to 4th in 2020–2021.
  • FTDL in Henan Province shifted from positive spatial autocorrelation in 2018–2019 to negative spatial autocorrelation in 2019–2020 and 2020–2021, with the degree of correlation gradually weakening. This trend is more specific in local autocorrelation analysis and the LISA clustering plot. Pingdingshan, located in central Henan Province, consistently exhibited an L–H pattern across all three periods due to its low FTDL, in contrast to its neighboring prefecture-level cities (Zhengzhou, Luoyang, and Nanyang), which had high FTDL. The discrete trend is the result of improved FTDL rankings for some prefecture-level cities in the north and south of Henan Province in 2020–2021, such as Anyang, Xinxiang, and Jiyuan in the South Taihang Mountains of northern Henan Province, as well as Xinyang in the Tongbai–Dabie Mountains of southern Henan Province. Notably, Xinyang (ranked seventh) exhibited an H–L pattern during this period, significantly surpassing its neighbor Zhumadian, which ranked last.
  • Eight dominant drivers of FTDL in Henan Province were identified and categorized into four groups: scientific research value, forest tourism market efficiency, forest tourism economic support, and environmental quality. Firstly, the impact of scientific research value on FTDL showed an overall upward trend with fluctuations, as reflected by q-values of 0.4543, 0.2477, and 0.5562, indicating a growing demand among tourists for knowledge and cultural exploration [62]. Secondly, FTDL in Henan Province is primarily driven by economic development and the ecological environment [12]. The q-values of four indicators, B14, B16, B17, and B19, representing forest tourism economic support, along with B21, representing environmental quality, ranked highest. Thirdly, forest tourism in Henan Province has undergone a transition from being environment-driven in 2018–2019 to economy-driven in 2019–2020 and 2020–2021. The reason was that environmental quality was the dominant factor influencing FTDL, with the q-value of B21 ranking second in 2018–2019, while forest tourism economic support emerged as the primary driver, as B14 and B16 ranked first and second, and B21 ranked third in 2019–2020 and 2020–2021. Additionally, the gap between the q-values of B21 (0.9024, 0.6449) and those of B14 (0.9029, 0.7548) and B16 (0.9027, 0.7538) widened from 2019–2020 to 2020–2021.
Comparisons with other studies have indicated that the influence of infrastructure scale and completeness on forest tourism development may be relatively low [63,64,65]. This difference can be attributed to several factors. First, forest tourism in Henan Province is still in the early stages of development, with significant regional variations in infrastructure quality such as restaurants, accommodation, and public facilities. Second, forest tourism sites often face overcrowding during holidays and a few tourists in usual time. Third, these sites are typically distant from urban areas, limiting the sharing of resources with other infrastructure. Consequently, there is a higher demand for improved infrastructure in forested tourism areas of Henan Province.
Some studies have indicated that the number of travel agencies significantly affects tourism in Yunnan Province [66]. However, in this study, the number of travel agencies did not have a significant effect on FTDL in Henan Province. This may be because the scenic areas in Xishuangbanna, Yunnan Province, are more mature than those in Henan Province. Tourists in Henan tend to travel shorter distances and require less information. Meanwhile, as the Internet and social media development, tourists can easily access independently through scenic area websites and social media platforms, such as Little Red Book and Weibo [67,68]. Consequently, they plan and arrange trips through online travel agencies (OTAs) and rely less on traditional offline travel agencies [69].

4.2. Political Implications

Based on a systematic assessment and analysis of FTDL in 18 prefecture-level cities in Henan Province, various strategies have been proposed to enhance the competitiveness of forest tourism in prefecture-level cities. Prefecture-level cities with high economic development and abundant forest tourism resources, such as Zhengzhou, Luoyang, and Nanyang, can leverage their economic strength by establishing forest tourism funds and encouraging large enterprises to invest in industry, thereby increasing the research and development of forest tourism products. Prefecture-level cities with rich forest tourism resources but less stability, such as Anyang, Puyang, Jiaozuo, and Jiyuan, need to develop distinct forest tourism brands based on their unique resources and enhance the carrying capacity and management of scenic spots to improve their tourism development resilience. Prefecture-level cities with strong economic development but limited forest tourism resources, such as Pingdingshan with an L–H type in LISA spatial agglomerations, can capitalize on the driving influence of surrounding prefecture-level cities and explore regional cooperation models for coordinated forest tourism development.

4.3. Research Limitations

This study focused on the administrative units of prefecture-level cities in China. However, each prefecture-level city had varying types and levels of forest tourism, which differed in their development foundations, prospects, models, and target customer groups. This study had certain limitations in reflecting FTDL across different types and levels. Future research should focus on forest parks to explore FTDL at different levels and types. Moreover, ecological networks have an important influence on the diversity of resources within the forest and their integration with external ecological resources (such as another forests, river valley, greenery refuges, etc.) [70]. These are important components of the ecological and aesthetic values of forest tourism. In future studies, ecological network connectivity indicators are considered in FTDL evaluation. Additionally, it is important to acknowledge that the geographical detector model requires discretizing continuous variables into categorical classes, which introduces a degree of subjectivity [57]. The selection of discretization thresholds can significantly affect the reliability of results. Therefore, we are actively seeking a more suitable method for identifying the driving factors in our future work.

5. Conclusions

Forest tourism plays a crucial role not only in meeting the demand for green consumption but also in balancing regional economic development with environmental protection. Understanding the spatiotemporal evolution of FTDL and its driving mechanisms can help regions better manage forest systems and formulate more rational policies. This study developed a comprehensive and dynamic index system to evaluate FTDL across 18 prefecture-level cities in Henan Province from 2018 to 2021. Exploratory spatial data analysis was used to assess spatial patterns of FTDL. Subsequently, a geographical detector model was used to identify the driving mechanisms. The key findings are as follows: (1) FTDL in Henan Province exhibited “stratified heterogeneity and small fluctuations” over time and followed a “high in the southwest and low in the east” spatial distribution pattern. Prefecture-level cities with strong socioeconomic development, such as Zhengzhou, maintained a more stable FTDL, particularly during times of crisis. In contrast, forest-rich cities, such as Anyang, enhanced their FTDL through environmental improvements; (2) FTDL shifted from positive to negative spatial autocorrelation in Henan Province, with a gradual weakening in correlation strength. Local autocorrelation patterns remained more stable in central and eastern Henan, whereas high–high (H–H) and high–low (H–L) clusters were primarily found in the northern and southern mountainous regions; And (3) eight dominant drivers, categorized into four groups, were identified, including scientific research value (B6), forest tourism market efficiency (B8 and B9), forest tourism economic support (B14, B16, B17, and B19), and environmental quality (B21). Over time, forest tourism in Henan Province has transitioned from being environment-driven to economy-driven, particularly from 2018–2019 to 2019–2020 and 2020–2021. These findings provide a theoretical foundation and decision-making support for forest tourism planning and policy development, thus contributing to sustainable development in the province.

Author Contributions

Conceptualization, J.L. and Y.Y.; methodology, H.H.; validation, E.G.; formal analysis, P.X.; data curation, X.D.; writing—original draft preparation, J.L and Y.Y.; writing—review and editing, H.H.; project administration, X.Y.; funding acquisition, E.G. All authors have read and agreed to the published version of the manuscript.

Funding

This research was funded by Soft Science Research Program in Henan Province (252400410249), Soft Science Research Program in Henan Province (232400411100), Flourishing Philosophy and Social Science Applied Research Project in Henan Agricultural University (FRZS2024B11), and Postdoctoral Research Grant in Henan Province (202001031).

Data Availability Statement

Data are contained within the article.

Acknowledgments

The authors wish to thank the anonymous reviewers who have helped to improve the paper. In addition, thanks are also extended to Keru Ge and Jianwu Wang, majoring in Tourism Management, Henan Agricultural University, for proofreading the manuscript.

Conflicts of Interest

The authors declare no conflicts of interest.

Correction Statement

This article has been republished with a minor correction of the information included in the spelling issue. This change does not affect the scientific content of the article.

References

  1. Yu, Y.J.; Shi, J.W. Environmental regulation, low-carbon technology progress and energy efficiency. Front. Environ. Sci. 2022, 10, 1012229. [Google Scholar] [CrossRef]
  2. Li, M. Correlation Degree Analysis of Tourism and Economic Growth Based on Computable General Equilibrium Model. J. Math. 2022, 12, 4275698. [Google Scholar] [CrossRef]
  3. Yu, F. Can Environmental Improvement Promote the Development of Forest Tourism? An Empirical Study Based on Chinese National Forest Parks. Pol. J. Environ. Stud. 2025, 34, 383–395. [Google Scholar] [CrossRef]
  4. Cao, S.Z. Development potential evaluation for land resources of forest tourism based on fuzzy AHP method. Math. Probl. Eng. 2022, 2022, 1–12. [Google Scholar] [CrossRef]
  5. Rodríguez, J.P.; Beard, T.D., Jr.; Bennett, E.M.; Cumming, G.S.; Cork, S.J.; Agard, J.; Dobson, A.P.; Peterson, G.D. Trade-offs across space, time, and ecosystem services. Ecol. Soc. 2006, 11, 28. [Google Scholar] [CrossRef]
  6. Miao, C.; Wang, J.; Wang, D. Research progress on urban forest ecosystem services and multifunctionality. Int. J. Environ. Sci. Technol. 2024, 1–10. [Google Scholar] [CrossRef]
  7. Faluyi, M.O.; Irmak, S. Northeastern American Forests: Natural Disturbances, Climate Change Impact, and the Utilization of Increasingly Damaged Forest Trees for Biofuel Production. Forests 2023, 14, 2409. [Google Scholar] [CrossRef]
  8. Favero, A.; Daigneault, A.; Sohngen, B.; Baker, J. A system-wide assessment of forest biomass production, markets, and carbon. Glob. Change Biol. Bioenergy 2023, 15, 154–165. [Google Scholar] [CrossRef]
  9. Tampakis, S.; Andrea, V.; Karanikola, P.; Pailas, I. The Growth of Mountain Tourism in a Traditional Forest Area of Greece. Forests 2019, 10, 1022. [Google Scholar] [CrossRef]
  10. Rui, Z.; Zhang, J.R.; Wang, W.K. Remote sensing imaging analysis and ubiquitous cloud-based mobile edge computing based intelligent forecast of forest tourism demand. Distrib. Parallel Databases 2023, 41, 95–116. [Google Scholar] [CrossRef]
  11. Zhu, J.; Sun, J.C. Ecotourism design and plant protection based on sensor network. Front. Plant Sci. 2022, 13, 993838. [Google Scholar] [CrossRef] [PubMed]
  12. Chen, B.X.; Nakama, Y. Thirty years of forest tourism in China. J. For. Res. 2013, 18, 285–292. [Google Scholar] [CrossRef]
  13. Ristić, V.; Trišić, I.; Štetić, S.; Nechita, F.; Candrea, A.N.; Majstorović, N.; Tomašević, V. Importance of Forest Ecosystem within Important Plant Areas (IPAs) for the Development of Nature-Based Tourism—A Case Study of Fruška Gora National Park. Forests 2024, 15, 1213. [Google Scholar] [CrossRef]
  14. Jia, H.; Luo, P.; Yang, H.; Luo, C.; Li, H.; Wu, S.; Cheng, Y.; Huang, Y.; Xie, W. Exploring the Relationship between Forest Scenic Beauty with Color Index and Ecological Integrity: Case Study of Jiuzhaigou and Giant Panda National Park in Sichuan, China. Forests 2022, 13, 1883. [Google Scholar] [CrossRef]
  15. Bonilla-Duarte, S.; Gómez-Valenzuela, V.; de la Mora, A.L.V.; García-García, A. Urban Forest Sustainability in Residential Areas in the City of Santo Domingo. Forests 2021, 12, 884. [Google Scholar] [CrossRef]
  16. Li, S.D.; Ren, T.; Jia, B.B.; Zhong, Y.D. The Spatial Pattern and Spillover Effect of the Eco-Efficiency of Regional Tourism from the Perspective of Green Development: An Empirical Study in China. Forests 2022, 13, 1324. [Google Scholar] [CrossRef]
  17. Petter, G.; Mairota, P.; Albrich, K.; Bebi, P.; Brůna, J.; Bugmann, H.; Haffenden, A.; Scheller, R.M.; Schmatz, D.R.; Seidl, R.; et al. How robust are future projections of forest landscape dynamics? Insights from a systematic comparison of four forest landscape models. Environ. Model. Softw. 2020, 134, 104844. [Google Scholar] [CrossRef]
  18. Weng, F.; Li, X.; Xie, Y.; Xu, Z.; Ding, F.; Ding, Z.; Zheng, Y. Study on Multidimensional Perception of National Forest Village Landscape Based on Digital Footprint Support—Anhui Xidi Village as an Example. Forests 2023, 14, 2345. [Google Scholar] [CrossRef]
  19. Li, L.; Liu, T.; Xu, S.B.; Tian, Z.W. Evaluation on sustainable development of forest tourism in Heilongjiang Province, China. Environ. Dev. Sustain. 2021, 23, 13382–13402. [Google Scholar] [CrossRef]
  20. Bachi, L.; Carvalho-Ribeiro, S. Markets for Non-Timber Forest Products (NTFPs): The Role of Community-Based Tourism (CBT) in Enhancing Brazil’s Sociobiodiversity. Forests 2023, 14, 298. [Google Scholar] [CrossRef]
  21. Darda, M.A.; Bhuiyan, M.A.H. A Structural Equation Model (SEM) for the socio-economic impacts of ecotourism development in Malaysia. PLoS ONE 2022, 17, e0273294. [Google Scholar] [CrossRef] [PubMed]
  22. Chandra, V.L.; Azharul, I.M.; Md, N.S. Does tourism have an impact on carbon emissions in Asia? An application of fresh panel methodology. Environ. Dev. Sustain. 2023, 26, 11–19. [Google Scholar] [CrossRef]
  23. Shi, Y.; Li, S.; Li, Y.; Jiang, L.; Khan, F.U.; Waiho, K.; Wang, Y.; Hu, M. Saving the overlooked mangrove horseshoe crabs-A perspective from enhancing mangrove ecosystem conservation. Mar. Environ. Res. 2023, 193, 106282. [Google Scholar] [CrossRef] [PubMed]
  24. Chae, Y.; Lee, S.; Jo, Y.; Kang, S.; Park, S.; Kang, H. The Effects of Forest Therapy on Immune Function. Int. J. Environ. Res. Public Health 2021, 18, 8440. [Google Scholar] [CrossRef]
  25. HChun, H.R.; Choi, Y.Y.; Cho, I.; Nam, H.K.; Kim, G.; Park, S.; Cho, S.I. Indicators of the Psychosocial and Physiological Effects of Forest Therapy: A Systematic Review. Forests 2023, 14, 1407. [Google Scholar] [CrossRef]
  26. Ideno, Y.; Hayashi, K.; Abe, Y.; Ueda, K.; Iso, H.; Noda, M.; Lee, J.S.; Suzuki, S. Blood pressure-lowering effect of Shinrin-Yoku (Forest bathing): A systematic review and meta-analysis. Bmc Complement. Altern. Med. 2017, 17, 409. [Google Scholar] [CrossRef]
  27. Lee, D.G.; Lee, M.M.; Jeong, Y.M.; Kim, J.G.; Yoon, Y.K.; Shin, W.S. Influence of Forest Visitors’ Perceived Restorativeness on Social–Psychological Stress. Int. J. Environ. Res. Public Health 2021, 18, 6328. [Google Scholar] [CrossRef]
  28. Kang, M.J.; Kim, H.S.; Kim, J.Y. Effects of Forest-Based Interventions on Mental Health: A Meta-Analysis of Randomized Controlled Trials. Int. J. Environ. Res. Public Health 2022, 19, 4884. [Google Scholar] [CrossRef]
  29. Carvalho-Santos, C.; Honrado, J.P.; Hein, L. Hydrological services and the role of forests: Conceptualization and indicator-based analysis with an illustration at a regional scale. Ecol. Complex. 2014, 20, 69–80. [Google Scholar] [CrossRef]
  30. Lu, J.W.; Chen, H.B. Dynamic Evaluation and Forecasting Analysis of Touristic Ecological Carrying Capacity of Forest Parks in China. Forests 2024, 15, 38. [Google Scholar] [CrossRef]
  31. Heejoo, L.; Yeo-Chang, Y. Relevance of cultural ecosystem services in nurturing ecological identity values that support restoration and conservation efforts. For. Ecol. Manag. 2022, 505, 119920. [Google Scholar] [CrossRef]
  32. Endler, C.; Oehler, K.; Matzarakis, A. Vertical gradient of climate change and climate tourism conditions in the Black Forest. Int. J. Biometeorol. 2010, 54, 45–61. [Google Scholar] [CrossRef] [PubMed]
  33. Liu, J.; Zhang, J.F.; Fu, Z.B. Tourism eco-efficiency of Chinese coastal cities—Analysis based on the DEA-Tobit model. Ocean Coast. Manag. 2017, 148, 164–170. [Google Scholar] [CrossRef]
  34. Sporcic, M.; Landekic, M.; Lovric, M.; Martinic, I. Planning and decision making models in forestry. Croat. J. For. Eng. 2011, 32, 443–456. [Google Scholar]
  35. Ghasemi, P.; Mehdiabadi, A.; Spulbar, C.; Birau, R. Ranking of sustainable medical tourism destinations in iran: An integrated approach using fuzzy SWARA-PROMETHEE. Sustainability 2021, 13, 683. [Google Scholar] [CrossRef]
  36. Verkoeyen, S.; Nepal, S.K. Understanding scuba divers’ response to coral bleaching: An application of Protection Motivation Theory. J. Environ. Manag. 2019, 231, 869–877. [Google Scholar] [CrossRef] [PubMed]
  37. Chen, H.S. The Construction and Validation of a Sustainable Tourism Development Evaluation Model. Int. J. Environ. Res. Public Health 2020, 17, 7306. [Google Scholar] [CrossRef]
  38. Okware, S.I.; Omaswa, F.G.; Zaramba, S.; Opio, A.; Lutwama, J.J.; Kamugisha, J.; Rwaguma, E.B.; Kagwa, P.; Lamunu, M. An outbreak of Ebola in Uganda. Trop. Med. Int. Health 2002, 7, 1068–1075. [Google Scholar] [CrossRef]
  39. Song, Y.; He, Y.W. Toward an intelligent tourism recommendation system based on artificial intelligence and IoT using Apriori algorithm. Soft Comput. 2023, 27, 19159–19177. [Google Scholar] [CrossRef]
  40. Liu, H.; Xu, X.X.; Tam, V.W.; Mao, P. Exploring the ‘dark’ side of forest therapy and recreation: A critical review and future directions. Renew. Sustain. Energy Rev. 2023, 183, 113480. [Google Scholar] [CrossRef]
  41. Zhang, L.Y.; Wu, C.L.; Hao, Y. Effect of The Development Level of Facilities for Forest Tourism on Tourists’ Willingness to Visit Urban Forest Parks. Forests 2022, 13, 1005. [Google Scholar] [CrossRef]
  42. You, S.; Zheng, Q.; Chen, B.; Xu, Z.; Lin, Y.; Gan, M.; Zhu, C.; Deng, J.; Wang, K. Identifying the spatiotemporal dynamics of forest ecotourism values with remotely sensed images and social media data: A perspective of public preferences. J. Clean. Prod. 2022, 341, 130715. [Google Scholar] [CrossRef]
  43. Hegetschweiler, T.; Wartmann, F.M.; Dubernet, I.; Fischer, C.; Hunziker, M. Urban forest usage and perception of ecosystem services—A comparison between teenagers and adults. Urban For. Urban Green. 2022, 74, 127624. [Google Scholar] [CrossRef]
  44. Li, Y.; Wang, X.; Wang, F.; Feng, K.; Li, H.; Han, Y.; Chen, S. Temporal and Spatial Characteristics of Agricultural Drought Based on the TVDI in Henan Province, China. Water 2024, 16, 1010. [Google Scholar] [CrossRef]
  45. Mojtaba, H.; JeanDenis, M.; Thomas, C. An Infrastructure Perspective for Enhancing Multi-functionality of Forests: A Conceptual Modeling Approach. Earths Future 2021, 9, e2019EF001369. [Google Scholar] [CrossRef]
  46. Kuvan, Y. The use of forests for the purpose of tourism: The case of Belek Tourism Center in Turkey. J. Environ. Manag. 2005, 75, 263–274. [Google Scholar] [CrossRef] [PubMed]
  47. Joseph, G. The niche-relationships of the California Thrasher. Auk 1917, 34, 427–433. [Google Scholar]
  48. Elton, C. Animal Ecology; Sidgwick and Jackson: London, UK, 2002; pp. 187–188. [Google Scholar]
  49. Hutchinson, G.E. Concluding remarks-cold spring harbor symposia on quantitative biology. Theor. Biol. Bull. Math Biol. 1991, 53, 193–213. [Google Scholar] [CrossRef]
  50. Wang, W.; Wang, S.Q.; Li, Y.S.; Feng, C. Assessing the sustainability and competitiveness of tourism economies in China’s Chengdu-Chongqing metropolitan area. Environ. Sci. Pollut. Res. 2022, 29, 66960–66978. [Google Scholar] [CrossRef]
  51. Xiang, Y. Tourism competition: The new perspective of niche analysis. Anhui Agric Sci. 2009, 37, 12771–12772. (In Chinese) [Google Scholar] [CrossRef]
  52. Wu, Y.X.; Yang, S.S.; Li, Y.S. Multidimensional Measurement and Enhancement Strategies of the Provincial Ecological Niche in the Yellow River Basin. Sustainability 2022, 14, 13034. [Google Scholar] [CrossRef]
  53. Li, Y.H.; Yuan, Y.; Cheng, N. Analysis on spatial difference and spillover effect of development resilience index of sports industry: A case study of 285 cities in China. PLoS ONE 2023, 18, e0295313. [Google Scholar] [CrossRef] [PubMed]
  54. Psaltoglou, A.; Vakali, A. An exploratory approach for urban data visualization and spatial analysis with a game engine. Multimed. Tools Appl. 2021, 80, 15849–15873. [Google Scholar] [CrossRef]
  55. Wang, L.G.; Zhao, H.X.; Wu, W.N.; Song, W.; Zhou, Q.S.; Ye, Y.T. Time-Varying Evolution and Impact Analysis of Forest Tourism Carbon Emissions and Forest Park Carbon Sinks in China. Forests 2024, 15, 1517. [Google Scholar] [CrossRef]
  56. Su, H.; Chen, Y.M.; Tan, H.Y.; Zhou, A.N.; Chen, G.D.; Chen, Y.J. Estimating Regional PM2.5 Concentrations in China Using a Global-Local Regression Model Considering Global Spatial Autocorrelation and Local Spatial Heterogeneity. Remote Sens. 2022, 14, 4545. [Google Scholar] [CrossRef]
  57. Wang, J.F.; Xu, C.D. Geographic detectors: Principles and prospects. Acta Geogr. Sinica 2017, 72, 116–134. (In Chinese) [Google Scholar]
  58. Peng, Q.X.; Xuan, L.F. Evaluation of County Economic Resilience in Henan Province Based on the Entropy Weight-Normal Cloud Model. Complexity 2023, 2023, 1308095. [Google Scholar] [CrossRef]
  59. Chen, X.D.; Yang, Z.P.; Han, F. Tourist landscape vulnerability assessment in mountainous world natural heritage sites: The case of Karajun-Kurdening, Xinjiang, China. Ecol. Indic. 2023, 148, 110038. [Google Scholar] [CrossRef]
  60. Ren, X.Y.; Zhang, M.K.; Qian, J.C.; Li, S.Q.; Wang, J.X.; Du, J. Analyzing spatio-temporal change in ecosystem quality and its driving mechanism in Henan province, China, from 2010 to 2020. Sustainability 2022, 14, 11742. [Google Scholar] [CrossRef]
  61. Ma, X.L.; Jiao, S.X. Comprehensive analysis of water resources from the perspective of water footprint and water ecological footprint: A case study from Anyang City, China. Environ. Scence Pollut. Res. 2023, 30, 2086–2102. [Google Scholar] [CrossRef]
  62. AlHaddad, M.; Arar, M.; Alhammad, R. Toward sustainable urban growth: Spatial modeling for the impact of cultural and natural heritage on city growth and their role in developing sustainable tourism. Alex. Eng. J. 2023, 69, 639–676. [Google Scholar] [CrossRef]
  63. Rodríguez-Piñeros, S.; Mayett-Moreno, Y. Forest owners’ perceptions of ecotourism: Integrating community values and forest conservation. Ambio 2015, 44, 99–109. [Google Scholar] [CrossRef] [PubMed]
  64. Fan, C.J.; Zhou, L.L.; Gai, Z.Y.; Shen, S.G.; Liu, C.; Li, S.Q. Multi-dimensional evaluation framework for the sustainable development of forest health bases and site selection for application in China. Forests 2022, 13, 799. [Google Scholar] [CrossRef]
  65. Gu, X.P.; Hunt, C.A.; Jia, X.; Niu, L.J. Evaluating nature-based tourism destination attractiveness with a fuzzy-AHP approach. Sustainability 2022, 14, 7584. [Google Scholar] [CrossRef]
  66. Jiao, Y.; Yang, J.X.; Li, J.F.; Lin, L.; Ren, Y.J. The role of tourism in promoting the urbanization of ethnic border areas: A case study of Xishuangbanna. Sustainability 2023, 15, 15119. [Google Scholar] [CrossRef]
  67. Yang, J.; Zheng, B.; Chen, Z.H. Optimization of Tourism Information Analysis System Based on Big Data Algorithm. Complexity 2020, 2020, 8841419. [Google Scholar] [CrossRef]
  68. Ummar, R.; Shaheen, K.; Bashir, I.; Haq, J.U.; Bonn, M.A. Green social media campaigns: Influencing consumers’ attitudes and behaviors. Sustainability 2023, 15, 12932. [Google Scholar] [CrossRef]
  69. Ma, D.Q.; Hu, J.S.; Yao, F.J. Big data empowering low-carbon smart tourism study on low-carbon tourism O2O supply chain considering consumer behaviors and corporate altruistic preferences. Comput. Ind. Eng. 2021, 153, 107061. [Google Scholar] [CrossRef]
  70. Zhou, Y.; Yao, J.; Li, P.Y.; Li, B.; Luo, Y.S.; Ning, S.B. Multilevel green space ecological network collaborative optimization from the perspective of scale effect. Ecol. Indic. 2024, 166, 112562. [Google Scholar] [CrossRef]
Figure 1. Study site: Henan Province, central China.
Forests 16 00483 g001
Figure 2. The flow chart of the research.
Forests 16 00483 g002
Figure 3. The result of five dimensions in FTDL evaluation in three periods: (a) the result of five dimensions during 2018–2019; (b) the result of five dimensions during 2019–2020; and (c) the result of five dimensions during 2020–2021.
Forests 16 00483 g003
Figure 4. FTDL spatial pattern in Henan Province: (a) FTDL during 2018–2019; (b) FTDL during 2019–2020; and (c) FTDL during 2020–2021.
Forests 16 00483 g004
Figure 5. LISA clustering pattern of FTDL in Henan Province: (a) LISA cluster map for 2018–2019; (b) LISA cluster map for 2019–2020; and (c) LISA cluster map for 2020–2021.
Forests 16 00483 g005
Table 1. Forest tourism ecological niche evaluation system in Henan Province.
First Level Indicator Second Level Indicator Third Level Indicator
FTDL in HenanA1 forest tourism resourceB1 resource richness
B2 resource visibility
B3 resource diversity
B4 number of special resources
B5 recreational value of resources
B6 scientific research value of resources
A2 forest tourism marketB7 resident population
B8 lodging and catering revenues
B9 number of star-rated hotels
B10 number of travel agencies
B11 tourist arrivals
B12 total tourism income
B13 market influence
A3 socioeconomic developmentB14 gross domestic product (GDP)
B15 GDP per capita
B16 total value of tertiary industry
B17 total retail value of consumer goods
B18 total passenger transportation
B19 infrastructure scale and completeness.
A4 ecological environment conditionB20 forest land area
B21 area covered by greenery
B22 ecological condition index (EI)
B23 ambient air quality
B24 quality of acoustic environment
B25 urban groundwater quality
B26 water quality of centralized drinking water sources
B27 temperature comfort
B28 inhalable particulate matter (PM10)
A5 local residents’ supportB29 resident participation
B30 resident satisfaction
B31 tourism income of residents
B32 consumption level of residents
B33 per capita disposable income of residents
Table 2. The result of FTDL evaluation and rankings of 18 prefecture-level cities in Henan Province.
Municipalities2018–2019Score Ranking2019–2020Score Ranking2020–2021Score Ranking
Zhengzhou0.135710.15710.12071
Kaifeng0.0391130.0335140.044413
Luoyang0.118420.090730.0842
Pingdingshan0.053290.046100.038914
Jiaozuo0.063650.0455110.06356
Hebi0.0443110.0183180.05469
Xinxiang0.057680.066750.06745
Anyang0.0231170.0446120.07154
Puyang0.0046180.0323150.045512
Xuchang0.0414120.050580.032516
Luohe0.0314140.0349130.046911
Sanmenxia0.061370.053370.048810
Nanyang0.099230.092220.07393
Shangqiu0.0293150.0297160.027117
Xinyang0.064740.084740.0597
Zhoukou0.0243160.046290.037615
Zhumadian0.0456100.055560.026318
Jiyuan0.063160.0183170.05748
Table 3. FTDL spatial correlation in Henan Province.
YearIFTZ-Valuep-Value
2018–20190.19631.49130.0760
2019–2020−0.1840−0.80080.2360
2020–2021−0.00830.27510.3760
Table 4. Factors influencing FTDL spatiotemporal evolution in Henan Province.
Detection Factor2018–20192019–20202020–2021
q-Valuep-Valueq-Valuep-Valueq-Valuep-Value
B10.51140.18970.57910.17880.39710.5346
B20.58100.05980.28570.43040.52800.0965
B40.36640.47310.29910.73430.36690.5696
B60.45430.14560.24770.47490.5562 *0.0500
B70.27320.50640.47150.20320.51960.7331
B80.45090.67730.8914 *0.00360.63070.4766
B90.8413 *0.01860.7260 *0.04490.24630.8615
B100.45210.69880.40440.48770.64390.4998
B110.66290.10460.67500.07590.41400.2305
B120.70630.05870.79780.08830.43410.3617
B140.71610.13920.9029 *0.00270.75480.2217
B150.21570.58800.21420.73850.37260.5474
B160.79380.05780.9027 *0.00280.75380.2088
B170.45090.70340.8246 *0.03480.64030.5003
B180.25830.56050.25850.67100.10100.9425
B190.68960.35150.8434 *0.03180.52480.8395
B200.54270.24680.36650.46530.26700.7498
B210.8045 *0.04390.9024 *0.00270.64490.6622
B230.16480.81960.16350.83030.05160.9843
B270.25180.52260.22510.55520.03780.9944
B280.16490.81390.09070.88120.44700.2050
B290.53930.52670.69280.28270.56530.6934
B300.35280.30180.23760.52460.10580.8283
B310.35010.42370.11330.84040.14590.8162
B320.25830.47850.10970.86510.47730.4190
Note: * indicates that the detection factor is significant at a 0.01 confidence level.
Disclaimer/Publisher’s Note: The statements, opinions and data contained in all publications are solely those of the individual author(s) and contributor(s) and not of MDPI and/or the editor(s). MDPI and/or the editor(s) disclaim responsibility for any injury to people or property resulting from any ideas, methods, instructions or products referred to in the content.

