Article

Identification of bHLH Family Genes in Rhododendron hainanense Merr. and Verification of Their Role in Heat Tolerance

Key Laboratory of Ministry of Education for Genetics and Germplasm Innovation of Tropical Special Trees and Ornamental Plants, Hainan Biological Key Laboratory for Germplasm Resources of Tropical Special Ornamental Plants, College of Tropical Agriculture and Forestry, Hainan University, Haikou 570228, China
*
Author to whom correspondence should be addressed.
Forests 2025, 16(3), 416; https://doi.org/10.3390/f16030416
Submission received: 14 January 2025 / Revised: 17 February 2025 / Accepted: 22 February 2025 / Published: 25 February 2025
(This article belongs to the Section Genetics and Molecular Biology)

Abstract

:
Rhododendron hainanense Merr. is a tropical flowering shrub with high ornamental and medicinal value, but high temperatures are a limiting factor for its landscape application. The bHLH transcription factor family regulates plant growth and development and is crucial for responses to various stresses; however, its mechanism for regulating high-temperature stress remains unclear. This study conducted a whole-genome analysis of R. hainanense, identifying 117 RhbHLH members with complete domains, unevenly distributed across 12 chromosomes. Using Arabidopsis thaliana (L.) Heynh. as a reference, the 117 RhbHLH genes were systematically categorized into 21 subfamilies. Conserved sequence analysis showed that motifs 1 and 2 form the characteristic bHLH domain, while motifs 3–6 exhibit significant conservation. Analysis of gene duplication events indicated that R. hainanense has eight pairs of segmental duplications, suggesting their role in potential adaptive evolution. Transcriptomic studies revealed that genes such as RhbHLH107 and RhbHLH49 were highly expressed in response to high temperatures, suggesting their involvement in regulating heat stress. Furthermore, the RhbHLH gene showed a strong correlation with common metabolites like flavonoids and jasmonic acid under high temperatures, indicating that these genes may participate in regulating jasmonic acid and flavonoids to mediate plant stress responses. This study lays the foundation for further research on the role of the bHLH gene family in plant heat tolerance and provides a basis for future applications in breeding and horticulture.

1. Introduction

High temperatures are increasingly being noticed globally and are one of the extreme climate changes faced by humanity. Rising temperatures greatly affect crop yields, thus exploring the heat tolerance mechanisms of plants and cultivating heat-resistant varieties has become a current priority. R. hainanense is a type of evergreen shrub belonging to the genus Rhododendron, first discovered in Hainan Province, China, and growing in Hainan Province and southern Guangxi, typically at an altitude of 300–900 m [1]. Its branches are upright, and its flowers are vibrant and beautiful, making it an excellent landscape plant; triterpenes and flavonoids extracted from its leaves can also be used as plant antibacterial agents widely in the medical field; thus, it has high ornamental and medicinal value. Compared to most high-altitude areas, R. hainanense grows in low-latitude and low-altitude regions, exhibiting more significant environmental differences and better heat tolerance than other Rhododendron species [2]. However, R. hainanense typically grows in humid environments, on the shady side of mountains or near rivers [3], and high temperatures remain the main limitation for its application in landscaping [4]. R. hainanense planted in urban areas often suffers varying degrees of heat damage. Enhancing the heat tolerance of R. hainanense can expand its application prospects in landscaping and increase the economic value it brings.
The bHLH family is one of the largest transcription factor families in plants and helps regulate plant growth and development, hormonal regulation, and stress resistance [5]. The bHLH family is named for the presence of the bHLH motif in its structure [6]. All bHLH proteins have a conserved domain of approximately 60 amino acids, which includes a DNA-binding basic region, located at the N terminus of the polypeptide chain, and is composed of numerous basic amino acids. At the C terminus of the polypeptide chain, it consists of ‘α helix 1’ and ‘loop region’ and ‘helix 2’, which is mainly composed of hydrophobic amino acid residues [7]. These amino acid residues can interact with other transcription factors to form dimers and exert their functions [8,9]. This family was first identified in Drosophila [10]. Simionato [11] identified the bHLH genes in plants using bioinformatics. Ledent [12] classified the bHLH gene family from a bioinformatics perspective and divided them into six groups based on the DNA sequences that bind to the bHLH protein. These groups are A/B/C/D/E/F. However, Buck found that the bHLH transcription factor families in plants and animals are mutually independent, their evolutionary lineages being completely different. Phylogenetic analysis of all known bHLH gene sequences in plants indicates that they all share a common ancestor with the b group members of animal bHLH [13]. Following this, Li classified all bHLH genes in rice and A. thalianas into 25 families [14], which will serve as a reference for this study.
Previous studies have shown that bHLH genes regulate plant growth and development. The dimer formed by MYB114 and bHLH in A. thalianas upregulates the expression of anthocyanins [15], while OsbHLH164 in Oryza sativa (L.) is significantly expressed in meristematic tissues and regulates the formation of axillary bud primordia in O. sativa [16]. Moreover, the bHLH gene family plays a crucial role in developmental processes, including root growth and differentiation [17], leaf size [18], and stamen development [19]. In addition, bHLH genes are related to plant responses to abiotic stress. It has been reported that AtbHLH122 in A. thalianas acts specifically on the ABA pathway to increase the level of abscisic acid in cells [20]. A. thalianas overexpressing AtbHLH122 shows better drought and salt tolerance, while AtbHLH122 knockout mutants are highly sensitive to drought and NaCl, further indicating that AtbHLH122 has a positive response in regulating the stress resistance of A. thalianas [21]. AtbHLH15 senses the iron levels in the plant growth environment, and gene silencing shows severe iron deficiency symptoms. Overexpression alleviates the effects of Fe deficiency [22]. Furthermore, bHLH transcription factors mediate heat tolerance by regulating plant biosynthetic pathways. OsbHLH13 is involved in the regulation of anthocyanin biosynthesis in rice [23], while the PIF4/PIF5 transcription factors in A. thalianas can bind to phytochromes and promote the plant’s shade avoidance response [24]. Research shows that the bHLH transcription factor PIF4 in A. thalianas can interact with phytochrome and DELLA proteins to regulate the elongation of the hypocotyl in high-temperature environments, thereby reducing the adverse effects of high temperatures on plants. In contrast, the PIF4 mutant transferred to high temperatures does not exhibit elongation response [25]. In conclusion, the bHLH gene family has multiple pathways mediating plant responses to growth, development, and stress. It has been reported that the bHLH gene family can participate in the response process of high temperature stress in many species, but how it exerts heat stress effects in R. hainanense has not been mentioned.
This study aims to utilize bioinformatics methods to identify and analyze the bHLH gene family of R. hainanense and systematically study its phylogenetic relationships, chromosome distribution, sequence collinearity, gene structure, etc. In addition, through transcriptome analysis, key genes associated with heat stress bHLH regulation were screened, aiming to gain a deeper understanding of RhbHLH genes that enhance the heat resistance of R. hainanense at the molecular level. Overall, this study lays a foundation for future research on the gene functions of bHLH in R. hainanense.

2. Materials and Methods

2.1. Growth Condition and Evaluation of Heat Resistance of R. hainanense

The materials used in this experiment, R. hainanense, were sourced from the agricultural science base of Hainan University (Haikou, China) (20.057 N, 110.323 E, 6 m above sea level), and three-year-old R. hainanense samples with consistent growth were selected. The plant is in the late growth period, the rhizome becomes thicker, and the root system is intact. The samples were cultured in an artificial climate chamber (25 °C/22 °C, 14 h/10 h, 2000 μmol m−2 s−1, 75% Rh) for 30 days to ensure the same initial state. Subsequently, high-temperature treatment (40 °C/32 °C, 14 h/10 h, 2000 lx, 75% Rh) was conducted for 7 days. We collected 3–5 rounds of leaf samples from the apex at time points of 0 h, 3 h, 6 h, 9 h, 12 h, 24 h, 3 d, 5 d, and 7 d, with three replicates each, and each replicate from ten plant lines (Figure 1). The leaves were frozen in liquid nitrogen and stored at −80 °C for subsequent experiments. To systematically gain a preliminary understanding of the heat tolerance of R. hainanense, we compared it with the closely related species Rhododendron dauricum (L.) Planch to evaluate the heat tolerance of R. hainanense. R. dauricum is a plant in the Ericaceae family, and it is mentioned in the literature that R. dauricum and R. hainanense belong to the same genus, showing a close evolutionary relationship [26]. It is currently widely used in landscape gardening. Comparisons between Rhododendron species reveal that R. dauricum has excellent heat tolerance [27], making it a suitable control material for studying the heat tolerance of R. hainanense. The growth and treatment indices of R. dauricum were consistent with those of R. hainanense.
Leaves were taken from heat-treated R. hainanense and R. dauricum to analyze the content of malondialdehyde (MDA), proline (PRO), hydrogen peroxide (H2O2), and superoxide dismutase (SOD) activity. The MDA content was measured by the thiobarbituric acid method according to Hodge and others [28]. The content of free proline was determined using the acidic ninhydrin colorimetric method [29]. The content of hydrogen peroxide was determined using the titanium salt method. We used the NBT method to determine SOD activity. All the experiments mentioned above were completed using the reagent kits from the following biotechnology companies: MDA: Malondialdehyde (MDA) Content Assay Kit (Sangon biotech, Shanghai, China); PRO: Proline (PRO) Content Assay Kit (Sangon biotech, Shanghai, China); H2O2: Hydrogen Peroxide (H2O2) Content Assay Kit (Sangon biotech, Shanghai, China); SOD: Superoxide Dismutase (SOD) Activity Assay Kit (Sangon biotech, Shanghai, China). Significance, variance analysis, and visualization of the data were performed using SPSS (IBM SPSS Statistics 26).

2.2. Identification of bHLH Members in R. hainanense

The team already obtained R. hainanense genomic data. Using the genome data of R. hainanense, bHLH members of R. hainanense were screened. First, the bHLH HMM model was downloaded from the PFAM database (PF00010) (http://Pfam.xfam.org/, accessed on 13 July 2022), and the protein file was obtained using the HMMER (http://hmmer.janelia.org/, accessed on 13 July 2022) search of the HMM file (E < 1 × 10⁻²⁰) at [30]. The bHLH protein file of A. thalianas was obtained through the online website TAIR (https://www.Arabidopsis.org/, accessed on 15 July 2022) and compared with the complete protein of R. hainanense using TBtools software (version 2.119) to obtain the RhbHLH protein file. The shared sequences from both sides were considered as preliminary R. hainanense bHLH members. To verify the conservativeness, the prediction of conserved domains was conducted using the CDD (https://www.ncbi.nlm.nih.gov/Structure/bwrpsb/bwrpsb.cgi, accessed on 15 July 2022) database, further filtering the identified Hainan R. hainanense bHLH gene family, ensuring that all sequences contain the bHLH domain. In addition, through the online tool ExPASy (https://web.expasy.org/protparam/, accessed on 15 July 2022), the analysis of bHLH family proteins’ amino acid number, isoelectric point (pI), and molecular weight (MW) was conducted [31]. Using the Plant-mPLoc online tool (http://www.csbio.sjtu.edu.cn/bioinf/plant-multi/, accessed on 15 July 2022) to predict subcellular localization of the target proteins, the results were analyzed and categorized based on their predicted localization sites, such as the nucleus, cytoplasm, chloroplast, mitochondria, or plasma membrane. This tool utilizes a multi-label classification system to provide accurate predictions of protein subcellular localization in plants.

2.3. Chromosomal Positioning, Gene Duplication, and Synteny Analysis

The gene position was provided by the GFF file, and the TBtools (version 2.119) visualization tool was used to visualize the chromosomal positions of all bHLH members. The TBtools (version 2.119) MCScanX tool was used to analyze gene duplication events [32], with the standard adopted being long genes with lengths that covered 75% of the comparable sequences and 75% of the similarity alignment regions. Co-linearity analysis was conducted within the R. hainanense genome, as well as between R. hainanense and A. thaliana, R. hainanense and O. sativa, and R. hainanense and R. dauricum. The A. thaliana protein file sources were obtained from https://www.arabidopsis.org/, accessed on 15 July 2022, the O. sativa protein file sources were obtained from https://www.ncbi.nlm.nih.gov/datasets/taxonomy/39947/, accessed on 15 July 2022, and the R. dauricum protein file sources were obtained from http://bioinfor.kib.ac.cn/RPGD/download_genome.html, accessed on 15 July 2022. BLASTp was used to conduct homology comparison of 117 RhbHLH protein sequences with other species’ bHLH proteins, with an output e-value < 1 × 10⁻¹⁰. The output file and the simplified gene locus file were input into MCScanX, and default settings were used to identify duplication types. For the repeated sequences in RhbHLH, the Ka/Ks calculator (version 1.0) was used to calculate the non-synonymous (Ka) and synonymous (Ks) values [33].

2.4. Analysis of Conserved Motifs, Gene Structure, and Phylogenetic Tree

Conserved motif identification: Based on 117 RhbHLH proteins, the MEME (version 5.5.7) online platform (https://meme-suite.org/meme/tools/meme, accessed on 15 July 2022) was used to identify the conserved motifs in their protein sequences. The parameters were configured to 8 motifs for each RhbHLH gene, with the optimal width of each motif being between 6 and 50. Conserved domain identification was conducted by using the NCBI-CDD online website (https://www.ncbi.nlm.nih.gov/Structure/cdd/cdd.shtml, accessed on 15 July 2022) to identify conserved domains. Gene structure visualization was conducted by using the sequence 2000 bp upstream of the CDS sequence as the gene promoter sequence, obtaining the intron and exon positions of the bHLH genes from the gff file, and visualizing the gene structure using TBtools (version 2.119). Constructing a phylogenetic tree to analyze the evolutionary degree of the bHLH family in R. hainanense, we used the bHLH family of the model plant A. thalianas as a reference, downloading 162 A. thalianas bHLH proteins [34]. We input the files into MEGAX, comparing the bHLH sequences of A. thalianas and R. hainanense [30] and using the maximum likelihood method (ML) to generate a phylogenetic tree with a bootstrap value of 1000. Visualization can be done in TBtools (version 2.119).

2.5. Protein Structure Visualization and Protein Interaction Network Analysis

According to the RhbHLH sequence translated into the protein sequence, the SWISS-MODEL(BETA SERVICE) (https://swissmodel.expasy.org/, accessed on 15 July 2022) database was used to predict and analyze the 3D structure of RhbHLH protein-forming conformations. Then, visual judgment analysis was conducted. All RhbHLH proteins were submitted to the STRING database (https://cn.string-db.org/, accessed on 15 July 2022). The direct homologous sequences of A. thalianas were selected as references for BLAST (version 11.5), and a network was constructed using the highest scoring genes.

2.6. Expression Patterns and Differential Gene Screening

The materials used in the experiment are described in detail in Section 2.1. RNA was extracted using the RNAprep pure plant kit (Tiangen, Beijing, China) from the leaves of R. hainanense on day 0 RNA and day 7 RNA, and genomic DNA was removed using DNasel (Sigma, Louis, MI, USA). The RNA concentration and quality were determined using the Nanodrop 2000 spectrophotometer (Thermo Fisher, Waltham, MA, USA) and the Bioanalyzer 2100 (Agilent, Waldbronn, Germany), respectively. Samples that passed quality control were used for transcriptome library construction. Oligo (dT) magnetic beads were used to enrich polyA tail mRNA, and then ribosomal RNA was extracted from total RNA, fragmenting the sample with a fragmentation buffer into short fragments. Using the short fragment RNA as a template, a six-base random hexamer was added, followed by buffer to synthesize the first strand cDNA. First-strand cDNA was synthesized using six-base random primers (random hexamers). Buffer dNTPs (dUTP, dATP, dGTP, dCTP) and DNA polymerase were then added to synthesize double-strand cDNA. Then, the purified double-strand cDNA was subjected to end repair, adding an A tail and ligating sequencing adapters. The final cDNA library was enriched through PCR to obtain the final cDNA library. After constructing the library, initial quantification was performed using Qubit 2.0, and the insert size of the library was detected using Agilent 2100. Once the insert size met expectations, sequencing was conducted using the Illumina HiSeq platform. Before data analysis, we removed reads with adapters, Npaired reads with a content over 10% of base pairs, and paired reads with a quality low (q ≤ 20) where the number of low quality bases exceeded 50% of the read length, and clean reads were compared with the reference genome using hisat2. Sequence comparison was performed using the StringTie software (version 11.5), measuring gene expression through FPKM (Fragments Per Kilobase of transcript per Million mapped reads). The deseq2 was applied to identify differentially expressed genes (DEGs) with these screening conditions: false discovery rate (FDR) ≤ 0.05 and Fold Change > 2 or |log2Ratio| ≥ 1. Using FDR ≤ 0.05 as a standard, gene ontology (GO) enrichment analysis and Kyoto Encyclopedia of Genes and Genomes (KEGG) pathway enrichment analysis were performed on DEGs using topGO (Version 2.58.0) and KOBAS (Version 3.0) software.
To filter the bHLH genes that change significantly under high-temperature treatment, genes were identified as high-temperature DEGs based on the standard (log2 (FoldChange) ≥ 1 & padj ≤ 0.05). A visual heatmap was then created based on 117 research-related bHLH genes to analyze the expression patterns under high-temperature treatment. Using log10 (FPKM + 1) values to generate the heatmap allows for a more intuitive observation of the differences in expression patterns.

2.7. Analysis of Differential Metabolites and Association Analysis with Differential Genes

For this project, 6 samples of R. hainanensis were selected and divided into 2 groups according to the heat treatment time: RhTN group (normal temperature group, heat treatment day 0) and RhTH group (high temperature group, heat treatment day 7), with a total of 3 biological replicates in each group (RhTN1, RhTN2, RhTN3 and RhTH1, RhTH2, RhTH3). A total of 783 metabolites were detected based on the UPLC-MS/MS detection platform and a self-built database. The data acquisition instrument system mainly includes Ultra Performance Liquid Chromatography (UPLC) (SHIMADZU Nexera X2, https://www.shimadzu.com.cn/, accessed on 6 April 2021) and Tandem mass spectrometry (MS/MS) (Applied Biosystems 6500 QTRAP, https://sciex.com.cn/applications/life-science-research/proteomics, accessed on 6 April 2021). The liquid phase conditions mainly include (1) Chromatographic column: Agilent SB-C18 1.8 µm, 2.1 mm × 100 mm; (2) Mobile phase: Phase A is ultra-pure water (with 0.1% formic acid), Phase B is acetonitrile (with 0.1% formic acid); (3) Elution gradient: At 0.00 min, the proportion of Phase B is 5%, increasing linearly to 95% within 9.00 min, maintaining at 95% for 1 min, then from 10.00–11.10 min, the proportion of Phase B drops to 5% and is balanced at 5% until 14 min; (4) Flow rate is 0.35 mL/min; column temperature is 40 °C; injection volume is 2 μL. The mass spectrometry conditions mainly include LIT and triple quadrupole (QQQ) scanning is obtained on a triple quadrupole linear ion trap mass spectrometer (Q TRAP), AB6500 Q TRAP UPLC/MS/MS system, which is equipped with ESI Turbo ion spray interface, controlled by Analyst 1.6.3 software (AB Sciex) in both positive and negative ion modes. The ESI source operational parameters are as follows: ion source, turbo spray; source temperature 550 °C; ion spray voltage (IS) 5500 V (positive ion mode)/−4500 V (negative ion mode); ion source gas I (GSI), gas II (GSII), and curtain gas (CUR) are set to 50, 60, and 25.0 psi, respectively, and the collision-induced ionization parameters are set to high. Based on the self-built database MWDB (metware database), substance qualitative analysis was conducted according to secondary spectrum information, with the removal of isotope signals, duplicate signals containing K+, Na+, NH4+, and duplicate signals of fragment ions that are themselves other larger molecular weight substances. The quantification of metabolites was completed using the multiple reaction monitoring mode (MRM) of the triple quadrupole mass spectrometry.
Based on accurate metabolomics data, principal component analysis (PCA) and partial least squares discriminant analysis (PLS-DA) were conducted to verify reproducibility, while metabolites with log2 (FC) > 1.5 and p-value < 0.05 were considered differential metabolites (DAMs). To clarify the regulatory mechanism of the RhbHLH gene on high-temperature stress in R. hainanense, a correlation analysis was performed between DAMs and differentially expressed genes (DEGs) using transcriptome data. The Pearson correlation coefficient (PCC) was used to assess the correlation between differential genes and differential metabolites, with |PCC| > 0.8 and pccp < 0.05 considered statistically significant. Subsequently, specific common metabolites under high-temperature stress were screened from DAMs and significantly correlated DEGs were identified for analysis.

2.8. Real-Time Fluorescence Quantitative Verification

We used an RNA extraction kit (Tiangen, Beijing, China) to extract total RNA from heat-treated Hainan Rhododendron, with three replicates per group, and measured its total RNA quality using NanoDrop (Thermo, ND-2000, Shanghai, China). We used a reverse transcription kit (Vazyme, Nanjing, China) to reverse transcribe it into cDNA. Five candidate genes were selected for RNA-seq validation. Primer Premier (version 5.00) was used for specific primer design, with the primer list provided in the Supplementary File S1. The real-time fluorescent quantitative PCR system from American Company Biosystem (Roanoke, VA, USA) was used, with 18 s as the housekeeping gene, and the 2−ΔΔCT method was used to calculate the relative expression of target genes.

3. Results

3.1. Comparison of High-Temperature Treatment of R. hainanense and R. dauricum

To investigate the heat tolerance potential of Hainan R. dauricum, this study uses R. hainanense as the experimental material and the closely related heat-tolerant species R. dauricum Planch as a control. By examining the physiological changes in the leaves of both species under high-temperature stress, we can further observe the heat tolerance performance of R. hainanense within the Rhododendron genus.

3.1.1. Changes in Hydrogen Peroxide Content

Hydrogen peroxide is an active oxygen species produced during the metabolic process of plants, and excessive accumulation can cause strong oxidative damage to membrane lipids [35]. With the prolonged duration of high-temperature stress, both types of Rhododendrons showed an increase in hydrogen peroxide content during the early stage of heat treatment (3 h). The R. hainanense reached a peak at the 12 h mark, rising by 119.50% compared to the untreated state; the R. dauricum reached a minimum at 6 h, which was 68.01% of the untreated state, but began to increase during the later stage of heat treatment (5 d), reaching a peak at 7 d, which was a 262.49% increase compared to 0 h (Figure 2A). This indicates that hydrogen peroxide continuously accumulates in R. hainanense during the early stage of thermal stress, starts to degrade at 12 h, and then shows stable fluctuations; R. dauricum exhibits stable fluctuations in the early stage of heat treatment, with accumulation gradually increasing over time, and the increase is significantly higher than that of R. hainanense. This suggests that compared to R. hainanense, R. dauricum has superior hydrogen peroxide scavenging ability in a short period, but R. hainanense performs better under prolonged high temperatures.

3.1.2. Changes in Proline Content

Proline is an osmotic regulator in plant cells that helps plants adjust their intracellular osmotic pressure [36]. With the extension of high-temperature stress, the R. dauricum exhibits a fluctuating pattern of rising and falling, while the R. hainanense tends to stabilize (Figure 2B). The R. hainanense reaches its lowest point at 24 h, which is 69.71% of the control group, and peaks at 7 days, increasing by 26.78% compared to the control group. The R. dauricum shows more dramatic fluctuations, reaching its peak at 12 h and its trough at 24 h, with an increase of 62.72% and a decrease of 16.96% compared to the control group, respectively. Such an astonishing change in the R. dauricum within just 12 h is quite intriguing. The results indicate that, in the face of high-temperature stress, the proline levels in the R. dauricum fluctuate more intensely, while the R. hainanense exhibits a more stable trend, suggesting a more stable internal environment in the R. hainanense.

3.1.3. Changes in MDA Content

MDA, as the final product of plant membrane lipid peroxidation, can indicate the degree of cell membrane damage and the plant’s response to stress [37]. With the extension of treatment time, MDA initially shows a decrease followed by an increase. R. hainanense (26.63% of the control group) and R. dauricum (13.14% of the control group) both reach their minimum values at 3 h, while R. hainanense peaks at 9 h (119.94% of the control group), and R. dauricum peaks at 3 days (176.12% of the control group) (Figure 2C). It is evident that membrane lipid damage is exacerbated by high temperatures, with the increase in MDA for R. dauricum being greater than that for R. hainanense. The results indicate that R. hainanense had lower membrane peroxidation and stronger heat resistance.

3.1.4. Changes in the Activity of the Protective Enzyme SOD

Plant SOD can convert negative oxygen ions into hydrogen peroxide and oxygen, thereby reducing oxidative damage to cells [38]. Continuous high temperatures resulted in opposite effects on the two types of Rhododendrons: the SOD activity in R. hainanense showed a trend of first decreasing and then increasing, reaching its lowest point at 24 h (12.30% of initial activity) and peaking at 7 days (226.42% of initial activity); whereas R. dauricum first increased and then decreased, peaking at 6 h (277.04% of initial activity) and reaching its lowest point at 3 days (34.08% of initial activity) (Figure 2D), and this phenomenon is very interesting, indicating differences in the heat stress responses of the two types of Rhododendrons. The R. hainanense shows a stronger ability to eliminate peroxides and intracellular free radicals with prolonged heat treatment time.

3.2. Identification and Physicochemical Property Analysis of RhbHLH

Through initial screening using HMM models and BLASTp, sequences without the bHLH conserved domain were removed. We obtained 117 bHLH genes from R. hainanense. All bHLH members contain bHLH conserved domains so that amino acid sequence of RhbHLH members is conserved, forming the “basic”, ”helix 1”, ”loop structure”, and “helix 2” at once from the C-terminus to the N-terminus (Figure 3). They are named according to R. hainanense and labeled based on their positions on the chromosome as RhbHLH1-RhbHLH117 (File S2). The physicochemical properties of RhbHLH protein were analyzed such that 117 RhbHLH proteins contain 92 amino acids (RhbHLH84)-1617 amino acids (RhbHLH25), with relative molecular weights ranging from 10,392.66 (RhbHLH103) to 95,602.22 (RhbHLH26), and the predicted isoelectric points range from 4.81 (RhbHLH35) to 9.90 (RhbHLH90). According to the proteins’ instability index, except for RhbHLH5, RhbHLH8, RhbHLH59, RhbHLH62, RhbHLH85, and RhbHLH105, the other proteins are unstable in vitro. The lipolysis index indicates that, except for RhbHLH103, RhbHLH46, and RhbHLH84, the remaining proteins all have values less than 100. A low lipolysis index suggests that they have good hydrophilicity, and almost all protein hydrophilicity scores (GRAVY) are less than 0, indicating that they are primarily hydrophilic and water-soluble proteins. Such high hydrophilicity is likely closely related to their function as transcription factors. Detailed data can be found in the Supplementary File S2.
The upper part of the figure shows the 3D protein modeling of the bHLH characteristic structure of the RhbHLH gene, with blue, cyan, green, and red representing the basic, helix1, loop, and helix2 structures, respectively. The lower part of the figure illustrates the conservation of the characteristic sequences, where the more conserved the amino acid at the site, the higher the representation of the amino acid letter.

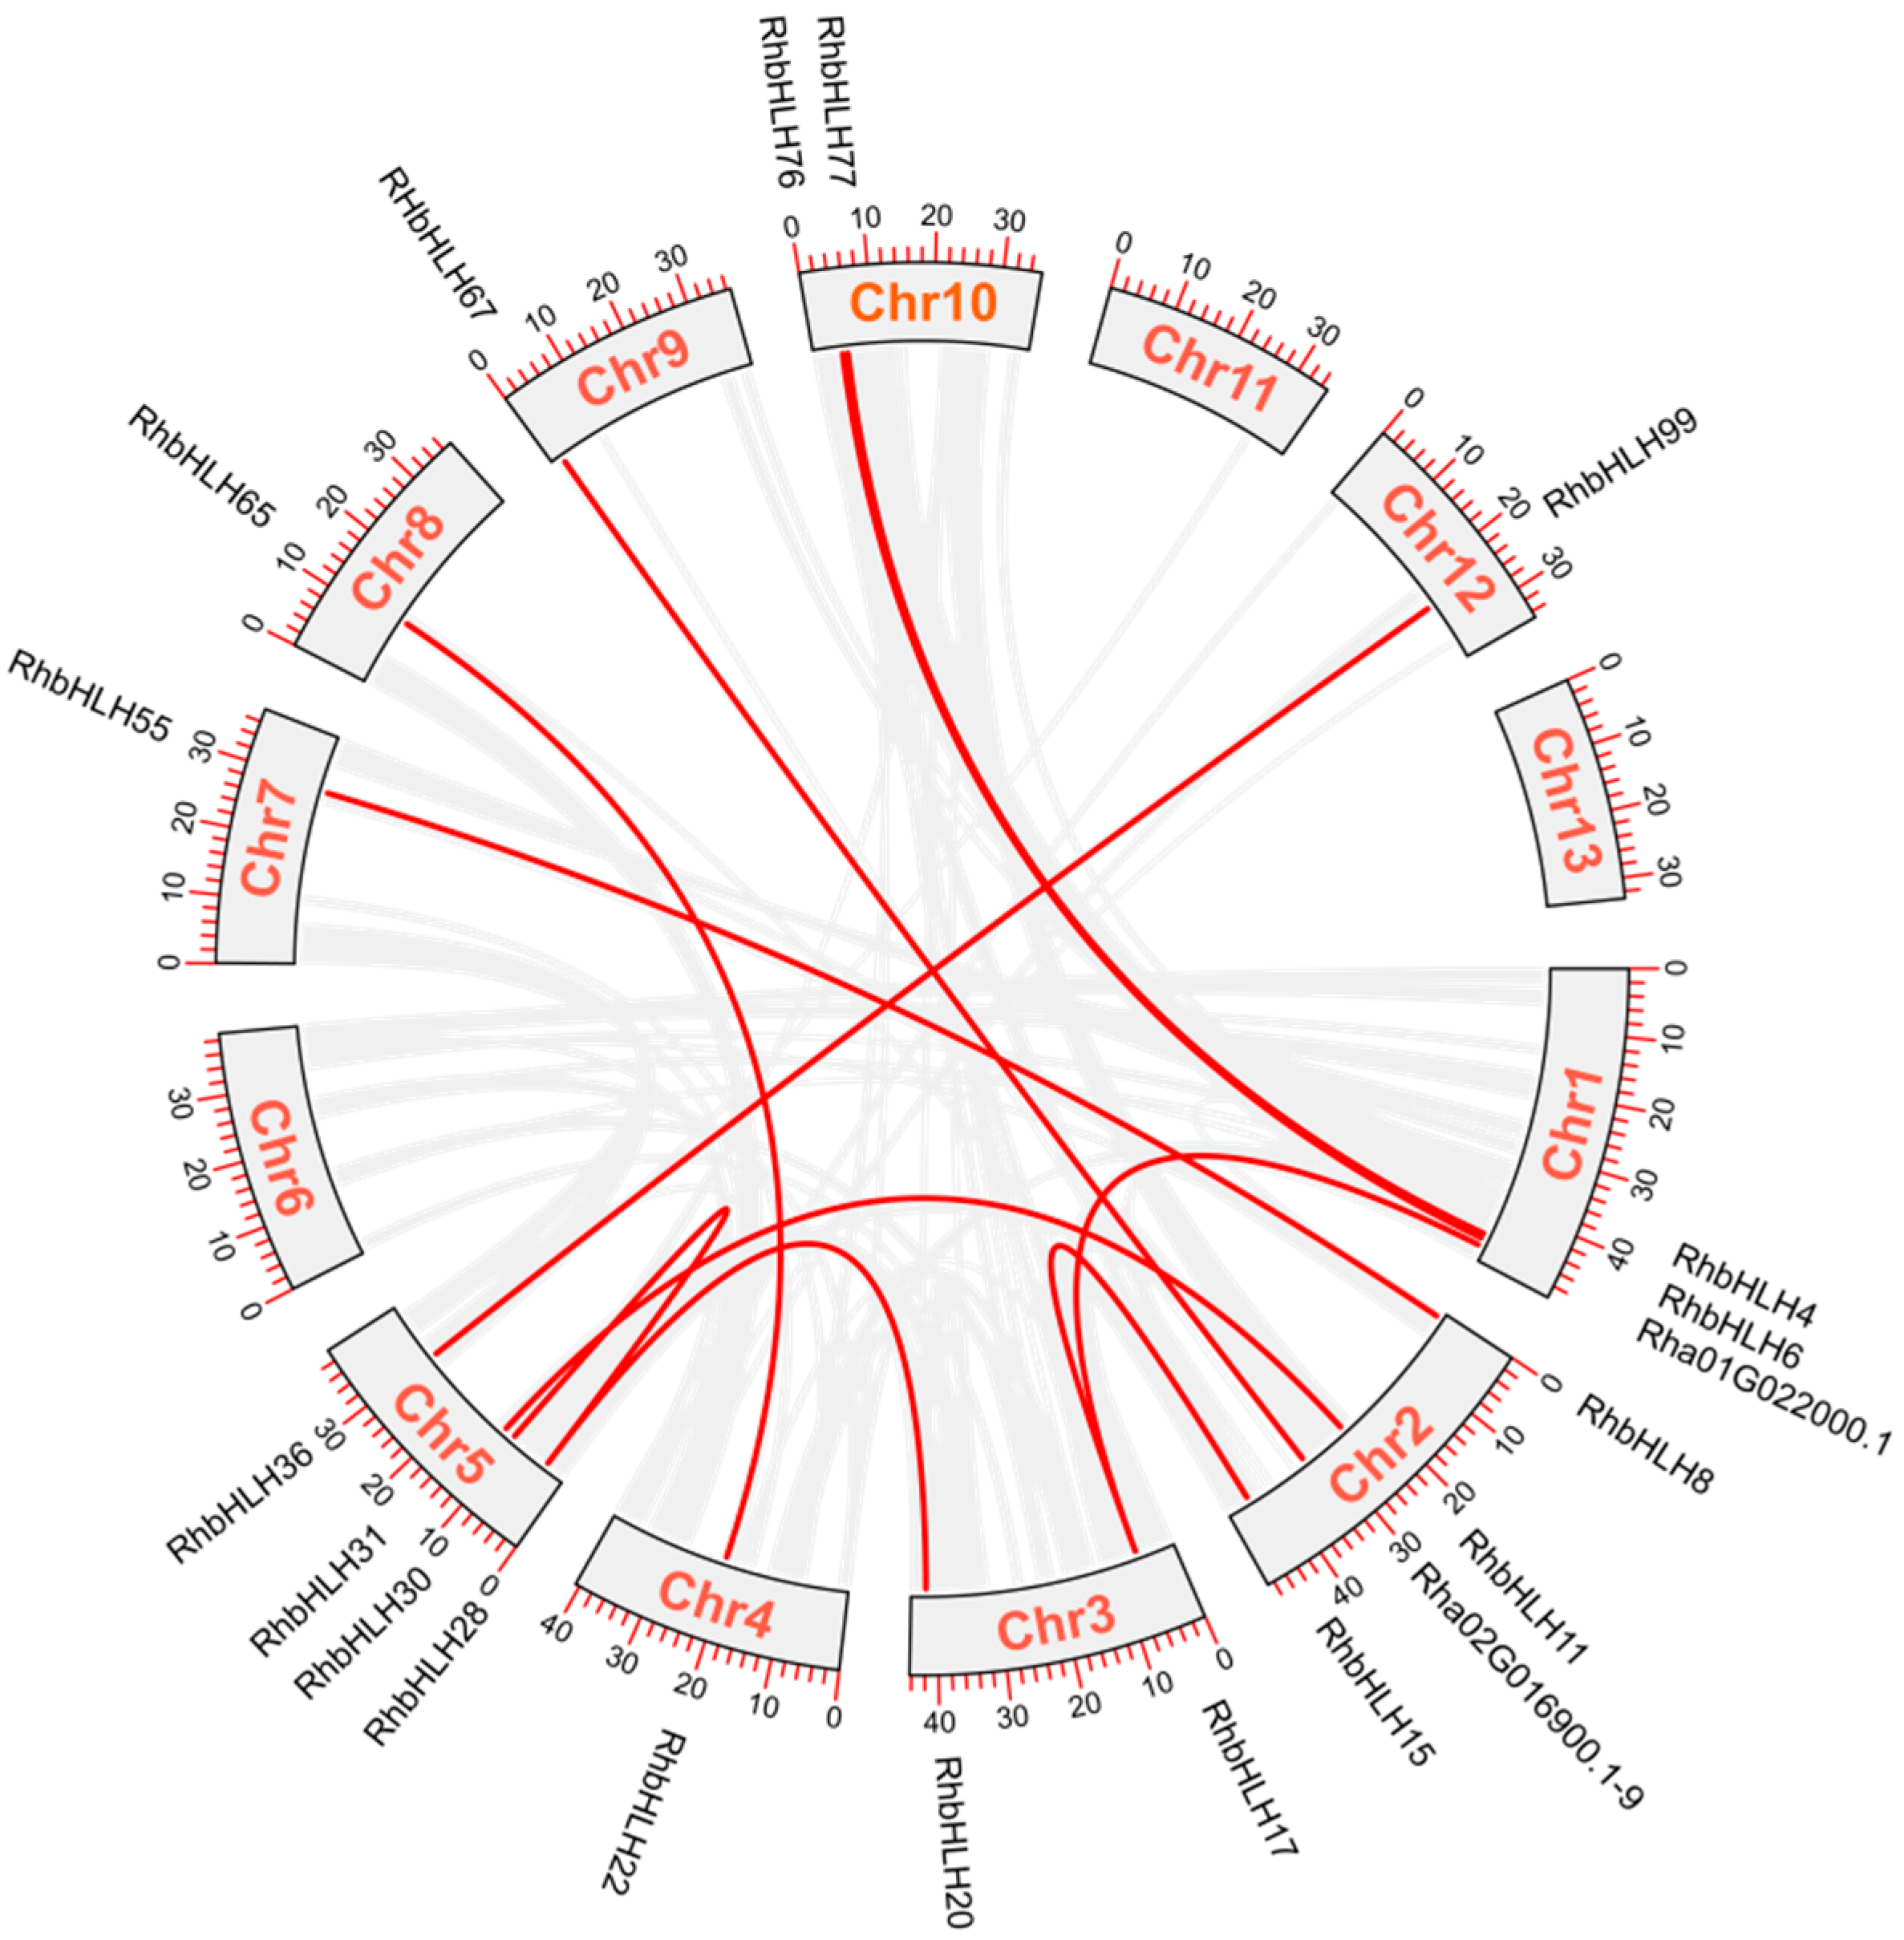
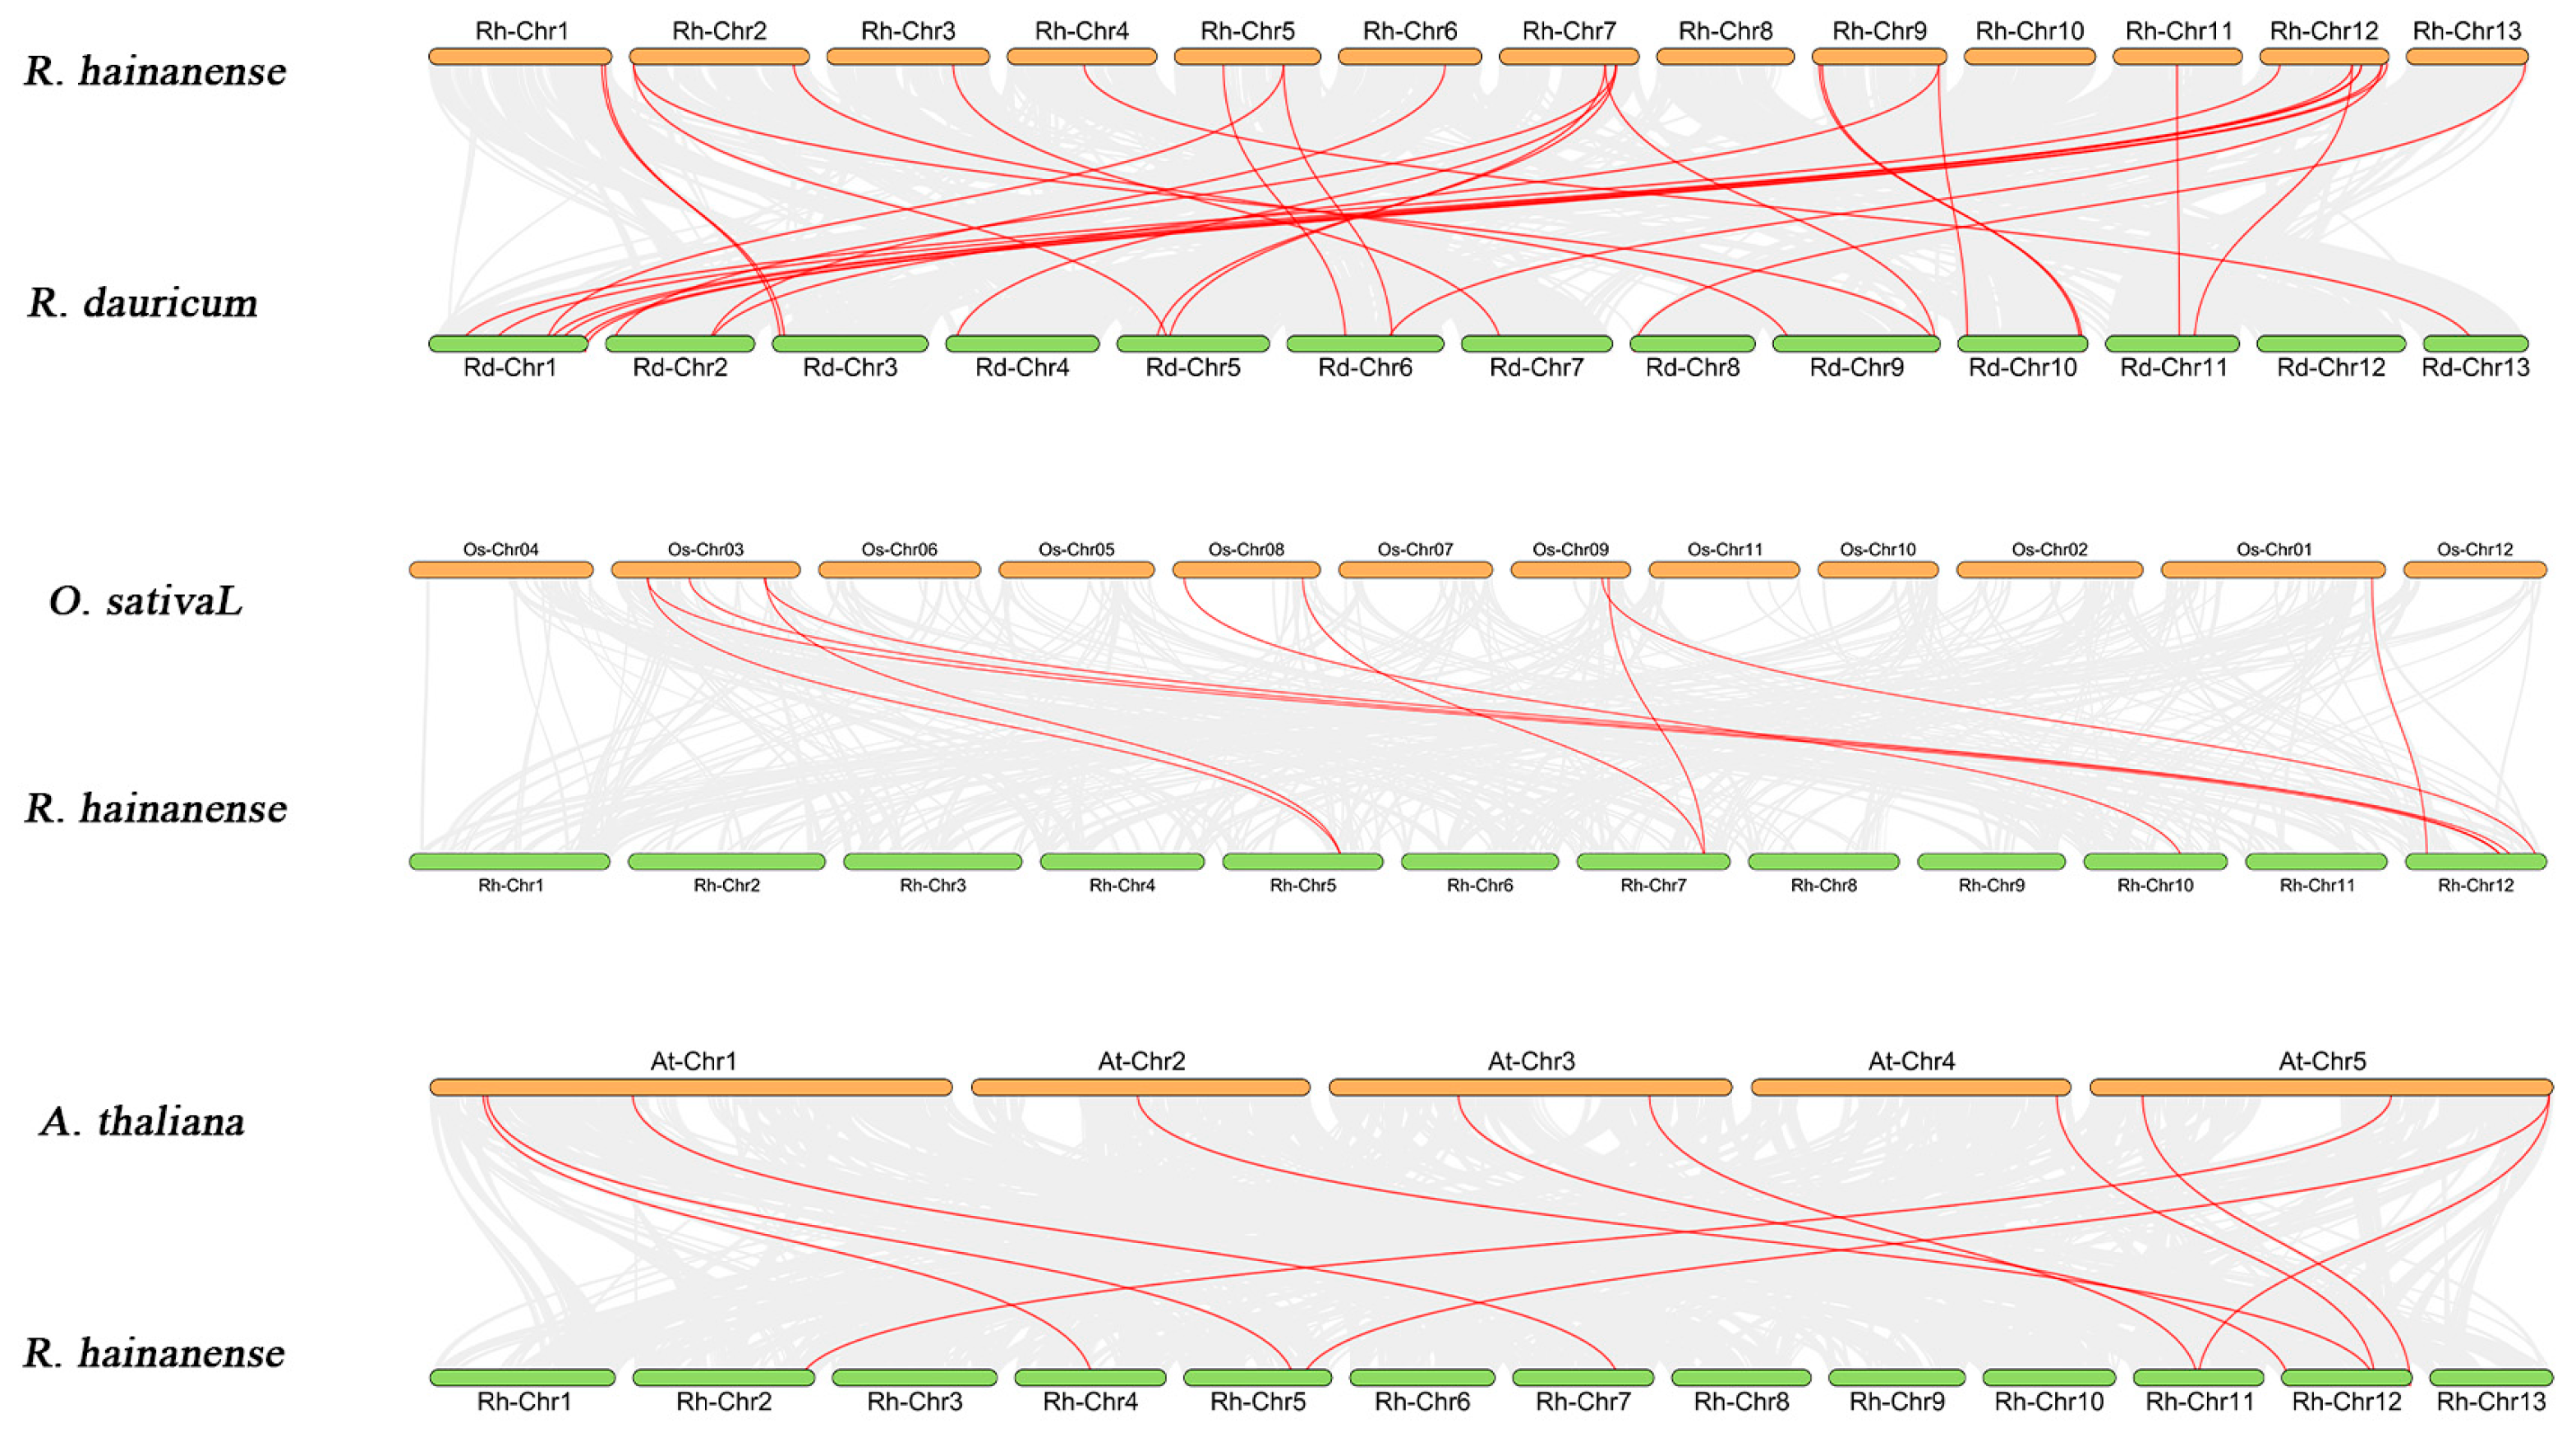
3.3. Chromosomal Location and Its Collinearity Relationship

After annotating the gff file of R. hainanense., we found that 112 RhbHLH genes are unevenly distributed across 13 chromosomes (Figure 4). Five genes with unconfirmed locations were named RhbHLH112–RhbHLH117. Chromosome 12 has the most bHLH genes (16), followed by chromosome 7 (13) and chromosome 6 (11), while the bHLH genes in chromosome 3 are the fewest (4). This suggests that the chromosomes with the majority of RhbHLH genes are more likely to be related to plant growth and stress processes.
We used the mscanx tool (version 2.119) to identify the RhbHLH gene duplication events in 112 RhbHLH family members across 13 chromosomes and found a total of eight pairs of duplicated gene segments. Chromosomes1, Chromosomes2, and Chromosomes5 exhibited a higher number of segmental duplication events, with RhbHLH20 and RhbHLH28 being homologous chromosome duplications, while the others are heterologous chromosome duplications (Figure 5). To investigate the evolutionary information of the duplicated segments, we used the KA/KS calculator (version 1.0) to compute their kaks values (Table 1). It is noteworthy that all the kaks values of the duplicated segments were less than 1, indicating that they have evolved under purifying selection. This may be one of the driving forces of evolution.
We further compared the gene duplication events present in the RhbHLH family of R. hainanense with those in A. thalianas, O. sativa, and R. dauricum to understand the evolutionary relationships of the bHLH family among different plant families. In total, 10 gene pairs were found between R. hainanense and O. sativa, 11 gene pairs were found between R. hainanense and A. thalianas, and 29 gene pairs were found between R. hainanense and R. dauricum (Figure 6). In the process of evolution, O. sativa was a monocotyledon [39]; and A. thalianas, R. hainanense, and R. dauricum were dicotyledons [40,41]; while R. hainanense and R. dauricum were classified as Rhododendron plants, and the collinearity showed that R. hainanense and R. dauricum had a closer evolutionary relationship.

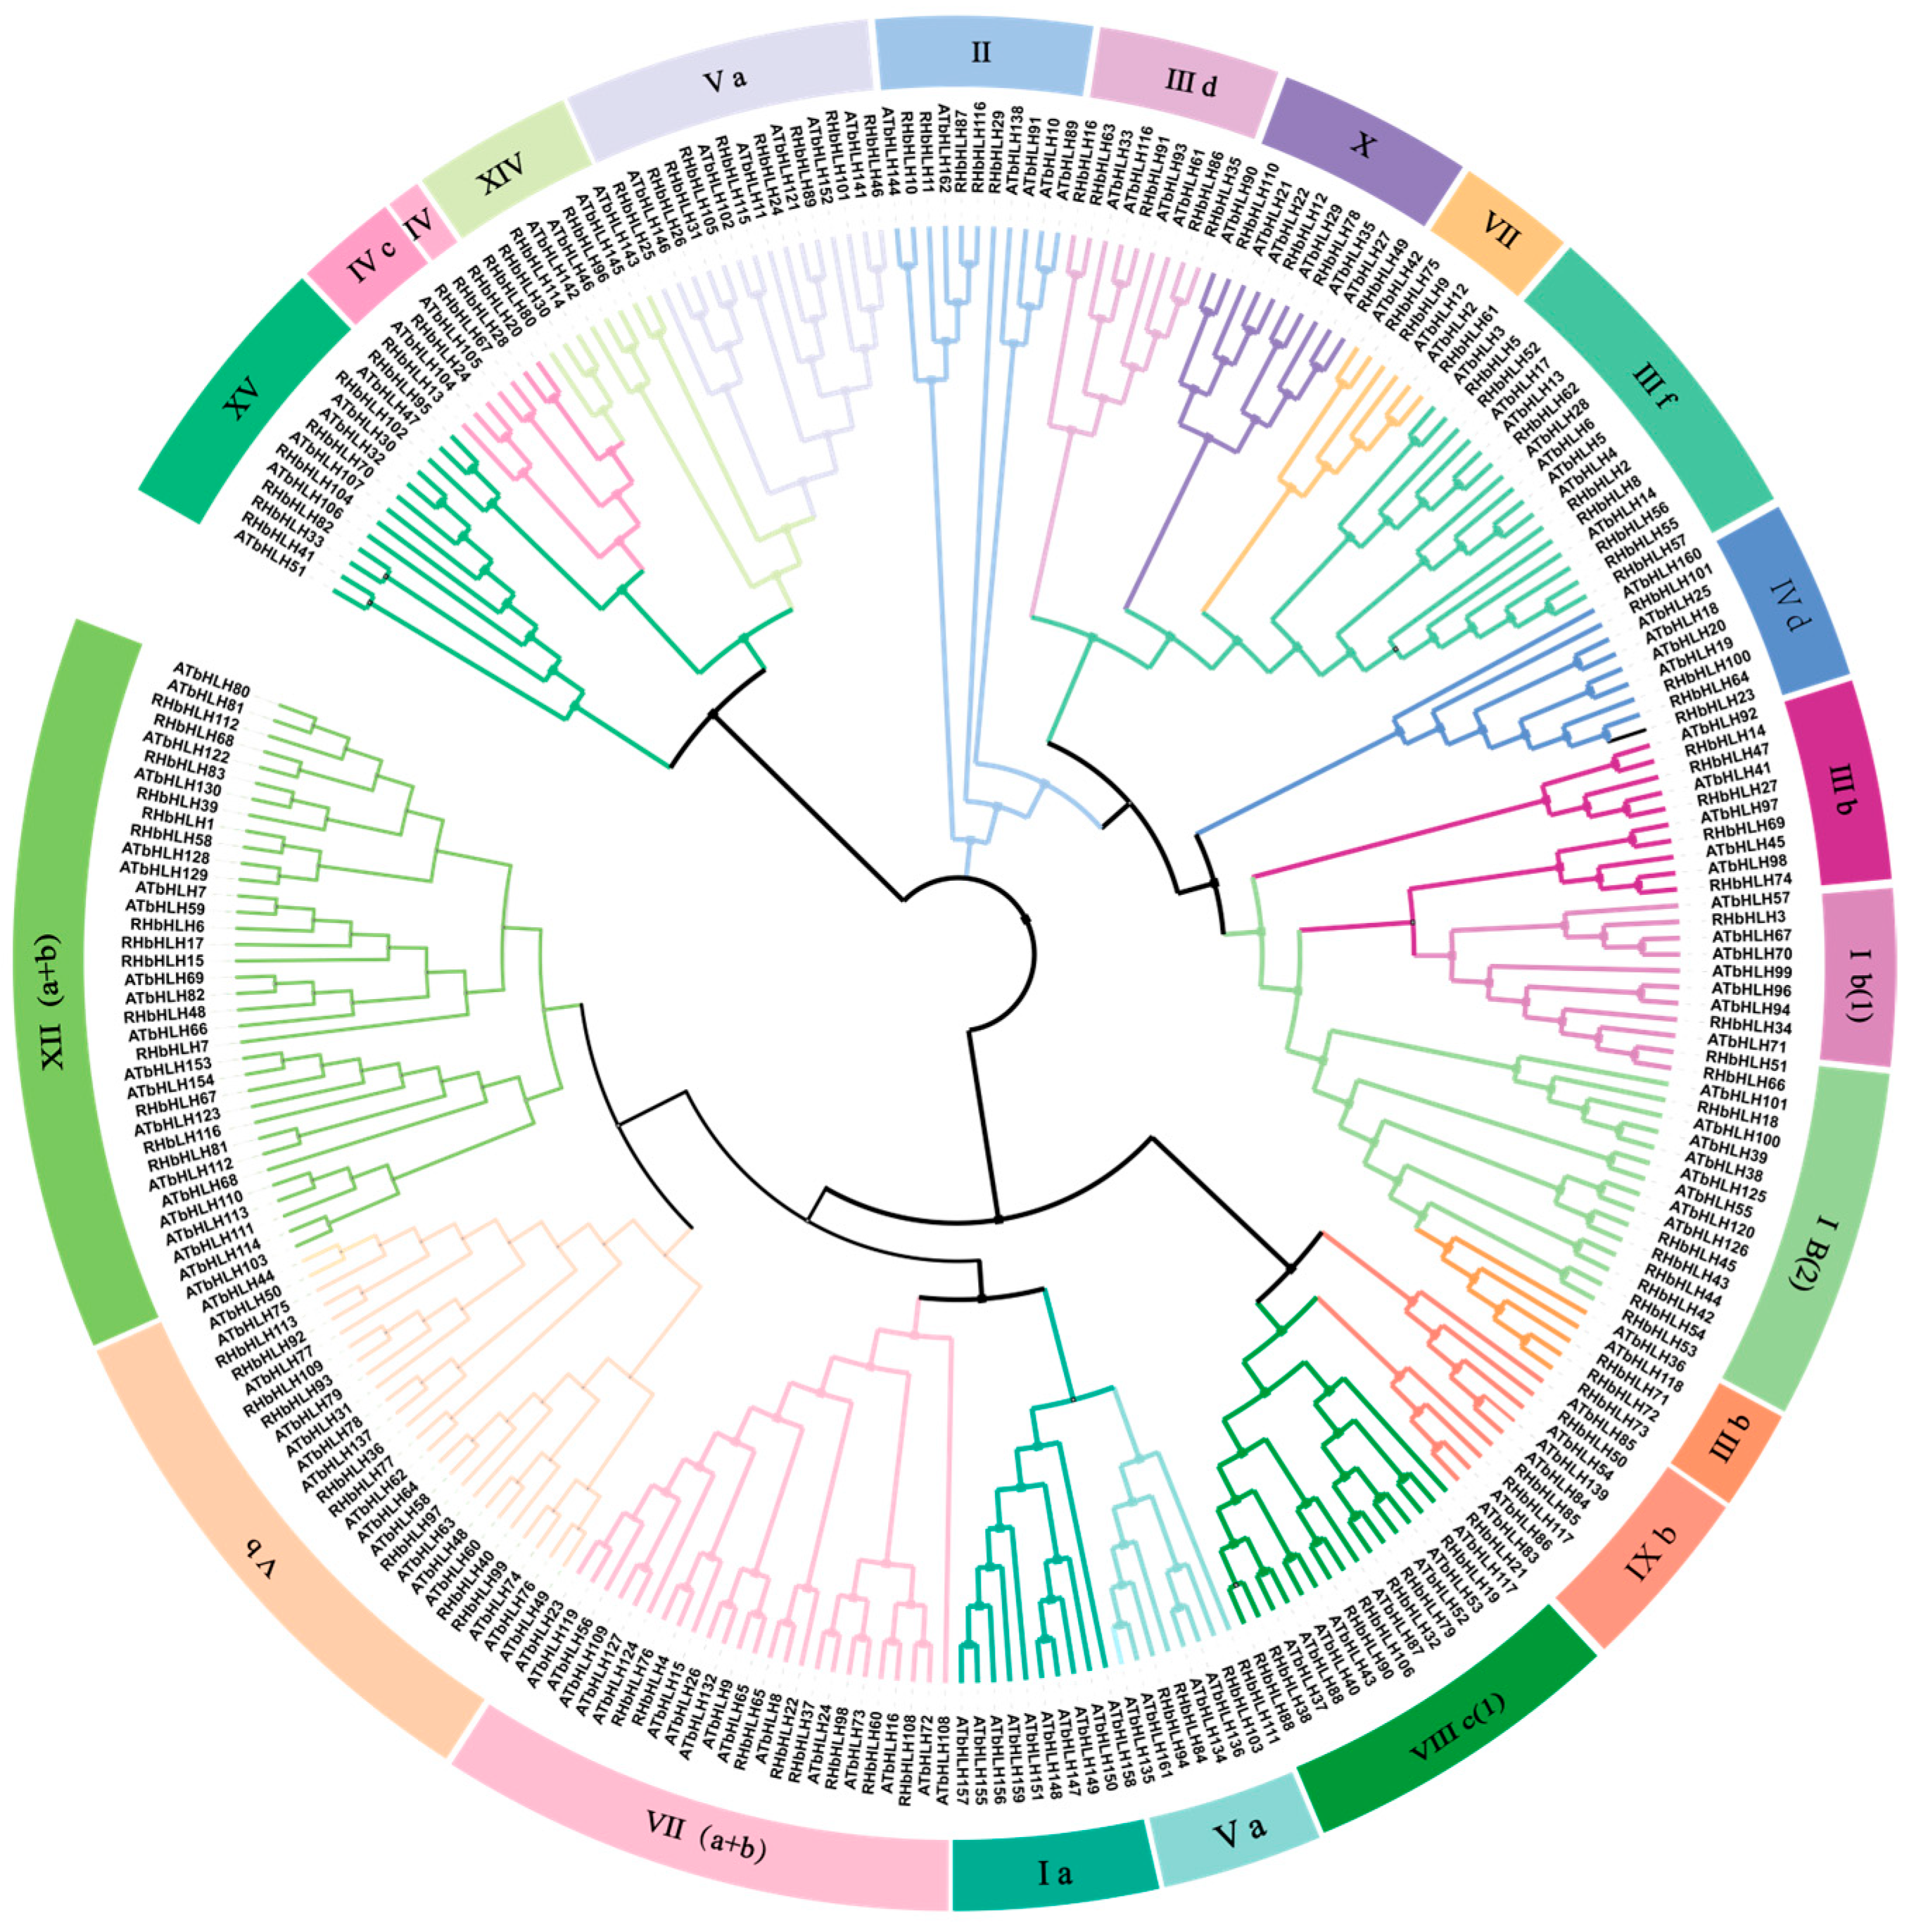
3.4. Sequence Conservatism and Phylogenetic Relationships

In order to study the bHLH gene family’s evolutionary degree, using the subfamily classification of the bHLH gene family in A. thalianas as a reference [42], sequences with close relationships and similar functions were classified into the same subfamily. The phylogenetic tree was generated using the maximum likelihood (ML) method of MEGA software (Version 10.0) (Figure 7). The phylogenetic tree includes the A. thalianas bHLH lineages (155) and the bHLH lineages we screened from R. hainanense (117). Using the subfamily classification of AtbHLH as a reference, the RhbHLH was divided into 21 subfamilies, among which subfamily XII has the highest number of members with a total of 23 genes, while subfamily Va has the least number of members with only 2 genes. The ratios of RhbHLH to AtbHLH subfamilies are somewhat similar, but there are significant differences in the ratios of certain subfamilies, indicating that the bHLH gene has a clear species preference and that there are differences between the two subfamilies [43]. Specific gene duplication events may have occurred during the evolution of R. hainanense, activating certain functional types of genes.
Analysis of the conserved motifs and phylogenetic relationships of the RhbHLH family was conducted using the MEME website (Figure 8). The results indicated that the generated eight conserved motifs ranged from motif 1 to motif 8, with motifs 1/2 widely distributed among all bHLH proteins, forming the bHLH domain. Other motifs were located in certain family members, and members with similar motifs were classified into the same subclass. For example, subclass XII (a + b) is composed of motifs 1/2/5, subclass IIIf is composed of motifs 1/2/5/8, and subclass Ib (2) is composed of motifs 1/2/7. At the same time, we used the NCBI-CDD online website to identify the protein domains of the RhbHLH family; with the exception of subclasses IIIa and Va, all genes contain the bHLH superfamily domain. Motifs within the same subclass have similar characteristics, but there are significant differences between subclasses.
Cis-regulatory elements in organisms regulate gene expression by providing binding sites for interaction with other proteins [44]. Therefore, different binding sites interact with proteins of varying functions, determining the function of the cis-regulatory element [45]. The promoter regions were screened, and the parts related to plant growth and stress were retained. A total of 794 CREs (cis-regulatory elements) were detected in the RhbHLH promoter region. Approximately 31 CREs were effectively expressed. We selected the most representative elements for display, broadly classified into three functional groups: light response elements: part of a conserved DNA module involved in light responsiveness, cis-acting element involved in light responsiveness and part of a module for light response; hormone regulatory element: cis-acting regulatory element involved in the MeJA (Methyl jasmonate)-responsiveness, cis-acting element involved in the ABA (abscisic acid) responsiveness, cis-acting element involved in SA (salicylic acid) responsiveness; and stress response elements: cis-acting regulatory element essential for the anaerobic induction, cis-acting element involved in low-temperature responsiveness (LTR), MYB binding site (MBS) involved in drought-inducibility. The cis-acting regulatory element involved in the MeJA-responsiveness appeared 132 times (16.64%) and was found in 21 members. The cis-acting element involved in the abscisic acid responsiveness appeared 130 times (16.39%) and was found in 35 members. The cis-acting element involved in salicylic acid responsiveness appeared 30 times (3.78%) and was found in 22 members. MeJA and ABA are important hormones in plants, which play an important role in the process of plant stress and maturation [46]. The results suggested that Methyl jasmonate and abscisic acid were involved in the regulation of growth and development in R. hainanense by the RhbHLH family (Figure 9). Among them, a large number of light response elements (part of a conserved DNA module involved in light responsiveness and part of a module for light response) were found in the promoter regions of the bHLH family, suggesting that this bHLH family is significantly involved in plant diurnal rhythm and physiological tissue development. Low-temperature responsiveness (LTR) appeared 35 (4.03%) times, and the MYB binding site involved in drought-inducibility appeared 32 (3.78%) times. The results indicated that the RhbHLH family was also involved in the stress response process of R. hainanense. Detailed data can be found in Supplementary File S4.

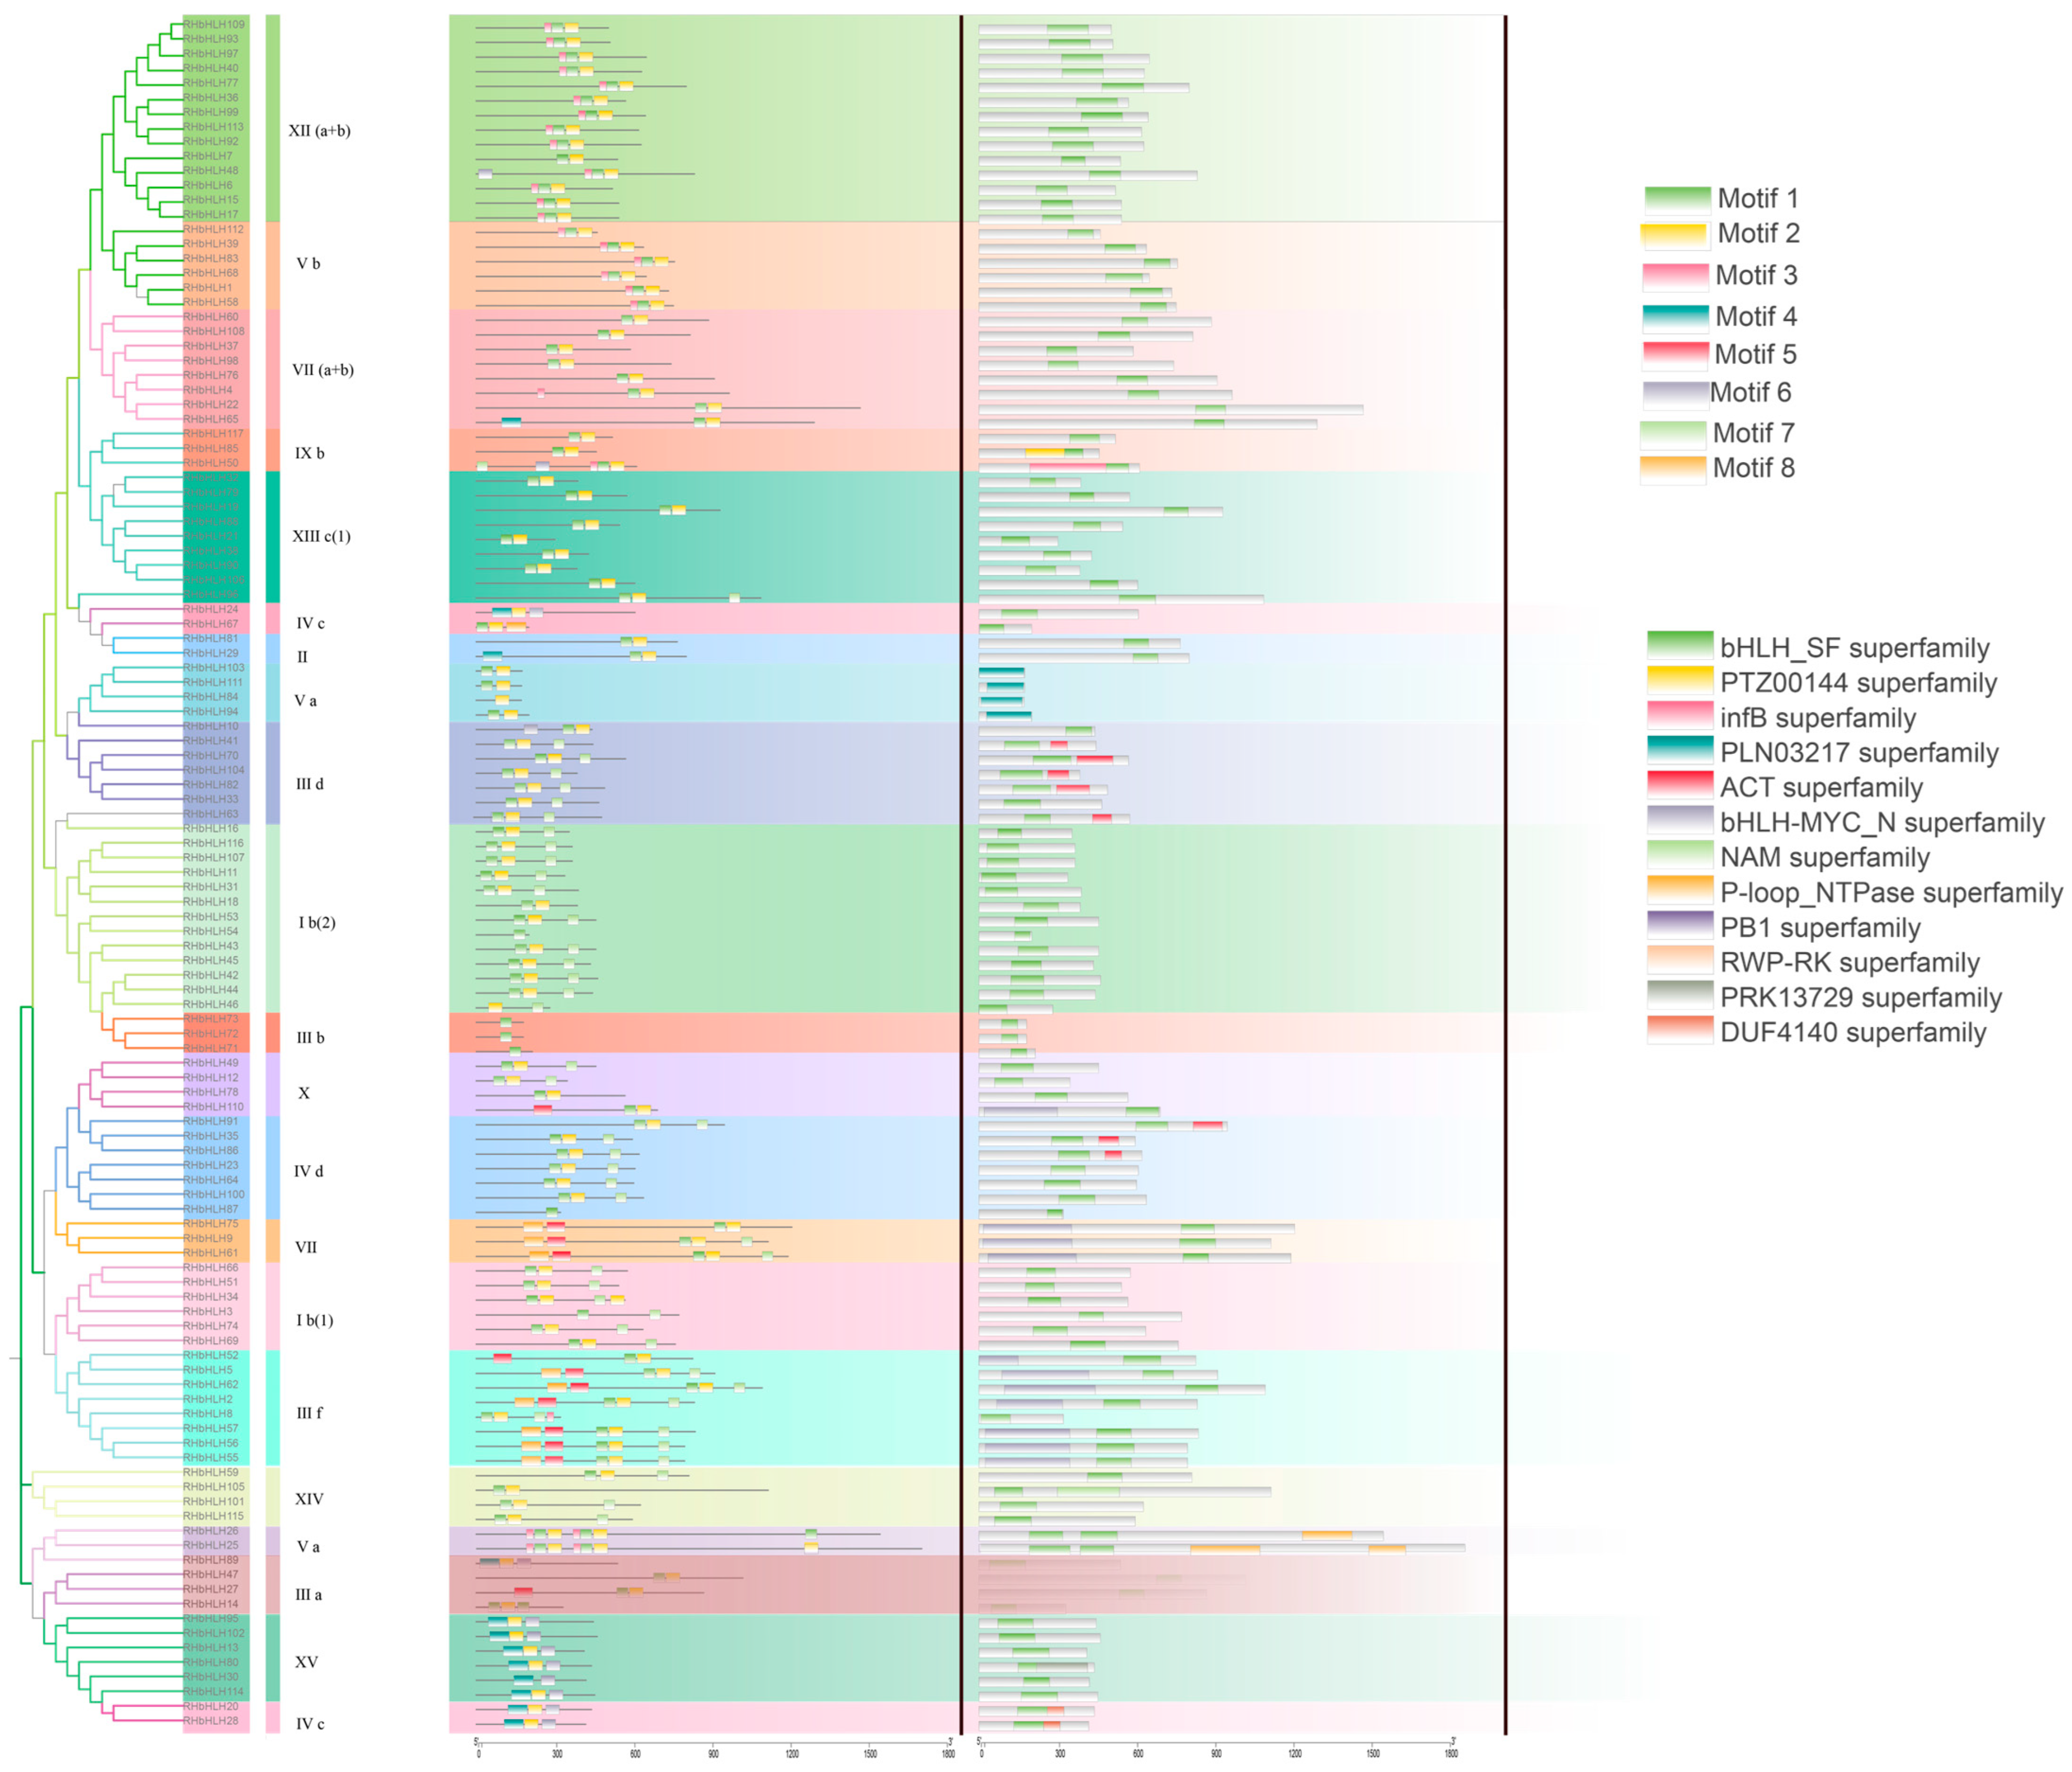
3.5. Visualization of bHLH Protein Structure and Interaction Network

The function of proteins depends on their three-dimensional structure, so different structures produce different functions [47]. This study utilized the SWISS-MODEL database to predict the bHLH protein structures, taking as representatives the protein structures with the highest GMQE and MEAND scores (Figure 10). The results indicate that the protein structures of different subfamilies differ, with closely related subfamilies having similar structures, and their biological functions are also relatively similar. For example, group Va and group VII exhibit strong central symmetry. Subfamily III and subfamily X show central symmetry. The three-dimensional modeling of proteins and the prediction of protein structures among different subfamilies provide a preliminary basis for exploring their functions.
bHLH protein forms homodimers, binds to DNA, and plays roles in various processes in plants [6]. To understand the function of the RhbHLH protein more clearly, we used homologous genes of A. thalianas and predicted the interaction network of the tR. hainanense bHLH protein (Figure 11). This network has a total of 70 nodes and interactions. Moreover, most bHLH proteins can interact with other proteins. Due to the specificity of the bHLH protein structure, they often need to form dimers to complete their biological functions, and the interactions between proteins are close, with some interactions between proteins already experimentally confirmed in databases.

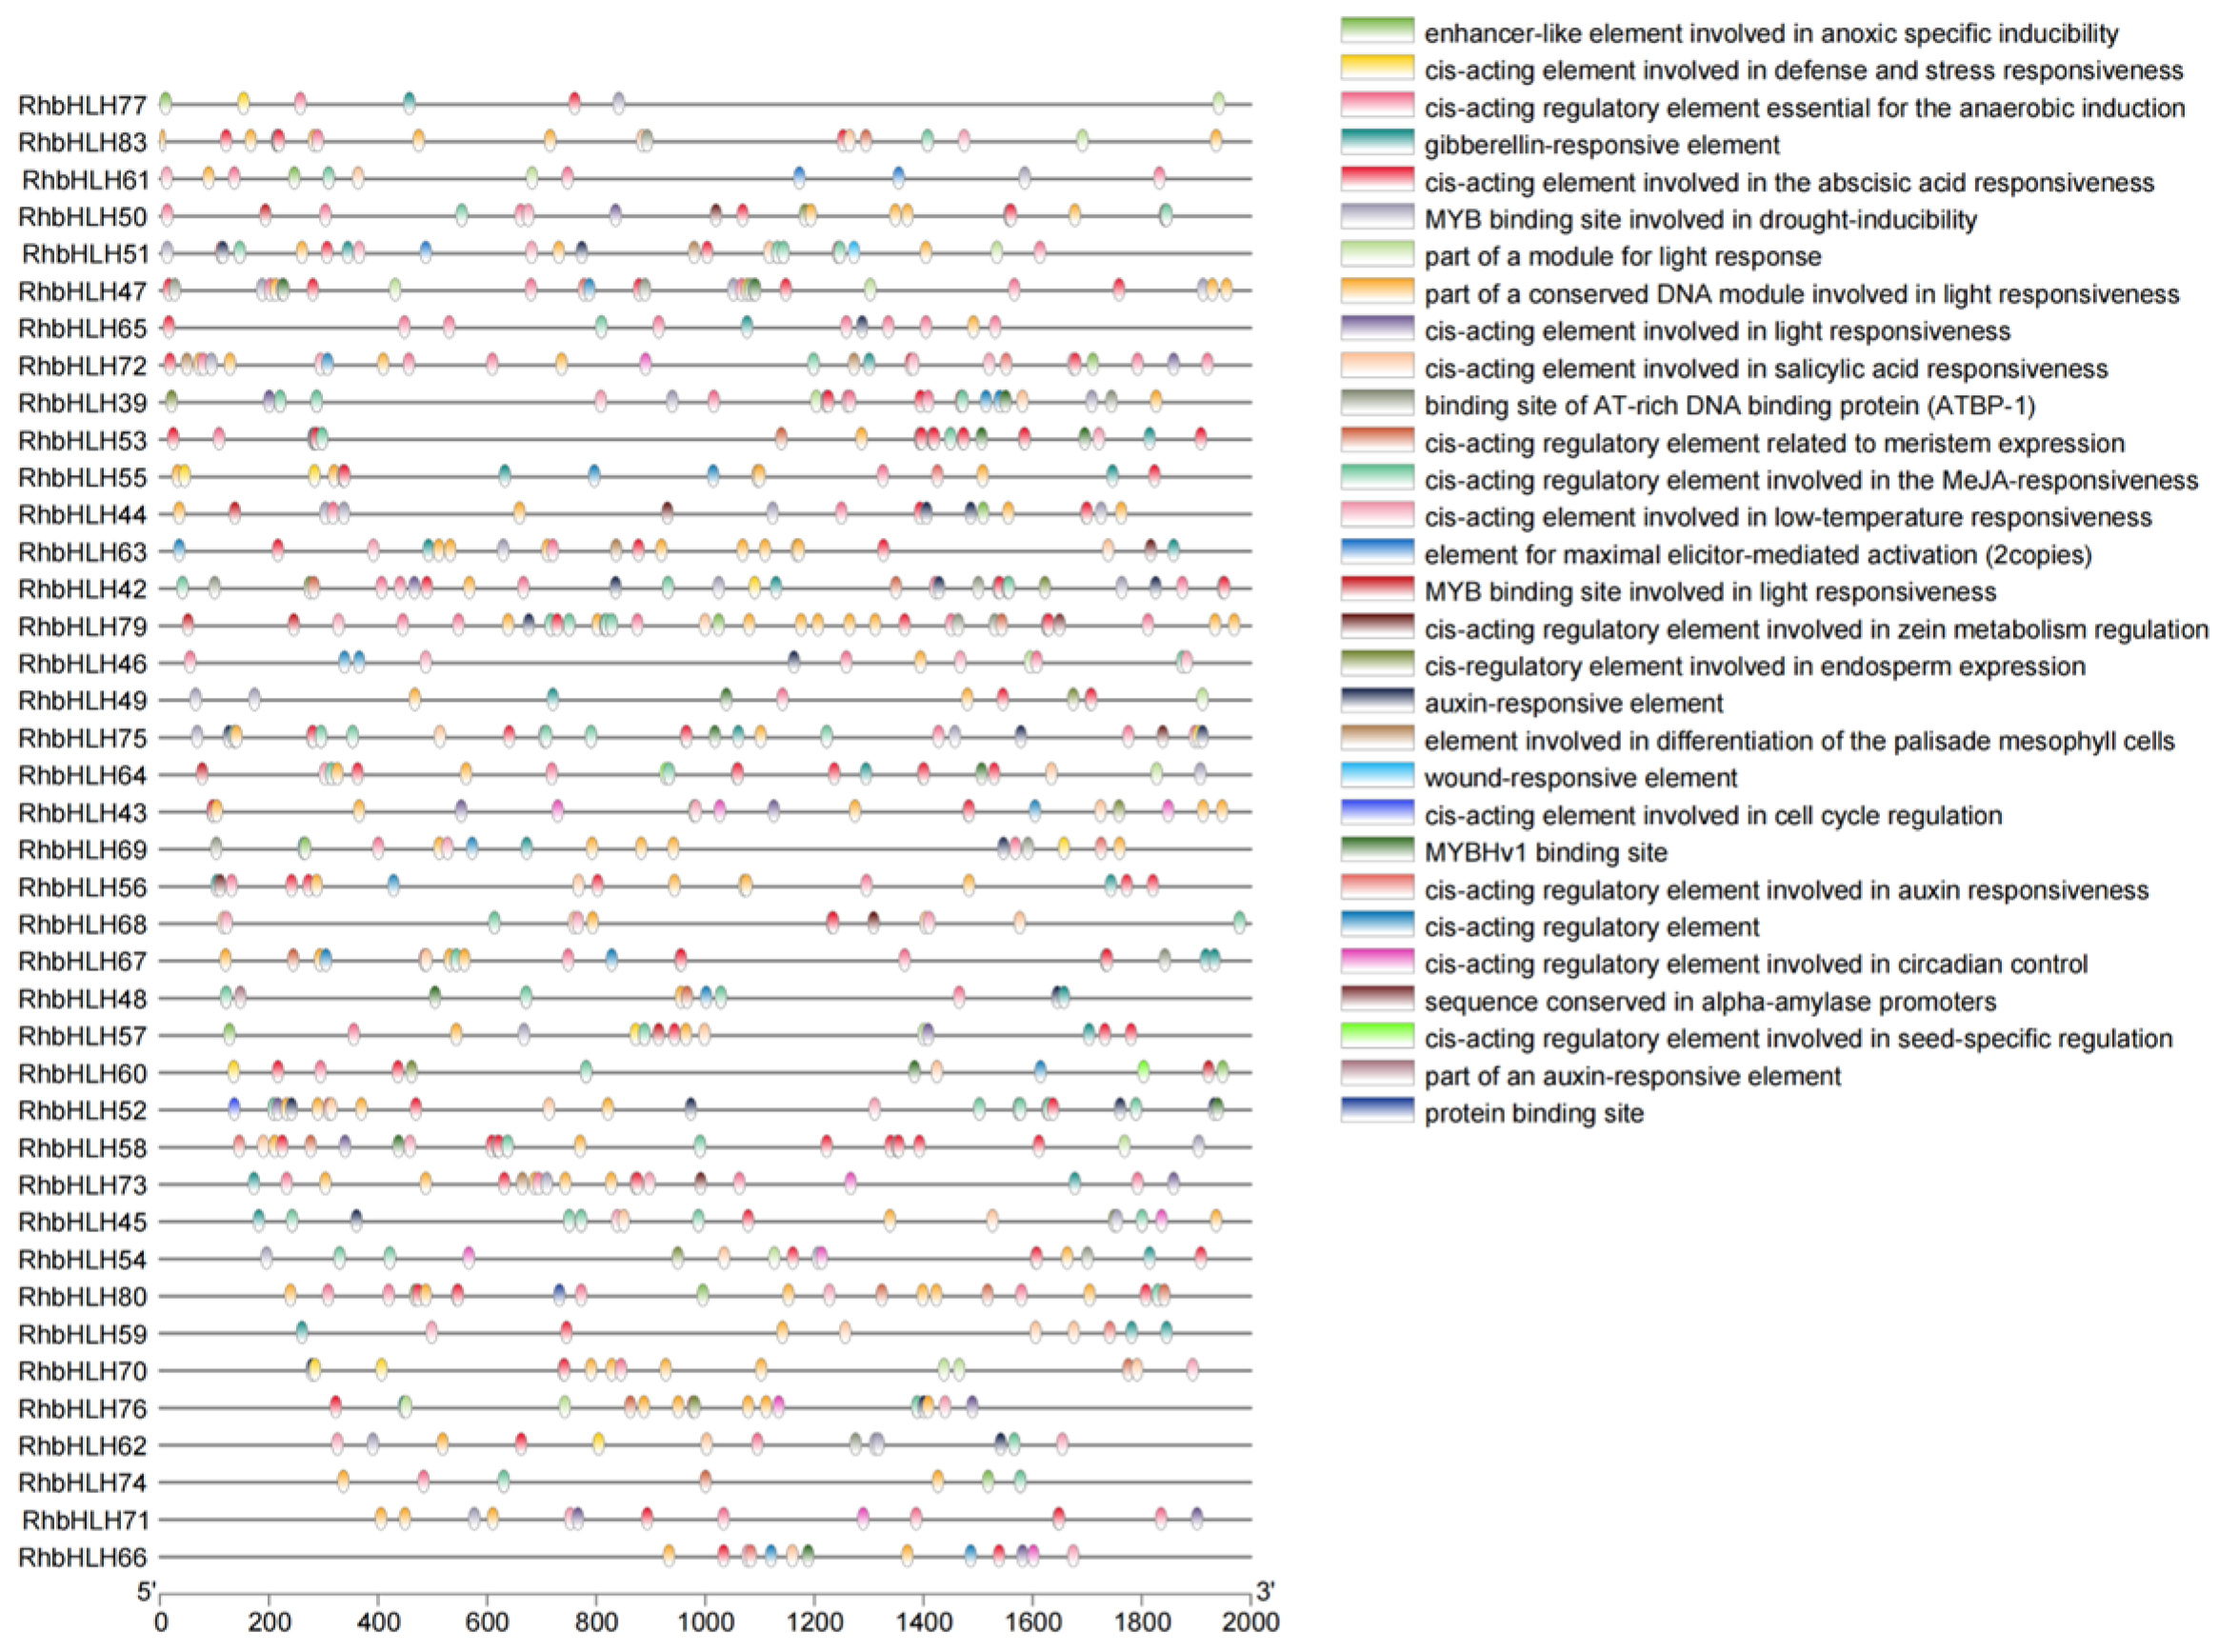
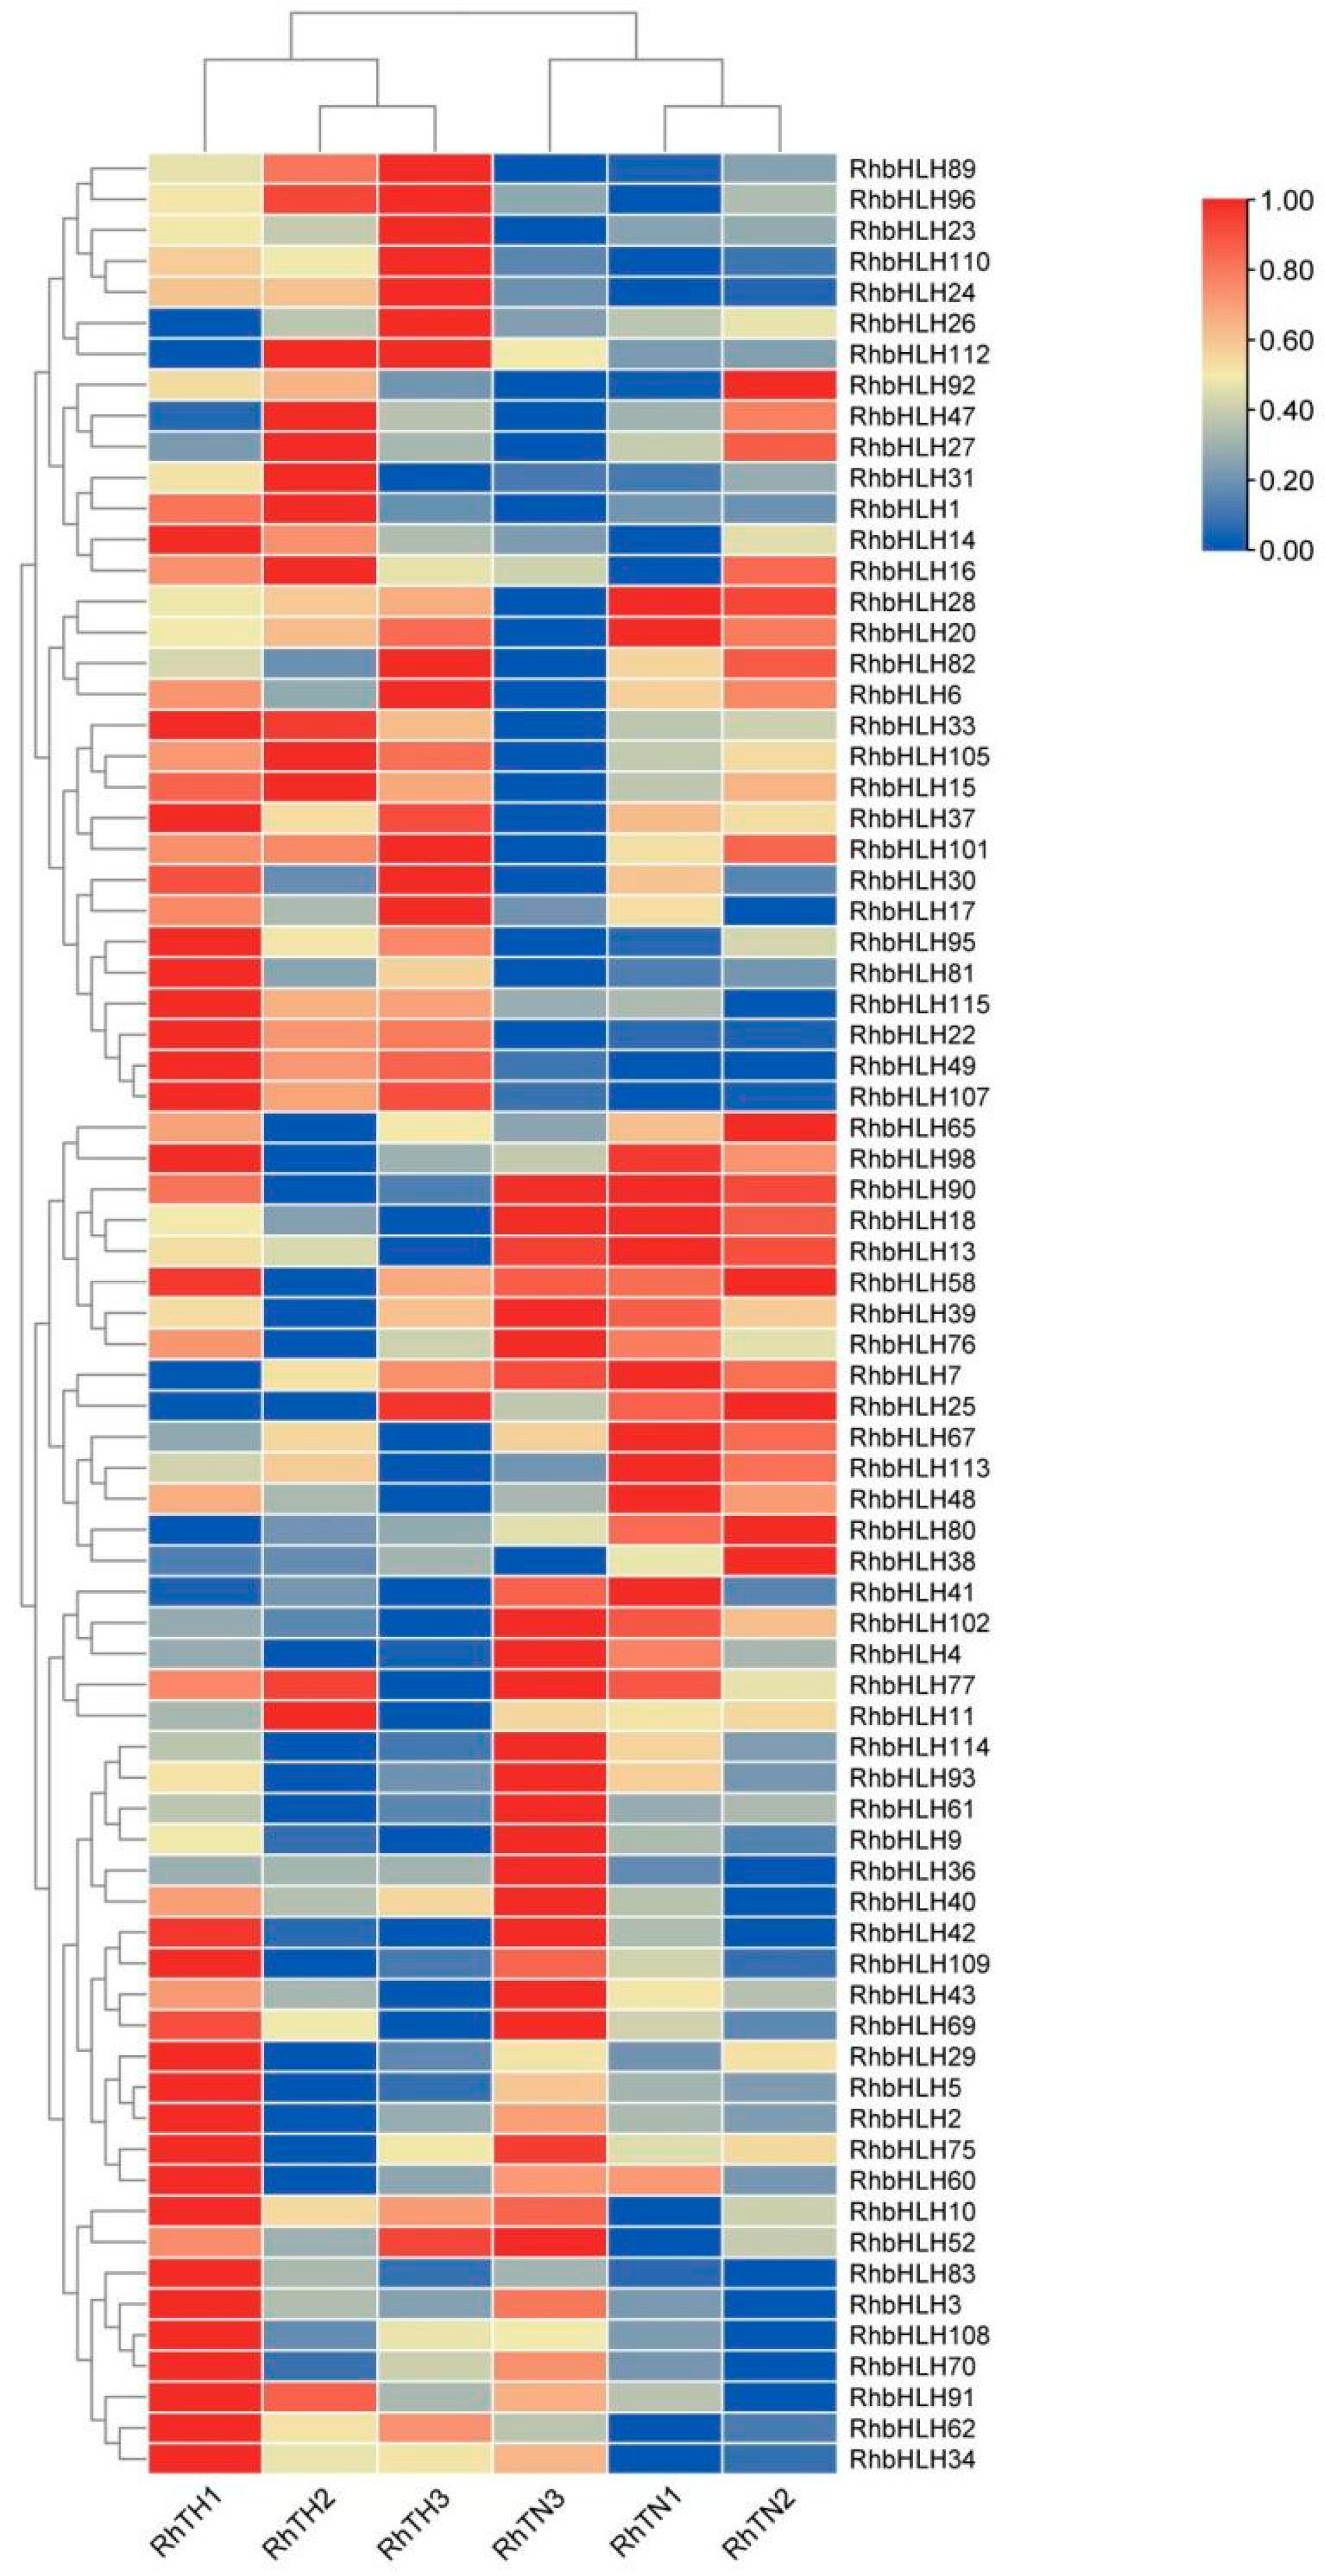
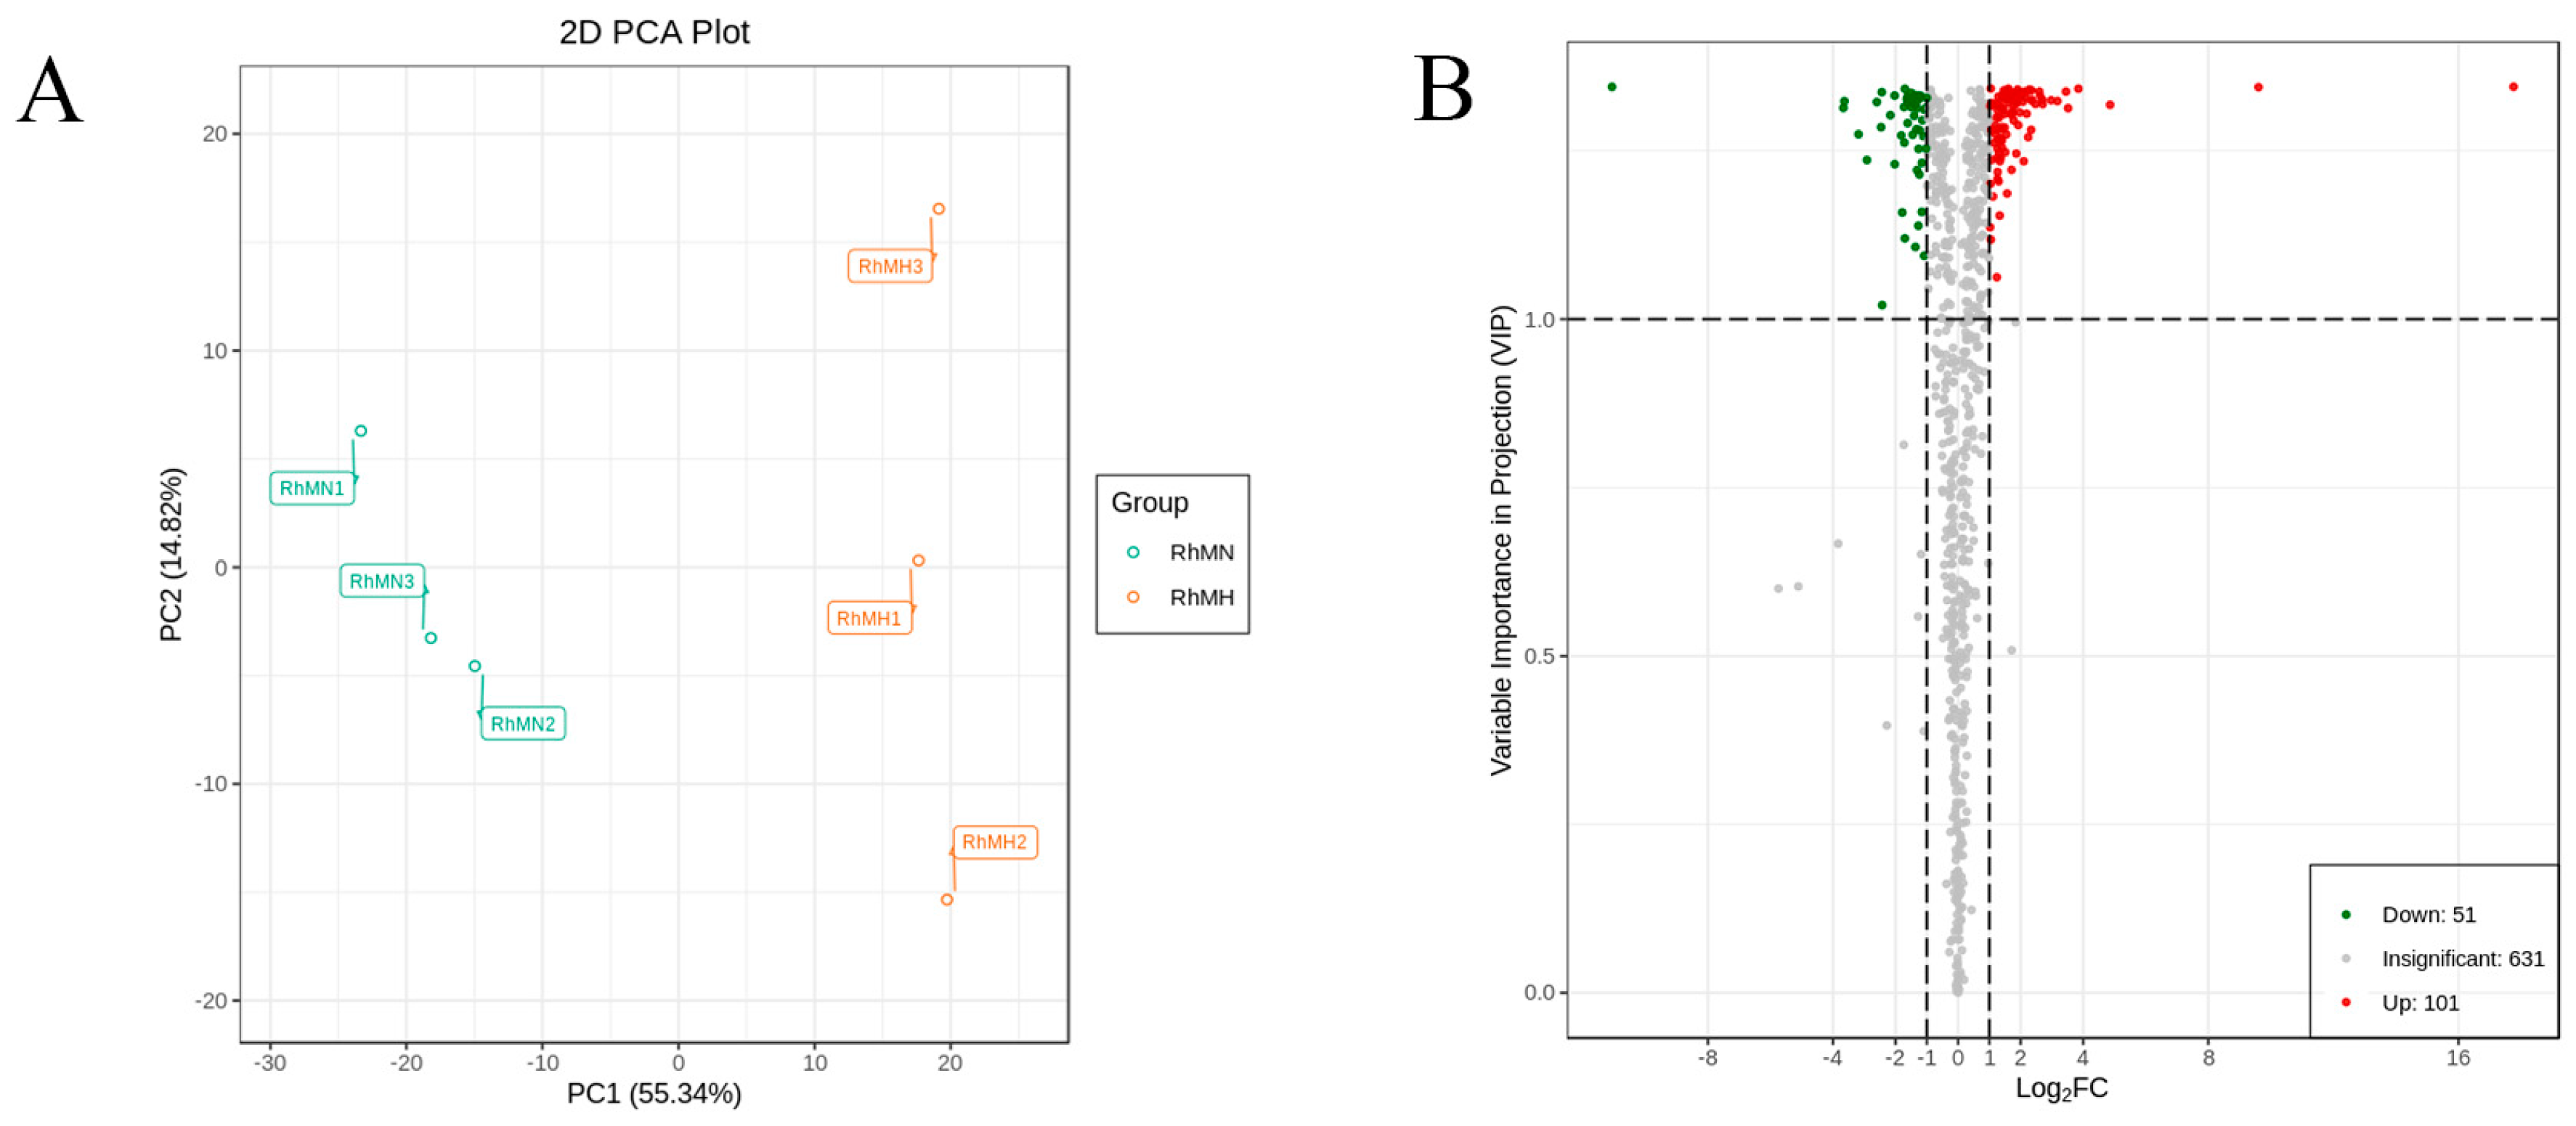
3.6. Expression Patterns and Analysis of Transcriptome Under High-Temperature Stress

The high-throughput sequencer was used to sequence six samples (High temperature group: RhTH1, RhTH2, RhTH3 and Normal temperature group: RhTN1,RhTN2, RhTN3), obtaining 4,128,0128–70,401,558 raw reads (Table 2). After data filtering, 40,342,882–6,899,938 valid reads were obtained, with a base number of 6.05–10.35 Gb, and a GC content of 46.57%–47.09%. Compared to the reference genome of R. hainanense, 25,254,777–33,659,962 valid reads were successfully obtained. The average pairing rate was 88.78%, and the proportion of base quality values greater than 20 was 97.81%–97.96%, while the proportion of base quality values greater than 30 was 93.56%–93.84%, indicating that the sequencing quality is high.
We collected the fpkm values of 117 RhbHLH in the transcriptome under high-temperature treatment and created a heat map (Figure 12) using TBtools software. The results showed that among the 117 bHLH sequences, five RhbHLH exhibited high expression levels after high-temperature treatment (RhbHLH107, RhbHLH49, RhbHLH62, RhbHLH89, RhbHLH41), while five RhbHLH showed significantly downregulated expression levels after heat treatment (RhbHLH41, RhbHLH67, RhbHLH4, RhbHLH102, RhbHLH18).

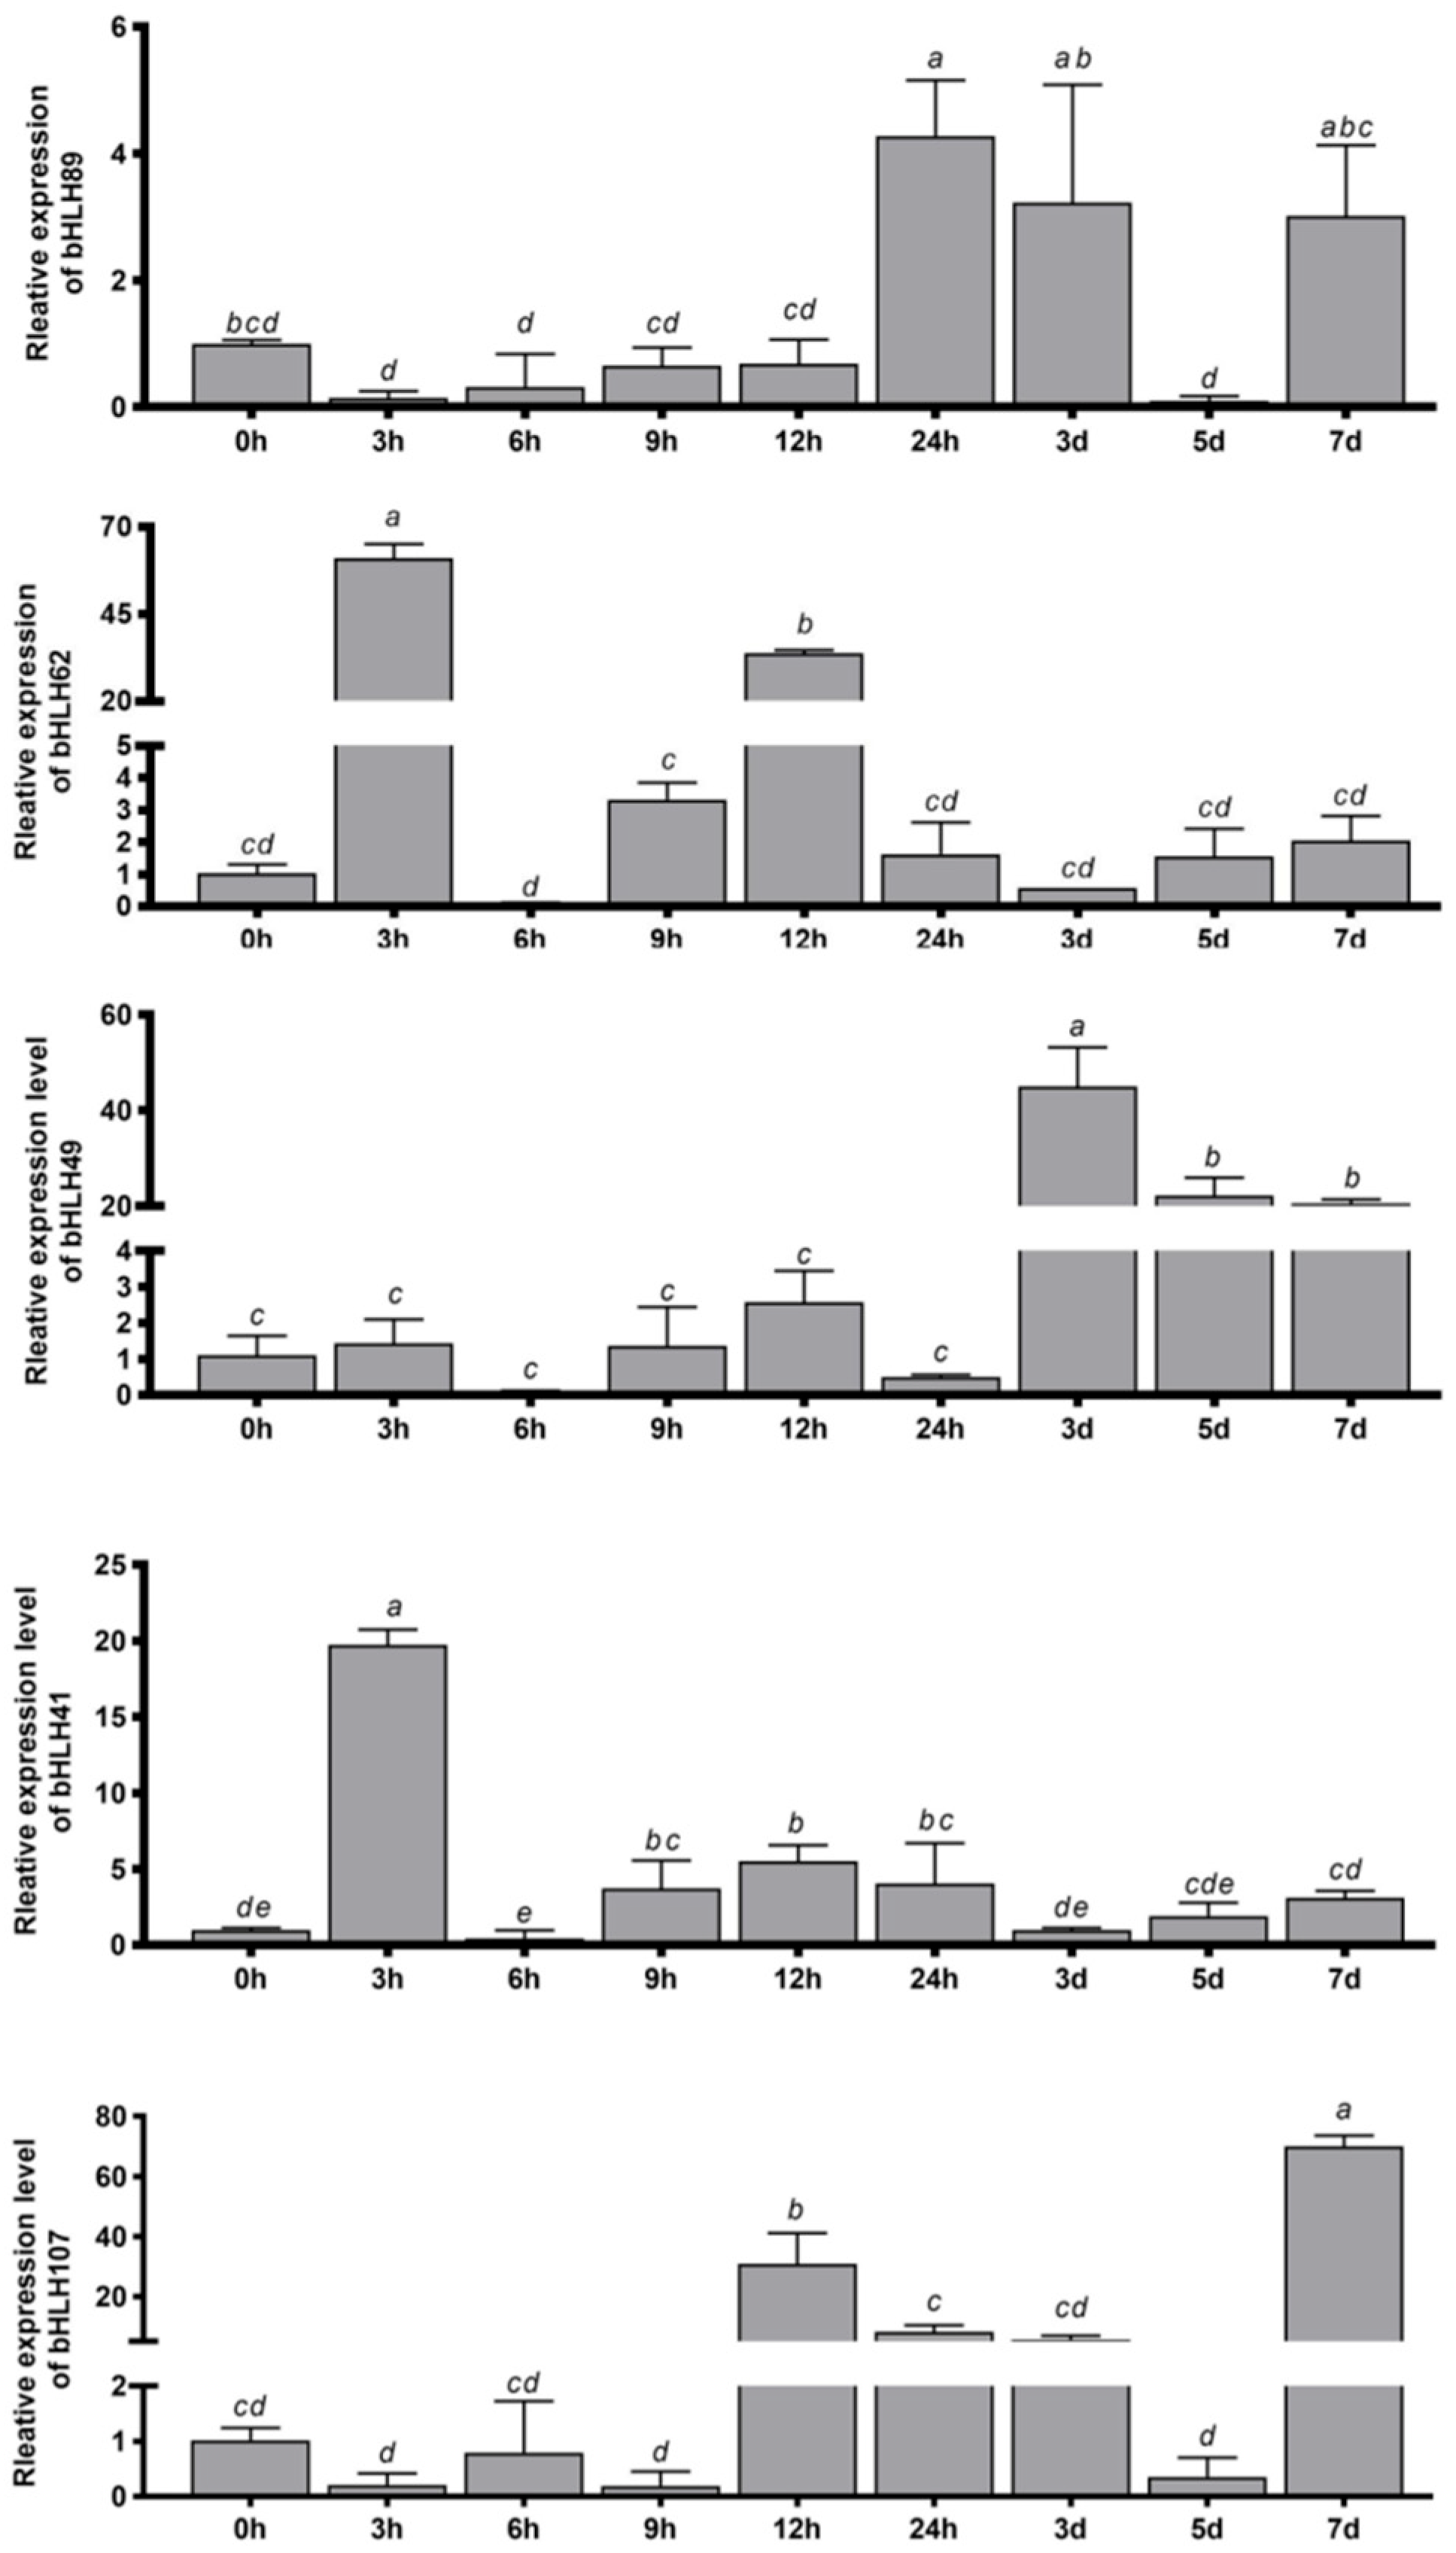
3.7. Real-Time Fluorescence Quantitative Verification and Relative Expression Levels of RhbHLH

To verify the accuracy of the RNA-seq for bHLH genes, we selected five upregulated RhbHLH genes for qPCR, and the results showed that the expression trends were consistent with those of RNA-seq, proving the data’s accuracy (Figure 13).
The results indicate that RhbHLH41 and RhbHLH62 expression significantly increased at the 3rd h after 40 °C treatment, sharply decreased again at the 6th h, and then gradually increased and stabilized. RhbHLH89, RhbHLH49, and RhbHLH107 showed no significant changes at the beginning of heat stress, until the gene expression started to increase at the 12th h, with RhbHLH89 reaching its highest expression at 24 h, which is 4.27 times that of the control group (NT), while RhbHLH49 and RhbHLH107 peaked at 38.77 times and 69.93 times, respectively, compared to the control group (NT) at 3 d and 7 d (Figure 14). The initial hypothesis was that they may play different roles in heat tolerance response, hence the different timing of their high expression, a hypothesis supported by the fact that RhbHLH107 and RhbHLH49 also have similar motif compositions.

3.8. Differential Metabolite Screening

We analyzed the metabolites with different abundances before and after high-temperature treatment, screening specific metabolites to identify significantly related differential genes. Principal component analysis (PCA) indicated that the metabolites of R. hainanense had significant differences after high-temperature treatment (Figure 15A). The volcano plot also showed that after 7 days of high-temperature treatment, there were 100 upregulated metabolites (33 flavonoids, accounting for 33%; 15 amino acids and their derivatives, accounting for 15%; 7 organic acids, accounting for 7%), and 51 downregulated metabolites (16 amino acids and their derivatives, accounting for 32%; 8 flavonoids, accounting for 16%; 7 organic acids, accounting for 14%). Additionally, 631 stable metabolites were detected (Figure 15B). To better analyze the pathways regulated by the metabolites, we utilized the KEGG database for DAM annotation, which indicated that the biosynthesis of secondary metabolites and flavonoids was enriched the most in DAM (S), suggesting their possible involvement in the heat stress regulation process of R. hainanense.

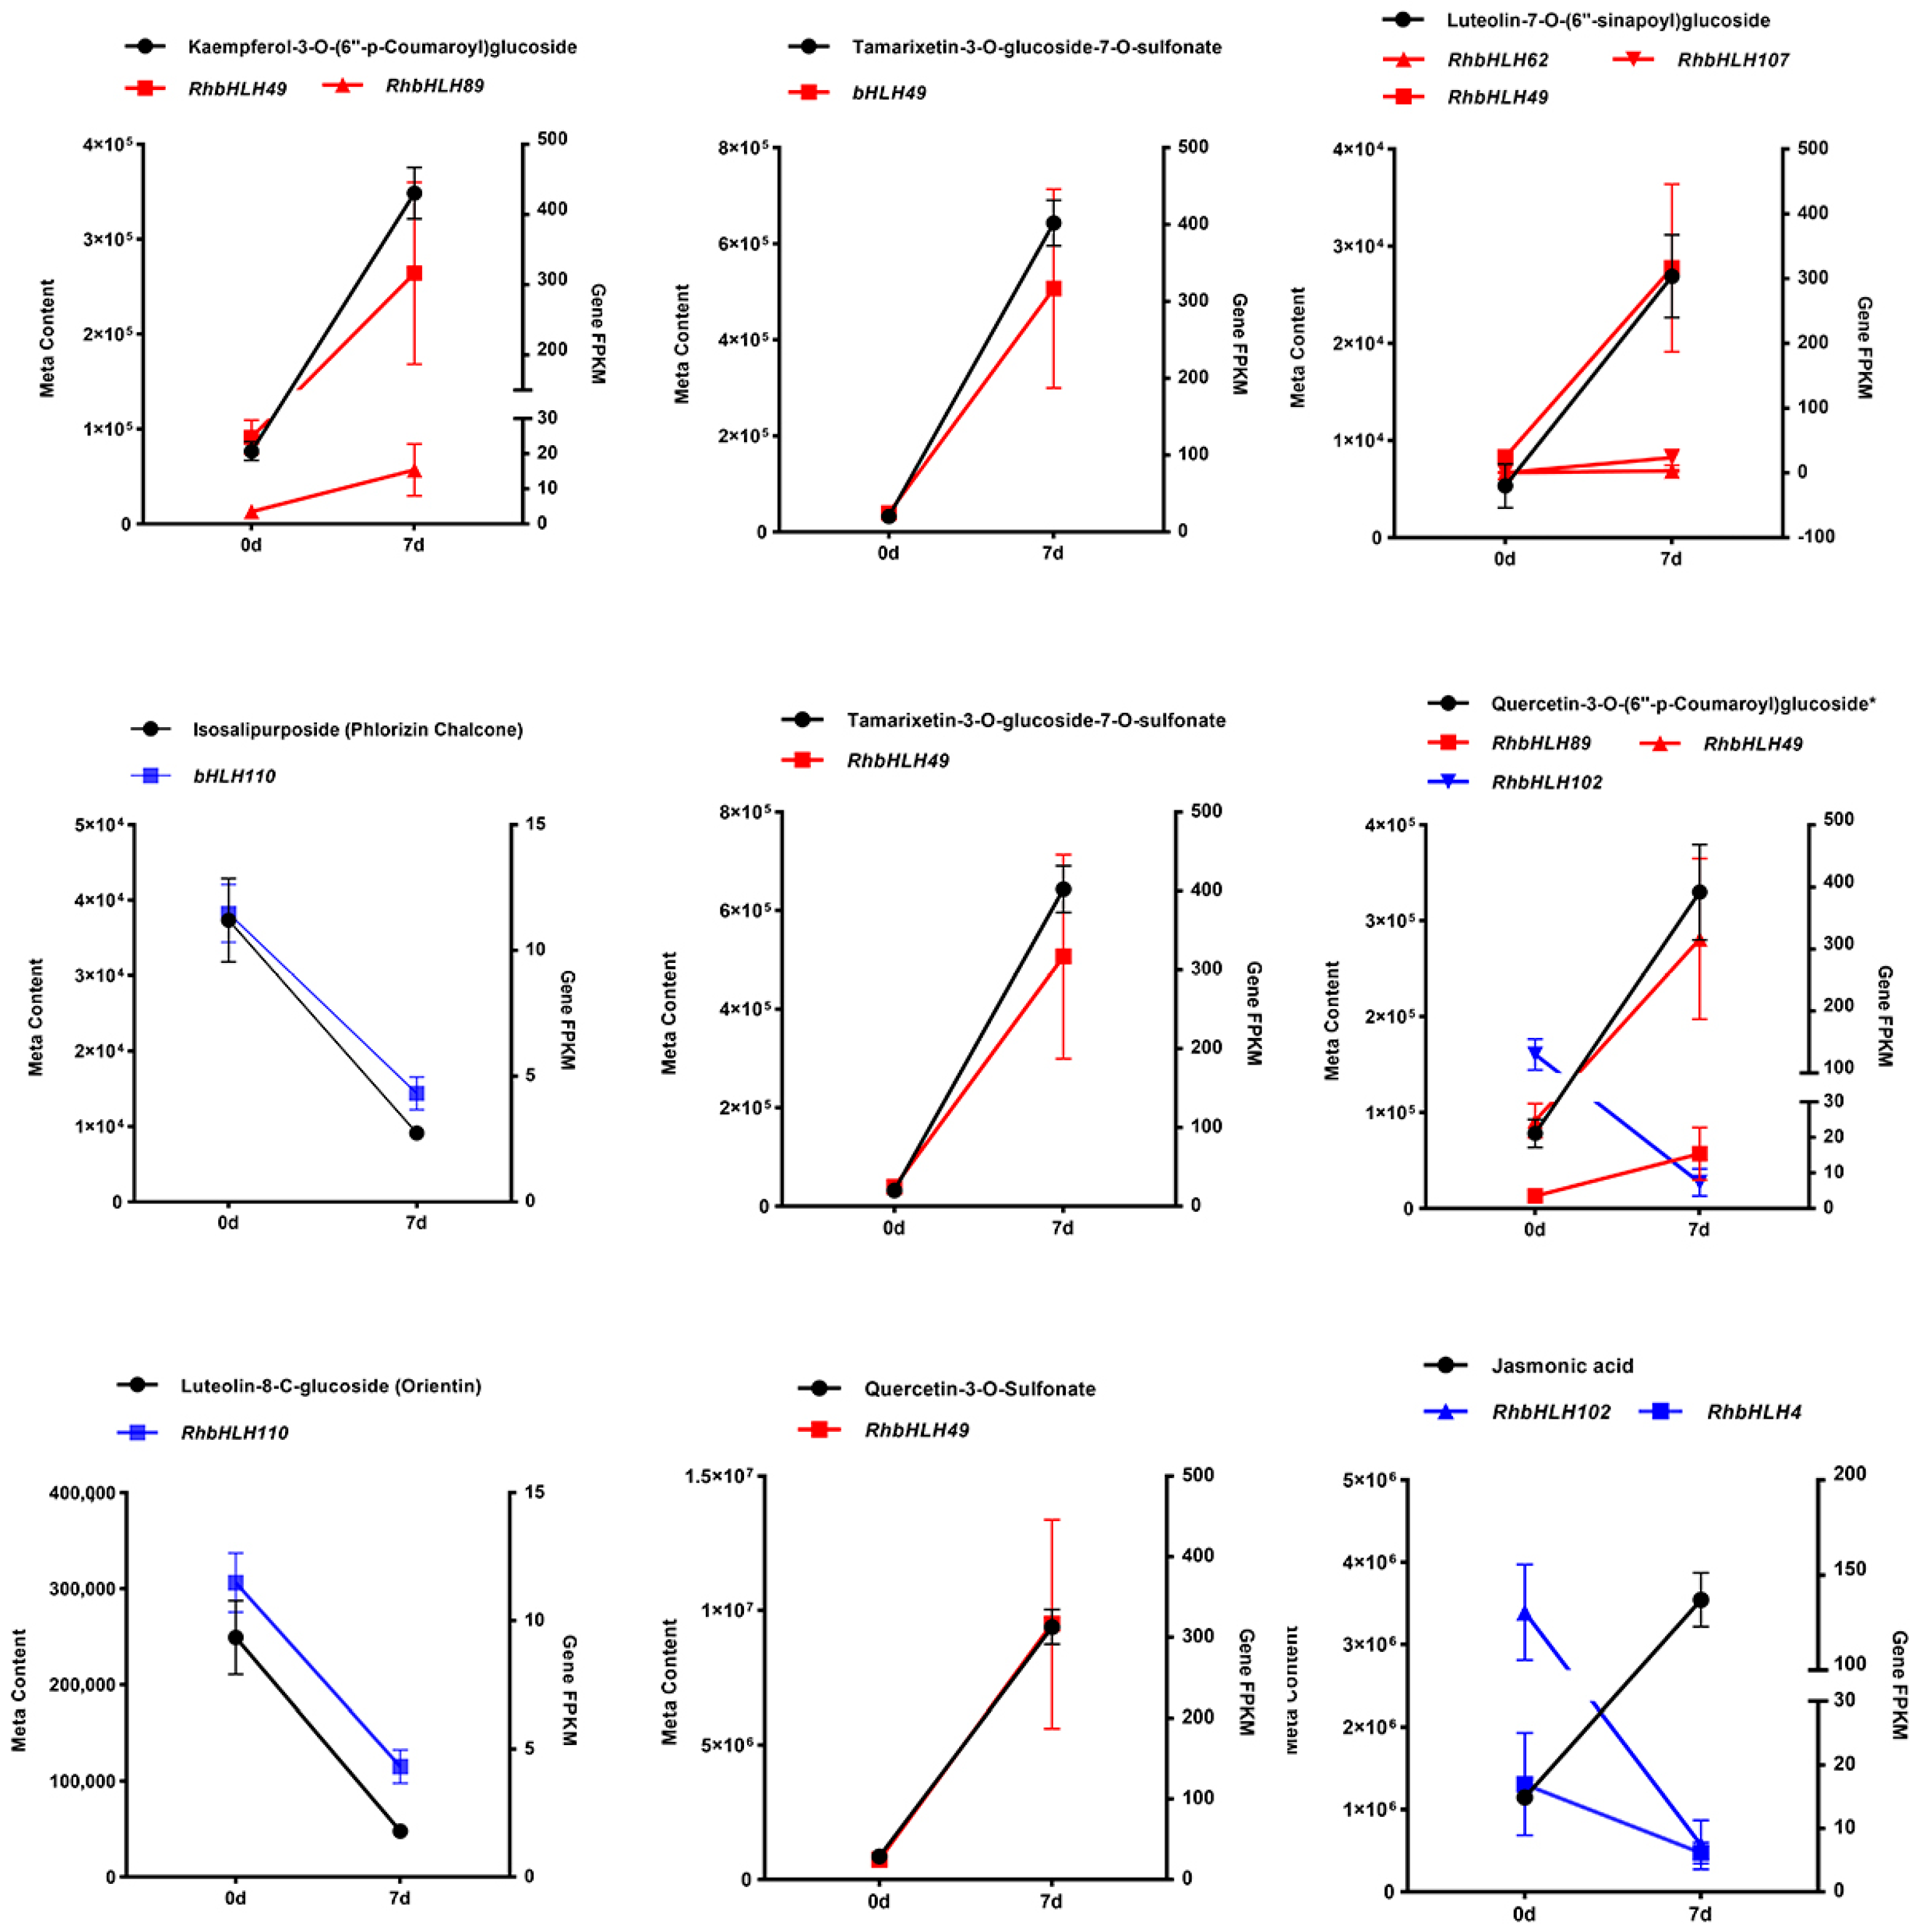
3.9. Analysis of Differential Metabolites and Differential Gene Associations

To explore how bHLH genes regulate the heat tolerance response in R. hainanense, Pearson correlation coefficients were used to analyze the correlation between differentially expressed bHLH genes and heat stress-related metabolites. The analysis results can be found in the Supplementary Document, with a summary shown in Table 3. The results indicate that RhbHLH107, RhbHLH49, RhbHLH89, and RhbHLH62 are significantly correlated with flavonoids (p < 0.01), while RhbHLH4 and RhbHLH102 are significantly correlated with jasmonic acid synthesis (p < 0.01).
After heat treatment, Tamarixetin-3-O-glucoside-7-O-sulfonateexpression levels increased, and the expression levels of RhbHLH49 and RhbHLH89, which are positively correlated with it, also increased; jasmonic acid accumulation significantly increased after high-temperature treatment, while the negatively correlated RhbHLH102 and RhbHLH4 were downregulated (Figure 16). We performed the same analysis on the other flavonoids. The results indicated that 6 RhbHLH genes might be involved in regulating flavonoids and jasmonic acid in response to heat stress. Detailed data can be found in the Supplementary File S5.

4. Conclusions

The bHLH gene family regulates plant growth and development and is also involved in the regulation of plant stress. We analyzed the evolutionary situation of the bHLH gene family in R. hainanense and its role in heat resistance using bioinformatics methods. This study identified 117 bHLH gene members with complete domains in R. hainanense, which is fewer compared to A. thaliana and O. sativa. The significant difference in gene quantity can be attributed to factors such as genome size, gene duplication events, and selection parameters. Chromosome localization indicates that the 117 bHLH members are unevenly distributed across 13 chromosomes. Based on differences in their conserved motifs, they are divided into 21 bHLH gene family subfamilies. For example, although subfamilies Va and Vb have similar motif compositions, Vb has double motif1 and motif5; motif3 is only found in subfamilies XV and IVc. The E family found in A. thaliana is absent in R. hainanense, while the T family is not found in A. thaliana [50]. This phenomenon indicates that the bHLH family in R. hainanense has undergone other changes during biological evolution, leading to differences in the composition of the gene family components.
The evolutionary analysis of the bHLH gene family in R. hainanense revealed eight pairs of segmental duplications, all of which exhibited Ka/Ks values less than 1, indicating purifying selection [51]. This suggests that these duplications have been conserved during evolution, likely due to their functional importance. The collinearity analysis between R. hainanense and other species, such as A. thaliana, O. sativa, and R. dauricum, further highlighted the evolutionary relationships of the bHLH family. The closer evolutionary relationship between R. hainanense and R. dauricum suggests shared functional roles in stress responses, particularly heat tolerance.
In the bHLH protein interaction network of R. hainanense, RhbHLH74 is predicted to be homologous to the A. thalianas transcription factor SPEECHLESS, which can serve as an integrative node for the opening and closing of stomata and can also function as an integrative node for brassinosteroids (BRs) to control the opening and closing of stomata [52]. RhbHLH91 is similar to the A. thalianas transcription factor ICE1, regulated by temperature changes. Studies have shown that the homologous protein interactions of RhbHLH74 and RhbHLH91 mediate the opening and closing of epidermal stomata [53] and reduce the impact of the environment on water stress [54]. RhbHLH8 and RhbHLH57 are homologous sequences of myc2, and their homologous sequences in red palm have been identified to relate to the drought response of plants participating in plant drought responses [55], with similar reports in grains [56]. There are also some proteins predicted to interact with a large number of other proteins such as RhbHLH91, RhbHLH96, and RhbHLH83. This phenomenon illustrates the complex and diverse functions of bHLH proteins, which are involved in various processes within the plant system.
A large number of studies have found that JA application can improve the thermal shock resistance of plants [57]. Su found that exogenous MEJA can regulate antioxidant defenses to enhance the heat resistance of ryegrass [58]. Through joint analysis of transcriptomics and metabolomics, we revealed an association under high-temperature stress between the bHLH gene family and the flavonoid and jasmonic acid content in R. hainanense. Similar studies have drawn the same conclusion. MYC, as a subfamily of bHLH transcription factors, has MYC2 being the dominant factor in JA signal regulation [59]. Cao’s research also found that MJ promotes flavonoids, and the increase in flavonoid content caused by MJ treatment leads to enhanced antioxidant activity [60], which aligns with our research results. The differentially expressed DEGs in R. hainanense are enriched in KEGG’s plant hormone signal transduction and MAPK signaling pathways, indicating that bHLH regulates plant hormones under heat stress; meanwhile, the differentially accumulated DAMs are enriched in secondary metabolites and flavonoid biosynthesis. We observed significant differences in flavonoid compound content before and after high-temperature stress. It is well known that flavonoids are crucial in plant temperature stress [61]. Coberly pointed out in his study that high-temperature tolerance is related to an increase in amino acids and the production of a large number of flavonoid compounds [62]. The ROS scavenging effect of flavonoid compounds in soybeans serves as a potential function of flavonoids in mitigating heat stress [63]. Previous studies have shown that flavonoids reduce the accumulation of reactive oxygen species in cells, which may be one of the reasons for the decrease in reactive oxygen species in R. hainanense in the later stages of heat stress (Figure 2). We detected five genes significantly related to flavonoid content: RhbHLH49, RhbHLH110, RhbHLH89, RhbHLH62, and RhbHLH107, and two genes significantly related to jasmonic acid content: RhbHLH102, RhbHLH4. Transcriptional and metabolomic analyses indicate that these bHLH genes may play a role in regulating jasmonic acid and flavonoids during heat stress.
It is noteworthy that the mechanism by which bHLH regulates JA and flavonoids is not clear. However, literature indicates that the increase in jasmonic acid can induce an increase in flavonoid content. Jiang found in their study on Erigerontis Herba that the application of exogenous jasmonic acid promotes flavonoid content, thereby enhancing the antioxidant capacity of the plants [64]. This is consistent with the conclusions of Cao’s research [65]. In Du’s study, the overexpression of CcbHLH 35 in the service tree significantly induced flavonoid synthase genes and suggested that methyl jasmonate promotes flavonoids by regulating CcbHLH 35, which coincides with the conclusions of this experiment [66]. A more detailed regulatory mechanism needs further experimentation to provide proof.
Overall, we found that seven RhbHLHs and two endogenous metabolites (jasmonic acid and flavonoids) were significantly associated with high temperature stress, indicating that bHLH family plays a crucial role in heat stress. Based on this study, future research can further explore the more detailed regulatory relationship between jasmonic acid, the bHLH gene family, and flavonoids. Currently, RhbHLH102 and RhbHLH4 may be involved in inhibiting the synthesis of jasmonic acid, while RhbHLH49, RhbHLH110, RhbHLH89, RhbHLH2, and RhbHLH107 may be involved in the synthesis of flavonoids, with consideration also given to the possibility of synergistic regulation among genes. Additionally, it is necessary to conduct research on other Rhododendron species, which will provide a theoretical basis for subsequent studies.

Supplementary Materials

The following supporting information can be downloaded at: https://www.mdpi.com/article/10.3390/f16030416/s1.

Author Contributions

Z.C.: Conceptualization. E.W.: Methodology. M.Z. and Y.L. (Yufei Li): Software. Y.L. (Yifan Li) and J.S.: Formal analysis. X.F. and J.W.: Editing. X.S. and Y.S.: Validation. Y.Z.: Writing and Reviewing. All authors have read and agreed to the published version of the manuscript.

Funding

This research was funded by National Natural Science Foundation of China (32360415 and 32160400), Scientific Research Project of Education Department of Hainan Province(hnhmzd202102).

Data Availability Statement

Data are contained within the article and Supplementary Materials.

Acknowledgments

This is a short text to acknowledge the contributions of specific colleagues, institutions, or agencies that aided the efforts of the authors.

Conflicts of Interest

The authors declare that the research was conducted in the absence of any commercial or financial relationships that could be construed as potential conflicts of interest.

References

  1. Chen, Y.C.; Zhao, Y.; Song, X.Q.; Ren, M.X. Difference in spatial distribution patterns and population structures of Rhododendron hainanense between both sides of riparian bends. Chin. J. Plant Ecol 2018, 42, 841–849. [Google Scholar] [CrossRef]
  2. Zhang, M.L.; Liu, Y.Q. Research on cultivation technology of alpine azalea. Anhui Agric. Sci. 2005, 33, 1008–1009. [Google Scholar]
  3. Huo, S.J.; Li, Y.F.; Li, R.P.; Chen, R.H.; Xing, H.T.; Wang, J.; Zhao, Y.; Song, X.Q. Genome-wide analysis of the MADS-box gene family in Rhododendron hainanense Merr. and expression analysis under heat and waterlogging stresses. Ind. Crops Prod. 2021, 172, 114007. [Google Scholar] [CrossRef]
  4. Shi, Y.H.; Li, S.P.; Liang, W.H.; Song, X.Q.; Tan, J.H. Germplasm Resourses of Rhododendron in Hainan. Chin. J. Trop. Crops. 2010, 31, 551–555. [Google Scholar]
  5. Feller, A.; Machemer, K.; Braun, E.L.; Grotewold, E. Evolutionary and comparative analysis of MYB and bHLH plant transcription factors. Plant J. 2011, 66, 94–116. [Google Scholar] [CrossRef]
  6. Hao, Y.; Zong, X.; Ren, P.; Qian, Y.; Fu, A. Basic Helix-Loop-Helix (bHLH) Transcription Factors Regulate a Wide Range of Functions in Arabidopsis. Int. J. Mol. Sci. 2021, 22, 7152. [Google Scholar] [CrossRef]
  7. Kolonko, M.; Greb-Markiewicz, B. bHLH-PAS Proteins: Their Structure and Intrinsic Disorder. Int. J. Mol. Sci. 2019, 20, 3653. [Google Scholar] [CrossRef]
  8. Massari, M.E.; Murre, C. Helix-loop-helix proteins: Regulators of transcription in eucaryotic organisms. Mol. Cell. Biol. 2000, 20, 429–440. [Google Scholar] [CrossRef]
  9. Pires, N.; Dolan, L. Origin and diversification of basic-helix-loop-helix proteins in plants. Mol. Cell. Biol. 2010, 27, 862–874. [Google Scholar] [CrossRef]
  10. Moore, A.W.; Barbel, S.; Jan, L.Y.; Jan, Y.N. A genomewide survey of basic helix-loop-helix factors in Drosophila. Proc. Natl. Acad. Sci. USA 2000, 97, 10436–10441. [Google Scholar] [CrossRef]
  11. Simionato, E.; Ledent, V.; Richards, G.; Thomas-Chollier, M.; Kerner, P.; Coornaert, D.; Degnan, B.M.; Vervoort, M. Origin and diversification of the basic helix-loop- helix gene family in metazoans: Insights from comparative genomics. BMC Dev. Biol. 2007, 7, 33. [Google Scholar]
  12. Ledent, V.; Paquet, O.; Vervoort, M. Phylogenetic analysis of the human basic helix-loop-helix proteins. Genome Biol. 2002, 3, research0030. [Google Scholar] [CrossRef] [PubMed]
  13. Buck, M.; Atchley, W. Phylogenetic analysis of plant basic helix-loop-helix proteins. J. Mol. Evol. 2003, 56, 742–750. [Google Scholar] [CrossRef] [PubMed]
  14. Li, T.; Brouwer, M. Hypoxia-inducible factor, gsHIF, of the grass shrimp Palaemonetes pugio:molecular characteriza-tion and response to hypoxia. Comp. Biochem. Physiol. B 2007, 147, 11–19. [Google Scholar] [CrossRef]
  15. Gonzalez, A.; Zhao, M.; Leavitt, J.M.; Lloyd, A.M. Regulation of the anthocyanin biosynthetic pathway by the TTG1/bHLH/MYB transcriptional complex in Arabidopsis seedlings. Plant J. 2008, 53, 814–827. [Google Scholar] [CrossRef]
  16. Komatsu, K.; Maekawa, M.; Ujiie, S.; Satake, Y.; Furutani, I.; Okamoto, H.; Shimamoto, K.; Kyozuka, J. LAX and SPA: Major regulators of shoot branching in rice. Proc. Natl. Acad. Sci. USA 2003, 100, 11765–11770. [Google Scholar] [CrossRef]
  17. Bernhardt, C.; Lee, M.M.; Gonzalez, A.; Zhang, F.; Lloyd, A.; Schiefelbein, J. The bHLH genes GLABRA3 (GL3) and ENHANCER OF GLABRA3 (EGL3) specify epidermal cell fate in the Arabidopsis root. Development 2003, 130, 6431–6439. [Google Scholar] [CrossRef]
  18. Ichihashi, Y.; Horiguchi, G.; Gleissberg, S.; Tsukaya, H. The bHLH Transcription Factor SPATULA Controls Final Leaf Size in Arabidopsis thaliana. Plant Cell Physiol. 2010, 51, 252–261. [Google Scholar] [CrossRef]
  19. Qi, T.C.; Huang, H.; Song, S.S.; Xie, D.X. Regulation of Jasmonate-Mediated Stamen Development and Seed Production by a bHLH-MYB Complex in Arabidopsis. Plant Cell 2015, 27, 1620–1633. [Google Scholar] [CrossRef]
  20. Abe, H.; Urao, T.; Ito, T.; Seki, M.; Shinozaki, K.; Yamaguchi-Shinozaki, K. Arabidopsis AtMYC2 (bHLH) and AtMYB2 (MYB) Function as Transcriptional Activators in Abscisic Acid Signaling. Plant Cell 2003, 15, 63–78. [Google Scholar] [CrossRef]
  21. Zimmermann, I.M.; Heim, M.A.; Weisshaar, B.; Uhrig, J.F. Comprehensive identification of Arabidopsis MYB transcription factors interacting with R/B-like bHLH proteins. Plant J. 2004, 40, 22–34. [Google Scholar] [CrossRef] [PubMed]
  22. Liang, G.; Zhang, H.M.; Li, X.L.; Ai, Q.; Yu, D.Q. bHLH transcription factor bHLH115 regulates iron homeostasis in Arabidopsis. J. Exp. Bot. 2017, 68, 1743–1755. [Google Scholar] [CrossRef] [PubMed]
  23. Sakamoto, W.; Ohmori, T.; Kageyama, K.; Miyazaki, C.; Saito, A.; Murata, M.; Noda, K.; Maekawa, M. The Purple leaf (Pl) locus of rice; the PlW allele has a complex organizationand includes two genes encoding basic helix-loop-helix proteinsinvolved in anthocyanin biosynthesis. Plant Cell Physiol. 2001, 42, 982–991. [Google Scholar] [CrossRef] [PubMed]
  24. Lorrain, S.; Allen, T.; Duek, P.D.; Whitelam, G.C.; Fankhauser, C. Phytochrome-mediated inhibition of shade avoidance involves degradation of growth-promoting bHLH transcription factors. Plant J. 2008, 53, 312–323. [Google Scholar] [CrossRef]
  25. Koini, M.A.; Alvey, L.; Allen, T.; Tilley, C.A.; Harberd, N.P.; Whitelam, G.C.; Franklin, K.A. High Temperature-Mediated Adaptations in Plant Architecture Require the bHLH Transcription Factor PIF4. Curr. Biol. 2009, 19, 408–413. [Google Scholar] [CrossRef]
  26. Khan, G.; Nolzen, J.; Schepker, H.; Albach, D.C. Incongruent phylogenies and their implications for the study of diversification, taxonomy, and genome size evolution of Rhododendron. Am. J. Bot. 2021, 108, 1957–1981. [Google Scholar] [CrossRef]
  27. Lin, W.; Liu, L.; Liang, J.C.; Tang, X.X.; Shi, J.; Zhang, L.; Wu, P.; Lan, S.; Wang, S.; Zhou, Y.; et al. Changes of endophytic microbial community in Rhododendron dauricum roots under heat stress and its correlation with leaf physiological indicators. Front. Microbiol. 2022, 13, 1006686. [Google Scholar] [CrossRef]
  28. Hodges, D.M.; DeLong, J.M.; Forney, C.F.; Prange, R.K. Improving the thiobarbituric acid-reactive-substances assay for estimating lipid peroxidation in plant tissues containing anthocyanin and other interfering compounds. Planta 1999, 207, 604–611. [Google Scholar] [CrossRef]
  29. Bates, L.S.; Waldren, R.P.; Teare, I.D. Rapid determination of free proline for water-stress studies. Plant Soil 1973, 39, 205–207. [Google Scholar] [CrossRef]
  30. Potter, S.C.; Luciani, A.; Eddy, S.R.; Park, Y.; Lopez, R.; Finn, R.D. HMMER web server: 2018 update. Nucleic Acids Res. 2018, 46, W200–W204. [Google Scholar] [CrossRef]
  31. Gasteiger, E.; Gattiker, A.; Hoogland, C.; Ivanyi, I.; Appel, R.D. Bairoch ExPASy: The proteomics server for in-depth protein knowledge and analysis. Nucleic Acids Res. 2003, 31, 3784–3788. [Google Scholar] [CrossRef] [PubMed]
  32. Liu, C.; Xie, T.; Chen, C.; Luan, A.; Long, J.; Li, C.; Ding, Y.; He, Y. Genome-wide organization and expression profiling of the R2R3-MYB transcription factor family in pineapple (Ananas comosus). BMC Genom. Data 2017, 18, 503. [Google Scholar] [CrossRef] [PubMed]
  33. Zhang, Z.; Li, J.; Zhao, X.Q.; Wang, J.; Wong, G.K.S.; Yu, J. KaKs_Calculator: Calculating Ka and Ks through model selection and model averaging. Genom. Proteom. Bioinform. 2006, 4, 259–263. [Google Scholar] [CrossRef] [PubMed]
  34. Wei, K.; Chen, H. Comparative functional genomics analysis of bHLH gene family in rice, maize and wheat. BMC Plant Biol. 2018, 18, 309. [Google Scholar] [CrossRef]
  35. Anam, S.; Hilal, B.; Fariduddin, Q. Polyamines and hydrogen peroxide: Allies in plant resilience against abiotic stress. Chemosphere 2024, 366, 143438. [Google Scholar] [CrossRef]
  36. Ghosh, U.K.; Islam, M.N.; Siddiqui, M.N.; Cao, X.; Khan, M.A.R. Proline, a multifaceted signalling molecule in plant responses to abiotic stress: Understanding the physiological mechanisms. J. Integr. Plant Biol. 2022, 24, 227–239. [Google Scholar] [CrossRef]
  37. Hnilickova, H.; Kraus, K.; Vachova, P.; Hnilicka, F. Salinity Stress Affects Photosynthesis, Malondialdehyde Formation, and Proline Content in Portulaca oleracea L. Plants 2021, 10, 845. [Google Scholar] [CrossRef]
  38. Bowler, C.; Van Camp, W.; Van Montagu, M.; Inzé, D.; Asada, K. Superoxide Dismutase in Plants. CRC Crit. Rev. Plant Sci. 1994, 13, 199–218. [Google Scholar] [CrossRef]
  39. Purugganan, M.D. The evolution of rice: Molecular vignettes on its origins and spread. Archaeol Anthropol Sci. 2010, 2, 61–68. [Google Scholar] [CrossRef]
  40. Baumgarten, A.; Cannon, S.; Spangler, R.; May, G. Genome-Level Evolution of Resistance Genes in Arabidopsis thaliana. Genetics 2003, 165, 309–319. [Google Scholar] [CrossRef]
  41. Polezhaeva, M.A.; Pimenova, E.A.; Tikhonova, N.A.; Korchagina, O.S. Plastid DNA diversity and genetic divergence within Rhododendron dauricum s.l. (R. dauricum s.s., R. ledebourii, R. sichotense and R. mucronulatum; Ericaceae). Plant Syst Evol. 2018, 304, 763–774. [Google Scholar] [CrossRef]
  42. Heim, M.A.; Jakoby, M.; Werber, M.; Martin, C.; Weisshaar, B.; Bailey, P.C. The basic helix-loop-helix transcription factor family in plants: A genome-wide study of protein structure and functional diversity. Mol. Biol. Evol. 2003, 20, 735–747. [Google Scholar] [CrossRef] [PubMed]
  43. Carretero-Paulet, L.; Galstyan, A.; Roig-Villanova, I.; Jaime, F.; García, M.; Bilbao-Castro, J.R.; Robertson, D.L. Genome-Wide Classification and Evolutionary Analysis of the bHLH Family of Transcription Factors in Arabidopsis, Poplar, Rice, Moss, and Algae. Plant Physiol. 2010, 153, 1398–1412. [Google Scholar] [CrossRef]
  44. Biłas, R.; Szafran, K.; Hnatuszko-Konka, K.; Kononowicz, A.K. Cis-regulatory elements used to control gene expression in plants. Plant Cell. 2016, 127, 269–287. [Google Scholar] [CrossRef]
  45. Alexandre, P.; Andrea, L.M.; Eveland, A.L.; Kaufmann, K.; Nathan, M.S. cis-Regulatory Elements in Plant Development, Adaptation, and Evolution. Annu. Rev. Plant Biol. 2023, 74, 111–137. [Google Scholar]
  46. Bari, R.; Jones, J.D.G. Role of plant hormones in plant defence responses. Plant Mol. Biol. 2009, 69, 473–488. [Google Scholar] [CrossRef]
  47. Soto, C. Unfolding the role of protein misfolding in neurodegenerative diseases. Nat. Rev. Neurosci. 2003, 4, 49–60. [Google Scholar] [CrossRef]
  48. Wang, J.; Song, L.; Gong, X.; Xu, J.; Li, M. Functions of Jasmonic Acid in Plant Regulation and Response to Abiotic Stress. Int. J. Mol. Sci. 2020, 21, 1446. [Google Scholar] [CrossRef]
  49. Cai, Z.; He, F.; Feng, X.; Liang, T.; Wang, H.W.; Ding, S.C.; Tian, X.H. Transcriptomic Analysis Reveals Important Roles of Lignin and Flavonoid Biosynthetic Pathways in Rice Thermotolerance During Reproductive Stage. Front. Genet. 2020, 11, 1664–8021. [Google Scholar] [CrossRef]
  50. Gabriela, T.O.; Huq, E.; Peter, H.Q. The Arabidopsis Basic/Helix-Loop-Helix Transcription Factor Family. Plant Cell 2003, 15, 1749–1770. [Google Scholar]
  51. Li, J.; Zhang, Z.; Vang, S.; Yu, J.; Wong, G.K.-S.; Wang, J. Correlation Between Ka/Ks and Ks is Related to Substitution Model and Evolutionary Lineage. J. Mol. Evol. 2009, 68, 414–423. [Google Scholar] [CrossRef] [PubMed]
  52. Gudesblat, G.; Schneider-Pizoń, J.; Betti, C.; Mayerhofer, J.; Vanhoutte, I.; van Dongen, W.; Boeren, S.; Zhiponova, M.; de Vries, S.; Jonak, C.; et al. SPEECHLESS integrates brassinosteroid and stomata signalling pathways. Nat. Cell Biol. 2012, 14, 548–554. [Google Scholar] [CrossRef] [PubMed]
  53. Wu, H.C.; Yu, S.Y.; Wang, Y.D.; Jinn, T.L. Guard Cell-Specific Pectin METHYLESTERASE53 Is Required for Abscisic Acid-Mediated Stomatal Function and Heat Response in Arabidopsis. Front. Plant Sci. 2022, 13, 836151. [Google Scholar] [CrossRef] [PubMed]
  54. Han, Y.; Fan, S.; Zhang, Q.; Wang, Y. Effect of heat stress on the MDA, proline and soluble sugar content in leaf lettuce seedlings. Agric. Sci. 2013, 4, 112–115. [Google Scholar] [CrossRef]
  55. Jiang, L.; Tian, X.; Li, S.; Fu, Y.; Xu, J.; Wang, G. The AabHLH35 Transcription Factor Identified from Anthurium andraeanum is Involved in Cold and Drought Tolerance. Plants 2019, 8, 216. [Google Scholar] [CrossRef]
  56. Wang, P.; Wang, H.; Wang, Y.; Ren, F.; Liu, W. Analysis of bHLH genes from foxtail millet (Setaria italica) and their potential relevance to drought stress. PLoS ONE 2018, 13, e0207344. [Google Scholar] [CrossRef]
  57. Wang, Y.; Mostafa, S.; Zeng, W.; Jin, B. Function and Mechanism of Jasmonic Acid in Plant Responses to Abiotic and Biotic Stresses. Int. J. Mol. Sci. 2021, 22, 8568. [Google Scholar] [CrossRef]
  58. Su, Y.; Huang, Y.; Dong, X.; Wang, R.; Tang, M.; Cai, J.; Chen, J.; Zhang, X.; Nie, G. Exogenous methyl jasmonate improves heat tolerance of perennial ryegrass through alteration of osmotic adjustment, antioxidant defense, and expression of jasmonic acid-responsive genes. Front. Plant Sci. 2021, 12, 665. [Google Scholar] [CrossRef]
  59. Zhang, F.; Yao, J.; Ke, J.; Zhang, L.; Lam, V.Q.; Xin, X.-F.; Zhou, X.E.; Chen, J.; Brunzelle, J.; Griffin, P.R.; et al. Structural basis of JAZ repression of MYC transcription factors in jasmonate signalling. Nature 2015, 525, 269–273. [Google Scholar] [CrossRef]
  60. Cao, F.; Zheng, Y.H.; Wang, K.T.; Rui, H. Methyl jasmonate reduces chilling injury and enhances antioxidant enzyme activity in postharvest loquat fruit. Food Chem. 2009, 115, 1458–1463. [Google Scholar] [CrossRef]
  61. Baskar, V.; Venkatesh, R.; Ramalingam, S. Flavonoids (Antioxidants Systems) in Higher Plants and Their Response to Stresses. In Antioxidants and Antioxidant Enzymes in Higher Plants; Gupta, D., Palma, J., Corpas, F., Eds.; Springer: Cham, Switzerland, 2018; pp. 253–268. [Google Scholar]
  62. Coberly, L.C.; Rausher, M.D. Analysis of a chalcone synthase mutant in Ipomoea purpurea reveals a novel function for flavonoids: Amelioration of heat stress. Mol. Ecol. 2003, 12, 1113–1124. [Google Scholar] [CrossRef] [PubMed]
  63. Shen, J.; Rong, X.; Li, X.; Ma, Y.; Cheng, H.; Sheng, J.; Huang, L.; Jin, S. Transcriptome and Flavonoid Compounds Metabolome Analyses Reveal the Mechanisms of Heat Stress in Rhododendron with Exogenously Applied Calcium. Agronomy. 2024, 14, 1282. [Google Scholar] [CrossRef]
  64. Woch, N.; Laha, S.; Gudipalli, P. Salicylic acid and jasmonic acid induced enhanced production of total phenolics, flavonoids, and antioxidant metabolism in callus cultures of Givotia moluccana (L.) Sreem. In Vitro Cell. Dev. Biol. Plant 2023, 59, 227–248. [Google Scholar] [CrossRef]
  65. Cao, J.; Li, M.; Chen, J.; Liu, P.; Li, Z. Effects of MeJA on Arabidopsis metabolome under endogenous JA deficiency. Sci. Rep. 2016, 6, 37674. [Google Scholar] [CrossRef] [PubMed]
  66. Du, T.T.; Fan, Y.X.; Cao, H.Y.; Song, Z.; Dong, B.; Liu, T.; Yang, W.; Wang, M.; Niu, L.; Yang, Q.; et al. Transcriptome analysis revealed key genes involved in flavonoid metabolism in response to jasmonic acid in pigeon pea (Cajanus cajan (L.) Millsp.). Plant Physiol. Biochem. 2021, 168, 410–422. [Google Scholar] [CrossRef]
Figure 1. Growth condition of experimental materials. The figure shows the phenotypes of R. hainanense at different heat treatment durations (40 °C).
Forests 16 00416 g001
Figure 2. Physiological indicators of R. hainanense and R. dauricum under high temperature stress over time. Comparison of Hydrogen peroxide content (A), proline content (B), MDA content (C) and SOD activity (D) of R. hainanense and R. dauricum under 40 °C high temperature. Note: Duncan’s teat (SSR), different small letter in the figure mean signficant difference (p < 0.05).
Forests 16 00416 g002
Figure 3. The conserved structure and conserved sequences of the RhbHLH gene.
Forests 16 00416 g003
Figure 4. Positioning of RhbHLH gene on the chromosome.
Forests 16 00416 g004
Figure 5. RhbHLH segmental duplication. Trajectories represent the collinear relationships of the whole genome of R. hainanense, with the outer area being coded gray blocks based on chromosome length. The gray lines represent duplicated collinear genes in R. hainanense, while the red lines represent duplicated collinear genes of the bHLH gene family. When the lines move away from the center, it indicates that the CG ratio contained in that gene is higher. Collinear bHLH genes are annotated in the figure.
Forests 16 00416 g005
Figure 6. Collinearity analysis R. hainanense bHLH gene between O. sativaL, A. thalianas, and R. dauricum. The analysis is listed from top to bottom for O. sativa and R. hainanense, A. thalianas and R. hainanense, R. dauricum and R. hainanense. The chromosomes of R. hainanense are represented by green blocks, while the chromosomes of other comparative species are represented by orange blocks. The gray lines indicate collinear segments between the two species, while collinear NAM gene pairs are connected by red lines.
Forests 16 00416 g006
Figure 7. Phylogenetic tree of the bHLH family of R. hainanense and A. thalianas. The phylogenetic tree of the bHLH family of R. hainanense, using A. thalianas as a template, where the same color blocks represent the same subfamily.
Forests 16 00416 g007
Figure 8. The conserved motifs and conserved structures of the R. hainanense bHLH family. Different colored blocks represent different subfamilies of RhbHLH.
Forests 16 00416 g008
Figure 9. Structure of the bHLH gene in R. hainanense.
Forests 16 00416 g009
Figure 10. Prediction the 3D structure of the bHLH protein of R. hainanense.
Forests 16 00416 g010
Figure 11. Protein interaction network based on the homologs of RhbHLHs in A. thalianas.
Forests 16 00416 g011
Figure 12. Expression heat map of R. hainanense bHLH under high-temperature treatment.
Forests 16 00416 g012
Figure 13. RT-PCR validation of rna-seq.
Forests 16 00416 g013
Figure 14. Fluorescent quantitative expression of differentially expressed bHLH under high-temperature stress.Note: Duncan’s teat(SSR), different small letter in the figure mean signficant difference (p < 0.05).
Forests 16 00416 g014
Figure 15. (A) PCA of DAM under positive ion mode & (B) Volcanic Map of DMA.
Forests 16 00416 g015
Figure 16. Metabolic levels of flavonoids and jasmonic acid and the expression levels of significantly related genes. Different DAMs are represented by black lines in the figure; DEGs positively correlated with DAMs are represented by red lines; those negatively correlated with DAMs are represented by blue dotted lines.
Forests 16 00416 g016
Table 1. KA/KS of the bHLH family repeat sequences in R. hainanense.
Duplicated Gene PairsNon Synonymous (Ka)Synonymous (Ks)Ka/Ks
RhbHLH76 & RhbHLH40.22540.84220.2676
RhbHLH17 & RhbHLH60.22771.34970.1687
RhbHLH36 & RhbHLH990.44232.01410.2196
RhbHLH17 & RhbHLH150.11840.71720.1651
RhbHLH55 & RhbHLH80.32180.96320.3341
RhbHLH28 & RhbHLH200.09900.60960.1624
RhbHLH65 & RhbHLH220.21890.59920.3654
RhbHLH30 & RhbHLH280.24602.36990.1038
Note: Detailed data can be found in the Supplementary File S3.
Table 2. RNA-Seq Quality Report.
SampleRaw ReadsClean ReadsClean Base (G)Error Rate (%)Q20 (%)Q30 (%)GC Content (%)
RhTH150,883,98849,954,0647.490.0397.8193.8146.8
RhTH243,558,65642,651,1966.40.0397.8993.6846.57
RhTH344,111,83043,263,5326.490.0397.8593.5646.61
RhTN141,280,12840,342,8826.050.0397.9393.8446.89
RhTN244,580,58643,394,0786.510.0397.9393.8446.95
RhTN370,401,55868,999,93810.350.0397.9693.8347.09
Table 3. PCC values and p-values of differentially expressed genes and differentially expressed metabolites.
CompoundsClassGene NamePCCPCCP
7-O-MethyleriodictyolFlavanolsRhbHLH490.9670.001607786
Isosalipurposide (Phlorizin Chalcone)ChalconesRhbHLH110−0.9460.0043221
Kaempferol-3-O-(6″-p-Coumaroyl)glucoside FlavonolsRhbHLH490.9680.001487601
Kaempferol-3-O-(6″-p-Coumaroyl)glucoside FlavonolsRhbHLH890.9250.008120533
Luteolin-7-O-(6″-sinapoyl)glucosideFlavonoidRhbHLH490.9710.001227645
Luteolin-7-O-(6″-sinapoyl)glucosideFlavonoidRhbHLH620.9440.004665124
Luteolin-7-O-(6″-sinapoyl)glucosideFlavonoidRhbHLH1070.9330.006563481
Luteolin-8-C-glucoside (Orientin)Flavonoid carbonosideRhbHLH110−0.970.001349201
Quercetin-3-O-(6″-p-Coumaroyl)glucoside*FlavonolsRhbHLH890.9460.004371937
Quercetin-3-O-(6″-p-Coumaroyl)glucoside*FlavonolsRhbHLH490.9420.004896722
Quercetin-3-O-(6″-p-Coumaroyl)glucoside*FlavonolsRhbHLH102−0.9760.000866412
Quercetin-3-O-SulfonateFlavonolsRhbHLH490.9770.00078461
Tamarixetin-3-O-glucoside-7-O-sulfonateFlavonoidRhbHLH490.9360.005967489
Jasmonic acidOrganic acidsRhbHLH4−0.9490.003875338
Jasmonic acidOrganic acidsRhbHLH102−0.9360.006062754
According to the association analysis of transcriptomics and metabolomics, the following flavonoid compounds are highly expressed under heat stress: Tamarixetin-3-O-glucoside-7-O-sulfonate,Quercetin-3-O-Sulfonate,7-O-Methyleriodictyo, Luteolin-7-O-(6″-eudesmyl)glucoside,Luteolin-7-O-(6″-sinapoyl)glucoside, Kaempferol-3-O-(6″-p-Coumaroyl)glucoside (Tiliroside), Quercetin-3-O-(6″-p-Coumaroyl)glucoside*, Isosalipurposide (Phlorizin Chalcone), Luteolin-8-C-glucoside (Orientin), and Jasmonic acid. Studies have shown that flavonoids and Jasmonic acid are involved in the heat tolerance response in plants [48,49].
Disclaimer/Publisher’s Note: The statements, opinions and data contained in all publications are solely those of the individual author(s) and contributor(s) and not of MDPI and/or the editor(s). MDPI and/or the editor(s) disclaim responsibility for any injury to people or property resulting from any ideas, methods, instructions or products referred to in the content.

