Abstract
Mangroves grow in high-salinity environments with low soil water potential (Ψs), where high light intensity and strong winds increase the vapor pressure deficit (VPD), causing physiological drought and high transpiration demand (Δw), which limits carbon dioxide (carbon gain) for photosynthesis. This study explored how mangroves optimize their carbon-gain-to-water-loss ratio (water-use strategies) to maximize carbon gain during both dry and rainy seasons. We also calculated the relative costs of key leaf traits and compared them with those of terrestrial forests under the carbon gain optimization model. The results revealed that (1) with increasing Δw, terrestrial forests primarily adjusted leaf hydraulic conductance (Kleaf), while mangroves altered the difference in water potential (ΔΨ); (2) as Ψs decreased, πtlp of both terrestrial forests and mangroves increased; (3) terrestrial forests developed a more balanced distribution of leaf trait costs between osmotic pressure (46.7 ± 0.2%) and stomata (43.3 ± 1.2%), whereas mangroves had the highest cost in osmotic pressure (49.04 ± 0.03%) and the lowest cost in stomata (11.08 ± 3.00%) during the rainy season; and (4) although mangroves showed differences in trait values between dry and rainy seasons, their responses to drought stress remained consistent. These findings provided new theoretical insights into how mangroves maintain high carbon gain and water-use efficiency under extreme environmental conditions, which is important to improve mangrove conservation efforts and contribute to climate mitigation policies.
Keywords:
mangroves; water-use strategy; VPD; salinity stress; carbon gain; carbon cost; osmotic adjustment 1. Introduction
Mangroves predominantly inhabit tropical and subtropical intertidal zones [1,2,3,4,5,6]. Despite abundant water availability, the low osmotic potential and extremely negative water potential in high-salinity soils make water absorption unfavorable and lead to the occurrence of physiological drought [7]. Environmental stressors, such as high light, high temperature, strong winds, tide inundation, and high VPD, are predicted to increase transpiration demand [8,9], exacerbating water loss and stress. In response, mangroves typically extract water by maintaining extremely low xylem water potentials, high xylem tension, and elevated cellular osmotic pressure [10], thereby conserving water through structural and physiological adaptations such as enhanced water-use efficiency [11,12] and reduced transpiration rates [13,14]. This conservative water-use strategy enables mangroves to maintain high productivity [1,11,15] and greater capacity for carbon sequestration than adjacent terrestrial forests, thereby enhancing their role in carbon storage [16,17,18,19].
Under high VPD and salinity stress, plants typically close their stomata to limit water loss [13,20,21,22], thereby conserving water but simultaneously reducing CO2 uptake and net photosynthesis [23,24,25,26,27]. Despite such constraints, mangroves maintain relatively high photosynthetic capacity [17,28,29] by employing advanced salt management—such as root ultrafiltration, salt glands, ion sequestration in vacuoles, and the production of compatible solutes for osmotic regulation [10,30,31]—while maintaining xylem water transport under low water potential by improving water-use efficiency, adjusting leaf structure, and regulating osmotic balance, thereby sustaining cell turgor [32,33,34,35,36,37]. However, the water and salt balance of mangroves remains sensitive to seasonal fluctuations and climate change, underscoring the importance of these adaptations for ensuring resilience in extreme environments [38,39,40,41]. In global climate models, these adaptive mechanisms can represent mangrove resilience in the face of climate change. By incorporating these physiological adaptations into carbon sequestration models, we can more accurately predict their carbon absorption capacity under future climate conditions.
In the unique environment of mangroves, leaves serve as crucial organs for gas exchange and energy conversion [42]. Leaf water potential (Ψleaf), transpiration rate (E), stomatal conductance (gsat), leaf hydraulic conductance (Kleaf), and CO2 assimilation rate (Asat) are closely interconnected and significantly affected by osmotic pressure [43,44]. The turgor loss point (πtlp) has been identified as a reliable predictor of species’ capacities for osmotic adjustment [45,46,47]. Plants with lower πtlp values typically exhibit stronger drought tolerance [48], enabling them to preserve turgor pressure and endure prolonged dry periods. The variation in πtlp also accounts for species distribution, where species with lower πtlp values are adapted to arid or saline environments [49]. Collectively, these traits, which balance leaf-level water uptake, transport, and loss, are key adaptations to high-salinity intertidal environments and facilitate efficient carbon gain [2,50]. Under both high vapor pressure deficit (VPD) and elevated salinity, mangroves need to optimize their leaf water-use strategies to maximize carbon gain and enhance survival [51,52].
The optimization hypothesis provided a critical theoretical framework for understanding the coordinated mechanisms among traits, suggesting that plants were subject to natural selection to achieve maximal net carbon gain [53,54]. The pioneering model by Cowan and Farquhar [55] suggested that the function of stomata is to minimize water loss while maintaining photosynthesis. Later, Farquhar et al. [56] proposed the FvCB model, which clarifies how photosynthesis functions under water and CO2 constraints. Building on the optimization hypothesis, numerous studies have further advanced photosynthetic modeling [57], particularly regarding nitrogen allocation [58] and leaf carbon gain and associated costs [53,59,60]. Collectively, these studies highlight the central role of the optimization hypothesis in plant photosynthesis and physiological adaptation, providing valuable insights into how plants cope with various environmental stresses and optimize resource use.
Given the above context, this study hypothesized that under the dual stress of high VPD and salinity, mangrove leaves would optimize water-use traits to maximize carbon gain and enhance adaptability. Our research investigated mangrove species in subtropical China during both the dry and rainy seasons, assessing net photosynthetic rates, gas exchange, and hydraulic traits. Although these mangrove species differ in their salt-exclusion strategies, the existing evidence suggests that such distinctions did not fundamentally alter their water relations [50]. Here, we applied a carbon-gain optimization model to explore how osmotic regulation, leaf water potential control, and stomatal optimization enable mangroves to balance water use and carbon uptake, thereby attaining maximal carbon gain. We further quantified the relative costs of key leaf functional traits and compared them with those of terrestrial forests. From the perspective of maximizing carbon gain, this study aimed to elucidate the water management and carbon acquisition strategies of mangroves in extreme environments, providing new insights and theoretical foundations for the conservation and management of mangrove ecosystems in response to climate change.
2. Materials and Methods
2.1. Study Area and Materials
In this study, we focused on four key functional traits of mangroves that were closely related to water stress responses. The goal of examining these traits was to gain deeper insight into how mangroves optimize their physiological functioning under elevated VPD (denoted as Δw) and high salinity (denoted as Ψs), ultimately maximizing carbon gain. We assessed these traits across different seasonal conditions through fieldwork in several major mangrove conservation areas in Hainan Province: the Dongzhaigang Mangrove Reserve (Haikou), the Xinying Mangrove Reserve (Danzhou), the Qinglangang Mangrove Reserve (Wenchang), and along the Linchun River and the Yuya salt field (Sanya). Measurements were taken on dominant mangrove species during both the dry season (March) and the rainy season (August). Species were selected based on their ecological significance, abundance, and functional roles in maintaining ecosystem stability in mangroves. We prioritized species that contribute significantly to primary productivity, exhibit strong adaptations to varying salinity and hydrological conditions, or play key roles in nutrient cycling and habitat structure. Data were also collected from additional mangrove species exhibiting the same traits (see Table 1). To facilitate comparison, information on terrestrial species exhibiting these four traits was obtained from Deans et al. [53].

Table 1.
Details of the mangrove species sampled for optimization model.
2.2. Photosynthetic Rate and Gas Exchange
We measured the maximum net photosynthetic rate (Asat), average maximum transpiration rate (E), and average maximum stomatal conductance (gsat) on three sunlit canopy leaves from three individuals of each species using a Li-Cor 6800 portable photosynthesis system (Li-Cor Inc., Lincoln, NE, USA). Prior to measurement, the leaves were exposed to 1800 μmol·m−2·s−1 for 10 min. The photosynthetic photon flux density in the leaf chamber was set to 1200 μmol·m−2·s−1. The chamber temperature was maintained at 26 °C. A CO2-filled steel cylinder controlled the leaf chamber CO2 concentration at 400 ppm. The flow rate was set to 500 μmol·m−2·s−1. The relative humidity was maintained at 55%.
2.3. Leaf Hydraulic Conductance
Healthy mangrove branches were collected before dusk; the cut ends were wrapped in wet paper towels and enclosed in black plastic bags with moist towels. The samples were then sealed and transported to the lab. Under water, each branch was re-cut and placed vertically (simulating natural growth) to submerge the petiole. The branches were wrapped in black plastic bags and rehydrated overnight to restore leaf water potential to near-saturation.
Following Xiong et al. [64], we used the evaporation flux method (EFM) to determine the mean maximum leaf hydraulic conductance (Kleaf max). During measurement, a target leaf with a 5–10 cm sheath was first cut underwater and trimmed in the target water tank. Next, the trimmed leaf was placed in darkness for 30 min to saturate. We then used the LI-6800 photosynthesis system (LI-COR Biosciences Inc., Lincoln, NE, USA) to measure the transpiration rate (E) under a PPFD of 1200 μmol·m−2·s−1 and a temperature of 28 °C, which were favorable for transpiration. The leaf was immediately placed into a sealed bag with moist paper towels in the dark for about 30 min to equilibrate. Leaf water potential (Ψleaf) was then measured using a WP4C device. Five replicates per treatment were measured. Leaf hydraulic conductance (Kleaf) was calculated using the following formula:
where = 0 for distilled water in this study.
2.4. Leaf Osmotic Pressure at the Turgor Loss Point
We collected fully rehydrated leaves (as described above) and quickly removed any remaining surface water. Using an 8 mm hole punch, we extracted a leaf disk from the area between the main vein and the leaf edge. The leaf disk was tightly wrapped in aluminum foil and rapidly frozen in liquid nitrogen (five replicates per species). During measurement, we punctured the frozen leaf disk 10–15 times with sharp tweezers to facilitate water vapor movement through the cuticle and reduce equilibrium time [65]. The disk was immediately placed into a vapor pressure osmometer (VAPRO 5600; Wescor, Logan, UT, USA) chamber. Prior to measurements, the osmometer was calibrated using three standard solutions (290, 1000, 100 mmol/kg) in sequence. Measurements were taken without opening the sample chamber until the final two readings had a deviation below 5 mmol/kg. The recorded value was the saturated osmotic potential (), and the mean of each sample was calculated and converted to MPa (1000 mmol/kg = 2.5 MPa). The turgor loss point was calculated from , using the biophysical calibration equation by [66], which was based on 30 species from different climate zones:
2.5. Carbon-Gain Optimization Model
We followed [53] in using a carbon-gain optimization model. In this model, net carbon gain is calculated by integrating the CO2 assimilation rate and trait parameters associated with photosynthesis, stomatal conductance, and leaf water relations:
where is the biochemical photosynthetic capacity of the leaf, is the CO2 compensation point without respiration, is the ambient CO2 concentration, is the light-saturated respiration rate, is the atmospheric evaporative demand, is the water potential at the petiole, is the light-saturated stomatal conductance, is leaf hydraulic conductance, is the osmotic potential at the turgor loss point, is the cost parameter for stomata, is the cost parameter for hydraulic traits, and is the cost parameter for . These parameters collectively determine both the CO2 assimilation rate and net carbon gain. Here, = 10 MPa, = 48.4 μmol mol−1, = 400μμmol mol−1, = 0.015, and = 0 MPa.
2.6. Model Validation
We used a dataset of species with known Asat, gsat, Kleaf, and πtlp values to solve for the unknown cost parameters and fit the model. Each species was treated as a unique sample, and the model was further validated using species data with only Asat, gsat, and Kleaf. In this study, the focus was solely on recording and analyzing species trait data values (such as Asat and gsat) in the context of the optimization model, with no comparisons made between groups (such as between different species or seasons). We performed the Kruskal–Wallis test and two-sided multiple comparison testing to examine the relative costs of stomatal, hydraulic, and osmotic traits between terrestrial forests and mangrove groups. Our goal was to determine whether the model explained the cross-species trends in osmotic adjustment, stomatal conductance, and leaf hydraulic conductance, as well as to estimate the relative costs of these traits. The model and terrestrial plant data were from [53].
3. Results
3.1. Relationships Among Leaf Photosynthesis, Stomata, and Hydraulic Conductance
The analysis of Asat, gsat, and Kleaf in mangroves during both the dry and rainy seasons showed strong correlations between these three parameters in both terrestrial forests and mangroves (Figure 1a–c), although there were notable differences. Compared to terrestrial forests, mangroves particularly during the dry season, had lower gsat (Figure 1a) and Kleaf (Figure 1b) as a response to drought stress, thereby reducing water loss while maintaining a certain level of CO2 assimilation. Additionally, gsat in mangroves was more sensitive to changes in Kleaf (Figure 1c), suggesting a more adaptable water regulation mechanism. The seasonal analyses also indicated that mangroves adjusted their physiological responses based on the availability of water throughout the seasons.
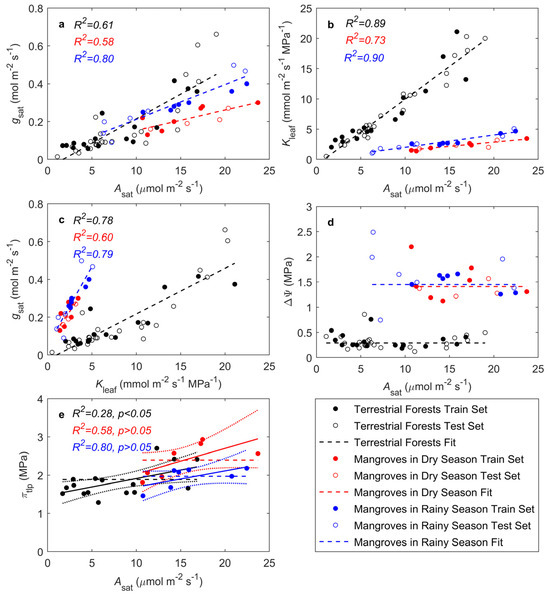
Figure 1.
Relationships of leaf photosynthetic traits with stomatal and hydraulic traits: (a) dependence of light-saturated CO2 assimilation rate (Asat) on stomatal conductance (gsat); (b) dependence of Asat on leaf hydraulic conductance (Kleaf); (c) dependence of gsat on Kleaf; (d) influence of stem-to-leaf water potential difference (ΔΨ) on Asat; (e) influence of turgor loss point osmotic potential (πtlp) on Asat. Black circles represent species with complete Asat, gsat, Kleaf, and πtlp data used for model fitting. Red circles represent species missing πtlp data. Lines represent predicted model trends. In (d), the solid line represents the linear line of best fit, and the dotted lines encompass the 95% confidence interval of the fit. Black: terrestrial forests; red: mangroves in the dry season; blue: mangroves in the rainy season (same throughout).
The results from the optimization model showed that ΔΨ is independent of Asat in both terrestrial forests and mangroves. The observed ΔΨ across species did not significantly differ from the predicted values of the model. The model predicted an optimal ΔΨ = 0.29 MPa (p = 0.27) for terrestrial forests, ΔΨ = 1.41 MPa (p = 0.52) for mangroves in the dry season, and ΔΨ = 1.45 MPa (p = 0.34) for mangroves in the rainy season (Figure 1d). The observed ΔΨ values in mangroves during the dry and rainy seasons were higher than predicted, possibly because the model did not fully consider the adaptive mechanisms of mangroves under extreme conditions. Mangroves efficiently utilize water during drought through mechanisms such as osmotic adjustment, root adaptations, and stomatal regulation, which may not be fully captured by the model. Compared to terrestrial forests, mangroves need to maintain a higher ΔΨ under high salinity or periodic water shortages in order to draw water from saline environments. In the rainy season, characterized by more variable water and salinity, ΔΨ showed relatively large variations. In contrast, during the dry season, limited water supply resulted in a more stable ΔΨ compared to the rainy season.
For terrestrial forests, πtlp showed a weak but significant correlation with Asat, (R2 = 0.28, p = 0.021), whereas πtlp in mangroves during both the dry and rainy seasons exhibited a weak but non-significant correlation with Asat (dry season: R2 = 0.37, p = 0.08; rainy season: R2 = 0.28, p = 0.13; Figure 1e). The model predicted an optimal πtlp = 1.54 MPa for terrestrial forests, πtlp = 2.39 MPa for mangroves in the dry season, and πtlp = 1.97 MPa for mangroves in the rainy season (Figure 1e). In the rainy season, increased freshwater availability brought the πtlp of mangroves closer to that of terrestrial forests.
3.2. Changes in Leaf Traits Under Atmospheric and Soil Drought
The model was used to estimate optimal Asat, gsat, Kleaf, πtlp, and ΔΨ in response to changes in Δw and Ψs, simulating adaptation to mean atmospheric dryness and leaf petiole water potential, respectively (Figure 2). The latter integrated soil dryness (salinity) and other resistances to water flow. The simulations utilized the average trait cost parameters across species, assuming a given biochemical photosynthetic capacity k. All model predictions were based on a photosynthetic capacity expected for a plant with an Asat of 15 μmol m−2 s−1 at Δw = 0.015 and Ψs = 0 MPa (Figure 2a,c). Both terrestrial forests and mangroves generally showed trends consistent with the Cowan–Farquhar model in terms of Asat and gsat, although with weaker sensitivity. Notably, mangroves were more sensitive to changes in Δw for both Asat and gsat (Figure 2a,c). Under drier atmospheric conditions, the model predicted that terrestrial forests would significantly increase Kleaf while only slightly raising ΔΨ to support higher transpiration, whereas πtlp showed minimal changes. On the other hand, mangroves displayed a substantial increase in ΔΨ with only minor changes in Kleaf and πtlp (Figure 3a,c,e).
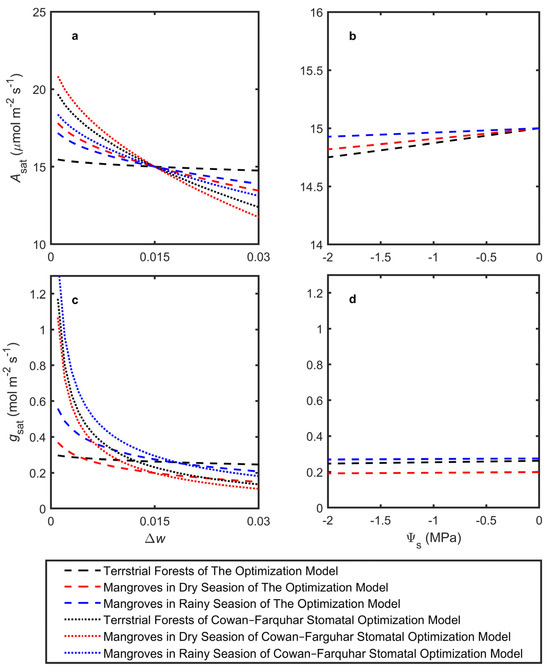
Figure 2.
Model-predicted impacts of atmospheric vapor pressure difference and source water potential on leaf-level adaptations for (a,b) light-saturated CO2 assimilation (Asat) and (c,d) stomatal conductance (gsat). All of the model predictions used a photosynthetic capacity expected for a plant with an Asat of 15 μmol m−2 s−1 at Δw = 0.015 and Ψs = 0 MPa. In (a,c), the dashed lines represent relationships predicted by the linearized Cowan–Farquhar stomatal optimization model.
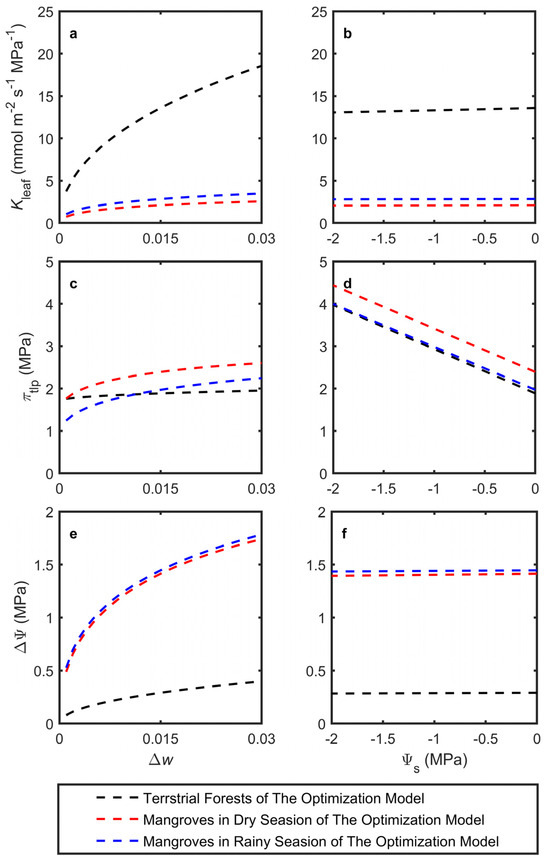
Figure 3.
Model-predicted responses of leaf traits, including (a,b) leaf hydraulic conductance (Kleaf), (c,d) turgor loss point osmotic potential (πtlp), and (e,f) stem-leaf water potential difference (ΔΨ), to (a,c,e) changes in vapor pressure difference (Δw) and (b,d,f) changes in source water potential (Ψs). All of the model predictions used the photosynthetic capacity expected for a plant with an Asat of 15 μmol m−2 s−1 at Δw = 0.015 and Ψs = 0 MPa.
3.3. Relative Cost Contributions of Key Traits
The carbon-gain optimization model provided a method to estimate the individual costs of hydraulic, stomatal, and osmotic pressure relative to the combined cost of these three traits. For terrestrial forests, leaf hydraulics were estimated to contribute 10.0 ± 1.1% of the total cost, while stomata costs made up 43.3 ± 1.2%, and osmotic pressure made up 46.7 ± 0.2%. In mangroves during the dry season, leaf hydraulics contributed 33.84 ± 4.56% of the total cost, while stomata contributed 18.00 ± 5.05%, and osmotic pressure made up 48.16 ± 0.49%. During the rainy season, mangroves showed a higher contribution from leaf hydraulics at 39.88 ± 2.74%, with stomata contributing 11.08 ± 3.00%, and osmotic pressure accounting for 49.04 ± 0.026% (Figure 4). The statistical tests, including Kruskal–Wallis and two-sided multiple comparison tests, revealed significant differences between terrestrial forests and mangroves in the allocation of costs between hydraulic and stomatal traits. However, no significant difference in cost allocation was found in osmotic traits.
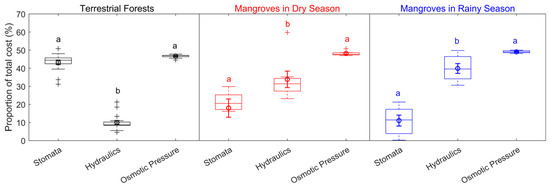
Figure 4.
Proportions of the total cost for stomatal, hydraulic, and osmotic traits. The center line represents the median, the box represents the 25th–75th percentiles, the whiskers represent non-outlier extremes, and the plus signs represent outliers. The circles show the mean values, and the error bars indicate the standard deviation. Letters indicate significantly different groups based on the Kruskal–Wallis test and two-sided multiple comparisons. (For terrestrial forests, n = 16; hydraulic vs. stomatal: p = 4.5 × 10⁻⁴; hydraulic vs. osmotic: p = 1.1 × 10⁻⁸; stomatal vs. osmotic: not significant. For mangroves in the dry season, n = 6; hydraulic vs. stomatal: not significant; hydraulic vs. osmotic: not significant; stomatal vs. osmotic: p = 6.0 × 10⁻⁴. For mangroves in the rainy season, n = 7; hydraulic vs. stomatal: p = 4.2 × 10⁻²; hydraulic vs. osmotic: not significant; stomatal vs. osmotic: p = 3.0 × 10⁻⁴).
4. Discussion
By integrating field observations with a carbon-gain optimization model, we measured and analyzed key functional traits (i.e., gsat, Kleaf, πtlp, and Asat) in mangrove leaves and investigated how mangroves optimize water-use strategies under the dual stresses of declining Ψs and rising Δw. Additionally, we systematically compared these strategies with those of terrestrial forests. Our study revealed the following key findings: (1) the differences in water-use strategies between mangroves and terrestrial forests enhance our understanding of plant ecohydrology; (2) mangroves adapt to drought and salinity stress by adjusting ΔΨ and πtlp, enabling them to survive in high VPD and high salinity environments, thereby providing new insights into plants might respond to future climate change; and (3) by highlighting the shared role of osmotic adjustment in drought tolerance, this study enriched the theoretical framework of plant water-use strategies.
4.1. Differences in Water-Use Strategies Under Drought Stress Between Mangroves and Terrestrial Forests
Our results showed that as Δw increased, mangroves significantly raised ΔΨ while keeping Kleaf relatively stable. In contrast, terrestrial forests increased Kleaf with only minor changes in ΔΨ. This pattern was consistent with previous studies, which found that under extreme conditions, drought-adapted species sharply reduced gsat while maintaining stable Kleaf [67], protecting leaves from rapid water potential declines and preventing hydraulic failure [68]. Under favorable external conditions, mangroves’ gsat can reach levels comparable to other tropical forests [69]. However, under high VPD, mangroves swiftly close their stomata [70,71,72] to minimize water loss and limit salt intake, preventing excessive dehydration and salt accumulation. Such high stomatal sensitivity enables mangroves to respond rapidly to changing VPD and optimize water-use efficiency, though it can lead to more frequent stomatal closure events. Similar to other halophytes, mangroves exhibited fast stomatal movements, which may have been an adaptive mechanism to manage salinity [73]. By regulating stomatal conductance, mangroves maintained water balance and minimized salt uptake in saline environments [74]. This response was particularly important under extreme conditions. When high temperatures and VPD increased the transpiration rate [75], increased water flux across leaves could have led to hydraulic conductivity loss [76]. To maintain water balance and sustain Asat comparable to those in tropical plants [62], mangroves accumulated osmolytes via osmotic adjustment, reducing cell Ψleaf and regulating ΔΨ. This process ensured a continuous water supply to leaves and prevented drought-induced hydraulic dysfunctions [77]. As a result, Kleaf remained relatively stable [50], allowing mangroves to sustain adequate Asat [53,78] and survive in harsh environments.
In terrestrial forests, gsat was less sensitive to VPD, leading to less frequent stomatal closure. This facilitated more stable photosynthesis under varying VPD but increased the risk of water stress under high VPD conditions. When Ψleaf was sufficient, terrestrial forests did not necessarily maintain a constant Kleaf or decrease it as E rose. Instead, they may have increased Kleaf alongside higher E to minimize changes in ΔΨ, thereby maximizing Ψleaf [43]. Additionally, ΔΨ remained relatively stable during leaf desiccation [79]. By enhancing Kleaf, terrestrial forests effectively transported limited water to support both transpiration and photosynthesis. This strategy helped maintain ΔΨ within a safe range and prevented excessive reliance on ΔΨ for water transport, preserving the integrity of the water transport system.
4.2. The Overarching Importance of Osmotic Adjustment in Drought Tolerance Across Species
Our findings showed that under the stress of declining Ψs, both mangrove and terrestrial forests exhibited more negative πtlp values. Additionally, the optimization model predicted that osmotic pressure incurred the highest cost in both forest groups. This suggested that despite biochemical differences, both groups relied on similar osmotic adjustments under drought [80]. Specifically, they maintained a more negative osmotic potential at full turgor, which allowed cells to retain a larger water content when dehydrated to the turgor loss point [34]. Such osmoregulation involves cytoplasmic adjustments [81] and cell wall reinforcement to increase rigidity [80,82]. Both mechanisms required carbon that would otherwise support growth [50,83]. While the carbon costs at the single-leaf level might have been small, their cumulative impact at the canopy scale could have been substantial [50]. Additionally, maintaining osmotic gradients between mesophyll cells and the leaf apoplast required continuous metabolic energy. Over a leaf’s lifetime, this ongoing energy demand likely contributed further to the overall carbon cost of osmoregulation [53].
4.3. Changes in the Relative Importance of Stomatal and Hydraulic Traits in Mangroves During the Dry and Rainy Seasons
Our study revealed significant differences between terrestrial forests and mangroves in the carbon investment for hydraulic and stomatal traits. These differences could be explained by construction, maintenance, and metabolic costs. In saline environments, mangroves typically had low stomatal density and small, often sunken stomata [62]. The high sensitivity of gsat to VPD enabled rapid responses that minimized water loss and salt intake, reducing the construction and maintenance costs with stomatal traits. Some studies indicated that under arid conditions, certain mangroves absorbed moisture from air, rain, dew, or fog through leaf stomata [35,40,84,85] to maintain leaf hydration [34,86] as an important water acquisition strategy [35], which may further lead to lower stomatal-related carbon costs [87].
In contrast, salt deposits and air emboli in the xylem significantly restricted mangrove Kleaf [88], limiting water transport capacity. Improving leaf water uptake capacity necessitated considerable construction costs, such as increasing vein diameter and density [89]. Furthermore, high salinity and periodic flooding demanded continuous maintenance of hydraulic system stability to prevent vessel blockage and cavitation, leading to higher maintenance costs for hydraulic traits.
Seasonal differences in mangrove trait cost allocation showed that during the rainy season—when plant growth peaks—mangroves allocated more resources to leaf development and hydraulic structures, such as vessel diameter and density, to support the rapid expansion of leaves, shoots, and roots. A higher Kleaf was essential for efficient water and nutrient transport, which sustained photosynthesis and metabolism [50]. In regions with abundant rainfall, mangroves often formed taller canopies and stored more carbon than those in arid areas [90,91]. In contrast, during the dry season, limited rainfall and higher salinity stress [40] reduced mangrove metabolism [41]. Studies on sea level rise suggested that rising salinity could further stress mangroves, making it more difficult to maintain physiological functions, especially during the dry season with reduced freshwater input [15]. This, in turn, affected their ability to sequester carbon [92].
5. Conclusions
This study explained how mangroves optimize their water-use strategies to maximize carbon gain under the dual stress of high salinity and atmospheric dryness. Unlike terrestrial forests, mangroves primarily adjust πtlp and ΔΨ, while keeping Kleaf relatively stable. This unique trait allocation and water management mechanism enabled mangroves to maintain high carbon gain and physiological function in extreme environments. It highlighted their specialized adaptations to high salinity and high VPD. Understanding these mechanisms is important for developing carbon trading policies and green economic strategies, as mangroves play a significant role in the global carbon cycle and serve as vital carbon sinks with significant ecological value.
For policymakers and conservationists, these findings emphasized the importance of protecting mangrove ecosystems, particularly in areas at risk of sea level rise and increased salinity. Supporting mangrove resilience not only helps preserve local biodiversity but also contributes to global climate mitigation efforts. Policymakers should prioritize mangrove habitat conservation and integrate their unique water-use strategies into environmental management frameworks.
However, the carbon gain model had limitations. It did not fully account for trait adaptability under extreme conditions, the variation in trait costs among different species, or the lack of independent dataset validation. Future research could focus on including spatial variability across different salinity gradients and climate conditions in mangrove ecosystems to gain a deeper understanding of their carbon sequestration potential. Expanding the model to include other species would also provide valuable insights into water-use strategies across plant groups, enhancing our ability to predict and manage carbon storage in the context of climate change.
Author Contributions
Conceptualization, L.D. and R.Y.; formal analysis, Y.W., M.G., H.X. and B.Z.; funding acquisition, L.D.; methodology, F.A.; project administration, R.Y.; supervision, R.Y.; writing—original draft, X.L.; writing—review and editing, R.Y. All authors have read and agreed to the published version of the manuscript.
Funding
This work was supported by the Hainan Provincial Natural Science Foundation of China (Project No. 423QN320) and the Youth Innovation Fund of Hainan Research Academy of Environmental Sciences (Project No. QNCX2021013).
Data Availability Statement
Data are contained within the article.
Conflicts of Interest
The authors declare no conflicts of interest.
References
- Alongi, D.M. Mangrove Forests: Resilience, Protection from Tsunamis, and Responses to Global Climate Change. Estuar. Coast. Shelf Sci. 2008, 76, 1–13. [Google Scholar] [CrossRef]
- Muller, E.; Lambs, L.; Fromard, F. Variations in Water Use by a Mature Mangrove of Avicennia Germinans, French Guiana. Ann. For. Sci. 2009, 66, 803. [Google Scholar] [CrossRef][Green Version]
- Alongi, D.M. Carbon Cycling and Storage in Mangrove Forests. Annu. Rev. Mar. Sci. 2014, 6, 195–219. [Google Scholar] [CrossRef] [PubMed]
- Das, S.C.; Pullaiah, T.; Ashton, E.C. (Eds.) Mangroves: Biodiversity, Livelihoods and Conservation; Springer Nature: Singapore, 2022; ISBN 978-981-19051-8-6. [Google Scholar]
- Cai, R.; Ding, R.; Yan, X.; Li, C.; Sun, J.; Tan, H.; Men, W.; Guo, H.; Wang, C. Adaptive Response of Dongzhaigang Mangrove in China to Future Sea Level Rise. Sci. Rep. 2022, 12, 11495. [Google Scholar] [CrossRef] [PubMed]
- Wei, S.; Zhang, H.; Xu, Z.; Lin, G.; Lin, Y.; Liang, X.; Ling, J.; Wee, A.K.S.; Lin, H.; Zhou, Y.; et al. Coastal Urbanization May Indirectly Positively Impact Growth of Mangrove Forests. Commun. Earth Environ. 2024, 5, 608. [Google Scholar] [CrossRef]
- Das, S.K.; Patra, J.K.; Thatoi, H. Antioxidative Response to Abiotic and Biotic Stresses in Mangrove Plants: A Review. Int. Rev. Hydrobiol. 2016, 101, 3–19. [Google Scholar] [CrossRef]
- Qie, Y.-D.; Zhang, Q.-W.; McAdam, S.A.M.; Cao, K.-F. Stomatal Dynamics Are Regulated by Leaf Hydraulic Traits and Guard Cell Anatomy in Nine True Mangrove Species. Plant Divers. 2024, 46, 395–405. [Google Scholar] [CrossRef]
- Bardou, R.; Pullen, J.; Cavanaugh, K.C.; Parker, J.D. Effects of Cold Water and Aridity on Baja California Mangrove Survival and Ecophysiological Traits. J. Ecol. 2024, 112, 985–997. [Google Scholar] [CrossRef]
- Reef, R.; Lovelock, C.E. Regulation of Water Balance in Mangroves. Ann. Bot. 2015, 115, 385–395. [Google Scholar] [CrossRef] [PubMed]
- Ball, M.C. Ecophysiology of Mangroves. Trees 1988, 2, 129–142. [Google Scholar] [CrossRef]
- Lovelock, C.E.; Krauss, K.W.; Osland, M.J.; Reef, R.; Ball, M.C. The physiology of mangrove trees with changing climate. In Tropical Tree Physiology; Goldstein, G., Santiago, L., Eds.; Springer: Cham, Switzerland, 2016; Volume 6. [Google Scholar] [CrossRef]
- McAdam, S.A.M.; Brodribb, T.J. The Evolution of Mechanisms Driving the Stomatal Response to Vapor Pressure Deficit. Plant Physiol. 2015, 167, 833–843. [Google Scholar] [CrossRef] [PubMed]
- Krauss, K.W.; Lovelock, C.E.; Chen, L.; Berger, U.; Ball, M.C.; Reef, R.; Peters, R.; Bowen, H.; Vovides, A.G.; Ward, E.J.; et al. Mangroves Provide Blue Carbon Ecological Value at a Low Freshwater Cost. Sci. Rep. 2022, 12, 17636. [Google Scholar] [CrossRef] [PubMed]
- Carruthers, L.; Ersek, V.; Maher, D.; Sanders, C.; Tait, D.; Soares, J.; Floyd, M.; Hashim, A.S.; Helber, S.; Garnett, M.; et al. Sea-Level Rise and Extreme Indian Ocean Dipole Explain Mangrove Dieback in the Maldives. Sci. Rep. 2024, 14, 27012. [Google Scholar] [CrossRef] [PubMed]
- Bourgeois, C.F.; MacKenzie, R.A.; Sharma, S.; Bhomia, R.K.; Johnson, N.G.; Rovai, A.S.; Worthington, T.A.; Krauss, K.W.; Analuddin, K.; Bukoski, J.J.; et al. Four Decades of Data Indicate That Planted Mangroves Stored up to 75% of the Carbon Stocks Found in Intact Mature Stands. Sci. Adv. 2024, 10, eadk5430. [Google Scholar] [CrossRef] [PubMed]
- Cui, X.; Liang, J.; Lu, W.; Chen, H.; Liu, F.; Lin, G.; Xu, F.; Luo, Y.; Lin, G. Stronger Ecosystem Carbon Sequestration Potential of Mangrove Wetlands with Respect to Terrestrial Forests in Subtropical China. Agric. For. Meteorol. 2018, 249, 71–80. [Google Scholar] [CrossRef]
- Zhang, Z.; Luo, X.; Friess, D.A.; Wang, S.; Li, Y.; Li, Y. Stronger Increases but Greater Variability in Global Mangrove Productivity Compared to That of Adjacent Terrestrial Forests. Nat. Ecol. Evol. 2024, 8, 239–250. [Google Scholar] [CrossRef]
- Sun, Z.; An, Y.; Kong, J.; Zhao, J.; Cui, W.; Nie, T.; Zhang, T.; Liu, W.; Wu, L. Exploring the Spatio-Temporal Patterns of Global Mangrove Gross Primary Production and Quantifying the Factors Affecting Its Estimation, 1996–2020. Sci. Total Environ. 2024, 908, 168262. [Google Scholar] [CrossRef] [PubMed]
- Cerqueira, J.V.A.; Silveira, J.A.G.; Carvalho, F.E.L.; Cunha, J.R.; Lima Neto, M.C. The Regulation of P700 Is an Important Photoprotective Mechanism to NaCl-salinity in Jatropha curcas. Physiol. Plant. 2019, 167, 404–417. [Google Scholar] [CrossRef] [PubMed]
- Grossiord, C.; Buckley, T.N.; Cernusak, L.A.; Novick, K.A.; Poulter, B.; Siegwolf, R.T.W.; Sperry, J.S.; McDowell, N.G. Plant Responses to Rising Vapor Pressure Deficit. New Phytol. 2020, 226, 1550–1566. [Google Scholar] [CrossRef] [PubMed]
- Silva, B.P.; Saballo, H.M.; Lobo, A.K.M.; Neto, M.C.L. The Plasticity of the Photosynthetic Apparatus and Antioxidant Responses Are Critical for the Dispersion of Rhizophora Mangle along a Salinity Gradient. Aquat. Bot. 2023, 185, 103609. [Google Scholar] [CrossRef]
- Sulman, B.N.; Roman, D.T.; Yi, K.; Wang, L.; Phillips, R.P.; Novick, K.A. High Atmospheric Demand for Water Can Limit Forest Carbon Uptake and Transpiration as Severely as Dry Soil. Geophys. Res. Lett. 2016, 43, 9686–9695. [Google Scholar] [CrossRef]
- Zhu, X.; Qin, Z.; Song, L. How Land-Sea Interaction of Tidal and Sea Breeze Activity Affect Mangrove Net Ecosystem Exchange? J. Geophys. Res. Atmos. 2021, 126, e2020JD034047. [Google Scholar] [CrossRef]
- Cai, G.; Wankmüller, F.; Ahmed, M.A.; Carminati, A. How the Interactions between Atmospheric and Soil Drought Affect the Functionality of Plant Hydraulics. Plant Cell Environ. 2023, 46, 733–735. [Google Scholar] [CrossRef]
- Gou, R.; Chi, J.; Liu, J.; Luo, Y.; Shekhar, A.; Mo, L.; Lin, G. Atmospheric Water Demand Constrains Net Ecosystem Production in Subtropical Mangrove Forests. J. Hydrol. 2024, 630, 130651. [Google Scholar] [CrossRef]
- Diao, H.; Cernusak, L.A.; Saurer, M.; Gessler, A.; Siegwolf, R.T.W.; Lehmann, M.M. Dry inside: Progressive Unsaturation within Leaves with Increasing Vapour Pressure Deficit Affects Estimation of Key Leaf Gas Exchange Parameters. New Phytol. 2024, 244, 1275–1287. [Google Scholar] [CrossRef] [PubMed]
- Cabon, A.; Fernández-de-Uña, L.; Gea-Izquierdo, G.; Meinzer, F.C.; Woodruff, D.R.; Martínez-Vilalta, J.; De Cáceres, M. Water Potential Control of Turgor-driven Tracheid Enlargement in Scots Pine at Its Xeric Distribution Edge. New Phytol. 2020, 225, 209–221. [Google Scholar] [CrossRef] [PubMed]
- Peters, R.L.; Steppe, K.; Cuny, H.E.; De Pauw, D.J.W.; Frank, D.C.; Schaub, M.; Rathgeber, C.B.K.; Cabon, A.; Fonti, P. Turgor—A Limiting Factor for Radial Growth in Mature Conifers along an Elevational Gradient. New Phytol. 2021, 229, 213–229. [Google Scholar] [CrossRef] [PubMed]
- Esteban, R.; Fernández-Marín, B.; Hernandez, A.; Jiménez, E.T.; León, A.; García-Mauriño, S.; Silva, C.D.; Dolmus, J.R.; Dolmus, C.M.; Molina, M.J.; et al. Salt Crystal Deposition as a Reversible Mechanism to Enhance Photoprotection in Black Mangrove. Trees 2013, 27, 229–237. [Google Scholar] [CrossRef]
- Méndez-Alonzo, R.; López-Portillo, J.; Moctezuma, C.; Bartlett, M.K.; Sack, L. Osmotic and Hydraulic Adjustment of Mangrove Saplings to Extreme Salinity. Tree Physiol. 2016, 36, 1562–1572. [Google Scholar] [CrossRef]
- Spicer, R. Symplasmic Networks in Secondary Vascular Tissues: Parenchyma Distribution and Activity Supporting Long-Distance Transport. J. Exp. Bot. 2014, 65, 1829–1848. [Google Scholar] [CrossRef]
- Pfautsch, S.; Renard, J.; Tjoelker, M.G.; Salih, A. Phloem as Capacitor: Radial Transfer of Water into Xylem of Tree Stems Occurs via Symplastic Transport in Ray Parenchyma. Plant Physiol. 2015, 167, 963–971. [Google Scholar] [CrossRef]
- Nguyen, H.T.; Meir, P.; Sack, L.; Evans, J.R.; Oliveira, R.S.; Ball, M.C. Leaf Water Storage Increases with Salinity and Aridity in the Mangrove Avicennia Marina: Integration of Leaf Structure, Osmotic Adjustment and Access to Multiple Water Sources. Plant Cell Environ. 2017, 40, 1576–1591. [Google Scholar] [CrossRef] [PubMed]
- Hayes, M.A.; Chapman, S.; Jesse, A.; O’Brien, E.; Langley, J.A.; Bardou, R.; Devaney, J.; Parker, J.D.; Cavanaugh, K.C. Foliar Water Uptake by Coastal Wetland Plants: A Novel Water Acquisition Mechanism in Arid and Humid Subtropical Mangroves. J. Ecol. 2020, 108, 2625–2637. [Google Scholar] [CrossRef]
- Bryant, C.; Fuenzalida, T.I.; Zavafer, A.; Nguyen, H.T.; Brothers, N.; Harris, R.J.; Beckett, H.A.A.; Holmlund, H.I.; Binks, O.; Ball, M.C. Foliar Water Uptake via Cork Warts in Mangroves of the Sonneratia Genus. Plant Cell Environ. 2021, 44, 2925–2937. [Google Scholar] [CrossRef]
- Potkay, A.; Hölttä, T.; Trugman, A.T.; Fan, Y. Turgor-Limited Predictions of Tree Growth, Height and Metabolic Scaling over Tree Lifespans. Tree Physiol. 2022, 42, 229–252. [Google Scholar] [CrossRef]
- Komiyama, A.; Poungparn, S.; Umnouysin, S.; Rodtassana, C.; Pravinvongvuthi, T.; Noda, T.; Kato, S. Occurrence of Seasonal Water Replacement in Mangrove Soil and the Trunk Growth Response of Avicennia alba Related to Salinity Changes in a Tropical Monsoon Climate. Ecol. Res. 2019, 34, 428–439. [Google Scholar] [CrossRef]
- Komiyama, A.; Poungparn, S.; Umnouysin, S.; Rodtassana, C.; Kato, S.; Pravinvongvuthi, T.; Sangtiean, T. Daily Inundation Induced Seasonal Variation in the Vertical Distribution of Soil Water Salinity in an Estuarine Mangrove Forest under a Tropical Monsoon Climate. Ecol. Res. 2020, 35, 638–649. [Google Scholar] [CrossRef]
- Zhu, X.; Sun, C.; Qin, Z. Drought-Induced Salinity Enhancement Weakens Mangrove Greenhouse Gas Cycling. J. Geophys. Res. Biogeosciences 2021, 126, e2021JG006416. [Google Scholar] [CrossRef]
- Wang, X.; Zhu, X. Salinity Stress and Atmospheric Dryness Co-Limit Evapotranspiration in a Subtropical Monsoonal Estuarine Mangrove Wetland. Environ. Res. Lett. 2024, 19, 114067. [Google Scholar] [CrossRef]
- Poorter, L.; Bongers, F. Leaf Traits Are Good Predictors of Plant Performance Across 53 Rain Forest Species. Ecology 2006, 87, 1733–1743. [Google Scholar] [CrossRef] [PubMed]
- Simonin, K.A.; Burns, E.; Choat, B.; Barbour, M.M.; Dawson, T.E.; Franks, P.J. Increasing Leaf Hydraulic Conductance with Transpiration Rate Minimizes the Water Potential Drawdown from Stem to Leaf. J. Exp. Bot. 2015, 66, 1303–1315. [Google Scholar] [CrossRef] [PubMed]
- Xiong, D.; Nadal, M. Linking Water Relations and Hydraulics with Photosynthesis. Plant J. 2020, 101, 800–815. [Google Scholar] [CrossRef]
- Bartlett, M.K.; Zhang, Y.; Kreidler, N.; Sun, S.; Ardy, R.; Cao, K.; Sack, L. Global Analysis of Plasticity in Turgor Loss Point, a Key Drought Tolerance Trait. Ecol. Lett. 2014, 17, 1580–1590. [Google Scholar] [CrossRef] [PubMed]
- Kunert, N.; Zailaa, J.; Herrmann, V.; Muller-Landau, H.C.; Wright, S.J.; Pérez, R.; McMahon, S.M.; Condit, R.C.; Hubbell, S.P.; Sack, L.; et al. Leaf Turgor Loss Point Shapes Local and Regional Distributions of Evergreen but Not Deciduous Tropical Trees. New Phytol. 2021, 230, 485–496. [Google Scholar] [CrossRef]
- Vargas, G.G.; Kunert, N.; Hammond, W.M.; Berry, Z.C.; Werden, L.K.; Smith-Martin, C.M.; Wolfe, B.T.; Toro, L.; Mondragón-Botero, A.; Pinto-Ledezma, J.N.; et al. Leaf Habit Affects the Distribution of Drought Sensitivity but Not Water Transport Efficiency in the Tropics. Ecol. Lett. 2022, 25, 2637–2650. [Google Scholar] [CrossRef] [PubMed]
- Maréchaux, I.; Bartlett, M.K.; Sack, L.; Baraloto, C.; Engel, J.; Joetzjer, E.; Chave, J. Drought Tolerance as Predicted by Leaf Water Potential at Turgor Loss Point Varies Strongly across Species within an Amazonian Forest. Funct. Ecol. 2015, 29, 1268–1277. [Google Scholar] [CrossRef]
- Zhu, S.-D.; Chen, Y.-J.; Ye, Q.; He, P.-C.; Liu, H.; Li, R.-H.; Fu, P.-L.; Jiang, G.-F.; Cao, K.-F. Leaf Turgor Loss Point Is Correlated with Drought Tolerance and Leaf Carbon Economics Traits. Tree Physiol. 2018, 38, 658–663. [Google Scholar] [CrossRef] [PubMed]
- Beckett, H.A.A.; Neeman, T.; Fuenzalida, T.I.; Bryant, C.; Latorre, S.C.; Ovington, L.I.; Sack, L.; Meir, P.; Ball, M.C. Ghosts of Dry Seasons Past: Legacy of Severe Drought Enhances Mangrove Salinity Tolerance through Coordinated Cellular Osmotic and Elastic Adjustments. Plant Cell Environ. 2023, 46, 2031–2045. [Google Scholar] [CrossRef] [PubMed]
- Jin, Y.; Wang, C.; Zhou, Z.; Li, Z. Co-Ordinated Performance of Leaf Hydraulics and Economics in 10 Chinese Temperate Tree Species. Funct. Plant Biol. 2016, 43, 1082. [Google Scholar] [CrossRef] [PubMed]
- Tang, M.; Zhao, W.; Xing, M.; Zhao, J.; Jiang, Z.; You, J.; Ni, B.; Ni, Y.; Liu, C.; Li, J.; et al. Resource Allocation Strategies among Vegetative Growth, Sexual Reproduction, Asexual Reproduction and Defense during Growing Season of Aconitum kusnezoffii Reichb. Plant J. 2021, 105, 957–977. [Google Scholar] [CrossRef] [PubMed]
- Deans, R.M.; Brodribb, T.J.; Busch, F.A.; Farquhar, G.D. Optimization Can Provide the Fundamental Link between Leaf Photosynthesis, Gas Exchange and Water Relations. Nat. Plants 2020, 6, 1116–1125. [Google Scholar] [CrossRef] [PubMed]
- Franklin, O.; Harrison, S.P.; Dewar, R.; Farrior, C.E.; Brännström, Å.; Dieckmann, U.; Pietsch, S.; Falster, D.; Cramer, W.; Loreau, M.; et al. Organizing Principles for Vegetation Dynamics. Nat. Plants 2020, 6, 444–453. [Google Scholar] [CrossRef] [PubMed]
- Cowan, I.R.; Farquhar, G.D. Stomatal Function in Relation to Leaf Metabolism and Environment: Stomatal Function in the Regulation of Gas Exchange. Symp. Soc. Exp. Biol. 1977, 31, 471–505. [Google Scholar] [PubMed]
- Farquhar, G.D.; Von Caemmerer, S.; Berry, J.A. A Biochemical Model of Photosynthetic CO2 Assimilation in Leaves of C3 Species. Planta 1980, 149, 78–90. [Google Scholar] [CrossRef] [PubMed]
- Wang, H.; Prentice, I.C.; Cornwell, W.; Keenan, T.; Davis, T.; Wright, I.; Evans, B.; Peng, C. A Universal Model for Carbon Dioxide Uptake by Plants. bioRxiv 2016. [CrossRef] [PubMed]
- Ali, A.A.; Xu, C.; Rogers, A.; Fisher, R.A.; Wullschleger, S.D.; Massoud, E.C.; Vrugt, J.A.; Muss, J.D.; McDowell, N.G.; Fisher, J.B.; et al. A Global Scale Mechanistic Model of Photosynthetic Capacity (LUNA V1.0). Geosci. Model Dev. 2016, 9, 587–606. [Google Scholar] [CrossRef]
- Xia, X.; Pan, Y.; Chang, M.; Wu, D.; Zhang, X.; Xia, J.; Song, K. Consistent Temperature-Dependent Patterns of Leaf Lifespan across Spatial and Temporal Gradients for Deciduous Trees in Europe. Sci. Total Environ. 2022, 820, 153175. [Google Scholar] [CrossRef] [PubMed]
- Wang, H.; Prentice, I.C.; Keenan, T.F.; Davis, T.W.; Wright, I.J.; Cornwell, W.K.; Evans, B.J.; Peng, C. Towards a universal model for carbon dioxide uptake by plants. Nat. Plants 2017, 3, 734–741. [Google Scholar] [CrossRef] [PubMed]
- Tian, S.Q.; Zhu, S.D.; Zhu, J.J.; Shen, Z.H.; Cao, K.F. Impact of leaf morphological and anatomical traits on mesophyll conductance and leaf hydraulic conductance in mangrove plants. Plant Sci. 2016, 34, 909–919. [Google Scholar] [CrossRef]
- Si, H.T.; Yu, T.H.; Guan, X.Y.; Jiang, G.F.; Cao, K.F. Stomatal responses to environmental factors and its coordination with hydraulic functions in plants of mangrove forests. Plant Physiol. 2017, 53, 487–496. [Google Scholar] [CrossRef]
- Jiang, G.-F.; Goodale, U.M.; Liu, Y.-Y.; Hao, G.-Y.; Cao, K.-F. Salt Management Strategy Defines the Stem and Leaf Hydraulic Characteristics of Six Mangrove Tree Species. Tree Physiol. 2017, 37, 389–401. [Google Scholar] [CrossRef] [PubMed]
- Xiong, D.; Flexas, J.; Yu, T.; Peng, S.; Huang, J. Leaf Anatomy Mediates Coordination of Leaf Hydraulic Conductance and Mesophyll Conductance to CO2 in Oryza. New Phytol. 2017, 213, 572–583. [Google Scholar] [CrossRef] [PubMed]
- Kikuta, S.B.; Richter, H. Leaf Discs or Press Saps? A Comparison of Techniques for the Determination of Osmotic Potentials in Freeze-Thawed Leaf Material. J. Exp. Bot. 1992, 43, 1039–1044. [Google Scholar] [CrossRef]
- Bartlett, M.K.; Scoffoni, C.; Sack, L. The Determinants of Leaf Turgor Loss Point and Prediction of Drought Tolerance of Species and Biomes: A Global Meta-Analysis: Drivers of Plant Drought Tolerance. Ecol. Lett. 2012, 15, 393–405. [Google Scholar] [CrossRef] [PubMed]
- Jin, Y.; Hao, G.; Hammond, W.M.; Yu, K.; Liu, X.; Ye, Q.; Zhou, Z.; Wang, C. Aridity-dependent Sequence of Water Potentials for Stomatal Closure and Hydraulic Dysfunctions in Woody Plants. Glob. Change Biol. 2023, 29, 2030–2040. [Google Scholar] [CrossRef]
- Torres-Ruiz, J.M.; Cochard, H.; Delzon, S.; Boivin, T.; Burlett, R.; Cailleret, M.; Corso, D.; Delmas, C.E.L.; De Caceres, M.; Diaz-Espejo, A.; et al. Plant Hydraulics at the Heart of Plant, Crops and Ecosystem Functions in the Face of Climate Change. New Phytol. 2024, 241, 984–999. [Google Scholar] [CrossRef] [PubMed]
- Leng, B.; Cao, K.-F. The Sap Flow of Six Tree Species and Stand Water Use of a Mangrove Forest in Hainan, China. Glob. Ecol. Conserv. 2020, 24, e01233. [Google Scholar] [CrossRef]
- Liu, J.; Lai, D.Y.F. Subtropical Mangrove Wetland Is a Stronger Carbon Dioxide Sink in the Dry than Wet Seasons. Agric. For. Meteorol. 2019, 278, 107644. [Google Scholar] [CrossRef]
- Granados-Martínez, K.P.; Yépez, E.A.; Sánchez-Mejía, Z.M.; Gutiérrez-Jurado, H.A.; Méndez-Barroso, L.A. Environmental Controls on the Temporal Evolution of Energy and CO2 Fluxes on an Arid Mangrove of Northwestern Mexico. J. Geophys. Res. Biogeosci. 2021, 126, e2020JG005932. [Google Scholar] [CrossRef]
- Gnanamoorthy, P.; Selvam, V.; Deb Burman, P.K.; Chakraborty, S.; Karipot, A.; Nagarajan, R.; Ramasubramanian, R.; Song, Q.; Zhang, Y.; Grace, J. Seasonal Variations of Net Ecosystem (CO2) Exchange in the Indian Tropical Mangrove Forest of Pichavaram. Estuar. Coast. Shelf Sci. 2020, 243, 106828. [Google Scholar] [CrossRef]
- Kübarsepp, L.; Laanisto, L.; Niinemets, Ü.; Talts, E.; Tosens, T. Are Stomata in Ferns and Allies Sluggish? Stomatal Responses to CO2, Humidity and Light and Their Scaling with Size and Density. New Phytol. 2020, 225, 183–195. [Google Scholar] [CrossRef] [PubMed]
- Rasouli, F.; Kiani-Pouya, A.; Tahir, A.; Shabala, L.; Chen, Z.; Shabala, S. A Comparative Analysis of Stomatal Traits and Photosynthetic Responses in Closely Related Halophytic and Glycophytic Species under Saline Conditions. Environ. Exp. Bot. 2021, 181, 104300. [Google Scholar] [CrossRef]
- Venturas, M.D.; Sperry, J.S.; Love, D.M.; Frehner, E.H.; Allred, M.G.; Wang, Y.; Anderegg, W.R.L. A Stomatal Control Model Based on Optimization of Carbon Gain versus Hydraulic Risk Predicts Aspen Sapling Responses to Drought. New Phytol. 2018, 220, 836–850. [Google Scholar] [CrossRef] [PubMed]
- Schönbeck, L.C.; Schuler, P.; Lehmann, M.M.; Mas, E.; Mekarni, L.; Pivovaroff, A.L.; Turberg, P.; Grossiord, C. Increasing Temperature and Vapour Pressure Deficit Lead to Hydraulic Damages in the Absence of Soil Drought. Plant Cell Environ. 2022, 45, 3275–3289. [Google Scholar] [CrossRef] [PubMed]
- Choat, B.; Brodribb, T.J.; Brodersen, C.R.; Duursma, R.A.; López, R.; Medlyn, B.E. Triggers of Tree Mortality under Drought. Nature 2018, 558, 531–539. [Google Scholar] [CrossRef]
- Blum, A. Osmotic Adjustment Is a Prime Drought Stress Adaptive Engine in Support of Plant Production. Plant Cell Environ. 2017, 40, 4–10. [Google Scholar] [CrossRef]
- Simonin, K.A.; Limm, E.B.; Dawson, T.E. Hydraulic Conductance of Leaves Correlates with Leaf Lifespan: Implications for Lifetime Carbon Gain. New Phytol. 2012, 193, 939–947. [Google Scholar] [CrossRef] [PubMed]
- Bartlett, M.K.; Scoffoni, C.; Ardy, R.; Zhang, Y.; Sun, S.; Cao, K.; Sack, L. Rapid Determination of Comparative Drought Tolerance Traits: Using an Osmometer to Predict Turgor Loss Point: Rapid Assessment of Leaf Drought Tolerance. Methods Ecol. Evol. 2012, 3, 880–888. [Google Scholar] [CrossRef]
- Flowers, T.J.; Colmer, T.D. Salinity Tolerance in Halophytes. New Phytol. 2008, 179, 945–963. [Google Scholar] [CrossRef] [PubMed]
- Perera-Castro, A.V.; Nadal, M.; Flexas, J. What Drives Photosynthesis during Desiccation? Mosses and Other Outliers from the Photosynthesis–Elasticity Trade-Off. J. Exp. Bot. 2020, 71, 6460–6470. [Google Scholar] [CrossRef] [PubMed]
- Munns, R.; Gilliham, M. Salinity Tolerance of Crops—What Is the Cost? New Phytol. 2015, 208, 668–673. [Google Scholar] [CrossRef]
- Li, S.; Xiao, H.; Zhao, L.; Zhou, M.-X.; Wang, F. Foliar Water Uptake of Tamarix Ramosissima from an Atmosphere of High Humidity. Sci. World J. 2014, 2014, 529308. [Google Scholar] [CrossRef]
- Yan, X.; Zhou, M.; Dong, X.; Zou, S.; Xiao, H.; Ma, X.-F. Molecular Mechanisms of Foliar Water Uptake in a Desert Tree. AoB Plants 2015, 7, plv129. [Google Scholar] [CrossRef] [PubMed]
- Hilty, J.; Pook, C.; Leuzinger, S. Water Relations Determine Short Time Leaf Growth Patterns in the Mangrove Avicennia marina (Forssk.) Vierh. Plant Cell Environ. 2019, 42, 527–535. [Google Scholar] [CrossRef] [PubMed]
- Lechthaler, S.; Robert, E.M.R.; Tonné, N.; Prusova, A.; Gerkema, E.; Van As, H.; Koedam, N.; Windt, C.W. Rhizophoraceae Mangrove Saplings Use Hypocotyl and Leaf Water Storage Capacity to Cope with Soil Water Salinity Changes. Front. Plant Sci. 2016, 7, 895. [Google Scholar] [CrossRef]
- Cao, H.; Ding, R.; Kang, S.; Du, T.; Tong, L.; Zhang, Y.; Chen, J.; Shukla, M.K. Drought, Salt, and Combined Stresses in Plants: Effects, Tolerance Mechanisms, and Strategies. In Advances in Agronomy; Elsevier: Amsterdam, The Netherlands, 2023; Volume 178, pp. 107–163. ISBN 978-0-443-19260-9. [Google Scholar]
- Schneider, J.V.; Habersetzer, J.; Rabenstein, R.; Wesenberg, J.; Wesche, K.; Zizka, G. Water Supply and Demand Remain Coordinated during Breakdown of the Global Scaling Relationship between Leaf Size and Major Vein Density. New Phytol. 2017, 214, 473–486. [Google Scholar] [CrossRef]
- Sanders, C.J.; Maher, D.T.; Tait, D.R.; Williams, D.; Holloway, C.; Sippo, J.Z.; Santos, I.R. Are Global Mangrove Carbon Stocks Driven by Rainfall? J. Geophys. Res. Biogeosci. 2016, 121, 2600–2609. [Google Scholar] [CrossRef]
- Simard, M.; Fatoyinbo, L.; Smetanka, C.; Rivera-Monroy, V.H.; Castañeda-Moya, E.; Thomas, N.; Van Der Stocken, T. Mangrove Canopy Height Globally Related to Precipitation, Temperature and Cyclone Frequency. Nat. Geosci. 2019, 12, 40–45. [Google Scholar] [CrossRef]
- Saintilan, N.; Horton, B.; Törnqvist, T.E.; Ashe, E.L.; Khan, N.S.; Schuerch, M.; Perry, C.; Kopp, R.E.; Garner, G.G.; Murray, N.; et al. Widespread Retreat of Coastal Habitat Is Likely at Warming Levels above 1.5 °C. Nature 2023, 621, 112–119. [Google Scholar] [CrossRef] [PubMed]


Disclaimer/Publisher’s Note: The statements, opinions and data contained in all publications are solely those of the individual author(s) and contributor(s) and not of MDPI and/or the editor(s). MDPI and/or the editor(s) disclaim responsibility for any injury to people or property resulting from any ideas, methods, instructions or products referred to in the content. |
© 2025 by the authors. Licensee MDPI, Basel, Switzerland. This article is an open access article distributed under the terms and conditions of the Creative Commons Attribution (CC BY) license (https://creativecommons.org/licenses/by/4.0/).