Article

Assessing Above-Ground Biomass Dynamics and Carbon Sequestration Potential Using Machine Learning and Spaceborne LiDAR in Hilly Conifer Forests of Mansehra District, Pakistan

by
Muhammad Imran
1,
Guanhua Zhou
2,*,
Guifei Jing
3,
Chongbin Xu
4,
Yumin Tan
1,3,
Rana Ahmad Faraz Ishaq
2,3,
Muhammad Kamran Lodhi
1,3,
Maimoona Yasinzai
5,
Ubaid Akbar
3 and
Anwar Ali
6
1
School of Transportation Science and Engineering, Beihang University, Beijing 100191, China
2
School of Instrumentation and Optoelectronic Engineering, Beihang University, Beijing 100191, China
3
Hangzhou International Innovation Institute, Beihang University, Hangzhou 311115, China
4
Beijing Institute of Space Mechanics & Electricity, Beijing 100094, China
5
Department of Environmental Science, International Islamic University, Islamabad 04436, Pakistan
6
Pakistan Forest Institute, Peshawar 25130, Pakistan
*
Author to whom correspondence should be addressed.
Forests 2025, 16(2), 330; https://doi.org/10.3390/f16020330
Submission received: 9 January 2025 / Revised: 1 February 2025 / Accepted: 11 February 2025 / Published: 13 February 2025
(This article belongs to the Special Issue Modeling Aboveground Forest Biomass: New Developments)

Abstract

:
Consistent and accurate data on forest biomass and carbon dynamics are essential for optimizing carbon sequestration, advancing sustainable management, and developing natural climate solutions in various forest ecosystems. This study quantifies the forest biomass in designated forests based on GEDI LiDAR datasets with a unique compartment-level monitoring of unexplored hilly areas of Mansehra. The integration of multisource explanatory variables, employing machine learning models, adds further innovation to the study of reliable above ground biomass (AGB) estimation. Integrating Landsat-9 vegetation indices with ancillary datasets improved forest biomass estimation, with the random forest algorithm yielding the best performance (R2 = 0.86, RMSE = 28.03 Mg/ha, and MAE = 19.54 Mg/ha). Validation with field data on a point-to-point basis estimated a mean above-ground biomass (AGB) of 224.61 Mg/ha, closely aligning with the mean ground measurement of 208.13 Mg/ha (R2 = 0.71). The overall mean AGB model estimated a forest biomass of 189.42 Mg/ha in the designated moist temperate forests of the study area. A critical deficit in the carbon sequestration potential was analysed, with the estimated AGB in 2022, at 19.94 thousand tons, with a deficit of 0.83 thousand tons to nullify CO2 emissions (20.77 thousand tons). This study proposes improved AGB estimation reliability and offers insights into the CO2 sequestration potential, suggesting a policy shift for sustainable decision-making and climate change mitigation policies.

1. Introduction

Climate model projections indicate a temperature increase ranging from 1.92 °C to 5.2 °C by the late 21st century, depending on CO2 and other greenhouse gases (GHGs) [1]. These alarming trends underscore the need for prompt policy interventions to mitigate the risks associated with climate change. Ecosystem services of forests are pivotal in curbing the progression of climate change, particularly by sequestering CO2 emissions. Global CO2 emissions annually increase by 0.1%, reaching 35.8 Gt in 2023, further contributing to global warming [2]. This highlights the need for a holistic understanding that combines biological, ecological, and social knowledge. Such an integrated approach bridges forest ecology and management, supporting the sustainable preservation of biomass and ecosystem services. Moreover, biomass estimation is also vital to monitor progress and targets under SDG-15 (Life on Land) and the REDD+ program to ensure sustainable forest management, biodiversity preservation, and ecosystem health [3,4].
AGB is a critical parameter for assessing forest ecosystems, as it effectively encapsulates indicators, such as forest area change, net forest change, and management practices. Moreover, AGB is a vital determinant of a forest ecosystem’s capacity for carbon storage. The accurate estimation of AGB is crucial for monitoring afforestation and deforestation and developing sustainable strategies to address forest management challenges under SDG-15.
Pakistan ranks 5th in climate vulnerability, according to the Global Climate Risk Index [5]. Its forests, covering just 4.51 million hectares [6], are increasingly vulnerable to climate change, necessitating advanced methodologies for accurate carbon assessment. Enhancing existing frameworks and tailoring them to local contexts is vital for developing effective mitigation strategies to control CO2 emissions [7]. Assessing forest areas without considering AGB limits our understanding of the total carbon storage capacity and the potential effects of climate change.
Temperature and precipitation are significant climate characteristics that regulate the environmental variables affecting above-ground forest carbon stocks. Forest structure changes are determined by species distribution, composition, and density and are vulnerable to climatic-induced shifts, impacting forest productivity and functionality [8]. Additionally, Pakistan’s management strategies adopted for forestry resources face multiple challenges due to climate change impacts and resource allocation among the indigenous communities living in the forest. The loss of carbon sinks, estimated at 1.1% from 2000 to 2023 by Global Forest Watch, has intensified climate change impacts, heightened susceptibility towards natural disasters, and increased habitat loss, threatening species survival and biodiversity [9]. Addressing these challenges requires integrating data fusion techniques, machine learning algorithms, and innovative approaches to improve carbon stock assessments in managed and natural forests.
Inaccurate and unreliable methods for estimating forest AGB result in substantial miscalculations of carbon storage capacities, ultimately undermining climate change mitigation and adaptation strategies [10]. Forest carbon estimates at global and regional scales face data availability challenges, estimation methods, topographical variability, and vast spatial coverage [11]. Significant data gaps and uncertainty in forest carbon sequestration and storage mainly stem from inconsistent field data collection and biomass allometric equations [12,13]. Ground-based methods for quantifying forest biomass and net primary productivity (NPP) are resource-intensive and limited in spatial and temporal coverage [14]. Therefore, a consistent methodological framework is essential to estimate AGB at national and sub-national levels.
Traditional methods of AGB estimation are statistical, requiring more resources. Allometric equations were developed using a logarithmic transformation model for biomass estimation in a sub-tropical ecoregion, using integrated cluster sampling, and using optical image segmentation to estimate carbon stocks in Himalayan temperate and sub-tropical mountain systems [15]. This ground-based methodology was supplemented with remote sensing to cover a larger area. These studies indicated the prevalent use of optical and field-based inventory data collection techniques for carbon stock estimation. Sentinel-2-derived vegetation indices and linear regression were used to estimate AGB, complemented by land cover change analysis with Landsat-7 and 8 data [16]. Similarly, temporal extent and deforestation rates were assessed in Mansehra [17]. Harmonized global maps with a spatial resolution of 300 m were developed by estimating above-ground and below-ground biomass carbon density using a rule-based decision tree method [18].
Spaceborne LiDAR is increasingly favoured for AGB estimation, because it captures biophysical vegetation parameters like plants’ vertical profiles, sub-canopy topography, and biomass [19]. The cost-effectiveness and suitability of spaceborne LiDAR over large areas and inaccessible hilly terrain make it a practical choice [20]. Using different statistical probability distribution techniques, the GEDI L4A dataset was used to map Amazon forests for carbon sequestration rates concerning vegetation recovery, with regeneration and disturbance [21]. A hybrid inference model demonstrated compatibility between GEDI L4A datasets and Paraguay’s national forest inventory (NFI), effectively reducing uncertainties in biomass estimation and enhancing the integration of remote sensing and field data for improved forest monitoring [22]. Similarly, the accuracy testing of GEDI L2A and ICESat-2 data using the kriging technique in tropical and sub-tropical forests in India showed superior results for GEDI [23]. However, the underestimation of GEDI (L4A and gridded L4B) footprints in tropical forests was found in comparison with Sentinel-2 estimates, indicating the need for additional explanatory variables from other datasets [24]. In regions with limited ground inventory resources, GEDI data is open, accessible geospatial information that provides a viable solution for estimating above-ground biomass. Ancillary and optical data from various sensor platforms further improved AGB estimation efficiency with GEDI L4A footprints in these studies [25,26,27,28]. The applicability of GEDI footprints and data products has been studied at various spatial (global and regional), temporal (seasonal), and species levels, highlighting the dynamic nature of carbon stock accumulation in response to slopes and aspects [29]. Despite numerous studies on reliable AGB estimation, gaps persist in assessing its local accuracy for GEDI L4A products.
GEDI L4A classifies four plant function types globally and applies an OLS model using waveform data, supporting reliability and accuracy in biomass estimation [30]. A 30 m resolution forest AGB map of China was generated using multisource remote sensing data, including meteorological and soil variables and RF regression, achieving R² = 0.67 and RMSE = 70.71 Mg/ha [25]. Similarly, in another study, optimized GEDI footprint density for regional biomass estimation using random forest was carried out. It was determined that a methodological reference for selecting GEDI footprints improve prediction accuracy, yielding an average biomass of 101.98 t/hm² and a total biomass of 3035.29 × 10⁴ t/hm² in forest assessments [31].
Our research signifies a comprehensive approach that combines optical data with machine learning algorithms and spaceborne LiDAR data to assess AGB dynamics and the carbon sequestration potential in this specific ecological context as compared to previous studies having integrated remote sensing and machine learning for AGB estimation. The proposed study quantifies the forest biomass in a designated forest based on the integration of multisource explanatory variables, with the importance score having topographic elevation, forest canopy height, and optical green band as the prominent and major key features in biomass estimation and with a unique compartment-level assessment.
Machine learning algorithms (MLAs) are widely used in biomass estimation by inventory data, allometric equations, and remote sensing data [32]. These methods are particularly effective in handling forest heterogeneity and terrain complexity, providing robust and scalable solutions for biomass estimation [33]. Among MLAs, random forest has demonstrated superior performance in predicting AGB for plant function types, such as broadleaf, coniferous, and mixed needle-broadleaf forests [34]. The selection of random forest is due to its demonstrated high predictive accuracy with a minimal risk of overfitting, due to its ensemble-based approach and effectiveness for biomass estimation in remote sensing applications [35]. The ability of the RF algorithm to handle non-linear relationships, high-dimensional data, and complex interactions among variables makes it more suitable for AGB estimation [36]. It provides an inherent mechanism for ranking the importance of input variables, which is beneficial for understanding the contribution of predictors (e.g., spectral indices, topographic data, and GEDI data) in biomass estimation [37]. A comprehensive insight into the above discussion underscores the importance of integrating multiple diverse data sources with machine learning algorithms to obtain reliable AGB estimation and its potential for CO2 sequestration. This integration facilitates accurate assessments of forest impact and inventory requirements for mitigating CO2 emissions. Therefore, this study aims to explore exploratory variables using machine learning models for accurate AGB estimation and its potential to sequester CO2 concentration. Thus, this research provides a comprehensive and efficient integrated approach consisting of exploratory variables derived from satellite and spaceborne LiDAR datasets and analytics to explore the AGB potential and requirements to tend to prevalent CO2 emissions.

2. Materials and Methods
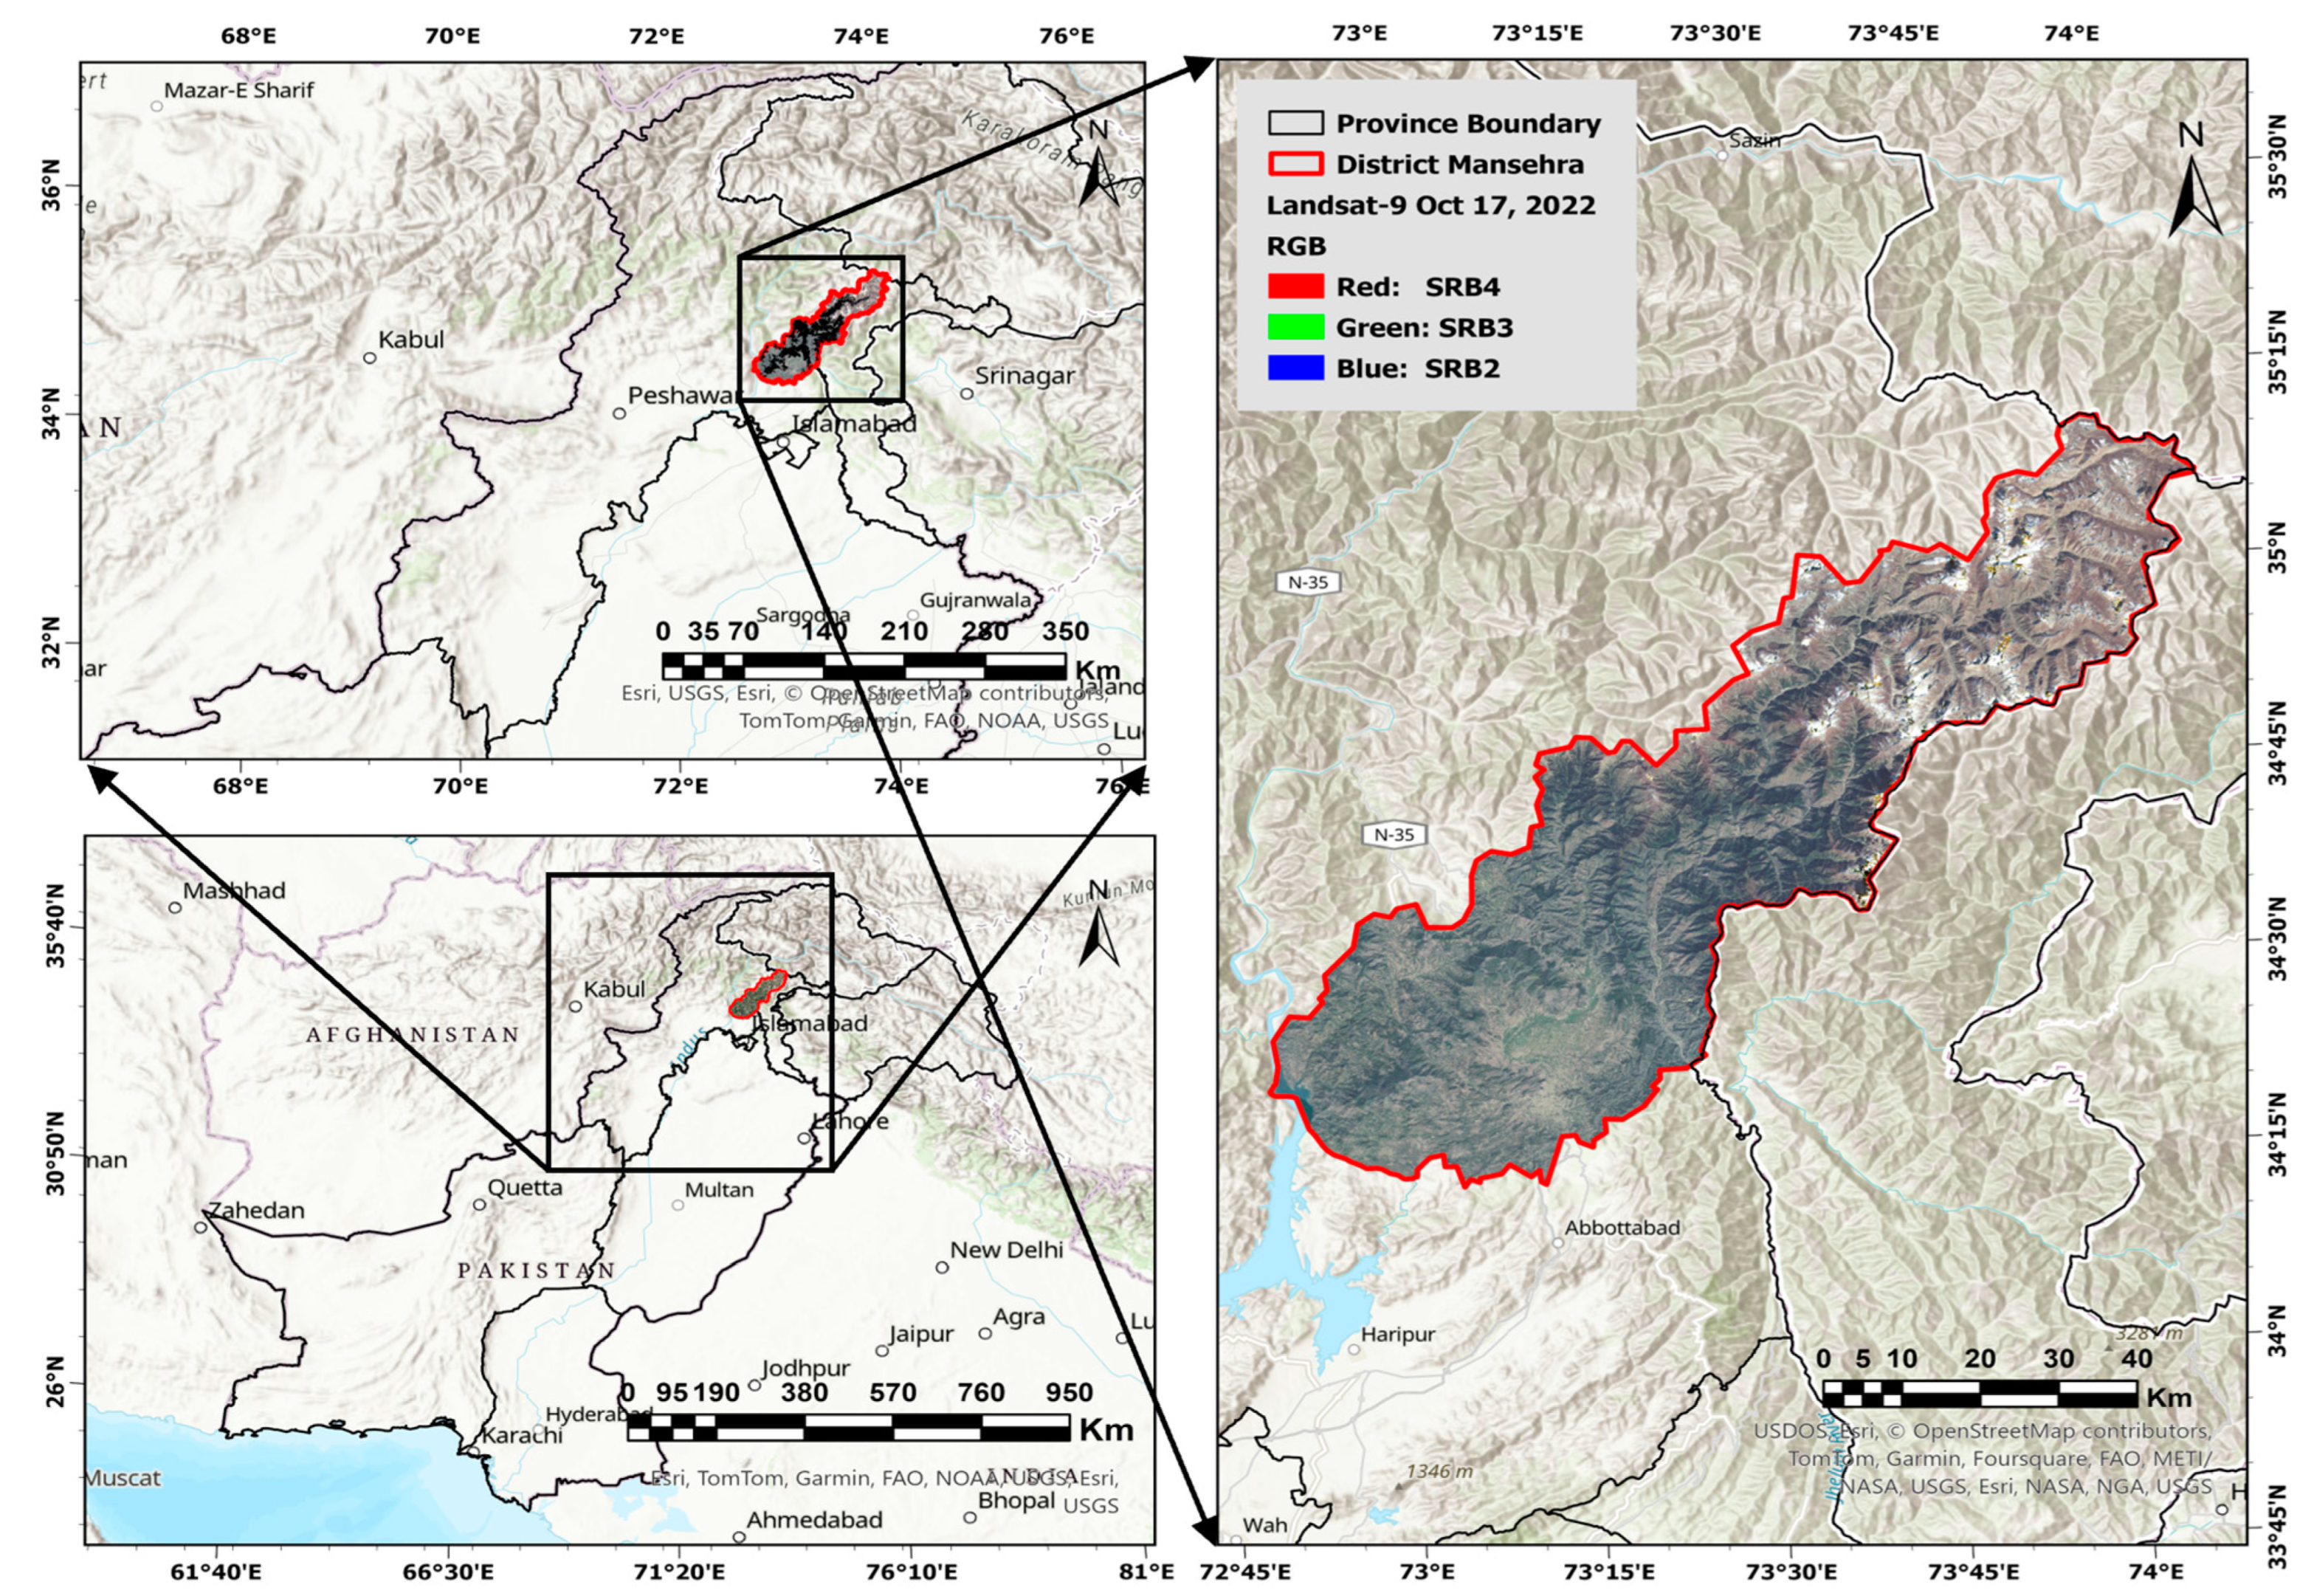
The major components of this study’s methodology include the study area, datasets, data preparation and analytical workflow, and CO2 emission datasets. These components are described below in detail.

2.1. Study Area

Mansehra District, located in the Khyber Pakhtunkhwa province of Pakistan, covers approximately 4579 km2, situated between latitudes 34°14′ N to 35°11′ N and longitudes 72°49′ E to 74°08′ E (Figure 1). The temperature ranges from 2 to 36 °C, with heavy monsoon rainfall reaching 1500 mm. The elevation varies from 600 to 4500 m, ranging from low-lying plains to high mountain peaks in the Kaghan Valley of Himalayan foothills.
The species composition in moist temperate forests is dominated by Blue Pine (Pinus wallichiana A.B. Jackson), followed by Deodar (Cedrus deodara (Roxb. Ex Lamb.) G. Don), Fir (Abies pindrow Royle), and Spruce (Picea smithiana (Wall.) Boiss.), forming an association with broad-leaved Oak (Quercus dilatata Lindl. ex Royle) of high carbon storage potential. Forest covers transition to sub-alpine, moist, and dry temperate forests at higher elevations, whereas the sub-tropical chir pine dominates lower elevations. The estimated total province forest area is 1.133 million hectares, covering 70% of the temperate zone, while 30% is the sub-tropical zone [38]. This diversity highlights the region’s ecological significance for biodiversity, carbon sequestration, and sustainable forest management.

2.2. Datasets

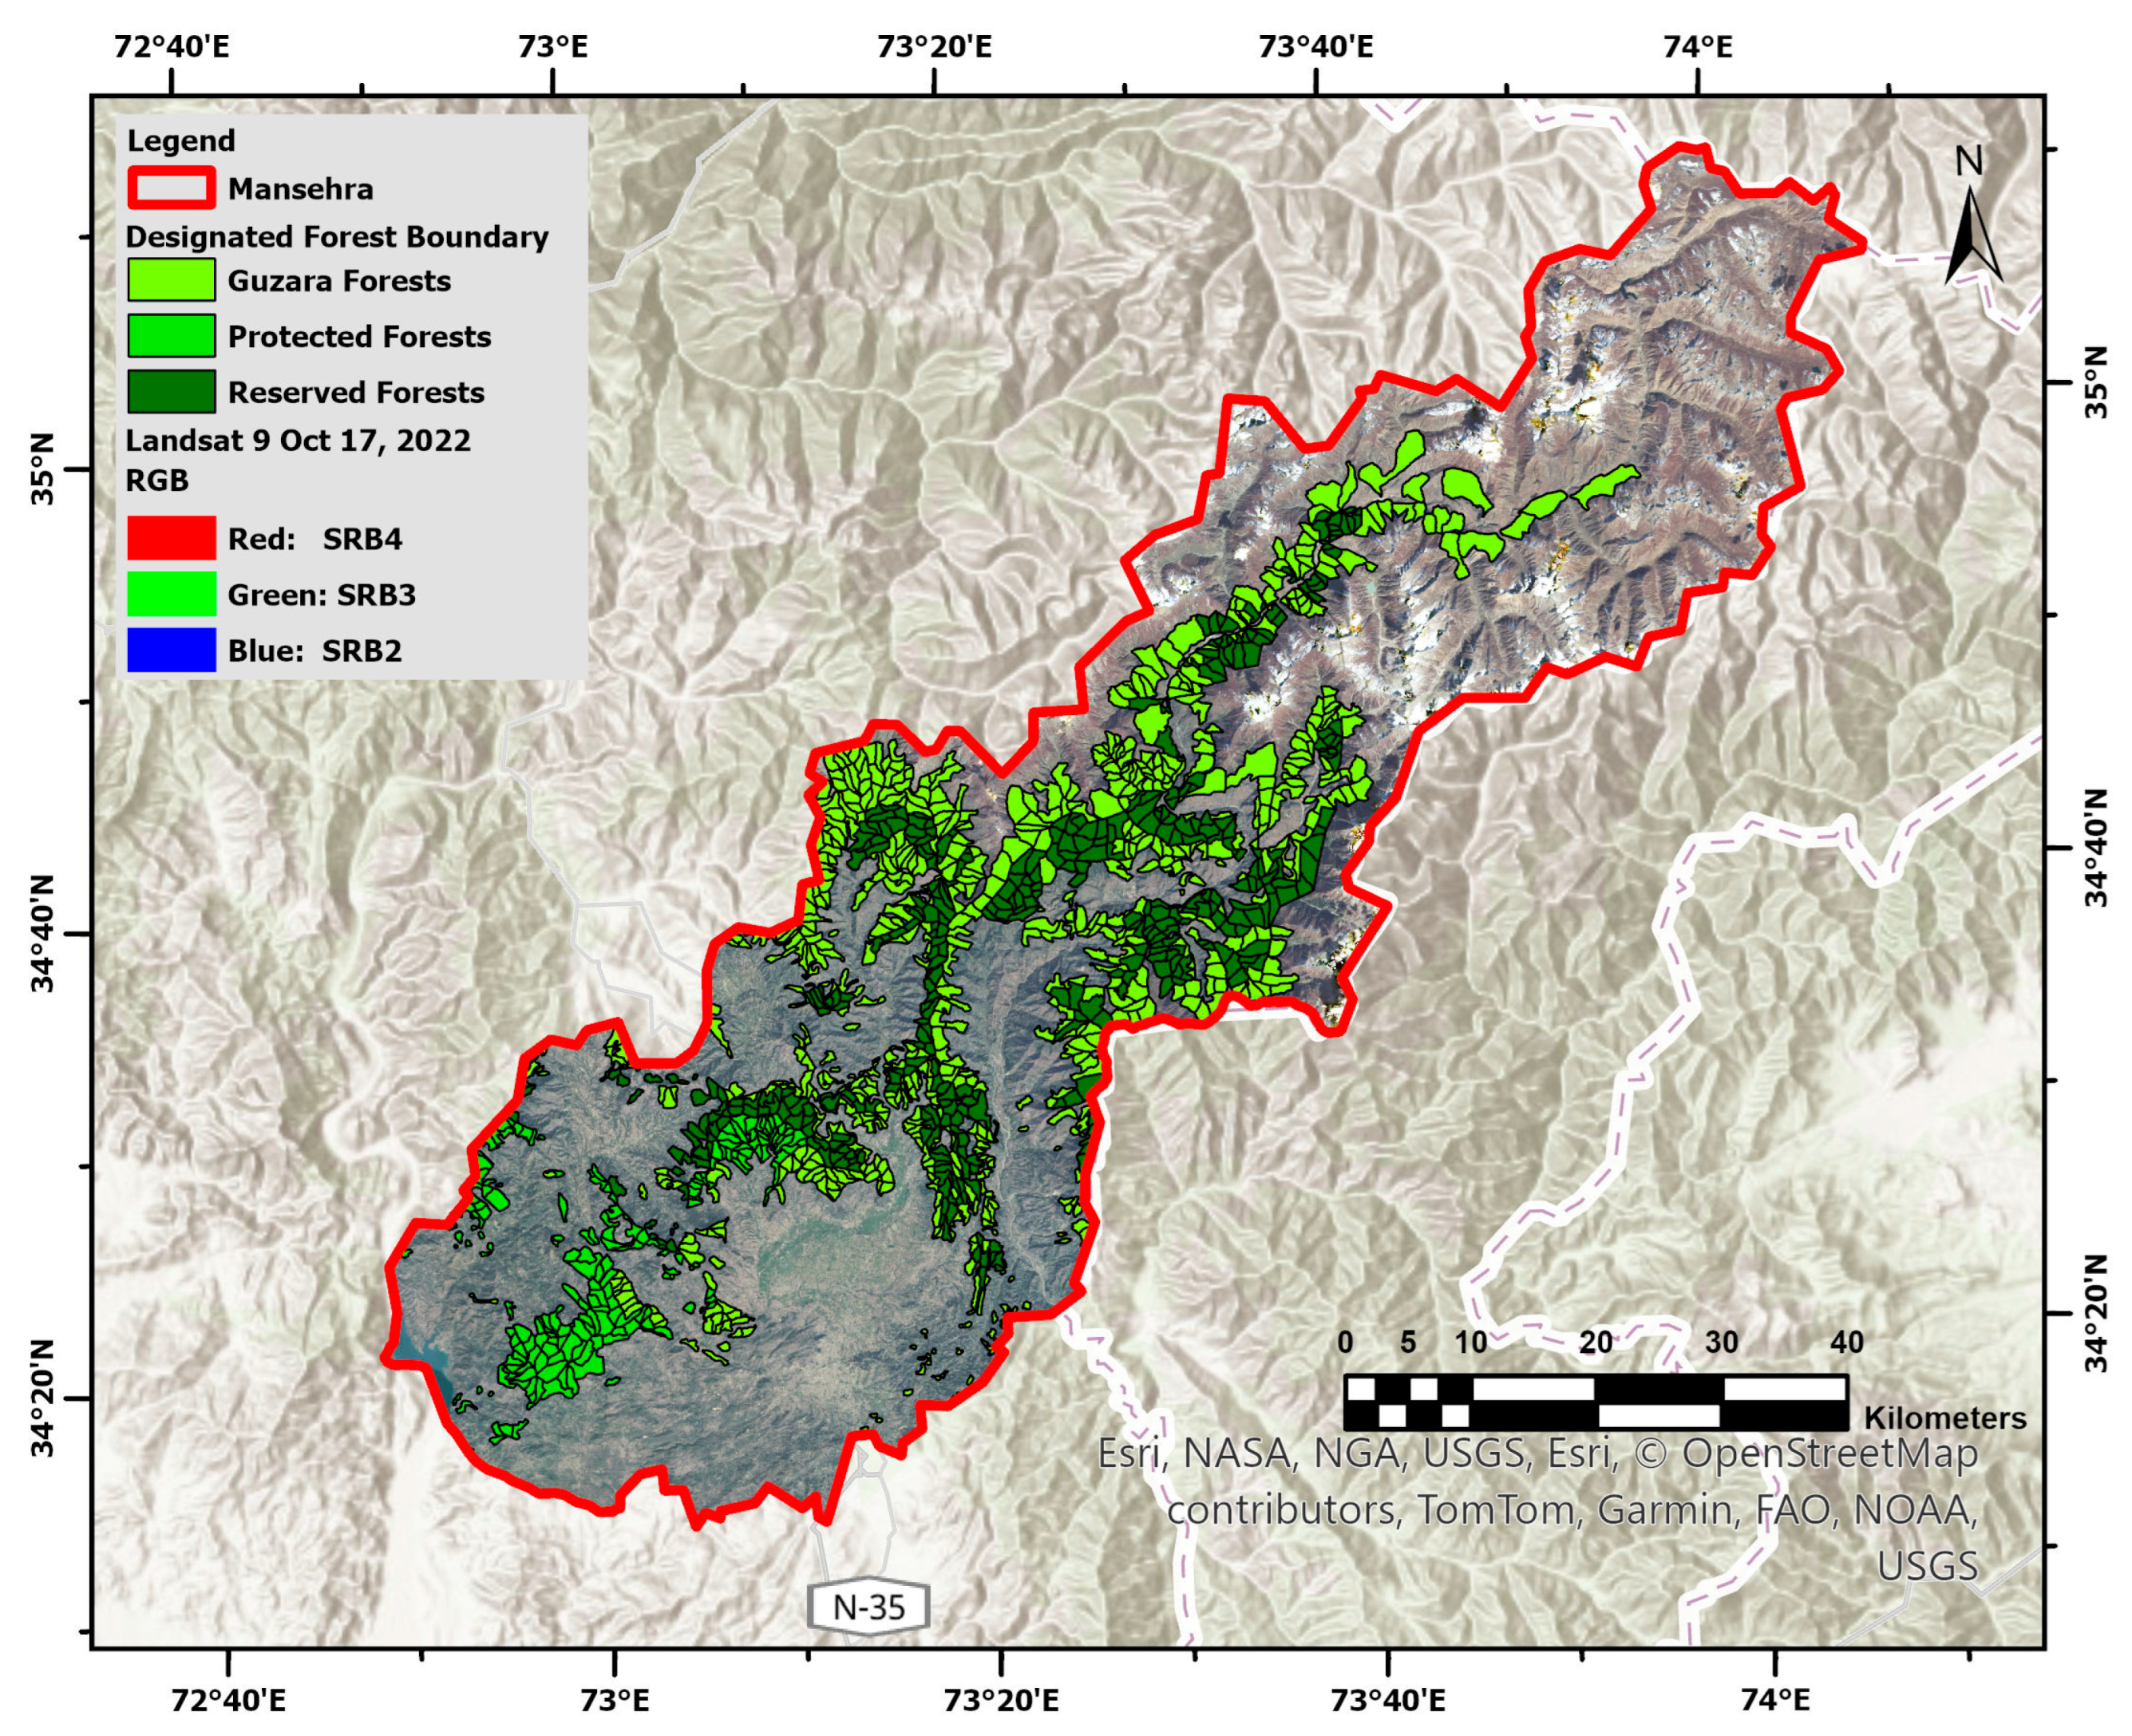
2.2.1. Forest Territorial Distribution and Compartment Data

Pakistan has 66% of state-managed forests and 34% of forests managed privately or by the community [39]. Out of the 3322.52 km2 of forest area in Mansehra District, the total designated forest area is 1118.85 km2. This forest territory is designated as a community locally named guzara (58.09%), reserved (30.34%), and protected (11.56%) forests. “The word “Guzara”, literally meaning “subsistence” which is community-owned, either individually or collectively managed, where local residents have legally documented rights to extract wood for their domestic needs”.
The Khyber Pakhtunkhwa Forest Department, under the Forest Ordinance 2002, categorizes designated forests into compartments, as in Figure 2 for geospatial monitoring, ensuring effective forest management practices and informed decision-making. Among the total 1298 compartments, community (privately owned) forests have 717, protected forests have 182, and reserved forests have 399 compartments. The distribution of designated forest categories and compartments is shown in Figure 2.

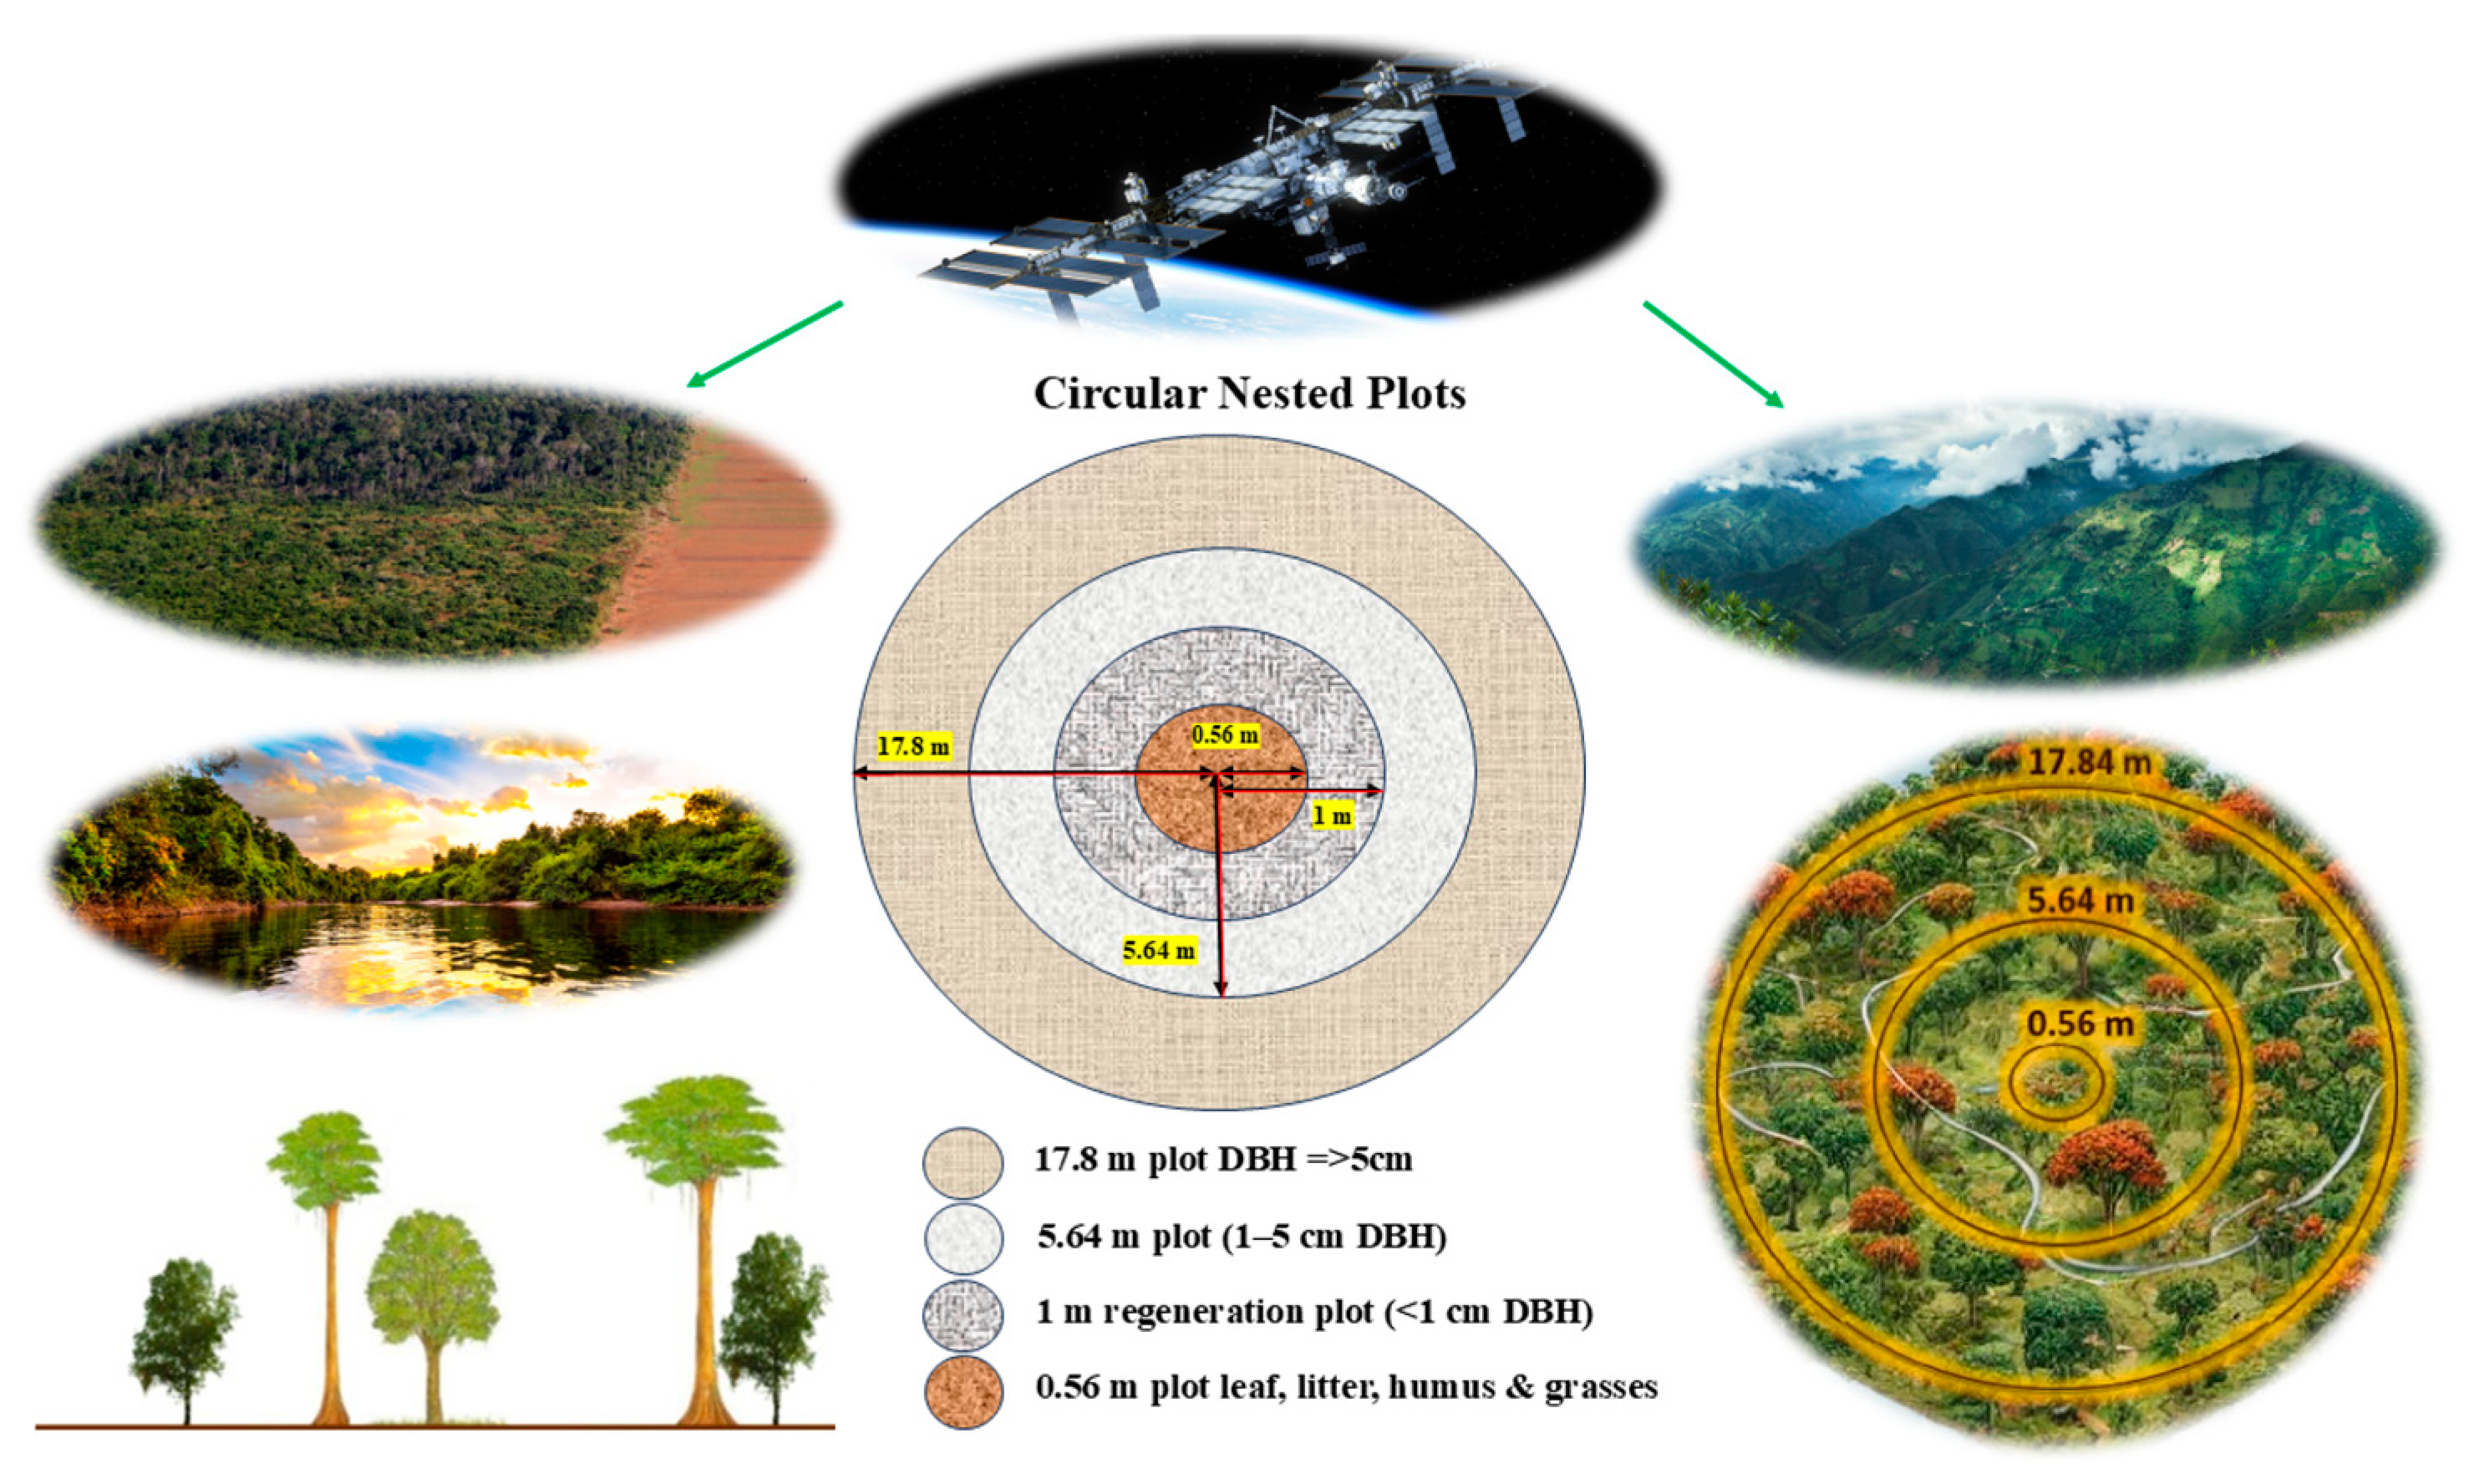
2.2.2. Field Inventory Data

A carbon inventory survey was conducted in the Khyber Pakhtunkhwa forests using satellite data and region-specific allometric equations to estimate the carbon stocks. These equations were developed for the local major population species, with biomass expansion factors and basic wood densities. A consistent forest definition (a minimum area of 0.5 ha area, a 10% canopy cover, and 2 m in height), with a national consensus of provincial and federal departments that was adopted in 2017 for the monitoring of forests, was used to estimate the forest cover. The field inventory data from the designated forests of the Mansehra district cover geographical, environmental, and forest structural parameters. The elevation, geolocation, slope (%), aspect, crown cover (%), diameter at breast height (DBH, cm), and basal area (m2), using allometric equations, were used to calculate the carbon stock points across dry temperate, moist temperate, and chir pine forests. The spatial distribution of these ground plot measurements is illustrated in Figure 3.
The Pakistan Forest Institute (PFI) conducted a field inventory campaign for a pilot project to develop species-specific local allometric models for Khyber Pakhtunkhwa. Among the total of 449 sample plots, 70 plots (15.59%) were designed as primary sampling units (PSUs) for accuracy assessment and validation through nested circular plots for biomass and carbon stocks. The layout and dimensions of the ground circular nested plots are shown in Figure 4. Within a nested circular plot (17.84 m radius; 1000 m2 area), the number of trees with a diameter higher than 5 cm were enumerated. However, the diameter at breast height (DBH) for the diameter class 1–5 cm was measured from a subplot of a 5.64 m radius (area = 100 m2). Later on, trees with a diameter of less than 1 cm (regeneration plot DBH) were counted from a 1 m radius plot within an area of 3.14 m2. Shrub non-tree, litter, and soil biomass measurements were taken from a small plot with a radius of 0.56 m (area = 1 m2).
A destructive sampling technique was employed in the coniferous forest to calculate the biomass expansion factor and basic wood density of conifer species and to develop allometric equations using regression functions, given in Table 1. Tree heights were accurately estimated by measuring new diameter-height functions developed for biomass estimation. Ground-based biomass estimates were calculated using the volume, wood density, height, and biomass expansion factor (BEF) [40]. Allometric equations given in Table 1 have four major components consisting of diameter at breast height (D), total tree height (H), regression constant (a) and regression coefficient (b). Regression constant and coefficient values depend upon geographical location and type of species.

2.2.3. Satellite Datasets

Landsat-9 optical imagery offers a broad spectral resolution, covering 11 bands ranging from visible light to thermal infrared. Key bands include the red (0.64–0.67 µm) and green (0.53–0.59 µm) bands, which help distinguish foliage and canopy densities. The near-infrared band (0.85–0.88 µm) is instrumental in analysing forest health, types, and biomass volume within a tree canopy. Additionally, the two short-wave infrared bands SWIR-1 (1.57–1.65 µm) and SWIR-2 (2.11–2.29 µm) are sensitive to moisture content in soil and vegetation [41]. Open-access Landsat-9 Operational Land Imager (OLI) data of the study area, with minimum cloud (up to 10%) cover, was downloaded from USGS Earth Explorer website https://earthexplorer.usgs.gov/, (accessed on: 18 October 2024).

Digital Elevation Model

The Shuttle Radar Topography Mission (SRTM), a collaborative product of the U.S. National Geospatial-Intelligence Agency (NGA) and NASA, is widely used in geospatial applications. SRTM provides data in a standardized global WGS84 geographic coordinate system with a resolution of 1 arc second (~30 m) and 3 arc seconds (~90 m). Aspect and DEM products with a 30 m resolution and GeoTiff file format were downloaded from the USGS EROS Archive link https://lpdaac.usgs.gov/products/srtmgl1v003/ (accessed on: 20 October 2024). Several studies have observed a correlation between topographic feature, elevation, slope, and biomass prediction in forest ecosystems in steep and hilly terrains [42].

Forest Layer

The forest layer, derived from the Sentinel-1 and Sentinel-2 datasets (10 m resolution), was extracted from World Cover 2020 and 2021 products website https://viewer.esa-worldcover.org/worldcover (accessed on: 20 October 2024), developed by the United Nations’ (UN) Food and Agriculture Organization (FAO) using the Land Cover Classification System (LCCS). This forest layer intersected with the GEDI-derived AGB points to ensure requisite data compatibility.

Forest Height

Tree height is a critical explanatory variable for accurately estimating biomass [43]. This study used the GEDI (RH98) L2A dataset as the primary source of forest height. Forest height coverage across the Mansehra district was ensured through the Global Forest Canopy Height (30 m raster) dataset, developed by the Global Land Analysis and Discovery (GLAD) team at the University of Maryland (UMD GLAD) as supplementary input. This dataset, available at https://glad.umd.edu/dataset/gedi/ (accessed on: 30 October 2024), allowed for seamless integration with GEDI (RH98), enabling reliable above-ground biomass (AGB) predictions for the entire study area.

Predictor Variables

Vegetation indices are essential in biomass estimation, forest cover assessment, and health monitoring. A comprehensive set of predictor variables was explored to estimate the structural parameters and biomass of forests using machine learning models. NDVI and seasonality impacts are frequently correlated, suggesting that a time series analysis improves AGB estimations, particularly during the fall [44]. The impact on biomass of combining different spectral bands and the vegetation indices NDVI [44], GNDVI [45], MSI [46], and PVI [47] were studied.

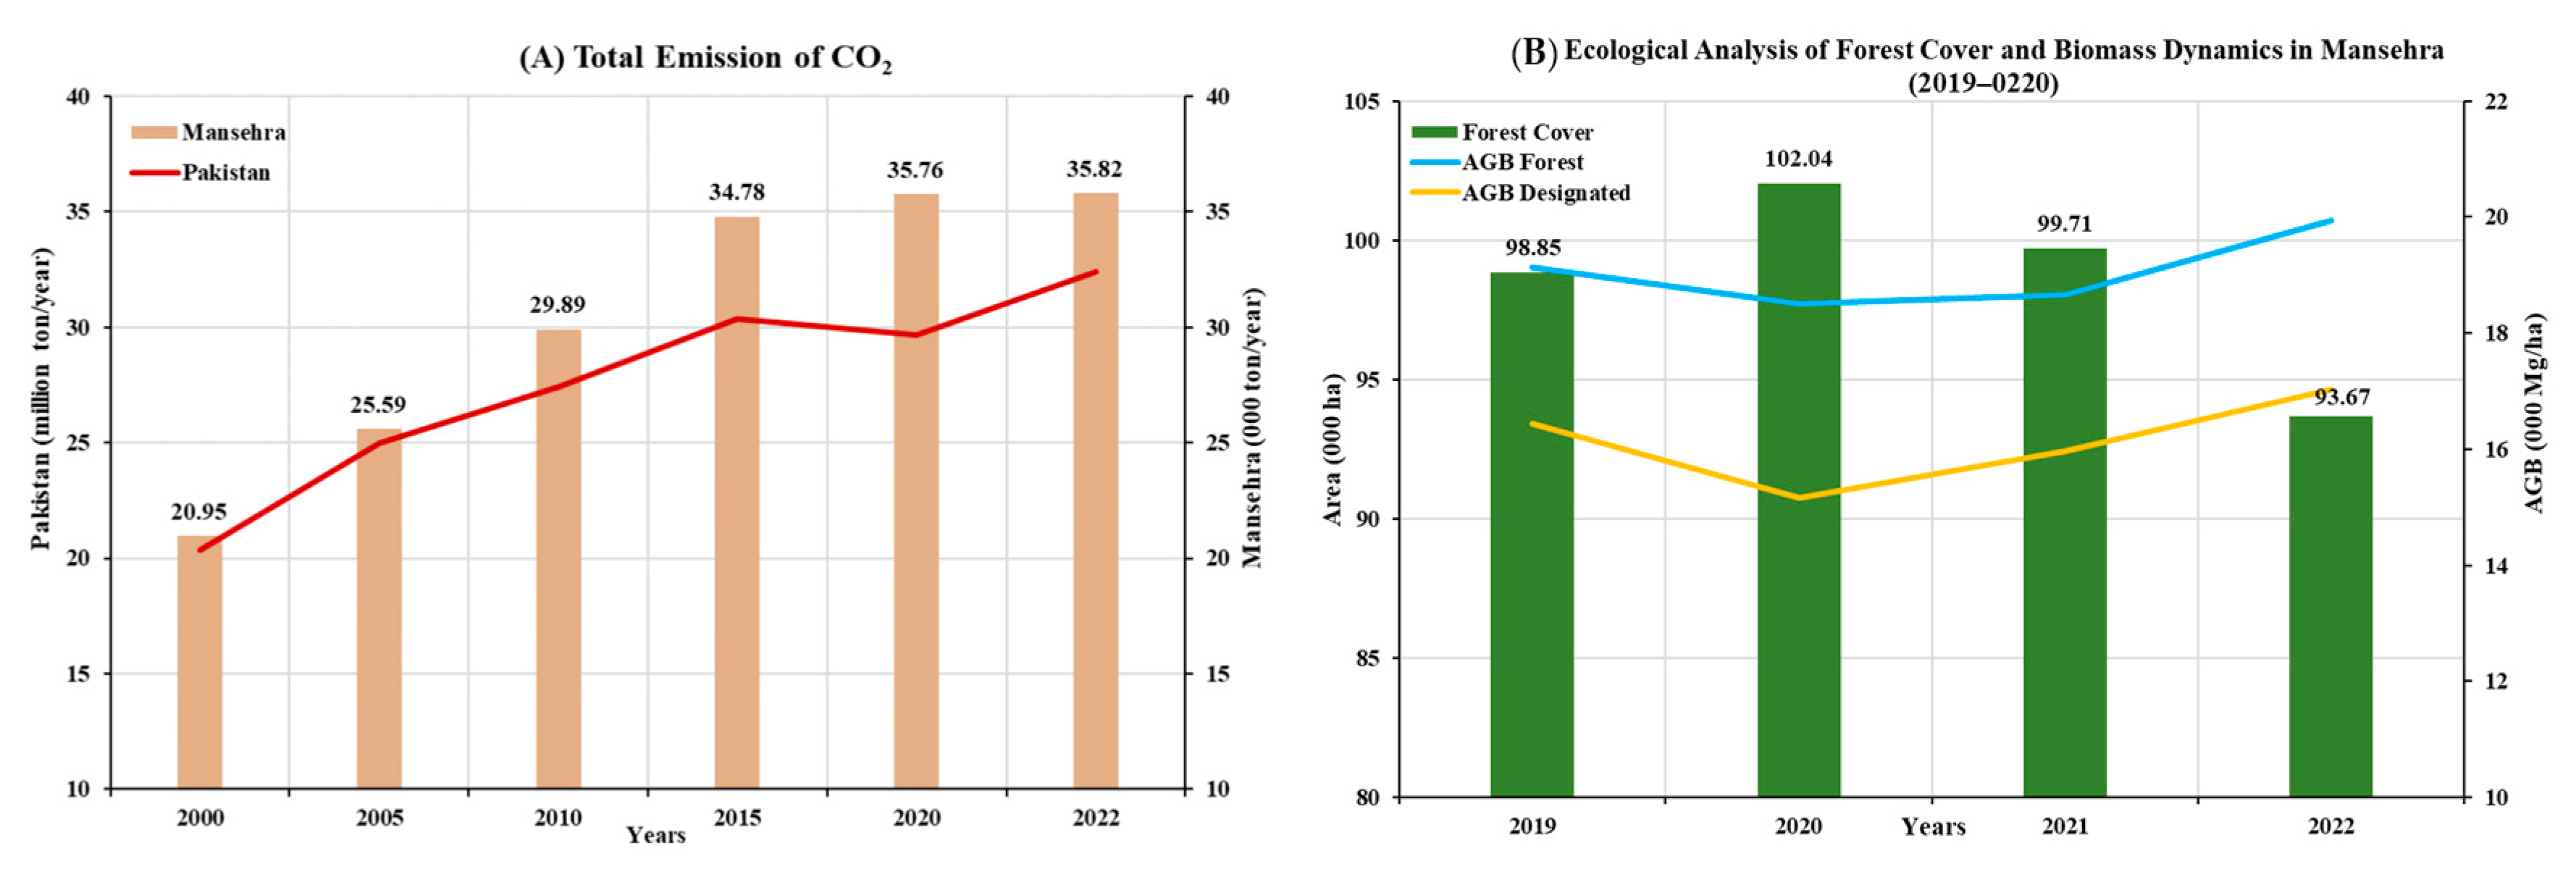
2.2.4. CO2 Emission Dataset

CO2 emissions were obtained from the EDGAR (Emissions Database for Global Atmospheric Research) Community GHG database, a collaborative work of the Joint Research Centre (JRC) and the International Energy Agency (IEA) [48]. These datasets were studied to observe the AGB potential and requirements to tend to CO2 emissions.

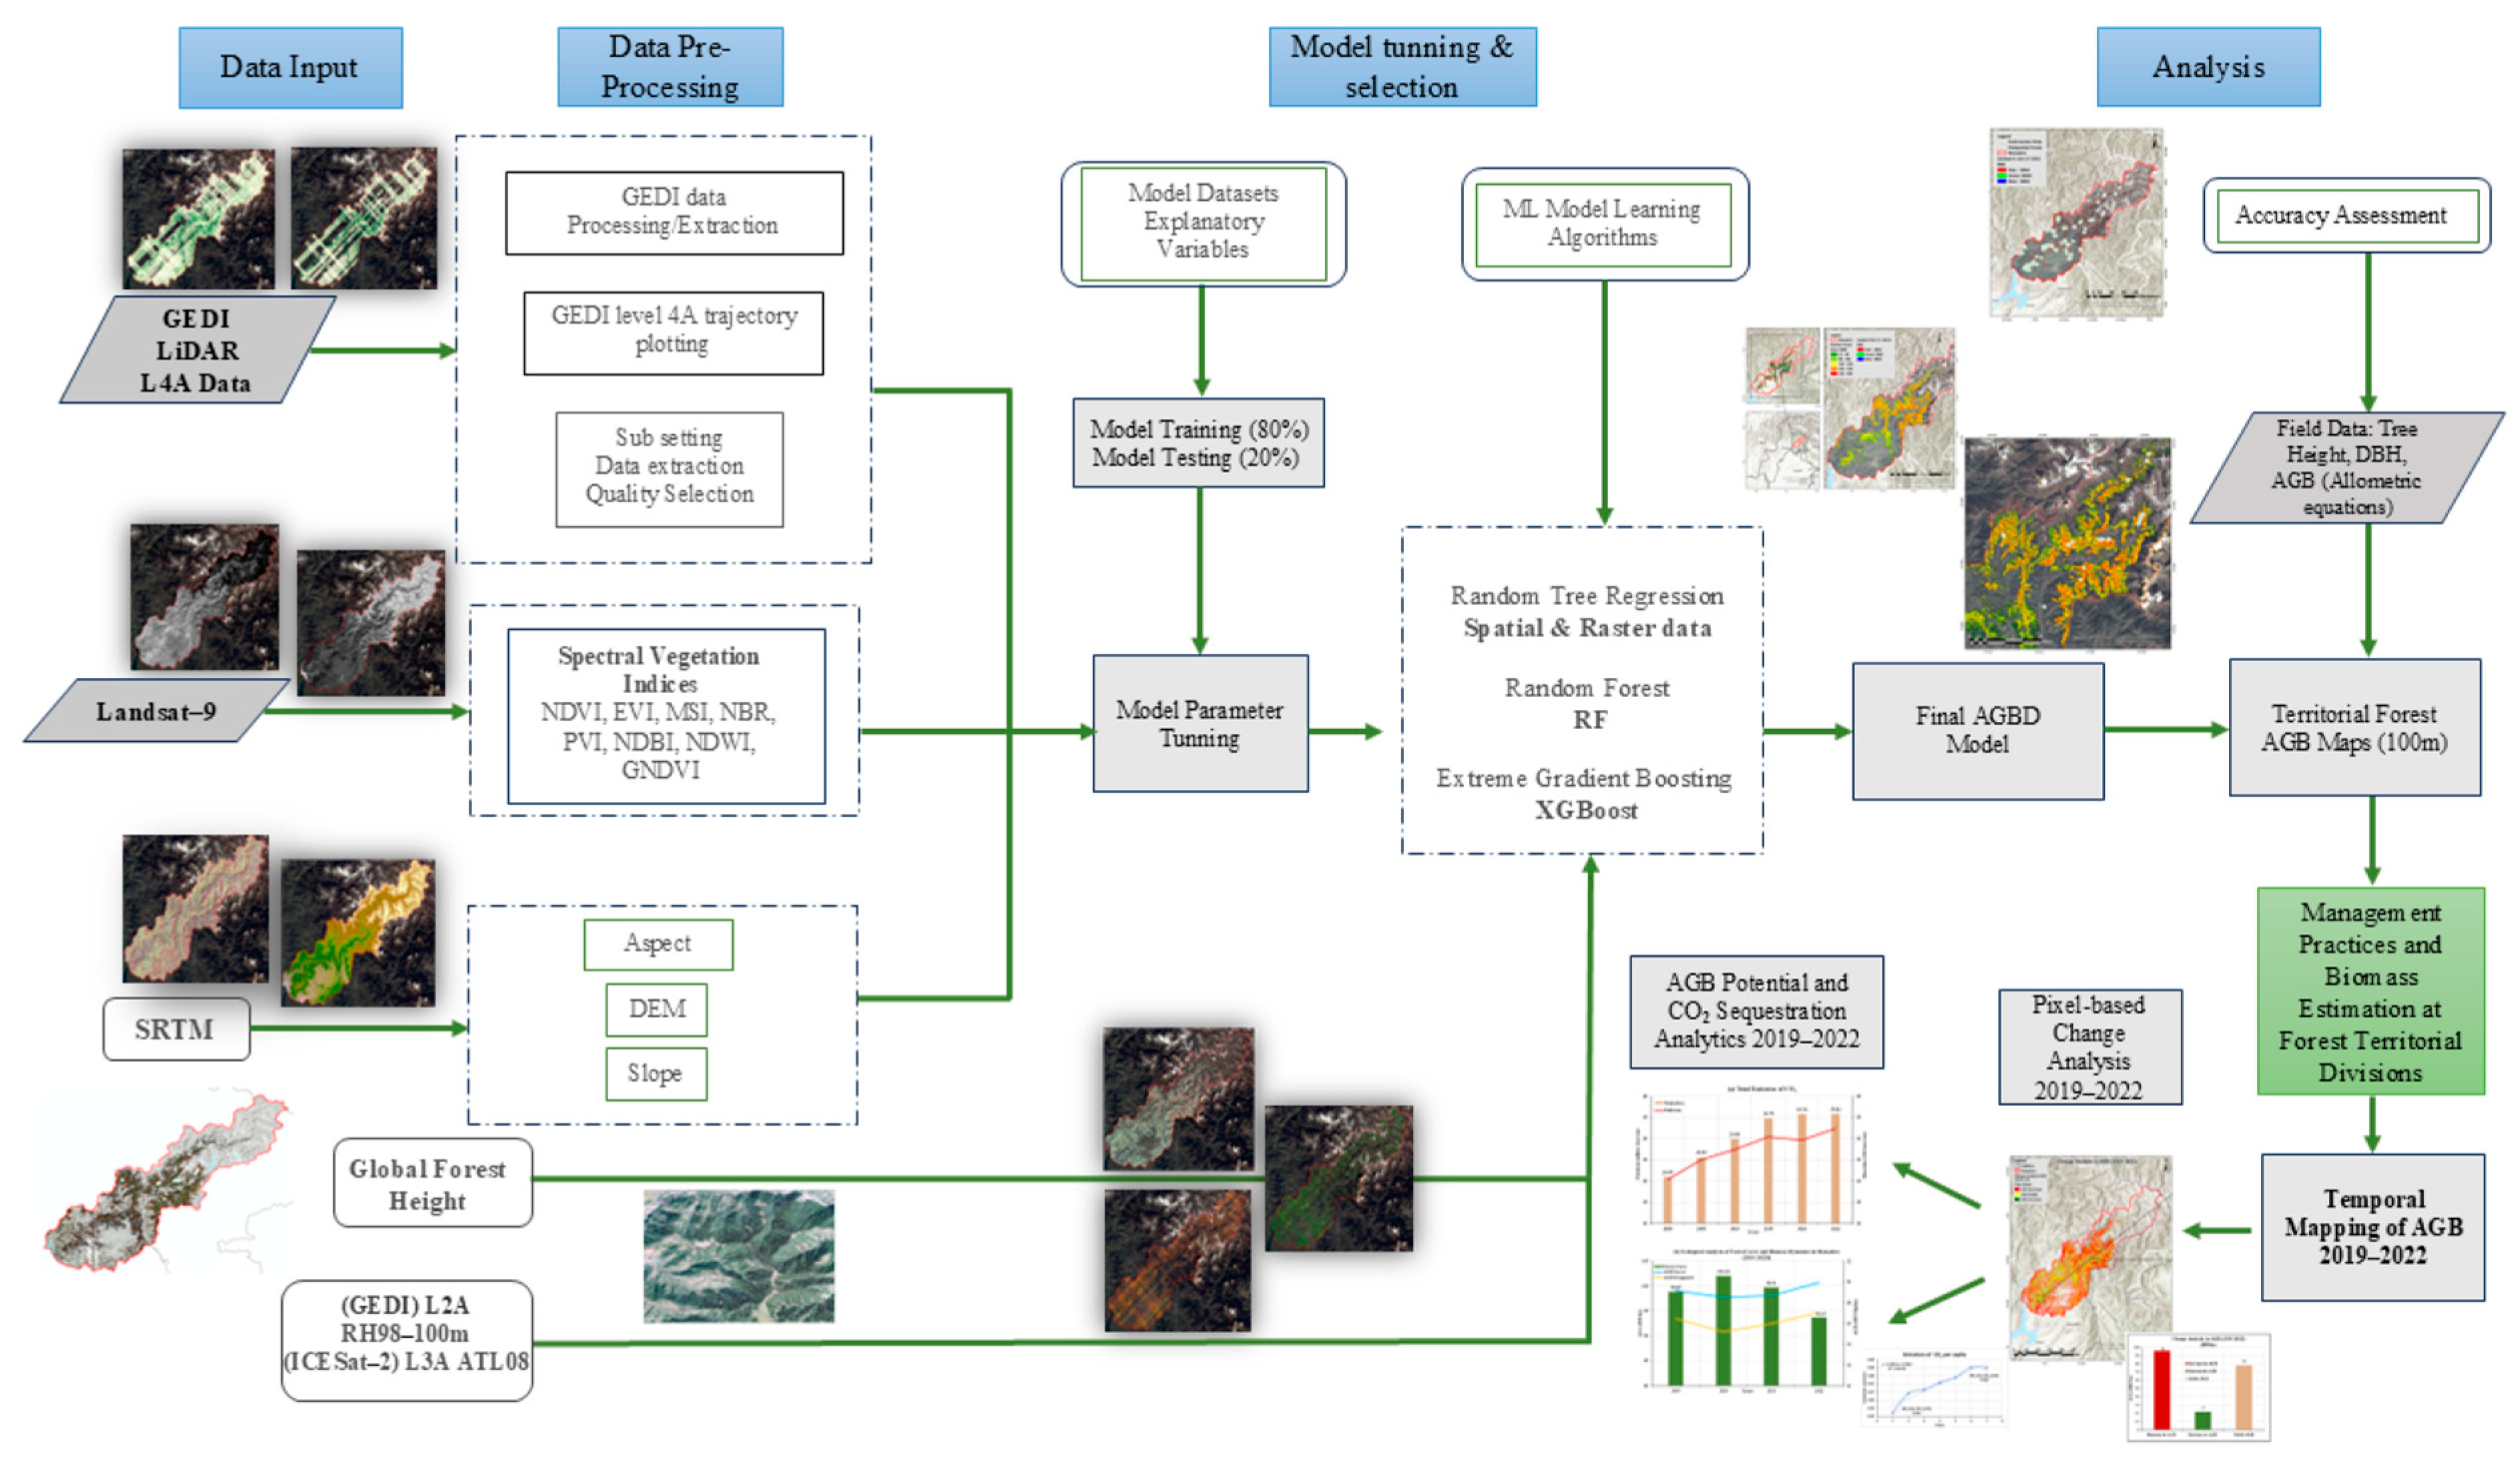
2.3. Data Preparation and Analytical Workflow

2.3.1. Data Processing

The open-source GEDI dataset is accessible from NASA’s Land Processes Distributed Active Archive Center (LPDAAC). The 200 GEDI sensor trajectory orbit tracks were downloaded from https://search.earthdata.nasa.gov (accessed on: 31 October 2024). Based on mathematical and algorithmic procedures, GEDI products are categorised into lower-level products (L1 and L2) and higher-level ones (L3 and L4). The GEDI instrument emits laser pulses with a diameter of 25 m and a wavelength of 1064 nm and a pulse rate of 242 Hz. The GEDI Level 4A version 2.1 datasets were used to estimate the AGB for tropical and temperate forests in the Mansehra district from 2019 to 2022. GEDI Level 4A data (Version 2.1) preprocessing involved several key steps to enhance accuracy and reliability. Quality filtering was applied to retain only high-quality footprints (quality_flag = 1, degrade_flag = 0). This removed footprints with low sensitivity or high uncertainty based on dataset quality flags. Strong beam footprints, which offer more reliable measurements, were prioritized over weak/coverage beams to improve data precision. Spatial alignment ensured GEDI footprints are co-registered with other remote sensing datasets, such as Landsat, Sentinel, or SRTM DEM, to prevent misalignment errors in model training. Additionally, outlier detection was performed to identify and remove erroneous, null values to ensure a rationalized, refined, and robust dataset for analysis. Derived metrics, such as RH95/RH50 ratios, were included to enhance vertical-structure characterization. Moreover, GEDI points were pre-processed to separate coverage beams and high-energy beams in complex hilly terrain areas to have only high-energy beams for GEDI L4A biomass footprints, as shown in (Figure 5) [42].
The forest mask layer was intersected with GEDI power beams to obtain forest area-specific datasets, effectively removing the urban and non-forest land-use features. After preprocessing, 93,248 GEDI power beam shots were used for model training and testing within the forest mask layer. Among the total GEDI points, 21,406 points intersected with the designated forest area, distributed across 1298 compartments within the district boundary.

2.3.2. Analytical Workflow

The structural information of vegetation, such as canopy height (L2A), derived from GEDI data, was combined with spectral indices from optical datasets and other explanatory variables. These inputs were used to train and test against GEDI L4A as the dependent variable through machine learning algorithms (MLAs). An overall methodological flowchart for the proposed study to estimate forest above-ground biomass and its potential to sequester CO2 is shown in (Figure 6).

2.3.3. Parameter Selection

Topographic variables, including elevation and slope, were incorporated to evaluate the influence of the terrain on the forest structure and growth patterns. GEDI L4A-derived height metrics, RH98, provide critical information related to the vertical structure of a canopy height. The explanatory variables, including satellite datasets (bands and indices), were analysed using machine learning algorithms, such as random forest, XGBoost, and random tree regression, to assign importance scores to variables contributing to reliable AGB prediction. The regression models identified key variables with high importance scores, including forest height (from GEDI L2A data), the green band, DEM, and the red band, as critical factors influencing biomass estimation. Among these models, the random forest-based relationship between predictor variables and biomass is illustrated in Figure 7. Following the efficient split of 80:20%, as mentioned in the literature [49], these variables were utilized for training (80%) and testing (20%) the model, enabling the accurate prediction of above-ground biomass (AGB).
Machine learning models were optimized using a grid search strategy combined with cross-validation. A 5-fold cross-validation was found to be suitable for optimizing model outputs. Table 2 outlines the fine-tuned hyperparameters used during the model training and testing phases for the best performance.
Random forest inherently identifies critical features based on their ranked contribution to prediction accuracy. The Out-of-Bag (OOB) error was used to evaluate the model’s predictive accuracy by providing an unbiased prediction error. Different combinations of explanatory variables, including the forest’s optical, SRTM DEM, and spaceborne LiDAR structural parameters, were tested to evaluate the performance of model training that explains the variability of forest biomass and provides reliable estimates.
Model performance was evaluated based on the Root Mean Square Error (RMSE), Mean Absolute Error (MAE), and Coefficient of Determination (R2). The optimal model demonstrated high R2 and low RMSE and MAE values, affirming its suitability for precise and dependable AGB estimation.

3. Results

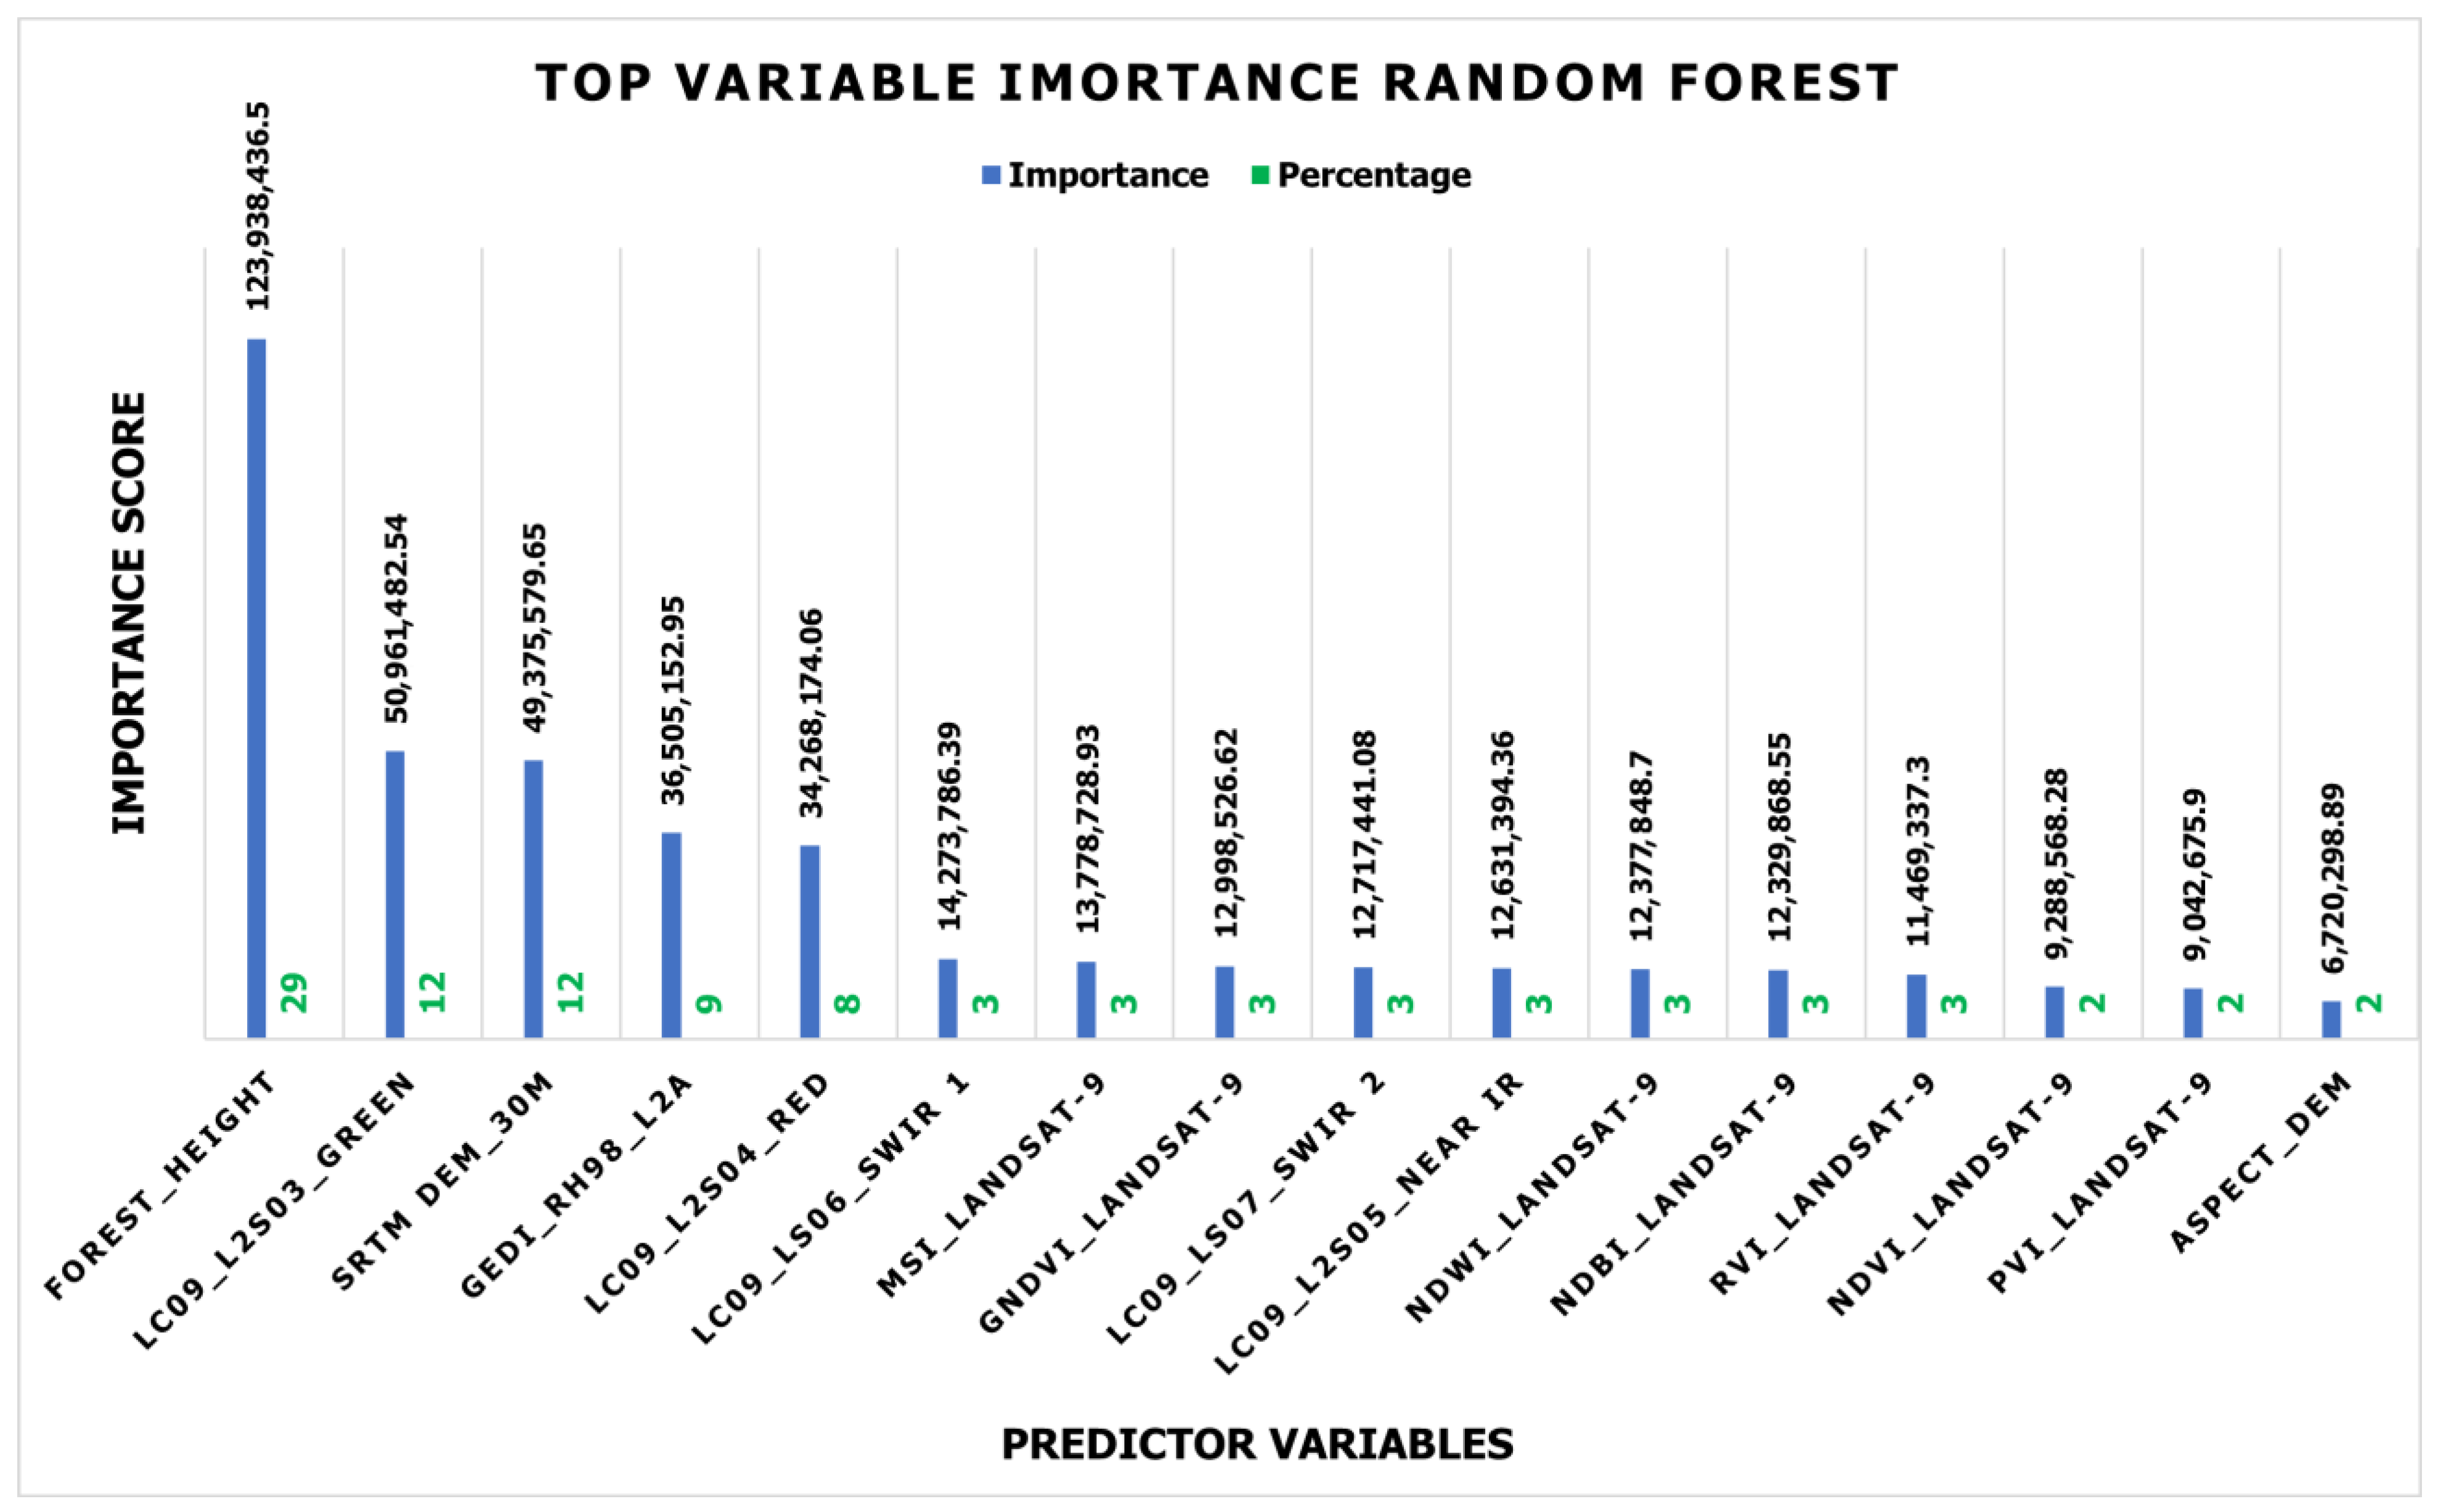
3.1. Explanatory Variable Evaluation

The variable importance matrices were studied, and 16 predictive variables, based on model training, were selected for prediction. Among the optical spectral bands and vegetation indices, B3, B4, B6, the Moisture Stress Index (MSI), and the Green Normalized Difference Vegetation Index (GNDVI) from the Landsat-9 datasets showed the highest importance score in the random forest model. These bands were particularly relevant to the ecological features of the moist and dry temperate forests. Band 3 (0.53–0.59 μm) is sensitive to vegetation health, reflecting the chlorophyll and moisture content in dense moist temperate forests and monitoring variations in canopy density. Band 4 (0.64–0.67 μm) is effective for vegetation stress detection due to its sensitivity to chlorophyll absorption, while Band 6 (1.57–1.65 μm) is sensitive to moisture content and soil–vegetation interactions, making it vital for analysing the canopy density. Similarly, in moist temperate forests, the dense canopy cover with a high moisture content was analysed by Green and SWIR-1 bands, which is effective in biomass estimation. In contrast, the red and SWIR-1 bands contribute to species health variation and moisture stress identification in the dry temperate zone for biomass estimation. Moreover, topographic and structural variables also contributed significantly. The DEM underscored the role of elevation in influencing the forest structure and biomass distribution, while GEDI RH98 provided crucial vertical-structure information at a 100 m resolution.
In contrast to the random tree regression technique, XGBoost assigned importance scores to the spectral bands B6, B4, and B3 that resemble the random forest algorithm. Forest height is the most critical predictor of AGB, followed by DEM. GEDI L2A data providing canopy cover and ground elevation estimates further enhanced our understanding of the vertical complexity and structure of the forest. The spectral bands, vegetative indices, topographic information, forest layers, and height estimation products from GEDI and the global forest canopy cover were used for enhanced biomass estimation. The random forest model achieved the highest R2 of 0.86, demonstrating its effective predictability.

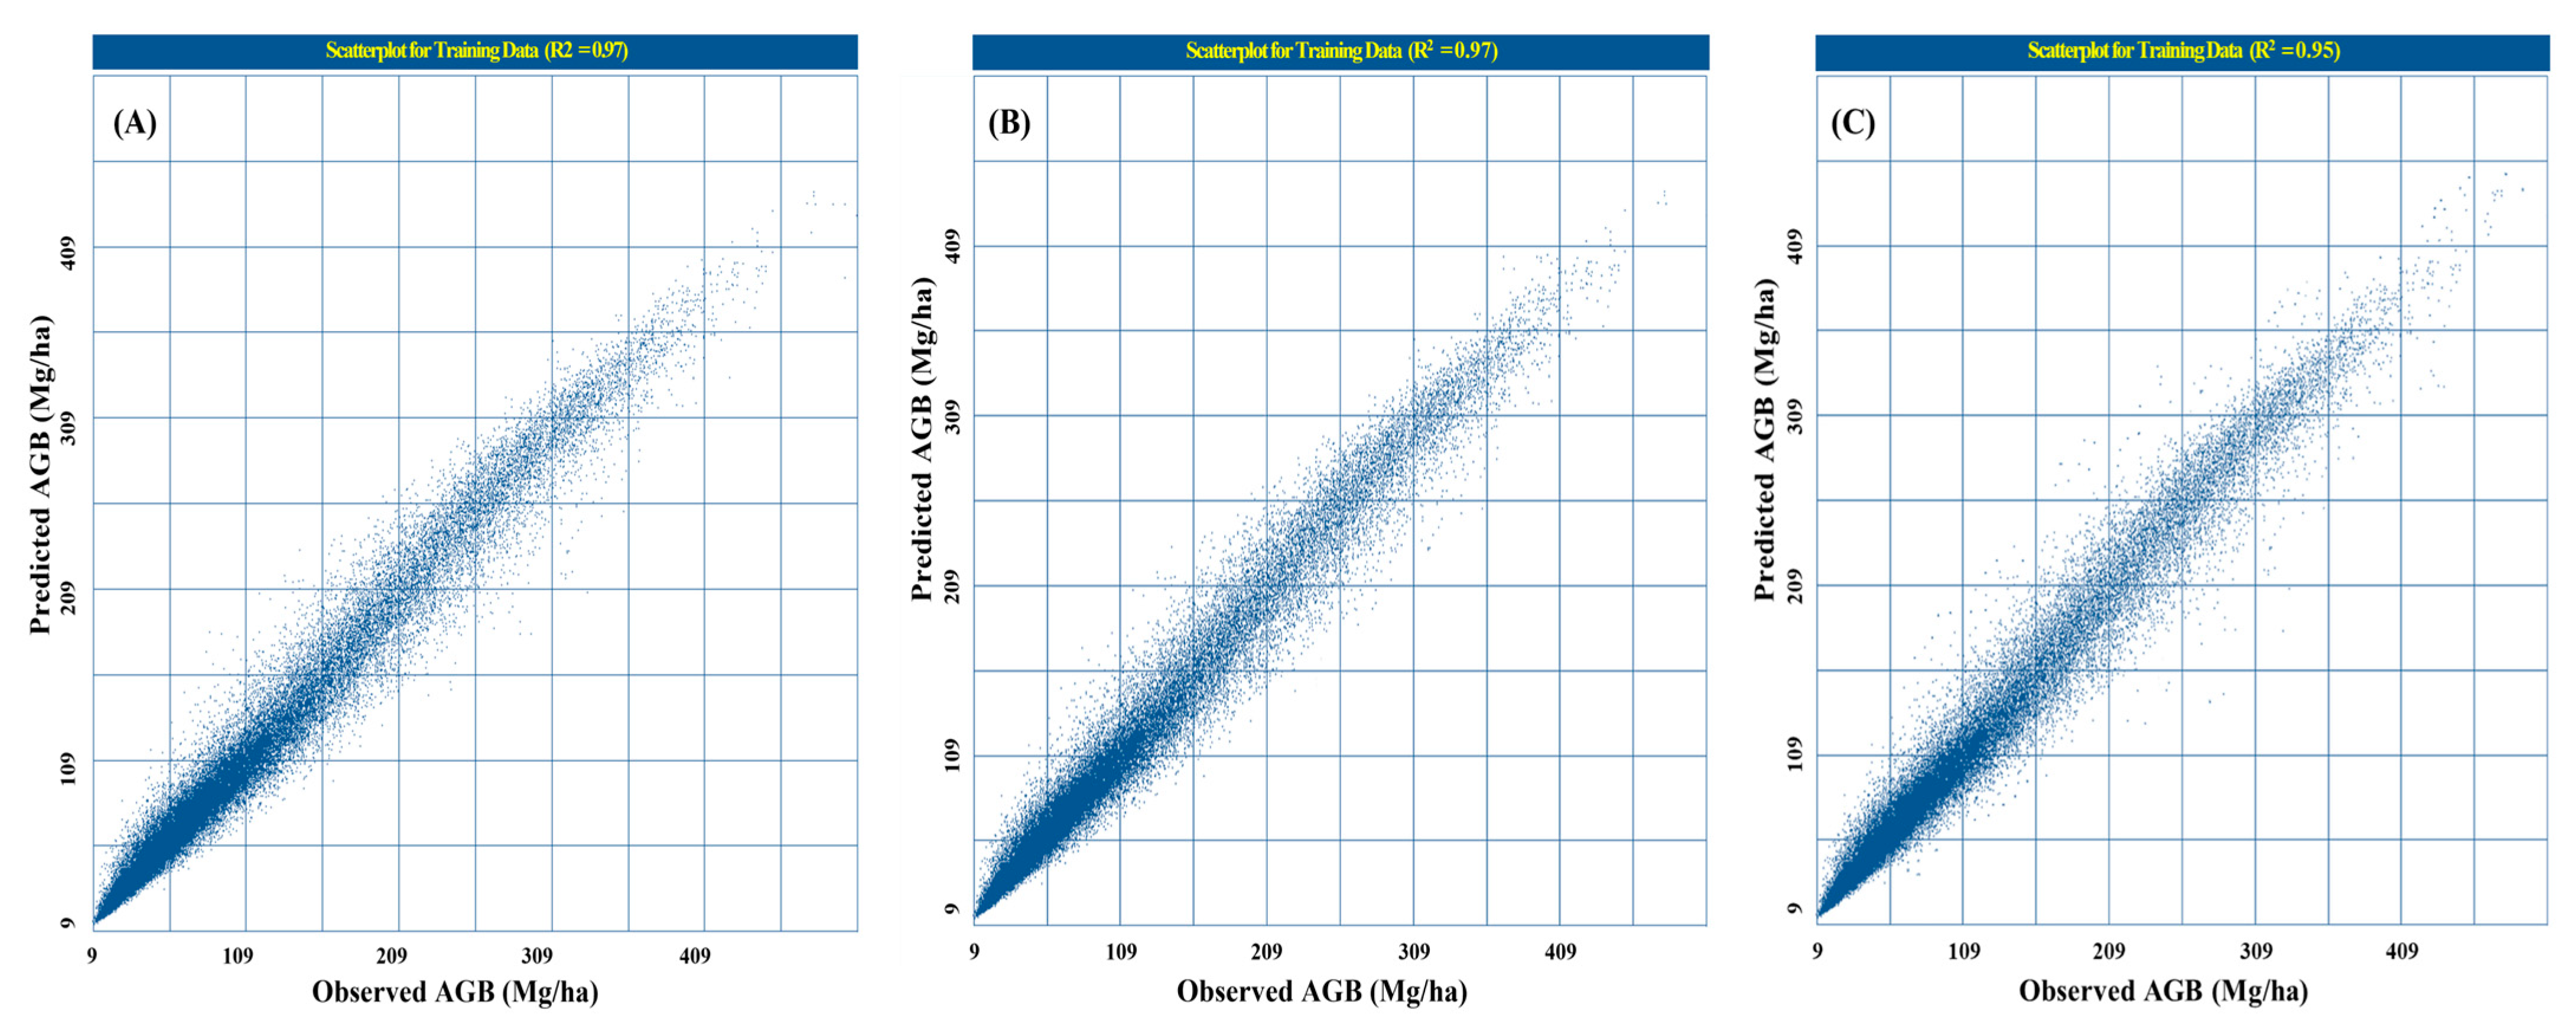
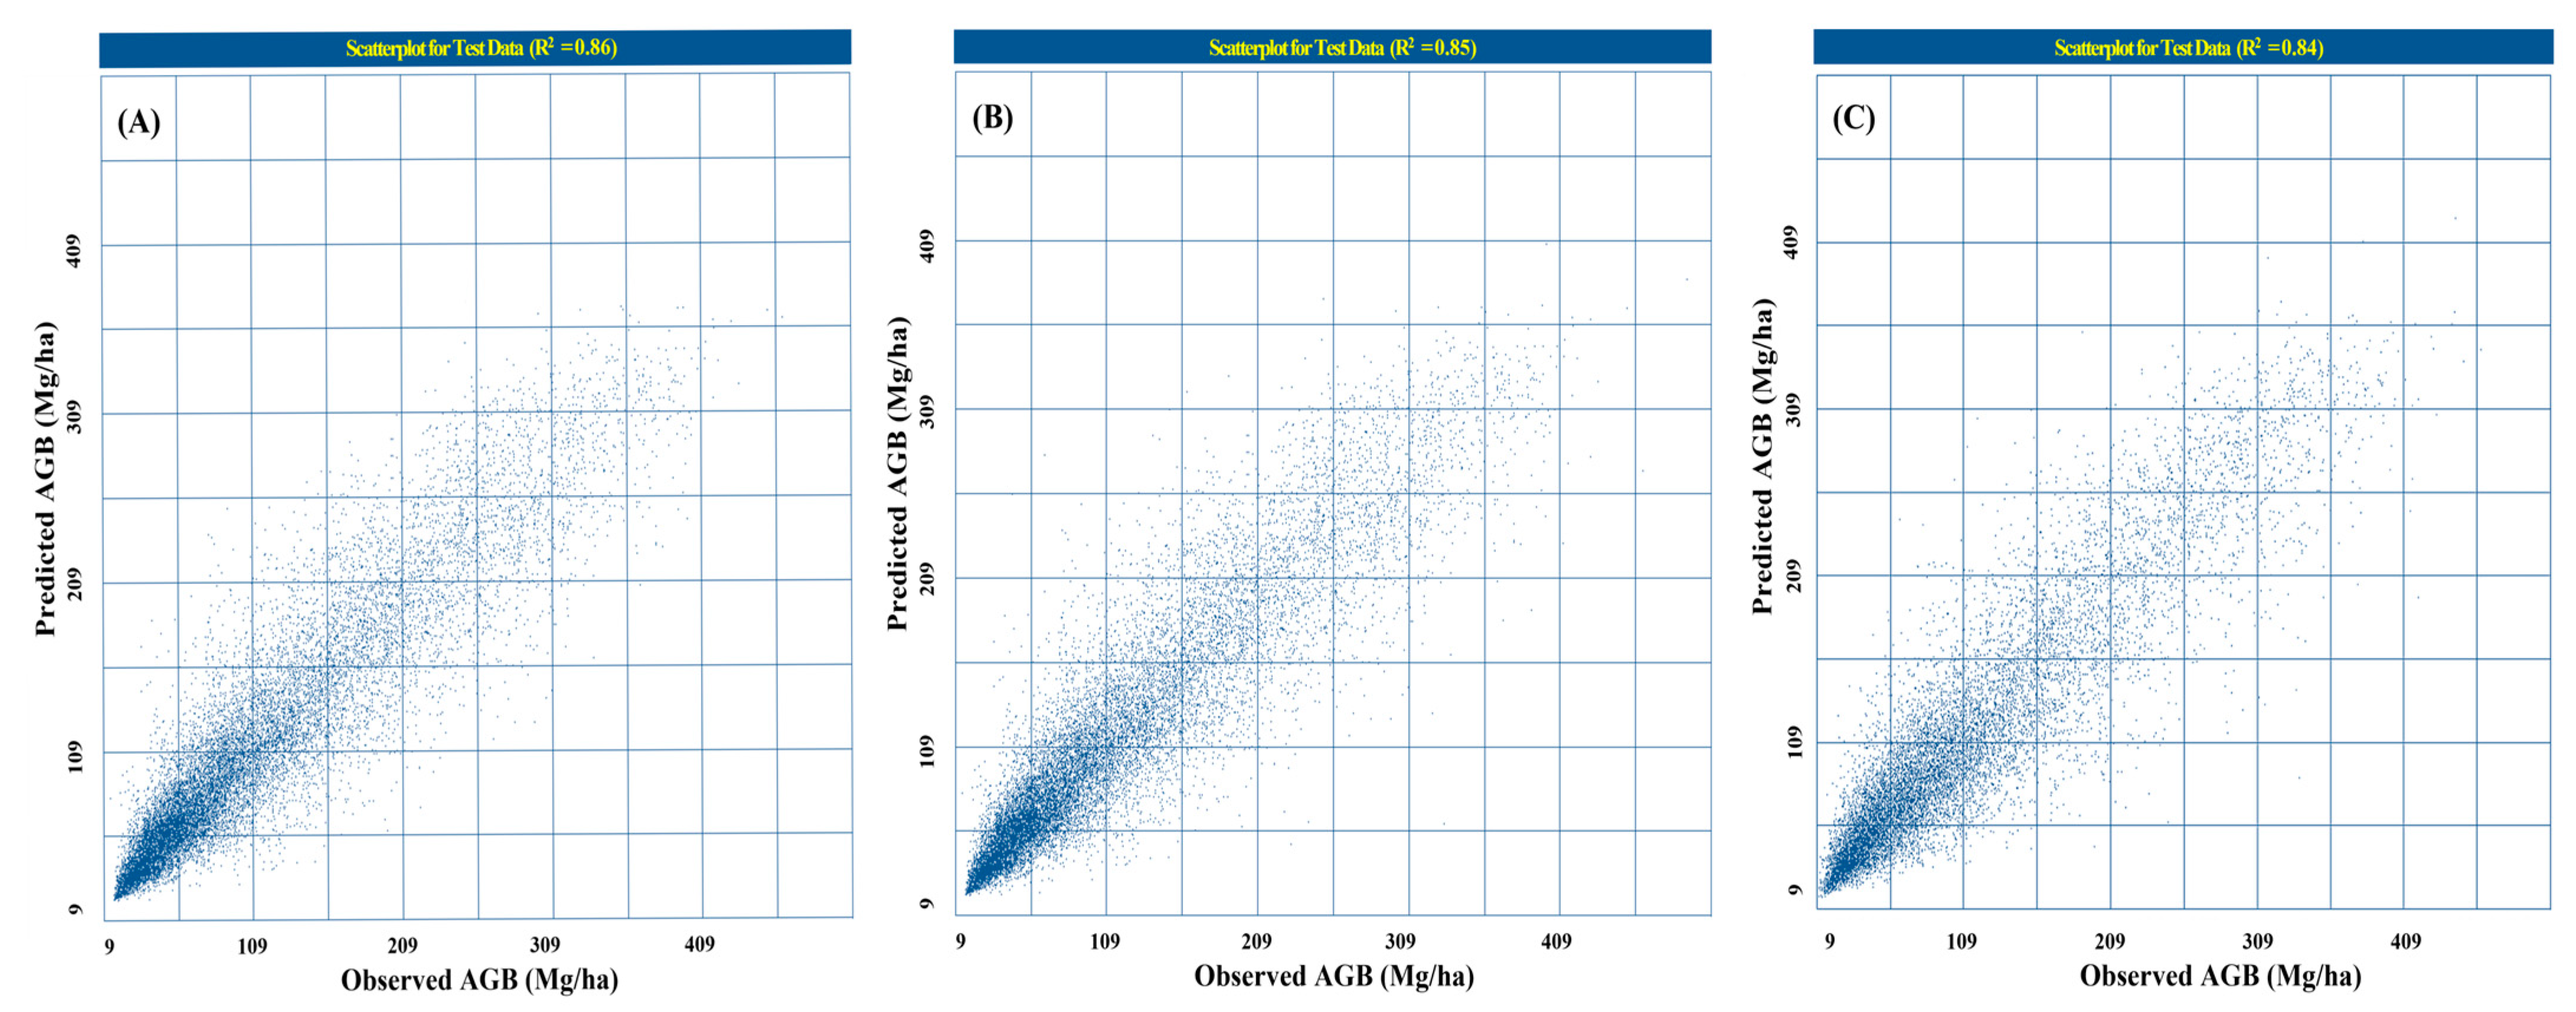
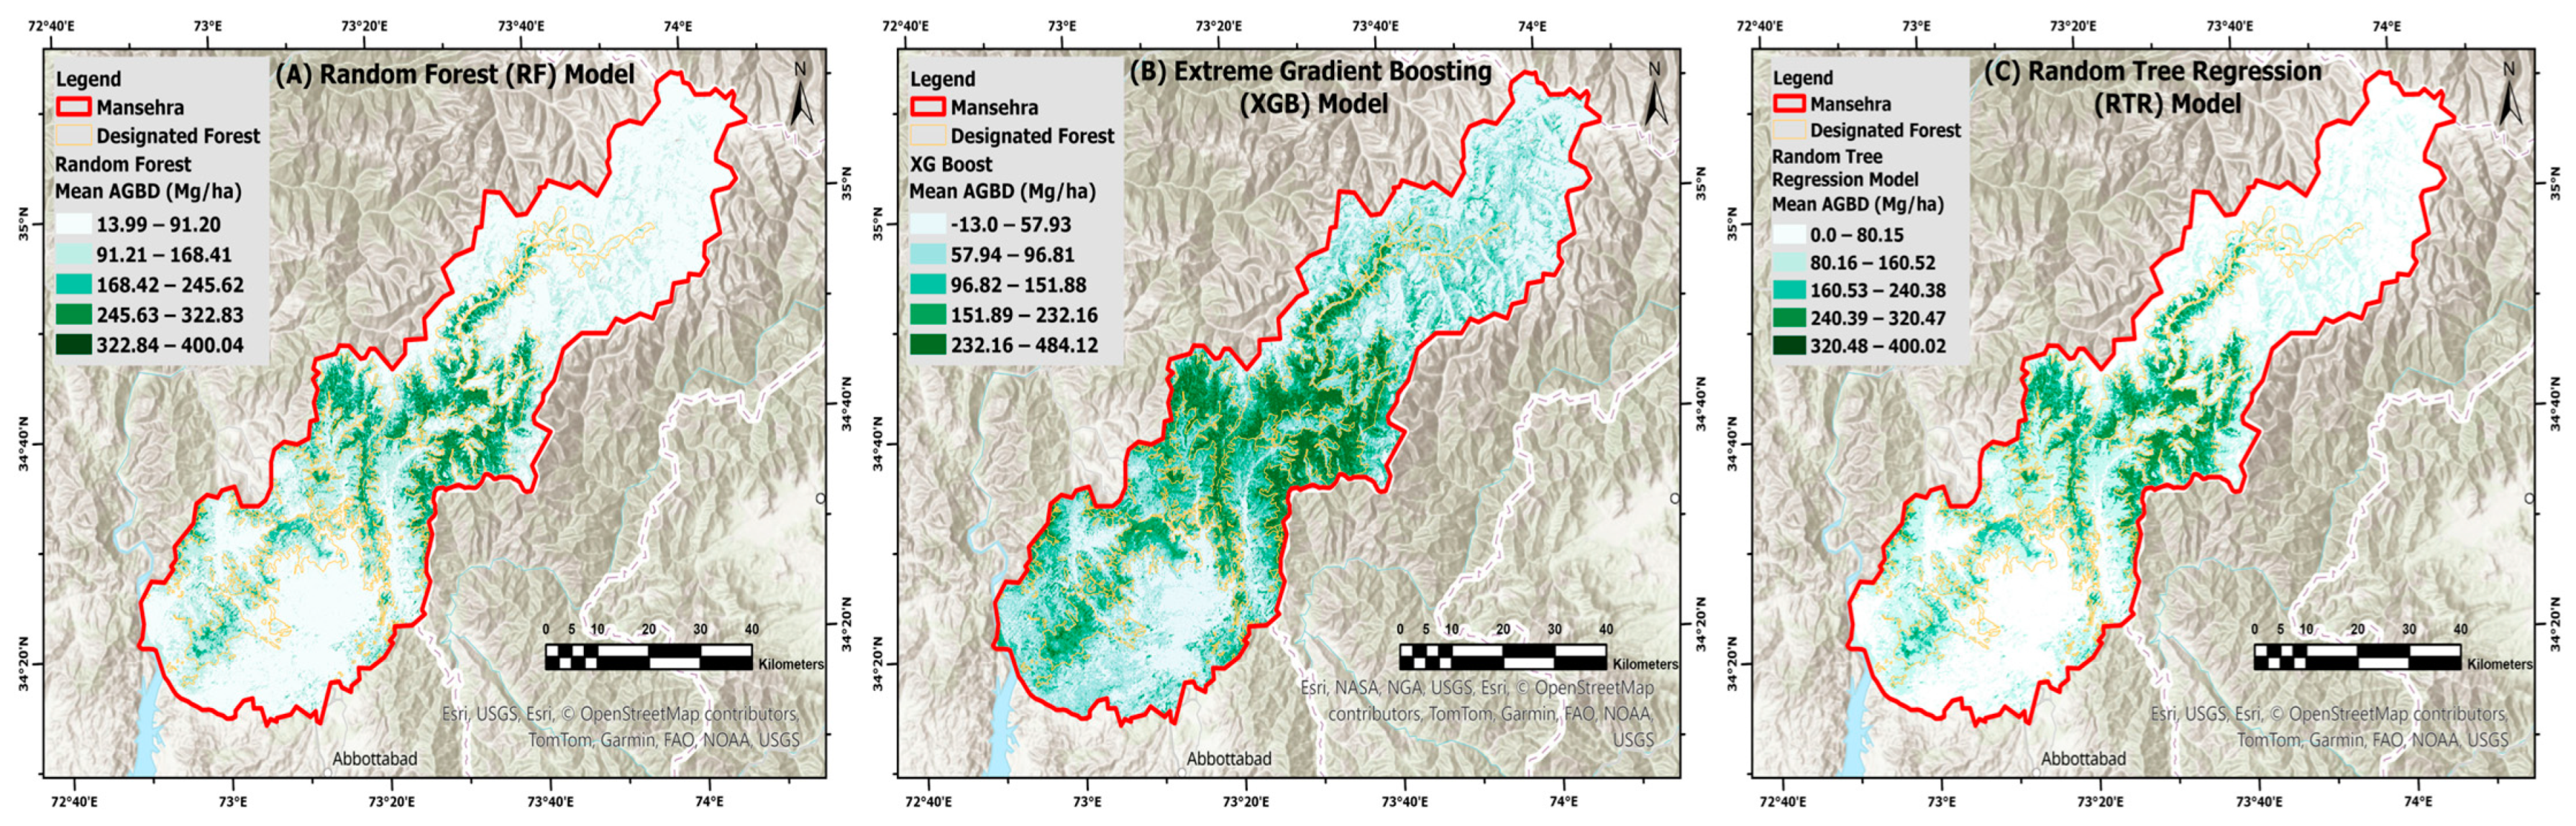
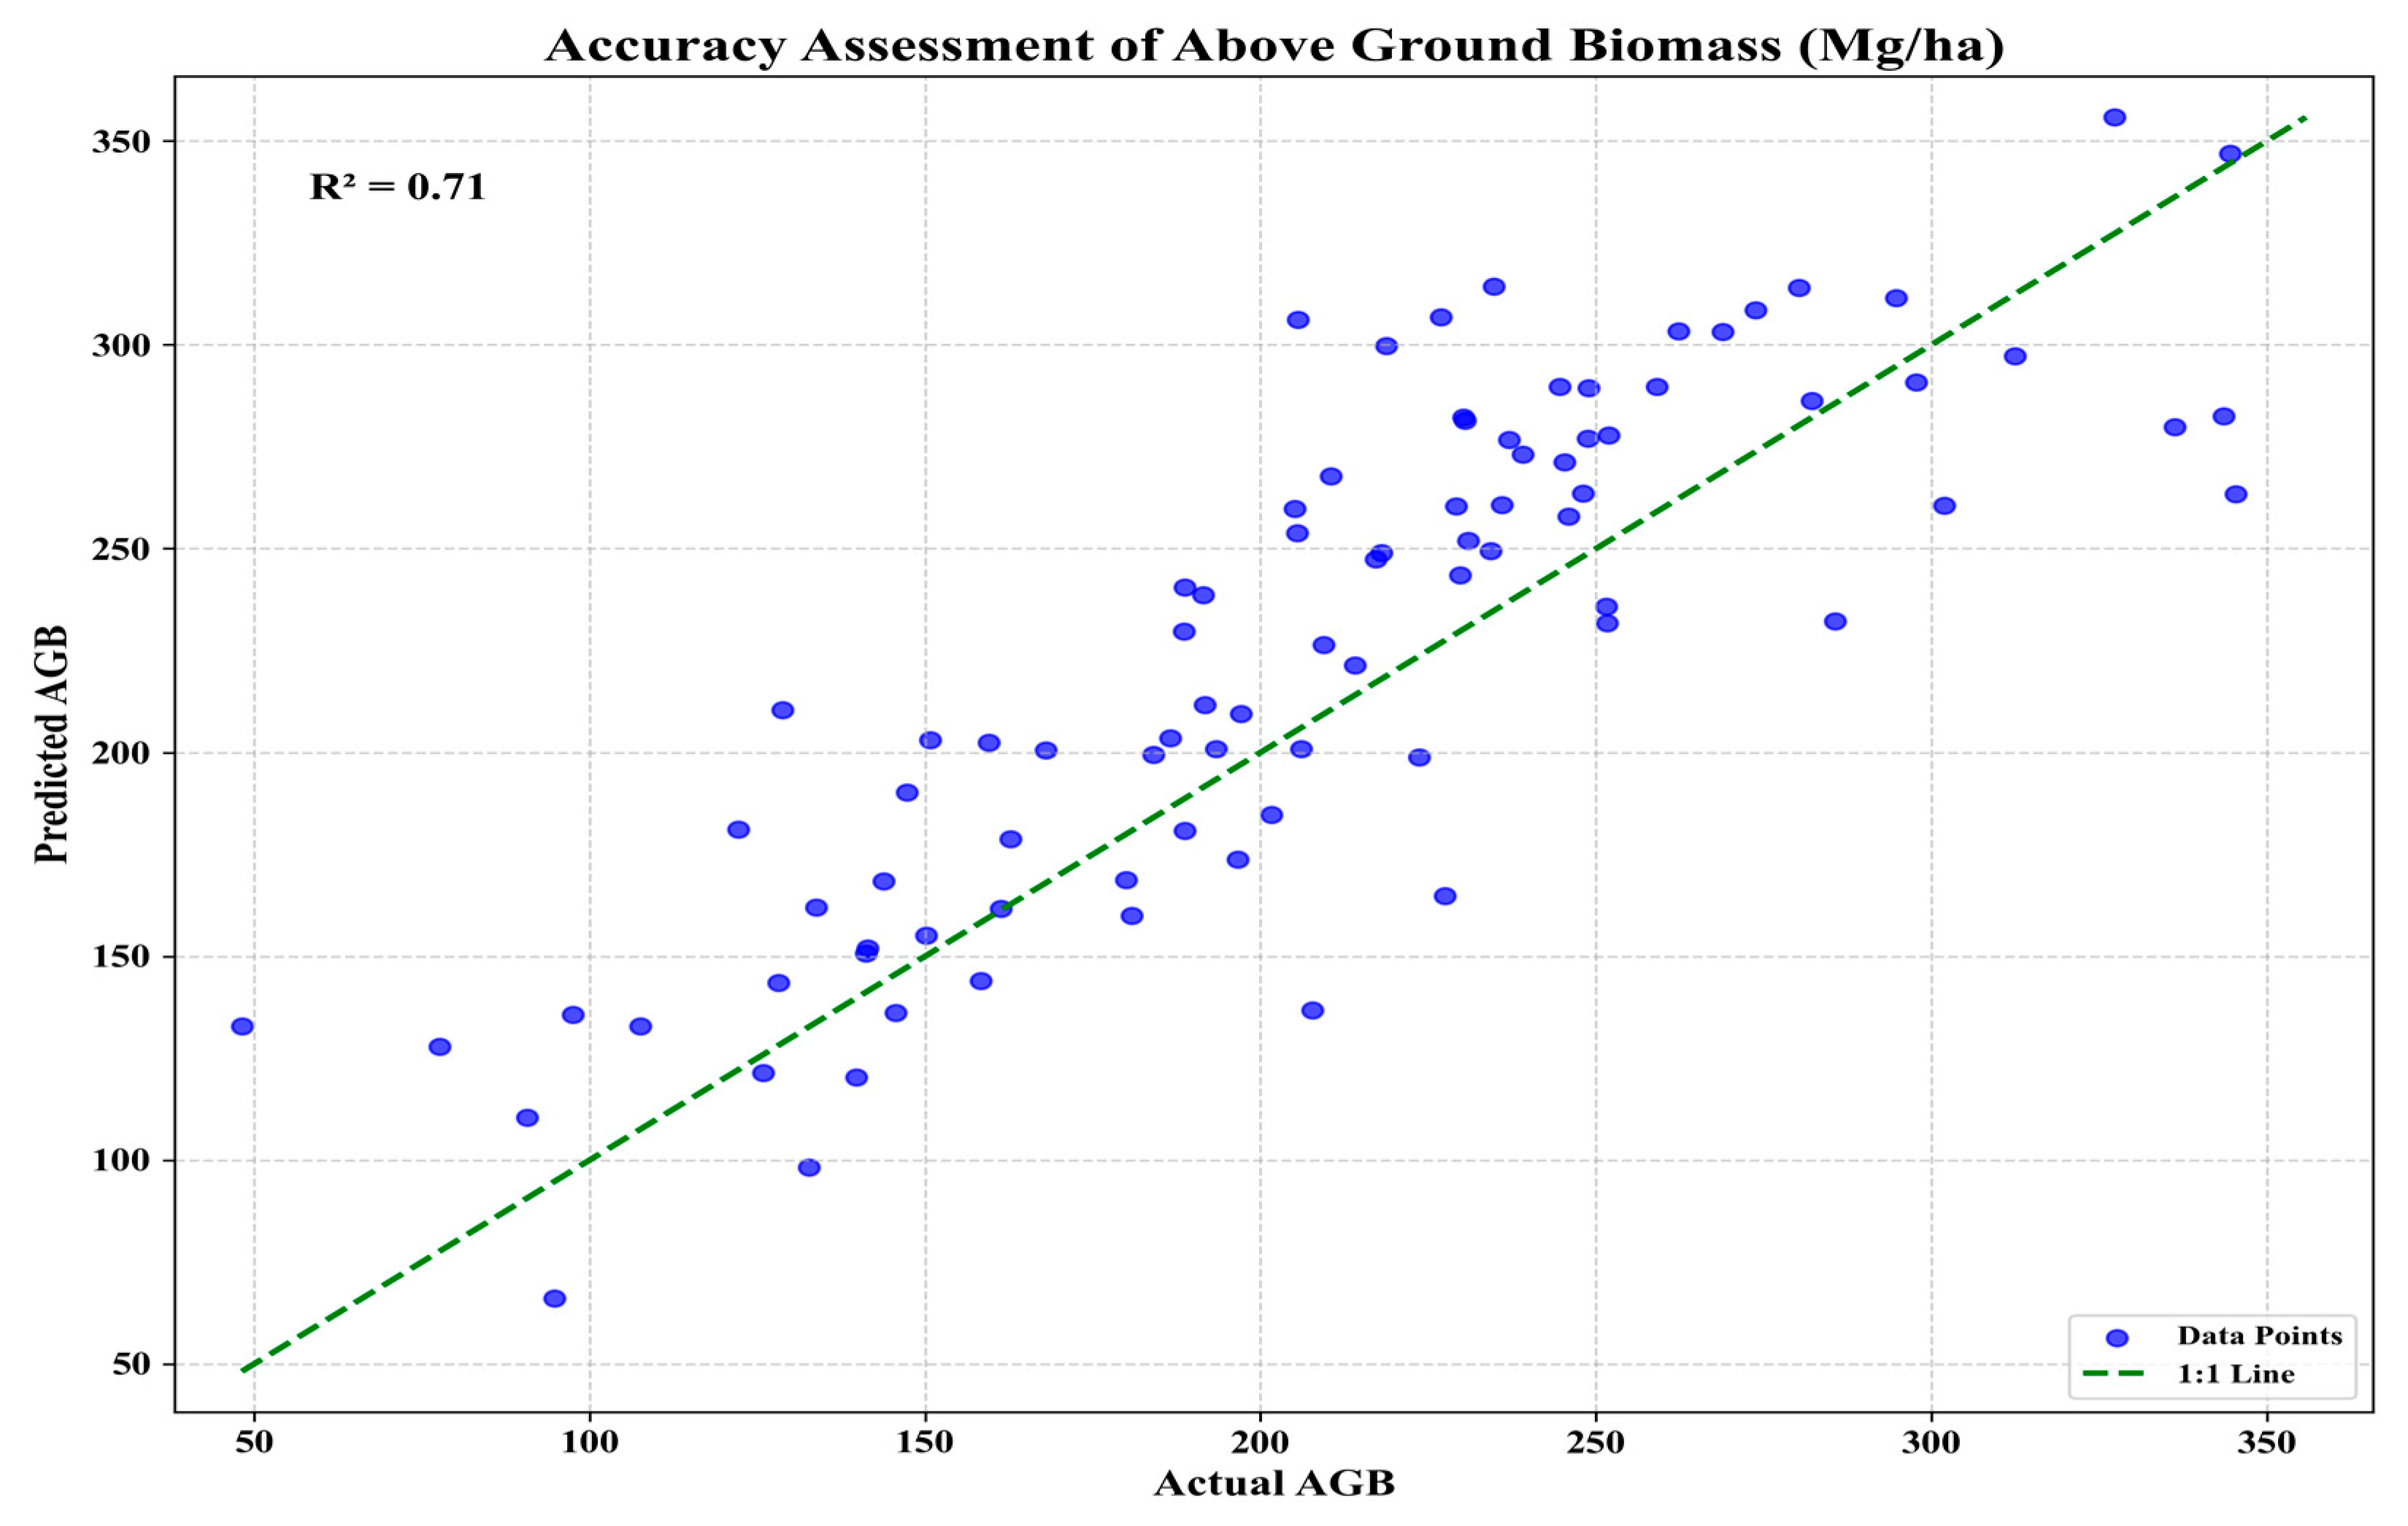
3.2. Model Selection and Accuracy Assessment

The scatter plots presented in Figure 8, corresponding to the three machine learning models, effectively depict the model’s performance for the training data. Figure 8 shows the scatter plots of the training data, with 8A for random forest (R2 = 0.97), 8B for random tree regression (R2 = 0.97), and 8C for the XGBoost (R2 = 0.95). The training data show a high correlation of R2 in the range of 0.97 to 0.95.
Meanwhile, the test data in Figure 9 show the scatter plots with 9A for random forest (R2 = 0.86), 9B for XGBoost (R2 = 0.85), and 9C for random tree regression (R2 = 0.84), underscoring the reliability and robustness of the random forest-trained model in predicting AGB based on given explanatory variables.
Table 3 presents the performance metrics of three machine learning models’ random forest, random tree regression, and XGBoost for estimating the above-ground biomass (AGB) in designated forests of the Mansehra Forest. All models accurately capture the relationship between input variables and above-ground biomass (AGB), ensuring high predictive accuracy, generalizability, and robustness with the best performance by the random forest model. The performance metrics of the three models are given in the table below.
A comparison of the machine learning algorithms in Figure 10 highlights the performance of the random forest, XGBoost, and random tree regression models. Among these, the random forest algorithm was selected as the best model for biomass estimation, with a high R2 of 0.86. This model effectively utilized explanatory variables to predict the AGB variations across the designated forests in Mansehra.
The AGB estimates were validated using field data from various forest compartments, where allometric equations, derived through destructive sampling, correlated the tree diameter and height for ground biomass estimation. The actual AGB was calculated from ground inventory points using circular nested plots and were compared with model predictions, ensuring an accurate evaluation of the model’s performance in estimating forest biomass. The predicted AGB value of 224.61 Mg/ha was 7.9% higher than the ground value of 208.13 Mg/ha, indicating a minor overestimation predicted by the proposed methodology using the GEDI L4A footprints. The validation results are encouraging, with a coefficient of determination (R2) of 0.71 (Figure 11), indicating the reliability of the estimates and a good relation between the actual and predicted values.
The mean AGB value for the entire designated forest was 189.42 Mg/ha, closely matching the ground biomass estimate of 180.93 Mg/ha for moist temperate forests, with a difference of only 5.2%. However, the point-to-point difference was higher at 7.9%, likely due to the scale differences and the heterogeneity in the point-level data. This highlights the trained random forest model’s superior, consistent, and accurate performance for generating mean-based estimates across the forest area.
Previous studies demonstrated similar overestimation tendencies in GEDI L4A data, especially for coniferous forests compared to broad-leaved forests [50]. They found that GEDI L4A AGB estimation was 8.94 times higher than ground data, primarily due to topographic variations within the footprint area distorting GEDI signals [51]. This underscores the challenges in AGB estimatation accuracy, which is influenced by the forest type and terrain complexity [52,53]. Despite these challenges, the integration of GEDI L4A and multisource data with machine learning models provides a robust approach for large-scale biomass estimation and carbon stock assessment [51].

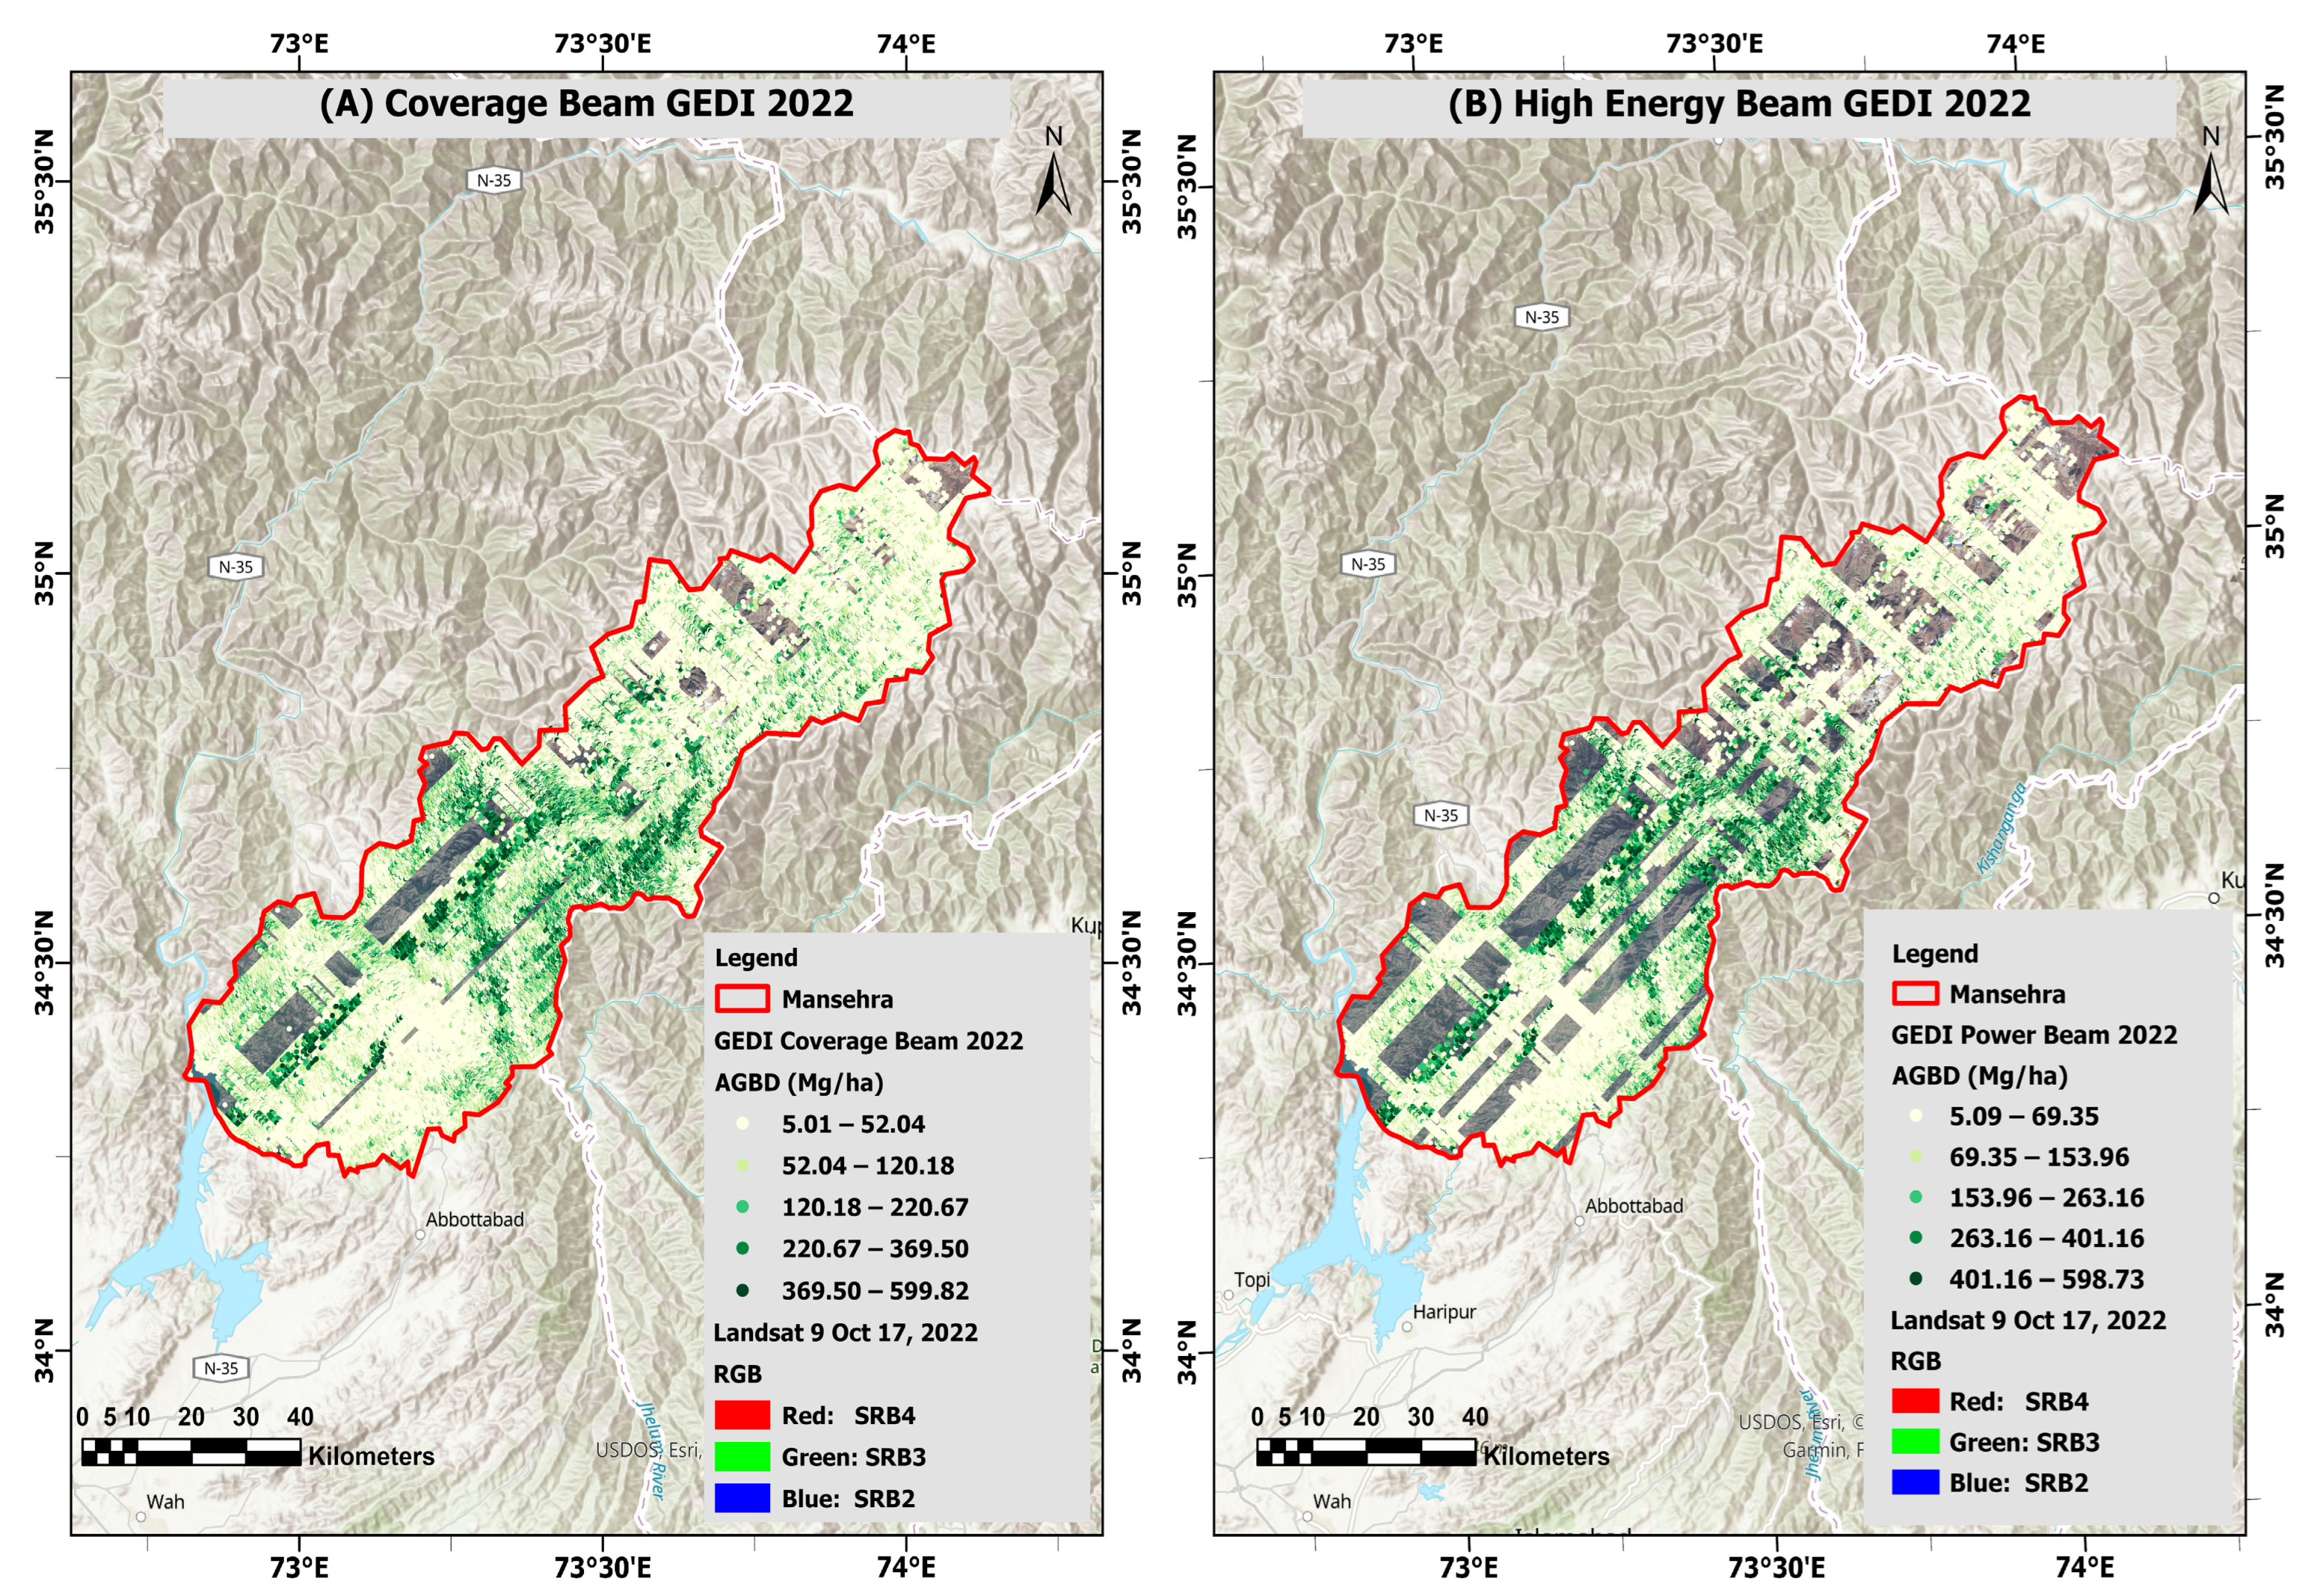
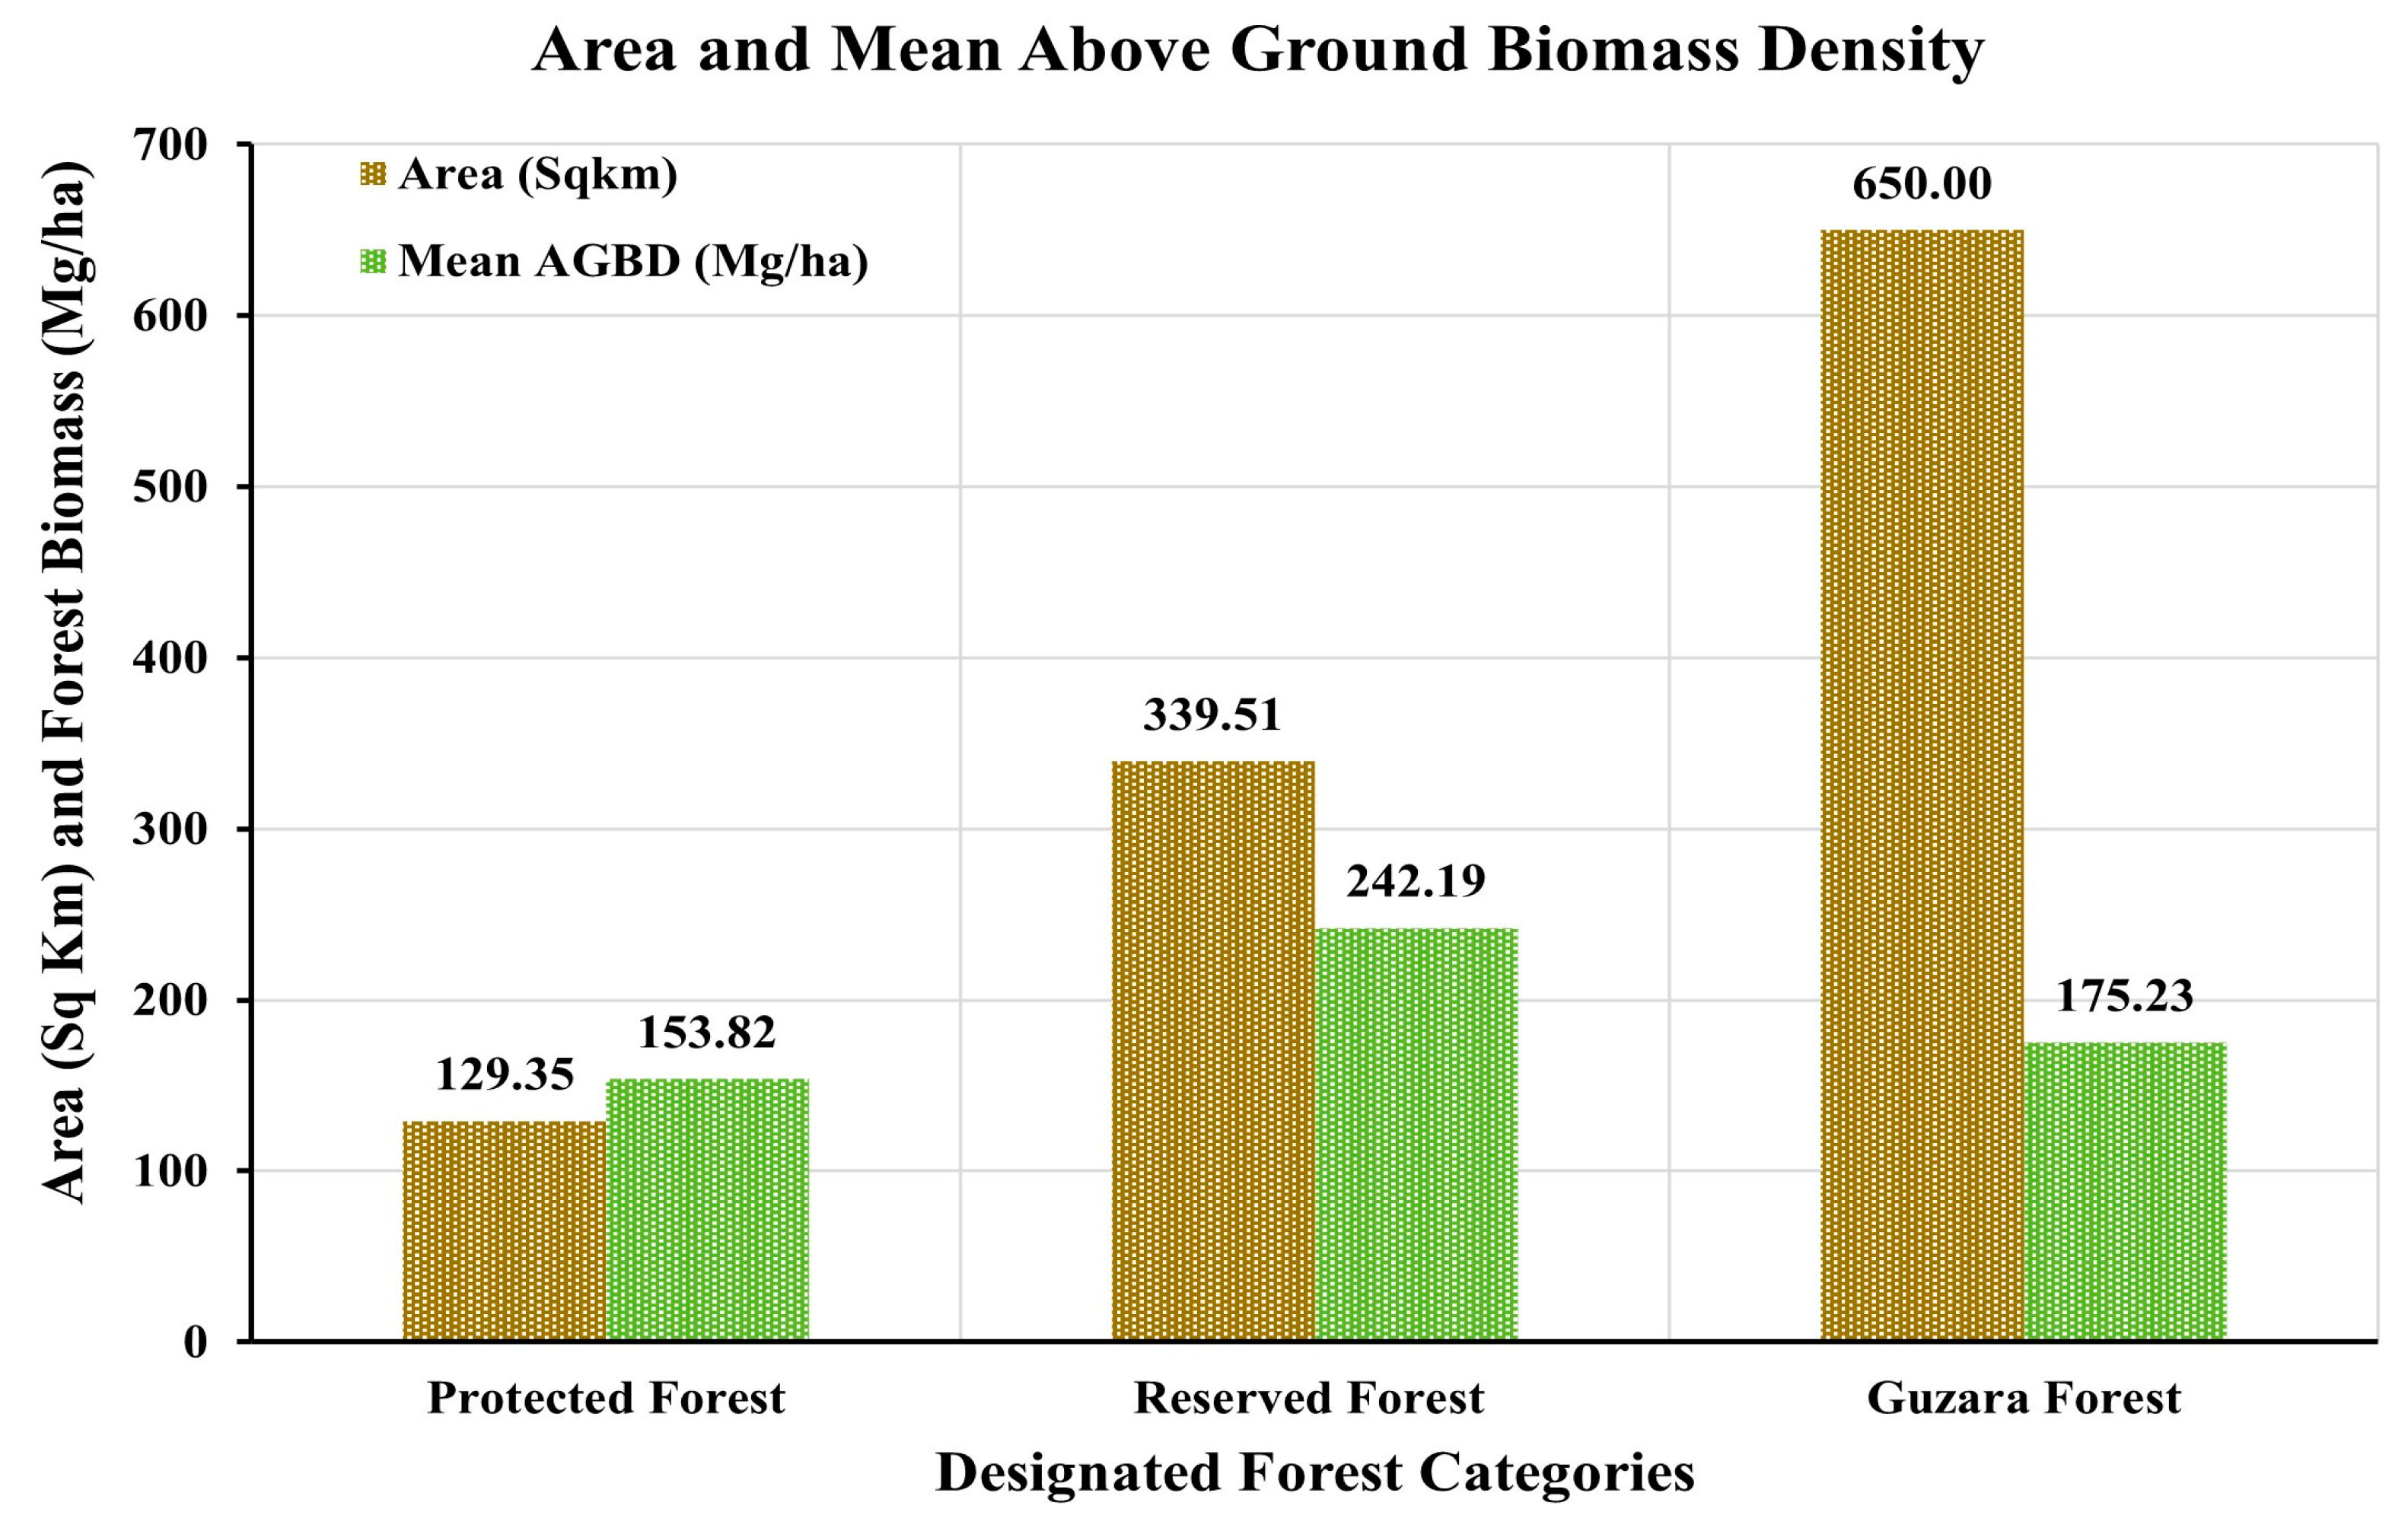
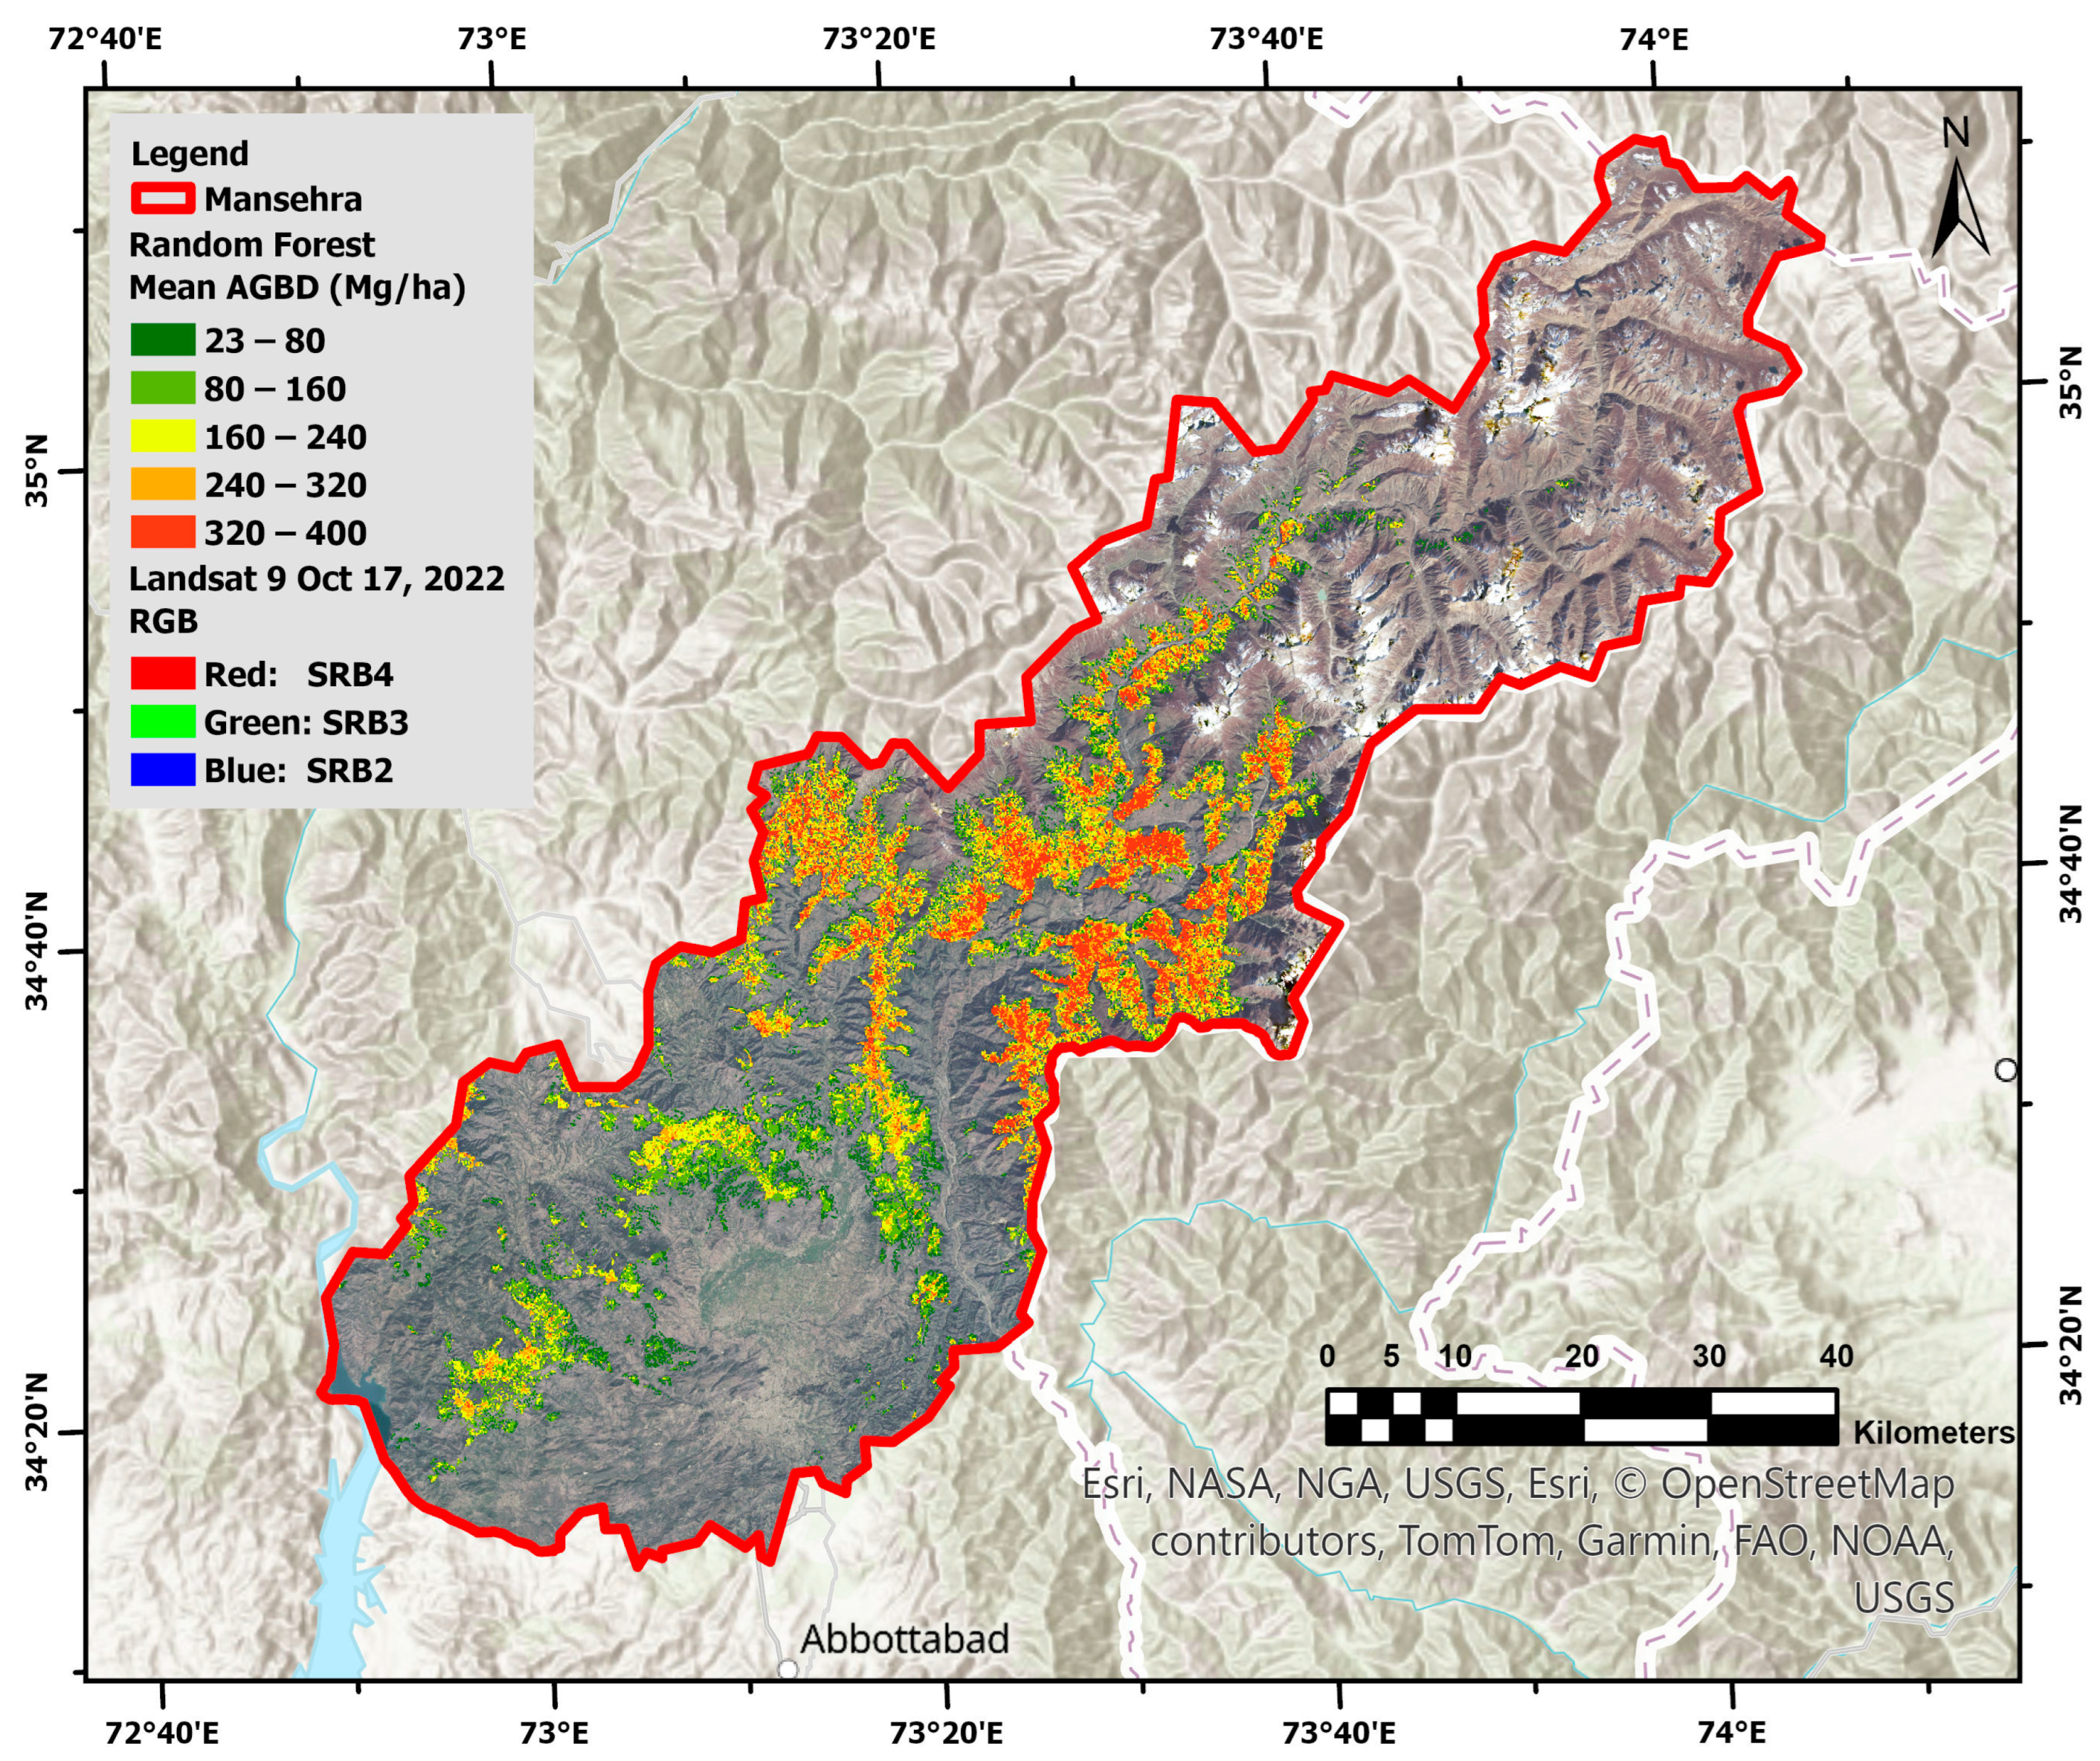
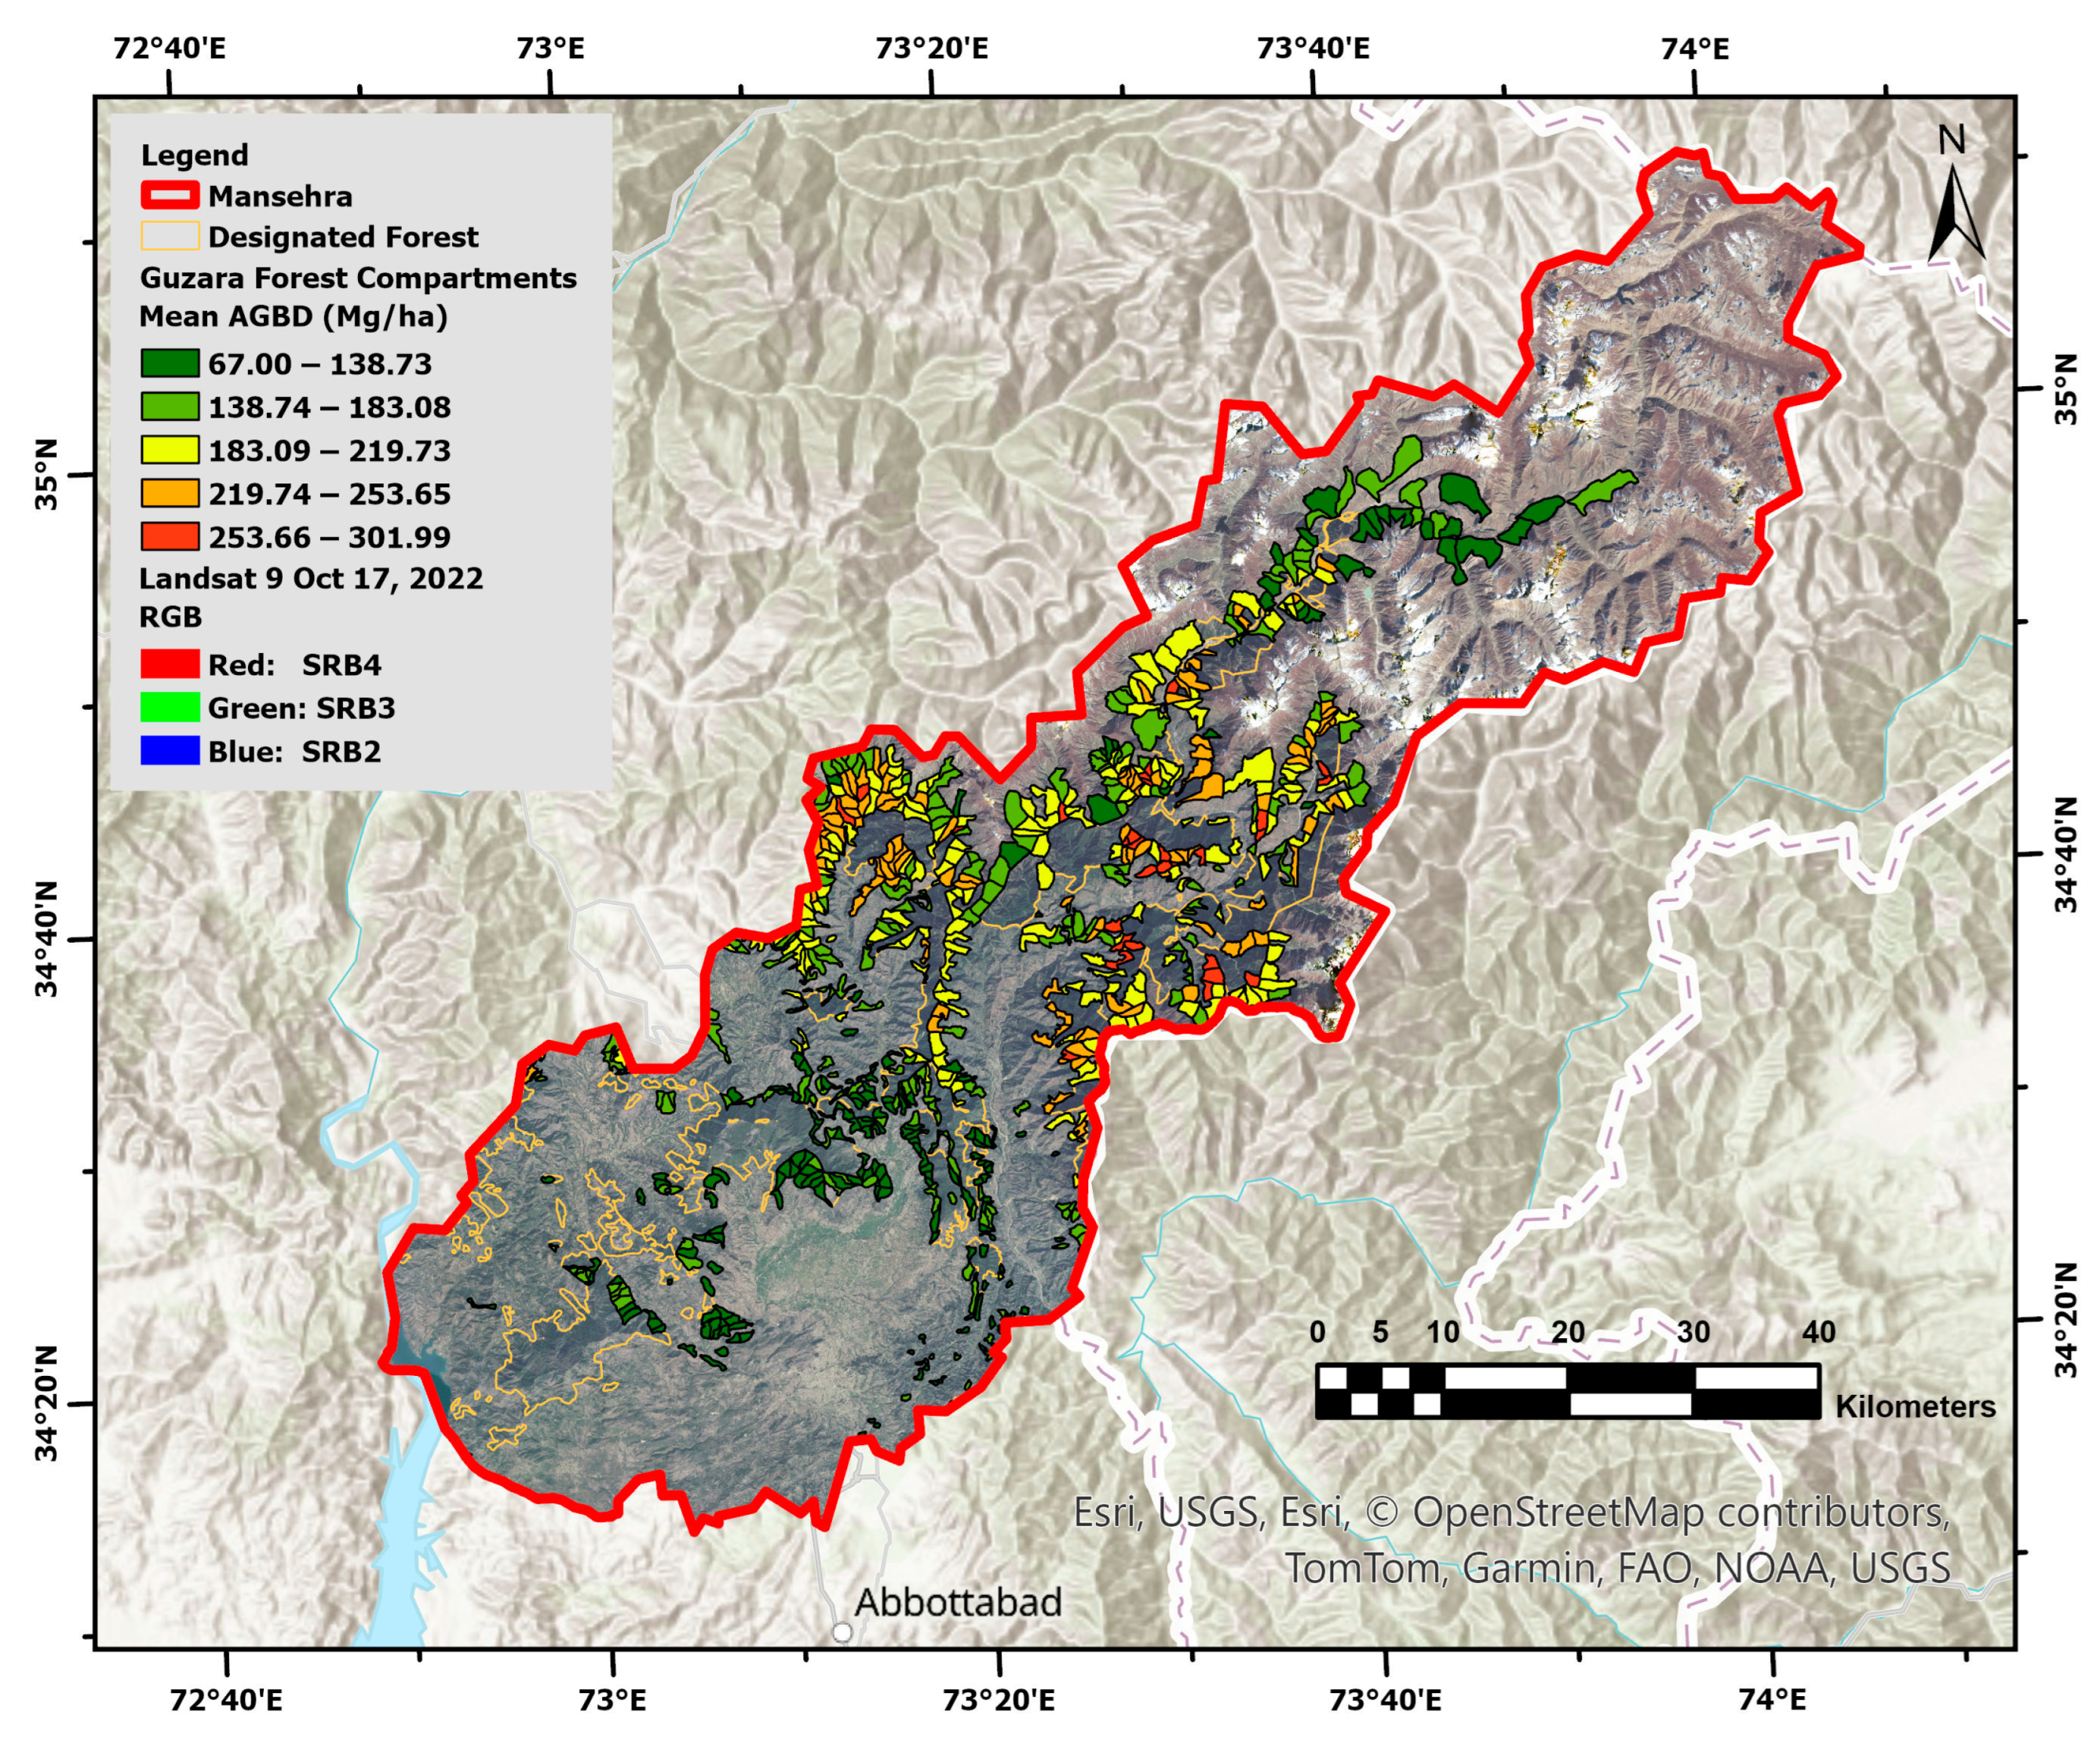
3.3. Above-Ground Biomass Distribution in Designated Forests

The distribution of AGB across protected, reserved, and community (guzara) forests provides valuable insights into carbon storage potentials. Figure 12 illustrates the carbon storage levels for protected, reserved, and guzara forests, highlighting the potential sites for future carbon storage strategies. The reserved forest exhibits the highest mean AGB of 242.19 Mg/ha, followed by the community forest at 175.23 Mg/ha. The protected forest, however, has the lowest mean AGB at 153.82 Mg/ha. These findings highlight the importance of developing biomass-specific yield strategies tailored to each forest management category’s ecological and environmental conditions. This approach aligns with the single-tree selection silviculture management system, which optimizes carbon capture and storage based on site-specific characteristics [54].
The analysis focused on a compartment-wise biomass estimation managed by the forest department, revealing a mean AGB density of 189.43 Mg/ha, ranging from 23 Mg/ha to 400 Mg/ha. This range indicates the heterogeneous distribution of forest densities across the designated forests. The forest biomass in the Mansehra district shows significant spatial heterogeneity, with values ranging from a lower bound of 23 Mg/ha to an upper bound of 400.04 Mg/ha, compared to an average of 189.43 Mg/ha, as highlighted in Figure 13.
The compartments with high biomass values were primarily situated in the upper reserved forest region. The biomass map highlights the variability in forest carbon accumulated across compartments, with an area of high biomass in the upper region depicted in orange and red shades. The random forest algorithm demonstrated its efficiency in accurately distinguishing compartments with high and low biomass densities.
Compartments are the smallest forest management units, having an area range of 200 to 250 hectares, with the highest forest biomass accumulation illustrated in Figure 14. The highest AGB value of 270.11 Mg/ha was observed in Diwan Bela, followed by Manna at 268.52 Mg/ha. These compartments fall under the reserved forest category, excluding Batsangra and Julgran. The Batsangra and Julgran compartments belong to community forests with forest biomass values of 239.36 and 238.52 Mg/ha, respectively.
The high AGB in reserved forests is due to stringent governmental restrictions on harvesting, grazing, and local community concessions. Similarly, the high AGB in community compartments, such as Batsangra and Julgran, can be attributed to the inaccessible location. The compartment-wise AGB estimates provide actionable insights for efficient decision-making to support sustainable departmental harvesting regimes.
The methodological reliability and model performance were visually interpreted with biomass estimation across compartments. Figure 15 captures the variations in forest biomass, with the low-biomass compartments visually consistent with the area of sparse forest cover.
The geospatial insights from the biomass maps will guide critical site selection for afforestation and species regeneration campaigns, timber harvesting, fuelwood regulation, and biodiversity conservation in vulnerable areas. Figure 16 visually interprets the upper bound biomass values in compartments with a dense forest cover, offering a valuable framework for developing conservation strategies and prioritizing sustainability efforts.

3.3.1. Reserved Forests

The state-owned reserved forests are managed under three working plan units: Kaghan, Lower Siran and Agror, and Upper Siran Reserved Forests. These units operate under “Working Plan”, which are strategic documents outlining forest management practices over 5 to 10 years to estimate forest yields, restore degraded ecosystems, and ensure continuity in policies and actions. Each “Working Circle”, a subdivision of the forests, follows a specific aim and silvicultural system, as outlined in the working plan.
The AGB distribution in reserved forests exhibits a histogram with a leftward skew, indicating a high mean AGB value of 242 Mg/ha. Diverse management practices within working circles contribute to variations in biomass and ecosystem conditions. The lower mean AGB values indicate reduced vegetation coverage in the lower Siran and Agror reserved working plan units (Figure 17). These observations emphasize the importance of continuous monitoring and spatial heterogeneity analysis to maintain existing carbon storage areas, conserve biodiversity, balance harvest and regrowth, restore degraded sites, and avoid land-use conversion practices.
High-AGB compartments are primarily located at higher altitudes, requiring robust management to mitigate erosion and landslide impacts on steep and vulnerable terrains. The histograms in Figure 18 illustrate the frequency distribution of the average AGB values across five working circles, with a normal distribution curve highlighting a high mean AGB value of 242 Mg/ha in the commercial working circle for the timber harvesting rotation patterns. In contrast, the improvement and conversion working circles have lower mean AGB values of 164 and 176 Mg/ha, respectively, reflecting the activities relevant to recovery and restoration. Thus, data-driven biomass estimation supports reliable yield-harvesting practices.
The mean AGB values in reserved forest compartments, ranging from 67 Mg/ha to 300 Mg/ha (Figure 19), underscore the impact of harvesting restrictions and local community concessions on biomass levels. Compartments with high biomass, typically in mature forest stands, represent valuable sites for future management and conservation strategies.

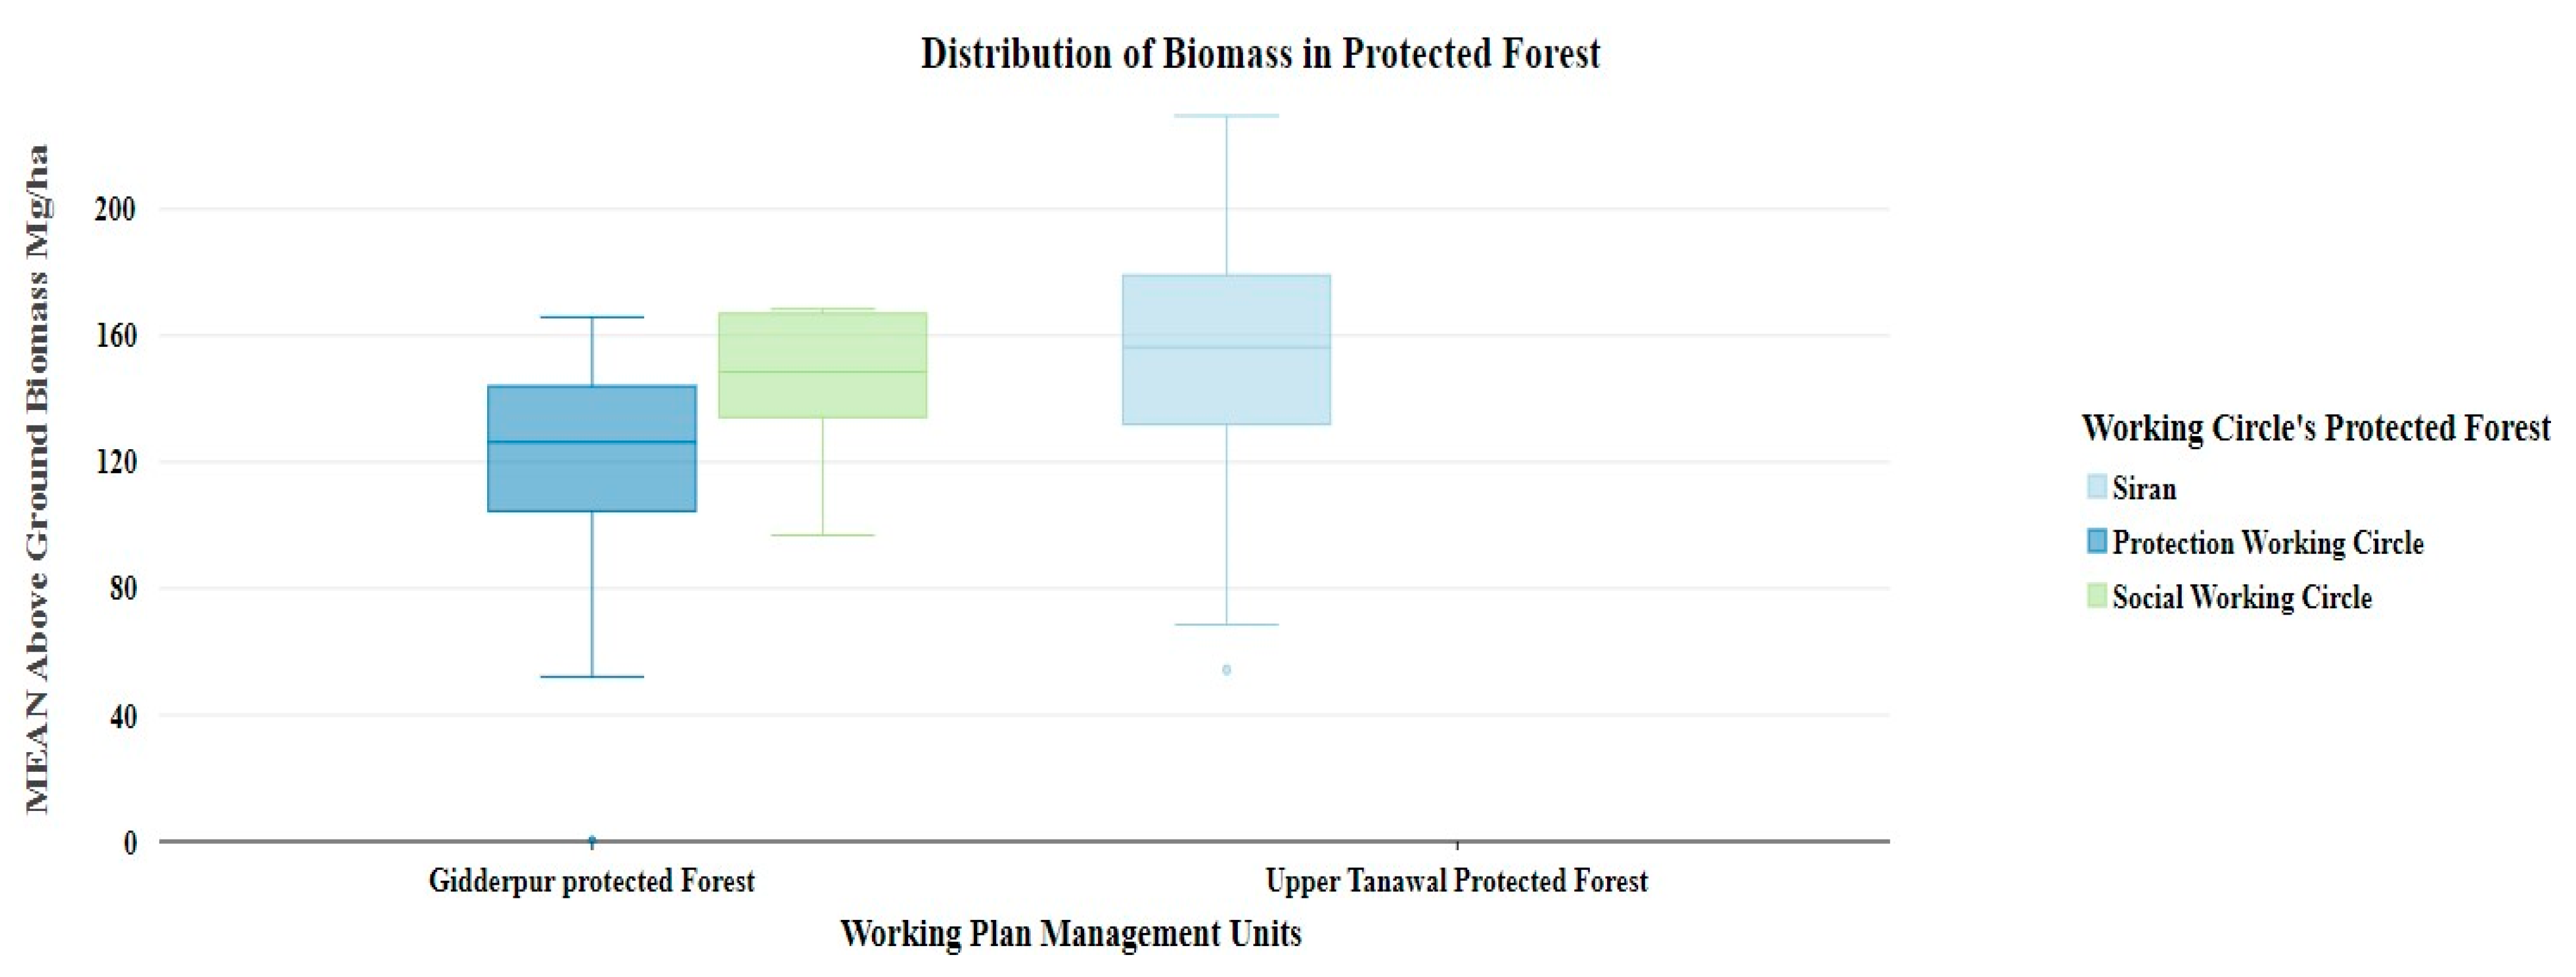
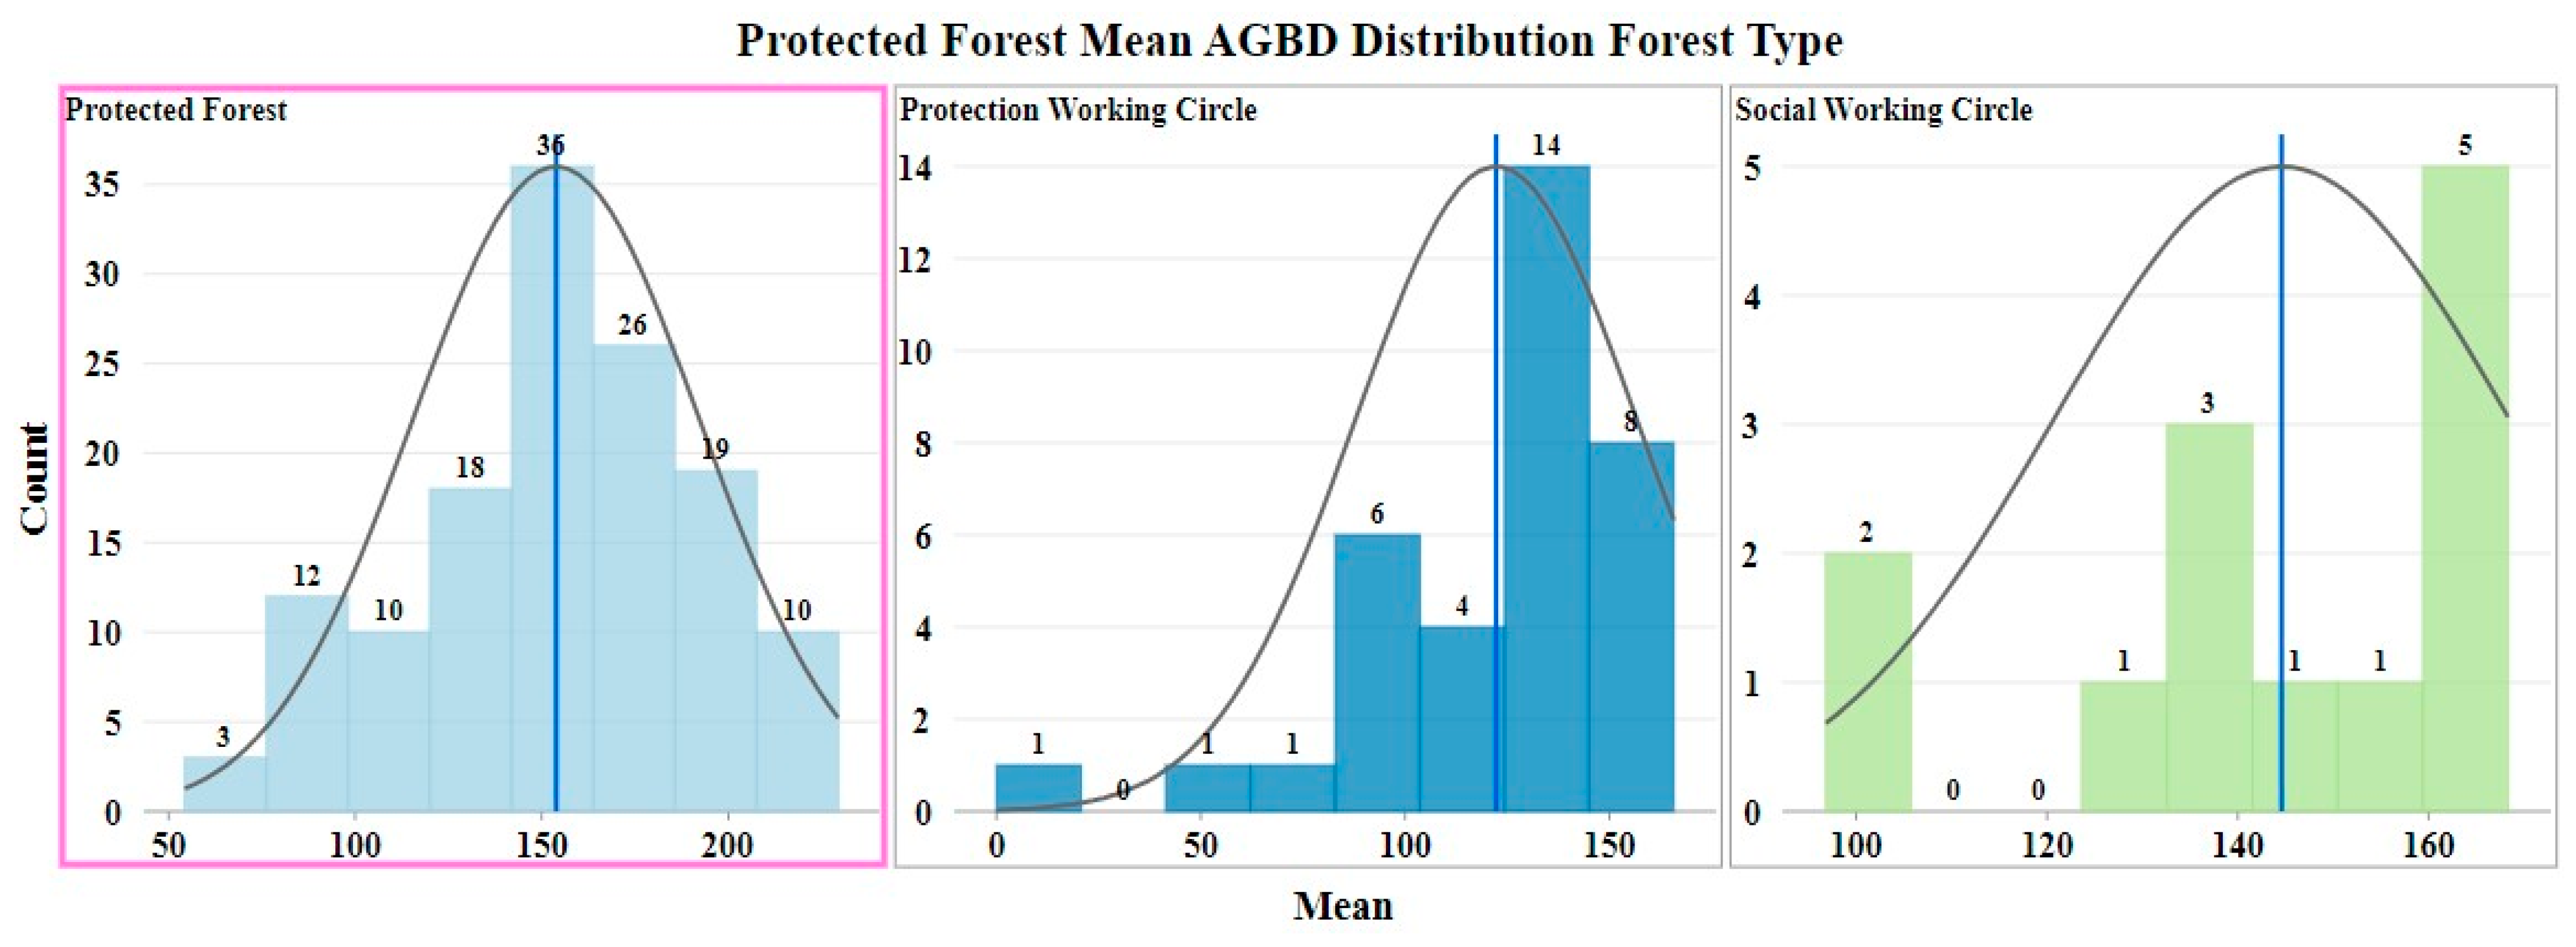
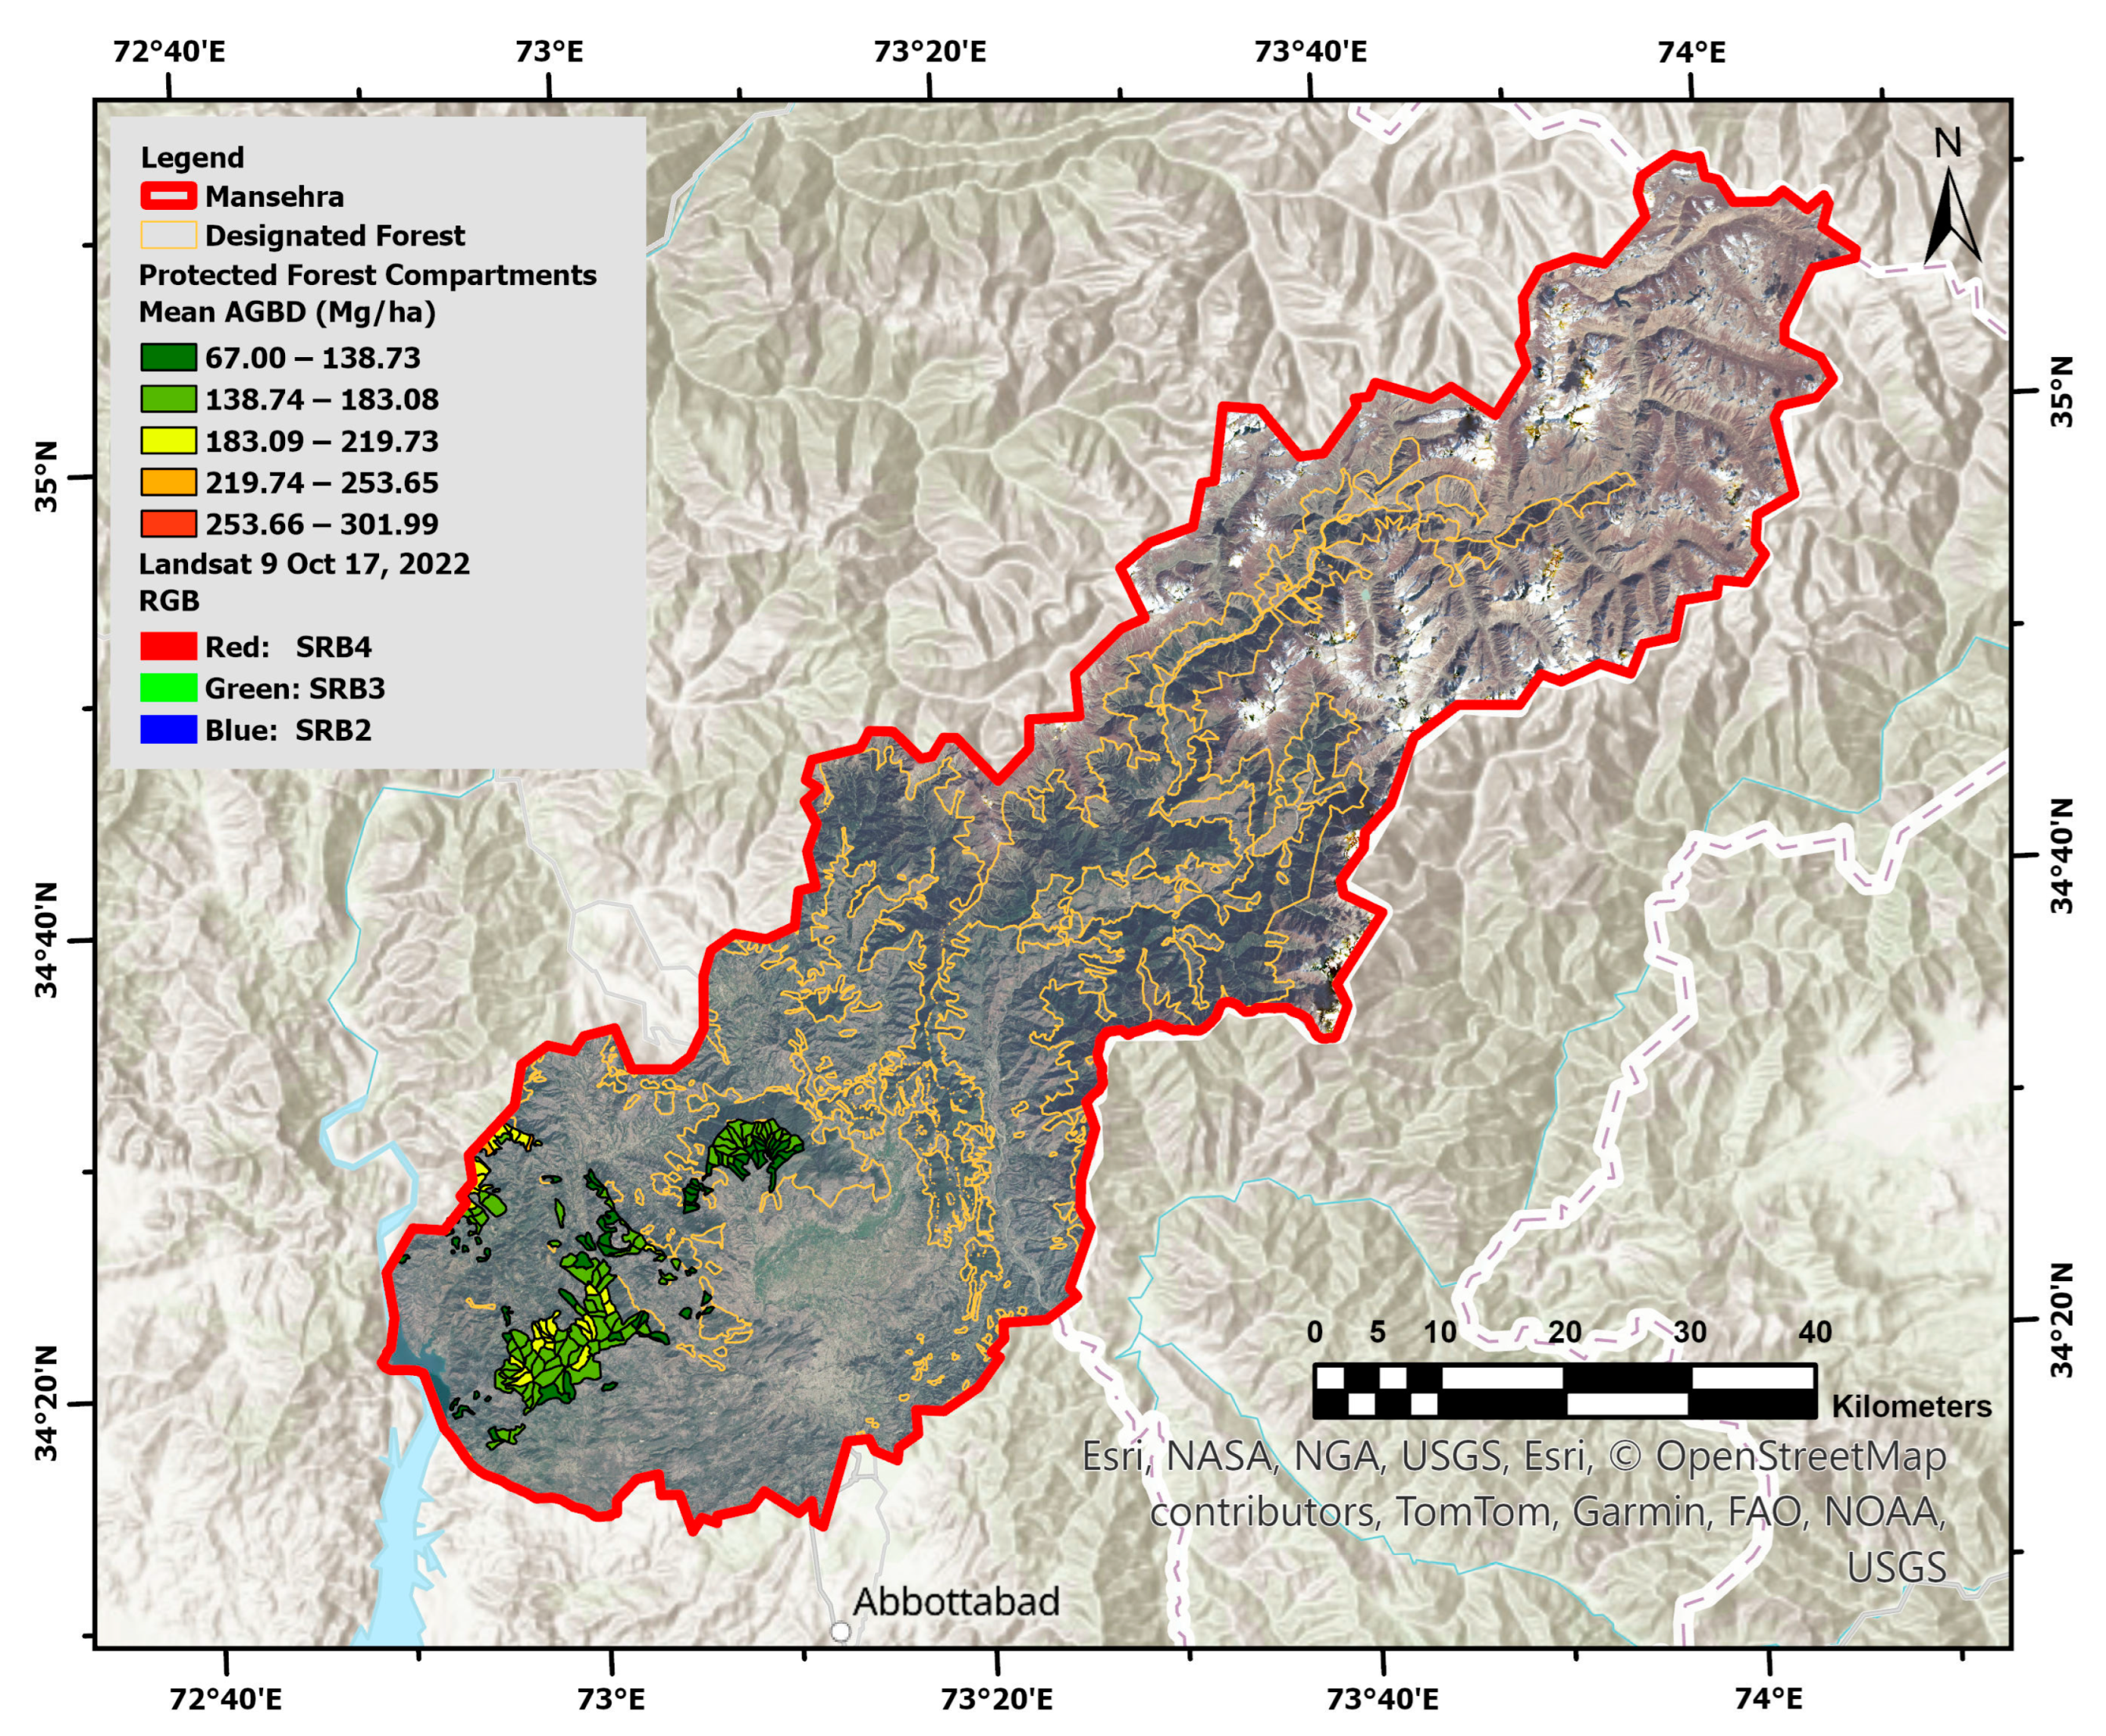
3.3.2. Protected Forests

Protected forests, where local communities exercise government-permitted rights and concessions, exhibit a mean AGB value of 154 Mg/ha, with several compartments characterized by low biomass. These forests provide non-commercial timber, fuelwood, and fodder for local livestock. Managed under protection and social working circles, these compartments emphasize the recovery of under-stocked patches and optimized silvicultural practices.
The Gidderpur working plan management unit shows a particularly low mean AGB value of 122 Mg/ha (Figure 20). These accessible compartments face significant pressure from local compartments. Strengthening forest surveillance; fire management practices; and the promotion of alternative renewable energy sources, such as biogas and solar power, are recommended to alleviate the over-extraction of forest resources. Furthermore, controlling illegal timber harvesting and encroachments is an essential measure towards sustainable carbon storage management.
Protected forests are managed under two working circles: protection and social. Biomass levels in the protection working circle are lower than those in the social working circle, as illustrated by the histogram in Figure 21, where high values of 144 Mg/ha are concentrated in the social working circle.
Protected forests’ relatively low AGB density highlights their suitability for future carbon sequestration projects managed under programs like REDD+. Identifying and mapping critical biodiversity hotspots in these ecosystems can align to foster a balanced approach for carbon sequestration goals with conservation priorities. The spatial distribution of AGB in the protected forest, as shown in Figure 22, ranges from 67 Mg/ha to 220 Mg/ha, highlighting the potential sites that support national and global carbon offset initiatives. These strategies can simultaneously benefit local communities and contribute to soil and water conservation efforts integral to sustainable carbon management.

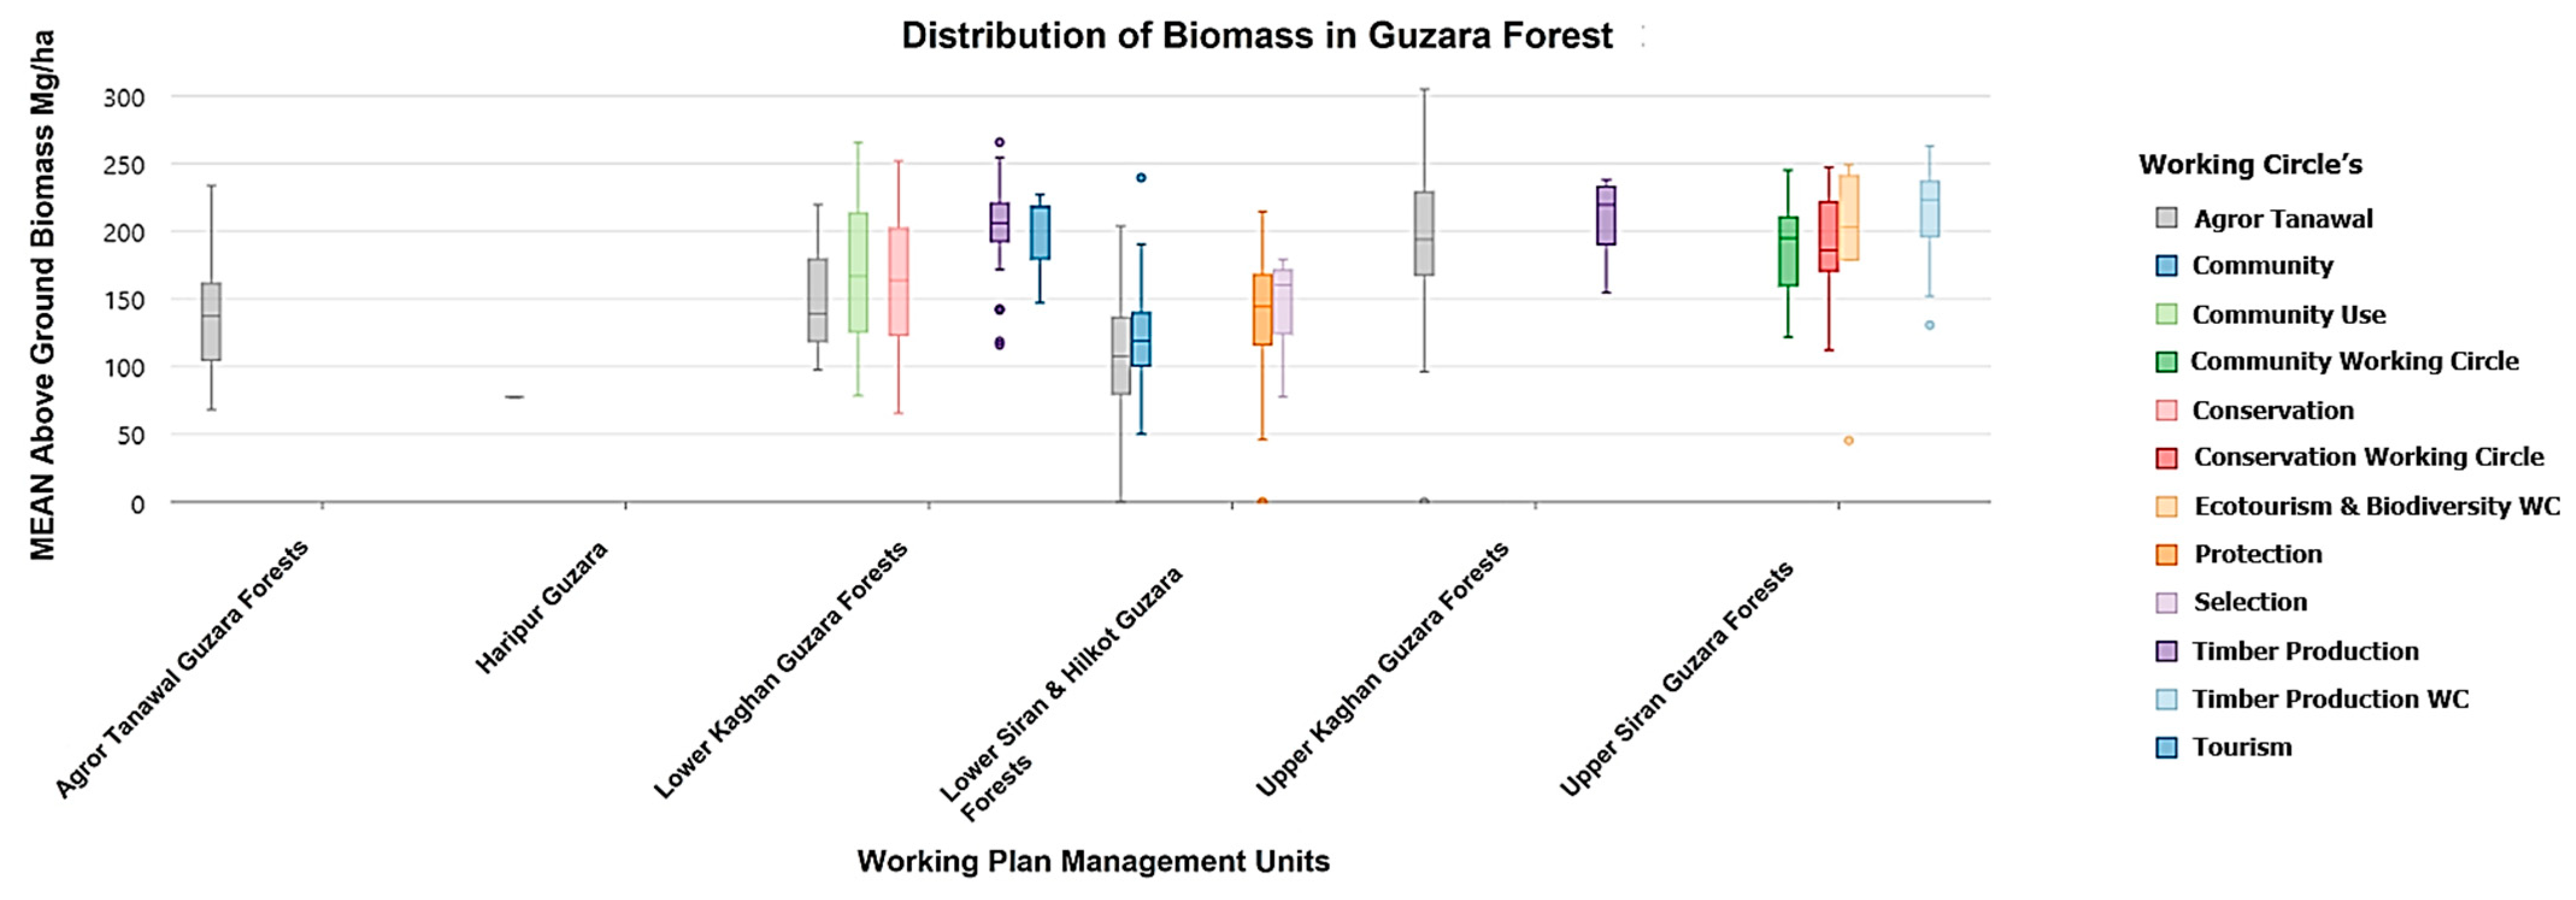
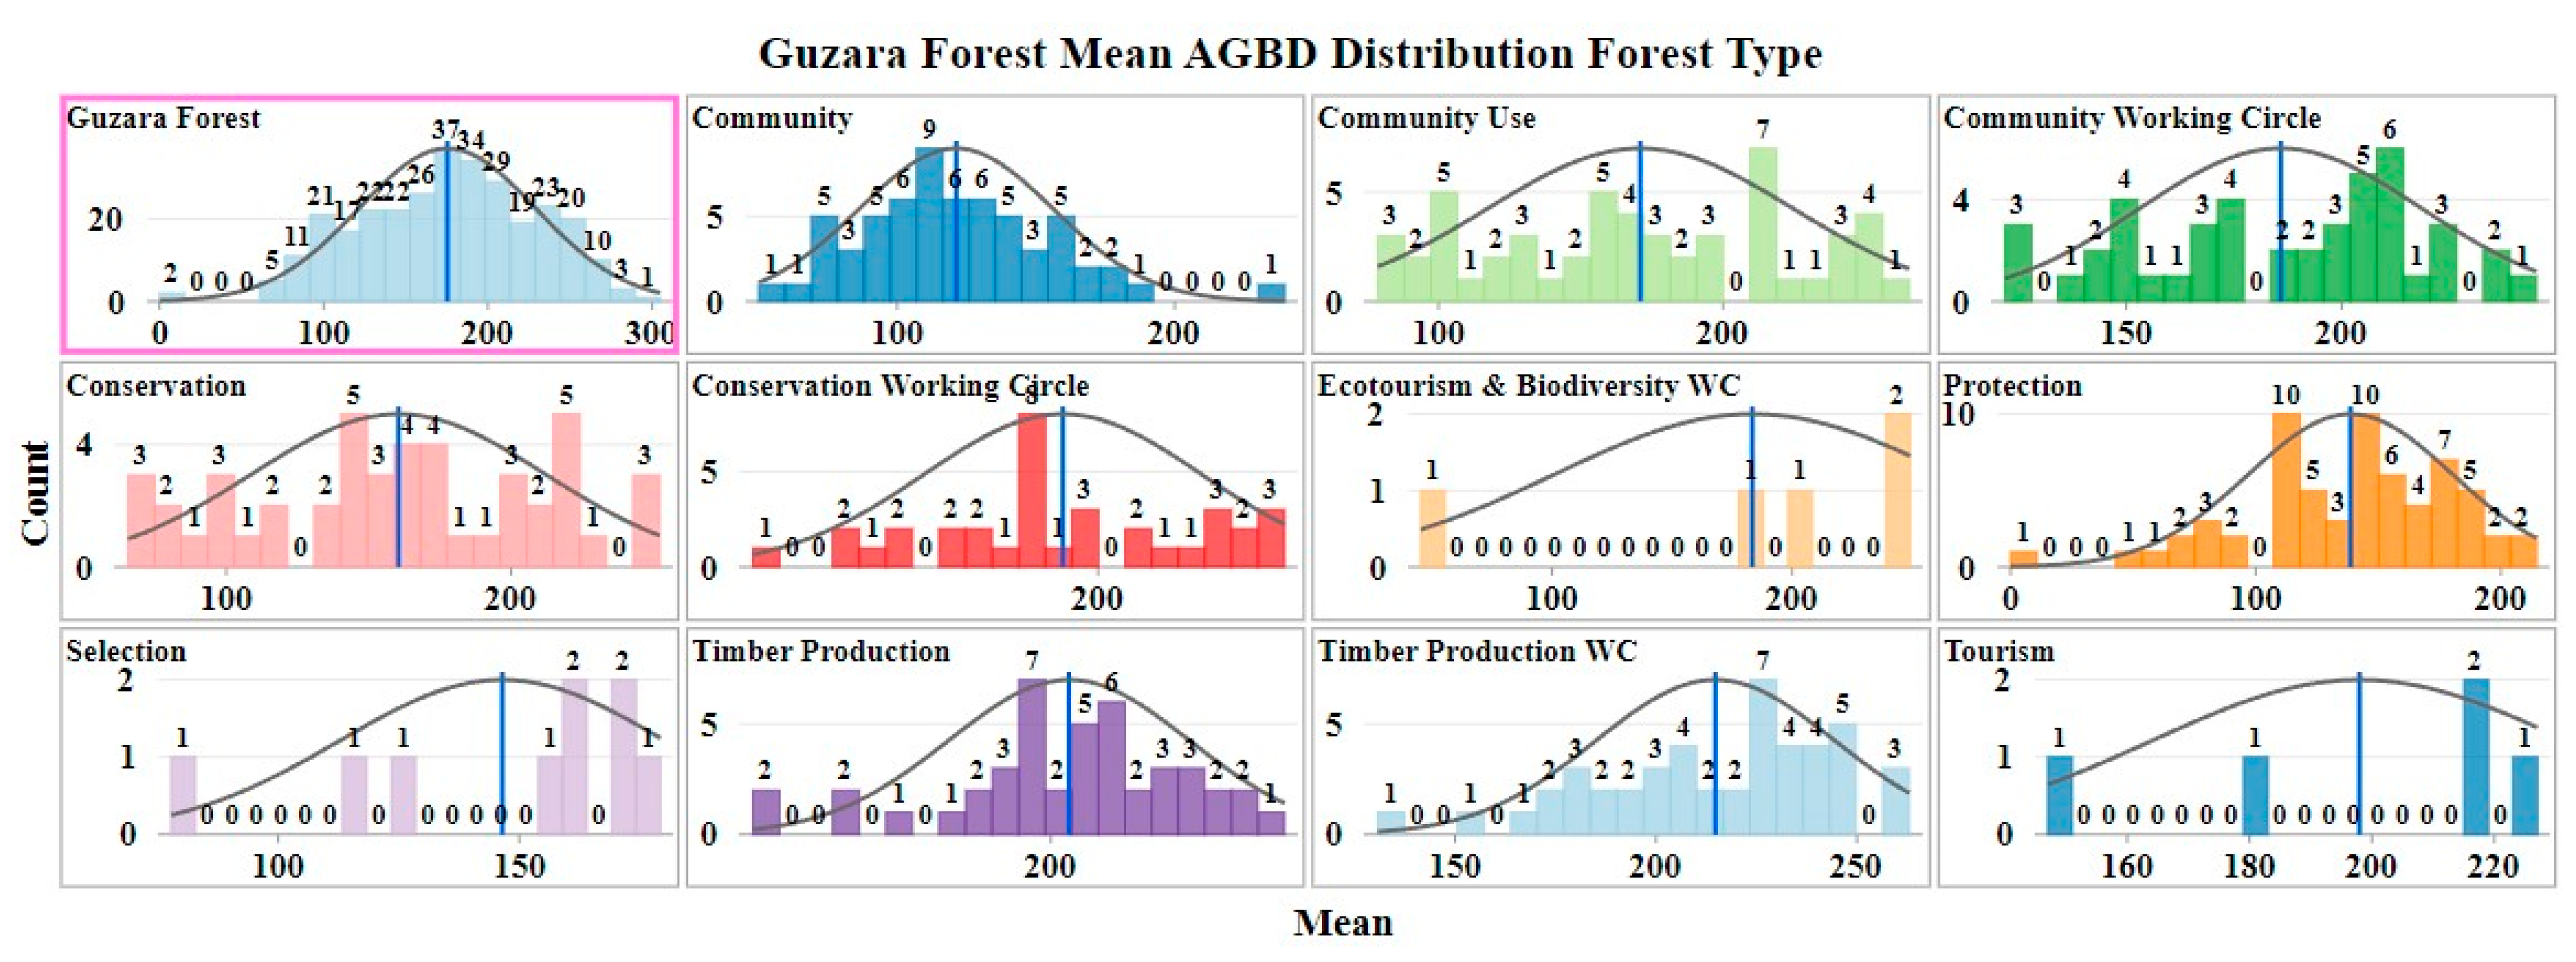
3.3.3. Community (Guzara) Forests

Community-owned forests account for approximately 58% of the designated forest area and are managed by the forest department. These forests exhibit diverse patterns of biomass accumulation due to variations in working circle activities. A privately-owned community forest is managed under six working plan activities, having a mean AGB value of 175 Mg/ha.
The biomass distribution in community forests (Figure 23) occupies a maximum number of compartments managed under 11 working circles, with priority given to community use, conservation, and timber production. The biomass levels exhibit significant variation, ranging from moderate to high, except in the Haripur guzara, where the biomass is 77 Mg/ha. The highest AGB values are found in the upper Siran community forest (215 Mg/ha), followed by the upper Kaghan community forest (208 Mg/ha). The Haripur guzara working plan’s lower biomass values highlight the degraded forest patches. The high biomass levels in upper Siran guzara forests are due to activities such as conservation, ecotourism, biodiversity, and timber production.
Community rights and concessions in these forests result in frequent disturbances like deforestation, grazing, fuelwood collection, and timber extraction, leading to AGB variations. The maximum AGB of 215 Mg/ha in timber production working circles reflects the communities’ reliance on these forests for timber needs. A lower biomass value, ranging from 121 to 146 Mg/ha, was observed in community, protection, and selection working circles. Attention is required to address these disparities in need-based intense management practices (Figure 24).
Extending from the low-lying areas to higher altitudes, community forests encompass a diverse range of forest cover, including moist, dry temperate, and sub-tropical chir pine forest zones. The biomass in the compartments varied from low to moderate levels, reflecting young and sub-mature forest stands. Target interventions, such as reforestation, grazing control, illegal logging prevention, agroforestry, and ecotourism initiatives, are critical for meeting and addressing community needs and conserving vulnerable Himalayan temperate forests. Certain compartments exhibit maximum biomass ranges of 250–300 Mg/ha. The carbon storage capacity in the different compartments signifies the need and demand for future carbon conservation strategies, and its spatial distribution is shown in Figure 25.

3.4. Ecological Analysis of Forest Cover and Biomass Dynamics in Mansehra

Mansehra District faces alarming climate change vulnerability due to increasing CO2 emissions, escalating from 20.95 thousand tons/year in 2000 to 35.82 thousand tons/year in 2022. This trend mirrors the national increase in CO2 emissions from 20 million tons/year in 2020 to 32 million tons/year in 2022. Although the forest cover increased in 2020–2021, AGB values declined during the same period, emphasizing the need to concentrate on AGB as a key factor for carbon sequestration rather than relying solely on the forest cover. The analytical results depicted in Figure 26 show the country and study area’s CO2 total emissions (Figure 26A) and a graphical presentation (Figure 26B) of the ecological analysis of the forest cover and biomass dynamics [55].
Forest carbon absorption rates vary by age classes and species, necessitating detailed AGB assessments for reliable CO2 mitigation. The CO2 mitigation potential was evaluated by converting the above-ground biomass (AGB) to above-ground carbon (AGC) and subsequently calculating the equivalent CO2 sequestration based on IPCC guidelines [56,57]:
A G C = A G B × 0.47
C O 2   s e q u e s t r a t i o n = A G C × 3.67
Equation (1) indicates that 1 ton of AGB is equal to 0.47 tons of AGC, which, upon multiplication with 3.67 as per equation 2, can sequestrate 1.7249 tons of CO2 from the atmosphere, and vice versa, 1 ton of CO2 emission sink requirements needs 0.5798 tons of AGB. In 2022, the Mansehra district emitted 35,820 tons of CO2 [48], requiring 20,770 tons of AGB for offsetting, compared to the available AGB of 19,940 tons, revealing a shortfall of 830 tons. Despite having 8.68% of the forest-rich KP province’s area, Mansehra’s AGB cannot offset CO2 emissions. To bridge this gap, the appropriate measures required are continuous temporal monitoring to maintain minimum AGB in each compartment, mixed plantations of high-potential carbon storage, a multipurpose land-use concept of agroforestry practices, high-storage-carbon species on commercial long-term rotation periods, and awareness and community participation for long-term sustainability. Nationally, AGB requirements increased from 11.80 million tons in 2000 to 18.78 million tons in 2022 without significant changes or initiatives to increase the forest area or AGB (Table 4; Pakistan Bureau of Statistics).
A temporal analysis of the AGB requirements against CO2 emissions underscored the urgency for targeted measures. A trained model for the year 2022 was used for the prediction of AGB in 2019. Input parameters of 2019 were used in the trained random forest model to obtain an AGB prediction for 2019. A change analysis of the AGB for 2019 and 2022 was carried out by taking the difference image, as shown in (Figure 27), which reveals a net decrease in AGB across 95,000 ha compared to an increase of 22,000 ha and stability across 79,000 ha of the forest cover. Areas with significant increases and decreases in AGB are illustrated in Box 1 and Box 2, respectively. Notably, afforestation programs contributed to the rise in AGB, highlighting the potential of regeneration initiatives to counteract biomass loss.

4. Discussion

Integrating GEDI L4A biomass density data with optical and ancillary datasets using machine learning addresses the challenges in biomass estimation in complex hilly terrains. The results provide insights into the biomass distribution and magnitude in mountainous landscapes per forest categories and demonstrate the utility of GEDI-derived data for forest biophysical parameters complemented with explanatory variables for enhanced accuracy and reliability.

4.1. Accuracy Analysis

The GEDI L4A outperforms other LiDAR systems like ICESat-1 and ICESat-2 due to its smaller footprint diameter (25 m) and higher sampling density, which are particularly advantageous for tropical and temperate forest applications [58]. Biases and underestimations in the GEDI-derived products were reduced through high-energy beam selection, improving the ground and canopy cover estimation in this South Asian region despite limited local calibration for its diverse ecosystems [59,60].
Key features contributing to AGB estimation accuracy include the canopy height, Landsat-9 green band (B3) and digital elevation, GNDVI, MSI, and GEDI L2A relative height data. These findings align with prior research [61,62,63,64]. The AGB variability patterns observed in the GEDI L4A dataset are consistent with the GEDI L4B data and other studies [62]. The model effectively predicts biomass at a detailed compartment level, capturing the Mansehra district’s complex and diverse forest structures, similar to the studies by [65,66]. Recent studies show that combining the predictors related to the canopy cover, vegetation density, Landsat-9 spectral information data, and topographical variables enhances AGB estimation [67,68,69,70].
The random forest model achieved high performance, with an R2 of 0.86, an RMSE of 28.03 Mg/ha, and an MAE of 19.54 Mg/ha on the test data. Ground validation showed satisfactory accuracy (R2 = 0.71), demonstrating the model’s robustness and generalizability. Biomass estimates ranged from around 60 to 426 Mg/ha, with R2 ranging from 0.72 to 0.88 (Table 5). Similarly, AGB estimation using different optical and microwave datasets showed an R2 value ranging from 0.63 to 0.77 (Table 6).
Limited biomass estimation research was conducted on forest compartments (basic administrative units) using LiDAR datasets, highlighting the key significance of this study. Point-based model accuracy helped the reliability and correct estimations of AGB in the compartments. This granularity is crucial for implementing target management strategies in Pakistan’s diverse ecosystems, as highlighted by [75].

4.2. Comparison of Biomass Estimates

The Mansehra district stores a large percentage of carbon stock in temperate forests (83%), followed by sub-tropical pine forests (14%), sub-alpine forests (1.5%), and others (1.5%) [76]. This study predicted a mean above-ground biomass value of 189.42 Mg/ha, which differed by only 5.2% from the ground-sampled carbon stock of 180.93 Mg/ha, confirming its accuracy and efficiency. Carbon stock densities in the designated Mansehra forest range from 31 to 142 Mg/ha, aligning with values reported in the conifer-dominated forests of the western Himalayan region of India (73.30 to 245 C Mg/ha) [77]. Differences in carbon density ranges reflect variations in forest age and species distribution.
A comparison with other studies in the same area (Table 4 and Table 5) validates the reliability of the AGB estimation presented in this study. Furthermore, the findings align with global AGB patterns, which rank temperate coniferous forests second to tropical forests, with an average AGB of approximately 102 Mg/ha. This study demonstrates significant improvements in AGB estimation, aligning with the ranges provided by GEDI L4B, albeit at a coarser resolution of 1 km.

4.3. AGB Potential and CO2 Sequestration

Despite the substantial forest resources, the Mansehra district faces challenges in offsetting CO2 emissions due to insufficient AGB. Current AGB values range from 23 to 400 Mg/ha in designated forests. Improving the forest biomass, particularly in low-AGB compartments, through efficient and sustainable forest management could enable the district to meet its emission-offset requirements.
Nationally, the gap between AGB capacity and CO2 emissions remains significant. Pakistan currently requires at least 18.78 million tons of AGB to mitigate emissions. Projections suggest this requirement will rise to 21.58 million tons by 2030 and to 30.71 million tons by 2050, assuming a population growth of 1.7% and per capita CO2 emissions of 0.080 tons annually. This requires a multi-faceted approach involving afforestation and reforestation by increasing the forest biomass through an increase in the forest area and AGB of existing forests by sustainable forest management, particularly in forest areas having low AGBs.

5. Conclusions

Accurate and reliable forest biomass estimation based on explanatory variables with consistent performance against all selected machine learning models with slight variations (R2 from 0.85 to 0.86) signifies the suitability and effectiveness of explanatory variable selection. This study found the global forest canopy height, DEM, GEDI L2A canopy height data, and green and red optical bands to be efficient variables, with an RMSE of 28.03 Mg/ha, using a random forest algorithm. The average estimated AGB (189.42 Mg/ha) is 5.2% higher than the carbon inventory technique (ground) estimation of (180.93 Mg/ha), with R2 = 0.71 presenting the high performance of the proposed methodology.
This study underscores the importance of monitoring AGB distributions at both the forest category and compartment scales, particularly in protected, reserved, and community forests. Detailed temporal monitoring and mapping by the forest department at the stand level or compartment scale enables informed decision-making, facilitating adjustments or shifts based on AGB threshold levels to achieve sustainable forest management. Moreover, the proposed methodological outcomes can serve as baseline information in developing the National Forestry Inventory, currently required under multiple international programs, particularly in the context of carbon credits.
Acknowledging the reliance of CO2 sequestration on AGB capacity, this study calls for a paradigm shift in forest management strategies. Therefore, it is imperative to consider AGB as a primary metric in forest management rather than relying exclusively on forest cover areas. This necessitates a policy shift towards accentuating AGB estimation and addressing future demands. Pakistan requires 18.78 million tons of AGB to adjust its greenhouse gas budget to maintain environmental sustainability. This requirement is projected to increase to 37.23 million tons by 2030 and 52.97 million tons by 2050, respectively. Meeting these demands necessitates a multi-faceted approach, including afforestation, reforestation, and enhancing AGB in existing forests through effective management. Sustainable practices aimed at increasing AGB will be pivotal in addressing the challenges of carbon sequestration and climate change mitigation, ensuring long-term ecological and environmental stability.

Author Contributions

Conceptualization, M.I., G.Z. and R.A.F.I.; methodology, G.Z., M.I., M.K.L. and R.A.F.I.; software, C.X. and U.A.; validation, M.I., G.Z., and A.A.; formal analysis, M.I., M.K.L. and R.A.F.I.; investigation, M.I., G.Z. and R.A.F.I.; resources, G.J., Y.T. and C.X.; data curation, M.I., M.Y., A.A. and U.A.; writing—original draft preparation, M.I., G.Z. and R.A.F.I.; writing—review and editing, Y.T., M.Y. and G.J., visualization, M.I., G.Z. and R.A.F.I., supervision, G.Z., Y.T. and G.J.; project administration, Y.T. and C.X.; funding acquisition, G.J. and C.X. All authors have read and agreed to the published version of the manuscript.

Funding

This study was funded by the National Natural Science Foundation of China (grant no. 42471425).

Data Availability Statement

The data presented in this study will be made available upon request from the corresponding author.

Acknowledgments

We appreciate NASA/USGS for providing Landsat-9 imagery and the Khyber Pakhtunkhwa Forest Department for providing ground data to validate this research study. Moreover, Syed Rizwan Ahmad Kazmi, Aitezaz Mehfooz, Suleman Khan, and Hassan Mehmud from the Climate Change, Forestry, Environment, and Wildlife Department are specially acknowledged for their support not only in data provision but also for their assistance in the effective application of this research study.

Conflicts of Interest

All authors declared no conflicts of interest.

References

  1. Sung, H.M.; Kim, J.; Shim, S.; Seo, J.B.; Kwon, S.H.; Sun, M.A.; Moon, H.; Lee, J.H.; Lim, Y.J.; Boo, K.O.; et al. Climate Change Projection in the Twenty-First Century Simulated by NIMS-KMA CMIP6 Model Based on New GHGs Concentration Pathways. Asia Pac. J. Atmos. Sci. 2021, 57, 851–862. [Google Scholar] [CrossRef]
  2. Liu, Z.; Deng, Z.; Davis, S.J.; Ciais, P. Global Carbon Emissions in 2023. Nat. Rev. Earth Environ. 2024, 5, 253–254. [Google Scholar] [CrossRef]
  3. Forzieri, G.; Dakos, V.; Mcdowell, N.G.; Ramdane, A.; Cescatti, A. Emerging Signals of Declining Forest Resilience under Climate Change. Nature 2022, 608, 534–539. [Google Scholar] [CrossRef]
  4. Vijitharan, S.; Sasaki, N.; Tripathi, N.K.; Pramanik, M.; Tsusaka, T.W. Assessing Carbon Emission Reductions and Removals in Vavuniya District, Sri Lanka: REDD+ Project Contributions to Sustainability. Next Sustain. 2024, 3, 100035. [Google Scholar] [CrossRef]
  5. Adnan, M.; Xiao, B.; Bibi, S.; Xiao, P.; Zhao, P.; Wang, H. Addressing Current Climate Issues in Pakistan: An Opportunity for a Sustainable Future. Environ. Chall. 2024, 15, 100887. [Google Scholar] [CrossRef]
  6. Khan, I.A.; Khan, W.R.; Ali, A.; Nazre, M. Assessment of Above-Ground Biomass in Pakistan Forest Ecosystem’s Carbon Pool: A Review. Forests 2021, 12, 586. [Google Scholar] [CrossRef]
  7. Walker, W.S.; Gorelik, S.R.; Cook-Patton, S.C.; Baccini, A.; Farina, M.K.; Solvik, K.K.; Ellis, P.W.; Sanderman, J.; Houghton, R.A.; Leavitt, S.M.; et al. The Global Potential for Increased Storage of Carbon on Land. Proc. Natl. Acad. Sci. USA 2022, 119, e2111312119. [Google Scholar] [CrossRef] [PubMed]
  8. Rawat, M.; Arunachalam, K.; Arunachalam, A.; Alatalo, J.M.; Kumar, U.; Simon, B.; Hufnagel, L.; Micheli, E.; Pandey, R. Relative Contribution of Plant Traits and Soil Properties to the Functioning of a Temperate Forest Ecosystem in the Indian Himalayas. Catena 2020, 194, 104671. [Google Scholar] [CrossRef]
  9. Gajendiran, K.; Kandasamy, S.; Narayanan, M. Influences of Wildfire on the Forest Ecosystem and Climate Change: A Comprehensive Study. Environ. Res. 2024, 240, 117537. [Google Scholar] [CrossRef]
  10. Petrokofsky, G.; Kanamaru, H.; Achard, F.; Goetz, S.J.; Joosten, H.; Holmgren, P.; Lehtonen, A.; Menton, M.C.; Pullin, A.S.; Wattenbach, M. Comparison of Methods for Measuring and Assessing Carbon Stocks and Carbon Stock Changes in Terrestrial Carbon Pools. How Do the Accuracy and Precision of Current Methods Compare? A Systematic Review Protocol. Environ. Evid. 2012, 1, 6. [Google Scholar] [CrossRef]
  11. Musthafa, M.; Singh, G. Forest Above-Ground Woody Biomass Estimation Using Multi-Temporal Space-Borne LiDAR Data in a Managed Forest at Haldwani, India. Adv. Space Res. 2022, 69, 3245–3257. [Google Scholar] [CrossRef]
  12. Manley, K.; Nyelele, C.; Egoh, B.N. A Review of Machine Learning and Big Data Applications in Addressing Ecosystem Service Research Gaps. Ecosyst. Serv. 2022, 57, 101478. [Google Scholar] [CrossRef]
  13. Zhang, Y.; Liang, S.; Yang, L. A Review of Regional and Global Gridded Forest Biomass Datasets. Remote Sens. 2019, 11, 2744. [Google Scholar] [CrossRef]
  14. Tang, G.; Beckage, B.; Smith, B.; Miller, P.A. Estimating Potential Forest NPP, Biomass and Their Climatic Sensitivity in New England Using a Dynamic Ecosystem Model. Ecosphere 2010, 1, 1–20. [Google Scholar] [CrossRef]
  15. Ali, A.; Ashraf, M.I.; Gulzar, S.; Akmal, M. Development of an Allometric Model for Biomass Estimation of Pinus Roxberghii, Growing in Subtropical Pine Forests of Khyber Pakhtunkhwa, Pakistan. Sarhad J. Agric. 2020, 36, 236–244. [Google Scholar] [CrossRef]
  16. Khan, K.; Iqbal, J.; Ali, A.; Khan, S.N. Assessment of Sentinel-2-Derived Vegetation Indices for the Estimation of Above-Ground Biomass/Carbon Stock, Temporal Deforestation and Carbon Emissions Estimation in the Moist Temperate Forests of Pakistan. Appl. Ecol. Environ. Res. 2020, 18, 783–815. [Google Scholar] [CrossRef]
  17. Amjad, D.; Kausar, S.; Waqar, R.; Sarwar, F. Land Cover Change Analysis and Impacts of Deforestation on the Climate of District Mansehra, Pakistan. J. Biodivers. Environ. Sci. 2020, 103, 103–113. [Google Scholar] [CrossRef]
  18. Spawn, S.A.; Sullivan, C.C.; Lark, T.J.; Gibbs, H.K. Harmonized Global Maps of above and Belowground Biomass Carbon Density in the Year 2010. Sci. Data 2020, 7, 112. [Google Scholar] [CrossRef] [PubMed]
  19. Dubayah, R.; Blair, J.B.; Goetz, S.; Fatoyinbo, L.; Hansen, M.; Healey, S.; Hofton, M.; Hurtt, G.; Kellner, J.; Luthcke, S.; et al. The Global Ecosystem Dynamics Investigation: High-Resolution Laser Ranging of the Earth’s Forests and Topography. Sci. Remote Sens. 2020, 1, 100002. [Google Scholar] [CrossRef]
  20. Kumar, L.; Mutanga, O. Remote Sensing of Above-Ground Biomass. Remote Sens. 2017, 9, 935. [Google Scholar] [CrossRef]
  21. Holcomb, A.; Mathis, S.V.; Coomes, D.A.; Keshav, S. Computational Tools for Assessing Forest Recovery with GEDI Shots and Forest Change Maps. Sci. Remote Sens. 2023, 8, 100106. [Google Scholar] [CrossRef]
  22. Bullock, E.L.; Healey, S.P.; Yang, Z.; Acosta, R.; Villalba, H.; Insfrán, K.P.; Melo, J.B.; Wilson, S.; Duncanson, L.; Næsset, E.; et al. Estimating Aboveground Biomass Density Using Hybrid Statistical Inference with GEDI Lidar Data and Paraguay’s National Forest Inventory. Environ. Res. Lett. 2023, 18, 085001. [Google Scholar] [CrossRef]
  23. Musthafa, M.; Singh, G.; Kumar, P. Comparison of Forest Stand Height Interpolation of GEDI and ICESat-2 LiDAR Measurements over Tropical and Sub-Tropical Forests in India. Environ. Monit. Assess. 2023, 195, 71. [Google Scholar] [CrossRef] [PubMed]
  24. Indirabai, I.; Nilsson, M. Estimation of above Ground Biomass in Tropical Heterogeneous Forests in India Using GEDI. Ecol. Inf. 2024, 82, 102712. [Google Scholar] [CrossRef]
  25. Yang, Q.; Niu, C.; Liu, X.; Feng, Y.; Ma, Q.; Wang, X.; Tang, H.; Guo, Q. Mapping High-Resolution Forest Aboveground Biomass of China Using Multisource Remote Sensing Data. GISci. Remote Sens. 2023, 60, 2203303. [Google Scholar] [CrossRef]
  26. Nandy, S.; Srinet, R.; Padalia, H. Mapping Forest Height and Aboveground Biomass by Integrating ICESat-2, Sentinel-1 and Sentinel-2 Data Using Random Forest Algorithm in Northwest Himalayan Foothills of India. Geophys. Res. Lett. 2021, 48, e2021GL093799. [Google Scholar] [CrossRef]
  27. Forkuor, G.; Benewinde Zoungrana, J.B.; Dimobe, K.; Ouattara, B.; Vadrevu, K.P.; Tondoh, J.E. Above-Ground Biomass Mapping in West African Dryland Forest Using Sentinel-1 and 2 Datasets—A Case Study. Remote Sens. Environ. 2020, 236, 111496. [Google Scholar] [CrossRef]
  28. Fayad, I.; Baghdadi, N.; Guitet, S.; Bailly, J.S.; Hérault, B.; Gond, V.; El Hajj, M.; Tong Minh, D.H. Aboveground Biomass Mapping in French Guiana by Combining Remote Sensing, Forest Inventories and Environmental Data. Int. J. Appl. Earth Obs. Geoinf. 2016, 52, 502–514. [Google Scholar] [CrossRef]
  29. Zhao, X.; Hu, W.; Han, J.; Wei, W.; Xu, J. Urban Above-Ground Biomass Estimation Using GEDI Laser Data and Optical Remote Sensing Images. Remote Sens. 2024, 16, 1229. [Google Scholar] [CrossRef]
  30. Duncanson, L.; Kellner, J.R.; Armston, J.; Dubayah, R.; Minor, D.M.; Hancock, S.; Healey, S.P.; Patterson, P.L. Aboveground Biomass Density Models for NASA’s Global Ecosystem Dynamics Investigation (GEDI) Lidar Mission. Remote Sens. Environ. 2022, 270, 112845. [Google Scholar] [CrossRef]
  31. Xu, L.; Yu, J.; Shu, Q.; Luo, S.; Zhou, W.; Duan, D. Forest Aboveground Biomass Estimation Based on Spaceborne LiDAR Combining Machine Learning Model and Geostatistical Method. Front. Plant Sci. 2024, 15, 1428268. [Google Scholar] [CrossRef]
  32. Torre-Tojal, L.; Bastarrika, A.; Boyano, A.; Lopez-Guede, J.M.; Graña, M. Above-Ground Biomass Estimation from LiDAR Data Using Random Forest Algorithms. J. Comput. Sci. 2022, 58, 101517. [Google Scholar] [CrossRef]
  33. Forest, M.; Wang, C.; Datcu, M.P.; Tang, Y.; Tian, S.; Tian, X.; Li, J.; Zhang, F.; Zhang, H.; Jiang, M. Forest Aboveground Biomass Estimation Using Multisource Remote Sensing Data and Deep Learning Algorithms: A Case Study over Hangzhou Area in China. Remote Sens. 2024, 16, 1074. [Google Scholar] [CrossRef]
  34. Cheng, F.; Ou, G.; Wang, M.; Liu, C. Remote Sensing Estimation of Forest Carbon Stock Based on Machine Learning Algorithms. Forests 2024, 15, 681. [Google Scholar] [CrossRef]
  35. Zhang, X.; Shen, H.; Huang, T.; Wu, Y.; Guo, B.; Liu, Z.; Luo, H.; Tang, J.; Zhou, H.; Wang, L.; et al. Improved Random Forest Algorithms for Increasing the Accuracy of Forest Aboveground Biomass Estimation Using Sentinel-2 Imagery. Ecol. Indic. 2024, 159, 111752. [Google Scholar] [CrossRef]
  36. Wang, E.; Huang, T.; Liu, Z.; Bao, L.; Guo, B.; Yu, Z.; Feng, Z.; Luo, H.; Ou, G. Improving Forest Above-Ground Biomass Estimation Accuracy Using Multi-Source Remote Sensing and Optimized Least Absolute Shrinkage and Selection Operator Variable Selection Method. Remote Sens. 2024, 16, 4497. [Google Scholar] [CrossRef]
  37. Anees, S.A.; Mehmood, K.; Khan, W.R.; Sajjad, M.; Alahmadi, T.A.; Alharbi, S.A.; Luo, M. Integration of Machine Learning and Remote Sensing for above Ground Biomass Estimation through Landsat-9 and Field Data in Temperate Forests of the Himalayan Region. Ecol. Inform. 2024, 82, 102732. [Google Scholar] [CrossRef]
  38. Ali, A.; Ashraf, M.I.; Gulzar, S.; Akmal, M. Estimation of Forest Carbon Stocks in Temperate and Subtropical Mountain Systems of Pakistan: Implications for REDD+ and Climate Change Mitigation. Environ. Monit. Assess. 2020, 192, 198. [Google Scholar] [CrossRef] [PubMed]
  39. Shahzad, N.; Saeed, U.; Gilani, H.; Ahmad, S.R.; Ashraf, I.; Irteza, S.M. Evaluation of State and Community/Private Forests in Punjab, Pakistan Using Geospatial Data and Related Techniques. For. Ecosyst. 2015, 2, 7. [Google Scholar] [CrossRef]
  40. Nizami, S.M. The Inventory of the Carbon Stocks in Sub Tropical Forests of Pakistan for Reporting under Kyoto Protocol. J. Res. 2012, 23, 377–384. [Google Scholar] [CrossRef]
  41. Masek, J.G.; Wulder, M.A.; Markham, B.; McCorkel, J.; Crawford, C.J.; Storey, J.; Jenstrom, D.T. Landsat 9: Empowering Open Science and Applications through Continuity. Remote Sens. Environ. 2020, 248, 111968. [Google Scholar] [CrossRef]
  42. Lu, D.; Chen, Q.; Wang, G.; Liu, L.; Li, G.; Moran, E. A Survey of Remote Sensing-Based Aboveground Biomass Estimation Methods in Forest Ecosystems. Int. J. Digit. Earth 2016, 9, 63–105. [Google Scholar] [CrossRef]
  43. Potapov, P.; Li, X.; Hernandez-Serna, A.; Tyukavina, A.; Hansen, M.C.; Kommareddy, A.; Pickens, A.; Turubanova, S.; Tang, H.; Silva, C.E.; et al. Mapping Global Forest Canopy Height through Integration of GEDI and Landsat Data. Remote Sens. Environ. 2021, 253, 112165. [Google Scholar] [CrossRef]
  44. Zhu, X.; Liu, D. Improving Forest Aboveground Biomass Estimation Using Seasonal Landsat NDVI Time-Series. ISPRS J. Photogramm. Remote Sens. 2015, 102, 222–231. [Google Scholar] [CrossRef]
  45. David, R.M.; Rosser, N.J.; Donoghue, D.N.M. Improving above Ground Biomass Estimates of Southern Africa Dryland Forests by Combining Sentinel-1 SAR and Sentinel-2 Multispectral Imagery. Remote Sens. Environ. 2022, 282, 113232. [Google Scholar] [CrossRef]
  46. Nandy, S.; Kushwaha, S.P.S. Forest Biomass Assessment Integrating Field Inventory and Optical Remote Sensing Data: A Systematic Review. Int. J. Plant Environ. 2021, 7, 181–186. [Google Scholar] [CrossRef]
  47. Alexandridis, T.; Perakis, K. Vegetation Indices: Advances Made in Biomass Estimation and Vegetation Monitoring in the Last 30 Years. Geocarto Int. 2006, 21, 21–28. [Google Scholar]
  48. Centre, E.C.J.R.; Crippa, M.; Guizzardi, D.; Pagani, F.; Banja, M.; Muntean, M.; Schaaf, E.; Monforti-Ferrario, F.; Becker, W.; Quadrelli, R.; et al. GHG Emissions of All World Countries; Publications Office of the European Union: Luxembourg, 2024. [Google Scholar]
  49. Bichri, H.; Chergui, A.; Hain, M. Investigating the Impact of Train/Test Split Ratio on the Performance of Pre-Trained Models with Custom Datasets. Int. J. Adv. Comput. Sci. Appl. 2024, 15, 331. [Google Scholar] [CrossRef]
  50. Hasan, L. An Anatomy of State Failures in Forest Management in Pakistan. In Pakistan Development Review; Pakistan Institute of Development Economics: Islamabad, Pakistan, 2007; Volume 46. [Google Scholar]
  51. Wang, C.; Zhang, W.; Ji, Y.; Marino, A.; Li, C.; Wang, L.; Zhao, H.; Wang, M. Estimation of Aboveground Biomass for Different Forest Types Using Data from Sentinel-1, Sentinel-2, ALOS PALSAR-2, and GEDI. Forests 2024, 15, 215. [Google Scholar] [CrossRef]
  52. Kanmegne Tamga, D.; Latifi, H.; Ullmann, T.; Baumhauer, R.; Bayala, J.; Thiel, M. Estimation of Aboveground Biomass in Agroforestry Systems over Three Climatic Regions in West Africa Using Sentinel-1, Sentinel-2, ALOS, and GEDI Data. Sensors 2022, 23, 349. [Google Scholar] [CrossRef] [PubMed]
  53. Gao, Y.; Lu, D.; Li, G.; Wang, G.; Chen, Q.; Liu, L.; Li, D. Comparative Analysis of Modeling Algorithms for Forest Aboveground Biomass Estimation in a Subtropical Region. Remote Sens. 2018, 10, 627. [Google Scholar] [CrossRef]
  54. Li, Y.; Li, C.; Li, M.; Liu, Z. Influence of Variable Selection and Forest Type on Forest Aboveground Biomass Estimation Using Machine Learning Algorithms. Forests 2019, 10, 1073. [Google Scholar] [CrossRef]
  55. Hoover, C.M.; Smith, J.E. Aboveground Live Tree Carbon Stock and Change in Forests of Conterminous United States: Influence of Stand Age. Carbon Balance Manag. 2023, 18, 7. [Google Scholar] [CrossRef] [PubMed]
  56. IPCC. 2006 IPCC Guidelines for National Greenhouse Gas Inventories, prepared by the National Greenhouse Gas Inventories Programme; Eggleston, H.S., Buendia, L., Miwa, K., Ngara, T., Tanabe, K., Eds.; IGES: Hayama, Japan, 2006. [Google Scholar]
  57. Bai, Y.; Ding, G. Estimation of Changes in Carbon Sequestration and Its Economic Value with Various Stand Density and Rotation Age of Pinus Massoniana Plantations in China. Sci. Rep. 2024, 14, 16852. [Google Scholar] [CrossRef] [PubMed]
  58. Jia, D.; Wang, C.; Hakkenberg, C.R.; Numata, I.; Elmore, A.J.; Cochrane, M.A. Accuracy Evaluation and Effect Factor Analysis of GEDI Aboveground Biomass Product for Temperate Forests in the Conterminous United States. GIsci. Remote Sens. 2023, 61, 2292374. [Google Scholar] [CrossRef]
  59. Rodda, S.R.; Nidamanuri, R.R.; Fararoda, R.; Mayamanikandan, T.; Rajashekar, G. Evaluation of Height Metrics and Above-Ground Biomass Density from GEDI and ICESat-2 Over Indian Tropical Dry Forests Using Airborne LiDAR Data. J. Indian Soc. Remote Sens. 2024, 52, 841–856. [Google Scholar] [CrossRef]
  60. Liu, A.; Cheng, X.; Chen, Z. Performance Evaluation of GEDI and ICESat-2 Laser Altimeter Data for Terrain and Canopy Height Retrievals. Remote Sens. Environ. 2021, 264, 112571. [Google Scholar] [CrossRef]
  61. Zhang, C.; Wang, K.; Yue, Y.; Qi, X.; Zhang, M. Assessing Regional Ecosystem Conditions Using Geospatial Techniques—A Review. Sensors 2023, 23, 4101. [Google Scholar] [CrossRef] [PubMed]
  62. Dorado-Roda, I.; Pascual, A.; Godinho, S.; Silva, C.A.; Botequim, B.; Rodríguez-Gonzálvez, P.; González-Ferreiro, E.; Guerra-Hernández, J. Assessing the Accuracy of GEDI Data for Canopy Height and Aboveground Biomass Estimates in Mediterranean Forests. Remote Sens. 2021, 13, 2279. [Google Scholar] [CrossRef]
  63. Rodríguez-Veiga, P.; Quegan, S.; Carreiras, J.; Persson, H.J.; Fransson, J.E.S.; Hoscilo, A.; Ziółkowski, D.; Stereńczak, K.; Lohberger, S.; Stängel, M.; et al. Forest Biomass Retrieval Approaches from Earth Observation in Different Biomes. Int. J. Appl. Earth Obs. Geoinf. 2019, 77, 53–68. [Google Scholar] [CrossRef]
  64. Sainuddin, F.V.; Malek, G.; Rajwadi, A.; Nagar, P.S.; Asok, S.V.; Reddy, C.S. Estimating Above-Ground Biomass of the Regional Forest Landscape of Northern Western Ghats Using Machine Learning Algorithms and Multi-Sensor Remote Sensing Data. J. Indian Soc. Remote Sens. 2024, 52, 885–902. [Google Scholar] [CrossRef]
  65. Yang, L.; Liang, S.; Zhang, Y. A New Method for Generating a Global Forest Aboveground Biomass Map from Multiple High-Level Satellite Products and Ancillary Information. IEEE J. Sel. Top. Appl. Earth Obs. Remote Sens. 2020, 13, 2587–2597. [Google Scholar] [CrossRef]
  66. Hu, T.; Su, Y.; Xue, B.; Liu, J.; Zhao, X.; Fang, J.; Guo, Q. Mapping Global Forest Aboveground Biomass with Spaceborne LiDAR, Optical Imagery, and Forest Inventory Data. Remote Sens. 2016, 8, 565. [Google Scholar] [CrossRef]
  67. Santoro, M.; Cartus, O.; Carvalhais, N.; Rozendaal, D.M.A.; Avitabile, V.; Araza, A.; De Bruin, S.; Herold, M.; Quegan, S.; Rodríguez-Veiga, P.; et al. The Global Forest Above-Ground Biomass Pool for 2010 Estimated from High-Resolution Satellite Observations. Earth Syst. Sci. Data 2021, 13, 3927–3950. [Google Scholar] [CrossRef]
  68. Bruening, J.M.; Fischer, R.; Bohn, F.J.; Armston, J.; Armstrong, A.H.; Knapp, N.; Tang, H.; Huth, A.; Dubayah, R. Challenges to Aboveground Biomass Prediction from Waveform Lidar. Environ. Res. Lett. 2021, 16, 125013. [Google Scholar] [CrossRef]
  69. Labrière, N.; Davies, S.J.; Disney, M.I.; Duncanson, L.I.; Herold, M.; Lewis, S.L.; Phillips, O.L.; Quegan, S.; Saatchi, S.S.; Schepaschenko, D.G.; et al. Toward a Forest Biomass Reference Measurement System for Remote Sensing Applications. Glob. Chang. Biol. 2023, 29, 827–840. [Google Scholar] [CrossRef] [PubMed]
  70. Campbell, M.J.; Dennison, P.E.; Kerr, K.L.; Brewer, S.C.; Anderegg, W.R.L. Scaled Biomass Estimation in Woodland Ecosystems: Testing the Individual and Combined Capacities of Satellite Multispectral and Lidar Data. Remote Sens. Environ. 2021, 262, 112511. [Google Scholar] [CrossRef]
  71. Bhandari, K.; Srinet, R.; Nandy, S. Forest Height and Aboveground Biomass Mapping by Synergistic Use of GEDI and Sentinel Data Using Random Forest Algorithm in the Indian Himalayan Region. J. Indian Soc. Remote Sens. 2024, 52, 857–869. [Google Scholar] [CrossRef]
  72. Fararoda, R.; Reddy, R.S.; Rajashekar, G.; Chand, T.R.K.; Jha, C.S.; Dadhwal, V.K. Improving Forest above Ground Biomass Estimates over Indian Forests Using Multi Source Data Sets with Machine Learning Algorithm. Ecol. Inf. 2021, 65, 101392. [Google Scholar] [CrossRef]
  73. Qasim, M.; Csaplovics, E. Comparative Study of Forest Biomass and Carbon Stocks of Margalla Hills National Park, Pakistan. For. Sci. Technol. 2023, 19, 139–154. [Google Scholar] [CrossRef]
  74. Imran, A.B.; Ahmed, S. Potential of Landsat-8 Spectral Indices to Estimate Forest Biomass. Int. J. Hum. Cap. Urban Manag. 2018, 3, 303–314. [Google Scholar] [CrossRef]
  75. Yusuf, M. Forest Management in Pakistan: A Legal and Institutional Analysis; Sustainable Development Policy Institute (SDPI): Islamabad, Pakistan, 2008. [Google Scholar]
  76. Ali, A. Forest Reference Emission Level of Khyber Pakhtunkhwa; Pakistan Forest Institute: Peshawar, Pakistan, 2017; pp. 1–54.
  77. Sharma, C.M.; Baduni, N.P.; Gairola, S.; Ghildiyal, S.K.; Suyal, S. Tree Diversity and Carbon Stocks of Some Major Forest Types of Garhwal Himalaya, India. Ecol. Manag. 2010, 260, 2170–2179. [Google Scholar] [CrossRef]
Figure 1. This map layout shows a map of the country, with the provincial territory of Khyber Pakhtunkhwa and the Mansehra district. The true-colour composite is displayed with 30 m resolution Landsat-9 optical satellite imagery acquired on 17 October 2022.
Forests 16 00330 g001
Figure 2. The territorial distribution of designated forests, showing reserved, protected, and community forest compartments obtained from the Khyber Pakhtunkhwa Forest Department.
Forests 16 00330 g002
Figure 3. This nested circular plot presents the ground carbon stock points of the designed forest in the Mansehra district.
Forests 16 00330 g003
Figure 4. The circular field inventory nested plots shown in this image, with the plot size dimensions, measure tree, shrub, and below-ground carbon stock estimates.
Forests 16 00330 g004
Figure 5. A spatial representation of spaceborne LiDAR GEDI L4A AGB points over the study area. In (A), the coverage beam is shown in the study area, while (B) shows the high-energy power beam shots, with the high-value-range classes shown in the legend.
Forests 16 00330 g005
Figure 6. Methodological flowchart of forest biomass and carbon stock estimation using machine learning regression algorithms in designated forests of Mansehra District.
Forests 16 00330 g006
Figure 7. A descending sequence of the importance scores assigned to predictor variables using random forest.
Forests 16 00330 g007
Figure 8. Scatter plots of random forest (A), random tree regression (B) and XGBoost (C) showing an analysis of GEDI AGB points for the training data.
Forests 16 00330 g008
Figure 9. Scatter plots of random forest (A), XGBoost (B), and random tree regression (C) showing test data performed for analysing the GEDI AGB points and explanatory variables.
Forests 16 00330 g009
Figure 10. Biomass maps were established to compare the machine learning regression analysis of forest biomass in designated forests of Mansehra District: (A) XGBoost model; (B) random forest model; (C) random tree regression model.
Forests 16 00330 g010
Figure 11. This scatter plot shows the actual and predicted above-ground biomass.
Forests 16 00330 g011
Figure 12. Category-wise area and mean AGB of the designated forests.
Forests 16 00330 g012
Figure 13. The spatial heterogeneity of forest biomass (Mg/ha) predicted by the random forest model in the designated forests of Mansehra District.
Forests 16 00330 g013
Figure 14. Compartments’ order based on the highest AGB values in the designated forests of Mansehra District.
Forests 16 00330 g014
Figure 15. Potential compartments (low AGB) to demarcate new afforestation sites.
Forests 16 00330 g015
Figure 16. Qualitative analysis of the compartments, presenting the dense vegetation of mature forest stands with high AGB values (Mg/ha).
Forests 16 00330 g016
Figure 17. Box plots showing biomass distribution in reserved forest working plan management units.
Forests 16 00330 g017
Figure 18. Mean distribution of above-ground biomass (AGB) estimates in different working circles.
Forests 16 00330 g018
Figure 19. The spatial distribution of reserved forest compartments that shows the mean AGB values, classifying high-biomass-density compartments in a red tone.
Forests 16 00330 g019
Figure 20. This box plot illustrates the distribution of mean biomass values in different working plans of protected forests.
Forests 16 00330 g020
Figure 21. The histogram peaks illustrate the distributions of mean biomass values in different management units of protected forests, showing sub-mature vegetation stands.
Forests 16 00330 g021
Figure 22. Mean AGB estimation value ranges in protected forest compartments are highlighted in lighter green tones, representing low biomass-value accumulation.
Forests 16 00330 g022
Figure 23. The biomass distribution in different working circles identifies the management practices adopted in the community-owned forests.
Forests 16 00330 g023
Figure 24. The biomass status in the community (Guzara) forests is represented by mean histogram values in working circles.
Forests 16 00330 g024
Figure 25. The extent of community forest compartments with mean AGB in all range values with different topographical locations in the district.
Forests 16 00330 g025
Figure 26. (A) Total CO2 emissions’ comparison of Mansehra District with Pakistan. (B) Comparison of temporal forest cover with the total sum values of above-ground biomass estimated in the designated forests and complete province.
Forests 16 00330 g026
Figure 27. Carbon dynamics showing the distribution of forest biomass change patterns in the district for 2019–2022.
Forests 16 00330 g027
Table 1. Allometric equations developed at local conditions for major conifer tree species.
SpeciesForest TypeAllometric EquationsModelSource
Quercus ilex L. (oak)Dry temperateAGB = 0.8277(D2H)0.6655M = a(D2H)b[38]
Cedrus deodara (Roxb. Ex Lamb.) G. Don (deodar)Dry temperateAGB = 0.1779(D2H)0.8103M = a(D2H)b
Pinus wallichiana A.B.Jackson (kail)Dry temperateAGB = 0.0631(D2H)0.8798M = a(D2H)b
Cedrus deodara (Roxb. Ex Lamb.) G. Don (deodar)Moist temperateAGB = 0.0491(D2H)0.9167M = a(D2H)b
Abies Pindrow Royle (fir)TemperateAGB = 0.0452(D2H)0.9029M = a(D2H)b
Picea smithiana (Wall.) Boiss (spruce)TemperateAGB = 0.0821(D2H)0.8363M = a(D2H)b
Pinus wallichiana A.B.Jackson (kail)Moist temperateAGB = 0.0594(D2H)0.881M = a(D2H)b
Pinus roxburghii Sargent (chir pine)Sub-tropical pineAGB = 0.0224(D2H)0.9767M = a(D2H)b
Table 2. Hyperparameters for training machine learning models.
Model NameModel Parameter CharacteristicsValue
Random ForestNumber of Trees500
Leaf Size5
Tree-Depth Range36–50
Mean Tree Depth40
% of Training Available per Tree100
Number of Randomly Sampled Variables5
Training and Test data %80:20
Model Out-of-Bag Error805.9
Gradient BoostingNumber of Trees500
Leaf Size5
Tree-Depth Range6–6
Mean Tree Depth6
% of Training Available per Tree100
Number of Randomly Sampled Variables5
% of Training Data Excluded for Validation20
L2 Regularization (Lambda)1.00
Minimum Loss Reduction for Splits (Gamma)0.00
Learning Rate (Eta)0.30
Random Tree RegressionTraining Options:
Maximum Number of Trees500
Maximum Tree Depth30
Maximum Number of Samples74,400
Percent of Samples for Testing20
Table 3. Performance metrics of machine learning models.
Model NameTrainingTest
R2RMSEMAER2RMSEMAE
Random Forest0.9711.848.080.8628.0319.54
XGBoost0.9515.7211.200.8529.3520.57
Random Tree Regression0.9714.3810.980.8431.2221.76
Table 4. CO2 emissions and AGB requirements in Mansehra and Pakistan.
YearMansehra (Values in Thousand Tons)Pakistan (Values in Million Tons)
CO2 EmissionsAGB RequirementCO2 EmissionsAGB Requirement
200020.9512.1420.3511.80
200525.5914.8324.9914.49
201029.8917.3327.4315.90
201534.7820.1630.3817.61
202035.7620.7329.6617.20
202235.8220.7732.3918.78
Table 5. Comparison of biomass estimation using Spaceborne LiDAR data.
RegionDataTechniquesMean AG (B/C)*/R2Ref
Himalayan moist temperate forest, Uttarakhand, IndiaSentinel-1 and -2 and GEDI forest canopy height RF1
Algorithm
AGB
190.27 Mg ha−1/0.88
[71]
NW Indian Himalayan foothillsICESat-2 and Sentinel-1 FCHRF
model
AGB
426.41 Mg ha−1/0.83
[26]
Xiaoshao, Yiliang Yunnan Province ChinaSentinel-1 and -2, ALOS PALSAR-2, and GEDI L4ARF
model
AGB
59.09 Mg ha−1/0.72
[51]
Biomass estimation in managed forests, Haldwani IndiaForest layer, field data, and GEDI canopy heightMLR2 modelsAGB
153 Mg ha−1/0.75
[11]
MLR2 = multiple linear regression; AG (B/C)* = above-ground (biomass/carbon); RF1 = random forest.
Table 6. Comparison of biomass estimation using optical and microwave data.
RegionDataTechniquesMean AG (B/C)*/R2Ref
Western Himalayan
Indian forest
MODIS and L-band ALOS-PALSAR RF1 RegressionAGB
180.27 Mg ha−1/0.77
[72]
Sub-tropical chir pine forest, Margalla Hill, PakistanDBH and height Linear RegressionAGC
73.36 ± 32.55 Mg C ha−1
[73]
Battagram KP, PakistanSentinel-2 vegetation indices Linear RegressionAGB
148.79 t ha−1/0.67
[16]
Temperate and sub-tropical forests, KP, PakistanSpot-5 satellite (2.5 m) Allometric EquationsAGC
85.05 ± 10.84 t ha−1
[38]
Pinus roxburghii forest in Siran forest divsion, PakistanLandsat-8
(spectral indices)
Linear RegressionAGC
26–116 t ha−1/0.63
[74]
AG (B/C)* = above-ground (biomass/carbon); RF1 = random forest.
Disclaimer/Publisher’s Note: The statements, opinions and data contained in all publications are solely those of the individual author(s) and contributor(s) and not of MDPI and/or the editor(s). MDPI and/or the editor(s) disclaim responsibility for any injury to people or property resulting from any ideas, methods, instructions or products referred to in the content.

