Abstract
Human-induced environmental changes threaten the functional stability of natural forest ecosystems. Understanding the dominant factors influencing both functional space and stability in extremely heterogeneous environments is crucial for elucidating the stability of heterogeneous forest ecosystems. Here, 30 forest dynamic plots were established along the successional pathway in Maolan National Nature Reserve in Southwest China. By measuring 15,725 stems across 286 distinct species’ six key plant functional traits, we constructed the key plant functional traits for functional space and quantified functional redundancy (FR) and functional vulnerability (FV) to represent functional stability, and we further utilized the line model and multiple linear regression model to explore the key biotic/abiotic indicators influencing functional stability along the successional pathway of degraded karst forests. Additionally, as the successional pathway unfolded, the contribution of the six plant traits to the overall functional space increased, from 59.85% to 66.64%. These traits included specific leaf area (SLA), leaf dry matter content (LDMC), leaf thickness (LT) and leaf nitrogen content (LNC), which played a crucial role in driving functional space. With the increasing species richness (FR), functional entities (p < 0.001) and FR (p < 0.001) increased, while FV (p < 0.01) decreased. The results also demonstrated a higher FR in degraded karst forests (FR > 2). However, over 51% of FEs consisted of a single species, with the majority of species clustered into a few functional entities (FEs), indicating an elevated level of FV in karst forests. Soil nutrient availability significantly influences the ecosystem’s functional stability, explaining 87% of FR variability and 100% of FV variability. Finally, the rich SR of karst forests could provide sufficient insurance effects; soil pH and available potassium (AK) enhance resilience, and exchangeable calcium (Eca), total phosphorus (TP) and total potassium (TK) indicate the resistance of functional stability in degraded karst forests. This study highlights the complex mechanisms of functional stability in extreme habitat conditions, thereby deepening our understanding of ecosystem function maintenance.
1. Introduction
The diversity–stability relationship (DSR) is a fundamental concept in ecology [1], providing a conceptual framework for comprehending how biodiversity regulates the stability of communities or ecosystems [2]. Species-diverse communities are widely considered to enhance multiple ecosystem functions and promote ecological stability [3]. However, most studies have focused on species diversity while neglecting other dimensions of biodiversity (i.e., functional diversity indicated by functional traits), thereby constraining a comprehensive understanding of the underlying relationships [4,5]. An increasing body of studies suggest that functional diversity, which refers to the spatial distribution and abundance of species in the functional trait space of a given community, can offer greater insights into the underlying mechanisms of species and ecosystem functions, since the functional traits exhibit heightened sensitivity to environmental changes [6,7]. Thus, the trait-based approach has been considered a more robust indicator in elucidating the DSR than species diversity alone [8,9]. Nevertheless, the extent to which the DSR is influenced by environmental conditions remains uncertain [10,11]. Clarifying the environmental dependency of the DSR is imperative for effective ecosystem management in the face of global biodiversity loss and climate change.
Functional stability (usually referred to as resilience and resistance) is one of the most important characteristics of ecosystems [12,13]. Previous studies have suggested that it could indicate how the community co-varied with abiotic factors [14,15]. Ecologists even highlighted that the successional pathway represented function restoration with increasing functional stability [16]. Distinguishing the driving mechanisms of functional stability is the theoretical principle of restoration ecology [17]. The insurance hypothesis suggests that SR promotes functional stability by increasing functional redundancy (FR), i.e., the average number of species within a functional entity (FE), thereby mitigating the risk of impaired functioning caused by species loss [18]. It has been argued that species-diverse communities enhance the probability of species maintaining similar functions, thereby ensuring the overall functionality of the ecosystem is largely preserved in the face of random individual mortality [19]. Conversely, species loss will critically affect functional stability if each species performs unique functions [20]. However, recent studies have revealed that the functioning of ecosystems in species-diverse ecosystems could also be vulnerable due to functional over-redundancy (FOR, i.e., the percentage of species in FEs exceeding expectations based on FR), which refers to the tendency of most species to cluster into a few over-represented FEs (unique combinations of different categorical functional traits) [21]. Zhang and Zang [22] concluded that despite possessing a higher level of FR, the tropical rainforest exhibited high vulnerability. They observed that most species maintained similar ecosystem functions (i.e., most species cluster into a few FEs), while only a small proportion of species (including rare ones) contributed to maintaining the remaining ecosystem functions. The disproportionate contributions of rare and common species to ecosystem functions can potentially undermine community stability and resilience [20]. These findings highlight the urgent need for a more comprehensive framework to assess functional stability [23]. Ubiquitous disturbance can lead to various degrees of forest degradation [24]. When the disturbance stops, the degraded forest will undergo a specific successional pathway toward climax recovery [25]. Previous studies have suggested that the successional pathway represents functional recovery, especially the recovery of functional stability [13]. The functional stability in later successional stages was observed to be higher than in early successional stages due to the complex community structure. Parmentier et al. [26] discovered that increasing competition for resources in the early successional stage diminishes functional stability. Bihn et al. [13] found that a higher FR in secondary forests could be attributed to the large proportion of rare species, suggesting a potential explanation for the abundance of rare species and their rarity in tropical rainforests. However, Zhang and Zang [22] found that the FR in the mid-successional stage of tropical lowland forests exceeded that observed in tropical monsoon rainforests, representing an off-peak climax in tropical forests. Chazdon [27] further emphasized that the successional pathway was not deterministic, due to the uncertainty of the disturbance regime, environmental background, and plant adaptability, implying a lack of certainty regarding the recovery of functional stability. That author advocated for an integrated approach to assess the effects of both biotic and abiotic elements on shifts in ecosystem functional stability.
However, elucidating the relationship between environmental changes and functional stability is challenging due to co-varying factors that can significantly impact the results [28]. Both the differentiation in ecological strategies adopted by species and the abiotic filtering framework directly influence plant functional traits (PFTs), which contribute to their FR and vulnerability [29,30]. For instance, Huang et al. [31] demonstrated that variations in average daily temperature were dominant in determining the FR and functional vulnerability (the percentage of FEs having only one species, FV) of subtropical forests. Huang et al. [32] found that soil available potassium is significantly correlated with the FR and FV of forests. Fetzer et al. [28] also observed a close relationship between the reduction in FR and nutrient availability. However, Chen et al. [33] suggested that ever-changing precipitation and soil nutrients exerted substantial influences on the resource utilization of plants within the community, consequently leading to a linear response of ecosystem function to increasing species richness, ultimately reducing the FR. In addition, topography poses significant challenges to forest communities in maintaining stability [34]. Zhang et al. [35] and Zhang and Zang [22] separately found that the decreasing species richness at high and low elevations led to a reduction in FR compared with mid-elevation. Notably, co-varying soil nutrients and topographic factors can influence both functional diversity and heterogeneous conditions [36]. Increased habitat heterogeneity results in the violent separation of soil layers, leading to diverse microhabitats and smaller patch sizes [37]. Investigating the functional stability of such heterogeneous ecosystems can significantly enhance our understanding of the mechanisms underlying ecosystem function maintenance. However, it remains unclear how the functional stability changes along the successional pathway in such special ecosystems, as well as what the driving factors are influencing functional stability.
Karst forest is widely distributed in the southwest of China, representing a typical heterogeneous forest ecosystem [38]. Due to its pronounced micro-habitat heterogeneity and shallower soil layer, the karst region is characterized by a discontinuous soil layer and weaker water conservation capacity. The vegetation on the karst landscape consists of subtropical evergreen–deciduous mixed forests, which differ significantly from the typical mid-subtropical evergreen broadleaved forests at the same latitude [39]. Previous studies have demonstrated that the karst forest has a hyper-diverse species pattern and is susceptible to disturbances [40] due to the special distributions of the soil’s physical and chemical properties caused by unique topographical and geomorphological features [41]. However, there is a lack of direct investigation into the sensitivity of and changes in the karst ecosystem along the successional pathway. Therefore, analyzing the functional characteristics of different communities in karst areas can enhance the comprehension of the relationship between biodiversity and stability. In this study, 30 forest dynamics plots (FDPs) were established to determine key plant functional traits along the successional pathway in degraded karst forests. This study sought to investigate how the plant functional space changed over the successional pathway, focusing on the key traits that drove these changes. Additionally, it aimed to measure how and which critical biotic/abiotic factors influenced the functional stability, thereby addressing the following questions: (i) How do PFTs and their indicating functional spaces change along the successional pathway in degraded karst forests? (ii) How do FEs and their indicating functional stability change along the successional pathway in degraded karst forests? (iii) Which factor acts more in determining functional stability?
2. Materials and Methods
2.1. Study Area and FDPs Establishment
This study was undertaken within the confines of the Maolan National Nature Reserve (25°09′–25°20′ N, 107°52′–108°05′ E), Guizhou Province, Southwest China (Figure 1), with an average elevation of 550 to 850 m. The study area is characterized by limestone soils, predominantly classified into two subtypes: Haplic Calcisols and Dolomitic Calcisols [42]. These soils are characterized by their shallow depth and a pH range that typically fluctuates from slightly acidic to neutral, with a high content of calcium and organic matter [43]. The region has a subtropical humid climate with an average annual temperature of 15.3 °C, an annual sunshine duration of 1272.8 h, and a total annual rainfall of 1752.5 mm. Significantly, approximately 80% of this rainfall is concentrated between April and October, giving rise to a distinct wet season. The predominant vegetation type within the study area is evergreen–deciduous broadleaved mixed forest [44], which is attributed to the heterogenous and inter-tile soil conditions. This forest demonstrates a greater SR compared to subtropical deciduous broadleaved forests at equivalent latitudes. The forest canopy is primarily composed of Quercus glauca Thunb., Clausena dunniana H. Lév., Boniodendron minus (Hemsl.) T. Chen, with Nandina domestica Thunb., Lindera communis Hemsl and Mahonia fortunei (Lindl.) Fedde emerging as the dominant understory tree species. Due to the complex disturbance regime, the forests experienced varying degrees of degradation. Within the nature reserve, selective logging for firewood emerged as the predominant form of disturbance (with larger trees used for house construction, furniture and coffin making, while smaller individuals were primarily harvested for firewood and charcoal collection) [45]. The effects of this particular disturbance were relatively benign, typically resulting in the transition to a shrub–canopy stage. Upon cessation of the disturbance, the disturbed forest underwent a specific successional pathway while recovering to its climax community. To explore the potential successional mechanisms, a series of FDPs were established along the natural successional pathway within the nature reserve from June to September 2021, following the technical specifications outlined by Condit [46]. Here, we classified the shrub–canopy stage (the last disturbance occurred within 20 years) as the early successional stage and the pioneer canopy (the last disturbance occurred 40 years ago) as the later successional stage. The old-growth forests (no disturbance over 100 years according to records) were considered the climax community [45]. In each successional stage, 10 FPDs (30 m × 30 m) were established (Table 1). Using the Real-Time Kinematic positioning device (DJ-Innovations Inc., Shenzhen, China), the coordinates of each FDP and the coordinates of the 10 m × 10 m grid were determined. All the individuals with a diameter at breast height (DBH) ≥ 1 cm in each FDP were tagged, located and measured for their heights and DBH [46]. Based on the phenotypic and breeding characteristics, all the tagged individuals were identified as species. This comprehensive survey resulted in the documentation of 15,725 stems across 286 distinct species (Table S1).
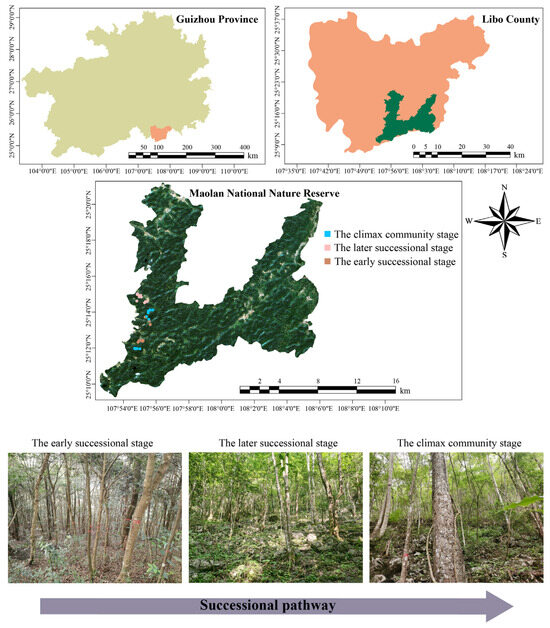
Figure 1.
Geographic locations of the FDPs established.

Table 1.
FDP detailed information.
2.2. PFTs Collections and Measurements
According to the standardized PFT measurement handbooks worldwide, we randomly collected leaf traits from 3–5 individuals (all individuals if the species abundance was less than 3) of each species in each FDP [47]. Specifically, two mature and pest-free leaves from each sampled individual were measured for functional traits. Then, we measured 6 key leaf functional traits, including the specific leaf area (SLA, cm2/g), leaf dry matter content (LDMC, g/g), leaf thickness (LT, mm), leaf carbon concentration (LCC, mg/g), leaf nitrogen concentration (LNC, mg/g) and leaf phosphorus concentration (LPC, mg/g). Leaf area was measured using a leaf area meter (LI-COR 3000C Area Meter, LI-COR, Inc., Lincoln, NE, USA) and calculated with the ‘Leaf Area’ package with ‘ImageJ 1.53 k’ software (National Institutes of Health, Bethesda, MD, USA, https://imagej.nih.gov/ij (accessed on 5 December 2024)) in the R 3.3.2 version [48]. SLA was calculated as the ratio of the fresh leaf surface area to the dry mass of the leaf tissue. LT was determined using an electronic digital caliper (SF2000, Digital Electronic Co., Ltd., Guilin, China) with an accuracy of 0.01 mm. LDMC was determined by dividing the leaf dry mass by the leaf fresh mass, without the leaf being rehydrated. LCC and LNC were determined by an elemental analyzer (UNICUBE trace, Elementar, Frankfurt, Germany), and LPC was determined by the molybdenum–antimony anti-colorimetric method.
2.3. Environment Factors Obtained and Determination
Soil samples were systematically collected in October 2021, employing a five-point sampling method to ensure a representative coverage of the study area [49]. Initially, the central sampling point for each FDP was established at the intersection of the two diagonals. Subsequently, four additional equidistant sampling points were selected along the lengths of these diagonals. In cases where the sampling points were situated on exposed rocks, nearby areas were sampled instead. Subsequently, soil samples from each FDP were removed from the soil surface, and litter and humus layers were collected before collecting the soil layer 0 to 20 cm. The soil samples, collected from each designated sampling point, were homogeneously amalgamated to form a composite soil sample. These composite samples were then carefully preserved and transported to the laboratory in cryogenic containers filled with liquid nitrogen to maintain their integrity. A total of 30 soil samples were collected (one from each plot) and air-dried before being sieved through screens with pore sizes of 0.25–2.00 mm for an analysis of physical and chemical properties, while the other part was sieved through 1 mm screens for the determining of enzyme activity indicators [43].
A suite of eight soil nutrient parameters was assessed, including the potential of hydrogen (pH), exchangeable calcium (Eca), particulate organic carbon (Poc), light-fraction organic carbon (Lfoc), soil organic carbon (Soc), available potassium (AK), total potassium (TK) and total phosphorus (TP). Soil pH was measured using a pH meter (PHSJ-3F, INESA, Shanghai, China). The Aca was determined by the atomic absorption spectrometry method [50]. The Poc was determined by the sodium hexametaphosphate extraction method [51]. The Lfoc was determined using the method described by Gregorich and Ellert [52]. The Soc was determined using an elemental analyzer (UNICUBE trace, Elementar, Germany). The soil AK content was determined using a velocimeter (TFC-1B, Qiangsheng Analysis Instruments Co., Ltd., Beijing, China). The soil TK was determined by the flame photometric method [50]. Soil TP was determined by the Mo-Sb colorimetric method [53].
Topographic factors were extracted using a portable LiDAR scanning system (SLAM100, Feima Robotics Technology Co., Ltd., Shenzhen, China) and the ArcMap 10.8 Geographic Information System software [54]. First, LiDAR360 (version 6.0, GreenValley International, Berkeley, CA, USA) software was utilized to calculate a range of topography parameters. The software’s ‘ground point classification feature’ was employed to differentiate ground points from non-ground objects within the handheld LiDAR-generated point cloud data. Following this classification, the identified ground points were subsequently processed to produce raster data, which served as the basis for constructing a digital elevation model (DEM) using the software’s integrated ‘digital elevation model’ function. Finally, ArcMap 10.8 software was deployed to compute various abiotic indicators, including digital elevation (Ele), slope (Slope), aspect (Aspect), profile curvature (Pfc), planar curvature (Pnc), topography relief (Tr) and ground roughness (Roughness). All the environment factors are listed in Table S2.
2.4. Data Analysis
2.4.1. The Functional Space Based on PFTs
To discern the primary gradients of variation in functional traits and their spatial distribution within the functional trait space, we utilized the ‘princomp’ function from the ‘ape’ package to perform a principal component analysis on the dataset comprising species’ functional traits. Subsequently, the analytical outcomes were visualized using the ‘funtest’ and ‘plot’ functions of the ‘funspace’ package [55], with all analyses and graphical renderings conducted within the R software (version 4.2.3, R Foundation for Statistical Computing, Vienna, Austria).
2.4.2. FEs and Indicating Functional Stability
According to the approaches proposed by Mouillot et al. [21], the K-means clustering algorithm was used to categorize the six functional traits of species into different levels, representing varying degrees of similarity among corresponding functional traits. This categorization facilitated the subsequent calculation of FEs. Each functional entity (FE) was delineated by distinctive combinations of various categorical functional traits. (Table 2.). Specifically, each unique combination of functional trait levels was considered an FE through the arrangement and combination of different levels of functional traits. Initially, we employed the ‘mFD::sp.to.fe’ function from the ‘mFD’ package to aggregate species into FEs, thereby obtaining comprehensive information on functional entities, including the number of FEs, the characteristics of FEs and the number of species within each FE. Subsequently, FR, FOR and FV were calculated using the ‘mFD::alpha.fd.fe’ function of the ‘mFD’ package, which enabled us to acquire detailed lists of the FE, FR, FOR and FV for each sampling plot. Finally, we utilized the ‘mFD::alpha.fe.fd.plot’ function of the ‘mFD’ package to generate graphical representations of FEs. Theoretically, our study encompassed 324 possible trait combinations from the six functional traits, with each combination constituting a distinct FE. This analysis was performed using ‘mFD’ packages in the R 4.2.3 version [56]. In fact, the number of functional entities we obtained was far less than the theoretical value (Table S3).
Table 2.
Description and classification criteria of the measured functional traits.
Three functional indices (FR, FOR and FV) were chosen to delineate the functional attributes of the successional karst forests.
FR represents the average number of species per FE; FOR indicates the percentage of species in FEs having more species than expected from the FR; FV denotes the percentage of FEs having only one species.
where S is the total number of species in each FDP; FE is the total number of FEs; and ni is the number of species in FE i.
This analysis was performed using ‘mFD’ packages in the R 4.2.3 version [56].
2.4.3. Species α-Diversity Indices
In this study, SR was operationalized as the count of distinct species in each FDP. The product of the Shannon–Wiener index and the logarithm of SR represented Pielou’s evenness index, which was employed to measure the evenness of species distribution. We utilized the ‘rarefy’ function of R package vegan to calculate the rarefied SR index, in order to mitigate the impact of the sample size on the diversity index. This was incorporated as a supplementary parameter for comparing diversities across different plots. This analysis was performed using ‘vegan’ packages in the R 4.2.3 version [57]. The specific formula is as follows:
where S is the number of species; N represents the total number of individuals of all species; and n is the size of samples taken during the sparsity process. In this study, n = 10, xi is the abundance of species i, , and Pi is the relative abundance of species i.
2.4.4. The Biotic/Abiotic Factors Determining Functional Stability
In this study, we investigate the effects of biotic and abiotic factors on the functional stability based on the FEs. We considered species diversity as the biotic factor and soil nutrients and topographic factors as the abiotic factor. The selected environmental variables were designated as explanatory variables for further statistical analysis. We constructed multiple linear regression models to assess the underlying relationships between functional stability and the selected environmental variables. Before the linear regression analyses, all environmental variables and functional features were logarithmically transformed and subsequently z-score normalized. This standardization process allowed for calculating coefficients that can be compared within and across multiple linear regression models, enabling a more rigorous assessment of the relative importance of different predictors [58]. To elucidate the relationships between functional stability parameters and explanatory variables, we employed the ‘lm’ function to construct multiple linear regression models. Subsequently, the ‘dredge’ function (R package MuMIn) was utilized to perform stepwise backward regression on these models, aiming to achieve model simplicity and optimal fit. This approach helps in selecting the most parsimonious model that best explains the variance in the data [59]. Specifically, the ‘dredge’ function was utilized to investigate the effects of 8 soil physicochemical indicators and 6 topographic factors on 4 functional stability indicators, and the optimal model was selected based on the AICc criterion [59]. However, from the stepwise backward regression analysis, only the indicators Pfc, Ele, pH, AK, TK, TP, Eca, Poc, Lfoc and Soc were retained in the model, while all other indicators were excluded from the model. Finally, the ‘rdacca.hp’ (R package rdacca.hp) method was applied to hierarchically partition the parameters of the optimal model, thereby obtaining the variance explanation rate for each explanatory variable [60]. This hierarchical partitioning allowed us to quantify the individual contributions of each explanatory variable to the overall model. Additionally, we constructed linear models using the ‘lm’ function to investigate the impact of each biological factor on functional stability, thereby providing a comprehensive understanding of the underlying mechanisms. We performed all data analyses with the R software version 4.2.3 [61].
3. Results
3.1. Variation in Functional Space Among Successional Stages in Degraded Karst Forests
The first two principal components (PCs) derived from the PCA on the trait data explained 66.64% of the variability in the climax community stage, followed by 64.53% in the later successional stage and 59.85% in the early successional stage (Figure 2A–C). In the first functional space of the climax community stage, SLA, LT and LDMC exhibited a higher percentage of explained variance compared to LCC, LNC and LPC (Table 3). Conversely, SLA, LT, LNC and LDMC showed a better representation than LCC and LPC in the other two stages (Table 3). Additionally, the explanatory power of SLA and LCC for the functional space gradually decreased with succession, while LDMC, LT and LNC showed the opposite trend. Overall, as succession progresses, the functional space gradually increases, and the explanatory power of functional traits for the two main axes of the functional space gradually rises.
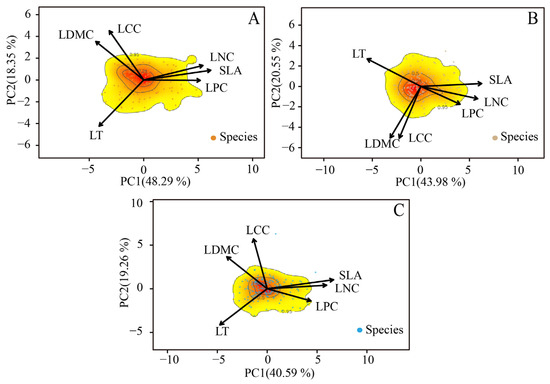
Figure 2.
The PCA of functional traits within the functional space in the early successional stage (A), later successional stage (B) and climax community (C). Contour lines are used to outline the color gradient, which represents the kernel density of species distribution (from dense, indicated by red, to sparse, indicated by light yellow), corresponding to the 25%, 50% and 95% quantiles of species abundance. The differently colored dots represent the distribution of species in each successional stage.
Table 3.
The percentage of variance explained for each trait in different successional stages.
3.2. Variations in Functional Stability Among Successional Stages in Degraded Karst Forests
The FR reached its peak of 3.0 during the early successional stage, while the later successional stage exhibited an FR level of 2.8. Finally, the climax community stage displayed the lowest FR level at 2.7. The average number of species per FE was at least two (Figure 3). The early successional stage exhibited the highest level of FOR, with an average of 41.4% of species displaying this pattern. Conversely, the climax community stage had the lowest level, with 39% of species contributing to the FOR. The later successional stage occupied an intermediate position, with 40.4% of species exhibiting this over-redundancy pattern. In addition, the variation in FV showed a similar trend to FR with succession (51.7% to 55.4%). Overall, there was a decreasing trend in FOR along the successional pathway, as well as FR; the number of FEs was opposite to the FR.
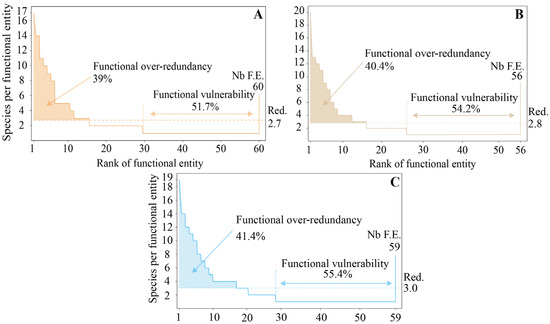
Figure 3.
Variations in functional stability among successional stages in degraded karst forests. The bottom right of the distribution diagram indicates the number of functional entities (Nb F.E.) present in each successional community. Functional richness (FR, denoted as ‘Red.’) is represented by the horizontal dashed line, which corresponds to the mean number of species per functional entity, with the specific value annotated on the right margin of the panel. Functional vulnerability (FV) is indicated by the horizontal color line accompanied by arrows. Functional over-redundancy (FOR), which represents the percentage of species that exceed the expected number based on FR in over-represented functional entities, is depicted through color coding. Dark yellow represents the climax community stage (A); light brown represents the later successional stage (B); blue represents the early successional stage (C).
3.3. Relationships Between Species Diversity and FEs Along Successional Pathway
The presence of functional entities (FEs) demonstrated a positive correlation with SR throughout the three distinct successional stages (Figure 4A, slope: 0.427, p < 0.001). As the rarefied species richness increased, the richness of FEs also increased (Figure 4E, slope: 3.09, p < 0.05). No significant changes were observed in the FE with Pielou’s evenness (Figure 4I, p > 0.05). Additionally, FEs demonstrated strong correlations with SR in the early successional stage (R2 = 0.74, p < 0.001), later successional stage (R2 = 0.92, p < 0.001) and the climax community stage (R2 = 0.68, p < 0.01). The rarefied species richness was positively correlated with the FEs in the later successional stage (R2 = 0.52, p < 0.05).
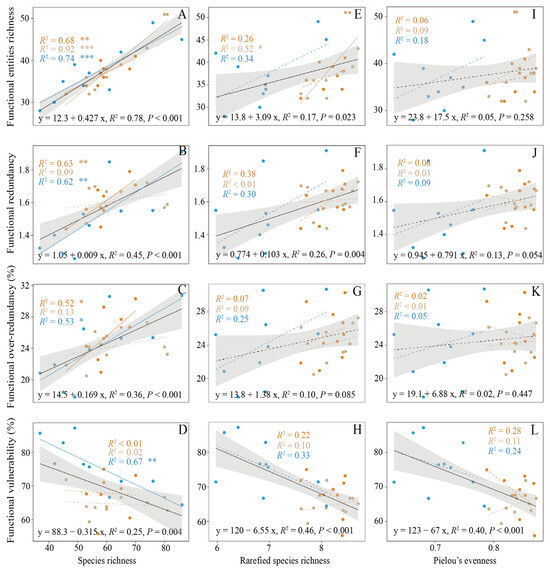
Figure 4.
Relationship between α-diversity (species richness (A–D), rarefied species richness (E–H), Pielou’s evenness (I–L)) and four functional indices for the successional stages. The black line delineates the fitted linear function relating α-diversity and the functional indices. Solid lines represent significant effects, while dashed lines denote nonsignificant effects. Dark yellow represents the climax community stage; light brown represents the later successional stage; blue represents the early successional stage. *, p < 0.05; **, p < 0.01; ***, p < 0.001.
FR exhibited a positive correlation with SR (Figure 4B, slope: 0.009, p < 0.001) and rarefied species richness (Figure 4F, slope: 0.103, p < 0.01) across three successional stages. However, no significant correlation was observed between FR and Pielou’s evenness (Figure 4J, p > 0.05). FR was positively correlated with SR in the early successional stage (R2 = 0.62, p < 0.01) and the climax community stage (R2 = 0.62, p < 0.01).
A positive correlation was observed between FOR and SR across the three successional stages (Figure 4C, slope: 0.169, p < 0.001). Specifically, FOR was positively correlated with the SR in the early successional stage (R2 = 0.52, p < 0.01) and the climax successional stage (R2 = 0.62, p < 0.01). On the other hand, SR (Figure 4D, slope: −0.315, p < 0.01), rarefied species richness (Figure 4H, slope: −6.55, p < 0.001) and Pielou’s evenness (Figure 4L, slope: −67, p < 0.001) were negatively correlated with FV in the three successional stages. However, only the early successional stage exhibited a negative correlation between FV and the successional stage alone (R2 = 0.67, p < 0.01). The distribution of SR among FEs revealed an uneven allocation of most species within a limited subset of FEs.
3.4. The Influence of Environmental Factors on Functional Stability
The results of the hierarchical partitioning analysis (Figure 5) showed that soil topography characteristics exerted the predominant influence on the observed variations in FEs. Overall, the topographic factor explained 36% of the variation in FEs, and the soil factor explained 64% (Adj. R2 = 0.41). Specifically, Pfc (p < 0.05), Eca (p < 0.05) and Lfoc (p < 0.01) were positively correlated with FEs, while Soc (p < 0.01) was negatively correlated with FEs (Table 4). Notably, Poc had no significant relationship with functional entities, but its impact was positive.
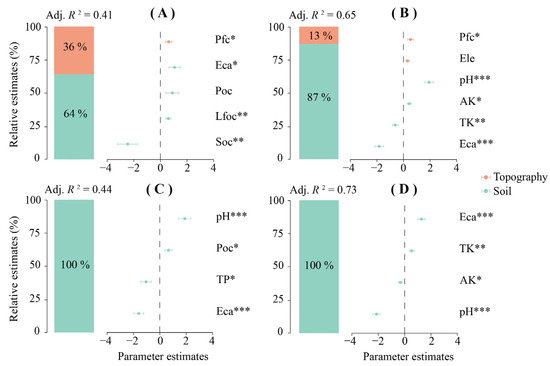
Figure 5.
Figure (A–D) illustrate the relative effects of various predictors on FEs, FR, FOR and FV, respectively. The model’s averaged parameter estimates, standardized as regression coefficients, are displayed alongside their corresponding 95% confidence intervals. The relative importance of each predictor is quantified by the proportion of explained variance it accounts for. The relative impact of the predictors and their interactions is calculated by dividing the parameter estimate of each predictor by the sum of all parameter estimates, with the result expressed as a percentage. Abiotic factors include topography and soil. Pfc is the profile curvature; Ele represents the elevation; Eca denotes the exchangeable calcium; POC represents the particulate organic carbon; LFOC represents the light-fraction organic carbon; pH indicates the pH value; TP denotes the total phosphorus; TK represents the total potassium; SOC represents the soil organic carbon; AK represents the available potassium; S-SC denotes the soil saccharase. *, p < 0.05; **, p < 0.01; ***, p < 0.001.
Table 4.
Regression analysis results of the impact of environmental variables on functional characteristics. *, p < 0.05; **, p < 0.01; ***, p < 0.001.
FR was positively correlated with Pfc (p < 0.05), pH (p < 0.001) and AK (p < 0.05), amd it was negatively correlated with TK (p < 0.01) and Eca (p < 0.001). The topographic factors Pfc and Ele explained 13% of the FR variance; although Ele positively affected FR, it did not show significance. Additionally, the soil factor explained the 87% variation in FR (Adj. R2 = 0.65) (Table 4). The influence of topography and soil available nutrients on FR showed a skewed trend, and overall, the impact of soil available nutrients on FR was greater than that of topographic indices.
The soil factor explained the whole variation in FOR (Adj. R2 = 0.44); however, the influence of topographic indices on FOR did not manifest itself during the hierarchical partitioning process. Specifically, pH (p < 0.001) and Poc (p < 0.05) were positively correlated with FOR, while TP (p < 0.05) and Eca (p < 0.001) were negatively correlated with FOR (Table 4).
In addition, the variation in FV was explained by the soil factor (Adj. R2 = 0.73), which was similar to FOR. However, Eca (p < 0.001) and TK (p < 0.01) were positively correlated with FV, while AK (p < 0.05) and pH (p < 0.001) were negatively correlated with FV (Table 4). Overall, soil available nutrients were the dominant factors for the variation in FOR and FV, while topographic factors influenced the changes in FR and FE.
4. Discussion
By quantifying functional space and stability along the successional pathway in degraded karst forests, we observed a decrease in both FOR and FV. The count of FEs and redundancy were positively correlated with SR. Notably, FOR and FV exhibited strong correlations with soil factors, while soil and topography significantly influenced the variation in FEs and FR.
4.1. Variations in PFTs and Indicating Functional Space Among Successional Stages in Degraded Karst Forests
PFTs indicate the ecological strategies adopted by species in response to environmental changes [62]. Normally, a thinner LT is correlated with water-limited conditions [63]. We found a significant decrease in LT, indicating that plant water resource utilization has a substantial impact on the variation in PFTs along the successional pathway [64]. Notably, temperature variability is a critical determinant of functional changes in subtropical forest ecosystems [65]. However, the influence of extreme climates on species might be limited in the study area, which has developed under a warm and humid monsoon climate. Furthermore, recent research has revealed that natural recovery can positively impact plant diversity and soil nutrients in regional ecosystems [66]. Therefore, we hypothesize that the significant increase in LPC and LNC observed during the successional pathway can be attributed to the stable temperature range and natural recovery in the region. Along the successional pathway, the functional space continues to expand, with SLA, LDMC, LT and LNC playing a dominant role in the changes in the functional space. However, this finding differs from the findings of Zhang et al. [20]. A possible reason is that the communities have favorable environmental conditions and lower intraspecific competition after reaching a peak stage of relative stability [67], which ensures the coexistence of a greater number of species [68,69]. Moreover, a species-rich community supports a larger functional space. Overall, species exhibit significant shifts in functional traits as succession proceeds, reflecting variations in ecological strategies in response to environmental changes. These adaptations to resource availability and competition influence the functional space of plant communities, ultimately affecting ecosystem functions and stability.
4.2. Changes in Functional Stability Along the Successional Pathway in Degraded Karst Forests
The FR varied between 2.7 and 3.0, indicating an average presence of at least two species within each FE. A higher FR may serve as a buffer against community instability due to species loss. Different from the findings of Huang et al. [32], the extremely heterogeneous topographic conditions within the reserve result in severe heterogeneity in environmental factors such as light, heat and water due to numerous exposed rocks that fragment habitats into multiple discontinuous patches [70]. As a result, the complex topography exerts significant pressure on the survival of the plant communities in the region [45]. However, the unique environmental conditions facilitate the reliance of species through unique genetic adaptations for their survival [71], thereby promoting the coexistence of many species with similar functions and enhancing the FR [72]. Functional stability and resilience are primarily determined by the distribution patterns of species across functional groups or entities. Our results indicated that FOR decreased along the successional pathway. Notably, approximately 40% of species exhibited an over-redundant distribution pattern across all successional stages. This finding suggested a significant proportion of species clustered within a limited number of FEs, thereby enhancing the stability of certain ecosystem functions [21]. However, empirical evidence demonstrated that most unique ecosystem functions were primarily determined by a small subset of species [73]. These species typically possess specific functional trait values that enable them to optimally perform these functions [74]. Our investigation substantiates the hypothesis that species tend to aggregate within the main FEs rather than being evenly distributed across them. Additionally, a large proportion of FEs contain only a single species (FV), indicating the high vulnerability of ecosystem functions performed by these species to disturbances. The loss of such species would consequently lead to the disappearance of corresponding ecosystem functions [75]. Therefore, our study suggested that among the successional stages in degraded karst forests, functional stability increased due to a higher FR, thereby enhancing the capacity to resist future disturbances. Notably, the loss of species with unique traits possibly has strong effects on functional stability.
4.3. Determining Factors Driving Functional Stability in Degraded Karst Forests
A strong positive correlation between FR and both SR and rarefied species richness (p < 0.01) is observed, indicating that communities with varying levels of SR possess distinct capacities to withstand future disturbances [21,22]. The successional pathway enhances soil fertility, facilitating the growth of soil-demanding species that typically promote high levels of SR and evenness [76]. Such an increasing SR serves as an insurance mechanism for the community to resist the decline in FV [15]. However, we observed a declining trend in FV with the increasing α-diversity (p < 0.001) (Figure 4D,H,L), suggesting that the assurance of stability afforded by enhanced species diversity is not inherently guaranteed [20], even though tropical forest exhibits a higher biodiversity and higher FV [18,22]. Recent studies have reported that a large number of FEs in subtropical forest regions are exclusively occupied by a single species with unique functional traits, making these areas more susceptible to ecosystem function vulnerability [32]. In our study, over 51% of FEs were comprised solely of one species throughout the successional pathway, predominantly rare species. Species with a low local abundance typically had a greater sensitivity to nature- and human-induced disturbances than abundant species [77]. However, these species often possess unique functional traits, and the functions performed by them may play a pivotal role in shaping the relationship between diversity and ecosystem functions [20,78]. The disappearance or extinction of these unique species results in the loss of their distinctive trait combination and irreplaceable functions [75,79]. Therefore, our study underscored that rich species diversity provided a safeguard for FR, while a high level of FV constantly threatened functional stability.
The interaction between plant functional traits and the environment is pivotal when examining whether ecosystem functional stability can be buffered by FR [28,29]. In this study, topography and soil factors exhibited significant correlations with FEs and FR. Soc, Aca and Lfoc exerted a substantial influence on the quantity of FEs. The possible reason is that the regulatory role of topography indicators on nutrients at local scales enhances the adaptability of regional species [80]. Although these topographic conditions differ from conventional landforms [40], species with unique functional traits are more likely to be filtered in highly heterogeneous environments [81]. In addition, FR was significantly constrained by pH, AK, TK and Eca. Soil factors had a more pronounced influence on the functional metrics under consideration. This unique habitat condition makes numerous species more susceptible to the environmental filtering represented by soil factors [82]. Consequently, the species with similar functional traits increase and affect the FR, promoting species coexistence and providing potential insurance for the community [83]. Furthermore, these findings may be attributed to the observation that species inhabiting stressful environments tend to exhibit enhanced nutrient retention and improved nutrient use efficiency, diminishing their ability to respond dynamically to environmental fluctuations [84]. Interestingly, we speculated that Pfc limited species similarity, allowing the coexistence of species with different traits, thereby increasing the number of FEs [85]. The FOR was significantly negatively affected by TP and Eca. Previous studies showed that communities in subtropical forests were phosphorus-limited [86], suggesting the distribution of soil nutrient resources strongly influenced species coexistence in resource-poor environments [87]. These species were densely clustered into a few FEs, further suggesting a higher FV [15,21,32]. In addition, FV was positively affected by Eca and TK and negatively affected by pH and AK. The FV increased with the decline in soil nutrient availability. Previous studies implied that soil characteristics greatly influenced pH levels and soil nutrient availability, determining the growth and survival of plants [88]. Therefore, we hypothesized that this nutrient deficiency acts as an environmental filter, resulting in species with similar resource acquisition abilities clustering more densely within a few FEs, thereby exhibiting a higher FV. Our results emphasized the importance of soil nutrient availability in determining the alternation of ecosystem functionality in degraded karst forests [45,66] and thereby the resistance and resilience of ecosystems to future disturbances [30].
5. Conclusions
Our study demonstrated that, as natural succession progresses in karst ecosystems, the resilience provided by FR significantly declines, while the resistance to disturbances, as indicated by FV, increases. Despite the inconsistent changes in these two aspects, the functional stability of karst ecosystems gradually strengthens compared with other ecosystems at the same latitude. In addition, a higher SR in karst forests provides a more effective insurance, and the loss of species with unique trait combinations is likely to have significant effects on ecosystem functions, which emphasizes the importance of the conservation of species with unique traits in natural forest management. Furthermore, our findings highlight the importance of soil nutrient availability in driving the functional stability of heterogeneous forest ecosystems; specifically, an increase in soil pH and AK significantly enhances the successional pathway’s resilience. In contrast, a rise in Eca, TP and TK reduces the resistance to disturbances. Such indicators appear to be more critical for functional stability in degraded karst ecosystems, thereby enhancing the comprehension of the mechanisms governing ecosystem function maintenance under extreme habitat conditions. However, the sample size and other plant traits (such as water storage capacity, plant height, leaf lifespan, root length and wood density) might greatly influence the estimation of functional stability. Therefore, future studies should consider increasing the sample size and evaluating a broader range of functional traits to enhance the reliability of this research. This approach will enable a more accurate elucidation of the mechanisms and factors influencing the variation in plant functional stability in the region, thereby providing theoretical references for studies on forest ecosystems in extremely heterogeneous environments.
Supplementary Materials
The following supporting information can be downloaded at: https://www.mdpi.com/article/10.3390/f16020304/s1, Table S1. Species information table; Table S2: Details of the environmental index; Table S3: The detail of FE in each FDP.
Author Contributions
Y.L.: Software, Validation, Formal analysis, Investigation, Data curation, Writing—original draft, Writing—review and editing, Visualization. L.M.: Investigation, Data curation. L.C.: Investigation, Data curation. M.S.: Conceptualization, Methodology, Writing—review and editing. G.Z.: Conceptualization, Methodology, Writing—review and editing. Q.L.: Conceptualization, Methodology., Writing—review and editing. D.C.: Conceptualization, Methodology, Writing—review and editing. F.D.: Conceptualization, Methodology, Writing—review and editing. L.Z.: Conceptualization, Methodology, Software, Validation, Formal analysis, Data curation, Writing—original draft, Writing—review and editing, Visualization, Supervision, Project administration, Funding acquisition. All authors have read and agreed to the published version of the manuscript.
Funding
This study was funded by the National Natural Science Foundation of China (Grant Number: 32360380 and 32360278), Guizhou Provincial Key Technology R&D Program (General [2023]111) and the basic Research Program in Guizhou Province (Foundation-ZK [2022] General 098).
Data Availability Statement
The raw data supporting the conclusions of this article will be made available by the authors on request.
Acknowledgments
We are grateful for the substantial assistance we received, without which this study would not have been possible. The laboratory, experimental equipment and consumables provided by the College of Forestry of Guizhou University enabled us to conduct numerous indoor experiments. Additionally, the managers and staff of the Guizhou Maolan National Nature Reserve Administration and Weng’ang Management Station provided invaluable support for our fieldwork. The forest rangers of the Weng’ang Management Station played crucial roles in various aspects of our fieldwork. Lastly, we extend our heartfelt gratitude for the assistance provided by the above-mentioned units and individuals!
Conflicts of Interest
The authors declare that they have no known competing financial interest or personal relationships that could have appeared to influence the work reported in this paper.
References
- Gonzalez-Maya, J.F.; Víquez-R, L.R.; Arias-Alzate, A.; Belant, J.L.; Ceballos, G. Spatial patterns of species richness and functional diversity in Costa Rican terrestrial mammals: Implications for conservation. Divers. Distrib. 2016, 22, 43–56. [Google Scholar] [CrossRef]
- Pennekamp, F.; Pontarp, M.; Tabi, A.; Altermatt, F.; Alther, R.; Choffat, Y.; Fronhofer, E.A.; Ganesanandamoorthy, P.; Garnier, A.; Griffiths, J.I.; et al. Biodiversity increases and decreases ecosystem stability. Nature 2018, 563, 109–112. [Google Scholar] [CrossRef]
- White, L.; O’Connor, N.E.; Yang, Q.; Emmerson, M.C.; Donohue, I. Individual species provide multifaceted contributions to the stability of ecosystems. Nat. Ecol. Evol. 2020, 4, 1594–1601. [Google Scholar] [CrossRef]
- de Bello, F.; Lavorel, S.; Hallett, L.M.; Valencia, E.; Garnier, E.; Roscher, C.; Conti, L.; Galland, T.; Goberna, M.; Májeková, M.; et al. Functional trait effects on ecosystem stability: Assembling the jigsaw puzzle. Trends Ecol. Evol. 2021, 36, 822–836. [Google Scholar] [CrossRef]
- Biggs, C.R.; Yeager, L.A.; Bolser, D.G.; Bonsell, C.; Dichiera, A.M.; Hou, Z.; Keyser, S.R.; Khursigara, A.J.; Lu, K.; Muth, A.F.; et al. Does functional redundancy affect ecological stability and resilience? A review and meta-analysis. Ecosphere 2020, 11, e03184. [Google Scholar] [CrossRef]
- Díaz, S.; Cabido, M. Vive la différence: Plant functional diversity matters to ecosystem processes. Trends Ecol. Evol. 2001, 16, 646–655. [Google Scholar] [CrossRef]
- Moro, A.V.I.; Borghetti, F.; Galetto, L.; Cellini, J.M.; Bravo, S.J. The influence of seed functional traits and anthropogenic disturbances on persistence and size of the soil seed bank from dry subtropical forest species. For. Ecol. Manage. 2024, 551, 121524. [Google Scholar] [CrossRef]
- Han, X.; Huang, J.; Yao, J.; Xu, Y.; Ding, Y.; Zang, R. Effects of logging on the ecological strategy spectrum of a tropical montane rain forest. Ecol. Indic. 2021, 128, 107812. [Google Scholar] [CrossRef]
- Craven, D.; Eisenhauer, N.; Pearse, W.D.; Hautier, Y.; Isbell, F.; Roscher, C.; Bahn, M.; Beierkuhnlein, C.; Bönisch, G.; Buchmann, N.; et al. Multiple facets of biodiversity drive the diversity–stability relationship. Nat. Ecol. Evol. 2018, 2, 1579–1587. [Google Scholar] [CrossRef]
- Hautier, Y.; Tilman, D.; Isbell, F.; Seabloom, E.W.; Borer, E.T.; Reich, P.B. Anthropogenic environmental changes affect ecosystem stability via biodiversity. Science 2015, 348, 336–340. [Google Scholar] [CrossRef]
- Isbell, F.; Gonzalez, A.; Loreau, M.; Cowles, J.; Díaz, S.; Hector, A.; Mace, G.M.; Wardle, D.A.; O’Connor, M.I.; Duffy, J.E.; et al. Linking the influence and dependence of people on biodiversity across scales. Nature 2017, 546, 65–72. [Google Scholar] [CrossRef] [PubMed]
- Wang, Z.; Huang, W.; Guan, X. Ecosystem Resilience Trends and Its Influencing Factors in China’s Three-River Headwater Region: A Comprehensive Analysis Using CSD Indicators (1982–2023). Land 2024, 13, 1224. [Google Scholar] [CrossRef]
- Bihn, J.H.; Gebauer, G.; Brandl, R. Loss of functional diversity of ant assemblages in secondary tropical forests. Ecology 2010, 91, 782–792. [Google Scholar] [CrossRef] [PubMed]
- Proios, K.; Michailidou, D.-E.; Lazarina, M.; Tsianou, M.; Kallimanis, A. Climate and Land Use Changes Impact the Future of European Amphibian Functional Diversity. Land 2024, 13, 1206. [Google Scholar] [CrossRef]
- Giordani, P.; Malaspina, P.; Benesperi, R.; Incerti, G.; Nascimbene, J. Functional over-redundancy and vulnerability of lichen communities decouple across spatial scales and environmental severity. Sci. Total Environ. 2019, 666, 22–30. [Google Scholar] [CrossRef]
- van der Sande, M.T.; Poorter, L.; Derroire, G.; do Espirito Santo, M.M.; Lohbeck, M.; Müller, S.C.; Bhaskar, R.; van Breugel, M.; Dupuy-Rada, J.M.; Durán, S.M.; et al. Tropical forest succession increases tree taxonomic and functional richness but decreases evenness. Glob. Ecol. Biogeogr. 2024, 33, e13856. [Google Scholar] [CrossRef]
- Rojas-Botero, S.; Solorza-Bejarano, J.; Kollmann, J.; Teixeira, L.H. Nucleation increases understory species and functional diversity in early tropical forest restoration. Ecol. Eng. 2020, 158, 106031. [Google Scholar] [CrossRef]
- Aguirre-Gutierrez, J.; Berenguer, E.; Oliveras Menor, I.; Bauman, D.; Corral-Rivas, J.J.; Nava-Miranda, M.G.; Both, S.; Ndong, J.E.; Ondo, F.E.; Bengone, N.N.s.; et al. Functional susceptibility of tropical forests to climate change. Nat. Ecol. Evol. 2022, 6, 878–889. [Google Scholar] [CrossRef]
- Pillar, V.D.; Blanco, C.C.; Müller, S.C.; Sosinski, E.E.; Joner, F.; Duarte, L.D.S. Functional redundancy and stability in plant communities. J. Veg. Sci. 2013, 24, 963–974. [Google Scholar] [CrossRef]
- Zhang, S.; Zang, R.; Sheil, D. Rare and common species contribute disproportionately to the functional variation within tropical forests. J. Environ. Manage. 2022, 304, 114332. [Google Scholar] [CrossRef] [PubMed]
- Mouillot, D.; Villéger, S.; Parravicini, V.; Kulbicki, M.; Arias-González, J.E.; Bender, M.; Chabanet, P.; Floeter, S.R.; Friedlander, A.; Vigliola, L.; et al. Functional over-redundancy and high functional vulnerability in global fish faunas on tropical reefs. Proc. Natl. Acad. Sci. USA 2014, 111, 13757–13762. [Google Scholar] [CrossRef] [PubMed]
- Zhang, S.; Zang, R. Tropical forests are vulnerable in terms of functional redundancy. Biol. Conserv. 2021, 262, 109326. [Google Scholar] [CrossRef]
- Gillison, A.N. Vegetation Functional Types and Traits at Multiple Scales; Springer International Publishing: Cham, Switzerland, 2016; pp. 53–97. ISBN 978-3-319-21452-8. [Google Scholar]
- McDowell, N.G.; Allen, C.D.; Anderson-Teixeira, K.; Aukema, B.H.; Bond-Lamberty, B.; Chini, L.; Clark, J.S.; Dietze, M.; Grossiord, C.; Hanbury-Brown, A.; et al. Pervasive shifts in forest dynamics in a changing world. Science 2020, 368, eaaz9463. [Google Scholar] [CrossRef]
- Sui, X.; Zhang, R.; Frey, B.; Yang, L.; Liu, Y.; Ni, H.; Li, M. Soil physicochemical properties drive the variation in soil microbial communities along a forest successional series in a degraded wetland in northeastern China. Ecol. Evol. 2021, 11, 2194–2208. [Google Scholar] [CrossRef] [PubMed]
- Parmentier, T.; Bonte, D.; De Laender, F. A successional shift enhances stability in ant symbiont communities. Commun. Biol. 2024, 7, 645. [Google Scholar] [CrossRef] [PubMed]
- Chazdon, R.L. Beyond Deforestation: Restoring Forests and Ecosystem Services on Degraded Lands. Science 2008, 320, 1458–1460. [Google Scholar] [CrossRef]
- Fetzer, I.; Johst, K.; Schäwe, R.; Banitz, T.; Harms, H.; Chatzinotas, A. The extent of functional redundancy changes as species’ roles shift in different environments. Proc. Natl. Acad. Sci. USA 2015, 112, 14888–14893. [Google Scholar] [CrossRef]
- Teixidó, N.; Gambi, M.C.; Parravacini, V.; Kroeker, K.; Micheli, F.; Villéger, S.; Ballesteros, E. Functional biodiversity loss along natural CO2 gradients. Nat. Commun. 2018, 9, 5149. [Google Scholar] [CrossRef] [PubMed]
- Bruno, D.; Gutiérrez-Cánovas, C.; Sánchez-Fernández, D.; Velasco, J.; Nilsson, C. Impacts of environmental filters on functional redundancy in riparian vegetation. J. Appl. Ecol. 2016, 53, 846–855. [Google Scholar] [CrossRef]
- Huang, C.; Xu, Y.; Zang, R. Variation Patterns of Functional Trait Moments Along Geographical Gradients and Their Environmental Determinants in the Subtropical Evergreen Broadleaved Forests. Front. Plant Sci. 2021, 12, 686965. [Google Scholar] [CrossRef] [PubMed]
- Huang, C.; Xu, Y.; Zang, R. Low functional redundancy revealed high vulnerability of the subtropical evergreen broadleaved forests to environmental change. Sci. Total Environ. 2024, 935, 173307. [Google Scholar] [CrossRef]
- Chen, X.; Zhang, D.; Liang, G.; Qiu, Q.; Liu, J.; Zhou, G.; Liu, S.; Chu, G.; Yan, J. Effects of precipitation on soil organic carbon fractions in three subtropical forests in southern China. J. Plant Ecol. 2015, 9, 10–19. [Google Scholar] [CrossRef]
- Li, M.; Luo, G.; Li, Y.; Qin, Y.; Huang, J.; Liao, J. Effects of landscape patterns and their changes on ecosystem health under different topographic gradients: A case study of the Miaoling Mountains in southern China. Ecol. Indic. 2023, 154, 110796. [Google Scholar] [CrossRef]
- Zhang, S.; Zang, R.; Huang, Y.; Ding, Y.; Huang, J.; Lu, X.; Liu, W.; Long, W.; Zhang, J.; Jiang, Y. Diversity maintenance mechanism changes with vegetation type and the community size in a tropical nature reserve. Ecosphere 2016, 7, e01526. [Google Scholar] [CrossRef]
- Micó, E.; Ramilo, P.; Thorn, S.; Müller, J.; Galante, E.; Carmona, C.P. Contrasting functional structure of saproxylic beetle assemblages associated to different microhabitats. Sci. Rep. 2020, 10, 1520. [Google Scholar] [CrossRef]
- Robinson, B.; Barnes, D.; Grange, L.; Morley, S. The Extremes of Disturbance Reduce Functional Redundancy: Functional Trait Assessment of the Shallow Antarctic Benthos. Front. Mar. Sci. 2022, 8, 797112. [Google Scholar] [CrossRef]
- Jiang, Z.; Lian, Y.; Qin, X. Rocky desertification in Southwest China: Impacts, causes, and restoration. Earth-Sci. Rev. 2014, 132, 1–12. [Google Scholar] [CrossRef]
- Tang, M.; Liu, J.; Hou, W.; Stubbendieck, R.M.; Xiong, H.; Jin, J.; Gong, J.; Cheng, C.; Tang, X.; Liu, Y.; et al. Structural variability in the bulk soil, rhizosphere, and root endophyte fungal communities of Themeda japonica plants under different grades of karst rocky desertification. Plant Soil 2022, 475, 105–122. [Google Scholar] [CrossRef]
- Liang, Y.; Pan, F.; Jiang, Z.; Li, Q.; Pu, J.; Liu, K. Accumulation in nutrient acquisition strategies of arbuscular mycorrhizal fungi and plant roots in poor and heterogeneous soils of karst shrub ecosystems. BMC Plant Biol. 2022, 22, 188. [Google Scholar] [CrossRef] [PubMed]
- Leung, J.Y.S. Habitat heterogeneity affects ecological functions of macrobenthic communities in a mangrove: Implication for the impact of restoration and afforestation. Glob. Ecol. Conserv. 2015, 4, 423–433. [Google Scholar] [CrossRef]
- IUSS Working Group WRB. World Reference Base for Soil Resources. International Soil Classification System for Naming Soils and Creating Legends for Soil Maps, 4th ed.; International Union of Soil Sciences (IUSS): Vienna, Austria, 2022; ISBN 979-8-9862451-1-9. [Google Scholar]
- Dai, Y.; Chen, D.; Zang, L.; Zhang, G.; Liu, Q.; He, Y.; Ding, F.; Wang, S.; Zhou, C.; Yang, Y.; et al. Natural restoration of degraded karst vegetation shifts soil microbial phosphorus acquisition strategies. Plant Soil 2023, 490, 201–215. [Google Scholar] [CrossRef]
- Fang, J.; Guo, K.; Wang, G.; Tang, Z.; Xie, Z.; Shen, Z.; Wang, R.; Qiang, S.; Liang, C.; Da, L.; et al. Vegetation classification system and classification of vegetation types used for the compilation of vegetation of China. Chin. J. Plant Ecol 2020, 44, 96–110. [Google Scholar] [CrossRef]
- Yang, Z.; Wu, Y.; Chen, S.; Sui, M.; Zhang, G.; Liu, Q.; Chen, D.; He, Y.; Zang, L. Does the universal adaptive strategy theory apply to natural regeneration in heterogeneous subtropical karst forests? Ecol. Indic. 2024, 165, 112168. [Google Scholar] [CrossRef]
- Condit, R. Tropical Forest Census Plots Methods and Results from Barro Colorado Island, Panama and a Comparison with Other Plots; Springer Science & Business Media: New York, NY, USA, 1998; ISBN 978-01-2183-940-6. [Google Scholar]
- Pérez-Harguindeguy, N.; Diaz, S.; Garnier, E.; Lavorel, S.; Poorter, H.; Jaureguiberry, P.; Bret-Harte, M.S.; Cornwell, W.K.; Craine, J.; Gurvich, D.; et al. New handbook for standardise measurement of plant functional traits worldwide. Aust. J. Bot. 2013, 61, 167–234. [Google Scholar] [CrossRef]
- Katabuchi, M. LeafArea: An R package for rapid digital image analysis of leaf area. Ecol. Res. 2015, 30, 1073–1077. [Google Scholar] [CrossRef]
- Long, F.; Zhou, G.; Zu, L.; Zang, L.; Chen, D.; Zhang, G.; Sui, M.; He, Y.; Liu, Q. Multi-Trophic Species Diversity Contributes to the Restoration of Soil Multifunctionality in Degraded Karst Forests through Cascading Effects. Forests 2024, 15, 559. [Google Scholar] [CrossRef]
- Bao, S.D. Analysis Method of Soil Agricultural Chemistry; China Agricultural Science and Technology Press: Beijing, China, 2007; ISBN 978-71-0906-644-1. [Google Scholar]
- Cambardella, C.A.; Elliott, E.T. Particulate soil organic-matter changes across a grassland cultivation sequence. Soil Sci. Soc. Am. J. 1992, 56, 777–783. [Google Scholar] [CrossRef]
- Janzen, H.H.; Campbell, C.A.; Brandt, S.A.; Lafond, G.P.; Townley-Smith, L. Light-Fraction Organic Matter in Soils from Long-Term Crop Rotations. Soil Sci. Soc. Am. J. 1992, 56, 1799–1806. [Google Scholar] [CrossRef]
- Han, F.; Ren, L.; Zhang, X.C. Effect of biochar on the soil nutrients about different grasslands in the Loess Plateau. Catena 2016, 137, 554–562. [Google Scholar] [CrossRef]
- Zhou, G.; Long, F.; Zu, L.; Jarvie, S.; Peng, Y.; Zang, L.; Chen, D.; Zhang, G.; Sui, M.; He, Y.; et al. Stand spatial structure and microbial diversity are key drivers of soil multifunctionality during secondary succession in degraded karst forests. Sci. Total Environ. 2024, 937, 173504. [Google Scholar] [CrossRef]
- Carmona, C.P.; Pavanetto, N.; Puglielli, G. funspace: An R package to build, analyse and plot functional trait spaces. Divers. Distrib. 2024, 30, e13820. [Google Scholar] [CrossRef]
- Magneville, C.; Loiseau, N.; Albouy, C.; Casajus, N.; Claverie, T.; Escalas, A.; Leprieur, F.; Maire, E.; Mouillot, D.; Villéger, S. mFD: An R package to compute and illustrate the multiple facets of functional diversity. Ecography 2022, 2022. [Google Scholar] [CrossRef]
- Dixon, P. VEGAN, a package of R functions for community ecology. J. Veg. Sci. 2003, 14, 927–930. [Google Scholar] [CrossRef]
- Wijewardene, L.; Wu, N.; Qu, Y.; Guo, K.; Messyasz, B.; Lorenz, S.; Riis, T.; Ulrich, U.; Fohrer, N. Influences of pesticides, nutrients, and local environmental variables on phytoplankton communities in lentic small water bodies in a German lowland agricultural area. Sci. Total Environ. 2021, 780, 146481. [Google Scholar] [CrossRef] [PubMed]
- Barton, K. MuMIn: Multi-Model Inference. R package version 1.47.1. 2022. Available online: https://CRAN.R-project.org/package=MuMIn (accessed on 6 February 2025).
- Lai, J.; Zou, Y.; Zhang, J.; Peres-Neto, P.R. Generalizing hierarchical and variation partitioning in multiple regression and canonical analyses using the rdacca.hp R package. Methods Ecol. Evol. 2022, 13, 782–788. [Google Scholar] [CrossRef]
- Team, R.C. R: A Language and Environment for Statistical Computing; R Foundation for Statistical Computing: Vienna, Austria, 2023. [Google Scholar]
- Wright, I.J.; Dong, N.; Maire, V.; Prentice, I.C.; Westoby, M.; Díaz, S.; Gallagher, R.V.; Jacobs, B.F.; Kooyman, R.; Law, E.A.; et al. Global climatic drivers of leaf size. Science 2017, 357, 917–921. [Google Scholar] [CrossRef] [PubMed]
- Liu, M.; Wang, Z.; Li, S.; Lü, X.; Wang, X.; Han, X. Changes in specific leaf area of dominant plants in temperate grasslands along a 2500-km transect in northern China. Sci. Rep. 2017, 7, 10780. [Google Scholar] [CrossRef]
- Muscarella, R.; Uriarte, M.; Aide, T.M.; Erickson, D.L.; Forero-Montaña, J.; Kress, W.J.; Swenson, N.G.; Zimmerman, J.K. Functional convergence and phylogenetic divergence during secondary succession of subtropical wet forests in Puerto Rico. J. Veg. Sci. 2016, 27, 283–294. [Google Scholar] [CrossRef]
- Shiono, T.; Kusumoto, B.; Maeshiro, R.; Fujii, S.; Götzenberger, L.; de Bello, F.; Kubota, Y. Climatic drivers of trait assembly in woody plants in Japan. J. Biogeogr. 2015, 42, 1176–1186. [Google Scholar] [CrossRef]
- Wang, S.; Chen, D.; Liu, Q.; Zang, L.; Zhang, G.; Sui, M.; Dai, Y.; Zhou, C.; Li, Y.; Yang, Y.; et al. Dominant influence of plants on soil microbial carbon cycling functions during natural restoration of degraded karst vegetation. J. Environ. Manage. 2023, 345, 118889. [Google Scholar] [CrossRef]
- Zhou, L.; Shalom, A.-D.D.; Wu, P.; Li, S.; Jia, Y.; Ma, X. Litterfall production and nutrient return in different-aged Chinese fir (Cunninghamia lanceolata) plantations in South China. J. For. Res. 2015, 26, 79–89. [Google Scholar] [CrossRef]
- Dudenhöffer, J.-H.; Luecke, N.C.; Crawford, K.M. Changes in precipitation patterns can destabilize plant species coexistence via changes in plant–soil feedback. Nat. Ecol. Evol. 2022, 6, 546–554. [Google Scholar] [CrossRef]
- Zemunik, G.; Turner, B.L.; Lambers, H.; Laliberté, E. Diversity of plant nutrient-acquisition strategies increases during long-term ecosystem development. Nat. Plants 2015, 1, 15050. [Google Scholar] [CrossRef]
- Wu, Y.; Yang, Z.; Chen, S.; Chen, L.; Sui, M.; Zhang, G.; Liu, Q.; Chen, D.; He, Y.; Zang, L. Drivers of β-diversity and its component-dependence along the natural restoration in an extremely heterogeneous forest ecosystem. Catena 2024, 243, 108224. [Google Scholar] [CrossRef]
- Goh, K.M.; González-Siso, M.-I.; Sani, R.K. Genomics of extreme environments: Unveiling the secrets of survival. Sci. Rep. 2023, 13, 21441. [Google Scholar] [CrossRef] [PubMed]
- Monge-González, M.L.; Guerrero-Ramírez, N.; Krömer, T.; Kreft, H.; Craven, D. Functional diversity and redundancy of tropical forests shift with elevation and forest-use intensity. J. Appl. Ecol. 2021, 58, 1827–1837. [Google Scholar] [CrossRef]
- Winfree, R.; Fox, J.W.; Williams, N.M.; Reilly, J.R.; Cariveau, D.P. Abundance of common species, not species richness, drives delivery of a real-world ecosystem service. Ecol. Lett. 2015, 18, 626–635. [Google Scholar] [CrossRef]
- Lohbeck, M.; Bongers, F.; Martinez-Ramos, M.; Poorter, L. The importance of biodiversity and dominance for multiple ecosystem functions in a human-modified tropical landscape. Ecology 2016, 97, 2772–2779. [Google Scholar] [CrossRef]
- van der Sande, M.T.; Arets, E.J.M.M.; Peña-Claros, M.; de Avila, A.L.; Roopsind, A.; Mazzei, L.; Ascarrunz, N.; Finegan, B.; Alarcón, A.; Cáceres-Siani, Y.; et al. Old-growth Neotropical forests are shifting in species and trait composition. Ecol. Monogr. 2016, 86, 228–243. [Google Scholar] [CrossRef]
- Bátori, Z.; Valkó, O.; Vojtkó, A.; Tölgyesi, C.; Farkas, T.; Frei, K.; Hábenczyus, A.A.; Tóth, Á.; Li, G.; Rádai, Z.; et al. Environmental heterogeneity increases the conservation value of small natural features in karst landscapes. Sci. Total Environ. 2023, 872, 162120. [Google Scholar] [CrossRef] [PubMed]
- Leitão, R.P.; Zuanon, J.; Villéger, S.; Williams, S.E.; Baraloto, C.; Fortunel, C.; Mendonça, F.P.; Mouillot, D. Rare species contribute disproportionately to the functional structure of species assemblages. Proc. R. Soc. B-Biol. Sci. 2016, 283, 20160084. [Google Scholar] [CrossRef] [PubMed]
- Violle, C.; Navas, M.L.; Vile, D.; Kazakou, E.; Fortunel, C.; Hummel, I.; Garnier, E. Let the concept of trait be functional! Oikos 2007, 116, 882–892. [Google Scholar] [CrossRef]
- Carmona, C.P.; Tamme, R.; Pärtel, M.; de Bello, F.; Brosse, S.; Capdevila, P.; González, M.R.; González-Suárez, M.; Salguero-Gómez, R.; Vásquez-Valderrama, M.; et al. Erosion of global functional diversity across the tree of life. Sci. Adv. 2021, 7, eabf2675. [Google Scholar] [CrossRef] [PubMed]
- Wen, D.; Yang, L.; Ni, K.; Xu, X.; Yu, L.; Elrys, A.S.; Meng, L.; Zhou, J.; Zhu, T.; Müller, C. Topography-driven differences in soil N transformation constrain N availability in karst ecosystems. Sci. Total Environ. 2024, 908, 168363. [Google Scholar] [CrossRef] [PubMed]
- Wieczynski, D.J.; Boyle, B.; Buzzard, V.; Duran, S.M.; Henderson, A.N.; Hulshof, C.M.; Kerkhoff, A.J.; McCarthy, M.C.; Michaletz, S.T.; Swenson, N.G.; et al. Climate shapes and shifts functional biodiversity in forests worldwide. Proc. Natl. Acad. Sci. USA 2019, 116, 587–592. [Google Scholar] [CrossRef]
- Moreno-García, P.; Baiser, B. Assessing functional redundancy in Eurasian small mammal assemblages across multiple traits and biogeographic extents. Ecography 2021, 44, 320–333. [Google Scholar] [CrossRef]
- van Klink, R.; Lepš, J.; Vermeulen, R.; de Bello, F. Functional differences stabilize beetle communities by weakening interspecific temporal synchrony. Ecology 2019, 100, e02748. [Google Scholar] [CrossRef]
- de la Riva, E.G.; Marañón, T.; Violle, C.; Villar, R.; Pérez-Ramos, I.M. Biogeochemical and Ecomorphological Niche Segregation of Mediterranean Woody Species along a Local Gradient. Front. Plant Sci. 2017, 8, 1242. [Google Scholar] [CrossRef]
- Mason, N.W.H.; Richardson, S.J.; Peltzer, D.A.; de Bello, F.; Wardle, D.A.; Allen, R.B. Changes in coexistence mechanisms along a long-term soil chronosequence revealed by functional trait diversity. J. Ecol. 2012, 100, 678–689. [Google Scholar] [CrossRef]
- Yan, Z.; Tian, D.; Han, W.; Tang, Z.; Fang, J. An assessment on the uncertainty of the nitrogen to phosphorus ratio as a threshold for nutrient limitation in plants. Ann. Bot. 2017, 120, 937–942. [Google Scholar] [CrossRef] [PubMed]
- Sutton, L.; Mueter, F.J.; Bluhm, B.A.; Iken, K. Environmental Filtering Influences Functional Community Assembly of Epibenthic Communities. Front. Mar. Sci. 2021, 8, 736917. [Google Scholar] [CrossRef]
- Pu, X.; Jin, G. Conspecific and phylogenetic density-dependent survival differs across life stages in two temperate old-growth forests in Northeast China. For. Ecol. Manage. 2018, 424, 95–104. [Google Scholar] [CrossRef]
Disclaimer/Publisher’s Note: The statements, opinions and data contained in all publications are solely those of the individual author(s) and contributor(s) and not of MDPI and/or the editor(s). MDPI and/or the editor(s) disclaim responsibility for any injury to people or property resulting from any ideas, methods, instructions or products referred to in the content. |
© 2025 by the authors. Licensee MDPI, Basel, Switzerland. This article is an open access article distributed under the terms and conditions of the Creative Commons Attribution (CC BY) license (https://creativecommons.org/licenses/by/4.0/).