Article

Construction and Comparison of Single-Tree Biomass Model for Dendrocalamus brandisii

1
Research Institute of Bamboo and Rattan, Cluster Bamboo Engineering Technology Research Center, College of Forestry, Southwest Forestry University, Kunming 650224, China
2
Academy of Forest Inventory and Planning, State Forestry Administration, Beijing 100714, China
3
Centre for Planetary Health and Food Security, School of Environment and Science, Griffith University, Nathan, Brisbane, QSD 4111, Australia
4
International Center for Bamboo and Rattan, Key Laboratory of National Forestry and Grassland Administration, Beijing 100102, China
*
Authors to whom correspondence should be addressed.
Forests 2025, 16(2), 301; https://doi.org/10.3390/f16020301
Submission received: 30 December 2024 / Revised: 26 January 2025 / Accepted: 6 February 2025 / Published: 9 February 2025
(This article belongs to the Special Issue Estimation and Monitoring of Forest Biomass and Fuel Load Components)

Abstract

:
Dendrocalamus brandisii (Munro) Kurz is a high-quality bamboo species for shoots, known for its sweet, tender, and crisp bamboo shoots, making it highly valuable for development. The biomass of bamboo forests is closely related to bamboo shoot yield, and studying biomass accumulation helps maintain the stability of artificial forest ecosystems. Biomass estimation facilitates the monitoring of stand dynamics and promotes the scientific management and sustainable development of D. brandisii plantations. This study collected biological data from 181 D. brandisii individuals in Changning County, Yunnan Province, to construct mathematical models for estimating single-plant biomass using the least squares method. The models were iteratively optimized using the quasi-Newton method. Based on performance indicators and residual analysis, six models were identified as suitable for estimating the biomass of D. brandisii, including multiple linear regression (MLR), linear, allometric growth, and cubic models. These models provide valuable references for biomass estimation and the management of D. brandisii plantations.

1. Introduction

Forest biomass is a key indicator for assessing forest ecosystem functions and carbon budgets. It also serves as fundamental data for exploring ecological issues in forestry. Biomass estimation is a complex process that requires comprehensive consideration of factors such as tree species, stand density, and mixing ratios [1]. Studies have shown that mixed-species growth significantly enhances forest productivity [2], as the growth rates and proportions of different species directly influence overall forest output [3]. Currently, two primary methods are used for biomass estimation: direct felling measurements and indirect estimation [4,5]. Indirect methods include remote sensing combined with machine learning algorithms, suitable for large-scale rapid assessment of forest resources [6,7]; three-dimensional LiDAR modeling, which excels in volume estimation for complex terrains [8]; and statistical modeling based on biological characteristics, employing DBH and tree height to construct regression equations for precise small-scale estimations [9]. Many biomass equations for trees use diameter at breast height (DBH) and tree height as main variables, achieving high fitting accuracy [10].
While 3S technologies, encompassing remote sensing (RS), geographic information systems (GISs), and global positioning systems (GPSs), are widely used in forestry, the high costs of equipment and technical expertise pose challenges. Free remote sensing data also face limitations in resolution and timeliness [11]. As a result, empirical formula-based biomass models remain practical and cost-effective tools, particularly for plantation management. Accurate biomass estimation enables optimization of production strategies, stabilization of plantation ecosystems, and long-term development [12,13,14].
Bamboo, a globally significant non-timber forest product, plays an essential role as a perennial agricultural plant [12]. The accumulation of bamboo biomass directly affects shoot yields and economic returns. For instance, the large individual biomass of Pleioblastus amarus leads to higher fresh shoot yields under optimal density [13]. Allometric growth models based on DBH are considered effective for predicting bamboo biomass, allowing stand-level estimation by aggregating individual models. These models are also useful for carbon stock predictions [14,15,16,17]. In recent years, regression models incorporating DBH and bamboo height have demonstrated excellent performance in studies on Bambusa chungii, D. tsiangii, B. blumeana, D. latiflorus, and P. amarus [18,19,20,21,22]. Allometric growth models are widely applied to evaluate biomass across bamboo species [23]. Furthermore, studies on species such as B. emeiensis, B. rigida, Phyllostachys edulis, P. bambusoides, and P. nigra have enriched the theoretical and practical foundation of bamboo biomass models [24,25,26].
W = 0.008 D H + 0.000403   ( D H ) 2
W = 0.372 D 2 0.753 D + 1.316
Two biomass models are presented as examples: (1) The biomass model for B. chungii. (2) The biomass model for D. tsiangii. In these models, D denotes the diameter at DBH, and H denotes the height of the bamboo culm.
D. brandisii, a large clumping bamboo species in the family Gramineae and genus Dendrocalamus, holds significant development potential. It is widely distributed in Southeast Asia and southern China and is characterized by high yields, rapid growth, and dual-use for shoots and culms [27,28,29]. Its culms are suitable for pulp and engineered wood products, while its fresh shoots are rich in nutrients, can be eaten raw without the bitterness found in other bamboo species, and hold significant economic value [30,31]. The bamboo samples collected in this experiment exhibited stable phenotypic traits and the highest levels of various amino acids among multiple provenances in Yunnan, making them the most superior variety in terms of morphological characteristics and nutritional value [32]. Accurate biomass estimation of D. brandisii is essential for developing planting and harvesting plans, reducing costs, and maximizing returns. Among bamboo species, Phyllostachys edulis has been extensively studied. Although Phyllostachys edulis is a monopodial species, differing from the sympodial D. brandisii, both species are large bamboos with similar morphological traits, making Phyllostachys edulis biomass models valuable references. Models using DBH and bamboo height to estimate biomass for culms, branches, leaves, and roots in Moso bamboo have shown excellent performance [26]. However, precise measurement of culm height in mature Moso bamboo, which can reach 28 m, remains challenging without felling. Factors such as stand density, average DBH, competition indices, soil depth, and elevation significantly influence Phyllostachys edulis biomass [33]. Most of these studies focus on natural forests and offer limited reference value for plantations, which are key contributors to economic value. Currently, no biomass models specifically tailored for D. brandisii plantations exist. This study, based on data from D. brandisii plantations in Mengtong Town, Changning County, Yunnan Province, constructs production-oriented biomass models, providing a scientific reference for bamboo forest management.

2. Materials and Methods
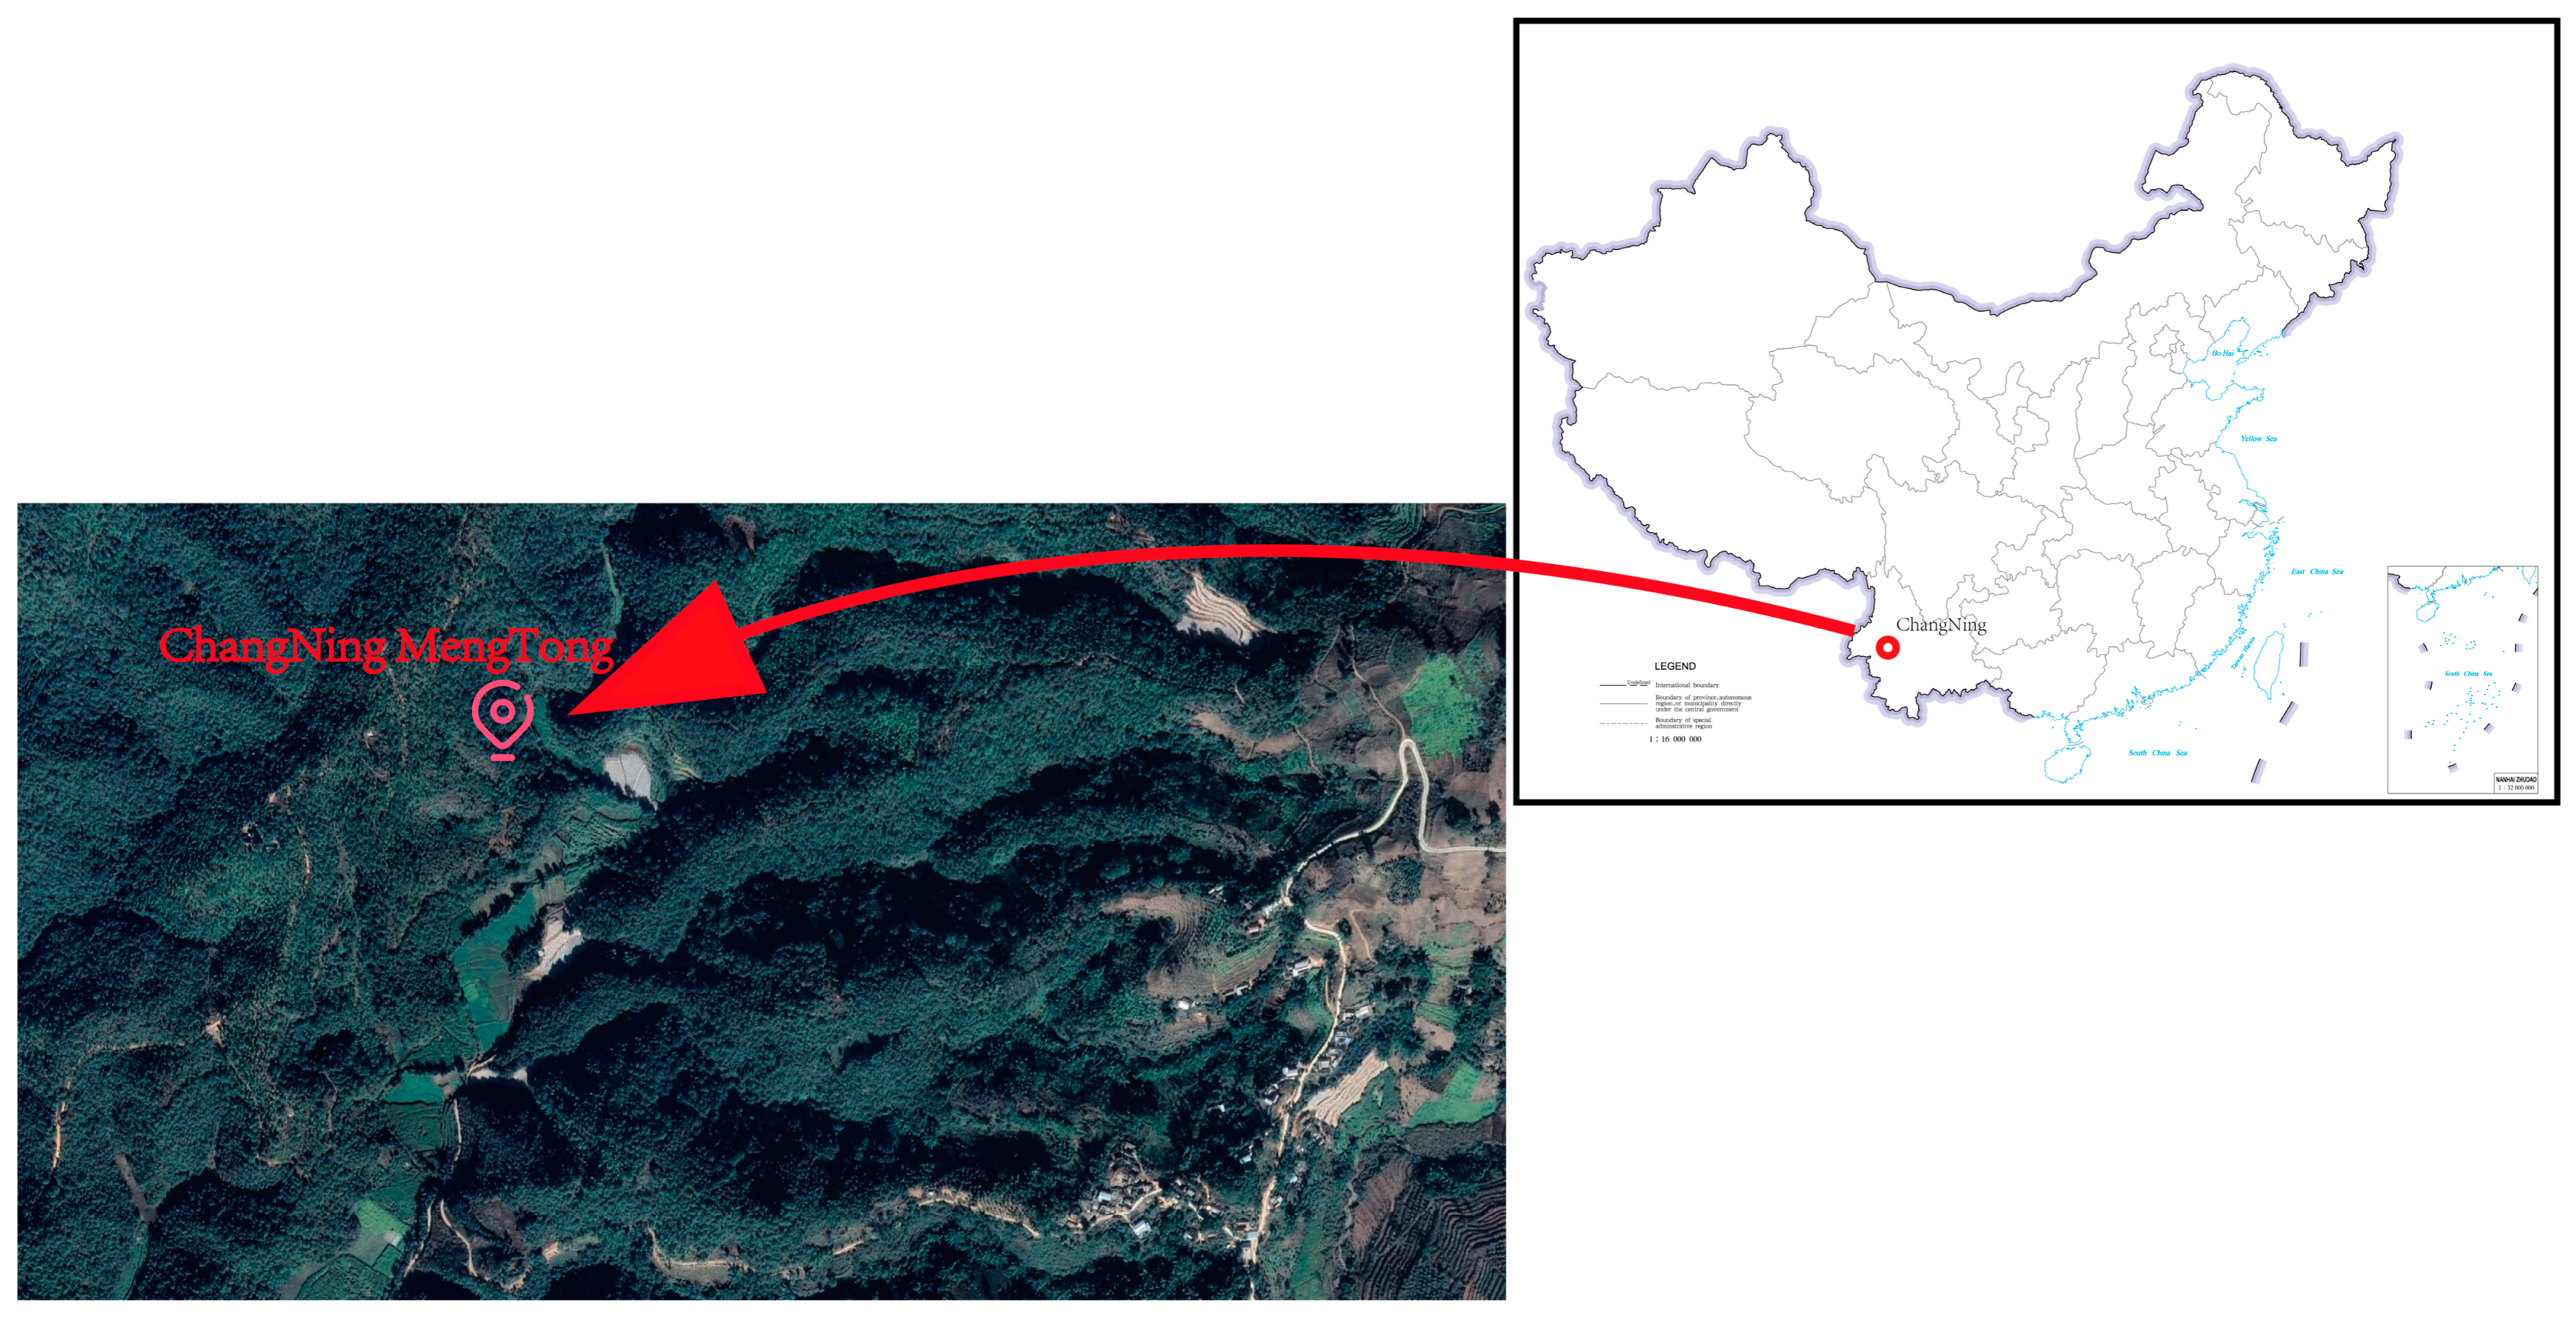
2.1. Study Area

The study area is located in Mengtong Township, Changning County, Yunnan Province, at longitudes 99°30′–99°41′ and latitudes 24°24′–24°38′. It covers an area of 298 km2, with a width of 12.5 km from east to west and a length of 26 km from north to south. The elevation ranges from 1010 m to 2175 m, and the average annual rainfall is 1361 mm. The climate is diverse, with abundant rainfall and fertile soil. The area includes both subtropical lowland river valleys and temperate mountainous regions, making it suitable for various agricultural activities.

2.2. Data Source

2.2.1. Selection and Sample Collection of Standard Bamboo

The selection of sample bamboo and data collection took place from November to December 2023 in Mengtong Township, Changning County, Yunnan Province, with the specific location shown in Figure 1. Based on field surveys, 181 healthy, pest-free D. brandisii bamboos with good growth were selected from 41 typical plots in the D. brandisii plantation, representing different age classes and diameter classes. These included the following: age class I (bamboo age ≤ 1 year) with 41 plants, age class II (1 year < bamboo age ≤ 3 years) with 78 plants, and age class III (bamboo age > 3 years) with 62 plants. The classification of ages followed Ji Xing et al.’s work, and the management experience was accumulated over many years by the forest management staff. The moisture content varies significantly among different age classes, and the classification of age classes is a crucial step in the measurement of biomass [34].

2.2.2. Sample Indicator Measurement

Although most bamboos and hardwood trees have woody structures, their stem structures differ; bamboo plants are mostly hollow, while hardwood trees are generally solid [35]. Therefore, when data on wood density and moisture content are available, biomass accumulation can be predicted based on volume [36]. In bamboo plants, there are significant variations between individuals, such as differences in internode length, wall thickness, and other factors. These variations make it difficult to accurately calculate the biomass of bamboo plants using the typical hollow structure model. Thus, biomass determination in bamboo plants is typically based on the moisture content of each organ to calculate dry weight [34,37,38,39]. This method offers a more accurate reflection of the plant’s actual growth condition.
The selected bamboo samples were felled at the base, and data such as DBH, internode length, and bamboo height were measured. Samples of bamboo stems, branches, and leaves were collected, with each organ sample weighing between 200 and 300 g. Bamboo stem samples were taken at four equal sections along the stem, with approximately 3 cm long bamboo rings collected to measure their fresh weight. Branch and leaf samples were taken from the upper, middle, and lower parts of the bamboo, selecting branches of varying thicknesses and leaves of different sizes. The collected samples were placed in an oven and dried at 80 °C for 72 h, then cooled to room temperature and weighed [40]. The moisture content of each organ was calculated, and the dry weight of each organ and the total dry weight of the bamboo were determined based on the moisture content. The formula is as follows:
M C = W f r e s h W d r y W f r e s h
W d r y = W d r e s h × ( 1 M C )
  • MC represents the moisture content;
  • Wdry represents the dry weight of the organ (in kg);
  • Wfresh represents the fresh weight of the organ (in kg).
After data collection, all variables were initially compiled and organized for analysis. To ensure the accuracy and reliability of the dataset, the Mahalanobis distance method was applied to screen for potential outliers. By considering the correlations among variables and the covariance structure of the data, this method effectively identified anomalous data points [41]. Observations with a Mahalanobis distance exceeding the predefined threshold were excluded from further analysis. This screening process minimized the influence of outliers, ensuring that the dataset accurately represented the underlying patterns and relationships for subsequent modeling efforts.

2.3. Model Construction and Selection

2.3.1. Model Construction

The general form of the regression models commonly used for calculating individual tree biomass is as follows:
y = β 0 x 1 β 1 x 2 β 2 x n β n + ε
In this formula, y typically represents biomass or volume, while x pertains to commonly employed morphological parameters such as DBH, tree height, and other related factors. Since the variables DBH and tree height are correlated, incorporating both DBH and tree height as independent predictors in an allometric biomass model inevitably introduces some degree of multicollinearity. To mitigate the adverse effects of multicollinearity, some models also adopt the ratio of DBH to tree height as an independent variable [42].
Existing biomass modeling research indicates a significant correlation between tree aboveground biomass and their DBH and tree height [43]. However, bamboo, as a member of the family Gramineae, differs greatly from trees in growth and development patterns. In D. brandisii plantations, bamboo height is strongly influenced by artificial management. For example, at the plantation base in Mengtong Township, Changning County, Yunnan Province, the tips of most mother bamboos are artificially pruned for easier management. As a result, we opted to use the length of the internode at breast height, denoted as L, as a calculation variable instead of bamboo height. This approach was adopted to more accurately estimate the biomass of D. brandisii and enhance the model’s predictive performance.
In the process of modeling, it was observed that the contribution of internode length at breast height to total plant biomass was minimal. Therefore, in most bivariate models, this variable was excluded during regression analysis, resulting in biomass models that solely used DBH as the independent variable. However, a few models retained internode length at breast height as a variable. Ultimately, five models were identified that included both DBH and internode length at breast height as independent variables, along with five other models that used DBH alone. The specific formulas for these models are presented in Table 1. In the equations presented, W represents the biomass (in kilograms), D denotes the DBH (in centimeters), and L stands for the length of bamboo internodes at breast height (in centimeters). These variables are key predictors used to model and estimate the biomass of bamboo accurately.

2.3.2. The Criteria for Selecting Models

Using SPSS 24 software, the correlation between various biomass indicators was determined to establish a biomass estimation model for D. brandisii. During the evaluation and comparison of biomass models, the following six metrics were used to assess the model: coefficient of determination (R2), standard error of estimate (SEE), total relative error (TRE), mean system error (MSE), mean prediction error (MPE), and mean percentage standard error (MPSE) [44].
R 2 = 1 ( y i y ^ i ) 2 / ( y i y ¯ ) 2
S E E = ( y i y ^ i ) 2 / ( n p )
T R E = 100 × ( y i y ^ i ) / y ^ i
M S E = ( y i y ^ i ) y ^ i × 100 n
M P E = t α · ( S E E / y ¯ ) · n × 100
M P S E = 100 × | y i y ^ i y ^ i | / n
In these equations, y i designates the actual observed values, y ^ i represents the model estimations, y ¯ constitutes the mean of the observed values, n indicates the sample size, and t α represents the t-value at the confidence level of α. Six indices were computed to assess the developed model. Among them, R 2 and SEE are the most prevalent indicators for goodness of fit in regression models; conversely, TRE and MSE are crucial metrics that ought to be maintained within specific ranges; TRE should be within ±3% and MSE within ±5%, with values approaching zero being optimal. For a comprehensive assessment of applicability, TRE and MSE must also be independently verified using verification samples, with TRE ideally within ±3% or below MPE values and MSE within ±5%. If MSE exceeds ±5% but remains within ±10%, the model is regarded as having moderate systematic error; if MSE exceeds ±10%, the systematic error is considered high. MPE indicates the accuracy level of average biomass estimation, while MPSE indicates the accuracy of individual plant biomass estimation, with smaller values being preferred for both indices.

2.4. Analysis Tools

Preliminary data processing, including statistical analysis and filtering, was carried out using Excel spreadsheets, while model construction and validation were performed using SPSS 24 and Python 3.8.
First, the initial biomass model for D. brandisii was developed using the ordinary least squares (OLS) method based on measured data. To improve the model’s accuracy, the minimize function from Python’s SciPy library was employed for optimization. Specifically, the quasi-Newton method was applied [45].
The minimize optimization algorithm is a powerful tool for finding the minimum of a function under given constraints and is widely used in machine learning, signal processing, and system optimization. Various optimization algorithms, such as gradient descent, Newton’s method, and genetic algorithms, are available within the minimize library. In this study, we adopted the BFGS (Broyden–Fletcher–Goldfarb–Shanno) method, a well-known quasi-Newton approach for unconstrained optimization. This method is particularly effective in approximating the Hessian matrix by using first-order derivatives, avoiding the computational cost of calculating second-order derivatives directly. The BFGS method iteratively searches for the function’s minimum and is known for its computational efficiency, robustness, and ease of implementation, making it highly applicable in both theoretical and practical optimization tasks.

3. Results

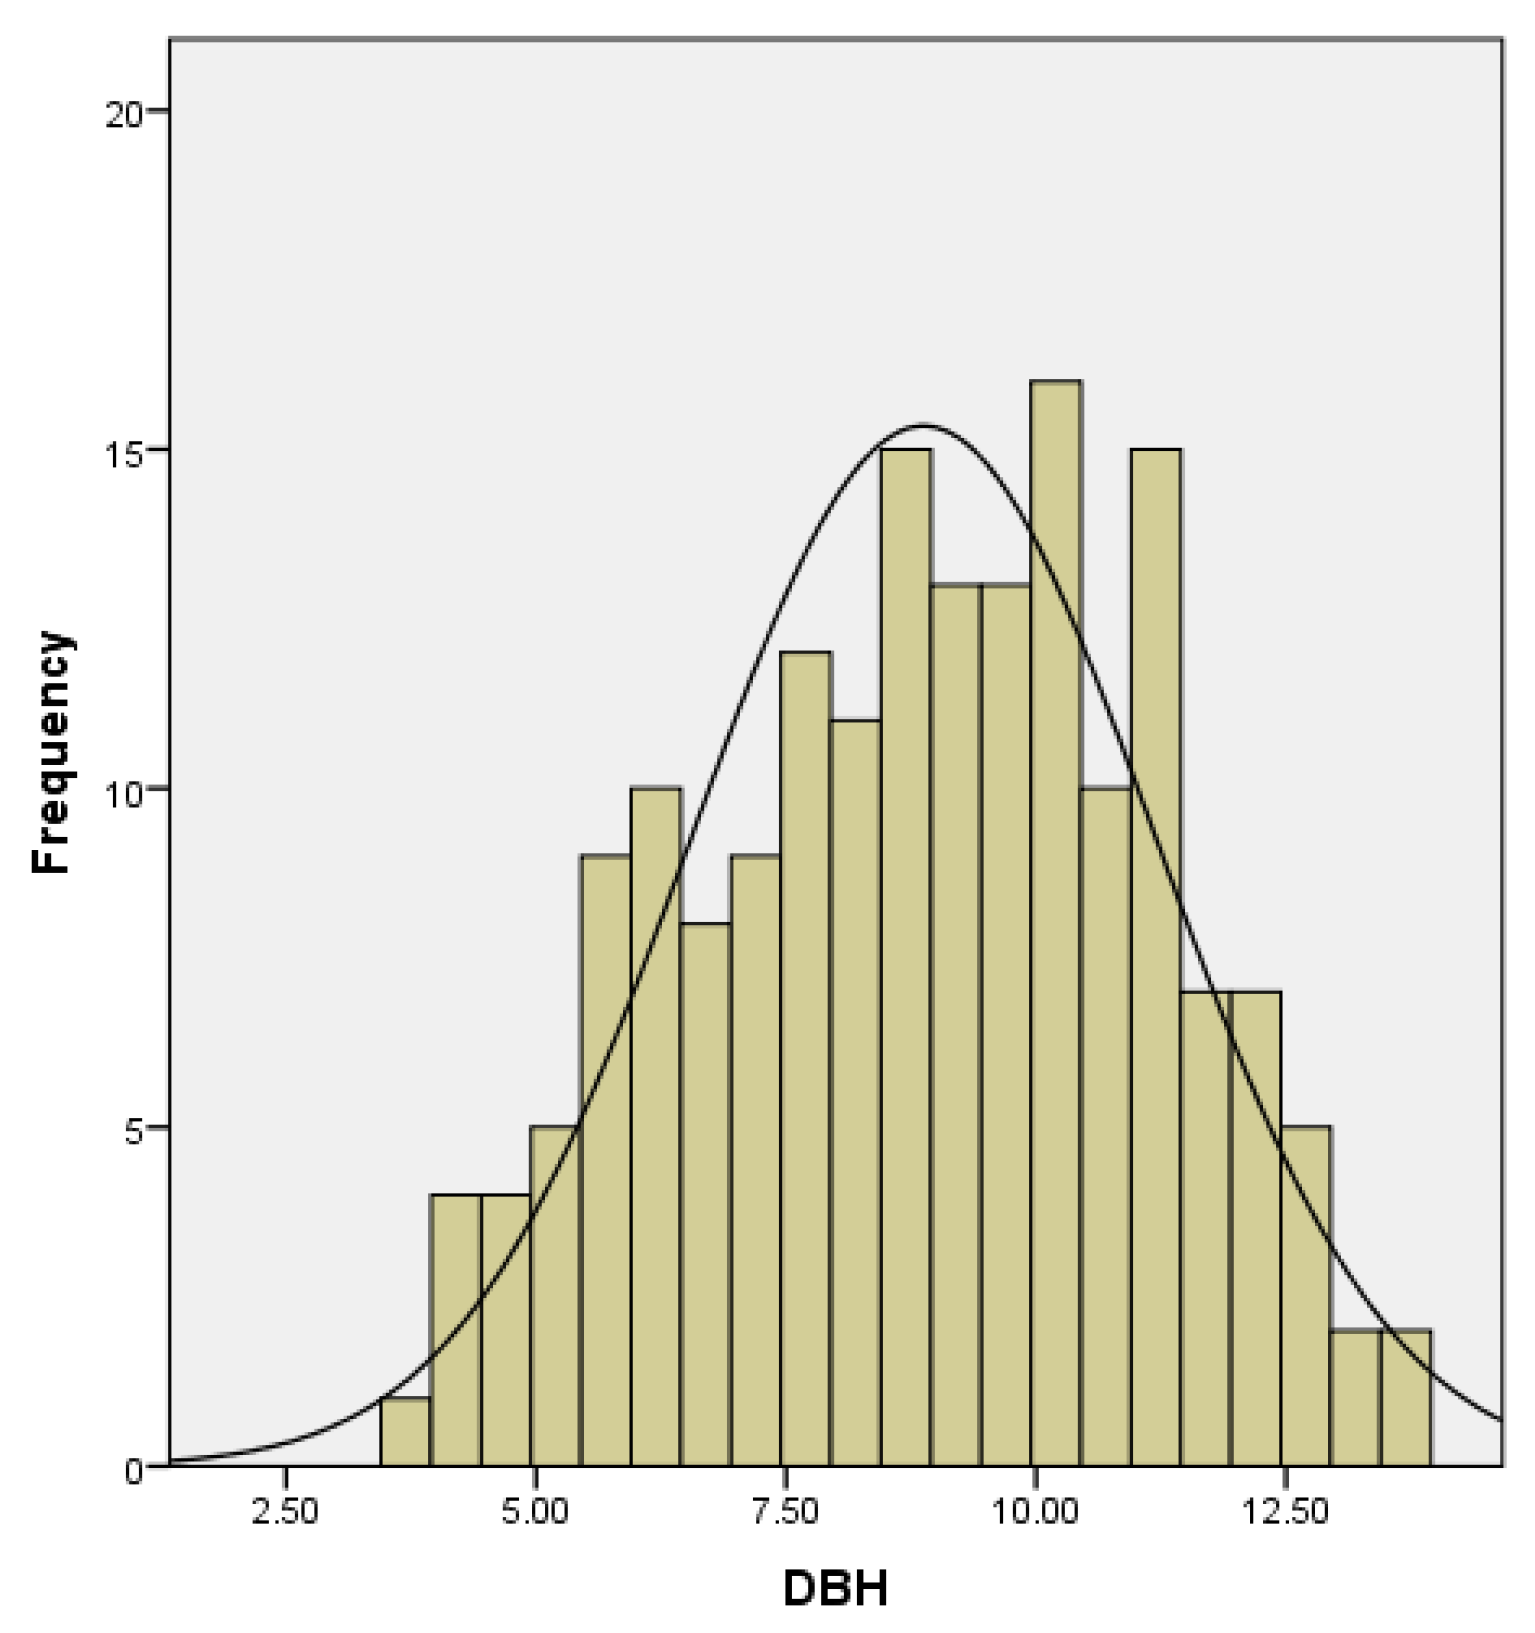
3.1. Data Collection

3.1.1. Analysis of the Water Content in the Organs of D. brandisii

There are structural and functional differences among the various organs of D. brandisii, and their moisture content varies. As the bamboo’s age increases, the moisture content in the different organs also changes, which is related to the accumulation of organic substances within the bamboo. The moisture content at different bamboo classes for each organ is shown in Figure 2.
As shown in Figure 2, for D. brandisii, the average moisture content of the aboveground components (e.g., stems, branches, and leaves) decreases from 74.96% in age class I to 48.44% in age class II and 48.27% in age class III as biomass accumulates across the various organs. The changes in moisture content across organs show that in age class I, the bamboo has higher moisture content due to the shoot removal that year, with branches and leaves not yet developed and the bamboo culms being immature and tender, leading to less biomass accumulation. This results in a significant difference in moisture content compared to age classes II and III. In age classes II and III, the moisture content follows the pattern of stem > branch > leaf.

3.1.2. Aboveground Biomass Proportion of Each Organ in D. brandisii

The aboveground biomass of D. brandisii consists of stems, branches, and leaves. The proportion of each organ in the aboveground biomass at different age classes is shown in Figure 3.
According to the biomass allocation results of the aboveground parts of D. brandisii at different age classes, the average aboveground biomass of individual bamboo plants is 19.89 kg, 39.12 kg, and 42.89 kg per plant for age classes I, II, and III, respectively. In age class I, biomass accumulation is lower because the branches and leaves are not yet fully developed. As the bamboo grows from age class I to age class III, the biomass of each organ and the total biomass increase with age. Regarding the biomass proportions, as the bamboo matures, the branches and leaves become more abundant, and their biomass proportion increases. In contrast, the proportion of stem biomass decreases as the age class progresses.

3.2. Construction of Biomass Regression Model

The Mahalanobis distance method was applied to filter the dataset, and samples with a Mahalanobis distance greater than 10.596635 were removed, totaling 5 samples. The remaining 176 samples were used to randomly select 20% (35 samples) as the validation dataset, while the remaining 141 samples were used for model development. After data processing, regression analysis was conducted using the OLS method in SPSS. The preliminary results are shown in Table 2.
For the preliminary fitting results, R2, SEE, TRE, MSE, MPE, and MPSE were used to compare the biomass model. Subsequently, the TRE and MSE of each model were calculated using the validation dataset. These eight metrics were then used to compare and select the best model. After comparison, it was found that only the MLR, cubic, and linear models met the standard range for all six metrics.
Once the preliminary fitting results were obtained, the BFGS method from the minimize optimization library in Python was used for iterative optimization. The results after iteration are shown in Table 3. As shown in Table 3, the iterative method made adjustments to the MLR, height–diameter, Schumacher–Hall, quadratic, cubic, and linear models, while resulting in larger changes in the tree biomass model, relative growth model, compound, and allometric models.

3.3. Selection of Biomass Models

3.3.1. Performance Metrics of the Model

R2, SEE, TRE, MSE, MPE, and MPSE of the biomass model results obtained after iteration were compared. Then, the TRE and MSE of each model were calculated using the validation dataset. These eight metrics were used to compare and select the best models.
After iterative optimization, the indicators of several models reached the acceptable range and performed well. The models that met the standards include the following: tree biomass model, MLR, height–diameter, cubic, allometric model, and linear models for D. brandisii biomass. The results of the six models are shown in Table 4.
From the table, it can be seen that as the core indicator, R2 shows decent performance in several models with little difference. Among the six models that meet the standards, the height–diameter model has a slightly lower R2 and a slightly higher SEE compared to the other models. This suggests that while using the ratio of DBH to the internode length at breast height as model variables to calculate biomass has some merits, it is not the optimal solution. The TRE of the MLR, height–diameter, and cubic models is close to 0, indicating excellent performance, while the absolute value of the TRE for the tree biomass and allometric models is around 0.7%. The absolute value of the TRE for the linear model is 2.93%, significantly higher than the TRE of the other models. This indicates that the linear model may not be as suitable for calculating the biomass of D. brandisii as the other models. The MSE of the linear and cubic models performs significantly better than the other models. The MPE values of the six models exhibit minimal variation, whereas the MPSE values show considerable disparity. Notably, the MPSE for both the multiple linear regression and the linear model exceeds 50%, indicating poor performance. This suggests that linear models are not appropriate for estimating the biomass of D. brandisii.
The performance of the six models in the validation dataset is relatively consistent. The TRE for all six models exceeds 3%, but all are lower than the MPE values for each model in the validation dataset. Among them, the height–diameter model has higher TRE and MSE compared to the other models, while the cubic model excels with both TRE and MSE indicators.

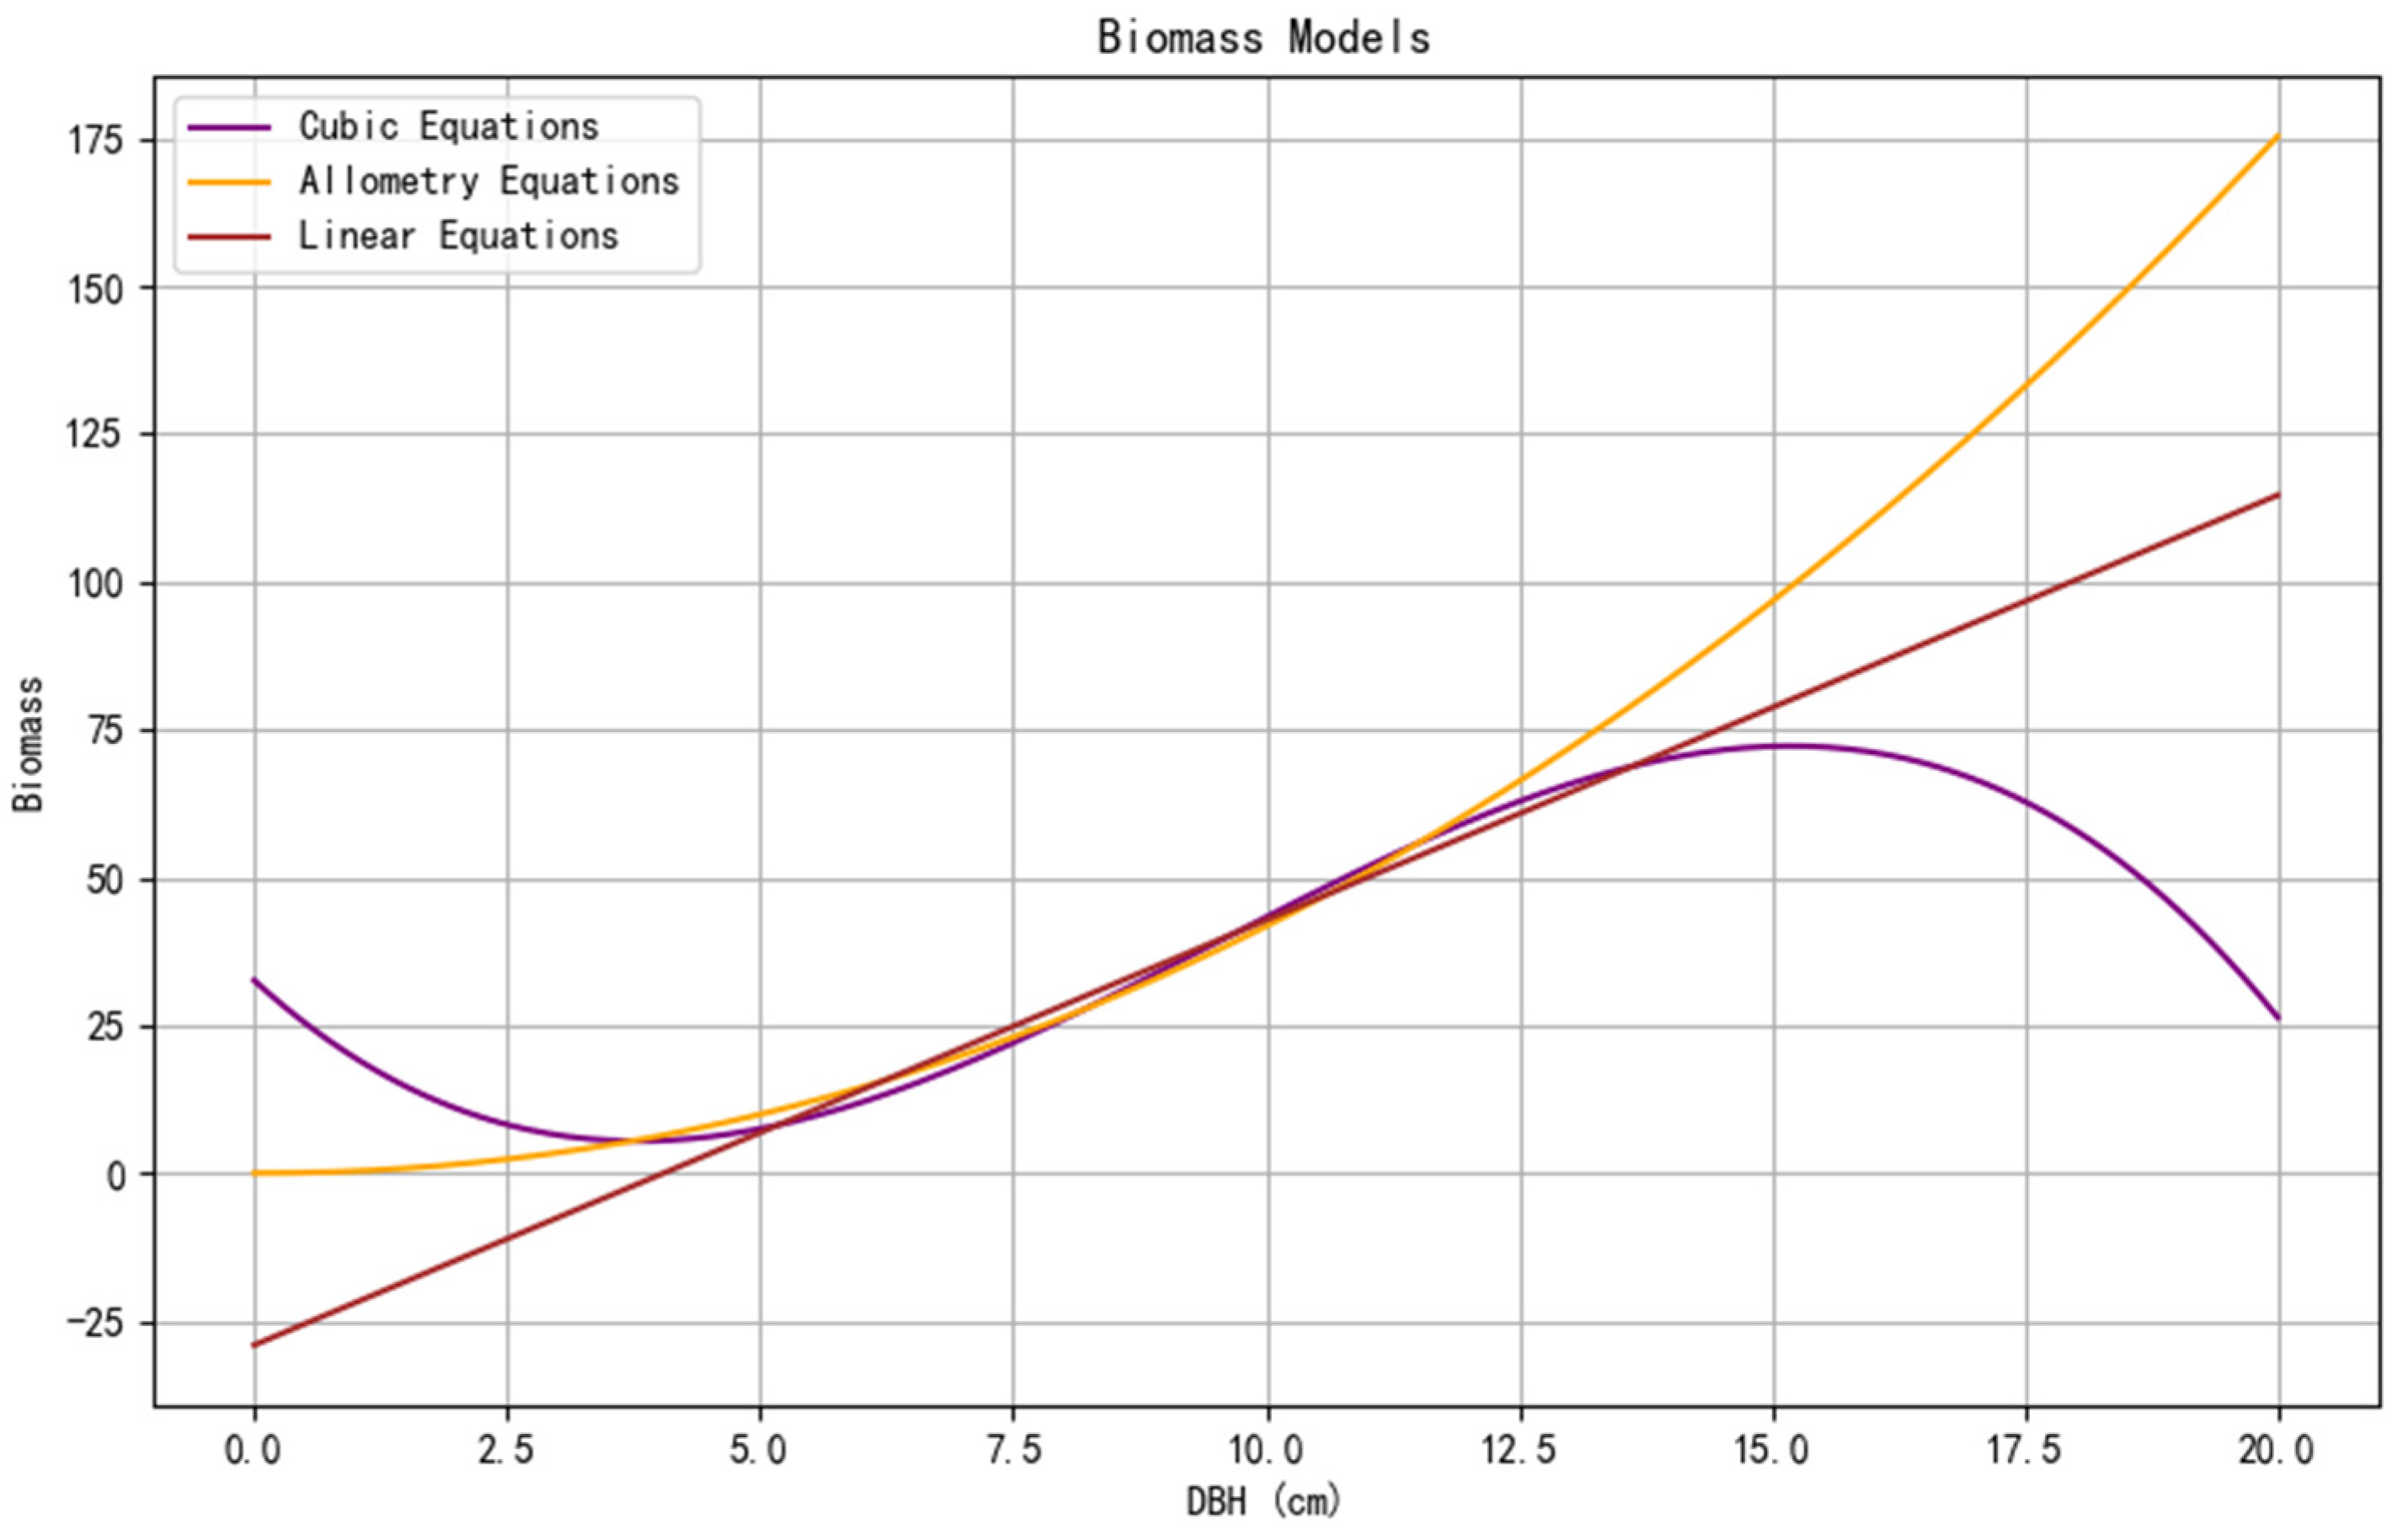
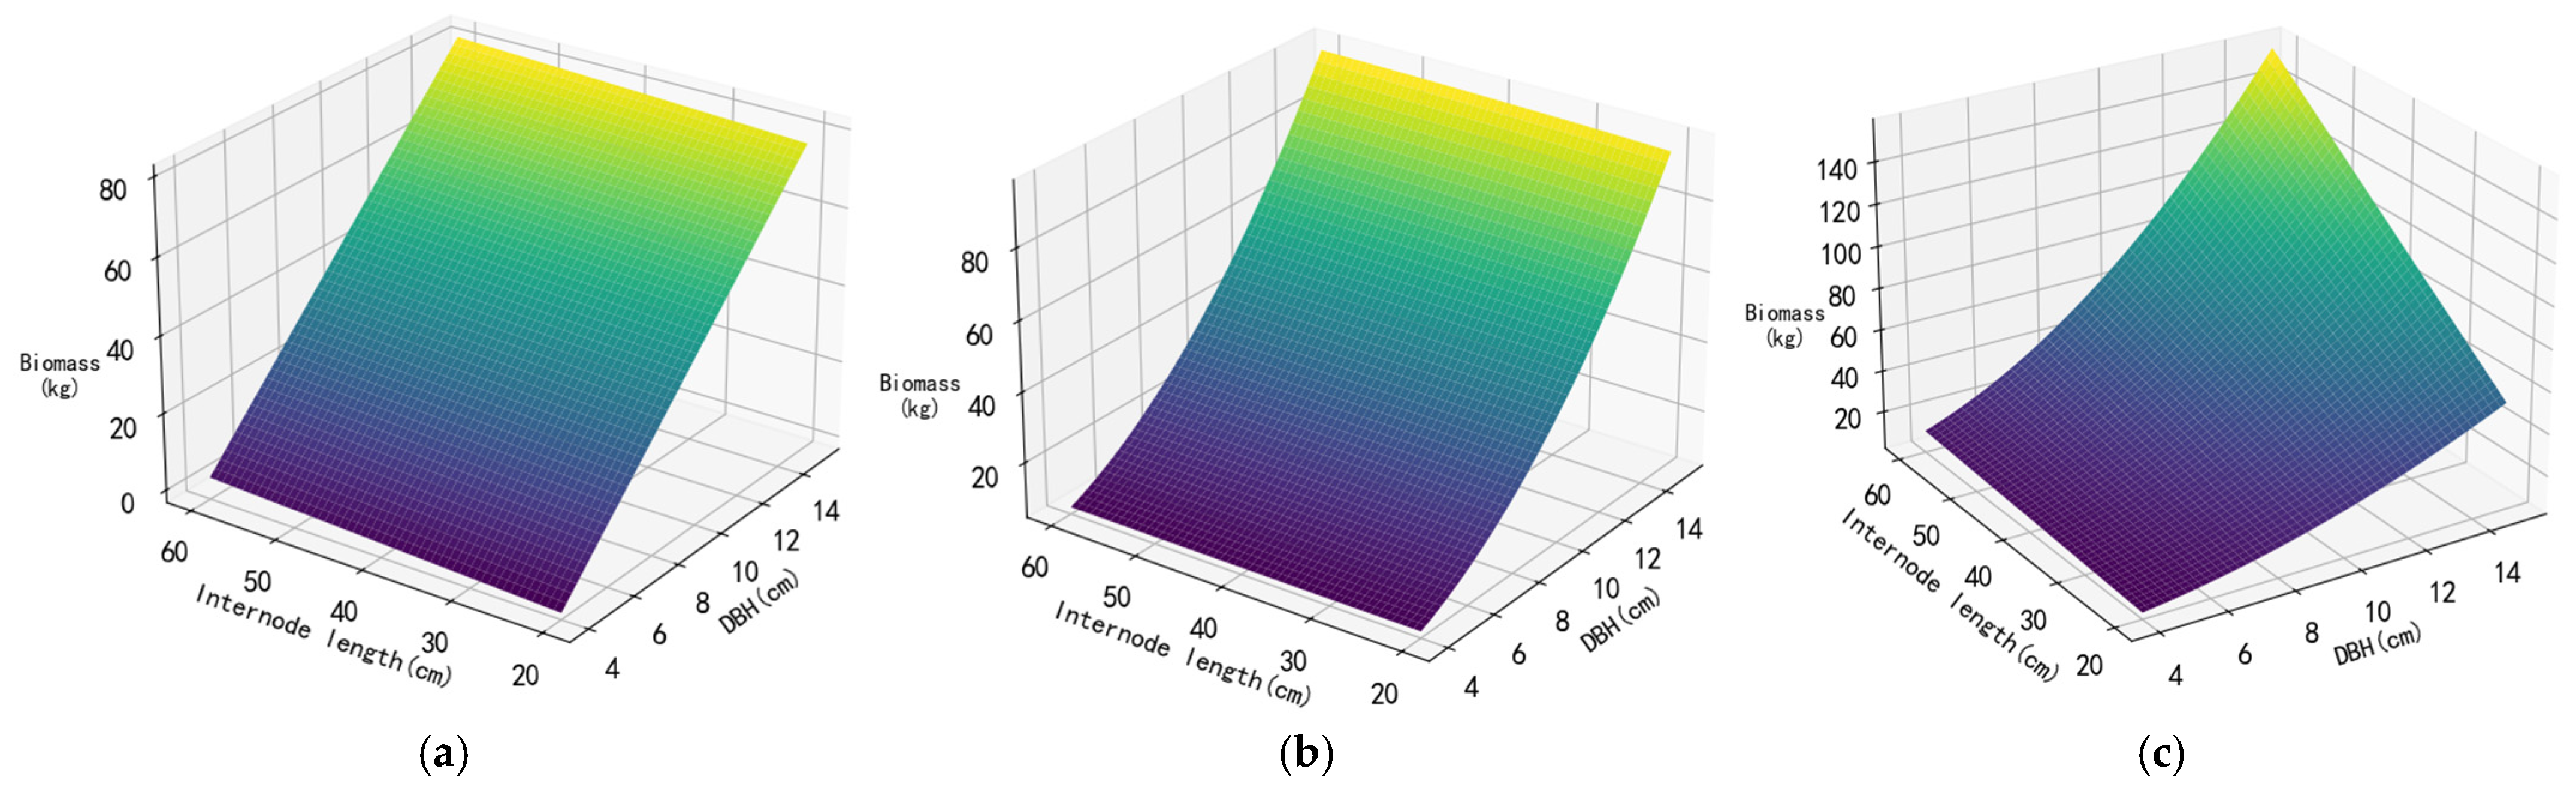
3.3.2. Fitting Results of Models

The six models selected after iterative optimization were plotted using the matplotlib.pyplot library and the mpl_toolkits.mplot3d library in Python, as shown in Figure 4 and Figure 5.
Among the models in Figure 4, the cubic model, allometric model, and linear model are univariate models, where biomass is only related to DBH. From the graph, it can be observed that the linear model fails to work effectively for small DBH values, as it predicts negative biomass when DBH is less than 4 cm, and the cubic model shows a local minimum around 4 cm and a local maximum at 15 cm. Therefore, it can be concluded that for the linear model, DBH should be greater than 4 cm, and for the cubic model, the applicable range of DBH is approximately between 4 cm and 15 cm. A histogram of the DBH values of all samples is shown in Figure 6. From the analysis, it can be seen that the majority of the sample bamboo has a DBH between 5 cm and 12.5 cm, which aligns with the optimal calculation range of the two models.
Among the models in Figure 5, the MLR model, tree biomass model, and height–diameter model use the following two independent variables: DBH and the length of the bamboo segment at breast height. In the MLR model, DBH and bamboo segment length at breast height are treated as separate terms, with the coefficient for DBH much higher than that for the bamboo segment length. In the tree biomass model, DBH and bamboo segment length at breast height are combined in the same term. The 3D regression plot shows that in both the MLR model and the tree biomass model, the effect of bamboo segment length on biomass is much smaller than that of DBH. In contrast, the height–diameter model uses the D2L as an independent variable, leading to a greater impact of bamboo segment length on biomass.

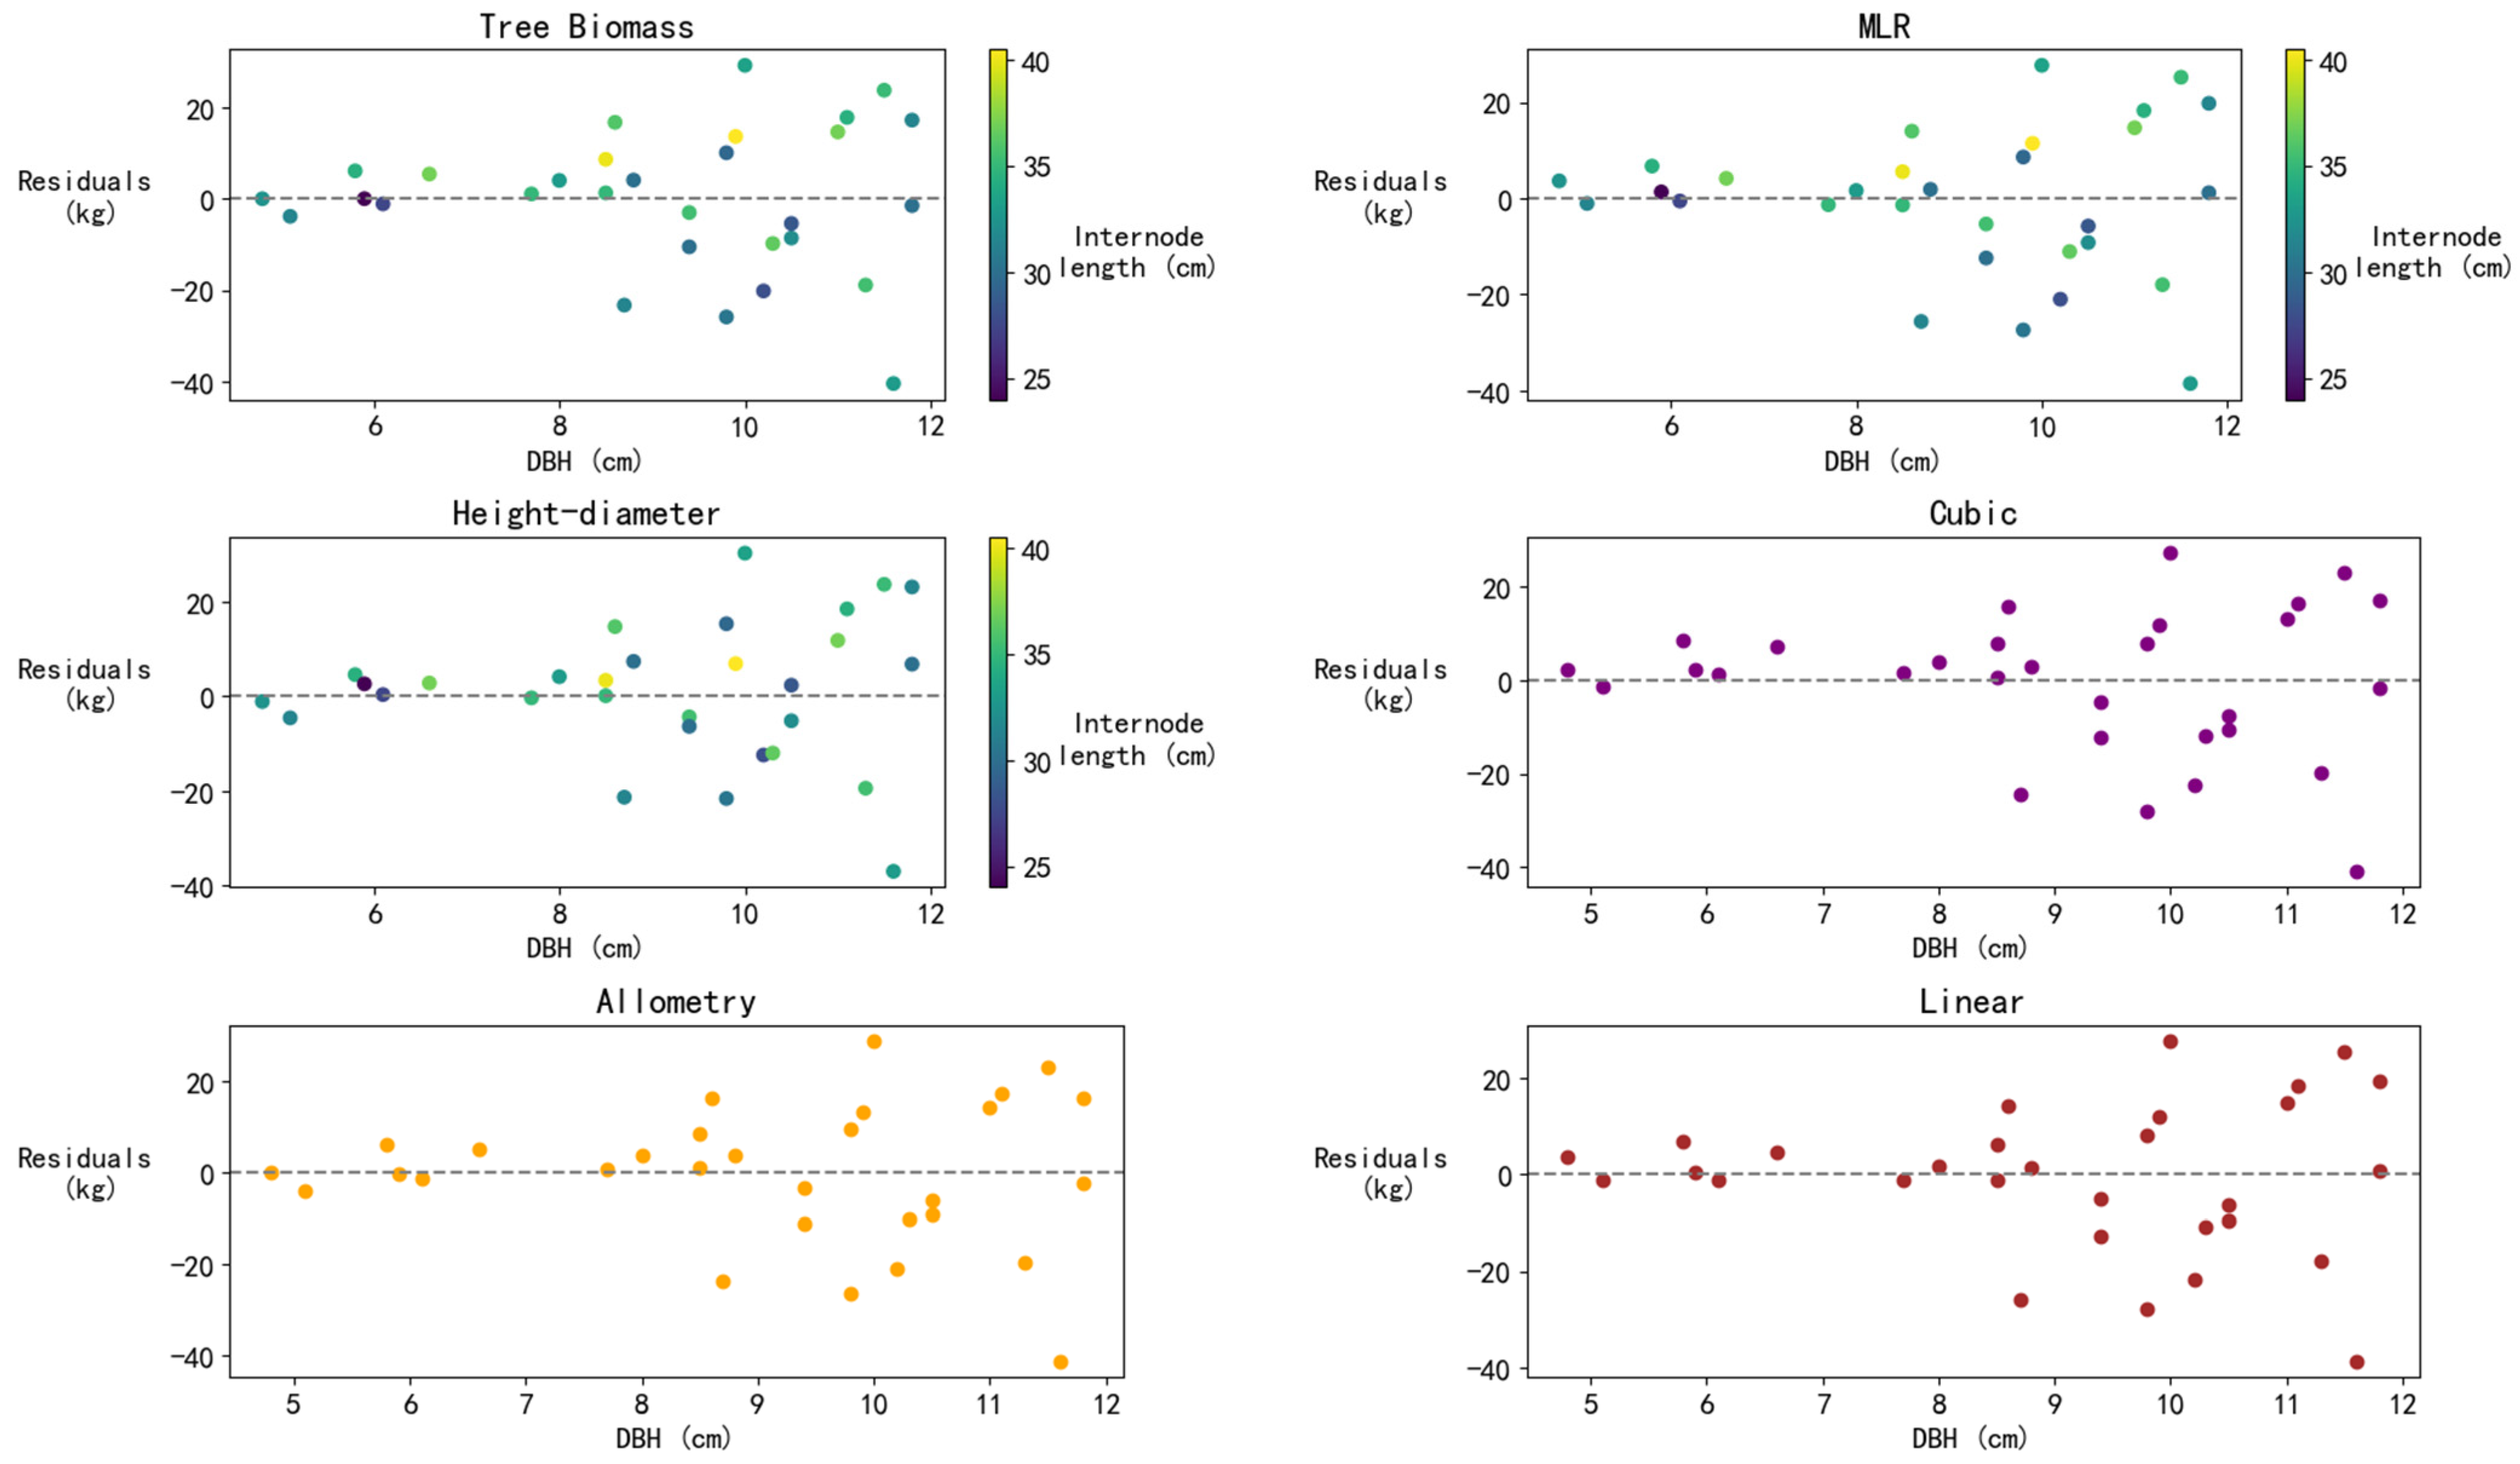
3.3.3. Residual Analysis of Models

Residual plots for six models were computed and plotted using a test dataset, as shown in Figure 7. The points on the residual plots represent the differences between the observed values and the model predictions, with the residuals on the vertical axis and DBH on the horizontal axis. The color bar in the figure indicates the variation in tree height. Residual plots for all six models show that the residuals are relatively dispersed within the large DBH range and do not exhibit significant systematic bias. This suggests that the models’ fits are similar, with no significant trend error across different DBH ranges. As the DBH increases, the dispersion of biomass values also grows, leading to larger residuals. The residuals for all models are generally distributed between −40 kg and 30 kg, indicating comparable error magnitudes across the models. The residual distributions are similar with no significant systematic bias, indicating that the models’ fits are close. The residual distribution for the MLR and allometric growth models is relatively uniform, especially in the middle DBH range (approximately 7–10 cm), where the residuals are small, suggesting that these models may perform better in predicting the middle DBH range. The tree biomass and height–diameter models show greater stability, but their residuals increase with higher DBH values, indicating that the models may overestimate actual values for larger DBH samples. The cubic model shows relatively consistent prediction errors across different DBH ranges but performs less well in the middle DBH range compared to other models. The linear model performs better in the small DBH range but underperforms in the large DBH range compared to the other models. Overall, MLR exhibits the broadest applicability. In contrast, the linear model, allometric growth model, and cubic model each demonstrate superior performance within specific intervals.

4. Discussion

4.1. Data

The experimental dataset comprised 181 samples, all collected from the same D. brandisii production site. During the process of mathematical modeling, substantial individual variability among samples was observed. With increasing DBH, the data showed greater dispersion. This phenomenon may be attributed to human-induced variations during the management and measurement of D. brandisii, as well as individual differences stemming from microhabitat variability among the bamboo plants [46]. All models exhibited low MPE but high MPSE. This typically indicates that the models perform well on average but show significant variability in error across different data points or larger errors for outliers. The following factors contribute to this phenomenon: Some samples have small actual values, leading to relatively larger proportional prediction errors, which in turn inflate MPSE. Despite low overall prediction error, specific numerical ranges may experience significant prediction deviations, elevating MPSE. Outliers in the dataset may disproportionately affect MPSE, causing higher variability in relative errors. To enhance model performance, collecting more individual biomass data for D. brandisii is necessary to achieve better fitting outcomes.
Among the ten commonly used mathematical models, six demonstrated strong fitting performance. These models relied solely on DBH and internode length at breast height, two easily accessible growth parameters. Future research should explore alternative model types and incorporate additional plant growth parameters to develop models more suitable for biomass estimation in D. brandisii. Comparing different models across various datasets would enable a more comprehensive evaluation of their accuracy and applicability, thereby providing more robust methods and references for biomass estimation in D. brandisii.

4.2. Model Building Method

When constructing biomass models, the method employed was the OLS, a classical regression approach characterized by its simplicity, efficiency, and wide applicability [47]. OLS minimizes the sum of squared differences between predicted and observed values to determine the optimal regression parameters. It is particularly effective for linear or approximately linear models and situations with large datasets and simple models. However, OLS assumes linearity of the model and independence of explanatory variable effects, which can lead to poor fitting performance for nonlinear relationships or data with noise and outliers, even potentially trapping the solution in a local optimum [48].
To address this issue, the quasi-Newton method was adopted as the optimization algorithm. The quasi-Newton method is effective for handling complex nonlinear optimization problems [44,45]. Compared to OLS, it offers significant advantages under conditions of nonlinear models and complex data, particularly in improving model accuracy and stability. Through quasi-Newton optimization, the model’s accuracy is ensured while achieving biomass predictions more closely aligned with actual values [49].
In addition, future research could explore other iterative optimization methods, such as gradient descent, Newton’s method, genetic algorithm, simulated annealing, and Lagrange multiplier method [50,51], to identify optimization approaches better suited to complex biomass models.

4.3. Comparison of Model Optimization Results

Comparing the changes in coefficients and constants across various models before and after iteration reveals that the quasi-Newton method induced minor adjustments in the MLR, height–diameter, Schumacher-Hall, quadratic, cubic, and linear models. In contrast, it caused significant changes in the tree biomass, relative growth model, compound, and allometric model. Notably, equations with substantial changes are primarily exponential or power functions.
An analysis of model evaluation metrics before and after iteration highlights the significant improvements achieved through optimization using the quasi-Newton method. Before optimization, only three models met the evaluation standards. After optimization, all models showed closer alignment with the evaluation criteria, and six models reached the standard range. This indicates that the quasi-Newton method has exceptional optimization capabilities for nonlinear mathematical models, such as the tree biomass model and allometric model, which are frequently used in plant biomass calculations [50].
Nevertheless, models such as the relative growth model, Schumacher–Hall, quadratic, and compound remained below the standards even after iterative optimization. This finding suggests that these models are unsuitable for predicting the biomass of D. brandisii.

5. Conclusions

Among the tested models, the allometric model consistently demonstrates superior performance metrics and is recommended as the default choice for biomass estimation under varying conditions. However, specific models are more appropriate for different DBH ranges, thereby enhancing accuracy and flexibility.
For smaller DBH ranges (5–7 cm), the linear model yields the highest accuracy. For medium DBH ranges (7–10 cm), the allometric growth model performs optimally. In larger DBH ranges (10–12 cm), the cubic model is most suitable, while for DBH values exceeding 12 cm, the allometric model remains the preferred choice. Additionally, when both DBH and internode length at breast height are available, the MLR model provides an effective means of biomass estimation.
This classification-based approach enables practitioners to select the most appropriate model according to specific DBH ranges, facilitating real-time adjustments and optimizations for biomass prediction. Although using multiple models may introduce complexity in traditional production processes, advanced applications can leverage computational tools to dynamically determine the most suitable equation based on real-time measurements, achieving optimal accuracy and flexibility. This methodology not only provides a scientific basis for production decision-making but also significantly improves the accuracy of biomass estimation for D. brandisii, thereby enhancing production efficiency and underscoring its strong practical applicability in bamboo forestry management.

Author Contributions

Conceptualization, Z.W. and W.L.; methodology, L.G.; software, Z.W.; validation, Z.W. and W.L.; formal analysis, C.C.; investigation, C.H.; resources, L.G.; data curation, Z.W.; writing—original draft preparation, Z.W.; writing—review and editing, W.Z., Z.X., and S.F.; visualization, L.G.; supervision, C.H. and W.L.; project administration, W.L.; funding acquisition, W.L. All authors have read and agreed to the published version of the manuscript.

Funding

This study was funded by the National Key R&D Program of China (2023YFD220120102), the Basic Research Special Project of Yunnan Province (202201AT070053), the Joint Special Project of Yunnan Province Agriculture (202301BD070001-123), the Monitoring Fund of “Dian Nan Bamboo Forest Ecosystem Positioning Observation Research Station” (2024-YN-15), and the Fund of the Changing Farmers Academician Workstation. It was also supported by the Bamboo and Rattan Research Institute of Southwest Forestry University.

Data Availability Statement

The data used and analyzed during the current study are not publicly available due to restrictions imposed by the funding institution. However, they can be made available from the corresponding author upon reasonable request.

Acknowledgments

I would like to express my deepest gratitude to all individuals and institutions who contributed to this research. Foremost, my sincere thanks go to my supervisor, for her invaluable guidance and academic insights that shaped this study. Special thanks to ChatGPT for its technical assistance in language polishing and translation, which significantly facilitated the cross-linguistic academic communication process.

Conflicts of Interest

The authors declare no conflict of interest.

References

  1. Zianis, D.; Muukkonen, P.; Mäkipää, R.; Mencuccini, M. Biomass and Stem Volume Equations for Tree Species in Europe; Silva Fennica Monogr; Tammer-Paino Oy: Tampere, Finland, 2005. [Google Scholar]
  2. Yang, H.; Guo, Z.; Chu, X.; Man, R.; Chen, J.; Liu, C.; Tao, J.; Jiang, Y. Comment on “Impacts of Species Richness on Productivity in a Large-Scale Subtropical Forest Experiment”. Science 2019, 363, eaav9117. [Google Scholar] [CrossRef] [PubMed]
  3. Návar, J. A Stand-Class Growth and Yield Model for Mexico’s Northern Temperate, Mixed and Multiaged Forests. Forests 2014, 5, 3048–3069. [Google Scholar] [CrossRef]
  4. Jyoti Nath, A.; Das, G.; Das, A.K. Above Ground Standing Biomass and Carbon Storage in Village Bamboos in North East India. Biomass Bioenergy 2009, 33, 1188–1196. [Google Scholar] [CrossRef]
  5. Dong, L.; Zhang, L.; Li, F. Developing Two Additive Biomass Equations for Three Coniferous Plantation Species in Northeast China. Forests 2016, 7, 136. [Google Scholar] [CrossRef]
  6. Esteban, J.; McRoberts, R.E.; Fernández-Landa, A.; Tomé, J.L.; Nӕsset, E. Estimating Forest Volume and Biomass and Their Changes Using Random Forests and Remotely Sensed Data. Remote Sens. 2019, 11, 1944. [Google Scholar] [CrossRef]
  7. Millan, M.; Bonnet, A.; Dauzat, J.; Vezy, R. Advancing Fine Branch Biomass Estimation with Lidar and Structural Models. Ann. Bot. 2024, 134, 455–466. [Google Scholar] [CrossRef]
  8. Lin, Y.; Jaakkola, A.; Hyyppä, J.; Kaartinen, H. From TLS to VLS: Biomass Estimation at Individual Tree Level. Remote Sens. 2010, 2, 1864–1879. [Google Scholar] [CrossRef]
  9. Brown, S.; Gillespie, A.J.R.; Lugo, A.E. Biomass Estimation Methods for Tropical Forests with Applications to Forest Inventory Data. For. Sci. 1989, 35, 881–902. [Google Scholar] [CrossRef]
  10. Jenkins, J.C. Comprehensive Database of Diameter-Based Biomass Regressions for North American Tree Species; United States Department of Agriculture, Forest Service, Northeastern Research Station: Amherst, MA, USA, 2004. [Google Scholar]
  11. Seelan, S.K.; Laguette, S.; Casady, G.M.; Seielstad, G.A. Remote Sensing Applications for Precision Agriculture: A Learning Community Approach. Remote Sens. Environ. 2003, 88, 157–169. [Google Scholar] [CrossRef]
  12. Wang, S.; Lin, S.; Li, W.; Ding, Y. Variations in Fiber Morphology and Chemical Components of Dendrocalamus giganteus. For. Prod. J. 2016, 66, 319–325. [Google Scholar] [CrossRef]
  13. Wu, Y.; Cao, X.; Zhang, X.; Wei, J.; Xiong, Z.; You, J.; Gan, S.; Chen, D.; Zhang, H. The Influence Analysis of Bamboo Stand Structure on the Bamboo Shoot Yield of Pleioblastus macutatus. J. Sichuan For. Sci. Technol. 2019, 40, 55–59. [Google Scholar]
  14. Yen, T.; Lee, J. Comparing Aboveground Carbon Sequestration between Moso Bamboo (Phyllostachys heterocycla) and China Fir (Cunninghamia lanceolata) Forests Based on the Allometric Model. For. Ecol. Manag. 2011, 261, 995–1002. [Google Scholar] [CrossRef]
  15. Eggleston, H.S.; Buendia, L.; Miwa, K.; Ngara, T.; Tanabe, K. (Eds.) 2006 IPCC Guidelines for National Greenhouse Gas Inventories; Institute for Global Environmental Strategies (IGES): Hayama, Japan, 2006. [Google Scholar]
  16. Yen, T.; Sun, P.; Li, L. Predicting Aboveground Biomass and Carbon Storage for Ma Bamboo (Dendrocalamus latiflorus Munro) Plantations. Forests 2023, 14, 854. [Google Scholar] [CrossRef]
  17. Yen, T.; Ji, Y.; Lee, J. Estimating Biomass Production and Carbon Storage for a Fast-Growing Makino Bamboo (Phyllostachys makinoi) Plant Based on the Diameter Distribution Model. For. Ecol. Manag. 2010, 260, 339–344. [Google Scholar] [CrossRef]
  18. Huang, D.; Huang, D.; Wei, L.; Li, L.; Xu, Z. Culm Form Structure and Biomass of Bambusa chungii. World Bamboo Ratt. 2020, 18, 28–32. [Google Scholar]
  19. Hou, Y.; Yao, W.; Yang, G.; Cui, Y.; Zhou, H.; Zhang, X. Study on the Culm Structure and Allocation of Aboveground Biomass of Dendrocalamus tsiangii. J. Bamboo Res. 2023, 42, 51–57. [Google Scholar]
  20. Peng, Y.; Fan, S.; Su, W.; Xia, P. Distribution Pattern of Above-Ground Biomass and Culm Form Characteristics of Bambusa blumeana. J. Sichuan Agric. Univ. 2013, 31, 296–301. [Google Scholar]
  21. Zheng, Y.; Xu, Z.; Jia, D.; Li, Z. Study on Allocation of Aboveground Biomass and Optimal Model of Dendrocalamus latiflorus Shoot-Producing. J. Bamboo Res. 2023, 42, 23–29. [Google Scholar]
  22. Lin, D.; Zhao, H.; Li, Z.; Huang, C.; Xu, W. The Distribution Characteristics and Regression Model of Aboveground Biomass of Pleioblastus amarus in Nanling Mountain, Gangdong. Chin. J. Ecol. 2024, 43, 3205–3210. [Google Scholar]
  23. Kaushal, R.; Islam, S.; Tewari, S.; Tomar, J.M.S.; Thapliyal, S.; Madhu, M.; Trinh, T.L.; Singh, T.; Singh, A.; Durai, J. An Allometric Model-Based Approach for Estimating Biomass in Seven Indian Bamboo Species in Western Himalayan Foothills, India. Sci. Rep. 2022, 12, 7527. [Google Scholar] [CrossRef] [PubMed]
  24. Jiang, X.; Zhou, H.; Yan, Y.; Hou, Y.; Yang, Y.; Xie, T. Culm Structure and Above-Ground Biomass Allocation of Dendrocalamus farinosus and Bambusa rigida. Guizhou For. Sci. Technol. 2023, 51, 39–43. [Google Scholar]
  25. Yuen, J.; Fung, T.; Ziegler, A.D. Carbon Stocks in Bamboo Ecosystems Worldwide: Estimates and Uncertainties. For. Ecol. Manag. 2017, 393, 113–138. [Google Scholar] [CrossRef]
  26. Kong, F.; Zhong, Q.; Yu, L.; Kuang, X.; Huang, S.; Lu, Y.; Li, Y.; Gao, F. Regression Model of Biomass of Phyllstachys edulis at Different Age Classes in Ruijin, Jiangxi Province. South China For. Sci. 2022, 50, 39–42. [Google Scholar]
  27. Shi, Z.; Hui, C.; Zhang, J.; Wu, C.; Qin, Y. Research on Chemical Composition and Fiber Morphology of Dendrocalamus brandisii. Biomass Chem. Eng. 2009, 43, 21–24. [Google Scholar]
  28. Huang, D.; Li, L.; Huang, Y.; Lin, J.; Lu, Z.; Wei, C. Investigation on Germplasm Resources of Shoot-Producing Bamboo Species in Guangxi and Their Utilization. World Bamboo Ratt. 2024, 22, 48–53. [Google Scholar]
  29. Ma, S.; Ouyang, W.; Liu, X.; Han, M.; Yang, Y.; Guo, A. Physicochemical Properties of Dietary Fiber from Dendrocalamus brandisii Leaves. Food Res. Dev. 2021, 42, 1–7. [Google Scholar]
  30. Hui, C.; He, H.; Liu, W.; Shi, Z.; Sun, S. Promoting the Development of Dendrocalamus brandisii Industry for Rural Vitalization. World Bamboo Ratt. 2022, 20, 66–69. [Google Scholar]
  31. Tan, H.; He, B.; Tan, R.; Zhou, T. Technical Approaches for Building High-Yield and High-Efficiency Bamboo Forest Models for Sweet Bamboo. For. Sci. Technol. 2000, 32–33. [Google Scholar]
  32. Jianwei, L.; Wanling, Q.; Chaomao, H.; Qian, C.; Yumeng, W.; Shuhong, Z.; Xiuting, Z.; Weiyi, L. Geographical Variation in Quality of Dendrocalamus brandisii Bamboo Shoots and Its Relationship with Site Conditions. Sci. Silvae Sin. 2024, 60, 75–83. [Google Scholar]
  33. Yang, F.; Tang, M. Relationship between Site and Structure and Its Influence on Biomass in Phyllostachys edulis Forest. J. Zhejiang A&F Univ. 2020, 37, 823–832. [Google Scholar]
  34. Ji, X.; Luo, Q.; Ding, Y.; Wang, Y.; Zhao, J.; Wang, S. A Study on the Aboveground Biomass Model of Dendrocalamus brandisii. J. Bamboo Res. 2015, 34, 49–53. [Google Scholar]
  35. Zhang, X.; Zhang, F. A Study on the “Hollow Design” of Chinese Bamboo Product. In Proceedings of the 2008 9th International Conference on Computer-Aided Industrial Design and Conceptual Design, Kunming, China, 22–25 November 2008; pp. 729–733. [Google Scholar]
  36. Casas, L.F.; Aldana, A.M.; Henao-Diaz, F.; Villanueva, B.; Stevenson, P.R. Specific Gravity of Woody Tissue from Lowland Neotropical Plants: Differences Among Forest Types. Ecology 2017, 98, 1474. [Google Scholar] [CrossRef] [PubMed]
  37. Ghale, K.; Yadav, S.K.; Thapa, N.; Sah, J.N. Potentiality of Bamboos to Combat Climate Change Impacts and Biodiversity Conservation in the Annapurna Conservation Area, Nepal. J. For. Nat. Resour. Manag. 2020, 2, 79–91. [Google Scholar] [CrossRef]
  38. Ordóñez-Prado, C.; Tamarit-Urias, J.C.; Nava-Nava, A.; Rodríguez-Acosta, M. Additive Equations System to Estimate Aboveground Biomass by Structural Component and Total of Three Giant Bamboo Species in Mexico. CERNE 2024, 30, e-103267. [Google Scholar] [CrossRef]
  39. Li, Z.; Guan, F.; Zhou, X.; Liu, L.; Fu, D.; Zhang, X.; Li, M. Effect of Fertilization on Soil Fertility and Individual Stand Biomass in Strip Cut Moso Bamboo (Phyllostachys edulis) Forests. Forests 2024, 15, 252. [Google Scholar] [CrossRef]
  40. Xayalath, S.; Hirota, I.; Tomita, S.; Nakagawa, M. Allometric Equations for Estimating the Aboveground Biomass of Bamboos in Northern Laos. J. For. Res. 2019, 24, 115–119. [Google Scholar] [CrossRef]
  41. Etherington, T.R. Mahalanobis Distances for Ecological Niche Modelling and Outlier Detection: Implications of Sample Size, Error, and Bias for Selecting and Parameterising a Multivariate Location and Scatter Method. PeerJ 2021, 9, e11436. [Google Scholar] [CrossRef] [PubMed]
  42. Osewe, E.O.; Dutcă, I. The Effects of Combining the Variables in Allometric Biomass Models on Biomass Estimates over Large Forest Areas: A European Beech Case Study. Forests 2021, 12, 1428. [Google Scholar] [CrossRef]
  43. Zeng, W.; Tang, S. Goodness Evaluation and Precision Analysis of Tree Biomass Equations. Sci. Silvae Sin. 2011, 47, 106–113. [Google Scholar]
  44. ArauÂjo, T.M.; Higuchi, N.; Carvalho, J.A., Jr. Comparison of Formulae for Biomass Content Determination in a Tropical Rain Forest Site in the State of ParaÂ, Brazil. For. Ecol. Manag. 1999, 117, 52. [Google Scholar]
  45. Nocedal, J.; Wright, S.J. Quasi-Newton Methods. In Numerical Optimization; Springer: New York, NY, USA, 2006; pp. 135–163. [Google Scholar]
  46. Chunquan, X.; Qihu, X.; Liping, L.; Xiao, H.; Yong, L.; Han, Z.; Lei, C.; Yuancai, L. Biomass Models with Breast Height Diameter and Age for Main Nativetree Species in Guangdong Province. Sci. Silvae Sin. 2019, 55, 97–108. [Google Scholar]
  47. De Viliers, P. The Theory and Application of Regression Analysis and the Least-Sqaures Principle. Sci. Mil. South Afr. J. Mil. Stud. 2012, 7. [Google Scholar] [CrossRef]
  48. Hongwei, J.; Jielai, X. Partial Least Square and Its Application. J. Fourth Mil. Med. Univ. 2003, 24, 280–283. [Google Scholar]
  49. Berahas, A.S.; Jahani, M.; Richtárik, P.; Takáč, M. Quasi-Newton Methods for Machine Learning: Forget the Past, Just Sample. Optim. Methods Softw. 2022, 37, 1668–1704. [Google Scholar] [CrossRef]
  50. Wei, H.; Wei, X. Research on Surveying and Mapping Data Processing Based on Nonlinear Mathematical Models and Deep Learning Optimization. Scalable Comput. Pract. Exp. 2024, 25, 2260–2265. [Google Scholar] [CrossRef]
  51. Adediran, E.; Ameen, S. Machine Learning and Optimization Techniques for Solving Inverse Kinematics in a 7-DOF Robotic Arm. arXiv 2024, arXiv:2406.13064. [Google Scholar]
Figure 1. Map of the location of sampling sites.
Forests 16 00301 g001
Figure 2. Moisture content of different organs of D. brandisii across age classes.
Forests 16 00301 g002
Figure 3. Distribution of each organ in the aboveground biomass of individual D. brandisii plants at age classes I, II, and III (kg).
Forests 16 00301 g003
Figure 4. Curve fitting for cubic, allometry, and linear models.
Forests 16 00301 g004
Figure 5. MLR model (a); tree biomass model (b); height–diameter model (c).
Forests 16 00301 g005
Figure 6. Histogram of the breast diameter distribution of D. brandisii samples.
Forests 16 00301 g006
Figure 7. Residuals of tree biomass model, MLR model, height–diameter model, allometry model, and linear model (kg).
Forests 16 00301 g007
Table 1. Mathematical model formula.
Model NameModel Formula
Tree Biomass Model W = e β 0 D β 1 L β 2
Relative Growth Model W = a ( D 2 L ) b
MLR W = β 0 + β 1 D + β 2 L
Height–Diameter W = a D 2 L + b
Schumacher–Hall W = β 0 + β 1 ln D + β 2 l n L
Quadratic W = a + b D + c D 2
Cubic W = a + b D + c D 2 + d D 3
Compound W = a b D
Allometric W = a D b
Linear W = a + b D
Table 2. Preliminary results of mathematical model fitting.
Model NameModel Formula
Tree Biomass Model W = 0.1905 D 2.225 L 0.059
Relative Growth Model W = 0.0079 ( D 2 L ) 1.047
MLR W = 32.225 + 7.166 D + 0.099 L
Height–Diameter W = 0.012 D 2 L + 1.471
Schumacher–Hall W = 95.430 + 51.655 l n D + 5.515 l n L
Quadratic W = 8.65 + 1.746 D 0.33 D 2
Cubic W = 32.572 15.62 D + 2.573 D 2 0.09 D 3
Compound W = 2.052 × 1.339 D
Allometric W = 0.232 D 2.228
Linear W = 29.072 + 7.186 D
Table 3. Optimized results of mathematical models.
Model NameModel Formula
Tree Biomass Model W = 0.3290 D 2.0680 L 0.0199
Relative Growth Model W = 0.0272 ( D 2 L ) 0.9001
MLR W = 32.2251 + 7.1659 D + 0.0993 L
Height–Diameter W = 0.0115 D 2 L + 1.4715
Schumacher–Hall W = 95.4303 + 51.6547 l n D + 5.5155 l n L
Quadratic W = 8.6498 + 1.7457 D + 0.3298 D 2
Cubic W = 32.5724 15.6202 D + 2.5733 D 2 0.0904 D 3
Compound W = 4.4516 × 1.2429 D
Allometric W = 0.35509 D 2.0703
Linear W = 29.0719 + 7.1856 D
Table 4. Performance indicators of the model.
Model NameR2SEETREMSEMPEMPSETRE *MSE *
Tree Biomass Model0.74510.6−0.71−3.166.293.925.350.34
MLR0.73710.71.76 × 10−62.796.3254.934.01−1.30
Height–Diameter0.69211.55.21 × 10−6−3.116.8026.178.71−3.11
Cubic0.75310.4−5.19 × 10−50.246.0924.063.87−0.44
Allometric0.74510.5−0.71−3.136.1923.975.320.30
Linear0.73610.7−2.930.726.3050.153.84−1.21
R2, SEE, TRE, MSE, MPE, and MPSE are the model’s performance on this indicator in the modeling dataset. TRE * and MSE * represent the model’s performance on this indicator in the validation dataset.
Disclaimer/Publisher’s Note: The statements, opinions and data contained in all publications are solely those of the individual author(s) and contributor(s) and not of MDPI and/or the editor(s). MDPI and/or the editor(s) disclaim responsibility for any injury to people or property resulting from any ideas, methods, instructions or products referred to in the content.

