Article

Sensitivity of First Leaf Date to Temperature Change for Typical Woody Plants in Guiyang, China

1
Teachers College, Beijing Union University, 5 Waiguanxiejie Street, Chaoyang District, Beijing 100011, China
2
Institute of Science and Technology Education, Beijing Union University, 5 Waiguanxiejie Street, Chaoyang District, Beijing 100011, China
3
Key Laboratory of Land Surface Pattern and Simulation, Institute of Geographic Sciences and Natural Resources Research, Chinese Academy of Sciences, Beijing 100101, China
4
Xinjiang Institute of Ecology and Geography, Chinese Academy of Sciences, Urumqi 830011, China
5
Akesu National Station of Observation and Research for Oasis Agro-Ecosystem, Akesu 843017, China
6
University of Chinese Academy of Sciences, Beijing 100049, China
*
Author to whom correspondence should be addressed.
Forests 2025, 16(2), 300; https://doi.org/10.3390/f16020300
Submission received: 17 January 2025 / Revised: 5 February 2025 / Accepted: 7 February 2025 / Published: 9 February 2025
(This article belongs to the Section Forest Meteorology and Climate Change)

Abstract

:
The temperature sensitivity of plant phenology reflects how and to what extent plants respond to climate change and is significantly related to their ability to adapt to climate change. Previous studies on the temperature sensitivity of first leaf date (FLD) primarily focus on temperate regions, with relatively few studies conducted in subtropical areas. This study analyzed observational data on the FLD of 63 typical woody plant species from 1980 to 2019 in Guiyang, located in the subtropical zone of China. We quantified the trend of FLD and its sensitivity to temperature changes and then assessed the impact of sample size on the stability of sensitivity estimates. The results showed that (1) significant warming occurred in Guiyang during the study period, with the largest warming occurring in spring. (2) The FLD of the vast majority of plants (95.2%) showed an earlier trend during the study period (19.0% significantly at p < 0.05). The earlier trend of most species ranged from −3 to −1 days decades−1. The median of trends for all 63 species investigated was 1.97 days decades−1. (3) The interannual variation in FLD was significantly negatively correlated with the preseason average temperature (p < 0.05). Most of the temperature sensitivity of FLD was between −5 and −3 days °C−1, with a mean of −4.53 days °C−1. (4) The sample size significantly influenced the stability of the temperature sensitivity estimates. Using randomly selected 20-year data could limit the standard deviation of the sensitivity estimate to 0.3 days °C−1. These results suggest that the leaf unfolding date of subtropical species could track climate warming closely like temperature species. The temperature sensitivity of FLD should be estimated based on long-term observation data.

1. Introduction

Global warming has become one of the most pressing environmental issues in the world today [1]. According to the Sixth Assessment Report of the Intergovernmental Panel on Climate Change (IPCC), the global mean surface temperature increased by approximately 1.09 °C between 2011 and 2020 compared to the period from 1850 to 1900 [2]. Changes in plant phenophases, as direct evidence of the impact of climate change on ecosystems, have received widespread attention [3,4]. Studies based on ground-based phenological observation data have shown that spring phenophases (such as first leaf date, first flowering date, etc.) of woody plants have predominantly exhibited an earlier trend in Europe [5,6], Asia [7,8,9], and most regions of North America [10,11]. This advancement has also been confirmed by changes in the start of the growing season based on remote sensing data [12,13]. These observed phenological changes are closely linked to climate change. The advancement of spring phenophases in temperate regions of the Northern Hemisphere could be mainly attributed to temperature increases [4,14]. Photoperiod and chilling also play a key role in regulating the spring phenophases of woody plants [15,16]. In arid ecosystems, water availability has also been shown to influence spring phenological changes significantly [17].
Although spring phenophases have generally advanced, there are significant differences in the degree of advancement among species. For example, the rate of advancement of spring phenophases in 232 plant species ranged from −13 to −2 days decades−1 between 1985 and 2011 on the island of Guernsey [18]. In Canada, a study showed that the rate of change in first flowering date between 2001 and 2012 ranged from −20 to 2 days decades−1 among 19 species [19]. Furthermore, the degree of advancement in plant spring phenophases also varies across different study periods. For instance, between 1971 and 2000, the average rate of advancement in first leaf date (FLD, defined as the date of the first appearance of fully expanded leaves on selected individuals) of European species was −3.94 ± 0.03 days decades−1, whereas between 1951 and 2018, the advancement rate was −2.40 ± 0.02 days decades−1, possibly due to the lack of active warming in 1951–1970 [3,20]. These interspecific differences were primarily attributed to varying sensitivities in response to temperature change. For example, in Xi’an, China, the temperature sensitivity of FLD for 42 woody species ranged from −5.48 to −1.47 days °C−1 [21]. Such differences in temperature sensitivity have even altered the sequence of phenophases within the same year [22].
Temperature sensitivity of plant phenophases is closely related to the ability of plants to adapt to climate change [23]. Woody plants with higher temperature sensitivity are able to respond more quickly to warming by advancing flowering and leaf unfolding, thereby extending their growing season, which helps them better survive and reproduce under climate warming [24]. However, the advancement of spring phenophases may also make plants more vulnerable to late frosts, which can negatively impact their survival and reproductive success [25]. Plants with a lower temperature sensitivity of phenology may be unable to take advantage of the longer growing season for photosynthesis, which is detrimental to resource acquisition and reproduction [26]. Studying the temperature sensitivity of phenophases across different species helps identify plant species that are more resilient to climate change and provides scientific evidence for ecosystem management under future climate change scenarios [27,28].
To date, studies on the temperature sensitivity of FLD primarily focus on temperate regions, such as North China [27,28], Japan and Korea [29,30,31], Northwestern Europe [3,32], and the Northeastern United States [6,33]. However, research on the temperature sensitivity of FLD in subtropical humid climate zones is relatively limited. In light of this, we focused on the FLD of 63 woody plant species from 1980 to 2019 in a subtropical site (Guiyang, China). We applied a sliding correlation method to calculate the optimal period (OP) during which temperature influences FLD significantly for each species and used regression analysis to estimate the phenological trend and temperature sensitivity. The objectives of this study are (1) to reveal the temporal trend of FLD in Guiyang over the past 40 years; (2) to quantify the sensitivity of FLD in response to temperature; and (3) to assess the impact of sample size on the stability of sensitivity estimates.

2. Materials and Methods

2.1. Study Area

Guiyang is located in the central part of Guizhou Province, China, with an average elevation of around 1100 m. The phenological observation site is situated at Guizhou University (26°25′44″ N and 106°40′09″ E). This site has a subtropical humid and mild climate. During the phenological observation period (1980–2019), the annual average temperature was 14.2 °C, with January being the coldest month (average temperature of 3.7 °C) and July being the hottest month (average temperature of 22.6 °C) (Figure 1). The annual total precipitation was 1091.5 mm, with the majority of precipitation (63%) occurring from May to August (Figure 1).

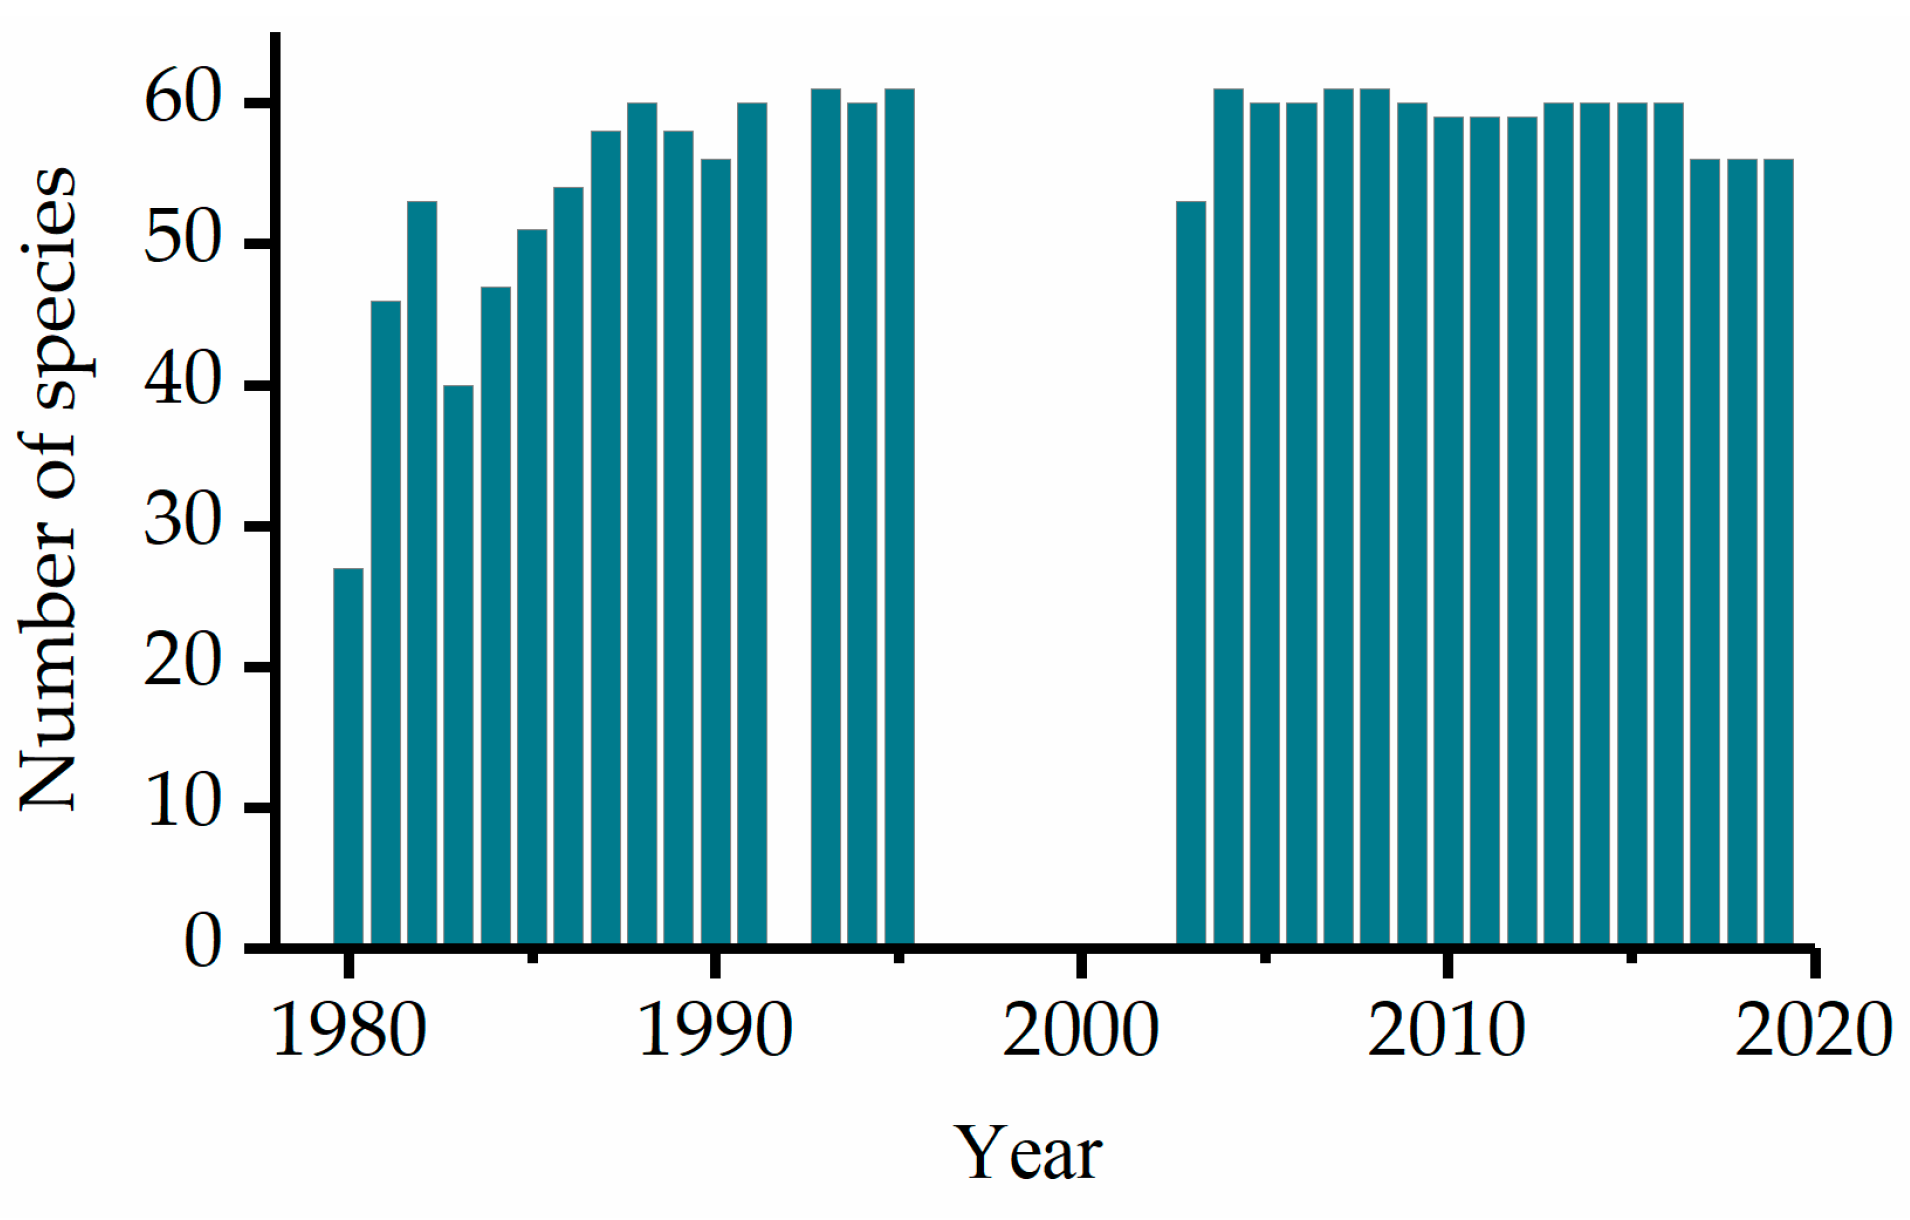
2.2. Phenological and Temperature Data

The phenological data used in this study were obtained from the China Phenology Observation Network (CPON). We used FLD data for 63 woody plant species from 1980 to 2019 (Table A1). According to the observation standards of CPON, FLD is defined as the date of the first appearance of fully expanded leaves on selected individuals [34]. During the entire study period, phenological observations were not conducted in 1992 or from 1996 to 2002. Thus, a total of 32 years of data were analyzed (Figure A1).
To ensure sufficient sample size for accurate trend estimation, the selected plant species must meet the following criteria: (1) at least 15 years of observation records between 1980 and 2019; (2) at least 5 years of observation records in both the 1980–1995 and 2003–2019 periods. Based on these criteria, 63 woody plant species were selected (Table A1). The discontinuous nature of the phenological observations caused varying numbers of species observed in each year, ranging from 38 to 63 species (Figure A1).
The daily temperature data (1980 to 2019) at Guiyang Station were downloaded from the China Meteorological Data Service Center (http://data.cma.cn/).

2.3. Methods

To investigate the climatic and phenological changes in Guiyang, linear regression analysis was first conducted between the monthly average temperatures and years to calculate the temperature trends for each month. Next, linear regression analysis was applied to the FLD data of different plant species to estimate the phenophase trends for each species. Additionally, for each species, the FLD time series was transferred to an anomaly time series by subtracting the multi-year average. The median of the FLD anomalies for all species was calculated annually to obtain a time series of median FLD anomalies, which represents the overall trend of FLD for all plant species. Furthermore, to explore the influence of period selection on the estimate of phenological trends, we also calculated the trends in the median FLD anomaly for all 10-year and longer periods between 1980 and 2019.
To study the sensitivity of FLD to temperature response, we first determined the optimal period during which temperature influences FLD most significantly. Previous studies have shown that FLD was typically significantly correlated with temperature from a specific preceding period [21,35,36]. Using the multi-year average FLD as the endpoint (EP), Pearson’s correlation coefficient between temperature and FLD was calculated for each period [EP – 15 × i, EP] (i = 1, 2, …, 12), with a step of 15 days. The period with the highest absolute value of the correlation coefficient was selected as the optimal period (OP) influencing FLD. Subsequently, regression analysis was performed on the FLD of each plant species and the mean temperature of the optimal period:
FLD = b × TEM + a + e
where FLD represents the leaf unfolding date, TEM represents the average temperature of the optimal period, a is the intercept, and e is the error term. b is the regression slope, which serves as the indicator of temperature sensitivity. For each species, the temperature sensitivity of FLD was estimated using all available data and Equation (1).
Furthermore, the average temperature time series for the optimal period of each species was converted to an anomaly time series by subtracting the multi-year average. The median of the OP temperature anomalies for all species was calculated, representing the overall interannual change of preseason temperature.
To investigate the effect of sample size on sensitivity estimation, we analyzed the 32-year time series of the median FLD anomaly and median OP temperature anomaly. First, the overall temperature sensitivity (ball) was calculated using Equation (1). Next, a random number generation algorithm was employed to generate FLD and corresponding temperature series with different sample sizes. For example, for a 5-year sample size, 5 years were randomly selected from the available data and the corresponding temperature and FLD data were extracted to compute the temperature sensitivity of FLD. This process was repeated 1000 times to obtain a set of sensitivity estimates for a 5-year sample size. Similarly, we calculated sensitivity for different sample sizes (from 5 to 22 years) and compared the standard deviations of sensitivity estimates and the probabilities of results falling within the 95% confidence interval of ball.

3. Results

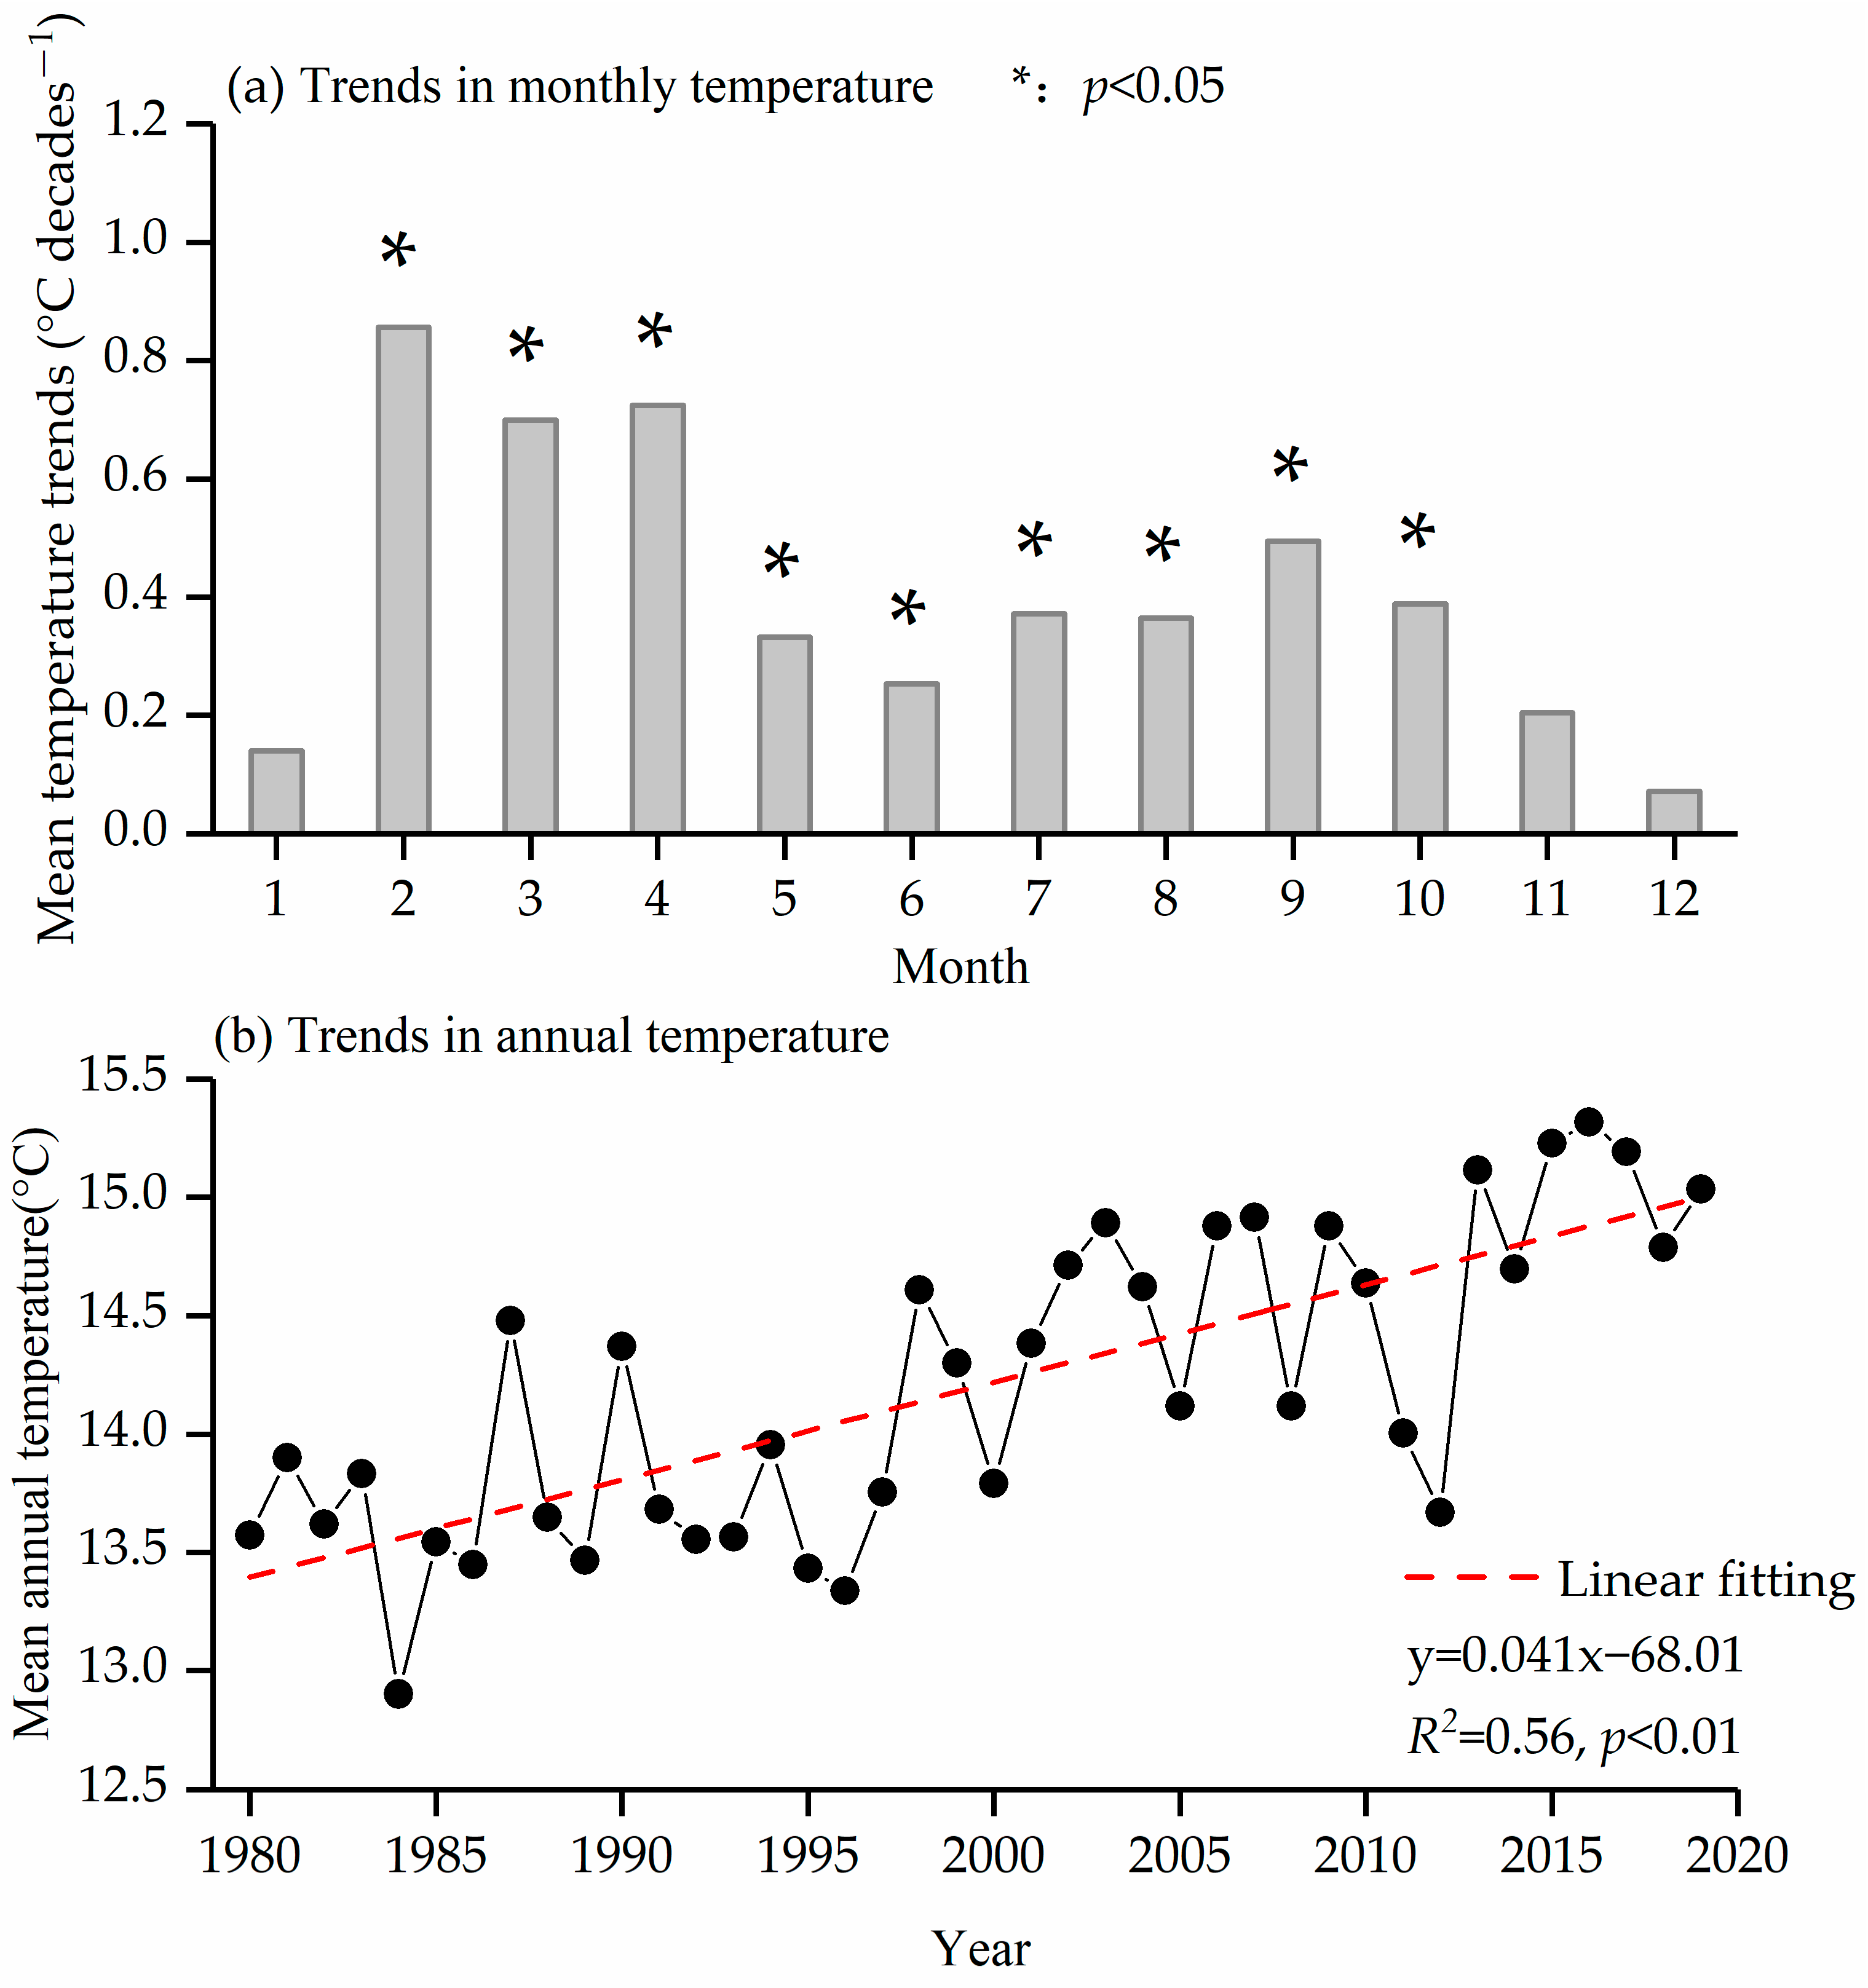
3.1. Temperature Trend

From 1980 to 2019, Guiyang experienced significant climate change. The annual average temperature showed a significant increasing trend of 0.41 °C decades−1 (p < 0.05, Figure 2b). Over the past 40 years, temperatures increased for all months (Figure 2a), with the temperature rise being statistically significant (p < 0.05) from February to October. Among these months, February exhibited the largest temperature increase of 0.85 °C decades−1.

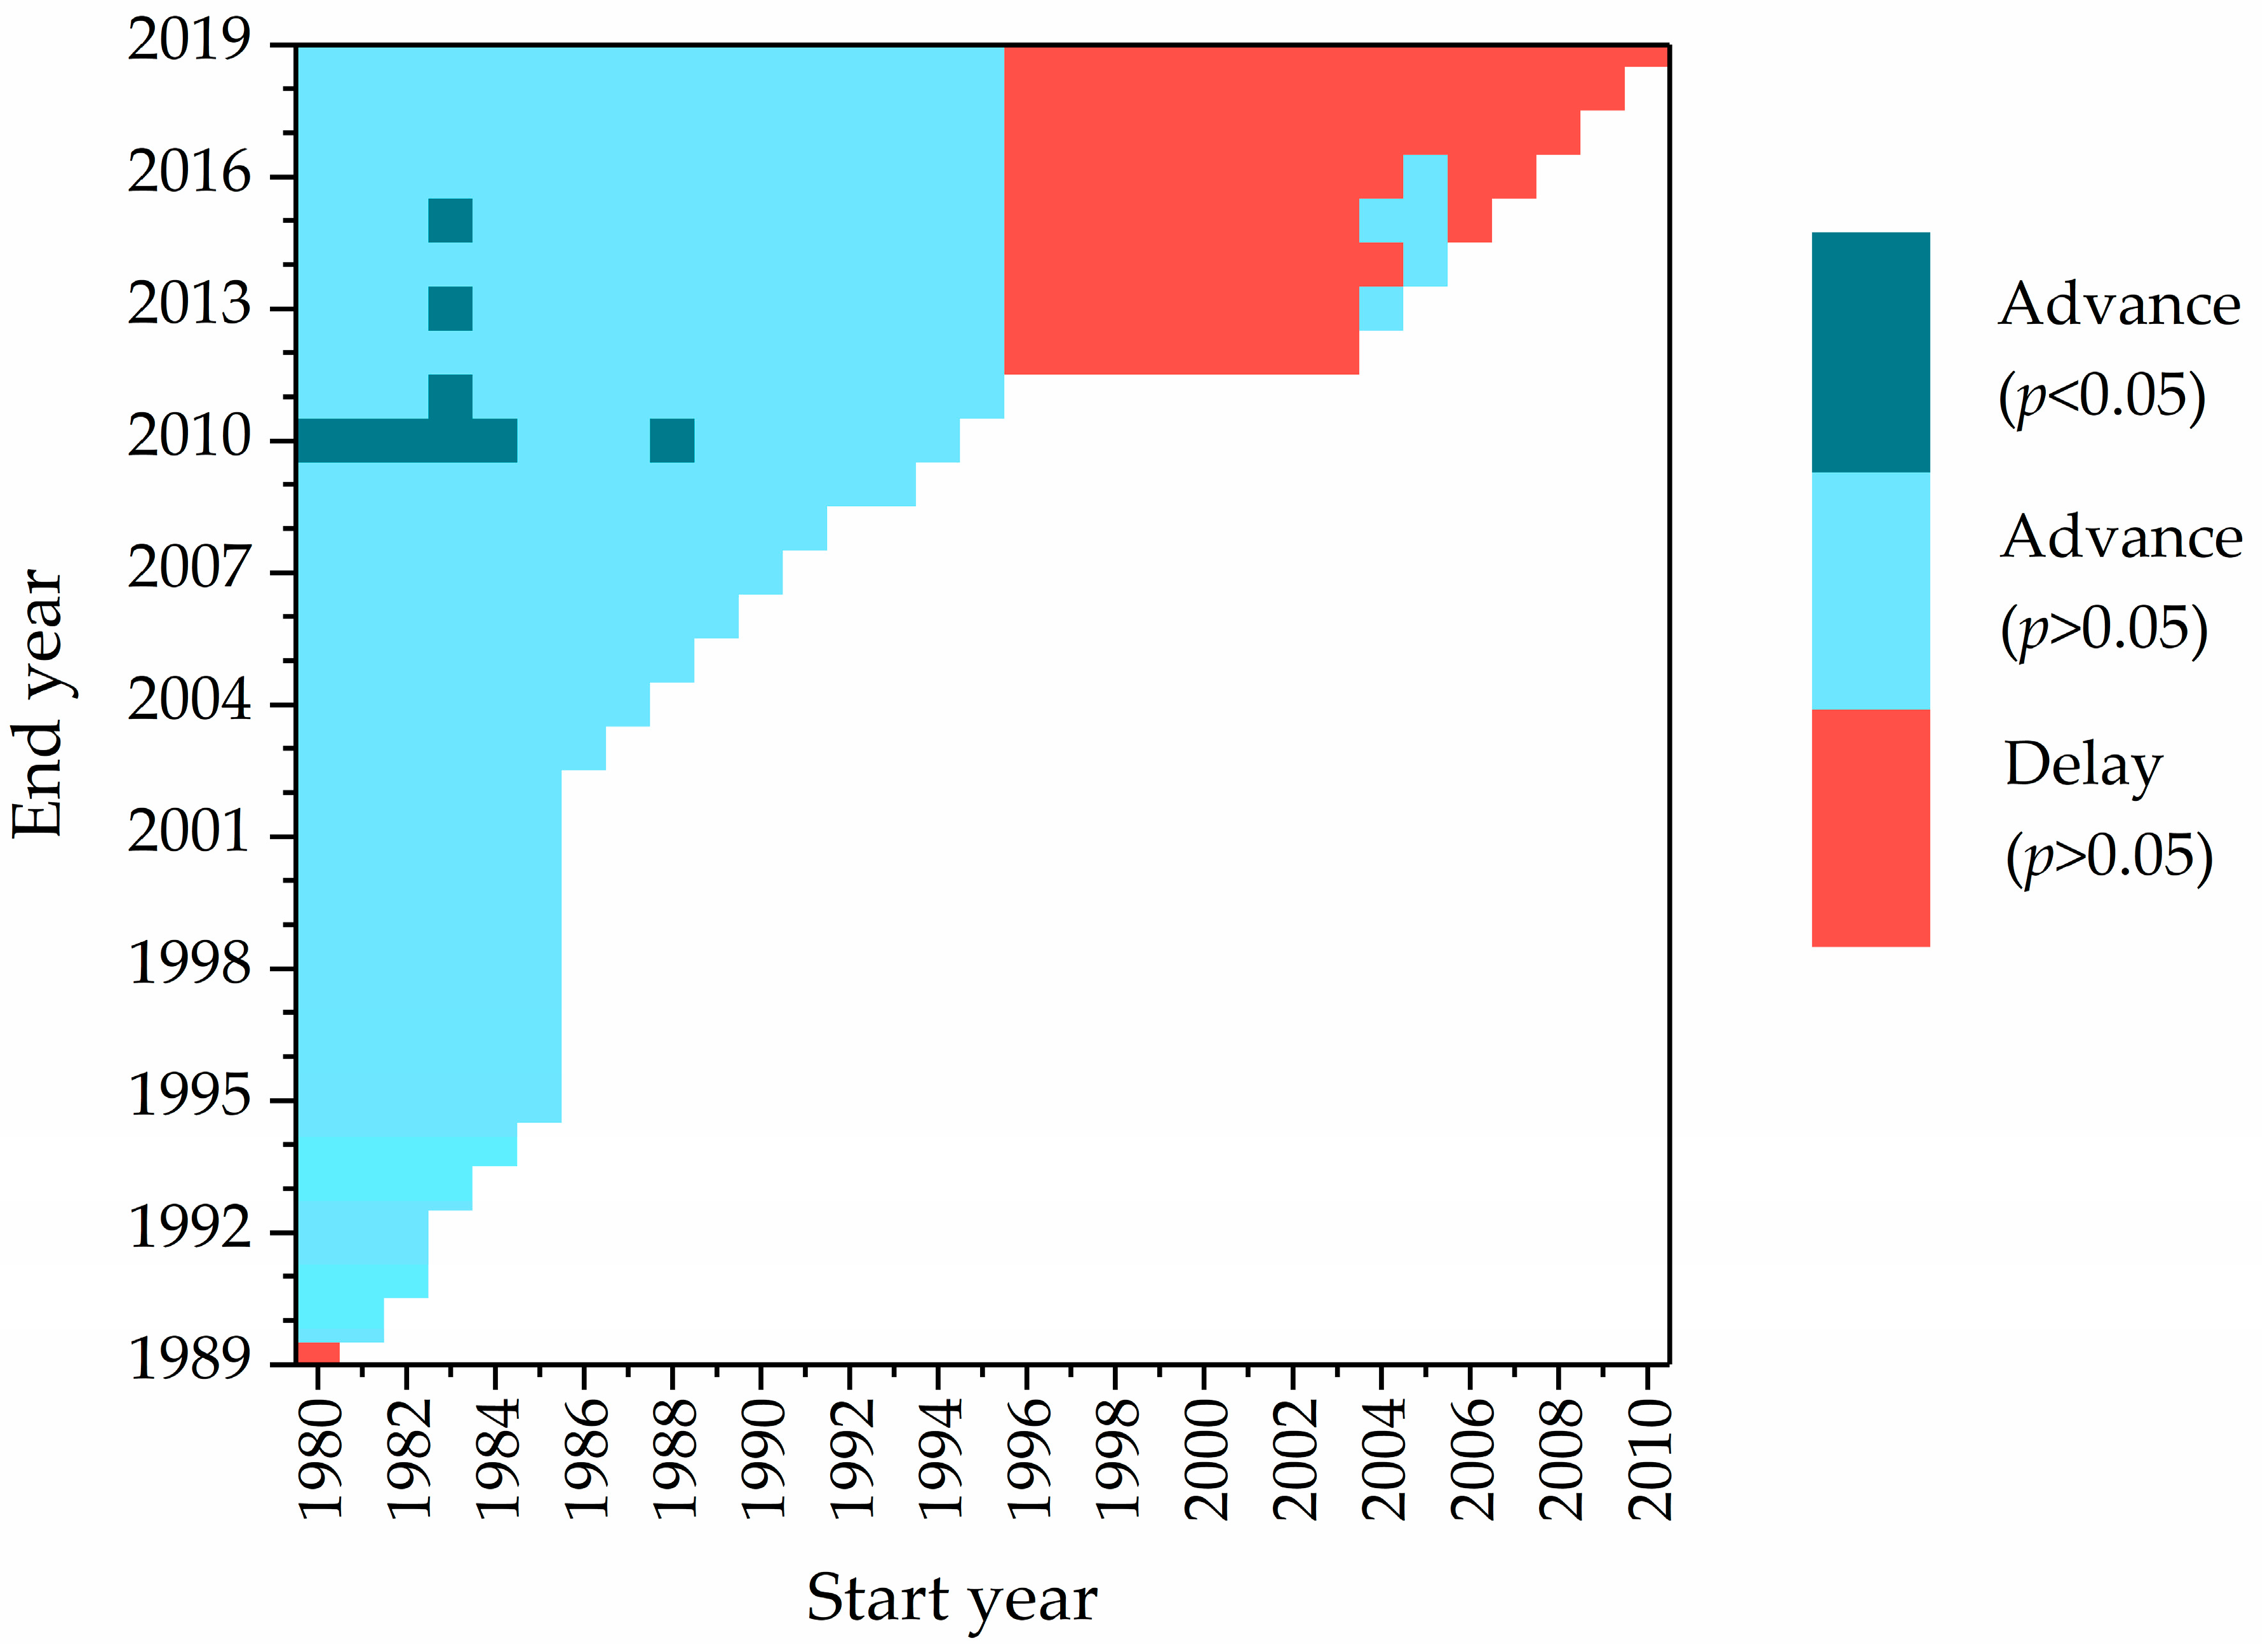
3.2. Leaf Unfolding Patterns and Changes Across Different Periods

The average FLD for all 63 species ranged from February 11 (Chaenomeles cathayensis) to April 12 (Pinus massoniana Lamb.). Nine species (14%) began leaf unfolding in February, while fifty species (79%) began in March and five species (8%) began in April (Table A1). FLD exhibited strong inter-annual variability in Guiyang, with an average standard deviation of 10.90 days (Figure 3a). The species with the smallest inter-annual variation (standard deviation of 7.05 days) was Liriodendron chinense (Hemsl.) Sarg., while the largest variation was observed in Hibiscus mutabilis L. (standard deviation of 16.38 days). Overall, the standard deviation of inter-annual variation in FLD was significantly negatively correlated with the average FLD (R = −0.36, p < 0.05), indicating that species with earlier FLD tend to show stronger inter-annual variation.
The FLD for various plant species in Guiyang revealed a predominant trend (Figure 3b). Among the 63 species, 60 species (95.2%) exhibited an earlier FLD between 1980 and 2019, with 12 species showing a significant advance (p < 0.05). Only three species showed a non-significant delayed trend in FLD. The species with the strongest advance in leaf unfolding was Pyrus calleryana Decne. (−6.50 days decades−1), while the weakest trend was observed in Corylus avellana L. (−0.05 days decades−1). The majority of species showed an earlier trend between −3 to −1 days decades−1 (Figure 3b).
According to the time series of the median FLD anomaly for all the 63 species in Guiyang (Figure 3c), the FLD anomalies were predominantly late before 1995 (average anomaly of 3.73 days), with only one extreme early FLD in 1987 (anomaly of −18.45 days). From 2003 to 2019, the anomalies shifted towards earlier, with 9 out of 17 years showing negative anomalies and the average anomaly being −2.47 days (Figure 3c). Such change from late to early FLD resulted in an overall advance of 1.97 days decades−1 over the 1980–2019 period, although this trend was not statistically significant. Figure 4 shows the changes in median FLD anomalies for different periods. The vast majority of periods longer than 10 years showed an earlier trend. Only in the periods starting between 1980–1983 and ending between 2009–2015, FLD showed a significant advance (p < 0.05). In the period from 1996–2010 to 2011–2019, the trend even showed a non-significant delaying trend. Considering the lack of observation data between 1996–2002, the slight delay in FLD mainly occurred after 2003.

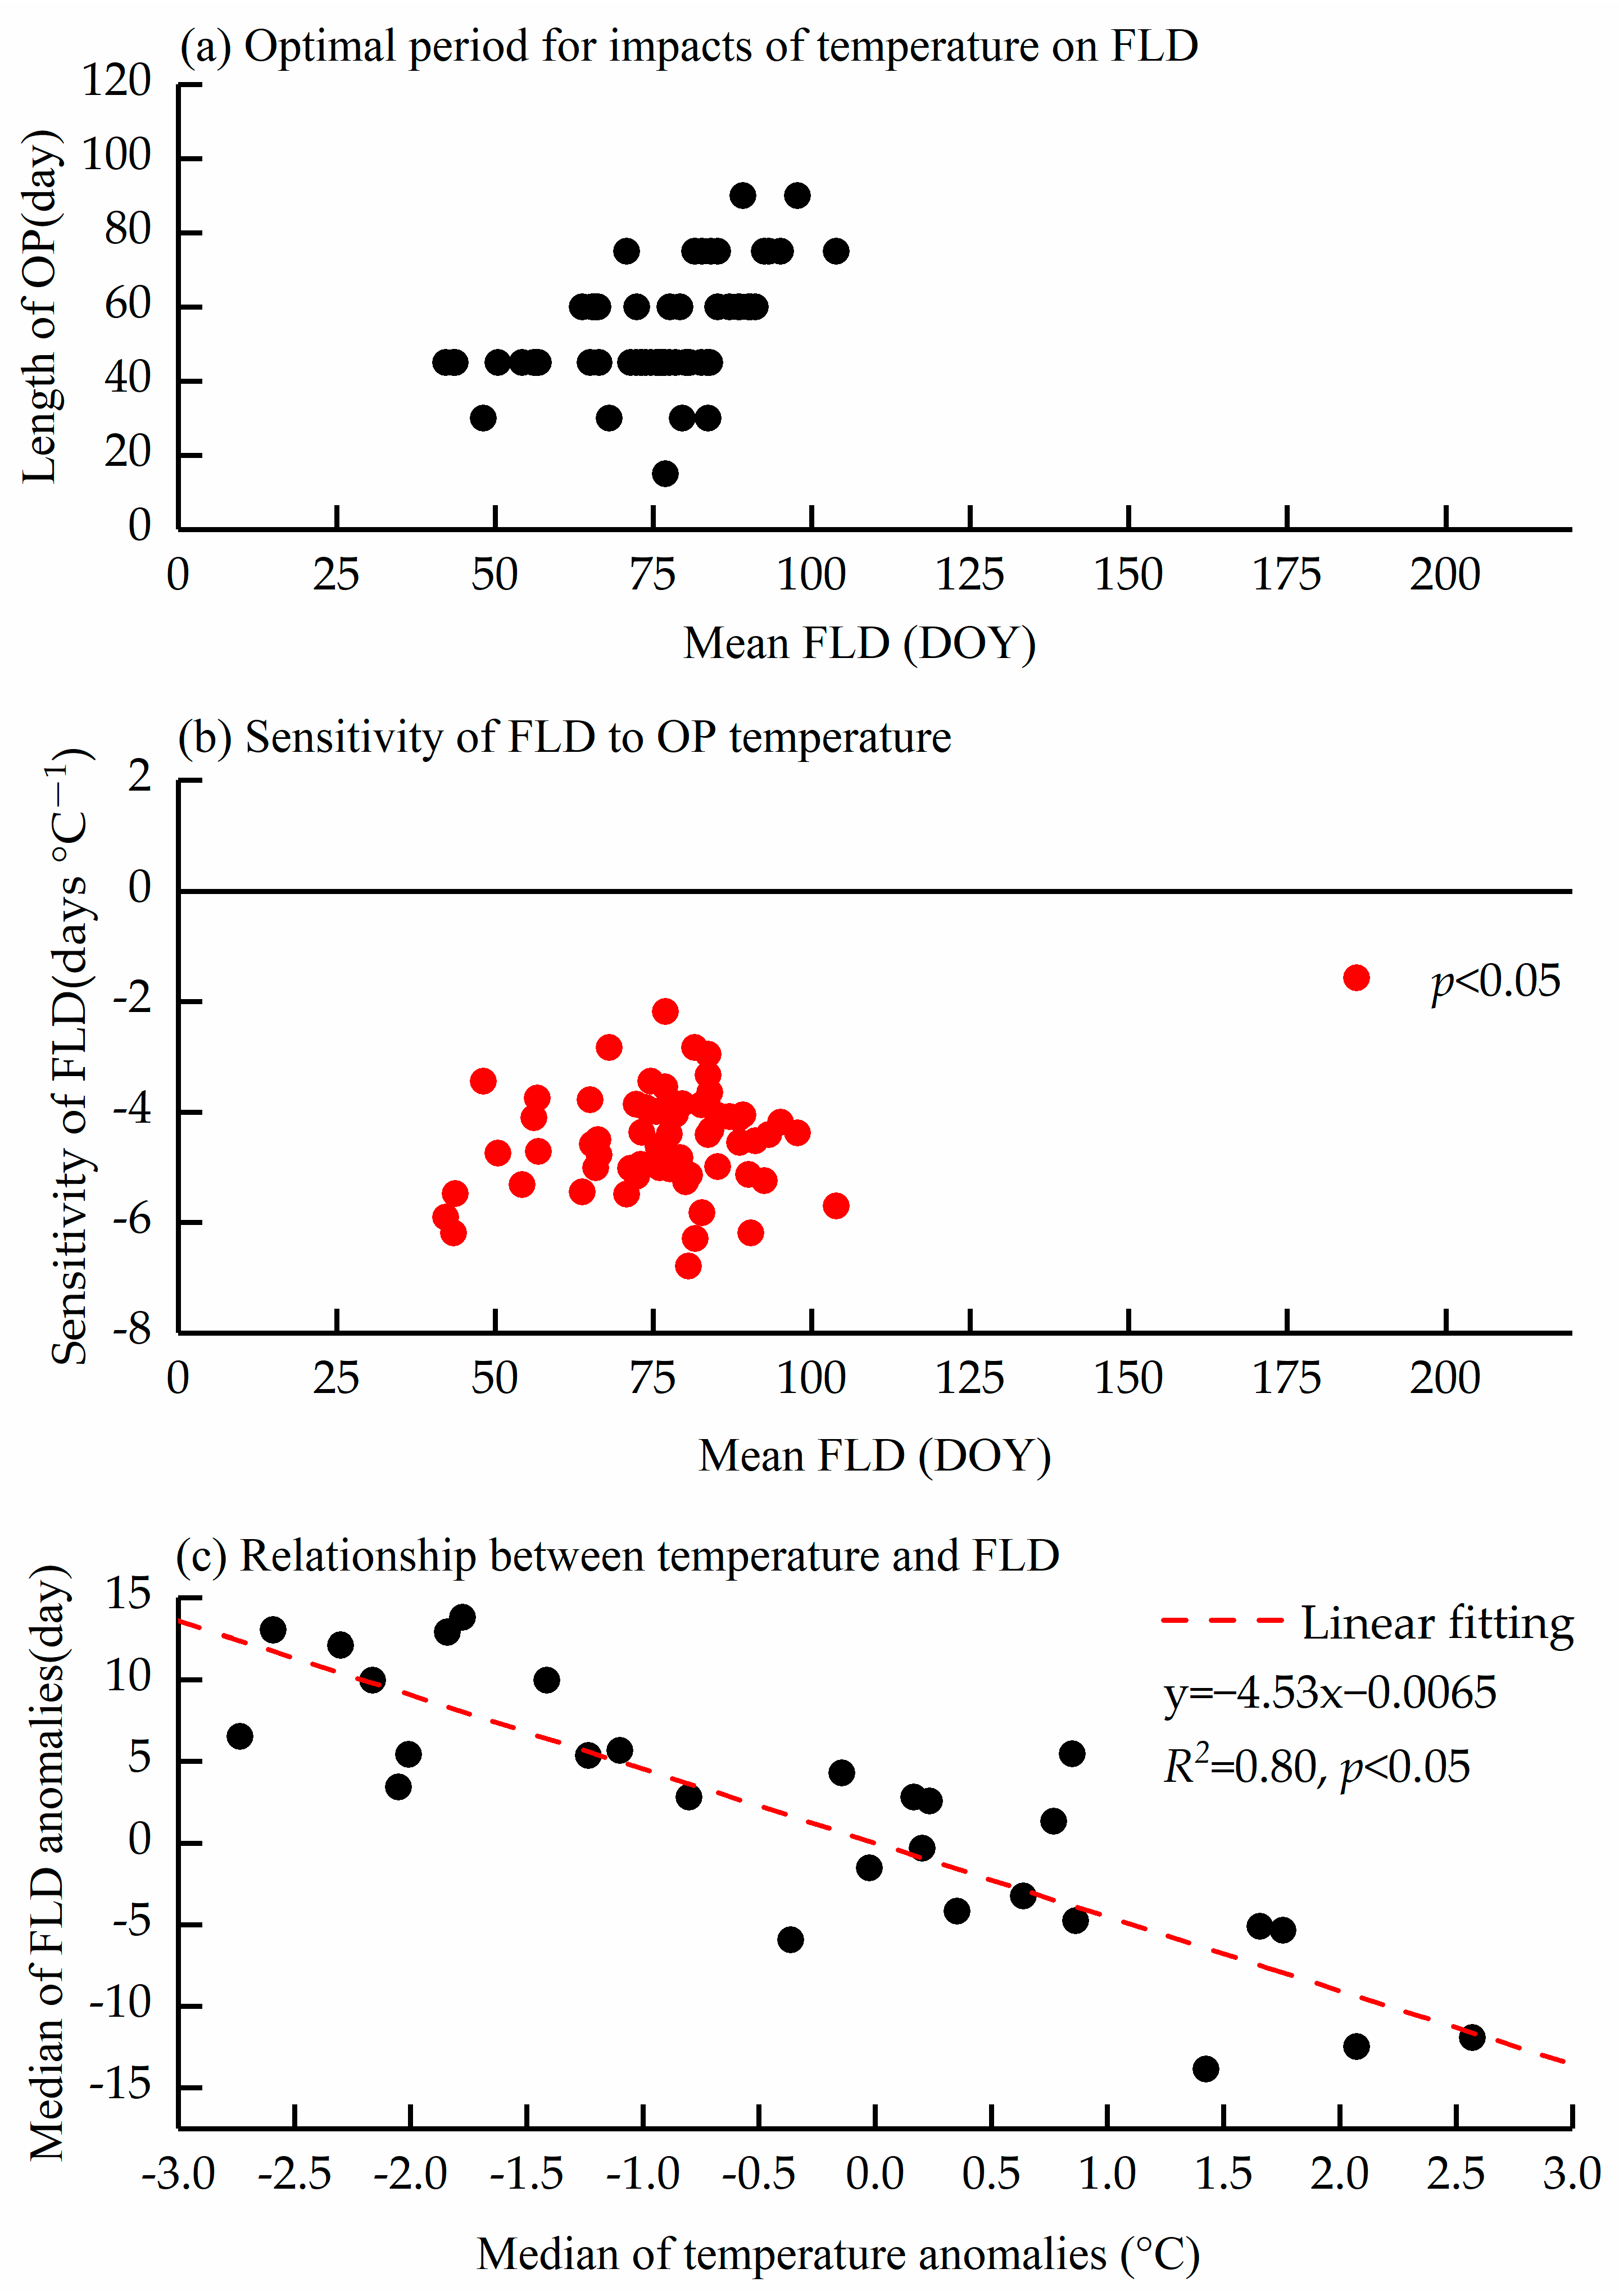
3.3. Relationship Between FLD and Temperature

Figure 5a shows the length of the optimal period in which temperature influences the FLD most significantly for each species. The average length of the optimal period for all species was 52.8 days, with most species (71.4%) having an optimal period between 45 and 60 days. Figure 5b illustrates the temperature sensitivity of FLD for each plant species, based on the mean temperature during the optimal period. For all 63 species, the response of FLD to temperature during the optimal period was statistically significant (p < 0.05). The strongest response was observed in Hibiscus mutabilis L., with a sensitivity of −6.79 days °C−1, while the weakest response was in Prunus persica (L.) Batsch, with a sensitivity of only −2.18 days °C−1. In terms of the frequency distribution of temperature sensitivity, most species (62%) had temperature sensitivity between −5 and −3 days °C−1. Regression analysis between the median FLD anomaly for all species and the median temperature anomaly for the optimal period revealed a significant correlation (R2 = −0.80, p < 0.05). The overall temperature sensitivity (ball) was −4.53 days °C−1 (with a 95% confidence interval of −5.34 to −3.71), indicating that for every 1°C increase in temperature, the average FLD in Guiyang was advanced by 4.53 days (Figure 5c).

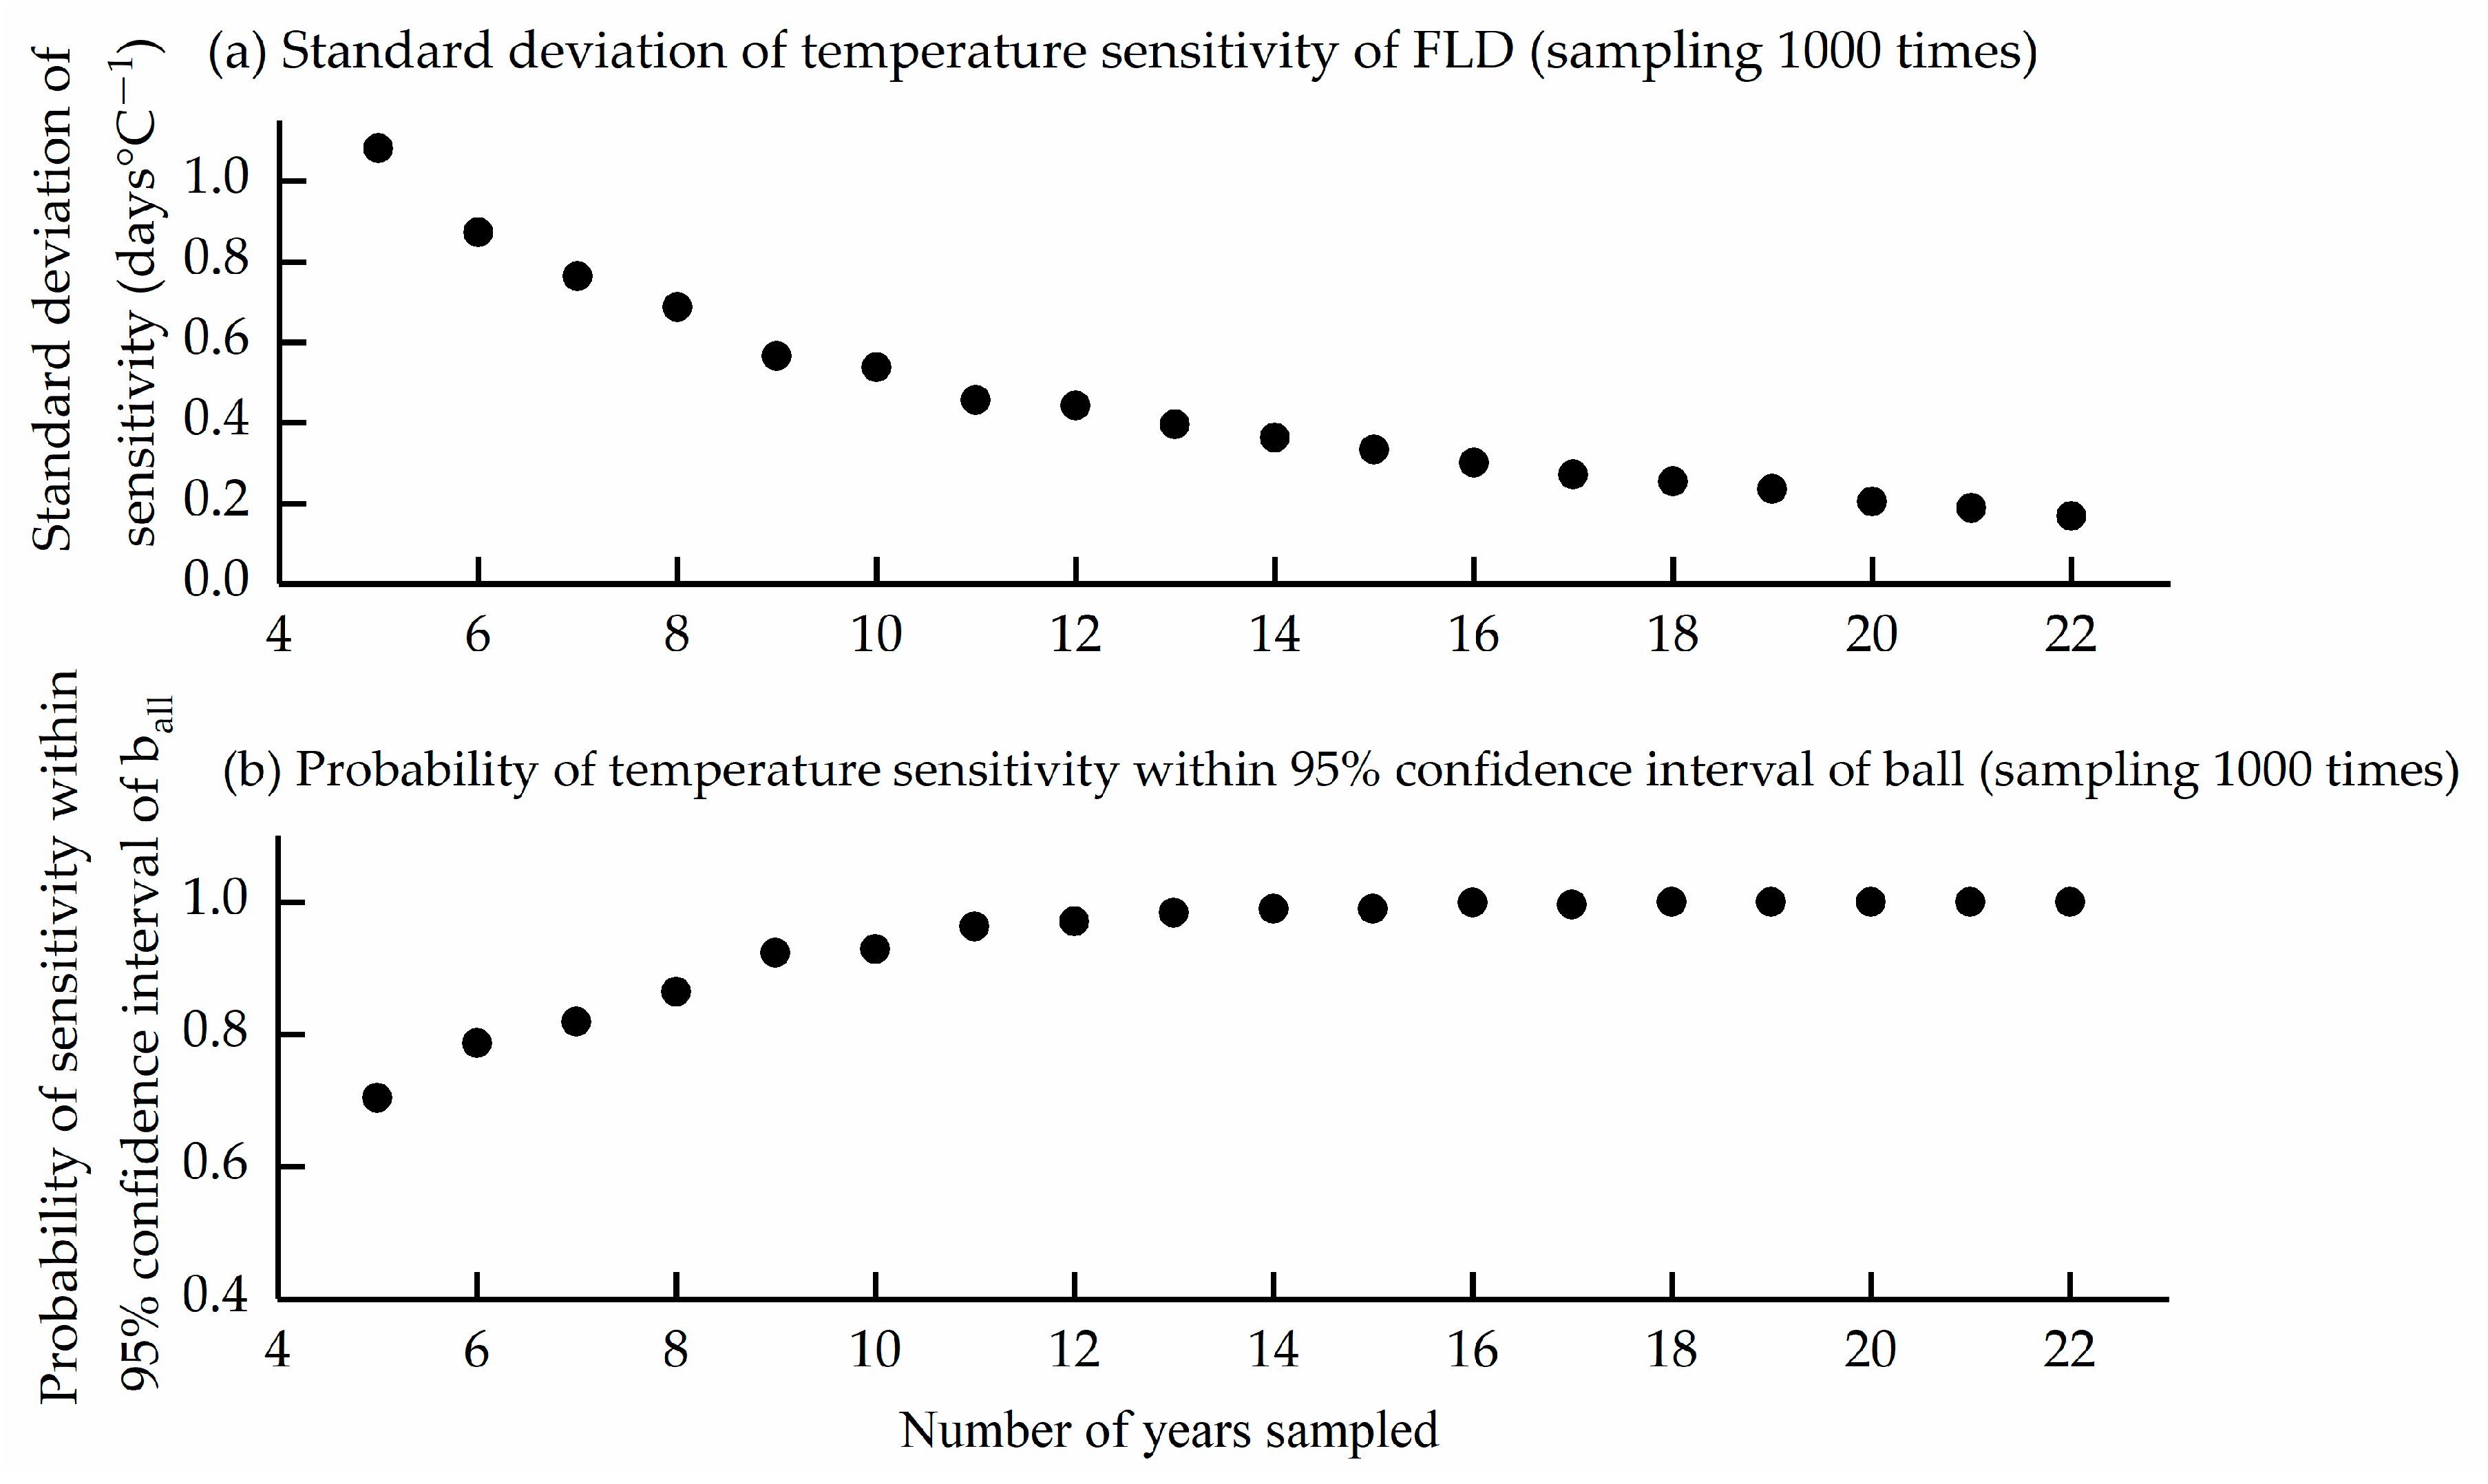
3.4. Impact of Sample Size on Sensitivity Estimation

The results of random sampling show that when the sample size was only 5 years, the standard deviation of temperature sensitivity from 1000 samplings was 1.24 days °C−1, with a probability of 55.6% that the estimates fall within the 95% confidence interval of ball (Figure 6). As the sample size increases, the standard deviation gradually decreases, and the probability of estimates falling within the 95% confidence interval of ball increases. When the sample size reached 20 years, the standard deviation from 1000 samplings decreased to 0.32 days °C−1, and 98.8% of the estimates fell within the 95% confidence interval of ball. This result demonstrated that the sample size has a significant impact on the stability of sensitivity estimation.

4. Discussion

We found that the median FLD of all plant species in Guiyang showed a significant earlier trend between 1980 and 2010, but the trend became delayed between 2011 and 2019 (Figure 4). This result suggests that the trend of earlier leaf unfolding was weakening or even reversed in the recent decade. This result was consistent with the finding of a reduced response of spring phenology to temperature during warmer periods [37]. Moreover, the study period has a significant impact on the estimation of phenological trends. Only the periods starting from 1980–1986 and ending in 2009–2016 showed a significant earlier trend. If the time series began from 1997–2010 and ended in 2011–2019, the result may even indicate a delay in FLD (Figure 4). This is also in line with previous studies. For example, through a sliding trend analysis of long-term historical phenological data, it was found that phenological change trends varied among each consecutive 30 years [38,39]. Such a difference in phenological trends was due to the distinct climate fluctuations over various periods. When synthesizing phenological changes from multiple studies to derive national or global-scale phenological trends, it is crucial to consider the varying periods used in different studies, as the results depend on the time window chosen [36].
This study found that the FLD of all surveyed plants was significantly correlated with temperature, with an overall sensitivity of −4.53 days °C−1. This value is higher than those reported for temperate regions. For instance, the average temperature sensitivity of FLD in Beijing, Xi’an, and Mudanjiang (all located in temperate regions) during 1963–2020 was −3.28 days °C−1 [9], and for 21 countries across Europe, the average sensitivity for spring and summer phenology was −2.5 days °C−1 [20]. This further confirms the fact that low-latitude regions exhibit higher temperature sensitivity compared to high-latitude regions [6]. Temperature sensitivity not only reflects how and to what extent phenological events respond to climate change, but also relates to the plants’ ability to adapt to climate change. Tree species with higher temperature sensitivity are able to respond more quickly to global warming, advancing leaf unfolding and flowering to lengthen the growing season. This adaptation helps these plants survive and reproduce in a warming climate [24]. In contrast, species that are less responsive to climate change may face growth limitations because they might miss out on crucial interactions with symbiotic organisms (e.g., plants that rely on insect pollination) or experience a shorter growing season [26,40]. Species whose phenology did not respond to climate change have significantly declined in their abundance within communities over the past 150 years [41]. Invasive species, which tend to have higher temperature sensitivity of leaf unfolding than native species, may contribute to species invasions at the community level [42]. Cleland et al. [40] synthesized data from 24 studies across 57 species and found that species more sensitive to climate warming showed increases in biomass, cover, and flower numbers. These studies highlighted the importance of the temperature sensitivity of leaf unfolding in determining how plant communities respond to global warming. Therefore, the results of sensitivity estimations can provide valuable insights for ecosystem management under future climate change scenarios. For example, in afforestation or landscaping projects, it might be beneficial to prioritize species with high phenological sensitivity, as these species would be better adapted to future climate changes.
Since temperature sensitivity was closely related to a species’ ability to adapt to future climate change, an accurate estimation of temperature sensitivity was crucial for interspecific comparison. There are usually two methods for estimating temperature sensitivity: long-term phenological observations and controlled experiments [43]. This study employed the first method to estimate the temperature sensitivity of FLD for 63 tree species in Guiyang. The results revealed that temperature sensitivity estimates were quite sensitive to the length of the time series. When the sample size reached 20 years, the standard deviation of the results from 1000 random samplings decreased to 0.32 days °C−1, and 98.8% of the estimates fell within the 95% confidence interval of ball. This suggests that when estimating temperature sensitivity in the future, longer time series should be used to achieve more stable and reliable results. Another method for estimating temperature sensitivity involves conducting controlled experiments in which plants are subjected to different temperatures. The temperature sensitivity was then determined as the ratio of phenological differences to temperature differences. However, significant differences in sensitivity estimates exist between the two methods for phenological events of the same species [6,14,43]. This discrepancy was likely due to the complex interactions of multiple environmental factors presented in long-term phenological observation data. Overall, long-term observational data can provide insights into how plants actually respond to climate variation over time, while controlled experiments offer a more direct measure of temperature sensitivity in a controlled environment. Ultimately, combining both methods could offer a more comprehensive understanding of plant responses to climate change.

5. Conclusions

This study investigated the changes in FLD and its temperature sensitivity for 63 plant species in Guiyang from 1980 to 2019. We found that the annual average temperature in Guiyang has significantly increased since 1980, with February temperature showing the greatest increase of 0.85 °C decades−1. Of the 63 species, 60 species (95.2%) have shown an earlier onset of leaf unfolding, with 12 species showing a significant advance (p < 0.05). The overall trend for FLD from 1980 to 2019 was −1.97 days decades−1, though a slight delay in leaf unfolding has occurred since 2002. During the study period, the inter-annual variation in FLD for all plants was significantly negatively correlated with the average temperature of the optimal period. The temperature sensitivity of FLD ranged from −5 to −3 days °C−1 with an overall sensitivity of −4.53 days °C−1. Sample size significantly affected the stability of temperature sensitivity estimates. To accurately compare the temperature sensitivity of FLD between species, sufficiently long time series (e.g., 20 years) are required to achieve stable estimates. These findings emphasize the importance of using long-term data for estimating temperature sensitivity and highlight how temperature increases are influencing the leaf unfolding date of species in subtropical regions.

Author Contributions

Conceptualization, Methodology, Formal analysis, Writing—Original Draft, W.H.; Validation, Data curation, L.C.; supervision, J.D. All authors have read and agreed to the published version of the manuscript.

Funding

This research was supported by the National Natural Science Foundation of China (Grant No. 42271062 and No. 42377461) and the Academic Research Projects of Beijing Union University (No. ZK20202208).

Data Availability Statement

The original contributions presented in the study are included in the article, further inquiries can be directed to the corresponding author.

Conflicts of Interest

The authors declare no conflicts of interest.

Appendix A

Table A1. Summary of plant species investigated in this study.
NumberSpeciesFamilyNumber of Observation YearsMean First Leaf DateTrends
(Days Decades−1)
Sensitivity (Days °C−1)
1Chaenomeles cathayensisRosaceae2611 February−1.68−5.91
2Chaenomeles speciosaRosaceae2812 February−1.15−6.19
3Chaenomeles sinensisRosaceae3212 February−0.88−5.48
4Malus micromalusRosaceae2317 February−0.88−3.44
5Liriodendron chinenseMagnoliaceae2317 February2.03−2.83
6Salix babylonicaSalicaceae3019 February−0.81−4.75
7Pyracantha fortuneanaRosaceae2723 February−2.60−5.31
8Forsythia viridissimaOleaceae2825 February−2.68−4.11
9Zanthoxylum simulansRutaceae2625 February−0.14−3.74
10Eriobotrya japonicaRosaceae2525 February−3.49−4.72
11Swida paucinervisCornaceae313 March−1.86−5.45
12Armeniaca vulgarisRosaceae305 March−1.61−5.01
13Distylium dunnianumHamamelidaceae265 March−3.43−3.78
14Ilex fargesiivar.angustifoliaAquifoliaceae265 March−2.86−4.58
15Cerasus subhirtellaRosaceae306 March−2.28−4.50
16Acanthopanax trifoliatusAraliaceae296 March−4.64−4.78
17Pterocarya stenopteraJuglandaceae328 March−1.50−2.83
18Prunus salicinaRosaceae2110 March−2.18−5.49
19Caesalpinia decapetalaLeguminosae2911 March−4.53−5.02
20Cercis chinensisLeguminosae3112 March−1.70−3.86
21Camellia oleiferaTheaceae3012 March−3.32−5.17
22Pyrus pyrifoliaRosaceae2113 March−6.50−4.37
23Fraxinus chinensisOleaceae3013 March−2.49−3.92
24Hibiscus syriacusMalvaceae2713 March−3.87−4.95
25Ulmus pumilaUlmaceae3014 March−0.77−3.44
26Populus yunnanensisSalicaceae2915 March−2.98−3.99
27Cedrus deodaraPinaceae3115 March−4.08−4.62
28Populus adenopodaSalicaceae2516 March−1.58−3.55
29Nerium indicumApocynaceae2616 March−1.06−5.01
30Serissa japonicaRubiaceae2716 March−1.13−4.69
31Prunus persicaRosaceae2416 March−0.06−2.18
32Salix chaenomeloidesSalicaceae3017 March−3.18−4.40
33Quercus acutissimaFagaceae3017 March−0.51−3.83
34Cinnamomum camphoraLauraceae2917 March−3.11−5.03
35Metasequoia glyptostroboidesCupressaceae 3218 March−2.98−4.04
36Cinnamomum bodinieriLauraceae3219 March−2.53−3.85
37Pistacia chinensisAnacardiaceae 2719 March−0.05−4.83
38Camptotheca acuminataNyssaceae3220 March−1.86−5.14
39Hibiscus mutabilisMalvaceae2920 March−5.74−6.79
40Celtis sinensisCannabaceae3120 March−3.18−5.26
41Catalpa bungeiBignoniaceae3121 March−2.88−6.29
42Lindera communisLauraceae3122 March−2.21−3.87
43Punica granatumPunicaceae3222 March−2.66−5.83
44Platanus acerifoliaPlatanaceae1623 March−2.85−3.34
45Robinia pseudoacaciaLeguminosae3223 March−1.55−4.40
46Gleditsia sinensisLeguminosae3123 March−0.72−3.65
47Alangium chinenseAlangiaceae2723 March−1.53−3.82
48Ginkgo bilobaGinkgoaceae3023 March−0.98−2.95
49Juniperus chinensisCupressaceae2624 March1.55−4.33
50Cerasus yedoensisRosaceae3125 March−1.01−4.06
51Broussonetia papyiferaMoraceae3125 March−0.95−4.99
52Clerodendrum trichotomumVerbenaceae3227 March−1.89−4.09
53Wisteria sinensisLeguminosae2628 March−2.36−4.55
54Ligustrum lucidumOleaceae3128 March−0.27−4.11
55Sophora japonicaLeguminosae3129 March0.96−4.05
56Melia azedarachMeliaceae 2130 March−5.11−6.19
57Hovenia acerbaRhamnaceae2530 March−4.09−5.13
58Lagerstroemia indicaLythraceae3131 March−2.02−4.52
59Sapium sebiferumEuphorbiaceae291 April−2.29−5.25
60Catalpa ovataBignoniaceae312 April−1.33−4.41
61Firmiana simplesSterculiaceae324 April−1.69−4.19
62ZiziphusjujubaRhamnaceae316 April−0.42−4.38
63Pinus massonianaPinaceae3012 April−4.11−5.70

Appendix B

Figure A1. Number of species observed in each year.
Forests 16 00300 g0a1

References

  1. Lambert, F. Why the timing of climate assessments matters. Nature 2024, 634, 9. [Google Scholar] [CrossRef] [PubMed]
  2. Masson-Delmotte, V.P.; Zhai, A.; Pirani, S.L.; Connors, C.; Péan, S.; Berger, N.; Caud, Y.; Chen, L.; Goldfarb, M.I.; Gomis, M.; et al. (Eds.) IPCC, 2021: Climate Change 2021: The Physical Science Basis. Contribution of Working Group I to the Sixth Assessment Report of the Intergovernmental Panel on Climate Change; Cambridge University Press: Cambridge, UK; New York, NY, USA, 2023. [Google Scholar] [CrossRef]
  3. Menzel, A.; Yuan, Y.; Matiu, M.; Sparks, T.; Scheifinger, H. Climate change fingerprints in recent European plant phenology. Glob. Change Biol. 2020, 26, 2599–2612. [Google Scholar] [CrossRef]
  4. Piao, S.; Wang, X.; Park, T.; Chen, C.; Lian, X. Characteristics, drivers and feedbacks of global greening. Nat. Rev. Earth Environ. 2019, 1, 14–27. [Google Scholar] [CrossRef]
  5. Fu, Y.H.; Piao, S.; Vitasse, Y.; Zhao, H. Increased heat requirement for leaf flushing delays spring phenology. Glob. Chang. Biol. 2015, 21, 2687–2697. [Google Scholar] [CrossRef] [PubMed]
  6. Guralnick, R.; Crimmins, T.; Grady, E.; Campbell, L. Phenological response to climatic change depends on spring warming velocity. Commun. Earth Environ. 2024, 5, 634. [Google Scholar] [CrossRef]
  7. Sun, M.; Li, P.; Sun, M.; Li, P.; Zhang, C.; Zhou, X.; Peng, C. Divergent response of vegetation phenology to extreme temperatures and precipitation of different intensities on the Tibetan Plateau. Sci. China Earth Sci. 2023, 66, 2200–2210. [Google Scholar] [CrossRef]
  8. Yu, H.; Wang, L.; Yang, Z.; Guo, L. Divergent response of leaf unfolding to climate warming in subtropical and temperate zones. Agric. For. Meteorol. 2023, 15, 103625. [Google Scholar] [CrossRef]
  9. Cao, L.; Lin, S.; Liu, W.; Gao, C.; Bai, W.; Zhu, M.; Hao, Y.; Hao, X.; Dai, J. Shifts in Plant Phenology and Its Responses to Climate Warming in Three Temperate Cities of China during 1963–2020. Forests 2024, 15, 1712. [Google Scholar] [CrossRef]
  10. Richardson, A.D.; Hufkens, K.; Milliman, T.; Aubrecht, D.M.; Chen, M. Tracking vegetation phenology across diverse North American biomes using PhenoCam imagery. Sci. Data 2018, 5, 180028. [Google Scholar] [CrossRef] [PubMed]
  11. Ramirez-Parada, T.H.; Park, I.W.; Record, S.; Davis, C.C.; Ellison, A.M.; Mazer, S.J. Plasticity and not adaptation is the primary source of temperature-mediated variation in flowering phenology in North America. Nat. Ecol. Evol. 2024, 8, 467–476. [Google Scholar] [CrossRef] [PubMed]
  12. Zhou, L.; Zhou, W.; Chen, J.; Xu, X.; Wang, Y.; Zhuang, J.; Chi, Y. Land surface phenology detections from multi-source remote sensing indices capturing canopy photosynthesis phenology across major land cover types in the Northern Hemisphere. Ecol. Indic. 2022, 135, 108579. [Google Scholar] [CrossRef]
  13. Zhang, J.; Zhao, J.; Wang, Y.; Zhang, H.; Zhang, Z.; Guo, X. Comparison of land surface phenology in the Northern Hemisphere based on AVHRR GIMMS3g and MODIS datasets. ISPRS J. Photogramm. Remote Sens. 2020, 169, 1–16. [Google Scholar] [CrossRef]
  14. Wang, Q.; Chen, H.; Xu, F.; Bento, V.A.; Zhang, R.; Wu, X.; Guo, P. Understanding vegetation phenology responses to easily ignored climate factors in China’s mid-high latitudes. Sci. Rep. 2024, 14, 8773. [Google Scholar] [CrossRef] [PubMed]
  15. Wang, H.; Bai, W.; Hu, Z.; Lin, S.; Ge, Q. Effectiveness of freezing temperatures on dormancy release of temperate woody species. Ann. Bot. 2024, 134, 615–630. [Google Scholar] [CrossRef] [PubMed]
  16. Wang, H.; Dai, J.; Peñuelas, J.; Ge, Q.; Fu, Y.; Wu, C. Winter warming offsets one half of the spring warming effects on leaf unfolding. Glob. Chang. Biol. 2022, 28, 6033–6049. [Google Scholar] [CrossRef] [PubMed]
  17. Bai, W.; Wang, H.; Lin, S. Magnitude and direction of green-up date in response to drought depend on background climate over Mongolian grassland. Sci. Total Environ. 2023, 902, 166051. [Google Scholar] [CrossRef] [PubMed]
  18. Bock, A.; Sparks, T.H.; Estrella, N.; Jee, N.; Casebow, A.; Schunk, C.; Leuchner, M.; Menzel, A. Changes in first flowering dates and flowering duration of 232 plant species on the island of Guernsey. Glob. Chang. Biol. 2014, 20, 3508–3519. [Google Scholar] [CrossRef]
  19. Gonsamo, A.; Chen, J.M.; Wu, C. Citizen science: Linking the recent rapid advances of plant flowering in Canada with climate variability. Sci. Rep. 2013, 3, 2239. [Google Scholar] [CrossRef]
  20. Menzel, A.; Sparks, T.H.; Estrella, N.; Koch, E.; Aasa, A.; Ahas, R.; Alm-Kübler, K.; Bissolli, P.; Braslavsk, O.; Briede, A.; et al. European phenological response to climate change matches the warming pattern. Glob. Change Biol. 2006, 12, 1969–1976. [Google Scholar] [CrossRef]
  21. Dai, J.; Wang, H.; Ge, Q. Multiple phenological responses to climate change among 42 plant species in Xi’an, China. Int. J. Biometeorol. 2013, 57, 749–758. [Google Scholar] [CrossRef] [PubMed]
  22. Liu, Q.; Piao, S.; Fu, Y.H.; Gao, M.; Peñuelas, J.; Janssens, I.A. Climatic Warming Increases Spatial Synchrony in Spring Vegetation Phenology Across the Northern Hemisphere. Geophys. Res. Lett. 2019, 46, 1641–1650. [Google Scholar] [CrossRef]
  23. Peñuelas, J.; Rutishauser, T.; Filella, I. Phenology Feedbacks on Climate Change. Science 2009, 324, 887–888. [Google Scholar] [CrossRef]
  24. Tang, Y.; Zhou, W.; Du, Y. Effects of Temperature, Precipitation, and CO2 on Plant Phenology in China: A Circular Regression Approach. Forests 2023, 14, 1844. [Google Scholar] [CrossRef]
  25. Bigler, C.; Vitasse, Y. Daily Maximum Temperatures Induce Lagged Effects on Leaf Unfolding in Temperate Woody Species Across Large Elevational Gradients. Front. Plant Sci. 2019, 10, 398. [Google Scholar] [CrossRef] [PubMed]
  26. Xu, Y.; Ge, Q.; Dai, J.; Wang, H. Variations in temperature sensitivity of leaf unfolding date and their influencing factors for typical woody plants in China over the past 50 years. Acta Ecol. Sin. 2019, 39, 8135–8143. [Google Scholar]
  27. Wang, H.; Gao, C.; Ge, Q. Low temperature and short daylength interact to affect the leaf senescence of two temperate tree species. Tree Physiol. 2022, 42, 2252–2265. [Google Scholar] [CrossRef] [PubMed]
  28. Xu, Y.; Dai, J.; Ge, Q.; Wang, H.; Tao, Z. Comparison of chilling and heat requirements for leaf unfolding in deciduous woody species in temperate and subtropical China. Int. J. Biometeorol. 2021, 65, 393–403. [Google Scholar] [CrossRef]
  29. Atsuko, M.-K.; Han, Q.; Keiko, K.; Akiko, S. Impacts of climate change on the transcriptional dynamics and timing of bud dormancy release in Yoshino-cherry tree. New Phytol. 2024, 6, 1505–1521. [Google Scholar]
  30. Hsu, H.-W.; Yun, K.; Kim, S.-H. Variable warming effects on flowering phenology of cherry trees across a latitudinal gradient in Japan. Agric. For. Meteorol. 2023, 339, 109571. [Google Scholar] [CrossRef]
  31. Kim, J.; Jeong, S.; Park, C.-E.; Park, H.; Son, S.; Kim, S.Y. Regional and Species Variations in Spring and Autumn Phenology of 25 Temperate Species in South Korea. Asia-Pac. J. Atmos. Sci. 2022, 58, 181–195. [Google Scholar] [CrossRef]
  32. Wittich, K.; Liedtke, M. Shifts in plant phenology: A look at the sensitivity of seasonal phenophases to temperature in Germany. Int. J. Climatol. 2015, 35, 3991–4000. [Google Scholar] [CrossRef]
  33. Munson, S.M.; Long, A.L. Climate drives shifts in grass reproductive phenology across the western USA. New Phytol. 2017, 213, 1945–1955. [Google Scholar] [CrossRef]
  34. Wan, M.; Liu, X. Zhong Guo Wu Hou Guan Ce Fang Fa[M]; Science Press: Beijing, China, 1979. [Google Scholar]
  35. Bolmgren, K.; Vanhoenacker, D.; Miller-Rushing, A.J. One man, 73 years, and 25 species. Evaluating phenological responses using a lifelong study of first flowering dates. Int. J. Biometeorol. 2013, 57, 367–375. [Google Scholar] [CrossRef]
  36. Ge, Q.; Wang, H.; Rutishauser, T.; Dai, J. Phenological response to climate change in China: A meta-analysis. Glob. Change Biol. 2015, 21, 265–274. [Google Scholar] [CrossRef]
  37. Lu, C.; van Groenigen, K.J.; Gillespie MA, K.; Hollister, R.D.; Post, E.; Cooper, E.J.; Welker, J.M.; Huang, Y.; Min, X.; Chen, J.; et al. Diminishing warming effects on plant phenology over time. New Phytol. 2024, 245, 523–533. [Google Scholar] [CrossRef]
  38. Rosenzweig, C.; Karoly, D.; Vicarelli, M.; Neofotis, P.; Wu, Q.; Casassa, G.; Menzel, A.; Root, T.L.; Estrella, N.; Seguin, B.; et al. Attributing physical and biological impacts to anthropogenic climate change. Nature 2008, 453, 353–357. [Google Scholar] [CrossRef] [PubMed]
  39. Ge, Q.; Wang, H.; Zheng, J.; This, R.; Dai, J. A 170 year spring phenology index of plants in eastern China. J. Geophys. Res. Biogeosci. 2014, 119, 301–311. [Google Scholar] [CrossRef]
  40. Cleland, E.E.; Allen, J.M.; Crimmins, T.M.; Dunne, J.A.; Pau, S.; Travers, S.E.; Zavaleta, E.S.; Wolkovich, E.M. Phenological tracking enables positive species responses to climate change. Ecology 2012, 93, 1765–1771. [Google Scholar] [CrossRef]
  41. Willis, C.G.; Ruhfel, B.; Primack, R.B.; Miller-Rushing, A.J.; Davis, C.C. Phylogenetic patterns of species loss in Thoreau’s woods are driven by climate change. Proc. Natl. Acad. Sci. USA 2008, 105, 17029–17033. [Google Scholar] [CrossRef]
  42. Willis, C.G.; Ruhfel, B.R.; Primack, R.B.; Miller-Rushing, A.J.; Losos, J.B.; Davis, C.C. Favorable Climate Change Response Explains Non-Native Species’ Success in Thoreau’s Woods. PLoS ONE 2010, 5, e8878. [Google Scholar] [CrossRef]
  43. Wolkovich, E.M.; Cook, B.I.; Allen, J.M.; Crimmins, T.M.; Betancourt, J.L.; Travers, S.E.; Pau, S.; Regetz, J.; Davies, T.J.; Kraft, N.J.B.; et al. Warming experiments underpredict plant phenological responses to climate change. Nature 2012, 485, 494–497. [Google Scholar] [CrossRef] [PubMed]
Figure 1. Climate conditions in Guiyang during 1980–2019.
Forests 16 00300 g001
Figure 2. Temperature changes in Guiyang from 1980 to 2019. (a) Linear trends in monthly temperature (the slope of linear regression of monthly temperature against year). *: the linear trend was significant at p < 0.05; (b) Trends in annual temperature.
Forests 16 00300 g002
Figure 3. Temporal trends and standard deviation of first leaf date (FLD) for 60 woody plants in Guiyang during the 1980–2019 period. (a) Standard deviation of FLD. (b) Linear trends in FLD (i.e., the slope of linear regression of FLD against year). (c) Time series of median FLD anomalies for all species.
Forests 16 00300 g003
Figure 4. Temporal trends in time series of median first leaf date (FLD) anomalies during different periods. The x-axis represents the start year and the y-axis represents the end year.
Forests 16 00300 g004
Figure 5. Temperature sensitivity of first leaf date (FLD) for 63 plant species in Guiyang. (a) Optimal period (OP) in which temperature influences the FLD most markedly. (b) Sensitivity of FLD to OP temperature (i.e., the slope of linear regression of FLD against OP temperature). The horizontal black line represents sensitivity = 0. (c) Relationship between median FLD anomalies and median OP temperature anomalies for all species.
Forests 16 00300 g005
Figure 6. The impact of sample size on estimates of temperature sensitivity of first leaf date (FLD). (a) Standard deviation of temperature sensitivity; (b) Probability of temperature sensitivity falling within the 95% confidence interval of ball. ball is the estimated temperature sensitivity based on data from all observed years.
Forests 16 00300 g006
Disclaimer/Publisher’s Note: The statements, opinions and data contained in all publications are solely those of the individual author(s) and contributor(s) and not of MDPI and/or the editor(s). MDPI and/or the editor(s) disclaim responsibility for any injury to people or property resulting from any ideas, methods, instructions or products referred to in the content.

