
A Novel Approach for the Counting of Wood Logs Using cGANs and Image Processing Techniques
 , , , , ,
  and
and
Abstract
1. Introduction
- How can automated wood log counting systems be designed to overcome inefficiencies, inaccuracies, and safety challenges associated with manual methods?
- How effective is the cGAN framework in addressing the specific segmentation and counting challenges presented by wood logs, a context often underexplored in the literature?
- What are the limitations of combining deep neural networks and mathematical morphology for object segmentation and counting?
- A novel dataset of wood logs captured by the authors of this work;
- An approach to the automation of wood_log counting, which is still not yet properly explored in the literature;
- A novel methodology from the algorithmic standpoint, where we combined existing techniques and approaches from machine learning and image processing to generate our final result.
2. Materials and Methods
- Light intensity and light-related characteristics;
- Capture angle and displacements of the logs;
- Distance from the object;
- Natural variation in the color of tree logs;
- Images containing extra details that present challenges during segmentation, such as leaf overlapping, branches, and barks.
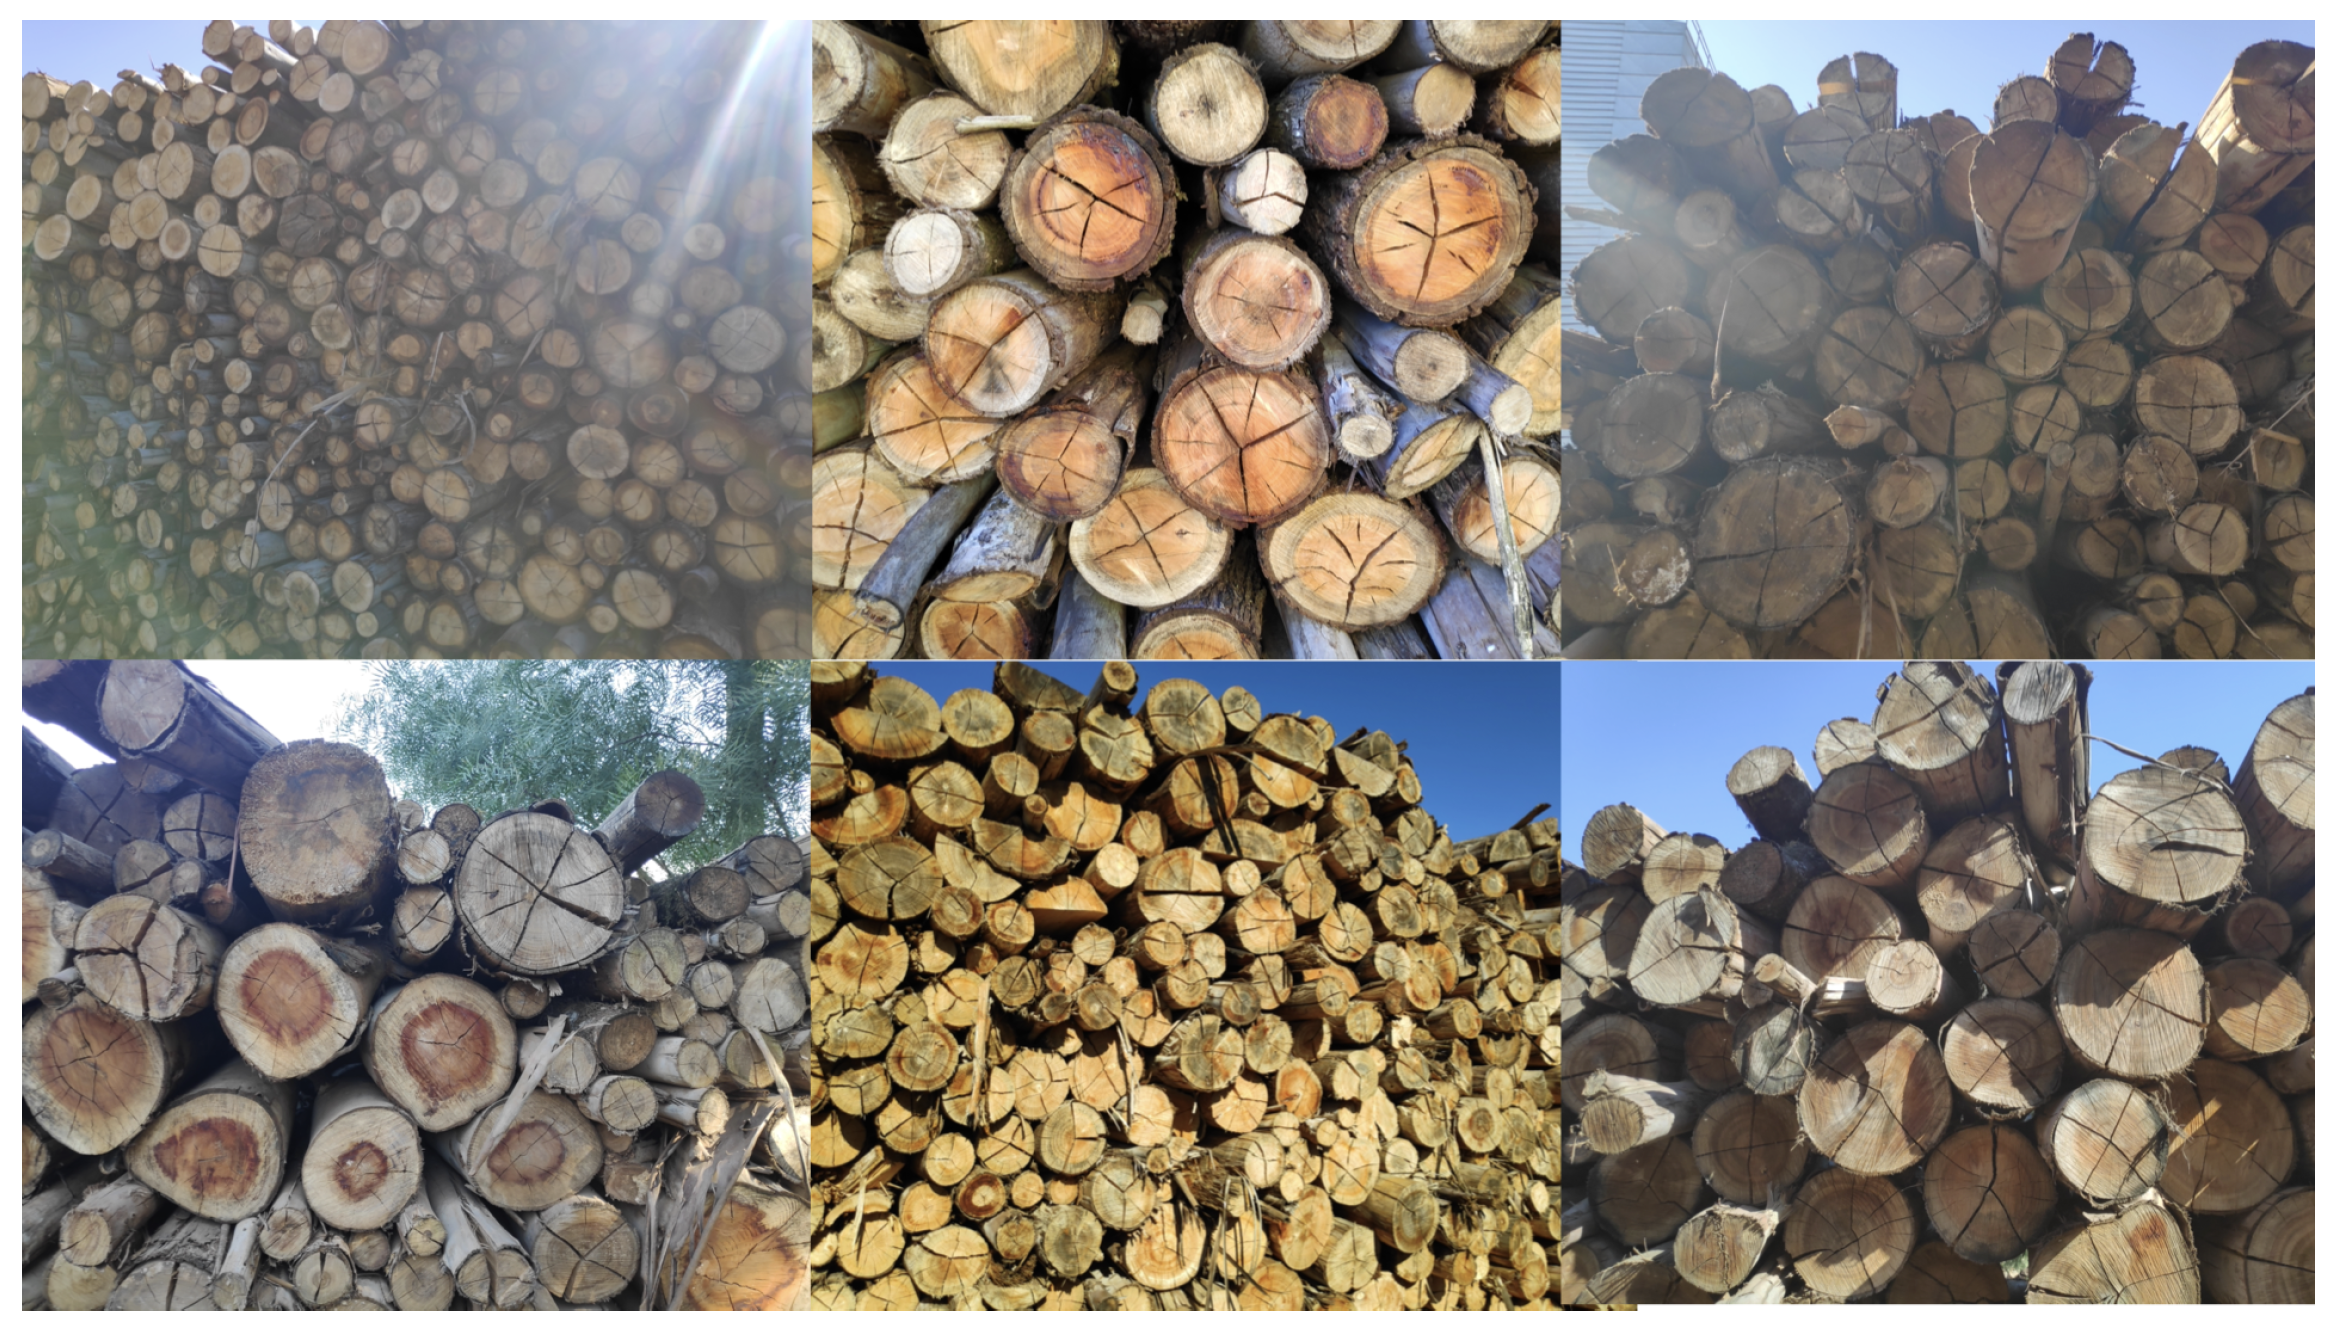
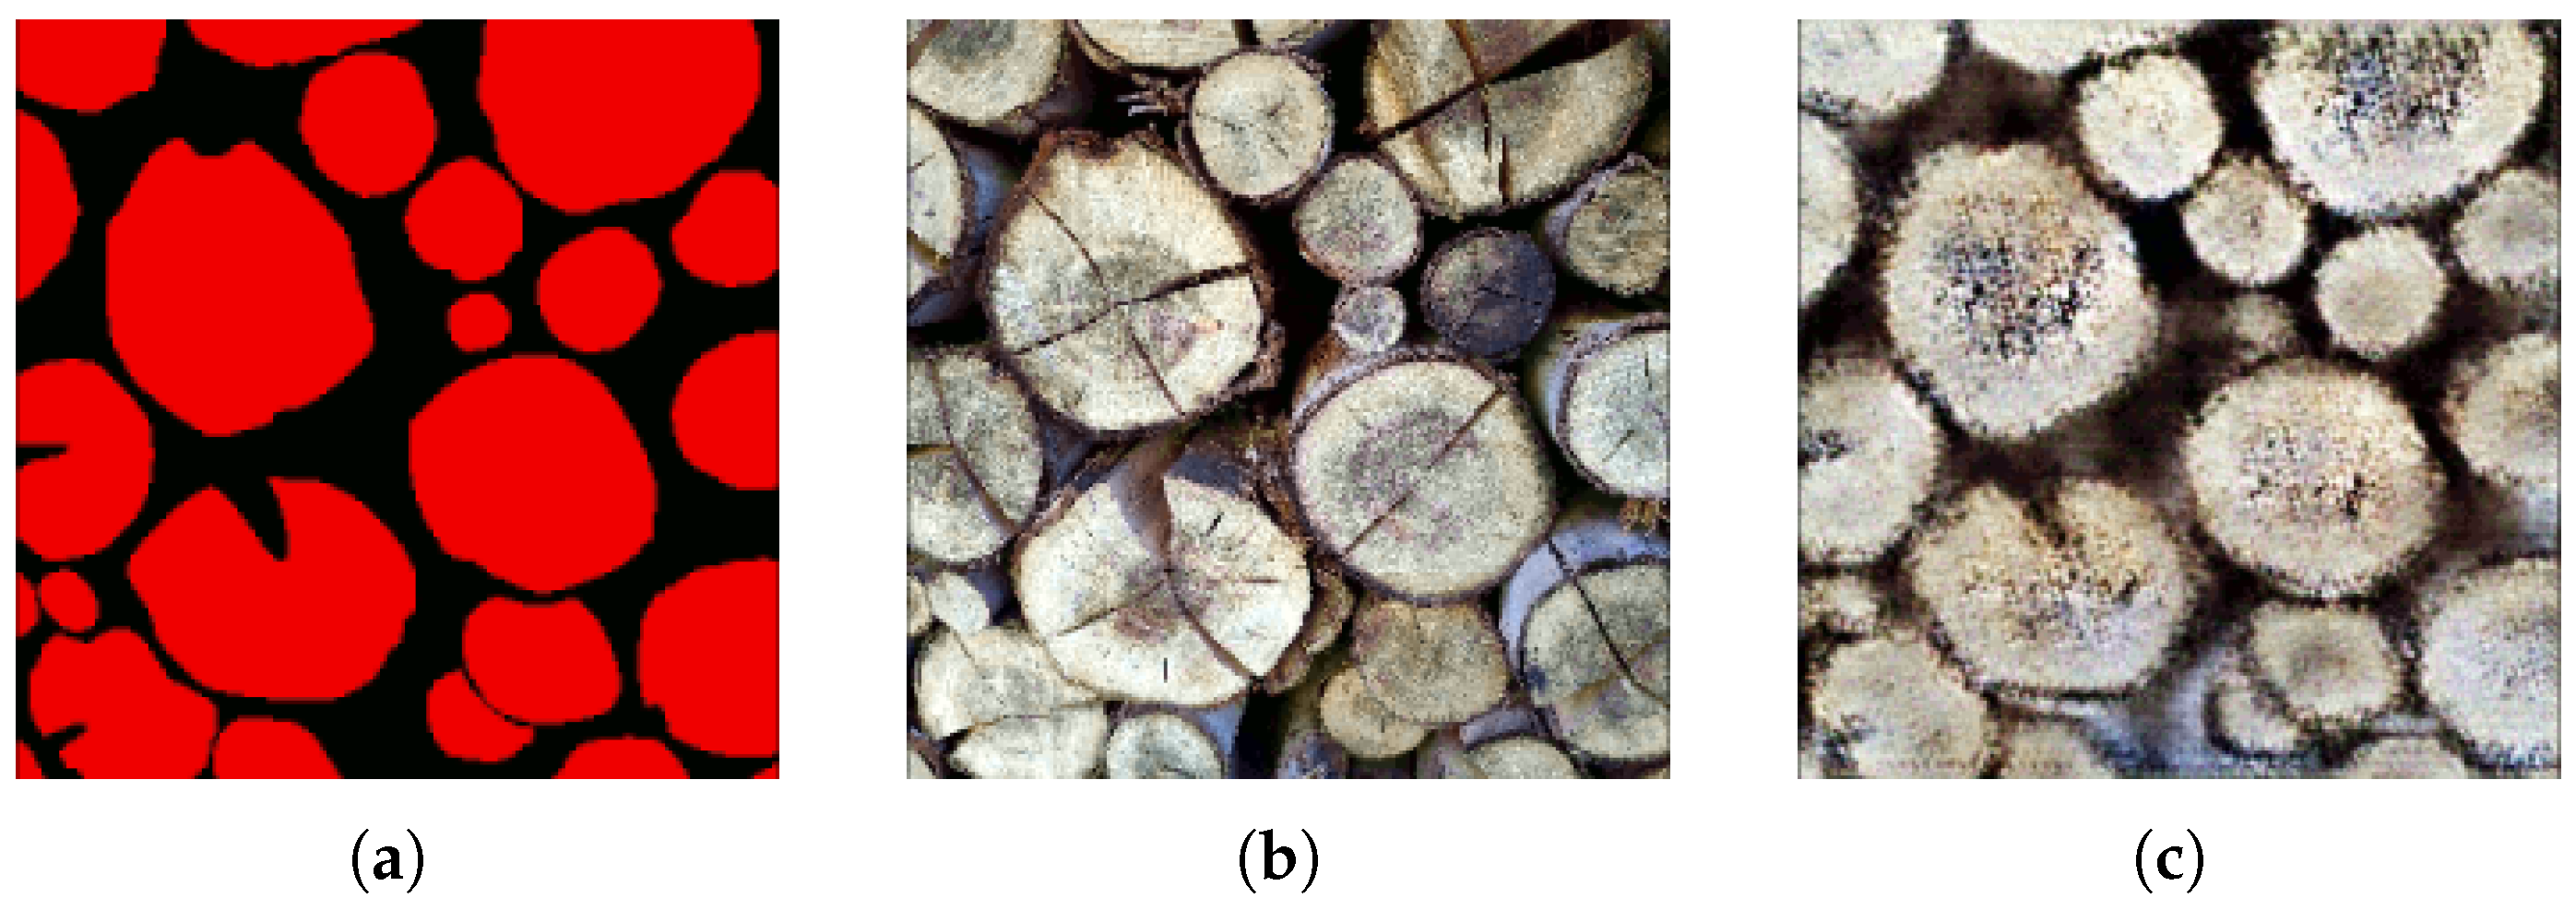
- A total of 167 images were captured from a close frame, a narrower field of view, keeping the number of woods close to 25. The capturing of the images was carried out in favor of the sun or with the sun on the right side, that is, without great variation in lighting and beams of light. However, the presence of shadows is notable due to the variation in the depth of the wood logs due to the positioning of the sun. In these images, the main characteristics that present a challenge to the identification model are the variation in size, face coloration, difference in depth between wood logs, angle of capture, and overlapping of wood logs. Figure 1 presents an example of close-frame images displayed in the second row.Despite the relatively simple nature of these images, several factors introduce challenges to the segmentation and identification of individual wood logs. The overlap between logs often obscures portions of their structure, making it difficult to clearly distinguish their shapes. Additionally, the variation in heartwood color can lead to visual confusion during the object segmentation process. While not predominant, the intricate texture of the bark, coupled with differences in size and shape, adds further complexity to automatic detection. Irregular lighting within the stack, resulting in alternating dark and bright areas, poses additional obstacles. Lastly, debris and foliage present between the logs introduce extraneous elements that can negatively impact detection accuracy.
- A total of 317 images were obtained from an open frame, a wider field of view. Some samples contain hundreds of logs, while others have intense beams of light and a significant presence of overlapping leaves and branches. Due to these specific characteristics, those images were not utilized for statistical analysis in this study, but they hold potential for further exploration in future research.
- Object positioning: the precise placement of the object within the frame can vary in terms of scale, orientation, and overall positioning. The angles of acquisition also play a major role at this point, which can be difficult to overcome depending on the chosen technique.
- Occlusion: we have to deal with different degrees of occlusion. It occurs when parts of the object are hidden or obscured by overlapping elements within the frame, such as other objects or other wood logs. Some occlusions are also generated by the angle of acquisition of the images.
- Light conditions: variations in daylight and sky conditions, including changes in brightness, shadow presence, and overall illumination, can significantly affect the object appearance in the photo. These conditions also influence contrast and color temperature throughout the day, contributing to potential image artifacts such as lens flares.
- Set of Object Pixels:which represents the set of all pixels that belong to wooden logs.
- Set of Connected Components:where each connected component contains all pixels in P that are spatially adjacent and belong to the same cluster.
- Accuracy: It is the most intuitive form of evaluation. The numerator consists of the sum of all true classifications, whether they are positive or negative, and the denominator consists of the sum of all classifications as follows:where
- (True Positive): number of pixels correctly classified as positive;
- (True Negative): number of pixels correctly classified as negative;
- (False Positive): number of pixels incorrectly classified as positive;
- (False Negative): number of pixels incorrectly classified as negative.
- F1 Score: Calculated using precision and recall, as follows:
- Kappa: It is a measure commonly used to check the consistency of segmentation, as follows:where
- (proportion of observed agreement) is the ratio of actual agreements to the total number of evaluations;
- (proportion of expected agreement) is the proportion of agreement that would be expected by chance.
- Intersection over Union (IoU): It is the ratio between the intersection and union of the ground truth set and the segmentation set to be evaluated. Also known as the Jaccard Index, it measures the overlap between the areas segmented by the model and the actual areas.
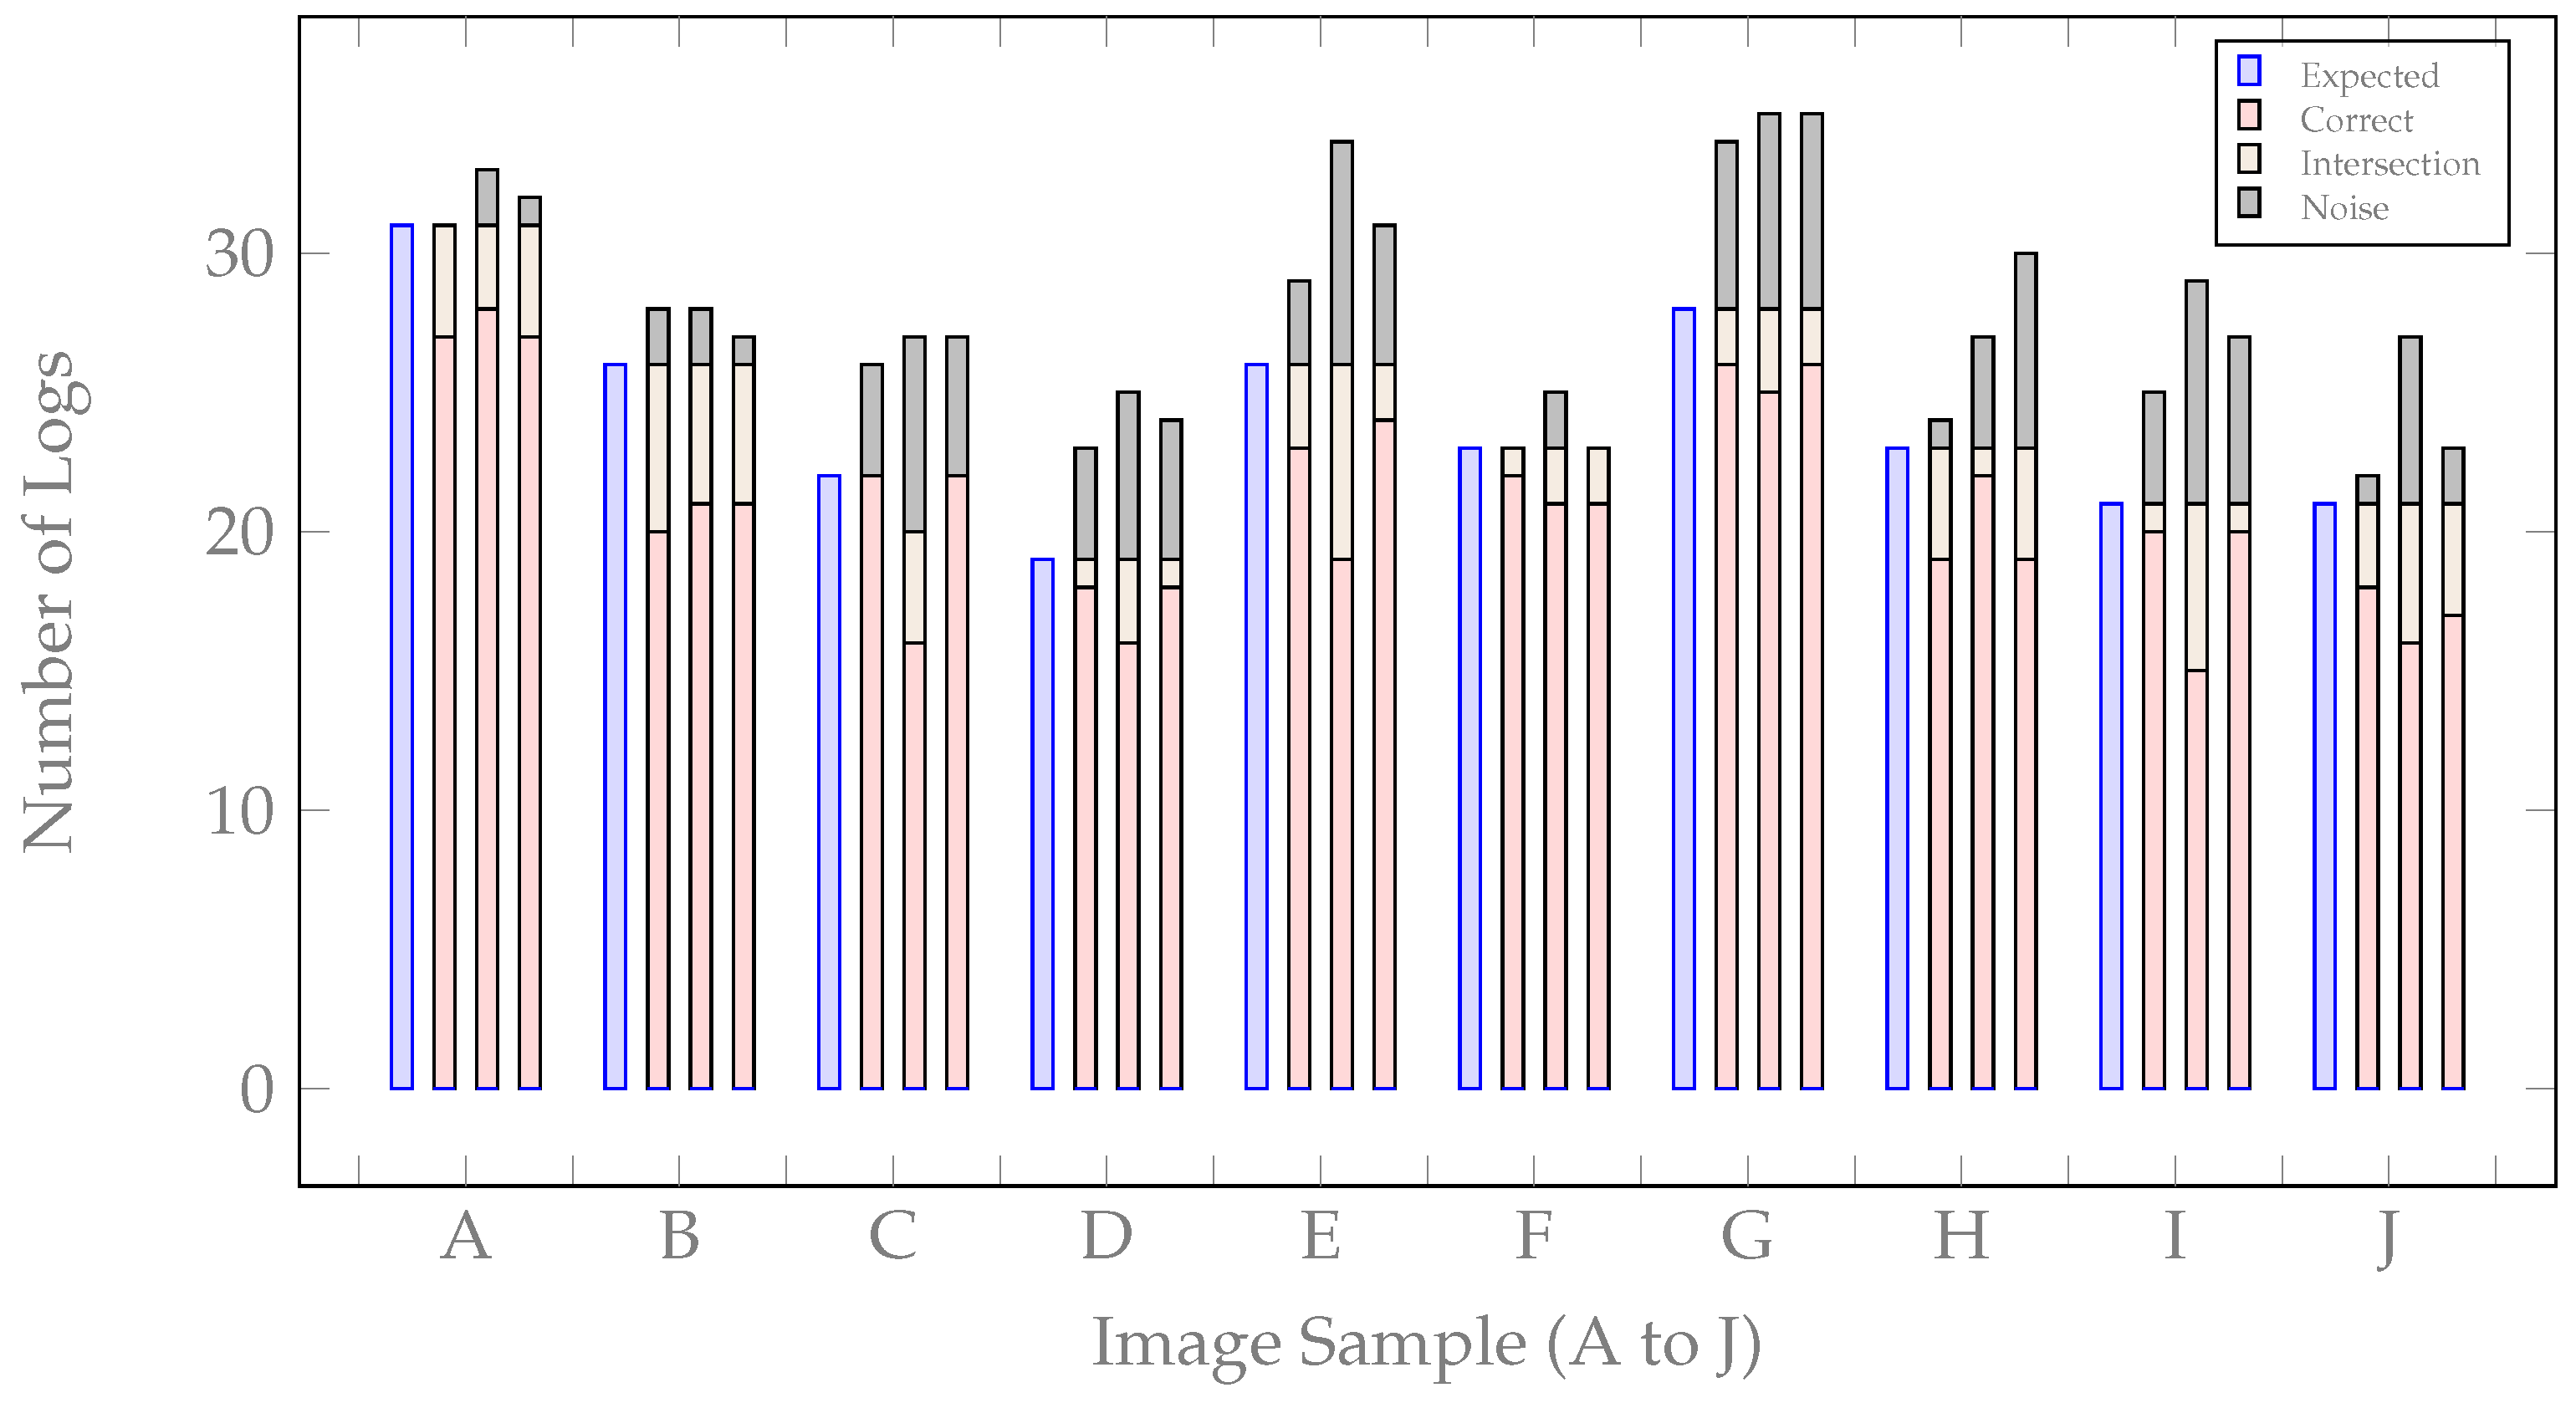
- represents the number of logs that are correctly identified (True Positive);
- E represents the number of non-identified logs (False Negative);
- I represents the number of logs classified as intersections;
- N represents the number of noises classified as logs (False Positive).
3. Results
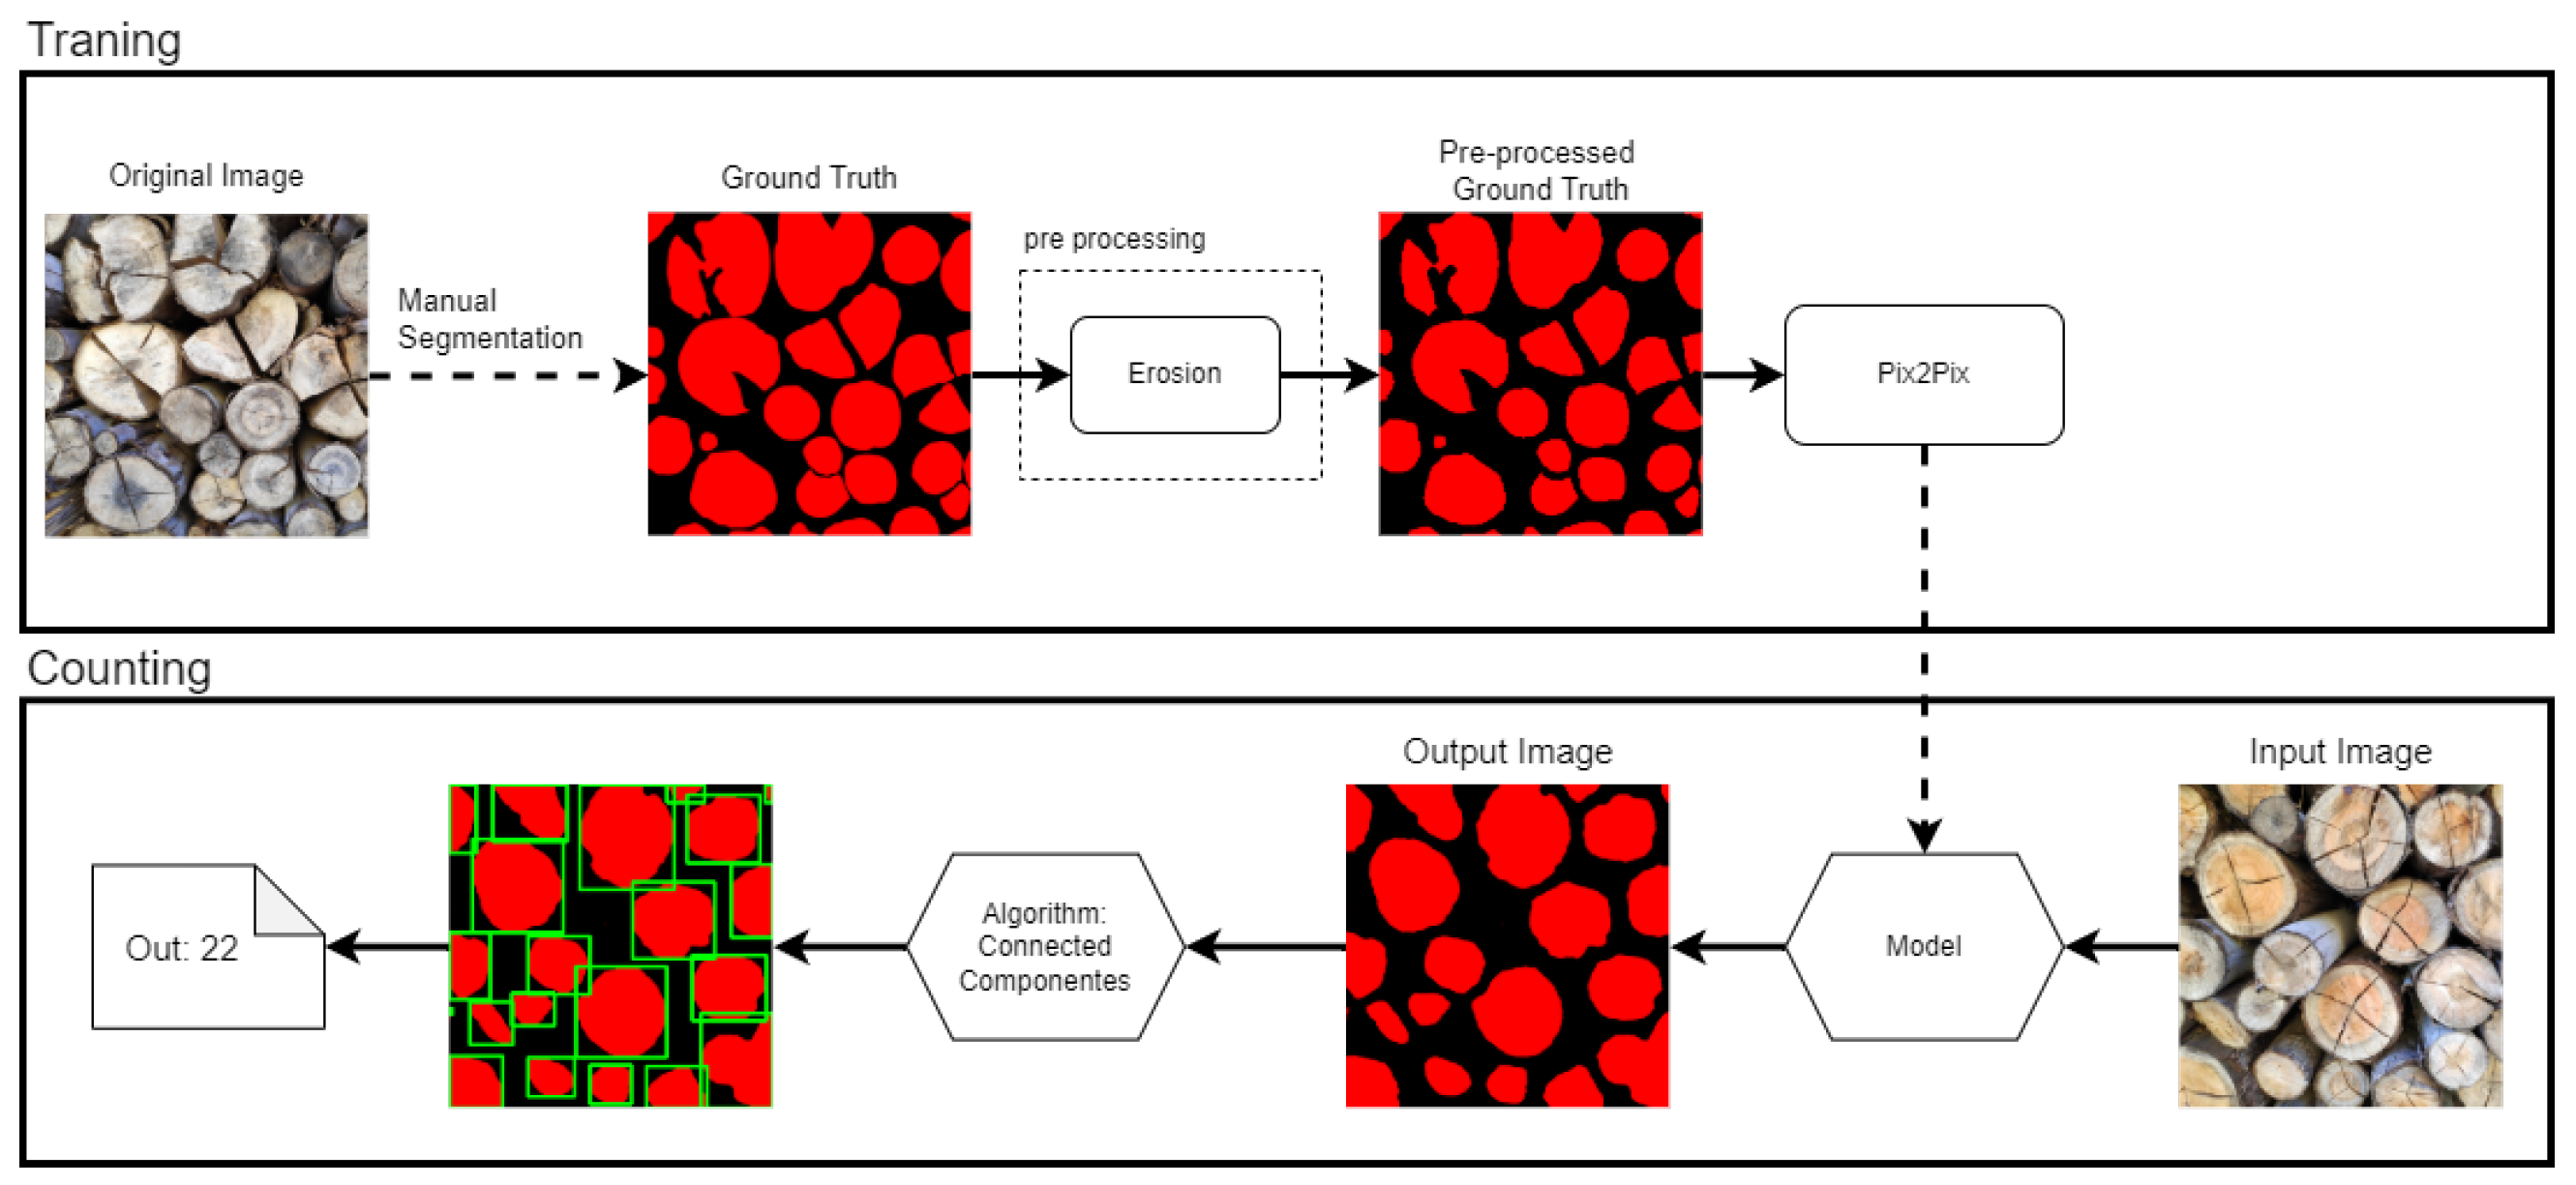
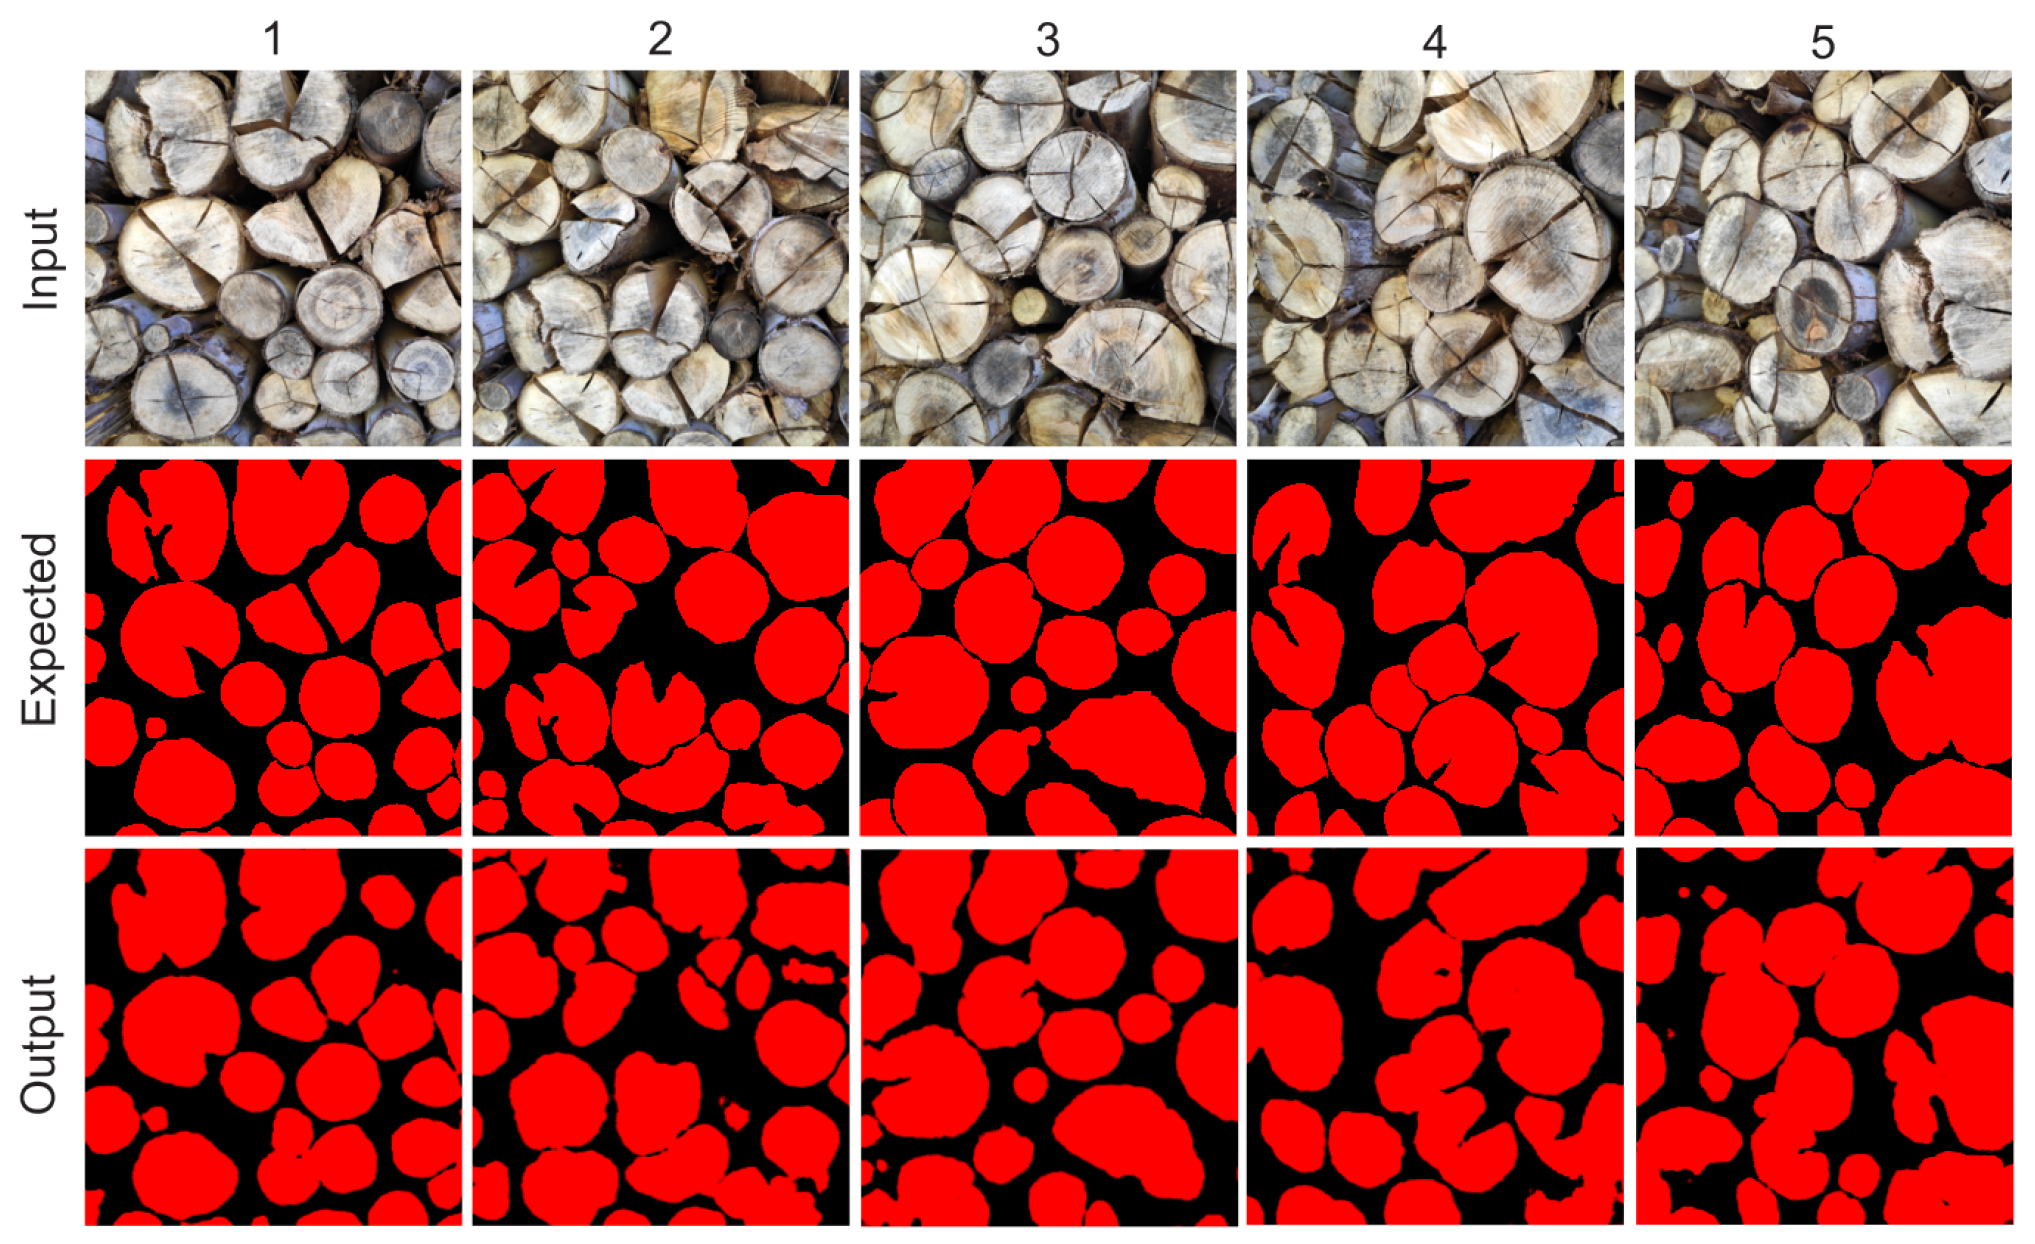
3.1. Segmentation
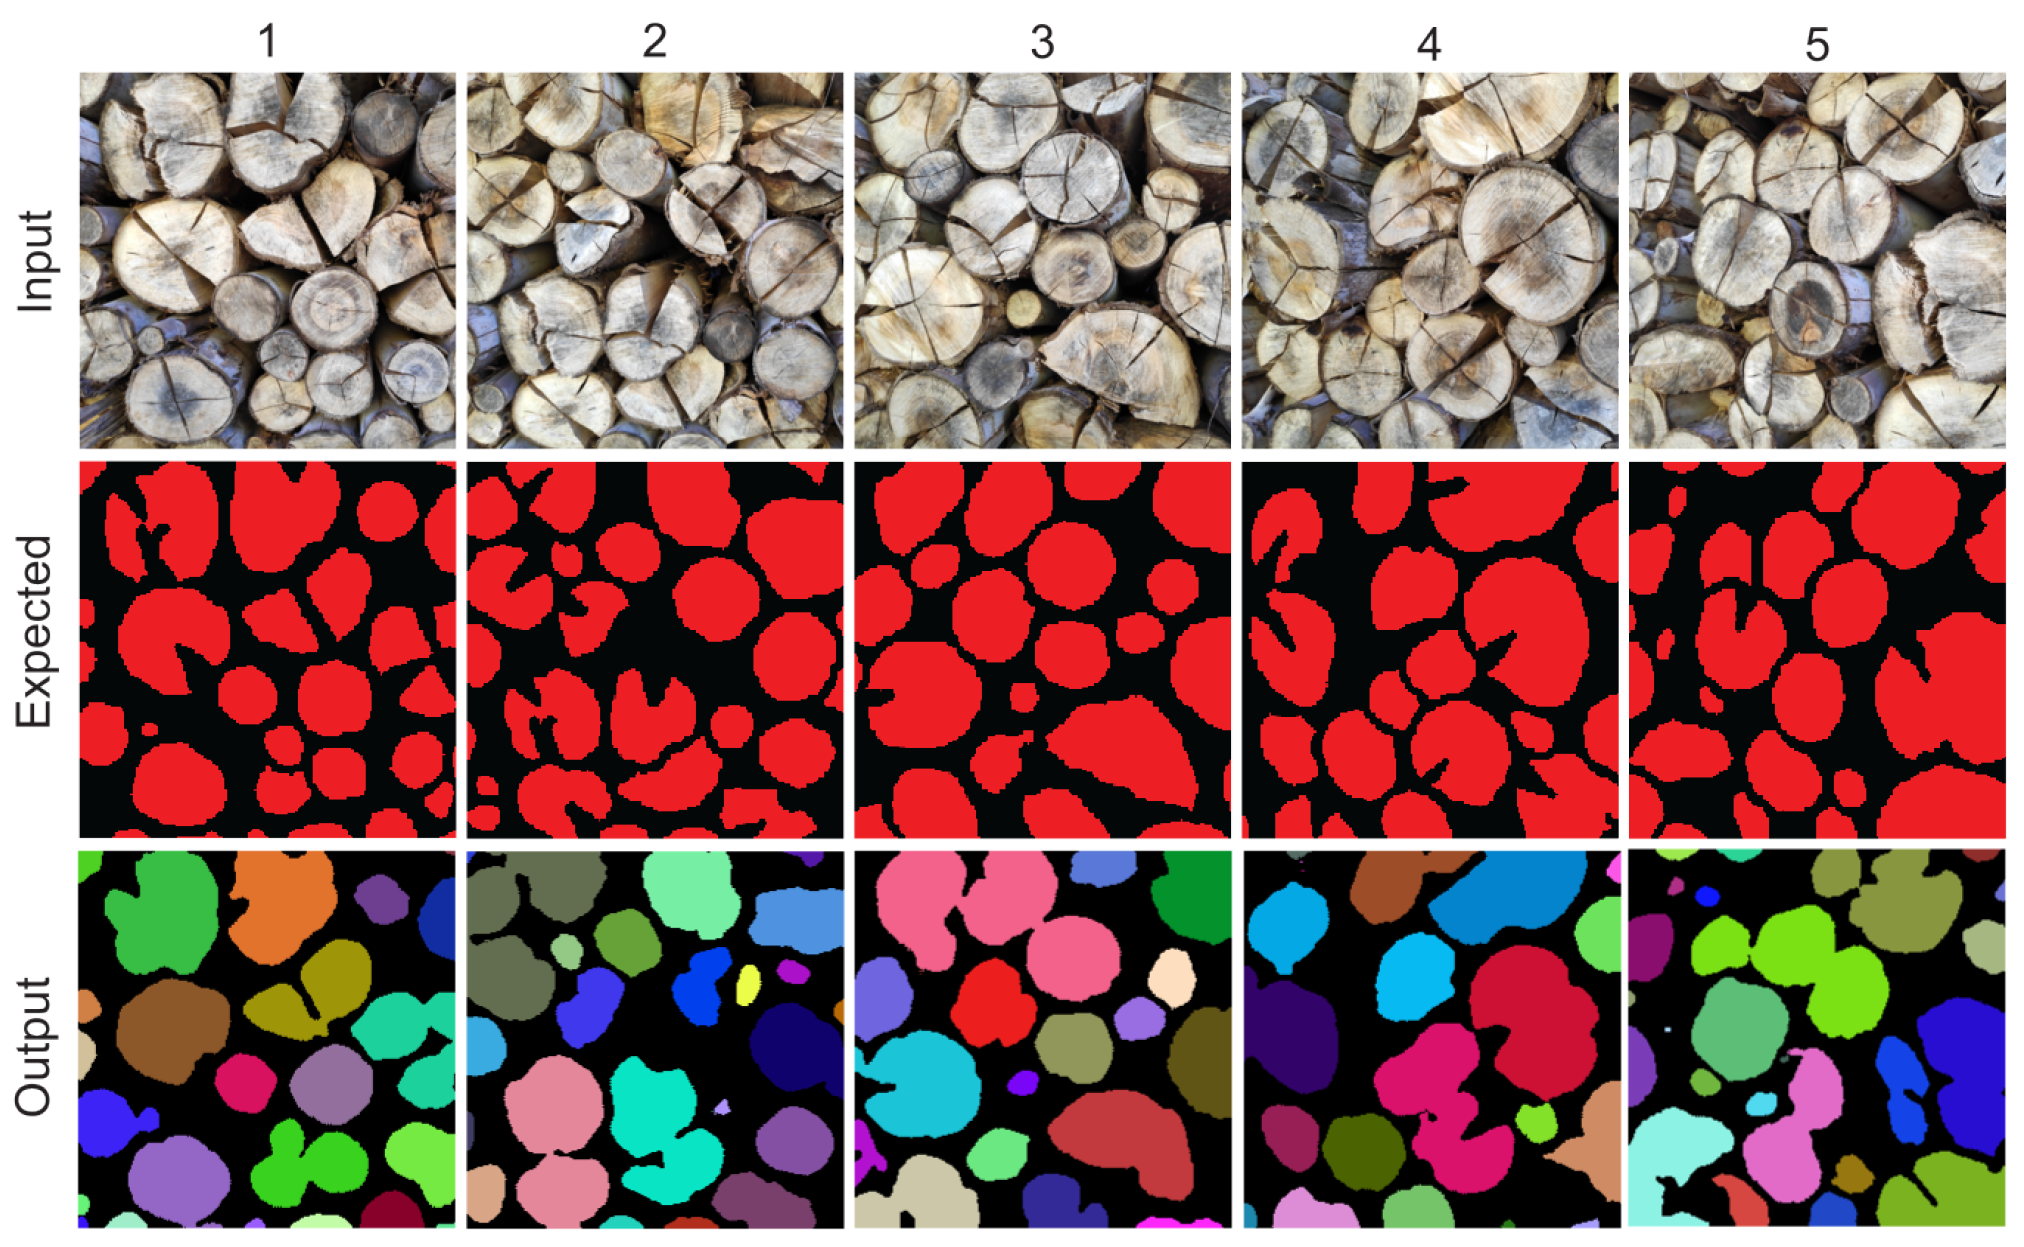
3.2. Counting
4. Discussion
5. Future Research
6. Conclusions
Author Contributions
Funding
Data Availability Statement
Conflicts of Interest
References
- Brahme, Y.B.; Kulkarni, P. An implementation of moving object detection, tracking and counting objects for traffic surveillance system. In Proceedings of the International Conference on Computational Intelligence and Communication Networks, Gwalior, India, 7–9 October 2011; IEEE: Piscataway, NJ, USA, 2011; pp. 143–148. [Google Scholar]
- Lin, J.P.; Sun, M.T. A YOLO-based traffic counting system. In Proceedings of the Conference on Technologies and Applications of Artificial Intelligence (TAAI), Taichung, Taiwan, 30 November–2 December 2018; IEEE: Piscataway, NJ, USA, 2018; pp. 82–85. [Google Scholar]
- Asha, C.; Narasimhadhan, A. Vehicle counting for traffic management system using YOLO and correlation filter. In Proceedings of the IEEE International Conference on Electronics, Computing and Communication Technologies (CONECCT), Bangalore, India, 16–17 March 2018; IEEE: Piscataway, NJ, USA, 2018; pp. 1–6. [Google Scholar]
- Chen, T.H.; Lin, Y.F.; Chen, T.Y. Intelligent vehicle counting method based on blob analysis in traffic surveillance. In Proceedings of the Second International Conference on Innovative Computing, Information and Control, Kumamoto, Japan, 5–7 September 2007; IEEE: Piscataway, NJ, USA, 2007; p. 238. [Google Scholar]
- Xu, H.; Lv, P.; Meng, L. A people counting system based on head-shoulder detection and tracking in surveillance video. In Proceedings of the International Conference on Computer Design and Applications, Qinhuangdao, China, 25–27 June 2010; IEEE: Piscataway, NJ, USA, 2010; p. V1-394. [Google Scholar]
- Seema, S.; Goutham, S.; Vasudev, S.; Putane, R.R. Deep learning models for analysis of traffic and crowd management from surveillance videos. In Progress in Computing, Analytics and Networking: Proceedings of ICCAN 2019; Springer: Singapore, 2020; pp. 83–93. [Google Scholar]
- Ilyas, N.; Shahzad, A.; Kim, K. Convolutional-neural network-based image crowd counting: Review, categorization, analysis, and performance evaluation. Sensors 2019, 20, 43. [Google Scholar] [CrossRef] [PubMed]
- Furferi, R.; Governi, L.; Puggelli, L.; Servi, M.; Volpe, Y. Machine vision system for counting small metal parts in electro-deposition industry. Appl. Sci. 2019, 9, 2418. [Google Scholar] [CrossRef]
- Lee, S.H.; Yang, C.S. A real time object recognition and counting system for smart industrial camera sensor. IEEE Sens. J. 2017, 17, 2516–2523. [Google Scholar] [CrossRef]
- Yella, S.; Dougherty, M. Automatically Detecting the Number of Logs on a Timber Truck. J. Intell. Syst. 2013, 22, 417–435. [Google Scholar] [CrossRef]
- Junior, C.d.S.R.; Walker, R.; Santos, M.d. Riverstock: Criação e implementação de smart-glasses para contagem apurada de estoque. 2020; Unpublished Work. [Google Scholar]
- Adamczuk, G.; Trentin, M.; de Lima, J.; Motta, J.; Cantelli, R. Lighting in the shackling area: Conciliating broiler welfare with labor comfort. Braz. J. Poult. Sci. 2014, 16, 87–91. [Google Scholar] [CrossRef]
- Kumar, L.; Mutanga, O. Remote sensing of above-ground biomass. Remote. Sens. 2017, 9, 935. [Google Scholar] [CrossRef]
- Pérez-Cruzado, C.; Rodríguez-Soalleiro, R. Improvement in accuracy of aboveground biomass estimation in Eucalyptus nitens plantations: Effect of bole sampling intensity and explanatory variables. For. Ecol. Manag. 2011, 261, 2016–2028. [Google Scholar] [CrossRef]
- Martí, F.; Forkan, A.R.M.; Jayaraman, P.P.; McCarthy, C.; Ghaderi, H. LogLiDAR: An internet of things solution for counting and scaling logs. In Proceedings of the IEEE International Conference on Pervasive Computing and Communications Workshops, Kassel, Germany, 22–26 March 2021; IEEE: Piscataway, NJ, USA, 2021; pp. 413–415. [Google Scholar]
- Wang, Z.; Menenti, M. Challenges and opportunities in Lidar remote sensing. Front. Remote. Sens. 2021, 2, 641723. [Google Scholar] [CrossRef]
- Isola, P.; Zhu, J.Y.; Zhou, T.; Efros, A.A. Image-to-image translation with conditional adversarial networks. In Proceedings of the IEEE Conference on Computer Vision and Pattern Recognition, Honolulu, HI, USA, 21–26 July 2017; IEEE: Piscataway, NJ, USA, 2017; pp. 1125–1134. [Google Scholar]
- Silva, G.S.; Casanova, D.; Oliva, J.T.; Rodrigues, E.O. Cardiac fat segmentation using computed tomography and an image-to-image conditional generative adversarial neural network. Med. Eng. Phys. 2024, 124, 104104. [Google Scholar] [CrossRef] [PubMed]
- Rodrigues, É.O.; Conci, A.; Liatsis, P. Morphological classifiers. Pattern Recognit. 2018, 84, 82–96. [Google Scholar] [CrossRef]
- He, L.; Chao, Y.; Suzuki, K.; Wu, K. Fast connected-component labeling. Pattern Recognit. 2009, 42, 1977–1987. [Google Scholar] [CrossRef]
- Instituto Brasileiro de Geografia e Estatística (IBGE). Extração Vegetal e Silvicultura 2022; Technical Report; IBGE: Rio de Janeiro, Brazil, 2022.
- Mazzochin, J.V.C. Segmentation and counting of wood trunks using Deep Learning and Image Processing. Masters Dissertation, Universidade Tecnologica Federal do Parana, Pato Branco, Parana, Brazil, 2025. [Google Scholar]
- Pena, F.; Crabi, D.; Izidoro, S.C.; Rodrigues, É.O.; Bernardes, G. Machine learning applied to emerald gemstone grading: Framework proposal and creation of a public dataset. Pattern Anal. Appl. 2022, 25, 241–251. [Google Scholar] [CrossRef]
- Pedersen, S.J.K. Circular hough transform. Vision Graph. Interact. Syst. 2007, 123, 2–3. [Google Scholar]
- de Lima Araujo, H.C.; Martins, F.S.; Cortese, T.T.P.; Locosselli, G.M. Artificial intelligence in urban forestry—A systematic review. Urban For. Urban Green. 2021, 66, 127410. [Google Scholar] [CrossRef]
- Rummer, B.; Wear, D.; Greis, J. Forest operations technology. In Southern Forest Resource Assessment; USDA-Forest Service: Asheville, NC, USA, 2002; pp. 341–353. [Google Scholar]
- TensorFlow Developers. TensorFlow: An End-to-End Open-Source Platform for Machine Learning. Available online: https://www.tensorflow.org/ (accessed on 8 January 2023).
- Ronneberger, O.; Fischer, P.; Brox, T. U-Net: Convolutional Networks for Biomedical Image Segmentation. In International Conference on Medical Image Computing and Computer-Assisted Intervention; Springer: Munich, Germany, 2015; pp. 234–241. [Google Scholar]
- Ibrahem, H.; Salem, A.; Kang, H.S. Exploration of Semantic Label Decomposition and Dataset Size in Semantic Indoor Scenes Synthesis via Optimized Residual Generative Adversarial Networks. Sensors 2022, 22, 8306. [Google Scholar] [CrossRef] [PubMed]
- Patel, K.; Shah, P.; Gajjar, R. Semantic Segmentation of Urban Area using Pix2Pix Generative Adversarial Networks. In Proceedings of the 3rd International Conference on Range Technology, Gujarat, India, 23–25 February 2023; IEEE: Piscataway, NJ, USA, 2023; pp. 1–6. [Google Scholar]
- Tsuda, H.; Hotta, K. Cell Image Segmentation by Integrating Pix2pixs for Each Class. In Proceedings of the IEEE/CVF Conference on Computer Vision and Pattern Recognition Workshops, Long Beach, CA, USA, 15–20 June 2019; IEEE: Piscataway, NJ, USA, 2019; pp. 1065–1073. [Google Scholar]


| Model | Parameters | Validation Loss (MSE) | Segmentation Accuracy (%) | Generalization Notes |
|---|---|---|---|---|
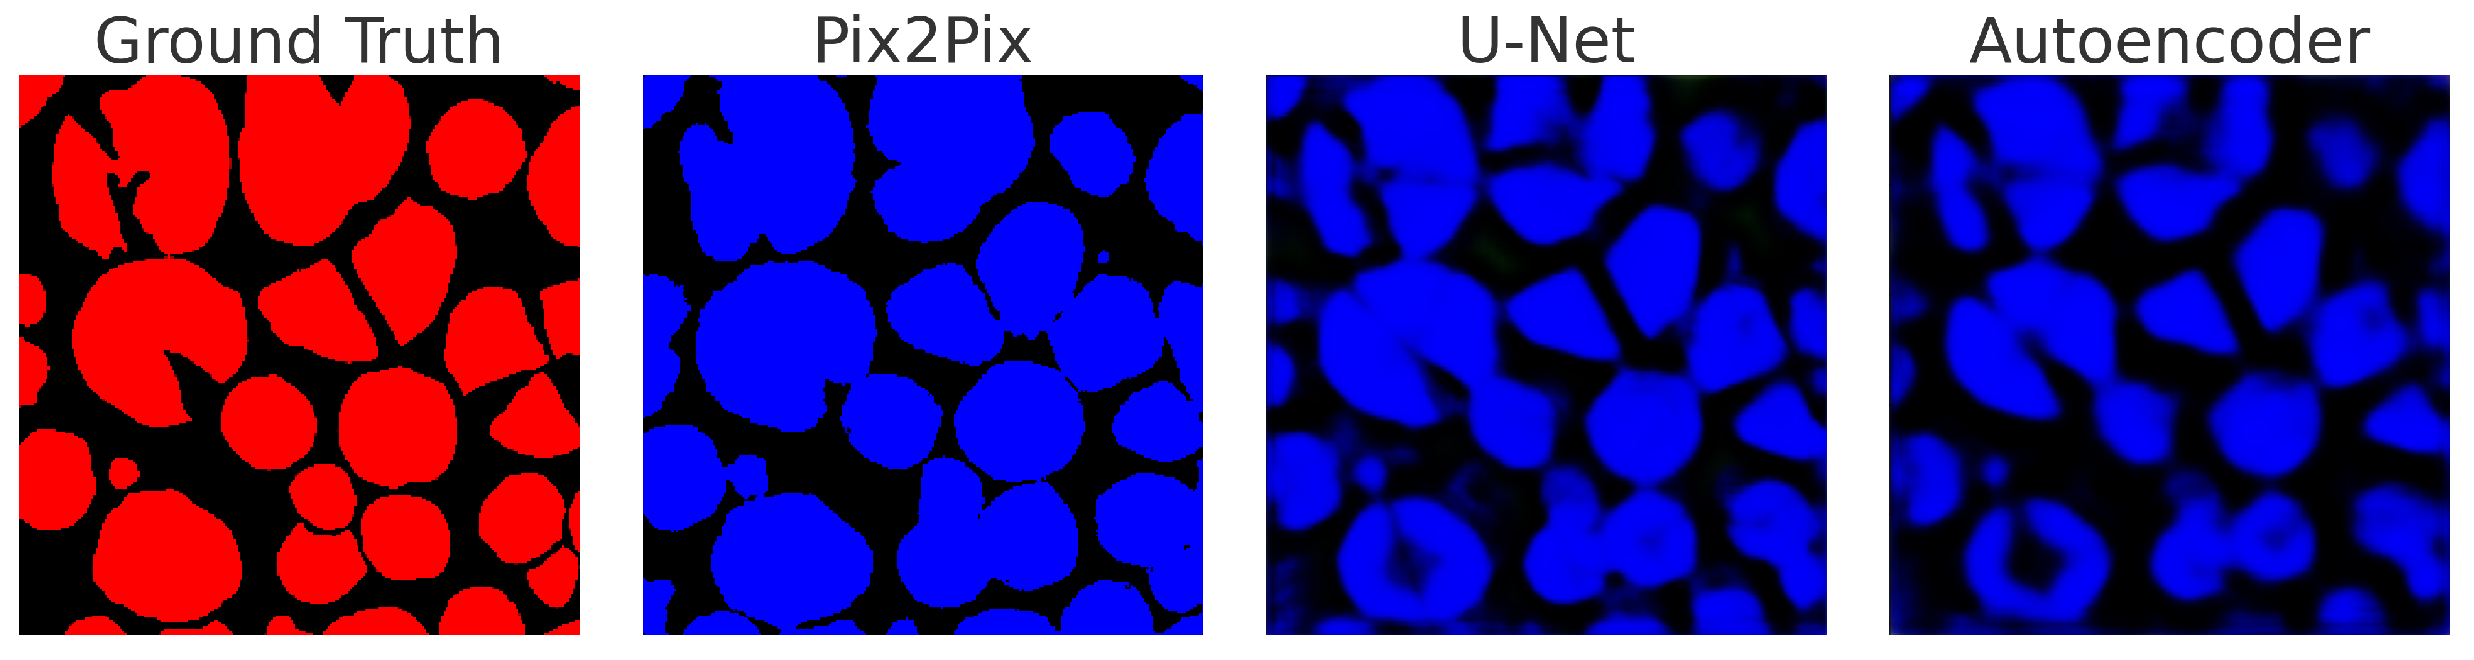
| Vanilla Autoencoder [27] | ~20,000 | 0.062 | 85.4 | Limited generalization |
| Vanilla U-Net [28] | ~15,000 | 0.059 | 86.9 | Limited generalization |
| Pix2Pix (Proposed) | 57,183,620 | 0.032 | 94.1 | Superior generalization |
| Image Index | Accuracypixel | F1 Score | Kappa | IoU |
|---|---|---|---|---|
| 71 | 0.962 | 0.907 | 0.884 | 0.831 |
| 17 | 0.956 | 0.897 | 0.869 | 0.814 |
| 26 | 0.970 | 0.933 | 0.914 | 0.875 |
| 34 | 0.961 | 0.910 | 0.885 | 0.835 |
| 59 | 0.968 | 0.925 | 0.905 | 0.861 |
| 12 | 0.971 | 0.932 | 0.913 | 0.872 |
| 55 | 0.957 | 0.879 | 0.853 | 0.784 |
| 10 | 0.970 | 0.924 | 0.905 | 0.858 |
| 2 | 0.969 | 0.917 | 0.898 | 0.847 |
| 46 | 0.964 | 0.908 | 0.886 | 0.831 |
| Image Index | Expected Number of Logs | Output | Correctly Identified (CI) | Intersecting Logs (I) | Noise (N) | ISS (%) |
|---|---|---|---|---|---|---|
| 71 | 31 | 29 | 22 | 7 | 2 | 70.97 |
| 17 | 26 | 23 | 13 | 10 | 3 | 50.00 |
| 26 | 22 | 23 | 13 | 5 | 4 | 56.52 |
| 34 | 19 | 19 | 11 | 6 | 1 | 61.11 |
| 59 | 26 | 24 | 16 | 7 | 3 | 61.54 |
| 12 | 23 | 22 | 17 | 4 | 2 | 68.00 |
| 55 | 28 | 29 | 10 | 12 | 5 | 37.04 |
| 10 | 23 | 23 | 12 | 8 | 2 | 48.00 |
| 2 | 21 | 23 | 16 | 3 | 2 | 76.19 |
| 46 | 21 | 19 | 14 | 6 | 1 | 66.67 |
Disclaimer/Publisher’s Note: The statements, opinions and data contained in all publications are solely those of the individual author(s) and contributor(s) and not of MDPI and/or the editor(s). MDPI and/or the editor(s) disclaim responsibility for any injury to people or property resulting from any ideas, methods, instructions or products referred to in the content. |
© 2025 by the authors. Licensee MDPI, Basel, Switzerland. This article is an open access article distributed under the terms and conditions of the Creative Commons Attribution (CC BY) license (https://creativecommons.org/licenses/by/4.0/).
Share and Cite
Mazzochin, J.V.C.; Vitor, G.B.; Tiecker, G.; Diniz, E.M.F.; Oliveira, G.A.; Trentin, M.; Rodrigues, É.O. A Novel Approach for the Counting of Wood Logs Using cGANs and Image Processing Techniques. Forests 2025, 16, 237. https://doi.org/10.3390/f16020237
Mazzochin JVC, Vitor GB, Tiecker G, Diniz EMF, Oliveira GA, Trentin M, Rodrigues ÉO. A Novel Approach for the Counting of Wood Logs Using cGANs and Image Processing Techniques. Forests. 2025; 16(2):237. https://doi.org/10.3390/f16020237
Chicago/Turabian StyleMazzochin, João V. C., Giovani Bernardes Vitor, Gustavo Tiecker, Elioenai M. F. Diniz, Gilson A. Oliveira, Marcelo Trentin, and Érick O. Rodrigues. 2025. "A Novel Approach for the Counting of Wood Logs Using cGANs and Image Processing Techniques" Forests 16, no. 2: 237. https://doi.org/10.3390/f16020237
APA StyleMazzochin, J. V. C., Vitor, G. B., Tiecker, G., Diniz, E. M. F., Oliveira, G. A., Trentin, M., & Rodrigues, É. O. (2025). A Novel Approach for the Counting of Wood Logs Using cGANs and Image Processing Techniques. Forests, 16(2), 237. https://doi.org/10.3390/f16020237