Article

Estimating Growing Stock Volume at Tree and Stand Levels for Chinese Fir (Cunninghamia lanceolata) in Southern China Using UAV Laser Scanning

Guangdong Forestry Survey and Planning Institute, 338 Guangshanyilu, Guangzhou 510520, China
*
Author to whom correspondence should be addressed.
Forests 2025, 16(12), 1779; https://doi.org/10.3390/f16121779
Submission received: 24 October 2025 / Revised: 17 November 2025 / Accepted: 22 November 2025 / Published: 27 November 2025
(This article belongs to the Special Issue Forest Resources Inventory, Monitoring, and Assessment)

Abstract

UAV laser scanning (UAV-LS) combines extensive scanning coverage with high point cloud density, enabling efficient and precise acquisition of key forest attributes. Based on field-measured data and UAV-LS data from 138 Chinese fir (Cunninghamia lanceolata) plantation plots in southern China, this study systematically developed growing stock volume (GSV) estimation models at both tree and stand levels. The models included base models (allometric models), linear models, dummy variable models incorporating age groups, and nonlinear mixed-effects models incorporating random effects (plot and area levels for the tree level, and only the area level for the stand level). The results showed the following: (1) Stand-level GSV prediction relied primarily on height metrics, achieving optimal performance through a combination of the 10th cumulative height percentile (AIH10) and canopy cover (CC), both of which showed near-linear relationships with GSV; tree-level GSV was predicted by LiDAR-derived tree height (LH) and crown width (LCW), with LH explaining most variation. (2) Tree-level models achieved R2 = 0.639–0.725 and RMSE = 0.050–0.058 m3, exhibiting larger individual prediction errors (mean percentage standard error, MPSE > 30%) with smaller aggregate prediction errors (mean prediction error, MPE < 1%); stand-level models reached R2 = 0.785–0.879 and RMSE = 46.052–61.314 m3 ha−1 while maintaining controlled errors across scales (MPE < 5%, MPSE < 20%). (3) At both the tree and stand levels, the nonlinear mixed-effects model outperformed the others, followed by the dummy variable model and the base model, with the linear model exhibiting the worst performance; area-level random effects primarily influenced the baseline value of tree-level GSV and the allometric relationship between stand-level GSV and AIH10, whereas plot-level random effects affected the allometric relationships of tree-level GSV with LH and LCW. This study confirms the effectiveness of UAV-LS for large-scale forest resource monitoring, while underscoring the necessity of incorporating spatial heterogeneity in GSV estimation.

1. Introduction

Growing stock volume (GSV), a core metric in national forest inventory (NFI), serves as a key indicator in evaluating forest resource quantity and quality. GSV is also integral to carbon accounting, where it is converted to above-ground biomass (AGB) using biomass conversion and expansion factor (BCEF)—an approach formally recommended by the Intergovernmental Panel on Climate Change (IPCC) [1,2,3]. Currently, GSV estimation primarily relies on traditional statistical models, including taper curves, form factor functions, and volume functions [4]. These methods remain heavily dependent on extensive ground surveys, which are labor-intensive, costly, and time-consuming. Their application is also limited in inaccessible areas.
Light detection and ranging (LiDAR) is an actively developing remote sensing technology that determines target distance by measuring the time interval between emitted laser pulses and their returning echoes. Compared to optical remote sensing, LiDAR exhibits superior penetration capability through forest canopy gaps, enabling the precise acquisition of vertical structural information for surface objects. Consequently, it is widely employed for extracting forest metrics such as tree height, crown width, diameter at breast height (DBH), GSV, and AGB [5,6,7,8,9]. Notably, LiDAR demonstrates significant advantages over synthetic aperture radar (SAR) for estimating GSV and AGB in dense forests. SAR typically utilizes backscatter coefficients as explanatory variables, which leads to signal saturation or attenuation when AGB exceeds 100 Mg ha−1 [10,11]. In contrast, LiDAR employs three-dimensional structural parameters with stronger physical relevance as explanatory variables, yielding a higher estimation ceiling, with some studies suggesting that it can exceed 1000 Mg ha−1 in AGB estimation [12,13].
Based on the carrying platform, LiDAR systems can be classified into three types: satellite laser scanning (SLS), airborne laser scanning (ALS), and terrestrial laser scanning (TLS) [14]. Within the forestry domain, ALS and TLS are predominantly employed. ALS conducts top-down scanning, providing extensive coverage at the expense of detailed characterization of understory vegetation structure. In contrast, TLS performs bottom-up scanning from ground level, enabling detailed acquisition of understory and individual tree structural information, but with limited coverage [15,16]. Unmanned aerial vehicle laser scanning (UAV-LS) represents a recent technological advancement in ALS. Operating at significantly lower altitudes (50–300 m) than manned ALS (500–3000 m), UAV-LS captures higher-density point clouds that facilitate precise individual tree segmentation [14,17,18]. Its coverage area (2–1000 ha) also substantially surpasses that of TLS (0.01–1 ha), demonstrating superior operational efficiency [14]. These comparative advantages enable UAV-LS to estimate GSV or AGB at both tree and stand levels.
At the tree level, conventional approaches estimate GSV using established allometric equations, which inherently require DBH. Although UAV-LS captures rich point cloud data, this capability is primarily restricted to canopy components. Here, occlusion effects yield sparse trunk point clouds, which are inadequate for direct extraction of DBH, particularly in closed-canopy forests [19]. To address this, studies have proposed estimating DBH from LiDAR-derived metrics (e.g., tree height, crown width, and crown area) [20,21]. However, this approach risks error propagation [22]. Consequently, some research bypasses DBH-based allometric equations, instead directly modeling GSV or AGB using LiDAR-derived metrics [23]. To enhance accuracy, integrating TLS represents an alternative approach. For instance, TLS enables measurement of DBH and stem diameters at various heights, facilitating the development of taper equations based on tree height and DBH. GSV can then be calculated via integration or sectional summation [24,25]. Furthermore, TLS acquires high-density stem point clouds, supporting direct reconstruction of three-dimensional stem geometry for explicit GSV extraction, such as through quantitative structure models (QSMs) [26]. However, TLS deployment entails limited spatial coverage, reduced efficiency, and consequently, poor scalability. Therefore, UAV-LS-based methods remain the predominant trend.
At the stand level, the abundance of LiDAR-derived forest structural metrics shifts the focus towards multivariate feature modeling, categorized into parametric and non-parametric approaches [13]. Parametric models assume that the data follow a specific, known probability distribution or functional form. These models are defined by a finite set of parameters. Within GSV estimation, multiple linear regression (MLR) is the predominant parametric model. Its application typically involves correlation analysis, collinearity analysis, and significance testing of regression coefficients to simplify complex multivariate relationships [27,28,29]. Non-parametric models, a cornerstone concept in machine learning, do not rely on assumptions about the underlying data distribution. The number of parameters in these models adjusts dynamically based on the data, making them powerful tools for modeling intricate relationships. For GSV prediction, widely applied non-parametric models, such as random forests (RF) and k-nearest neighbors (k-NN), frequently demonstrate robust predictive performance [30,31,32].
Chinese fir (Cunninghamia lanceolata) is a major plantation timber species in southern China. According to China’s 9th NFI data, it accounts for 6.33% of the area and 5.00% of the GSV in the nation’s arboreal forests. However, research on LiDAR-based estimation of Chinese fir GSV remains relatively scarce. Studies conducted at the tree level are often confined to very limited areas (e.g., a single forest farm or plot), which undermines the representativeness and generalizability of their findings [33,34,35,36]. Most importantly, at both the tree and stand levels, the influence of forest age and site conditions on GSV estimation has not been sufficiently investigated. This is a critical gap, as Chinese fir stands at different growth stages typically undergo distinct management interventions, and stands in different areas or locations may exhibit heterogeneity in habitat conditions and internal competition intensity. These factors introduce systematic between-group variation in GSV. Failure to account for this variation can lead to model misspecification, resulting in invalid statistical inference and compromised predictive performance.
Therefore, this study established plots across seven major Chinese fir plantation areas in Guangdong Province, China, collecting both field-measured data and UAV-LS data. The primary objectives were to (1) systematically develop GSV estimation models at both tree and stand levels for Chinese fir based on LiDAR-derived metrics, and evaluate the importance of each metric in estimating GSV; (2) incorporate age group effects via dummy variable approaches to analyze whether GSV differs significantly across distinct growth stages; (3) establish nonlinear mixed-effects models examining how area-level and plot-level random effects influence GSV; and (4) compile aerial volume tables for Chinese fir at both tree and stand levels based on the developed models to meet the demand for forest resource monitoring across different scales.

2. Materials and Methods

2.1. Study Area

The study area is located in Guangdong Province, situated in the southernmost part of the Chinese mainland (20°09′ N–25°31′ N, 109°45′ E–117°20′ E; Figure 1). Characterized by higher elevations in the north and lower terrain in the south, the province’s landscape is dominated by mountains, hills, and plains. Acidic soils, primarily latosolic red soil, red soil, and laterite, are prevalent. Driven by the East Asian monsoon, the climate transitions from central subtropical in the north through southern subtropical to tropical in the south. It features abundant heat and moisture with concurrent rainy and warm seasons, exhibiting a mean annual temperature of 21.8 °C and mean annual precipitation of 1789.3 mm, concentrated predominantly from April to September. Correspondingly, the vegetation displays distinct zonal variations, including northern tropical monsoon forests, southern subtropical monsoon evergreen broad-leaved forests, central subtropical typical evergreen broad-leaved forests, and coastal tropical mangrove forests. According to the 9th NFI data, the provincial forest area totals 94,598 km2 with a forest coverage rate of 53.52%. Within arboreal forests, Chinese fir accounts for 10.32% of the area and 8.93% of the GSV.

2.2. Field-Measured Data

Field measurements were conducted in two phases: November–December 2021 and December 2023–March 2024. To account for variations in growth environments and ensure even distribution across age groups, 138 square sample plots (30 m × 30 m) were established across seven areas (counties) in Guangdong Province, China. Real-time kinematic (RTK) positioning was used to determine the coordinates of plot corners and individual sample trees. Site conditions, stand origin, average age, and canopy closure were documented. Structural traits of sample trees were measured, including DBH, tree height, crown base height, and crown width. GSV was calculated using the binary volume model (based on DBH and tree height) issued by the Forestry Administration of Guangdong Province (Equation (1)).
V = 6.97483 × 10 5 × D 1.81583 × H 0.99610
where V is the tree-level growing stock volume (m3); D is the diameter at breast height (cm); and H is the tree height (m).

2.3. UAV-LS Data

Synchronous with ground surveys, LiDAR data were acquired using an AS-1300HL system (Riegl VUX-1LR scanner, Riegl Laser Measurement Systems GmbH, Horn, Austria) mounted on a quadcopter. The system operated at a 1550 nm wavelength with a ±30° effective scan field, 49 Hz scan frequency, and 0.5 mrad beam divergence. Flights followed an orthogonal grid pattern at 10 m/s with 50% lateral overlap, achieving a mean point density of 110 pts/m2. Integrated global navigation satellite system and inertial measurement unit (GNSS/IMU) provided centimeter-level georeferencing, while multi-echo detection enabled penetration through vegetation canopies for sub-canopy terrain mapping.
The raw point cloud data were processed using LiDAR360 V5.2. Noise points were identified and removed with the nearest neighbor distance (NND) method. Ground point classification utilized an improved progressive triangulated irregular network (TIN) densification algorithm. Normalization was achieved by subtracting the elevation of its nearest ground point from that of each non-ground point. Stand characteristic attributes, including canopy cover, gap fraction, leaf area index, 56 height metrics, and 42 intensity metrics, were calculated from normalized point cloud data. Tree segmentation using distance-constrained clustering extracted tree height, crown diameter, crown area, and crown volume. After removing erroneous and extreme-value samples, 17,221 trees and all 138 plots were retained. The randomly selected 70% of the trees and 70% of the plots were used for model development, with the remaining 30% of each reserved for model testing. Figure 1 shows the workflow of this study.

2.4. Base Models and Variable Selection

In this study, the allometric equation, which reflects resource allocation strategies of organisms and is widely used in forestry biological modeling [37,38,39], was adopted as the base functional form. To enhance model interpretability and avoid overfitting, only two independent variables were retained in the final models. At the tree level, LiDAR-derived tree height and crown morphological features (crown width, area, or volume) served as predictors. At the stand level, the importance of each input variable, quantified by the percentage increase in mean squared error (%IncMSE), was first calculated using the RF algorithm. Subsequently, the top 20 variables ranked by %IncMSE were selected and used to form all possible pairwise combinations, generating candidate variable pairs. During this process, combinations involving variables with similar biophysical functions (e.g., pairing two height variables) were avoided to reduce redundant information and mitigate collinearity risk. Each candidate pair was then fitted to the allometric equation (Equation (2)). The optimal variable pair was selected using the model evaluation methods defined in this study, with a variance inflation factor (VIF) of less than 5. For comparison, linear models using the same independent variables were also developed concurrently at both the tree and stand levels.
y = a x 1 b x 2 c + ε
where y is the response variable; x 1 and x 2 are predictor variables; a is the proportionality constant; b and c are allometric exponents; and ε is an error term.

2.5. Dummy Variable Models

Based on growth characteristics and harvesting attributes, Chinese fir plantations were classified into five age groups: young forest (≤10 years), middle-aged forest (11–20 years), near-mature forest (21–25 years), mature forest (26–35 years), and over-mature forest (≥36 years). Age groups were incorporated into the allometric equations using dummy variable coding. Specifically, a separate dummy variable was assigned to each age group, taking a value of 1 if a sample belonged to that age group and 0 otherwise [40]. These dummy variables allowed the proportionality constant (a) in the allometric equations to vary across age groups, thereby capturing the influence of different development stages on baseline GSV. The expanded model form is as follows:
y = ( a i A G i ) × x 1 b x 2 c + ε
where A G i is the dummy variable for the i-th age group (i = 1, 2, 3, 4, 5 representing young, middle-aged, near-mature, mature, and over-mature forests, respectively); and a i is the proportionality constant for the i-th age group.

2.6. Nonlinear Mixed-Effects Models

Building upon the allometric equation, spatial heterogeneity was further incorporated. At the tree level, a two-level mixed-effects model with area-level and plot-level random effects was developed, where plots were nested within areas. At the stand level, a single-level mixed-effects model with area-level random effects was constructed. The following random effects allocation principle was applied: random effects were assigned to a given parameter at only one hierarchical level (e.g., parameter a exclusively at the area level), while different parameters could receive random effects at the same level (e.g., parameters a and b at the plot level). This design avoids confounding of variance sources, improves the stability of variance component estimates, and enhances model interpretability. Models were fitted using the nlme package in R, with an unstructured covariance structure for the random-effects variance-covariance matrix. The optimal random effects combination was selected based on the Akaike information criterion (AIC) and Bayesian information criterion (BIC). Equations (4) and (5) present the structural forms of the extended tree-level and stand-level models, respectively [41]:
y i j = f ( ϕ i , x i j ) + ε i j ,   i = 1 , 2 , , m = 1 S S m ,   j = 1 , 2 , , n i ϕ i = A i β + B i ( a r e a ) u i ( a r e a ) + B i ( a r e a × p l o t ) u i ( a r e a × p l o t ) u i ( a r e a ) N ( 0 , Ψ ( a r e a ) ) ,   u i ( a r e a × p l o t ) N ( 0 , Ψ ( a r e a × p l o t ) )
y i j = f ( ϕ i , x i j ) + ε i j ,   i = 1 , 2 , , S ,   j = 1 , 2 , , n i ϕ i = A i β + B i ( a r e a ) u i ( a r e a ) u i ( a r e a ) N ( 0 , Ψ ( a r e a ) )
where y i j is the response variable value for the j-th observation of the i-th subject (observations sharing identical values for all categorical variables in the model are grouped into a subject); x i j is the predictor variable value for the j-th observation of the i-th subject; ϕ i is the parameter vector of the i-th subject; f ( . ) is a nonlinear function of ϕ i and x i j ; β is the fixed-effects parameter vector; u i ( a r e a ) is the area-level random-effects parameter vector of the i-th subject; u i ( a r e a × p l o t ) is the plot-level random-effects parameter vector of the i-th subject; A i , B i ( a r e a ) , and B i ( a r e a × p l o t ) are the design matrices; Ψ ( a r e a ) is the covariance matrix for u i ( a r e a ) ; Ψ ( a r e a × p l o t ) is the covariance matrix for u i ( a r e a × p l o t ) ; S is the number of areas; S m is the number of plots in the m-th area; n i is the number of observations of the i-th subject. Random effects at different levels are mutually independent, and the error term is independent of the random effects.

2.7. Heteroscedasticity Correction and Model Evaluation

The GSV model commonly suffers from heteroscedasticity. To mitigate this limitation, a weighting function W = 1/f(x)λ was applied [42], where f(x) represents the unweighted fitted model and λ ranges from 1 to 2, with the optimal value determined through systematic testing. Six core metrics were employed for model evaluation: R-squared (R2), root mean square error (RMSE), mean prediction error (MPE), mean percentage standard error (MPSE), AIC and BIC [20,43]. The calculation formulas for RMSE, MPE, and MPSE are given below:
e ¯ = e k / n = ( y k y ^ k ) / n
σ 2 = ( e k e ¯ ) 2 / ( n 1 )
SEE = ( y k y ^ k ) 2 / ( n p )
RMSE = e ¯ 2 + σ 2
MPE = t α × ( SEE / y ¯ ) / n × 100
MPSE = ( y k y ^ k ) / y ^ k / n × 100
where y k and y ^ k are the observed value and the predicted value for the k-th observation; y ¯ is the mean of the observed values; n is the sample size; p is the number of model parameters; t α is the t-value at the confidence level α ; e ¯ is the mean bias; σ 2 is the bias variance; and SEE is the standard error of the estimate.
Model generalization was evaluated on a randomly held-out 30% test set. Additionally, to assess the potential impact of spatial autocorrelation in forest structure data on model stability, spatial cross-validation was performed using the full dataset. Following a comparable 7:3 ratio, the dataset was partitioned by area into folds, each comprising five areas for training and two for validation, resulting in 21 folds per model.

3. Results

3.1. Variable Importance Assessment

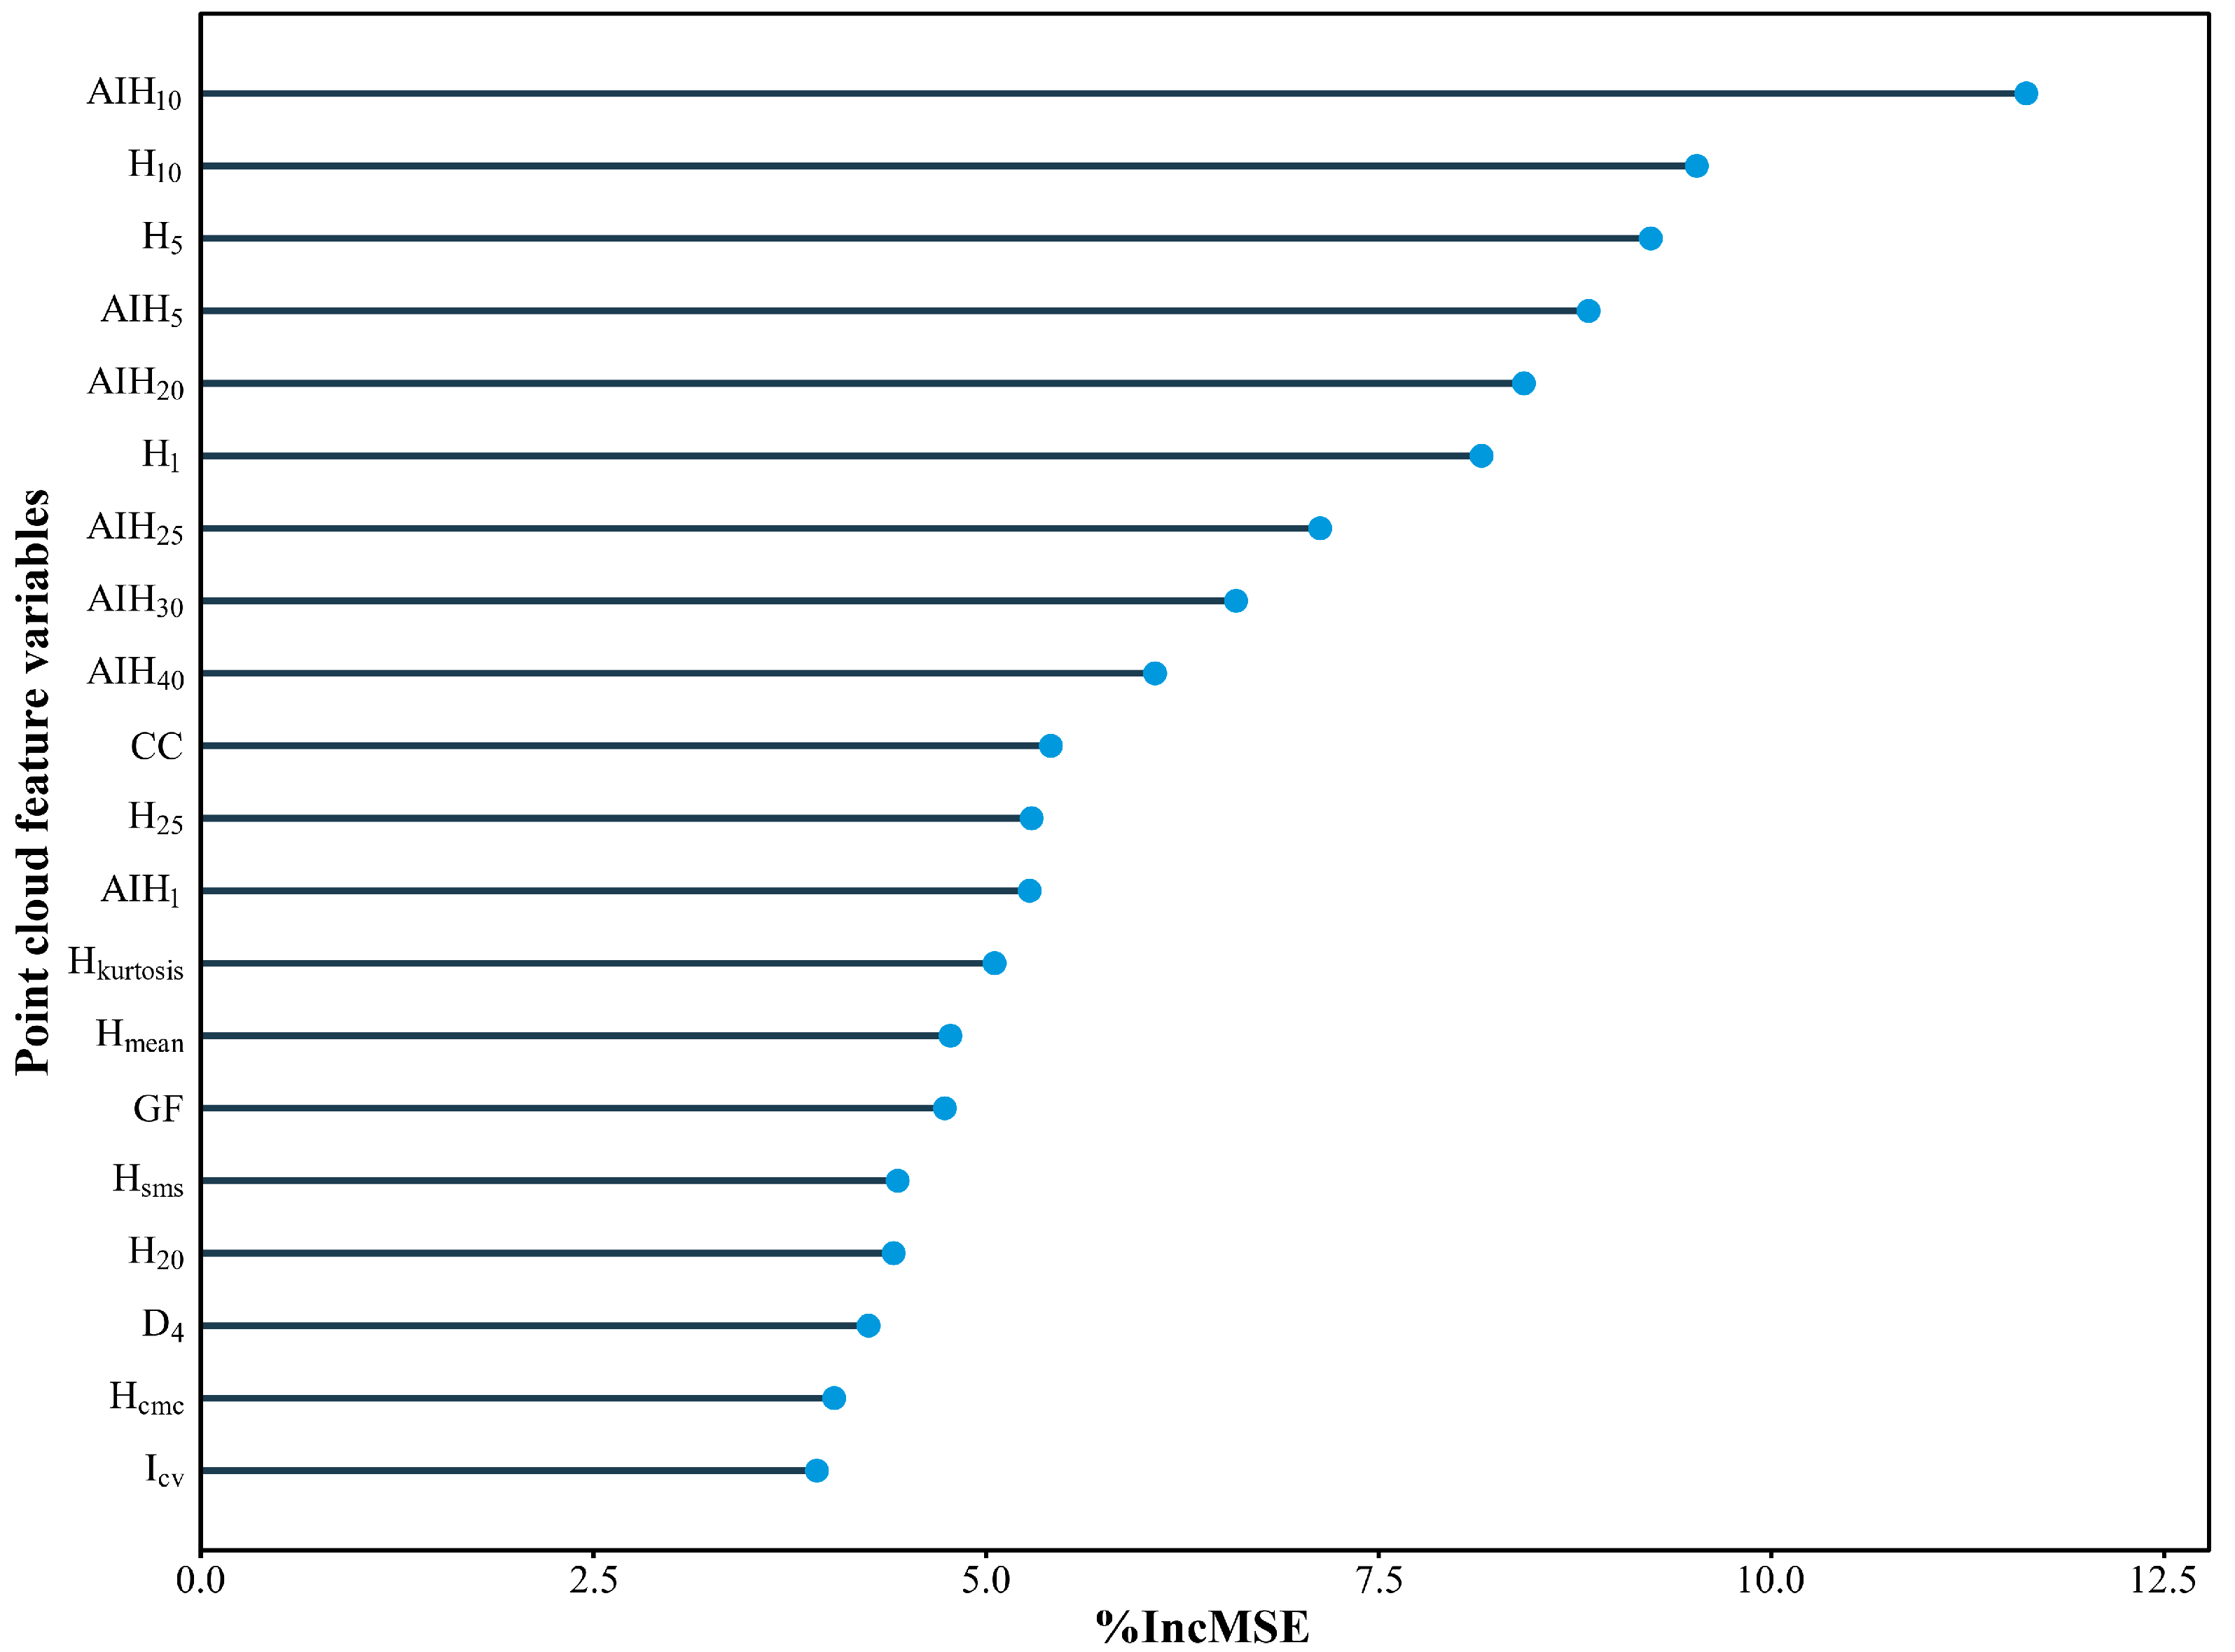
At the stand level, over 100 LiDAR-derived point cloud metrics were generated. The importance of each metric (as an input variable) for estimating GSV was evaluated using an RF model. A higher %IncMSE value for a given variable indicates that permuting the variable leads to a greater increase in the model’s prediction error (mean squared error). This signifies the variable is crucial for making accurate predictions, since model performance degrades significantly when its information is degraded. Figure 2 shows that 17 out of the top 20 variables ranked by %IncMSE were height metrics. The remaining three were canopy cover (CC), gap fraction (GF), and the intensity coefficient of variation (Icv). Furthermore, the top 9 positions were exclusively occupied by height metrics, underscoring their critical role in the accurate estimation of GSV. Among these, the i-th cumulative height percentile (AIHi, where i = 1, 5, 10, …, 95, 99) metrics were particularly important, with 6 of the top 9 variables being AIHi metrics. Notably, AIH10 exhibited the highest %IncMSE value among all variables, significantly higher than the variable ranked second. CC ranked 10th among variables, while GF and Icv were positioned lower. Although their importance was lower than the height metrics, they provided supplementary information to the model.
Based on the variable importance assessment results, all candidate variable pairs were tested in the base functional form (allometric equation). The stand-level optimal predictor variables were ultimately identified as AIH10 and CC. At the tree level, LiDAR-derived tree height (LH) was paired with LiDAR-derived crown width (LCW), crown area (LCA), and crown volume (LCV), respectively. Testing revealed that differences in model performance among the three combinations were negligible. Given that crown width is a more commonly used survey metric, LH and LCW were selected as the final predictor variables for tree-level modeling. Summary statistics for the research variables are presented in Table 1.

3.2. Model Development and Training Performance

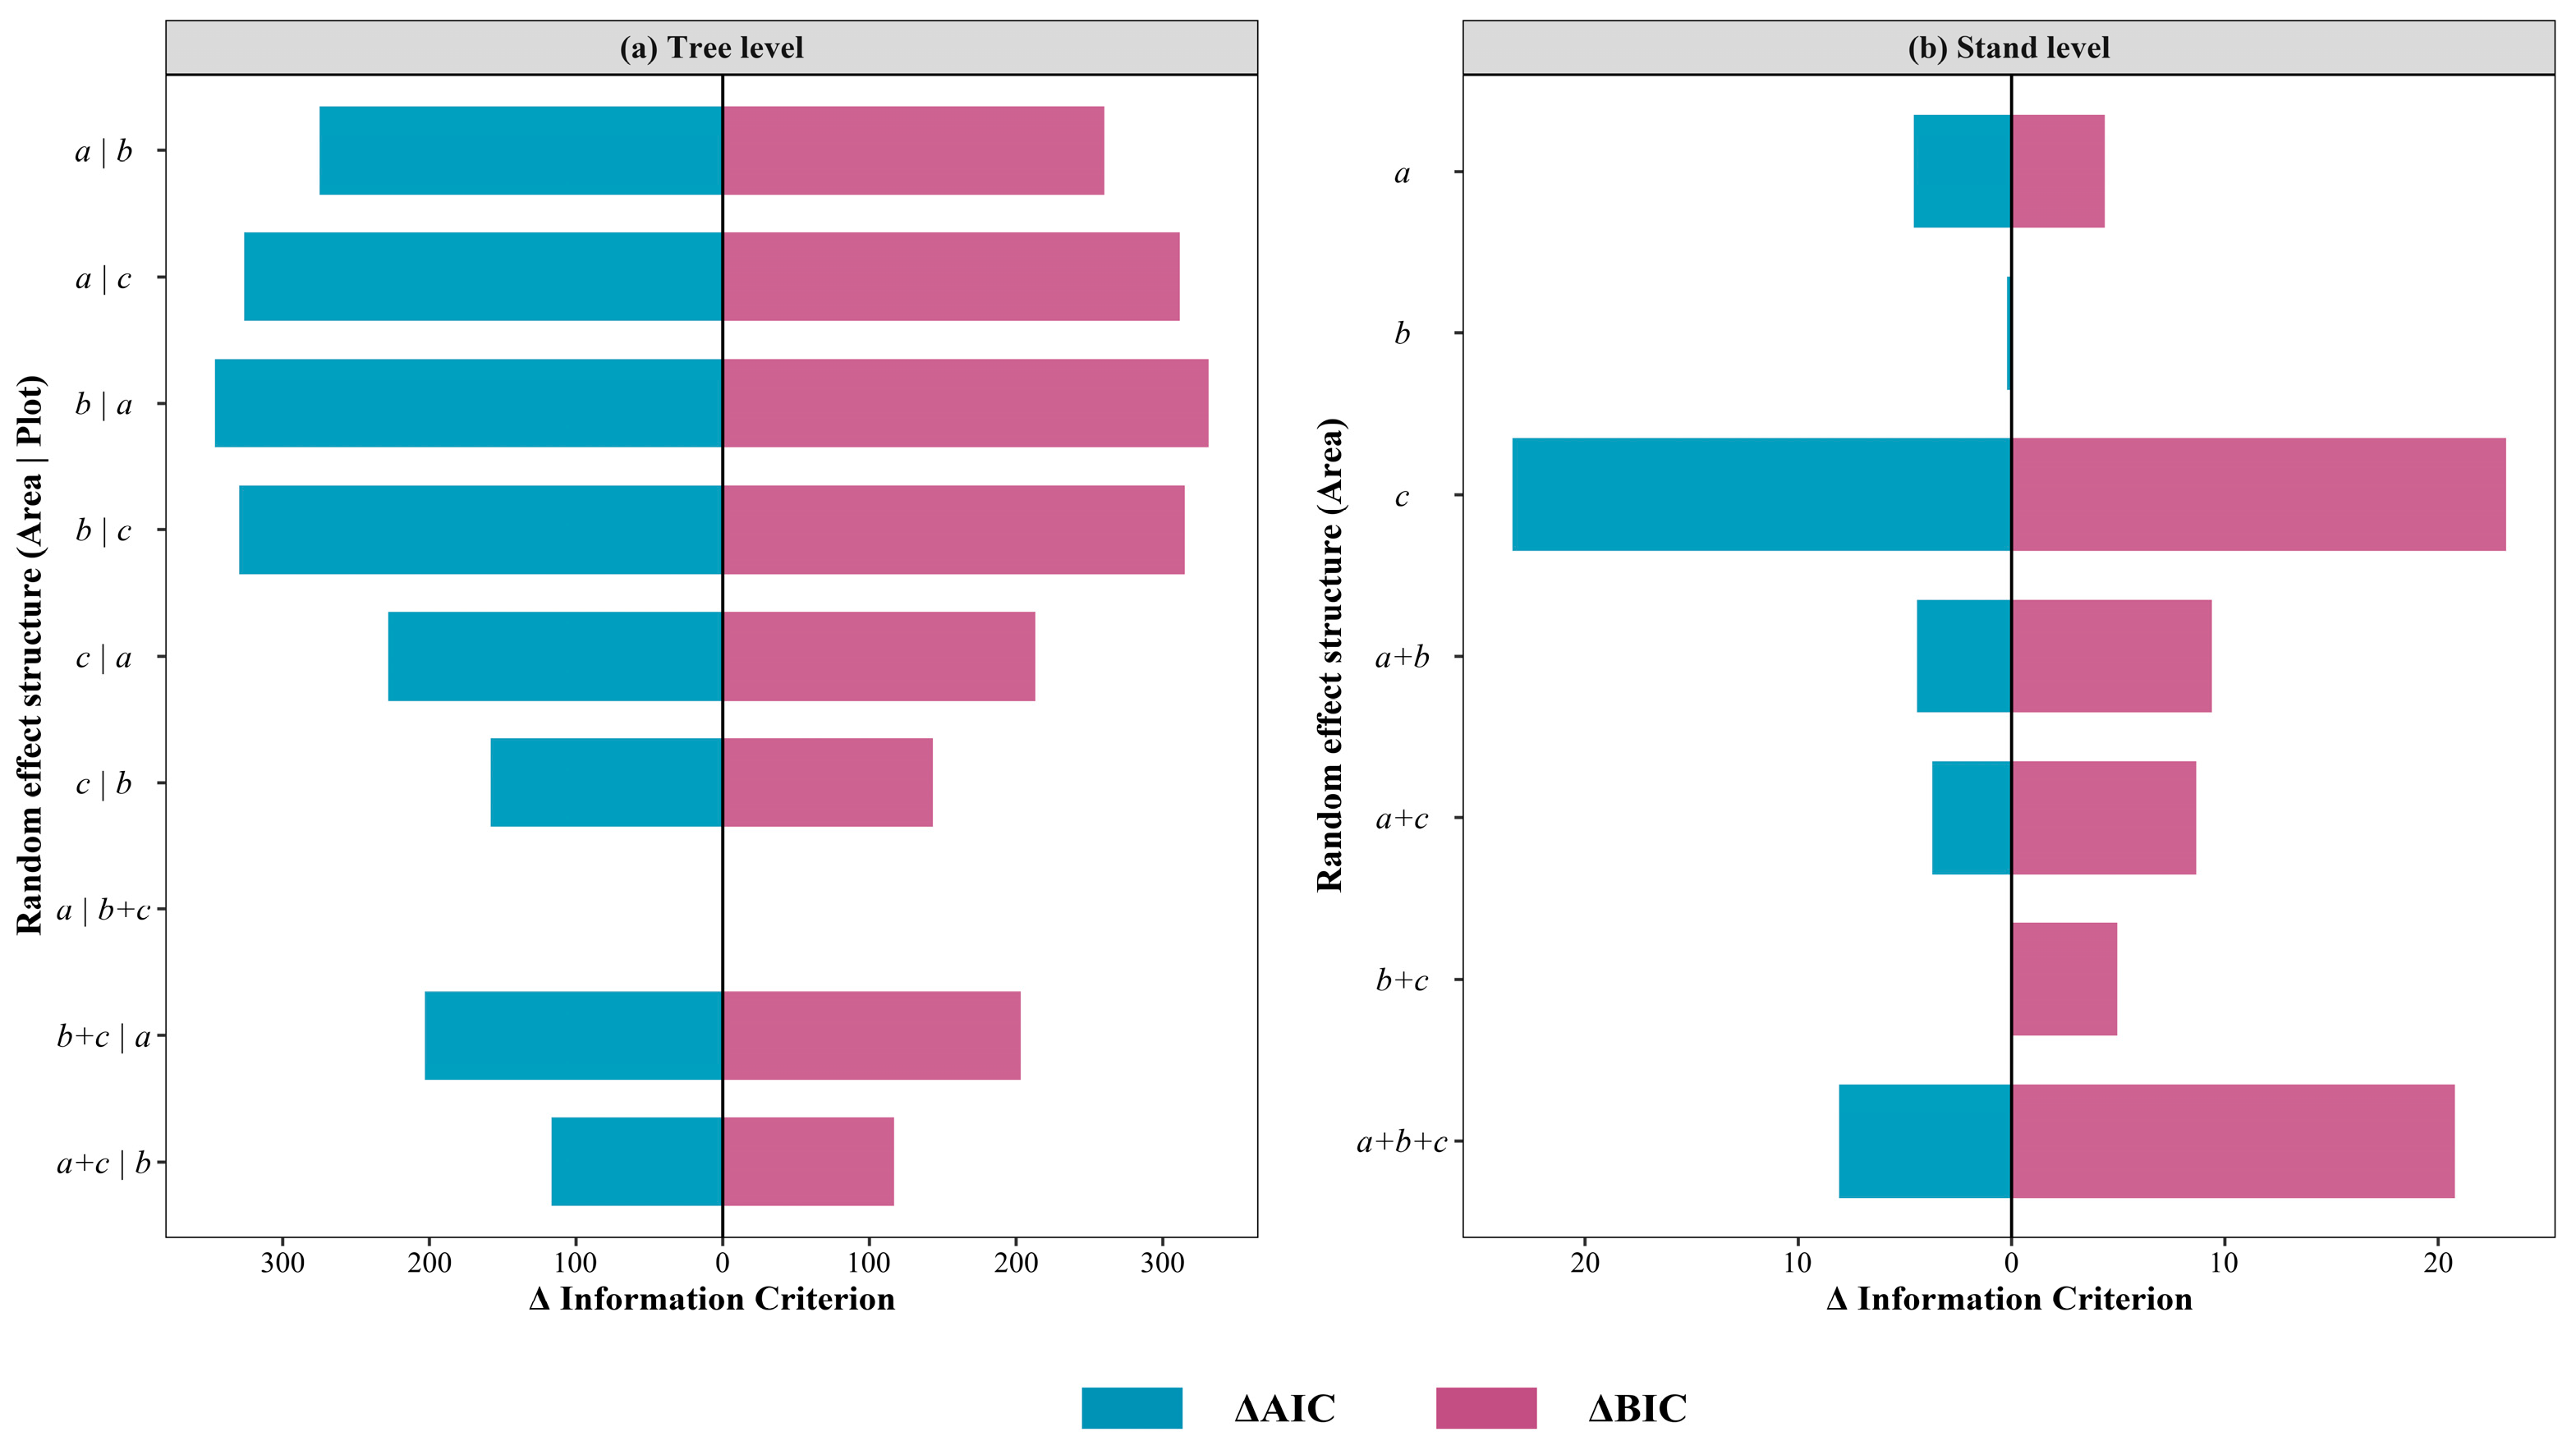
Figure 3 presents the results of selecting random effects structures for nonlinear mixed-effects models. AIC and BIC balance model fit against complexity by penalizing over-parameterization. Lower values indicate superior performance. At the tree level, minimum AIC and BIC were achieved when an area-level random effect was incorporated into parameter a, and plot-level random effects into parameters b and c. At the stand level, incorporating an area-level random effect to parameter b yielded an AIC of 1059.6 and a BIC of 1072.5. Though this AIC was not the absolute minimum (ΔAIC = 0.2), its BIC was the lowest among all candidate models, being lower than others by at least 4.4.
The parameter estimates are presented in Table 2, and the structures of the two nonlinear mixed-effects models (at tree and stand levels, respectively) are given by Equations (12) and (13). Parameter estimates from the base model indicated that LH was the core driver of tree-level GSV, with an exponent value of approximately 2.37. This signified that a 1% increase in LH corresponded to an average increase in GSV of about 2.37%, demonstrating the high sensitivity of GSV to variations in LH. In contrast, the exponent value for LCW was only around 0.06, suggesting its marginal contribution to GSV prediction was limited when LH was present. Differently, AIH10 and CC contributed almost equally to explaining variation in stand-level GSV. Both exhibited exponent values slightly below but close to 1 (AIH10 being marginally larger), indicating a near-linear relationship with GSV, yet displaying a slight diminishing returns effect.
V i j k = ( 0.000223 + u i ) L H i j k ( 2.363358 + v 1 i j ) L C W i j k ( 0.052013 + v 2 i j )
M i j = 59.38025 A I H 10 i j ( 0.74094 + u i ) C C i j 1.14790
where V i j k is the growing stock volume (m3) for the k-th tree in the j-th plot within the i-th area; L H i j k is the LiDAR-derived tree height (m) for the k-th tree in the j-th plot within the i-th area; L C W i j k is the LiDAR-derived crown width (m) for the k-th tree in the j-th plot within the i-th area; M i j is the growing stock volume per hectare (m3 ha−1) for the j-th plot within the i-th area; A I H 10 i j is the 10th cumulative height percentile (m) for the j-th plot within the i-th area; C C i j is the canopy cover (proportion) for the j-th plot within the i-th area; u i is the random effect for the i-th area; and v 1 i j and v 2 i j are the random effects for the j-th plot within the i-th area.
Table 3 summarizes model evaluation results. MPE reflects estimation error at the aggregate level and is typically required below 3% or 5%, whereas MPSE measures estimation error at the individual level and is generally expected under 15% or 20%. At the tree level, all models attained R2 > 0.63, RMSE < 0.06 m3, and MPE < 1%. However, MPSE values were relatively high: the linear model exceeded 100%, while the others were all slightly above 30%. Specifically, the base model outperformed the linear model, particularly in MPSE (about one-third that of the linear model). The dummy variable model showed marginal improvement over the base model, whereas the nonlinear mixed-effects model demonstrated considerably greater enhancement, increasing R2 by over 7% relative to the base model while reducing RMSE, MPE, and MPSE. At the stand level, all models achieved R2 > 0.78, RMSE < 62 m3 ha−1, MPE < 5%, and MPSE < 20%. Here, the base and linear models performed comparably: the base model showed slight advantages in R2, RMSE, and MPE, while its MPSE was marginally higher than that of the linear model. Overall, the base model exhibited slightly superior performance. The dummy variable model exhibited marginally better performance than the base model, primarily due to a slight increase in R2, while values of all other performance measures showed negligible differences. In contrast, the nonlinear mixed-effects model delivered a marked performance boost, increasing R2 by more than 11%, reducing RMSE by over 14 m3 ha−1, decreasing MPE by more than 1 percentage point, and lowering MPSE by over 3 percentage points compared to the base model.
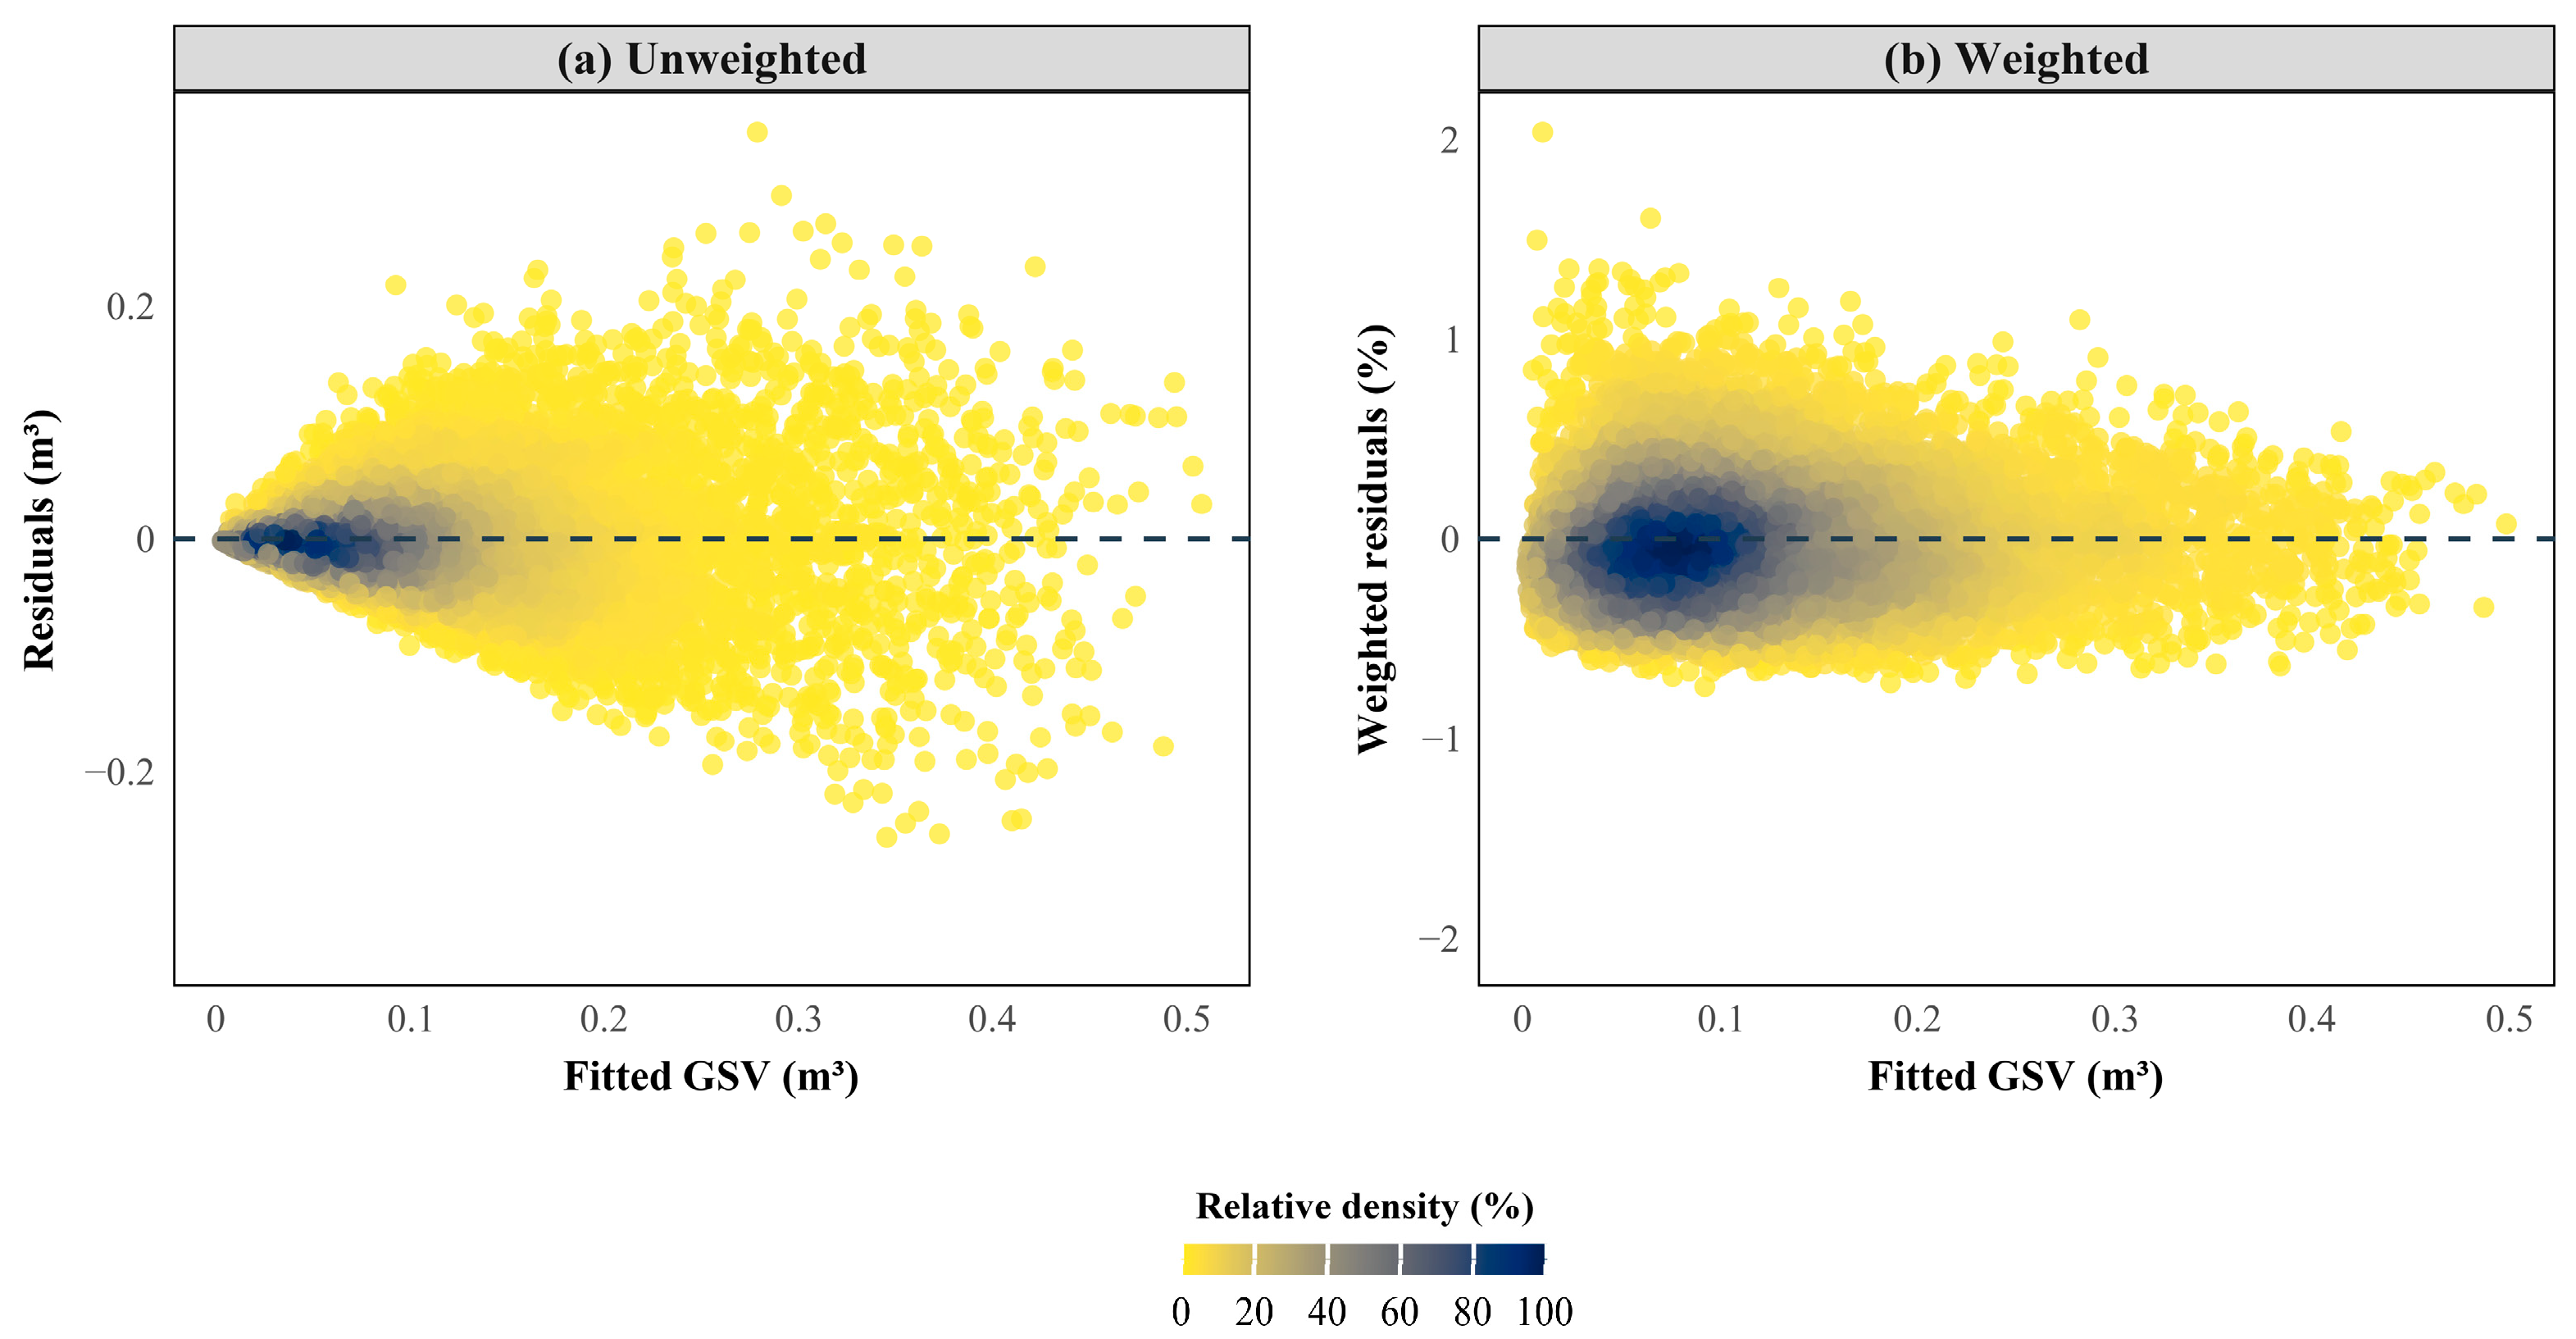
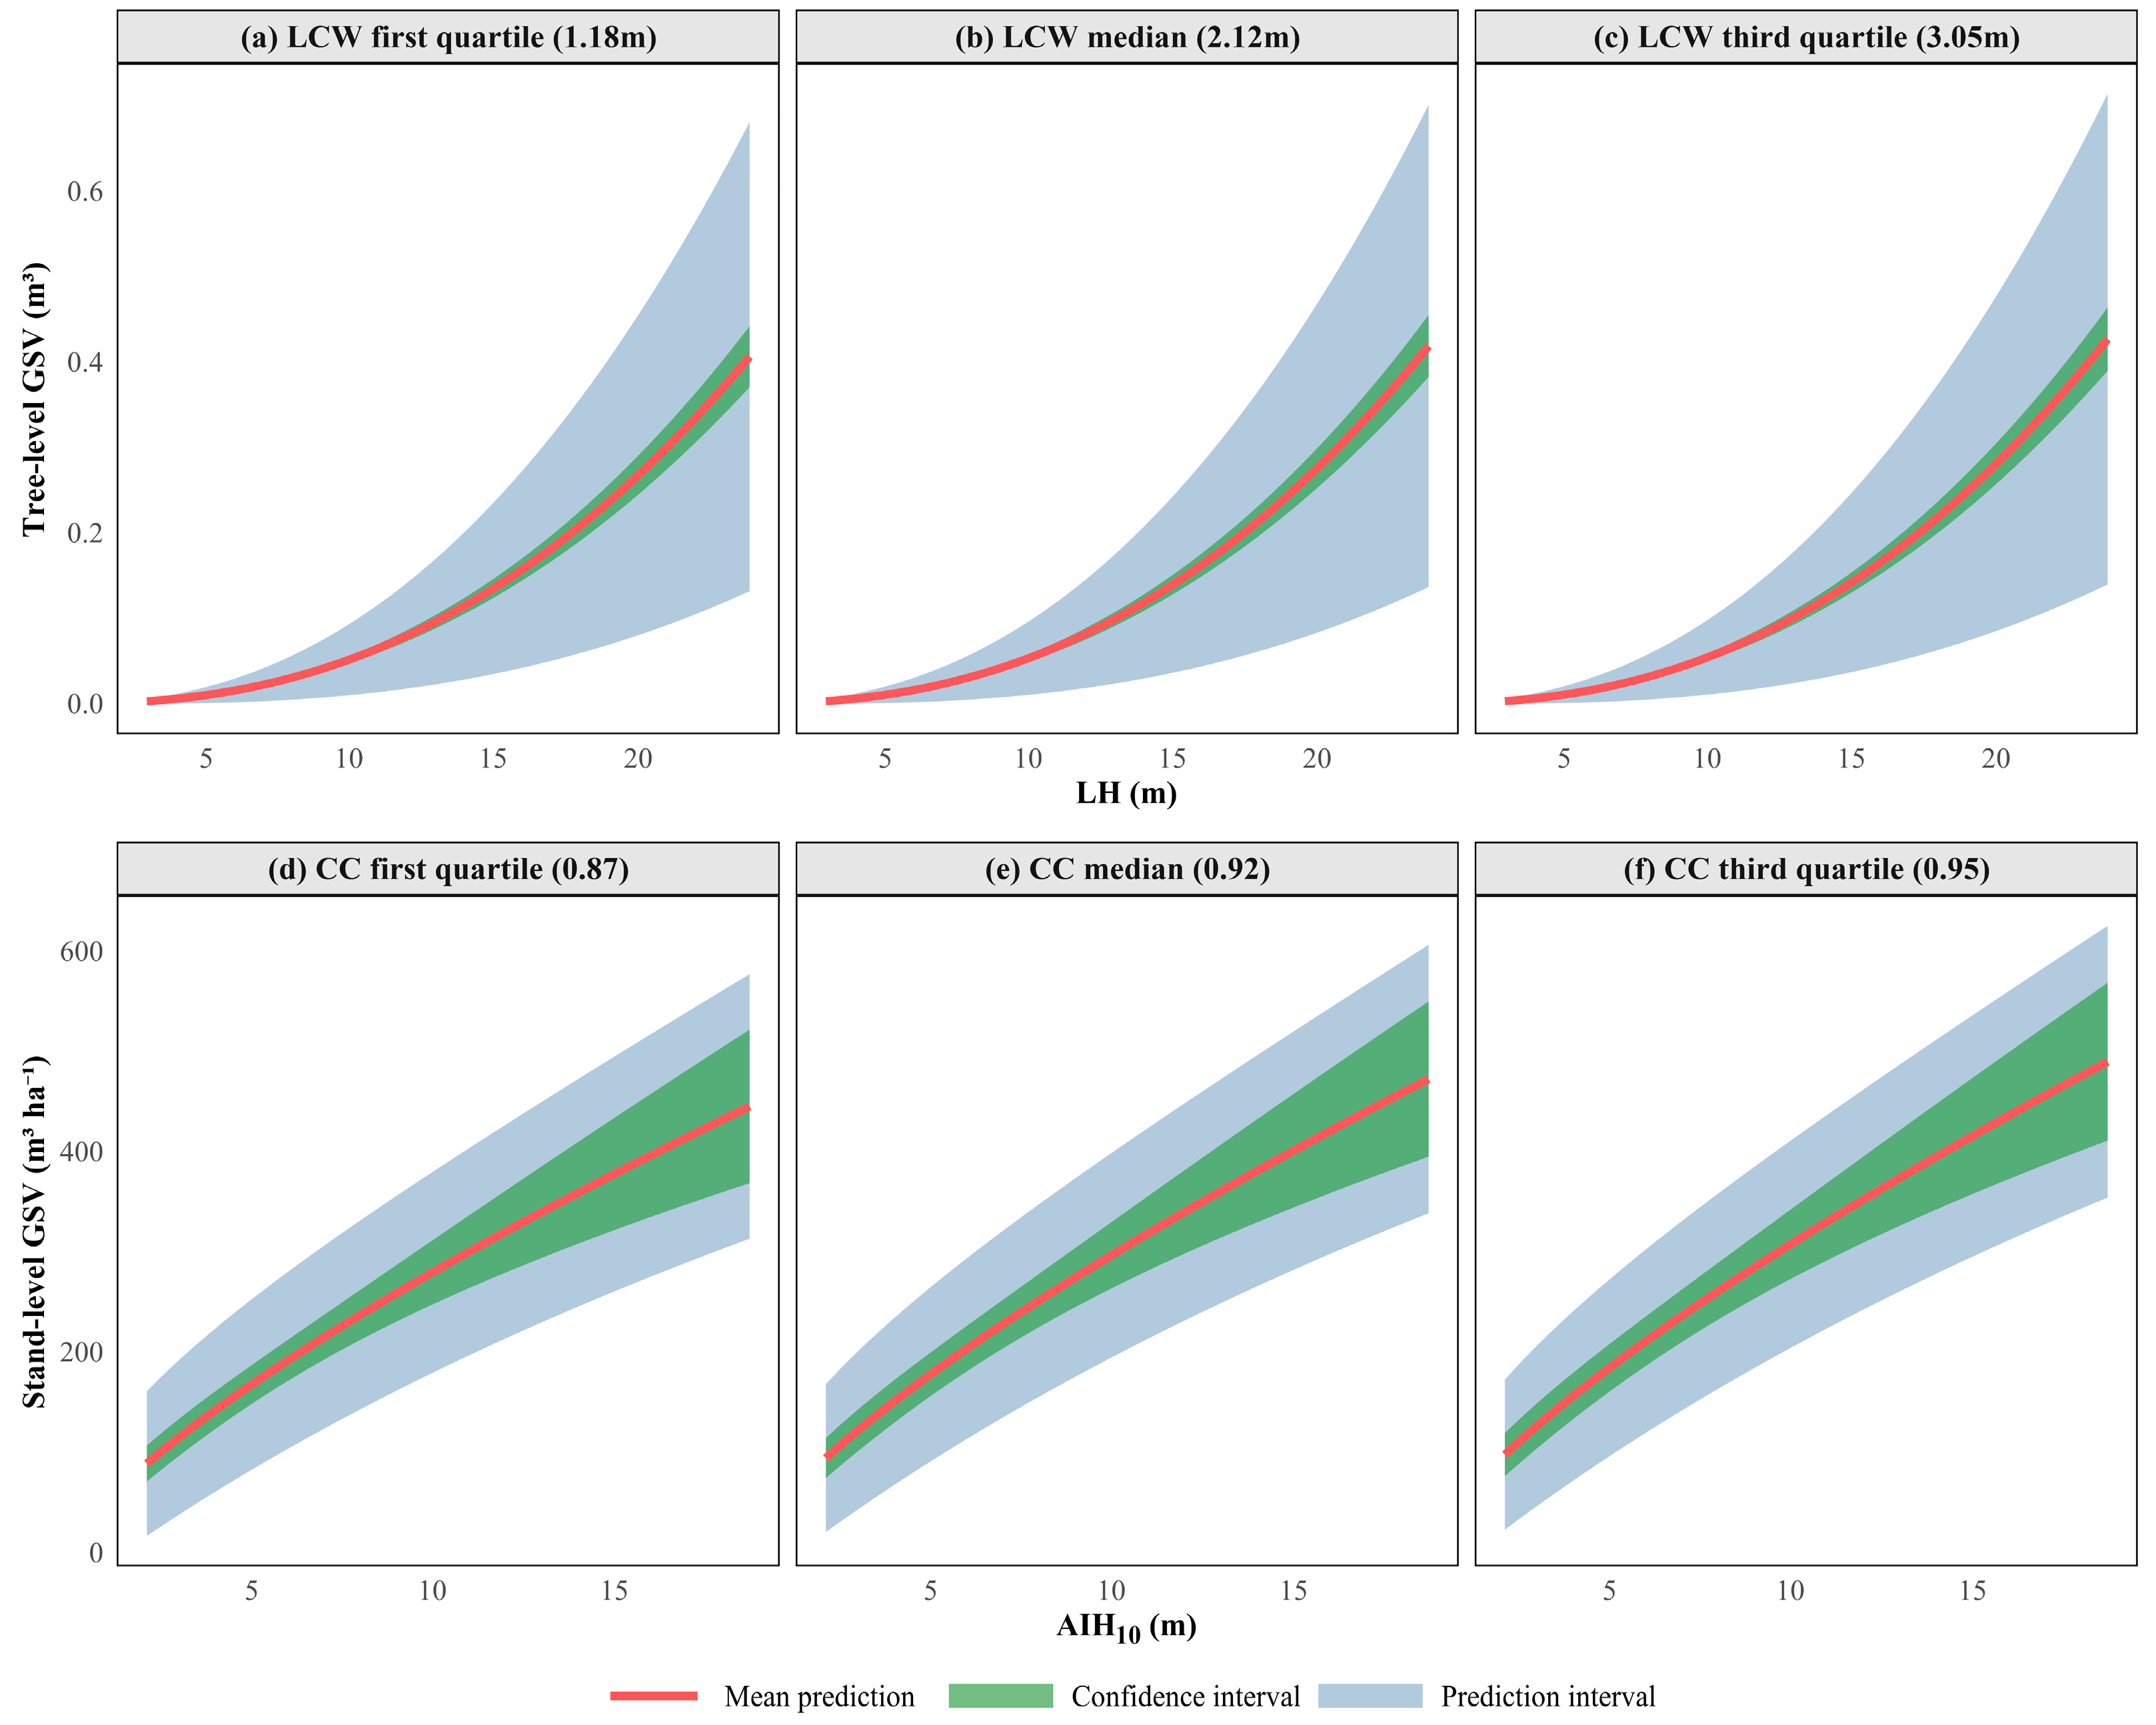
Weighted regression effectively resolved model heteroscedasticity. Using the tree-level nonlinear mixed-effects model as an example (Figure 4), residual magnitude increased with rising predicted values in the unweighted case (left panel), displaying a funnel-shaped pattern characteristic of significant heteroscedasticity. Following weighting, however, residuals were generally distributed evenly around zero (right panel), and scatter point dispersion increased, indicating that heteroscedasticity had been largely eliminated. Figure 5 displays the confidence and prediction intervals for the nonlinear mixed-effects models at the tree and stand levels. Through robust predictions of the weighted model and weight correction of the intervals, the true fluctuations in heteroscedasticity are accounted for, thereby providing more accurate uncertainty estimates.

3.3. Randomized Testing and Spatial Cross-Validation

All models were evaluated on the 30% independently held-out randomized test set (Table 4). At the tree level, results were largely consistent with those obtained on the training set. Overall, R2 showed a slight decrease, while RMSE, MPE, and MPSE exhibited minor increases (although the linear model’s MPSE decreased, it still exceeded 90%). The MPE increase was relatively more pronounced, yet its baseline value remained small (just slightly above 1%). At the stand level, R2 generally experienced a slight decline overall (though it increased marginally for the base model), while RMSE and MPSE decreased across the board (with MPSE values all below 15%). Conversely, MPE values all increased. In summary, model performance on the randomized test set was comparable to that on the training set, with values of some evaluation metrics even surpassing those on the training set, demonstrating good generalization capability.
Figure 6 presents scatter plots of predicted versus observed GSVs on the randomized test set for the tree-level and stand-level models, respectively. Model prediction accuracy is higher when the fitted line is closer to the 1:1 line (y = x) and the data points are more tightly clustered (indicated by a higher R2). At the tree level, the nonlinear mixed-effects model exhibited superior performance. Its fitted line showed the closest slope to 1 and intercept to 0, coupled with the highest R2, signifying the best predictive accuracy on the test set. The dummy variable model and the base model ranked next, with minimal differences in their performance. The linear model performed the poorest, exhibiting systematic underestimation in the higher GSV range and generating negative predictions (less than 0) in the lower GSV range. At the stand level, the nonlinear mixed-effects model again demonstrated the best performance. Its fitted line closely approximated the 1:1 line and achieved a high R2 (reaching 0.889). With the exception of one larger outlier in the higher GSV range, the remaining data points were clustered uniformly and tightly around the 1:1 line. The performances of the other three models were relatively comparable overall, and their predictive abilities were also reasonably good.
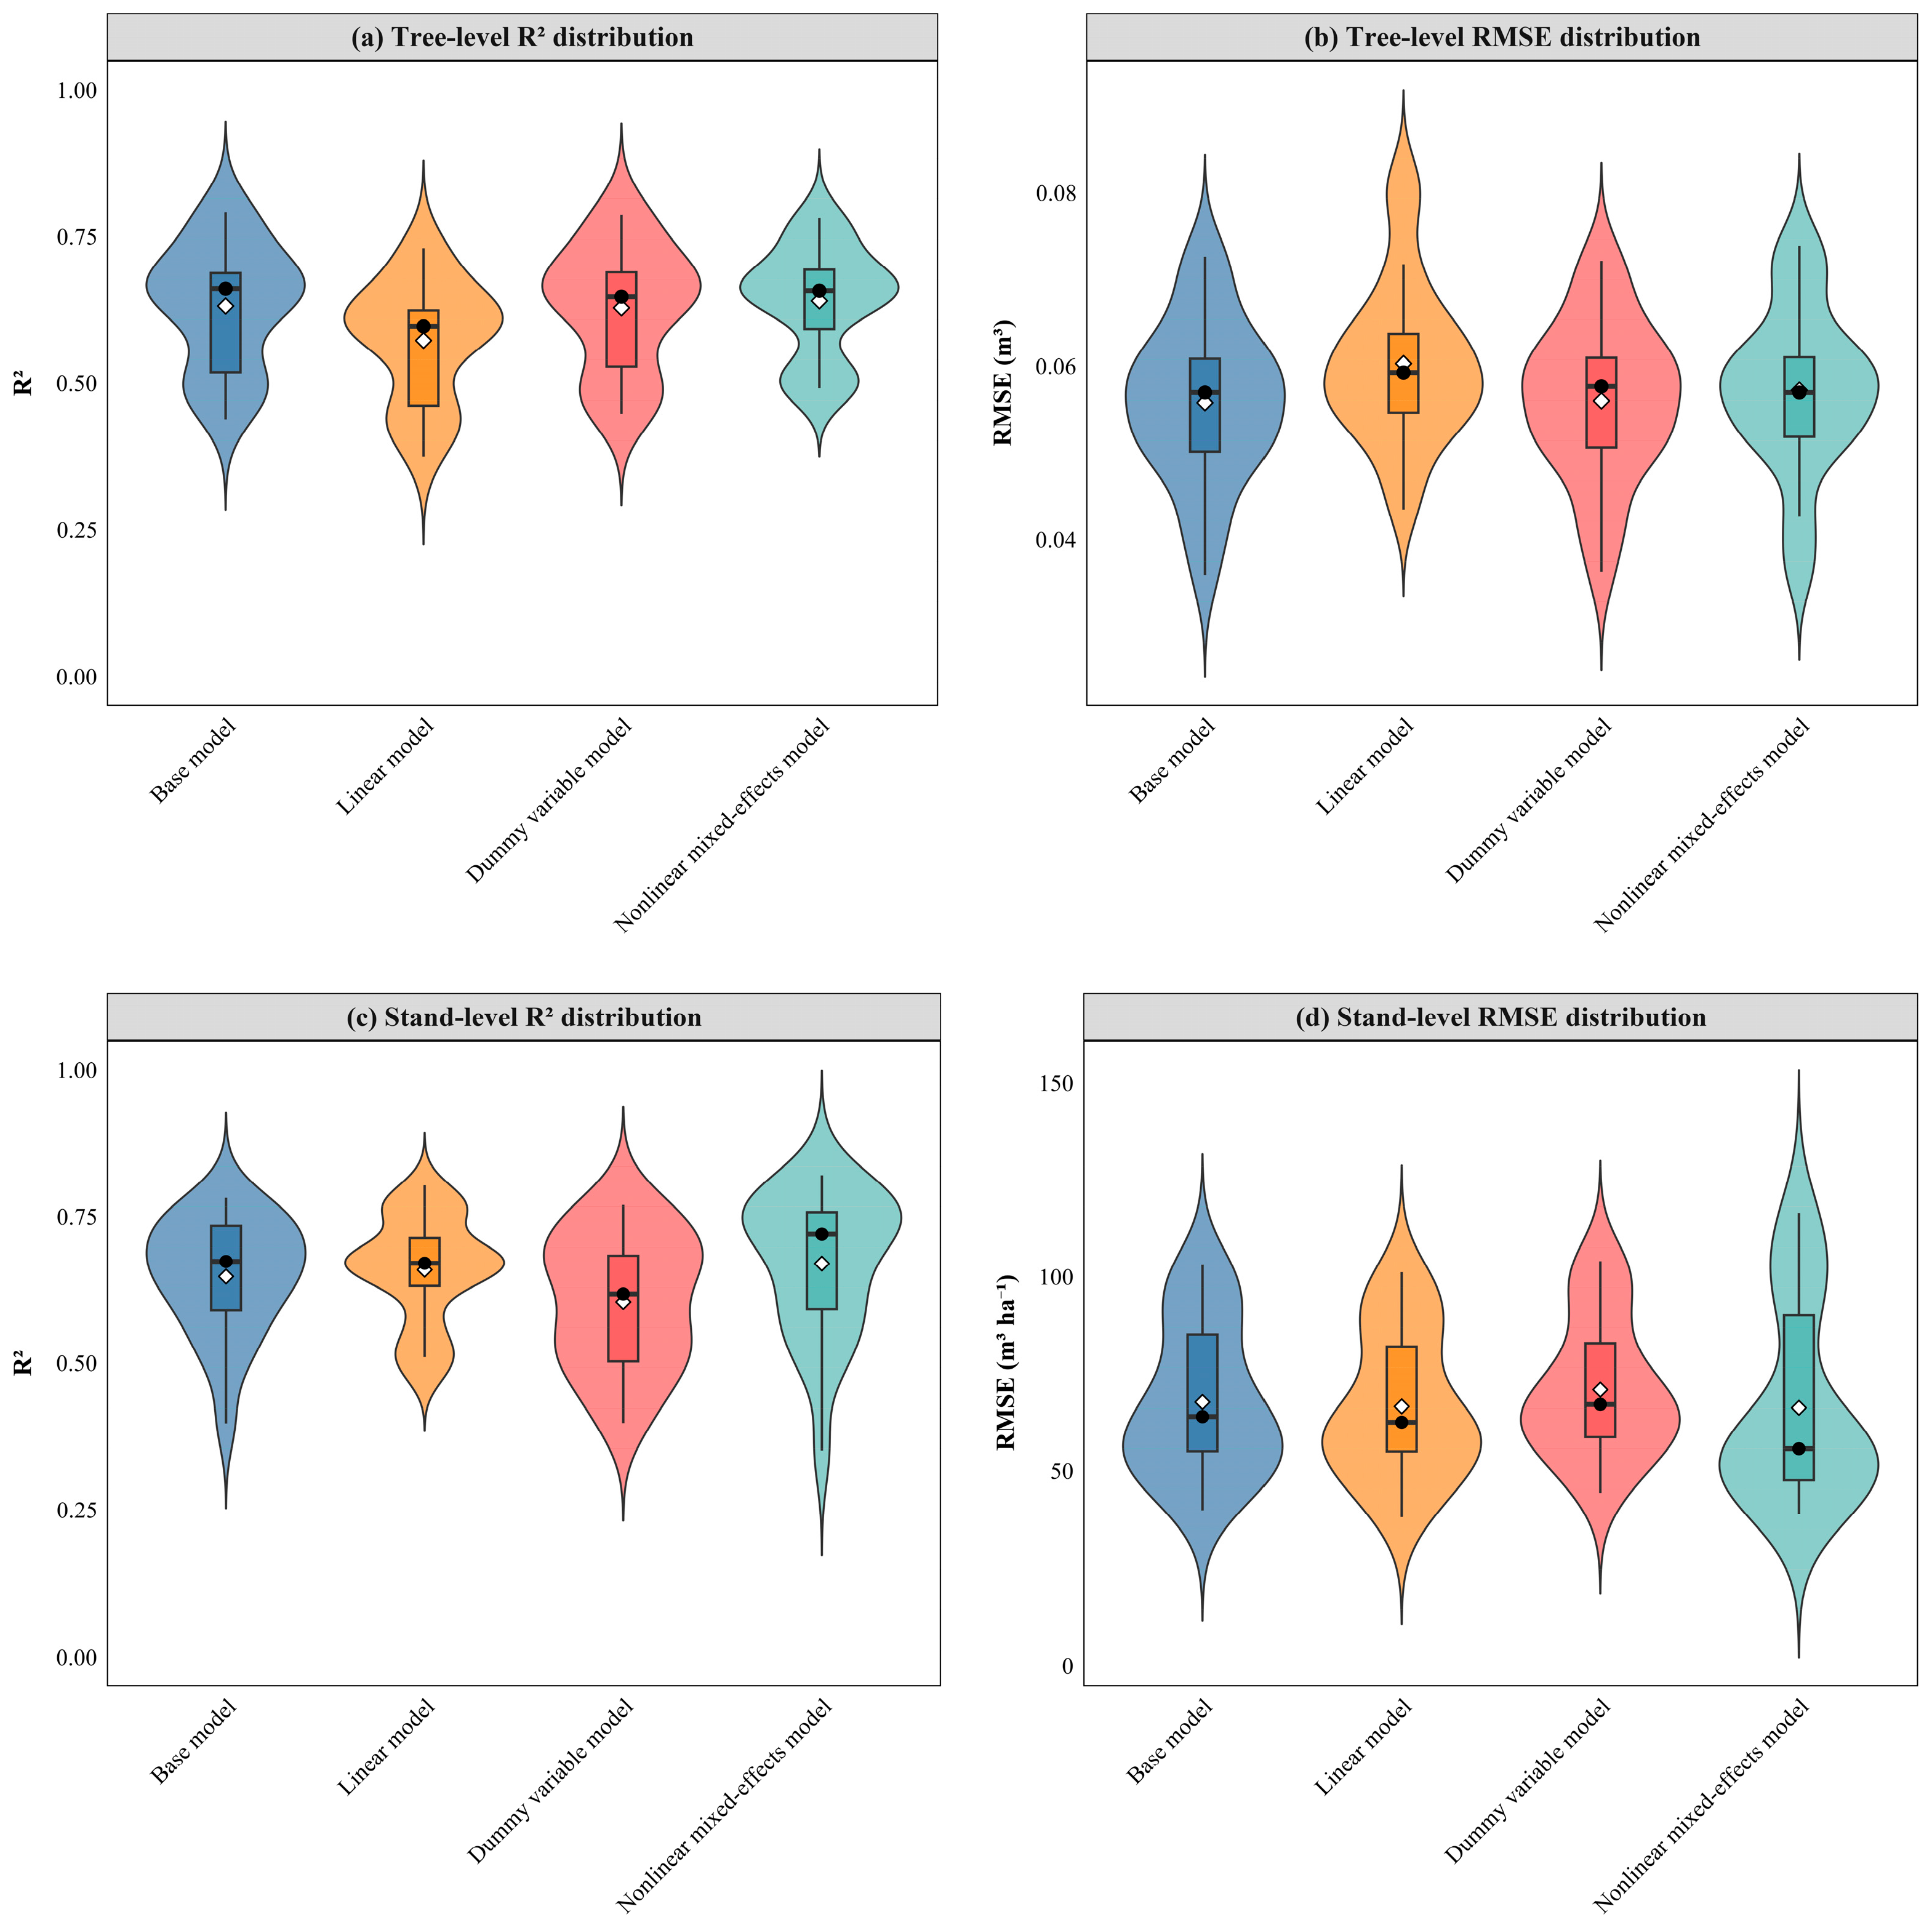
Figure 7 presents the spatial cross-validation results. At the tree level, the nonlinear mixed-effects model achieved the highest R2 (0.641 ± 0.093), with values predominantly clustered around 0.65. It was followed by the base model (0.632 ± 0.105), while the linear model demonstrated the poorest performance. In terms of RMSE, the values were generally comparable across models, except for the linear model, which exhibited a markedly higher error. A similar trend was observed at the stand level. The nonlinear mixed-effects model again yielded the highest R2 (0.670 ± 0.121), with most values distributed around 0.75. The linear model ranked second (0.659 ± 0.093), and the dummy variable model performed the worst. For RMSE, the dummy variable model showed a significantly higher value, whereas the other models displayed comparable errors.
The spatial cross-validation results were consistently inferior to the randomized test results at both levels. This discrepancy arises from the spatial autocorrelation inherent in the data, as well as the loss of sample information, which compromises model fitting quality. The strategic selection of the study area for representativeness and variability means that omitting samples from any area inevitably leads to a loss of valuable information, which limits what the models can learn from the training data. Therefore, the true performance of the models is likely bounded by the randomized test and spatial cross-validation results. Even when judged by the more conservative spatial cross-validation metrics, all models maintain reasonably good predictive performance. This indicates that the developed models possess satisfactory generalization capability and robustness, with the nonlinear mixed-effects model performing particularly well across both tree and stand levels.

4. Discussion

Tree size, primarily determined by trunk height and diameter, is the main driver of GSV. In situations where trunk diameter is difficult to acquire using UAV-LS, height variables often emerge as the primary predictor [31]. Our findings supported this view, but the relative importance of height variables varied across scales. At the tree level, LH accounted for the vast majority of the variance in GSV (allometric exponent > 2.0), while the marginal contribution of LCW was minimal. At the stand level, however, AIH10 and CC exhibited comparable explanatory power for GSV variation (allometric exponents both slightly below 1.0). This difference is primarily because stand-level GSV is influenced not only by average tree size but also by stand density [44]. CC serves as a proxy for stand density and has been used in some studies as a surrogate for stem number per unit area [45]. In contrast, tree-level GSV is solely determined by tree dimensions. LCW provides less information compared to CC; it primarily reflects photosynthetic area size, which typically influences GSV only indirectly.
In this study, the tree-level GSV models demonstrated a low MPE (less than 1%) but a high MPSE (greater than 30%). MPE represents the overall prediction error for the mean GSV within a statistical inference framework, while MPSE is the arithmetic mean of the within-sample individual prediction errors [43]. The elevated MPSE indicates substantial relative errors in the model’s predictions of GSV for individual trees, which may predominantly occur on smaller trees (as even minor absolute errors can yield large relative errors). Particularly for linear models, a negative constant term can result in negative predicted values for small trees, further amplifying the relative error. As observed in this study, despite comparable performance on other metrics, the linear model’s MPSE was three times that of the other models. Conversely, the low MPE signifies a small prediction error for the mean GSV. This implies that, although individual trees (such as small ones) may exhibit large relative errors, the prediction error for the total GSV (or mean GSV) aggregated to the stand or areal scale remains minimal. Furthermore, both MPE and MPSE for the stand-level GSV models fell within acceptable ranges. Consequently, both tree-level and stand-level models effectively meet the requirements for forest resource monitoring at areal scales. This makes UAV-LS highly valuable in subcompartment-based inventories, such as the decennial forest management inventory (FMI) conducted by forest management units or county-level administrative regions in China, which aims to generate stand-level data, including mean tree height, stand density, and total GSV within subcompartments. Traditional methods require a team of 3–5 people to carry out field measurements of various forest attributes, whereas UAV-LS can be operated by only 1–2 individuals without requiring direct on-site presence, as proximity is sufficient. A single flight can simultaneously cover multiple adjacent subcompartments, significantly reducing labor and time costs. In the context of NFI, however, the application of UAV-LS requires integration with partial field measurements or TLS. This is primarily because NFI necessitates the collection of detailed individual tree attributes, for which UAV-LS currently has limitations in detecting understory saplings and capturing key metrics such as DBH. Moreover, in broad-leaved or dense forests where tree crown apexes and boundaries are difficult to delineate, the accuracy of individual tree segmentation by UAV-LS remains limited, further increasing the omission rate.
At both the tree and stand levels, the basic model outperformed the linear model. However, the difference in performance metrics between the two models was minimal at the stand level. This is primarily because GSV exhibited near-linear relationships with both AIH10 and CC (allometric exponents were close to 1). Nevertheless, the basic model is still recommended, as the negative constant term in the linear model can lead to the biologically implausible scenario of negative predicted values, an issue effectively circumvented by the basic model.
Compared to the basic model, the dummy variable model also showed no significant performance improvement. To promote canopy closure and reduce tending costs, Chinese fir plantations in China are typically established at high initial planting densities [46]. Thinning is conducted periodically as the stand develops to reduce competition. Consequently, while the GSV per tree increases with stand age, stand density decreases over time. After reaching the near-mature or mature stage, although thinning activities diminish or cease, stand growth rates also slow down correspondingly. This dynamic may result in no significant differences in stand-level GSV across different developmental stages. At the tree level, the influence of stand age is likely already directly reflected in specific growth metrics (e.g., tree height), meaning the dummy variable for age group provides relatively little additional information. This similarly results in insignificant performance gains for the dummy variable model.
The nonlinear mixed-effects model demonstrated significant performance improvements over the base model. At the tree level, the model performed optimally when area-level random effects were incorporated for parameter a, and plot-level random effects were included for parameters b and c. Parameter a, a proportionality constant, represents the baseline GSV per unit LH and unit LCW. Parameters b and c are allometric exponents governing the scaling of GSV with increasing LH and LCW, respectively. These findings indicate that areal heterogeneity primarily manifests in baseline productivity, driven by large-scale environmental conditions such as climate and soil. For instance, trees in areas with favorable hydrothermal conditions tend to be stouter and exhibit higher GSV, representing variation unexplained by LH and LCW. Conversely, plot-level heterogeneity predominantly influences the scaling effects of LH and LCW on GSV, modulated by microtopography, microenvironment, stand density, and competition intensity. For example, in high-density or intensely competitive plots, trees may preferentially invest in height growth to compete for light, constraining radial stem growth. This ultimately reduces the proportional contribution of LH increase to GSV accumulation. It can be inferred that the random effects at both the area and plot levels can be partially explained by differences in radial stem growth. This suggests that these effects compensate, to some extent, for the absence of DBH in the LiDAR-based model. At the stand level, model performance was optimal when an area-level random effect was applied to parameter b (the allometric exponent for AIH10). This implies that areal environmental heterogeneity primarily affects the scaling effect of AIH10 on GSV, likely also attributable to areal variations in mean DBH. Numerous studies have documented significant influences of environmental factors (e.g., climate, soil, topography) on GSV (and its associated biomass and carbon stocks), and their incorporation can substantially improve models [47,48,49,50]. Our results are consistent with these findings. Areal and plot heterogeneities indirectly reflect underlying environmental gradients. Incorporating these heterogeneities into the model not only enhanced predictive capability but also, by capturing inherent random variation, conferred broader applicability and enhanced transferability. It should be noted, however, that caution should be exercised when extrapolating the models beyond their training domain, as the study was exclusively based on samples from Guangdong Province. In China, Chinese fir-producing regions are typically categorized into northern, central, and southern zones based on variations in site quality, growth patterns, and productivity [51]. Guangdong Province is situated within the southern zone, which also encompasses Guangxi Zhuang Autonomous Region, Fujian Province, Yunnan Province, as well as parts of Guizhou and Hunan provinces that border the central zone. These regions share comparable growth environments for Chinese fir and represent the primary intended areas for the application of the models developed in this study. For other regions beyond this scope, local calibration is necessary when implementing the models. As a resource for application, aerial volume tables based on the nonlinear mixed-effects models can be found in Appendix A.

5. Conclusions

This study systematically developed tree-level and stand-level Growing Stock Volume (GSV) estimation models for Chinese fir (Cunninghamia lanceolata) plantations in southern China, utilizing field-measured data from 138 plots and UAV-LS data. The models, based on LiDAR-derived metrics, included base models (allometric models) and linear models. The base models were extended by incorporating age groups to create dummy variable models. Additionally, nonlinear mixed-effects models were constructed by introducing random effects (area-level and plot-level for tree-level models; area-level only for stand-level models). Key conclusions are as follows:
(1)
At the stand level, height metrics were the most critical for accurate GSV prediction. The optimal predictor combination was the 10th cumulative height percentile (AIH10) and canopy cover (CC), exhibiting a nearly linear relationship with GSV. At the tree level, the preferred predictors were LiDAR-derived tree height (LH) and crown width (LCW), with LH accounting for the majority of the variation in GSV.
(2)
Regardless of scale (tree or stand level), the base models demonstrated superior fit and prediction accuracy compared to the linear models. The dummy variable models provided only a marginal improvement over the base models. The nonlinear mixed-effects models significantly outperformed the base models. While tree-level models exhibited larger errors for individual tree estimates, they yielded smaller errors for population-level estimates. Stand-level model prediction errors remained within acceptable limits. Consequently, both approaches are suitable for areal forest resource monitoring.
(3)
For tree-level models, the area-level random effect primarily governed the baseline GSV, while the plot-level random effect mainly affected the allometric relationship between GSV and predictors LH and LCW. At the stand level, the area-level random effect predominantly influenced the allometric relationship between GSV and AIH10.

Author Contributions

Conceptualization, Z.Y., Z.G. and J.Y.; methodology, Z.Y. and Z.G.; software, Z.G., K.S. and D.Z.; validation, Z.Y., Z.G., K.S. and D.Z.; formal analysis, Z.Y., Z.G., J.Z., X.F. and S.D.; investigation, J.Z., K.S. and X.F.; resources, Z.Y. and J.Y.; data curation, Z.G. and J.Z.; writing—original draft preparation, Z.Y. and Z.G.; writing—review and editing, J.Z., X.F., S.D. and J.Y.; visualization, Z.Y. and Z.G.; supervision, J.Y.; project administration, Z.Y. and J.Y.; funding acquisition, J.Y. All authors have read and agreed to the published version of the manuscript.

Funding

This research was funded by the Forestry Administration of Guangdong Province, via the program entitled “An airborne LiDAR-based model for estimating stand volume and aboveground biomass of major tree species in Guangdong Province” (Grant No. 2021KJCX001).

Data Availability Statement

The data that support the findings of this study are available from the authors upon reasonable request.

Acknowledgments

We thank the Research Institute of Forest Resource Information Techniques, Chinese Academy of Forestry and Nanjing Forestry University for their assistance in data processing during this study.

Conflicts of Interest

The authors declare no conflicts of interest.

Appendix A

Table A1. Aerial volume table for Chinese fir (Cunninghamia lanceolata) at the tree level, compiled from the nonlinear mixed-effects model established in this study. LH = LiDAR-derived tree height (m); LCW = LiDAR-derived crown width (m); and volume = tree-level growing stock volume (m3).
LHLCW
0.20.40.60.81.01.21.41.61.82.02.2
20.001060.001090.001120.001130.001150.001160.001170.001180.001180.001190.00120
30.002750.002850.002910.002960.002990.003020.003040.003070.003080.003100.00312
40.005430.005630.005750.005840.005900.005960.006010.006050.006090.006120.00615
50.009200.009540.009740.009890.010010.010100.010180.010250.010320.010370.01042
60.014160.014680.014990.015220.015390.015540.015670.015780.015870.015960.01604
70.020380.021130.021580.021900.022160.022370.022550.022710.022850.022970.02309
80.027940.028970.029590.030030.030380.030670.030920.031130.031330.031500.03165
90.036910.038270.039080.039670.040130.040520.040840.041130.041380.041610.04181
100.047350.049090.050130.050890.051480.051970.052390.052760.053080.053370.05364
110.059310.061490.062800.063750.064490.065100.065630.066090.066490.066860.06719
120.072850.075530.077140.078300.079210.079970.080610.081170.081670.082120.08253
130.088020.091250.093200.094600.095710.096620.097400.098080.098680.099220.09972
140.104870.108720.111040.112710.114030.115120.116040.116850.117570.118220.11880
150.123450.127980.130700.132670.134220.135500.136590.137550.138390.139150.13984
160.143790.149060.152240.154540.156340.157830.159100.160210.161190.162080.16289
170.165940.172030.175690.178340.180420.182140.183610.184890.186030.187050.18798
180.189940.196910.201110.204140.206520.208490.210170.211630.212930.214100.21517
190.215830.223750.228520.231960.234670.236910.238810.240480.241960.243280.24449
200.243640.252580.257970.261860.264910.267440.269590.271470.273140.274640.27600
210.273420.283460.289500.293860.297290.300120.302540.304650.306520.308210.30974
220.305190.316400.323140.328010.331840.335000.337700.340050.342140.344020.34573
230.339000.351440.358940.364350.368600.372110.375110.377720.380040.382130.38403
240.374870.388630.396920.402900.407600.411490.414800.417690.420260.422570.42467
250.412840.428000.437120.443710.448890.453160.456810.460000.462820.465370.46768
Table A2. Aerial volume table for Chinese fir (Cunninghamia lanceolata) at the stand level, compiled from the nonlinear mixed-effects model established in this study. AIH10 = 10th cumulative height percentile (m); CC = canopy cover (proportion); and volume = stand-level growing stock volume (m3 ha−1).
AIH10CC
0.300.350.400.450.500.550.600.650.700.750.800.85
224.9229.7434.6739.6844.7949.9655.2160.5265.9071.3376.8182.35
333.6540.1646.8153.5960.4867.4774.5681.7388.9996.33103.73111.21
441.6449.7057.9366.3274.8583.5092.27101.15110.13119.21128.38137.63
549.1358.6468.3578.2588.3098.51108.86119.34129.93140.64151.46162.37
656.2367.1278.2489.56101.08112.76124.61136.60148.73160.99173.37185.86
763.0475.2487.70100.40113.31126.41139.68153.13166.72180.46194.34208.35
869.5983.0696.82110.84125.09139.55154.21169.05184.06199.23214.55230.02
975.9490.64105.65120.95136.50152.28168.27184.47200.85217.40234.12250.99
1082.1098.00114.23130.77147.58164.64181.94199.45217.16235.05253.13271.37
1188.11105.17122.59140.34158.38176.69195.25214.04233.04252.25271.65291.23
1293.98112.17130.75149.68168.93188.46208.25228.29248.56269.05289.74310.62
1399.72119.03138.74158.83179.25199.97220.98242.24263.75285.49307.44329.60
14105.35125.74146.57167.79189.37211.26233.45255.92278.64301.60324.80348.20
15110.88132.34154.26176.59199.30222.34245.69269.34293.25317.42341.83366.47
16116.31138.82161.82185.24209.06233.23257.73282.53307.62332.97358.57384.42
17121.65145.20169.25193.76218.66243.95269.57295.51321.75348.27375.05402.08
18126.91151.48176.57202.14228.12254.50281.23308.30335.67363.33391.27419.47
19132.10157.67183.79210.40237.45264.90292.73320.90349.39378.19407.27436.62
20137.22163.78190.91218.55246.65275.16304.07333.33362.92392.83423.04453.53
21142.27169.81197.94226.59255.73285.29315.26345.60376.28407.30438.62470.23
22147.26175.76204.88234.54264.69295.30326.31357.72389.48421.58454.00486.72
23152.19181.65211.74242.39273.56305.18337.24369.70402.52435.70469.20503.01
24157.07187.47218.52250.16282.32314.96348.05381.54415.42449.65484.23519.13
25161.89193.23225.24257.84290.99324.63358.73393.26428.17463.46499.10535.07

References

  1. Fang, J.; Chen, A.; Peng, C.; Zhao, S.; Ci, L. Changes in forest biomass carbon storage in China between 1949 and 1998. Science 2001, 292, 2320–2322. [Google Scholar] [CrossRef] [PubMed]
  2. Li, H.; Zhao, P.; Lei, Y.; Zeng, W. Comparison on estimation of wood biomass using forest inventory data. Sci. Silv. Sin. 2012, 48, 44–52. [Google Scholar]
  3. IPCC (Intergovernmental Panel on Climate Change). 2006 IPCC Guidelines for National Greenhouse Gas Inventories; Institute for Global Environmental Strategies: Kanagawa, Japan, 2006. [Google Scholar]
  4. Gschwantner, T.; Alberdi, I.; Bauwens, S.; Bender, S.; Borota, D.; Bosela, M.; Bouriaud, O.; Breidenbach, J.; Donis, J.; Fischer, C.; et al. Growing stock monitoring by European National Forest Inventories: Historical origins, current methods and harmonisation. For. Ecol. Manag. 2022, 505, 119868. [Google Scholar] [CrossRef]
  5. Coops, N.C.; Tompalski, P.; Goodbody, T.R.H.; Queinnec, M.; Luther, J.E.; Bolton, D.K.; White, J.C.; Wulder, M.A.; van Lier, O.R.; Hermosilla, T. Modelling lidar-derived estimates of forest attributes over space and time: A review of approaches and future trends. Remote Sens. Environ. 2021, 260, 112477. [Google Scholar] [CrossRef]
  6. Ye, Y.; Coops, N.C.; Wulder, M.A.; Hermosilla, T. A multi-resolution forest stand segmentation algorithm integrating Landsat imagery and forest structural, age, and species attributes. ISPRS J. Photogramm. Remote Sens. 2025, 226, 381–395. [Google Scholar] [CrossRef]
  7. Zhou, M.; Li, C.A.; Li, Z. Extraction of individual tree attributes using ultra-high-density point clouds acquired by low-cost UAV-LiDAR in Eucalyptus plantations. Ann. For. Sci. 2025, 82, 20. [Google Scholar] [CrossRef]
  8. Hu, Y.; Sun, R.; He, M.; Zhao, J.; Li, Y.; Huang, S.; Zhang, J. Estimating spatiotemporal dynamics of carbon storage in Roinia pseudoacacia plantations in the Caijiachuan Watershed using sample plots and uncrewed aerial vehicle-borne laser scanning data. Remote Sens. 2025, 17, 1365. [Google Scholar] [CrossRef]
  9. Lei, L.T.; Chai, G.Q.; Yao, Z.Q.; Li, Y.B.; Jia, X.; Zhang, X.L. A novel self-similarity cluster grouping approach for individual tree crown segmentation using multi-features from UAV-based LiDAR and multi-angle photogrammetry data. Remote Sens. Environ. 2025, 318, 114588. [Google Scholar] [CrossRef]
  10. Mermoz, S.; Réjou-Méchain, M.; Villard, L.; Le Loan, T.; Rossi, V.; Gourlet-Fleury, S. Decrease of L-band SAR backscatter with biomass of dense forests. Remote Sens. Environ. 2015, 159, 307–317. [Google Scholar] [CrossRef]
  11. Joshi, N.; Mitchard, E.T.A.; Brolly, M.; Schumacher, J.; Fernández-Landa, A.; Johannsen, V.K.; Marchamalo, M.; Fensholt, R. Understanding ‘saturation’ of radar signals over forests. Sci. Rep. 2017, 7, 3505. [Google Scholar] [CrossRef]
  12. Oehmcke, S.; Li, L.; Trepekli, K.; Revenga, J.C.; Nord-Larsen, T.; Gieseke, F.; Igel, C. Deep point cloud regression for above-ground forest biomass estimation from airborne LiDAR. Remote Sens. Environ. 2024, 302, 113968. [Google Scholar] [CrossRef]
  13. Borsah, A.A.; Nazeer, M.; Wong, M.S. LiDAR-based forest biomass remote sensing: A review of metrics, methods, and assessment criteria for the selection of allometric equations. Forests 2023, 14, 2095. [Google Scholar] [CrossRef]
  14. Beland, M.; Parker, G.; Sparrow, B.; Harding, D.; Chasmer, L.; Phinn, S.; Antonarakis, A.; Strahler, A. On promoting the use of lidar systems in forest ecosystem research. For. Ecol. Manag. 2019, 450, 117484. [Google Scholar] [CrossRef]
  15. Li, Z.; Liu, Q.; Pang, Y. Review on forest parameters inversion using LiDAR. J. Remote Sens. 2016, 20, 1138–1150. [Google Scholar] [CrossRef]
  16. Guo, Q.; Liu, J.; Tao, S.; Xue, B.; Li, L.; Xu, G.; Li, W.; Wu, F.; Li, Y.; CHen, L.; et al. Perspectives and prospects of LiDAR in forest ecosystem monitoring and modeling. Chin. Sci. Bull. 2014, 59, 459–478. [Google Scholar] [CrossRef]
  17. Puliti, S.; Breidenbach, J.; Astrup, R. Estimation of forest growing stock volume with UAV laser scanning data: Can it be done without field data? Remote Sens. 2020, 12, 1245. [Google Scholar] [CrossRef]
  18. Xu, D.D.; Wang, H.B.; Xu, W.X.; Luan, Z.Q.; Xu, X. LiDAR applications to estimate forest biomass at individual tree scale: Opportunities, challenges and future perspectives. Forests 2021, 12, 550. [Google Scholar] [CrossRef]
  19. Xu, Q.; Man, A.; Fredrickson, M.; Hou, Z.Y.; Pitkänen, J.; Wing, B.; Ramirez, C.; Li, B.; Greenberg, J.A. Quantification of uncertainty in aboveground biomass estimates derived from small-footprint airborne LiDAR. Remote Sens. Environ. 2018, 216, 514–528. [Google Scholar] [CrossRef]
  20. Fu, L.Y.; Liu, Q.W.; Sun, H.; Wang, Q.Y.; Li, Z.Y.; Chen, E.X.; Pang, Y.; Song, X.Y.; Wang, G.X. Development of a system of compatible individual tree diameter and aboveground biomass prediction models using error-in-variable regression and airborne LiDAR data. Remote Sens. 2018, 10, 325. [Google Scholar] [CrossRef]
  21. Salas, C.; Ene, L.; Gregoire, T.G.; Naesset, E.; Gobakken, T. Modelling tree diameter from airborne laser scanning derived variables: A comparison of spatial statistical models. Remote Sens. Environ. 2010, 114, 1277–1285. [Google Scholar] [CrossRef]
  22. Novotny, J.; Navrátilová, B.; Janoutová, R.; Oulehle, F.; Homolová, L. Influence of site-specific conditions on estimation of forest above ground biomass from airborne laser scanning. Forests 2020, 11, 268. [Google Scholar] [CrossRef]
  23. Popescu, S.C. Estimating biomass of individual pine trees using airborne lidar. Biomass Bioenergy 2007, 31, 646–655. [Google Scholar] [CrossRef]
  24. Gao, S.; Zhang, Z.N.; Cao, L. Individual tree structural parameter extraction and volume table creation based on near-field LiDAR data: A case study in a subtropical planted forest. Sensors 2021, 21, 8162. [Google Scholar] [CrossRef] [PubMed]
  25. Lee, Y.; Lee, J. Advancing stem volume estimation using multi-platform LiDAR and taper model integration for precision forestry. Remote Sens. 2025, 17, 785. [Google Scholar] [CrossRef]
  26. Bornand, A.; Rehush, N.; Morsdorf, F.; Thürig, E.; Abegg, M. Individual tree volume estimation with terrestrial laser scanning: Evaluating reconstructive and allometric approaches. Agric. For. Meteorol. 2023, 341, 109654. [Google Scholar] [CrossRef]
  27. Zeng, W.; Sun, X.; Wang, L.; Wang, W.; Pu, Y. Development of forest stand volume models based on airborne laser scanning data. Sci. Silv. Sin. 2021, 57, 31–38. [Google Scholar]
  28. Garcia-Gutierrez, J.; Gonzalez-Ferreiro, E.; Riquelme-Santos, J.C.; Miranda, D.; Dieguez-Aranda, U.; Navarro-Cerrillo, R.M. Evolutionary feature selection to estimate forest stand variables using LiDAR. Int. J. Appl. Earth Observ. Geoinf. 2014, 26, 119–131. [Google Scholar] [CrossRef]
  29. García-Gutiérrez, J.; Martínez-Alvarez, F.; Troncoso, A.; Riquelme, J.C. A comparison of machine learning regression techniques for LiDAR-derived estimation of forest variables. Neurocomputing 2015, 167, 24–31. [Google Scholar] [CrossRef]
  30. Xu, C.; Manley, B.; Morgenroth, J. Evaluation of modelling approaches in predicting forest volume and stand age for small-scale plantation forests in New Zealand with RapidEye and LiDAR. Int. J. Appl. Earth Observ. Geoinf. 2018, 73, 386–396. [Google Scholar] [CrossRef]
  31. Leite, R.V.; do Amaral, C.H.; Pires, R.D.; Silva, C.A.; Soares, C.P.B.; Macedo, R.P.; da Silva, A.A.L.; Broadbent, E.N.; Mohan, M.; Leite, H.G. Estimating stem volume in Eucalyptus plantations using airborne LiDAR: A comparison of area- and individual tree-based approaches. Remote Sens. 2020, 12, 1513. [Google Scholar] [CrossRef]
  32. Liu, K.; Shen, X.; Cao, L.; Wang, G.B.; Cao, F.L. Estimating forest structural attributes using UAV-LiDAR data in Ginkgo plantations. ISPRS J. Photogramm. Remote Sens. 2018, 146, 465–482. [Google Scholar] [CrossRef]
  33. Yu, S.H.; Chen, X.Y.; Huang, X.; Chen, Y.C.; Hu, Z.Y.; Liu, J.; Yu, K.Y. Research on the estimation of Chinese fir stand volume based on UAV-LiDAR technology. Forests 2023, 14, 1252. [Google Scholar] [CrossRef]
  34. Zhou, X.S.; Ma, K.S.; Sun, H.; Li, C.K.; Wang, Y.H. Estimation of forest stand volume in coniferous plantation from individual tree segmentation aspect using UAV-LiDAR. Remote Sens. 2024, 16, 2736. [Google Scholar] [CrossRef]
  35. Li, C.A.; Lin, X.; Dai, H.B.; Li, Z.; Zhou, M. Effects of plot size on airborne LiDAR-derived metrics and predicted model performances of subtropical planted forest attributes. Forests 2022, 13, 2124. [Google Scholar] [CrossRef]
  36. Li, C.A.; Yu, Z.; Zhou, X.B.; Zhou, M.; Li, Z. Using the error-in-variable simultaneous equations approach to construct compatible estimation models of forest inventory attributes based on airborne LiDAR. Forests 2023, 14, 65. [Google Scholar] [CrossRef]
  37. Yuen, J.Q.; Fung, T.; Ziegler, A.D. Review of allometric equations for major land covers in SE Asia: Uncertainty and implications for above- and below-ground carbon estimates. For. Ecol. Manag. 2016, 360, 323–340. [Google Scholar] [CrossRef]
  38. Sileshi, G.W. A critical review of forest biomass estimation models, common mistakes and corrective measures. For. Ecol. Manag. 2014, 329, 237–254. [Google Scholar] [CrossRef]
  39. Chave, J.; Réjou-Méchain, M.; Búrquez, A.; Chidumayo, E.; Colgan, M.S.; Delitti, W.B.C.; Duque, A.; Eid, T.; Fearnside, P.M.; Goodman, R.C.; et al. Improved allometric models to estimate the aboveground biomass of tropical trees. Glob. Change Biol. 2014, 20, 3177–3190. [Google Scholar] [CrossRef]
  40. Tang, S.; Lang, K.; Li, H. Statistics and Computation of Biomathematical Models (ForStat Course); Science Press: Beijing, China, 2008. [Google Scholar]
  41. Fu, L.; Tang, S. A general formulation of nonlinear mixed effect models and its application. Sci. Sin. Math. 2020, 50, 15–30. [Google Scholar] [CrossRef]
  42. Zeng, W. Comparison of different weight functions in weighted regression. For. Grassl. Resour. Res. 2013, 40, 55–61. [Google Scholar]
  43. Zeng, W.; Tang, S. Evaluation and precision analysis of tree biomass equations. Sci. Silv. Sin. 2011, 47, 106–113. [Google Scholar]
  44. Wang, Y.L.; Kershaw, J.A.; Ducey, M.J.; Sun, Y.; McCarter, J.B. What diameter? What height? Influence of measures of average tree size on area-based allometric volume relationships. For. Ecosyst. 2024, 11, 100171. [Google Scholar] [CrossRef]
  45. Balenovic, I.; Milas, A.S.; Marjanovic, H. A comparison of stand-level volume estimates from image-based canopy height models of different spatial resolutions. Remote Sens. 2017, 9, 205. [Google Scholar] [CrossRef]
  46. Zhao, S.; Wang, R.; Liu, K.; Dong, K.; Gong, Y.; Zhang, B.; Zhou, Y. Effects of thinning on growth and understory vegetation diversity of Chinese fir plantation at different ages. J. Cent. South Univ. For. Technol. 2020, 40, 34–43+82. [Google Scholar]
  47. Tian, H.L.; Zhu, J.H.; He, X.; Chen, X.Y.; Jian, Z.J.; Li, C.Y.; Ou, Q.X.; Li, Q.; Huang, G.S.; Liu, C.F.; et al. Using machine learning algorithms to estimate stand volume growth of Larix and Quercus forests based on national-scale forest inventory data in China. For. Ecosyst. 2022, 9, 100037. [Google Scholar] [CrossRef]
  48. Mensah, A.A.; Holmström, E.; Nyström, K.; Nilsson, U. Modelling potential yield capacity in conifers using Swedish long-term experiments. For. Ecol. Manag. 2022, 512, 120162. [Google Scholar] [CrossRef]
  49. Tang, X.L.; Zhao, X.; Bai, Y.F.; Tang, Z.Y.; Wang, W.T.; Zhao, Y.C.; Wan, H.W.; Xie, Z.Q.; Shi, X.Z.; Wu, B.F.; et al. Carbon pools in China’s terrestrial ecosystems: New estimates based on an intensive field survey. Proc. Natl. Acad. Sci. USA 2018, 115, 4021–4026. [Google Scholar] [CrossRef]
  50. Sullivan, M.J.P.; Lewis, S.L.; Affum-Baffoe, K.; Castilho, C.; Costa, F.; Sanchez, A.C.; Ewango, C.E.N.; Hubau, W.; Marimon, B.; Monteagudo-Mendoza, A.; et al. Long-term thermal sensitivity of Earth’s tropical forests. Science 2020, 368, 869–874. [Google Scholar] [CrossRef]
  51. Tong, S.; Liu, J. Management Table and Optimal Density Control of Chinese Fir Forest; China Forestry Press: Beijing, China, 2019. [Google Scholar]
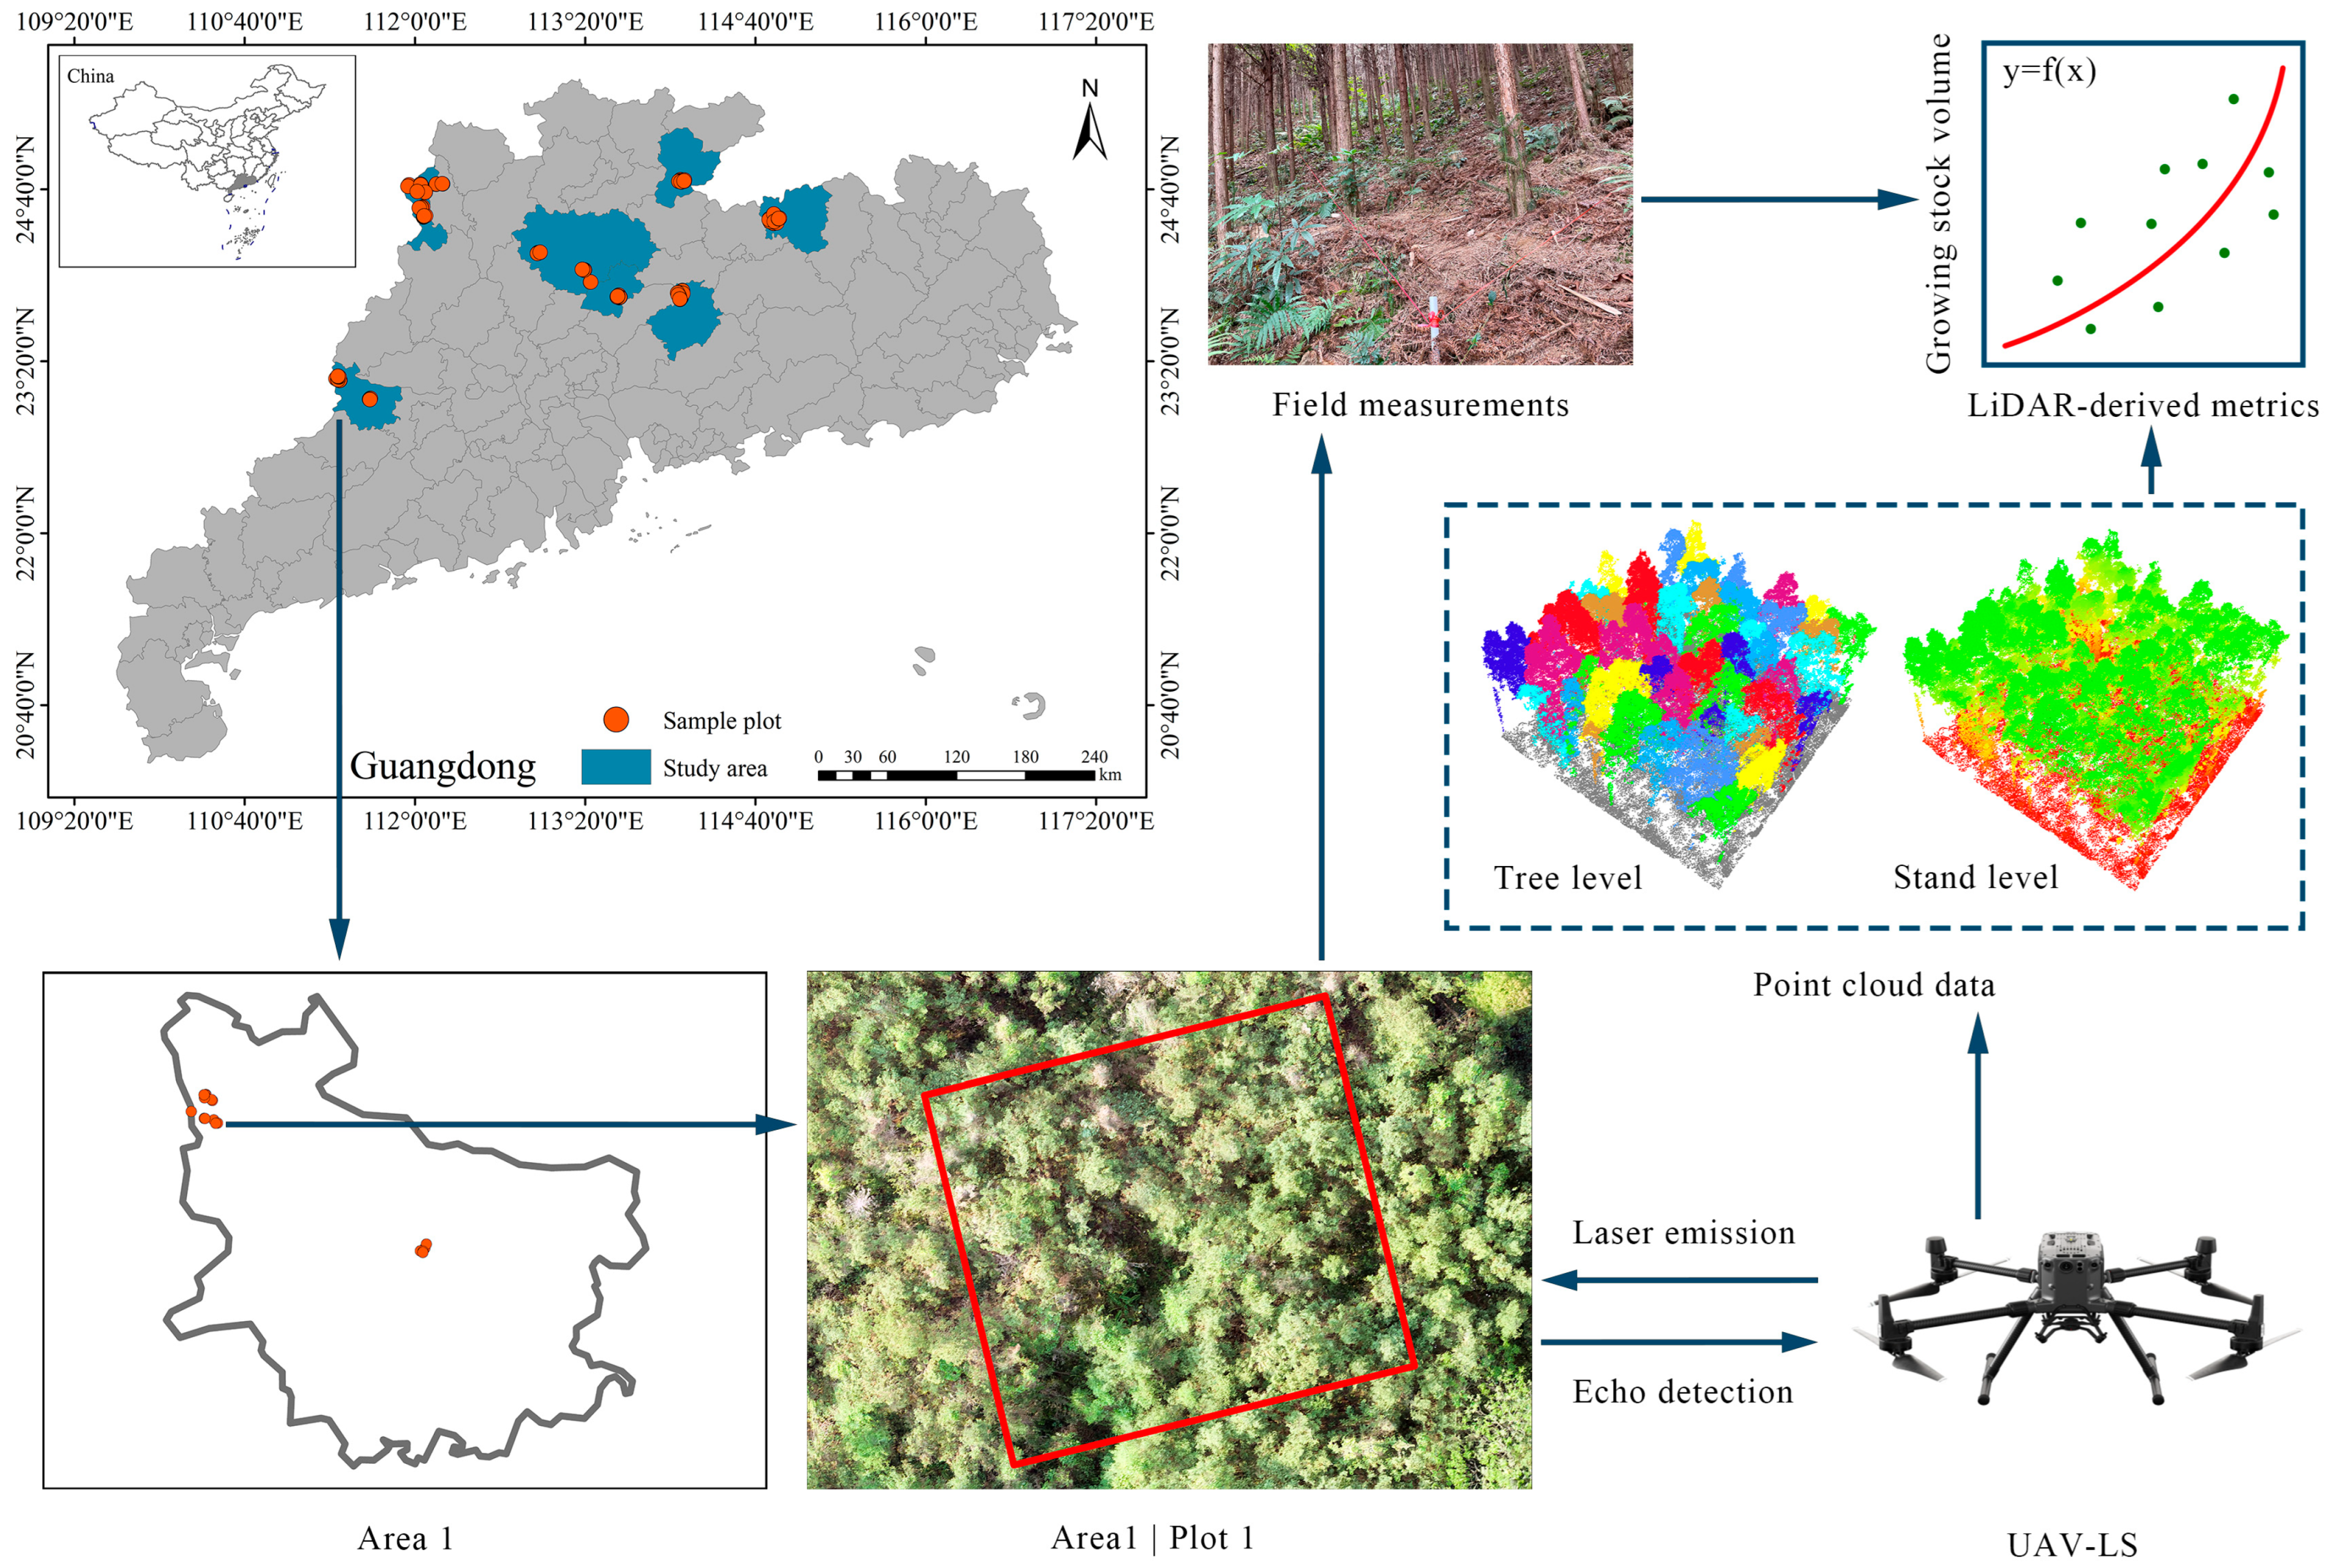
Figure 1. Study Area, plot distribution, and technical flowchart.
Forests 16 01779 g001
Figure 2. Variable importance ranking of point cloud features for growing stock volume estimation using percentage increase in mean squared error (%IncMSE). AIHi = i-th cumulative height percentile (i = 1, 5, 10, …, 95, 99); Hi = i-th height percentile (i = 1, 5, 10, …, 95, 99); Hkurtosis = height kurtosis; Hmean = mean height; Hsms = root mean square of height; Hcmc = cubic mean of height; D4 = density metrics 4; Icv = coefficient of variation of intensity; CC = canopy cover; and GF = gap fraction.
Forests 16 01779 g002
Figure 3. Selection of random effects structures for parameters a, b, and c in allometric equations at tree ( V = a L H b L C W c ) and stand ( M = a A I H 10 b C C c ) levels using Akaike (AIC) and Bayesian (BIC) information criteria, presenting successfully converged results only. ΔAIC = AIC difference between the candidate model and the best model (i.e., the one with the smallest AIC); ΔBIC = BIC difference between the candidate model and the best model (i.e., the one with the smallest BIC); V = tree-level growing stock volume; LH = LiDAR-derived tree height; LCW = LiDAR-derived crown width; M = stand-level growing stock volume; A I H 10 = 10th cumulative height percentile; and CC = canopy cover.
Forests 16 01779 g003
Figure 4. Residual distributions of the tree-level nonlinear mixed-effects model for growing stock volume (GSV) before and after weighting.
Forests 16 01779 g004
Figure 5. Confidence and prediction intervals for the nonlinear mixed-effects models at tree and stand levels. GSV = growing stock volume; LH = LiDAR-derived tree height; LCW = LiDAR-derived crown width; AIH10 = 10th cumulative height percentile; and CC = canopy cover.
Forests 16 01779 g005
Figure 6. Predictive performance of growing stock volume (GSV) models at tree and stand levels on the randomized test set, with fitted regressions (red solid lines) and 1:1 references (green dashed lines).
Forests 16 01779 g006
Figure 7. Results of spatial cross-validation at tree and stand levels.
Forests 16 01779 g007
Table 1. Summary statistics for the research variables. LH = LiDAR-derived tree height; LCW = LiDAR-derived crown width; AIH10 = 10th cumulative height percentile; CC = canopy cover; and GSV = growing stock volume.
LevelVariablesTraining SetTest Set
MinMeanMaxStdMinMeanMaxStd
Tree levelLH (cm)2.9513.2623.883.783.1613.2223.823.75
LCW (m)0.032.236.001.290.052.225.961.26
GSV (m3)0.0020.1200.6570.0960.0020.1190.6510.096
Stand levelAIH10 (m)2.129.0818.703.753.379.0016.383.19
CC (proportion)0.330.880.990.140.720.890.970.07
GSV (m3 ha−1)10.57276.03718.96132.23102.75273.18729.28122.07
Table 2. Estimated parameters for final models at tree and stand levels, with a denoting the intercept in the linear model and proportionality constant in other models (ai being the proportionality constant for the i-th age group in the dummy variable model), and b, c each denoting the slope in the linear model and allometric exponent in other models. LH = LiDAR-derived tree height; LCW = LiDAR-derived crown width; AIH10 = 10th cumulative height percentile; and CC = canopy cover.
LevelModela/aib (LH/AIH10)c (LCW/CC)
Tree levelBase0.000222
(0.000008)
2.367329
(0.014343)
0.063381
(0.005365)
Linear−0.151763
(0.000209)
0.019266
(0.000018)
0.007030
(0.000047)
Dummy variable0.000259/0.000243/0.000261/0.000269/0.000275
(0.000012/0.000012/0.000013/0.000014/0.000015)
2.309164
(0.018917)
0.065991
(0.005439)
Nonlinear mixed-effects0.000223
(0.000016)
2.363358
(0.023469)
0.052013
(0.012441)
Stand levelBase42.50689
(7.30879)
0.88988
(0.06887)
0.85418
(0.23726)
Linear−82.38714
(1.97050)
28.94223
(0.28611)
109.61360
(3.68027)
Dummy variable41.90878/41.33184/38.30201/40.94594/38.80829
(7.84685/8.73077/8.18430/9.42490/9.12756)
0.91231
(0.08675)
0.81914
(0.24603)
Nonlinear mixed-effects59.38025
(10.04528)
0.74094
(0.07265)
1.14790
(0.25586)
Table 3. Training performance of models for growing stock volume estimation at tree and stand levels, evaluated using R2, RMSE (m3 at tree level, m3 ha−1 at stand level), MPE (%, mean prediction error), and MPSE (%, mean percentage standard error).
LevelModelR2RMSEMPEMPSE
Tree levelBase0.6770.0550.8233.33
Linear0.6390.0580.86107.35
Dummy variable0.6800.0540.8133.26
Nonlinear mixed-effects0.7250.0500.7530.55
Stand levelBase0.78960.6734.4518.86
Linear0.78561.3144.5018.67
Dummy variable0.79959.2794.4518.56
Nonlinear mixed-effects0.87946.0523.4415.50
Table 4. Test performance of models for growing stock volume estimation at tree and stand levels, evaluated on the independent test set using R2, RMSE (m3 at tree level, m3 ha−1 at stand level), MPE (%, mean prediction error), and MPSE (%, mean percentage standard error).
LevelModelR2RMSEMPEMPSE
Tree levelBase0.6660.0551.2733.48
Linear0.6310.0581.3391.49
Dummy variable0.6690.0551.2633.43
Nonlinear mixed-effects0.7060.0521.1931.22
Stand levelBase0.79255.6236.7013.32
Linear0.78157.0706.8714.06
Dummy variable0.79655.1907.0713.03
Nonlinear mixed-effects0.86245.3525.7111.36
Disclaimer/Publisher’s Note: The statements, opinions and data contained in all publications are solely those of the individual author(s) and contributor(s) and not of MDPI and/or the editor(s). MDPI and/or the editor(s) disclaim responsibility for any injury to people or property resulting from any ideas, methods, instructions or products referred to in the content.