Article

Development of an Integrated Forestry Survey Device for Tree Height and DBH

1
Key Laboratory of Forestry Intelligent Monitoring and Information Technology Research of Zhejiang Province, Zhejiang A & F University, Hangzhou 311300, China
2
College of Mathematics and Computer Science, Zhejiang A & F University, Hangzhou 311300, China
3
Haining Municipal Bureau of Natural Resources and Planning, Haining 314000, China
*
Authors to whom correspondence should be addressed.
Forests 2025, 16(10), 1529; https://doi.org/10.3390/f16101529
Submission received: 24 August 2025 / Revised: 15 September 2025 / Accepted: 28 September 2025 / Published: 30 September 2025
(This article belongs to the Special Issue Forest Resources Inventory, Monitoring, and Assessment)

Abstract

Tree diameter at breast height (DBH) and tree height are important quantitative attributes in forestry surveys. They serve as essential data for calculating forest stock, growth, and carbon sequestration, and are of significant research value for forest health assessments and other research outcomes. To improve the efficiency of forest resource inventories and to reduce labor costs, a forestry survey device integrating multiple sensors has been developed. Based on the principles of laser ranging and the tunnel magnetoresistance effect, this device integrates both the DBH and tree height measurements. Compared to traditional measurement methods, it boasts a compact size, low cost, and high measurement accuracy. Experimental applications have shown that the average root mean square error (RMSE) of tree height measurements ranges from 31 to 55 cm, while the DBH measurement accuracy reaches 98%, We acknowledge that, although this accuracy meets the requirements for general forestry surveys, it still falls short of the accuracy required for high-precision forest resource surveys (<20 cm), which points to a direction for future improvement.

1. Introduction

Surveys of forest resources and dynamic monitoring are foundational to the practice of sustainable forestry management. Tree diameter at breast height (DBH) and tree height are the most fundamental and frequently utilized structural parameters. The influence of these factors on the estimation of individual tree biomass is direct, and their role in calculating forest carbon stocks, analyzing stand structure, and developing growth models is crucial [1,2,3,4]. Existing forestry resource inventories continue to rely primarily on conventional manual measurement instruments, including calipers, girth rulers, and tower rulers, which pose problems such as cumbersome operation, low efficiency, and poor accuracy. At the same time, many handheld devices on the market have relatively single functions, such as electronic altimeters that are only used to measure height, or electronic calipers that are only used to measure diameter. This requires forestry surveyors to carry, manage, and integrate data from multiple independent instruments in the field. Therefore, the core novelty of this study lies in integrating the two key measurement functions of DBH and tree height into a unified and low-cost handheld device. This integrated design aims to simplify the entire field data collection workflow and is particularly rare in current forestry survey devices. Furthermore, our device’s integrated structure allows us to perform a single, continuous workflow in front of each tree. This is fundamentally different from the traditional process of carrying and operating multiple devices, which is not only inefficient but may also introduce data matching errors. Our compact and low-cost design provides a more economical and convenient alternative to existing multi-functional tools. The advent of science and technology has led to an increasing number of domestic and foreign scholars adopting digital methodologies to advance the field of forestry [5]. A number of teams of researchers, including Kejie Zhao and Yuanjing Sun, have developed a series of devices designed for measuring breast diameter [6,7,8]. However, the steps are complicated and the installation process often requires precise clamping and fixing, which is very time-consuming for a single person to operate. Kotaro Iizuka and other researchers employed a remote sensing system affixed to an unmanned aerial vehicle (UAV) to estimate tree height and DBH. The findings indicated that, when the tree height ranged from 16 to 24 m, the root mean square error of the tree height estimation was 1.712 m, and the correlation coefficients between the DBH and the crown width and crown area were 0.7786 and 0.7923, respectively. However, its high equipment cost and complex data processing limit its application in small and medium-scale forestry surveys [9]. Guangjie Liu and others used laser scanning technology to estimate the DBH and tree height of a single tree [10]. This method will reduce the measurement accuracy in high-density forests or areas with many obstructions. Donghai Yu and others used a total station to measure the DBH and the height of trees [11]. This method can achieve high-precision measurement of DBH, tree height, and volume, but the equipment cost is high, the operation is complex, and it is difficult to promote. Internationally, commercial altimeters, such as the Haglöf Vertex series, which utilizes ultrasonic and laser technology, and the Nikon Forestry Pro laser rangefinder and altimeter, are widely used and renowned for their high accuracy. However, their high cost (typically hundreds to thousands of dollars) makes large-scale deployment unaffordable for grassroots forestry stations and developing countries. This economic constraint highlights the conflict between the high precision and accuracy required for forestry surveys and the practical needs of many forestry practitioners. To date, forest resource surveys still commonly utilize traditional mechanical altimeters and circumference rulers, and surveyors are eager for new, low-cost devices that meet practical needs.
Based on the reference of relevant technical methods at home and abroad, this study designed an integrated breast-height tree height measurement device that integrates a laser ranging module, an MPU6050 six-axis attitude sensor, and an angle sensor. The goal is to achieve fast, accurate, portable, and efficient tree height and breast-height diameter measurement requirements. Field trials were conducted to determine the accuracy of the measurements.

2. Development of Integrated Tree Measurement Device

2.1. Mechanical Structure Design

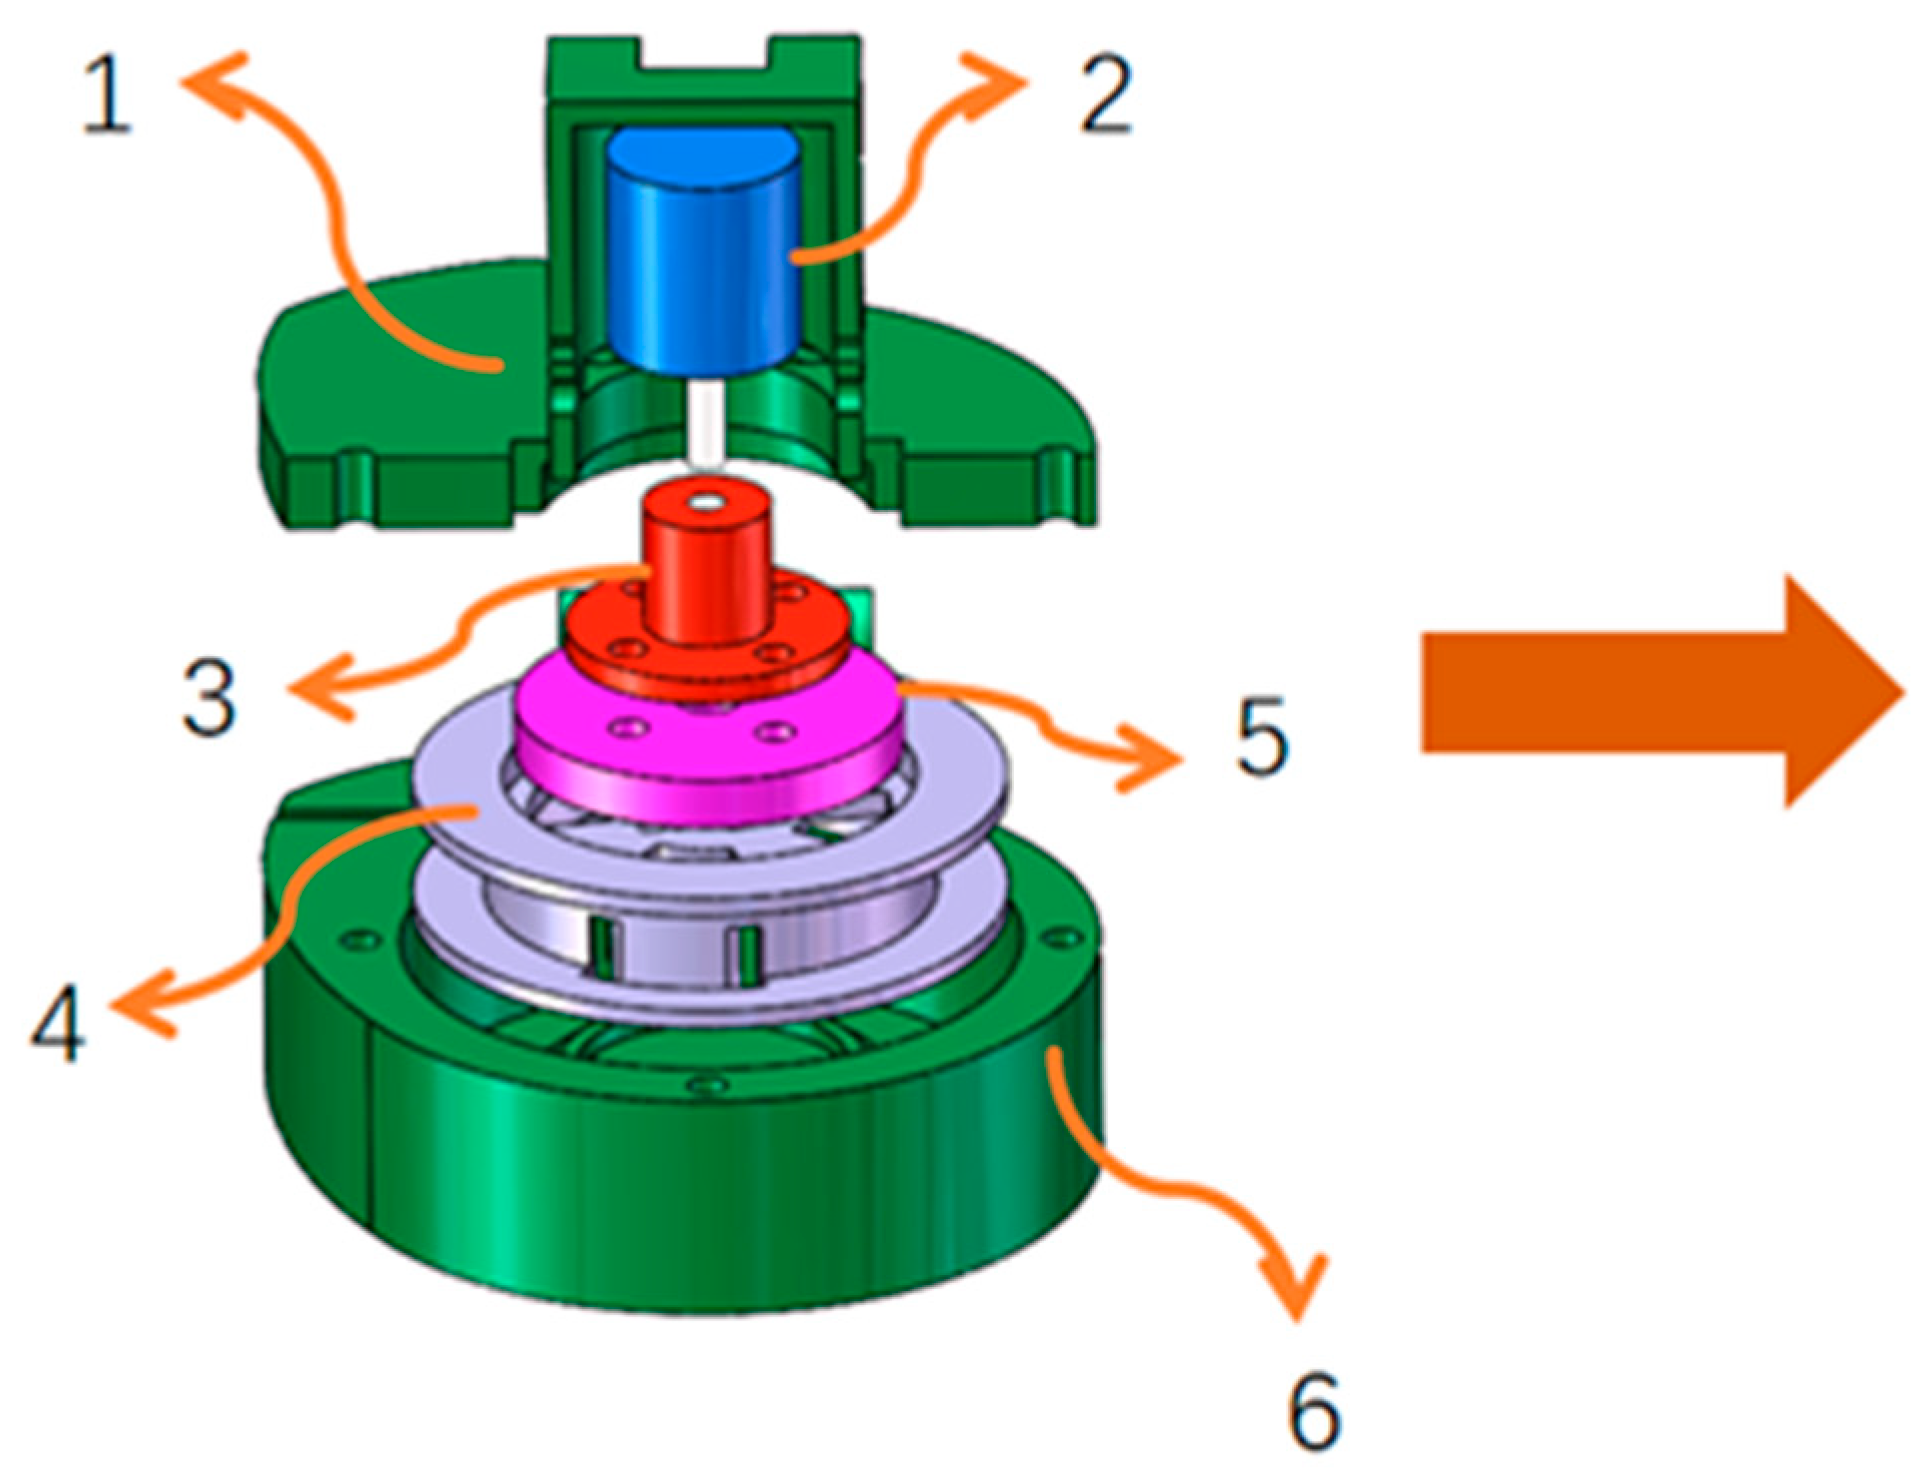
In order to ensure the convenience and speed of forestry workers and to adapt to the mobility needs in the woodland environment, the device adopts a streamlined gun-shaped design to ensure portability for forestry practitioners. As shown in Figure 1, the device is mainly modular in design and contains five core components: a holster, a mainboard fixing part, a base, a tape measure box, and a support structure. The holster uses a pull-out buckle to quickly disassemble and assemble the mainboard and the base for easy maintenance, and integrates an auxiliary sight to improve positioning accuracy; the mainboard fixing part stabilizes the sensor and circuit board, and uses high-strength and lightweight materials to ensure stability and portability; the base has a built-in 3400 mAh lithium battery that supports the long-term power supply, and is connected to the tape measure box via screws to improve structural reliability. As shown in Figure 2, the tape measure case employs a self-resetting mechanism. Its internal components include an angle sensor, a flange shaft, a spring-loaded flange-mounted base, and a fixed base. When the tape is extended, the flange rotates, driving the integrated angle sensor to achieve precise measurements. The support part adopts a triangular reinforcement structure to enhance the overall impact resistance and stability to adapt to complex outdoor environments.

2.2. Circuit and Component Integration Design

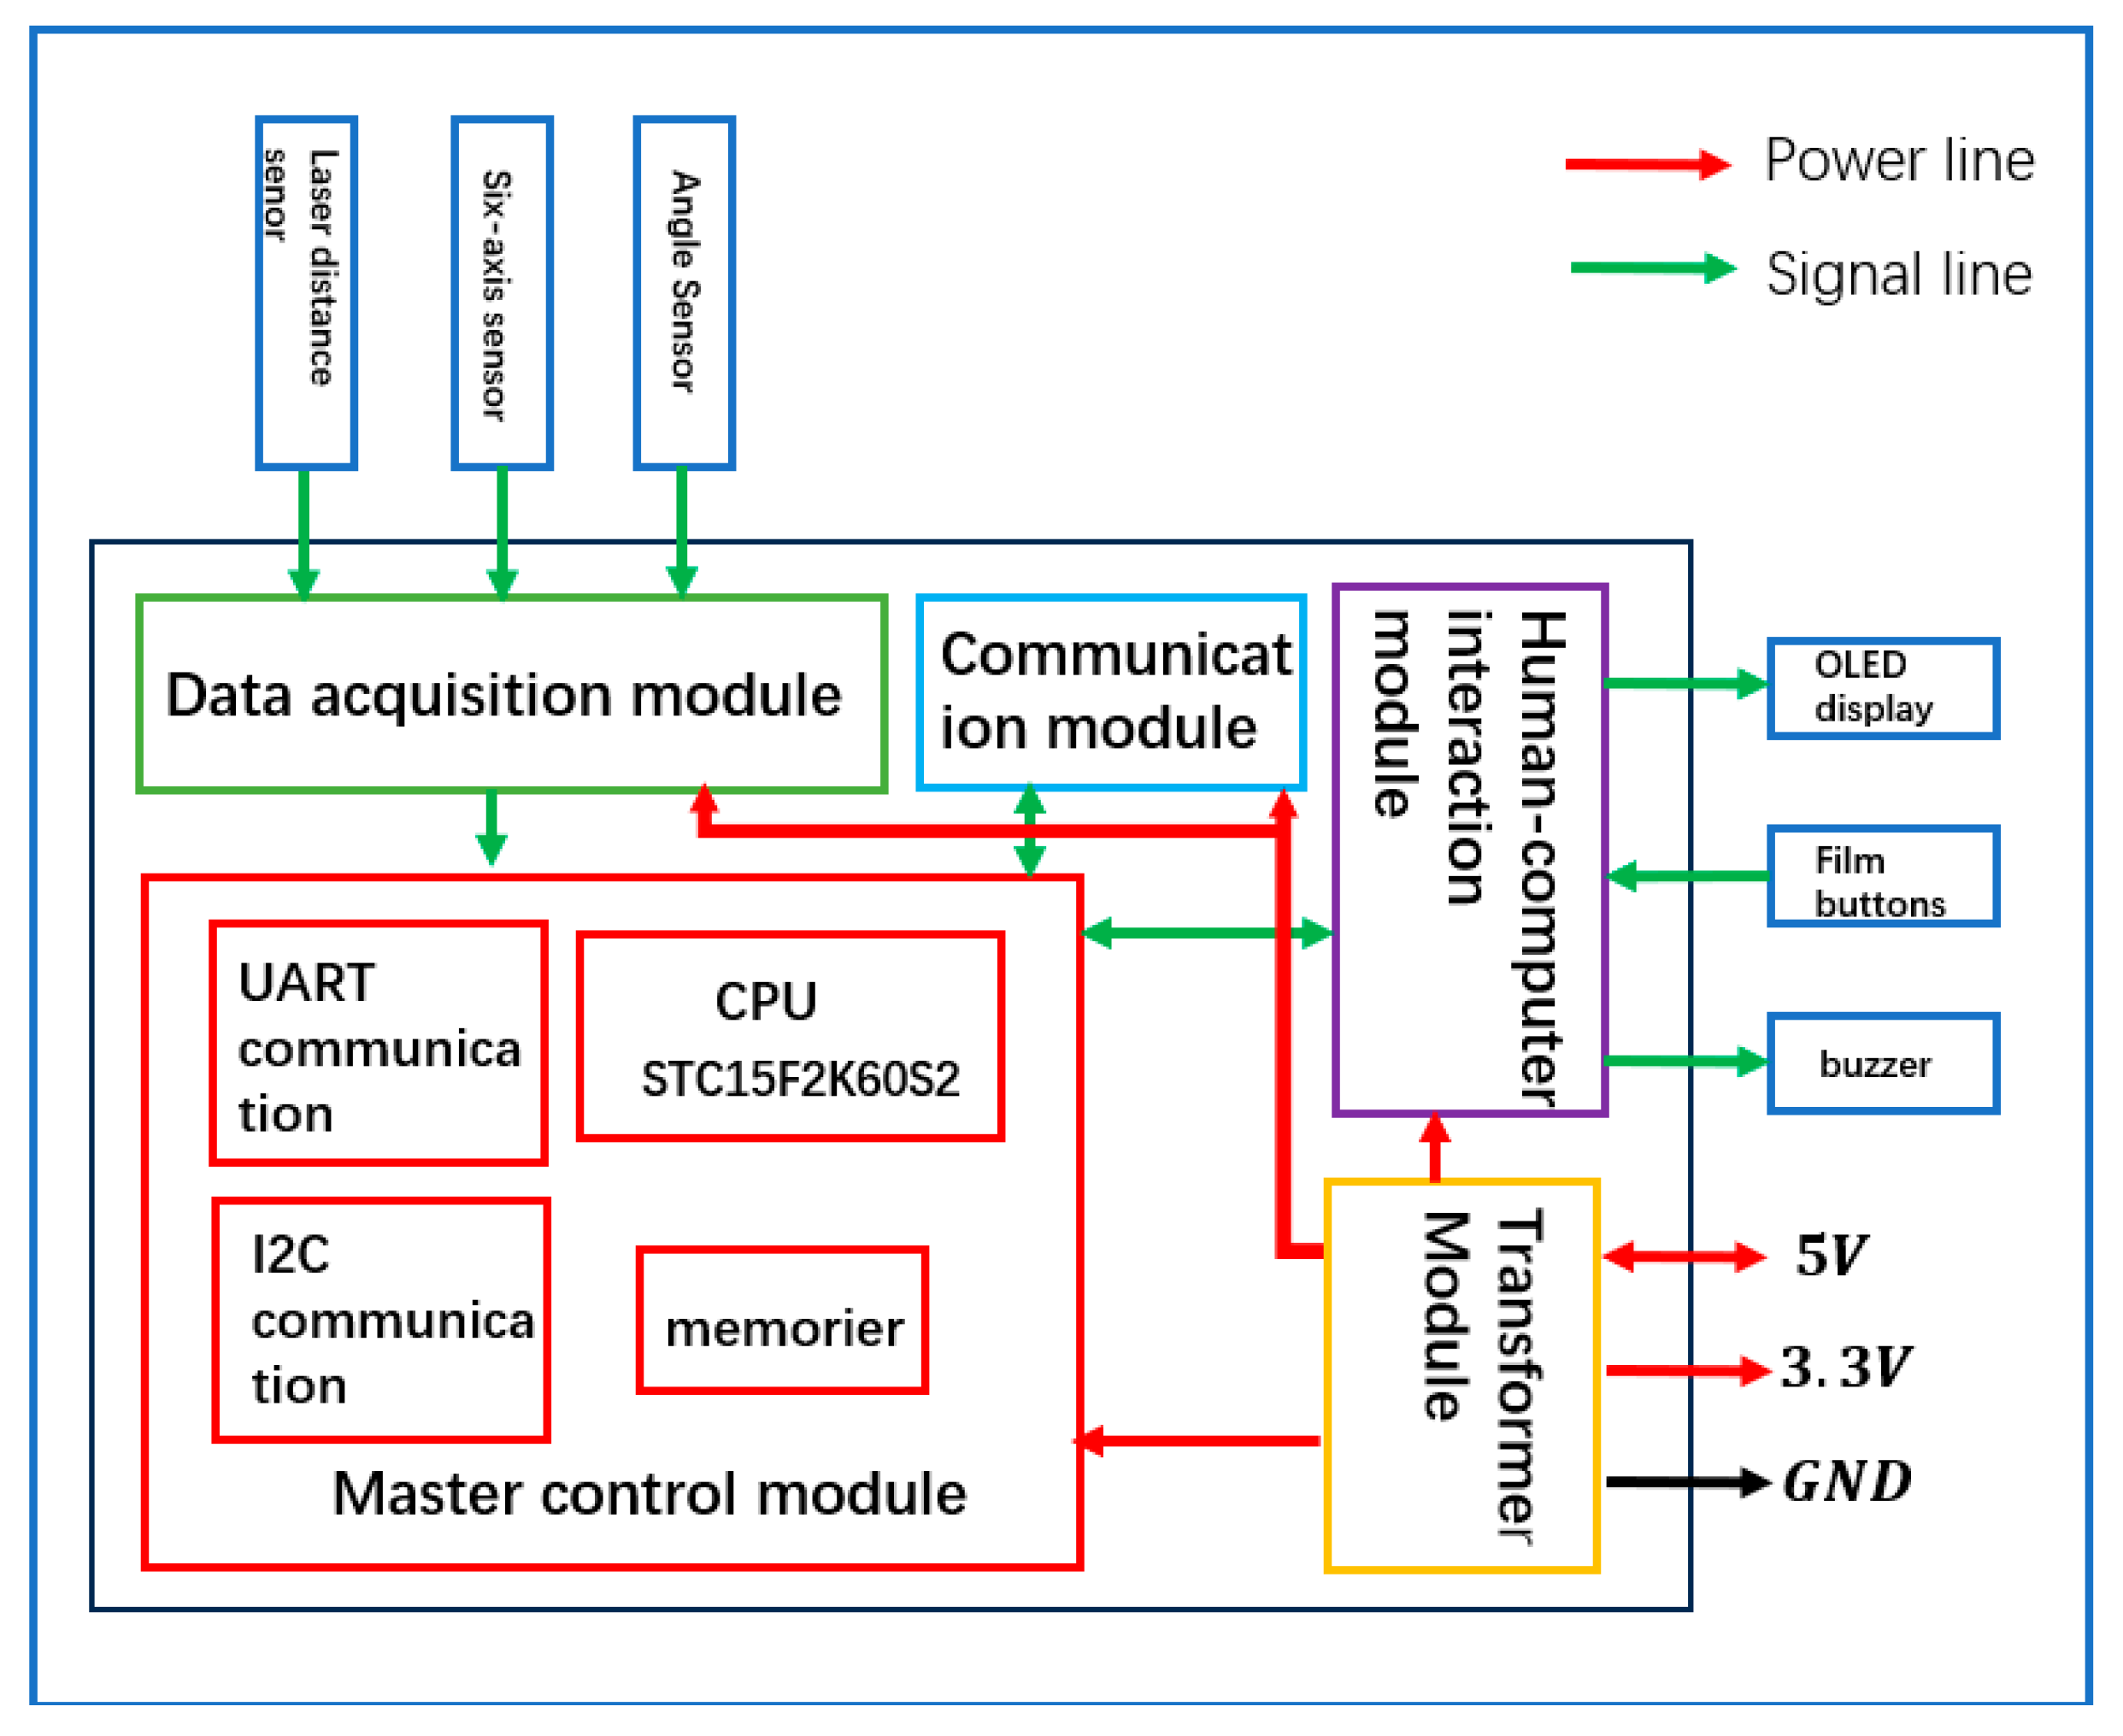
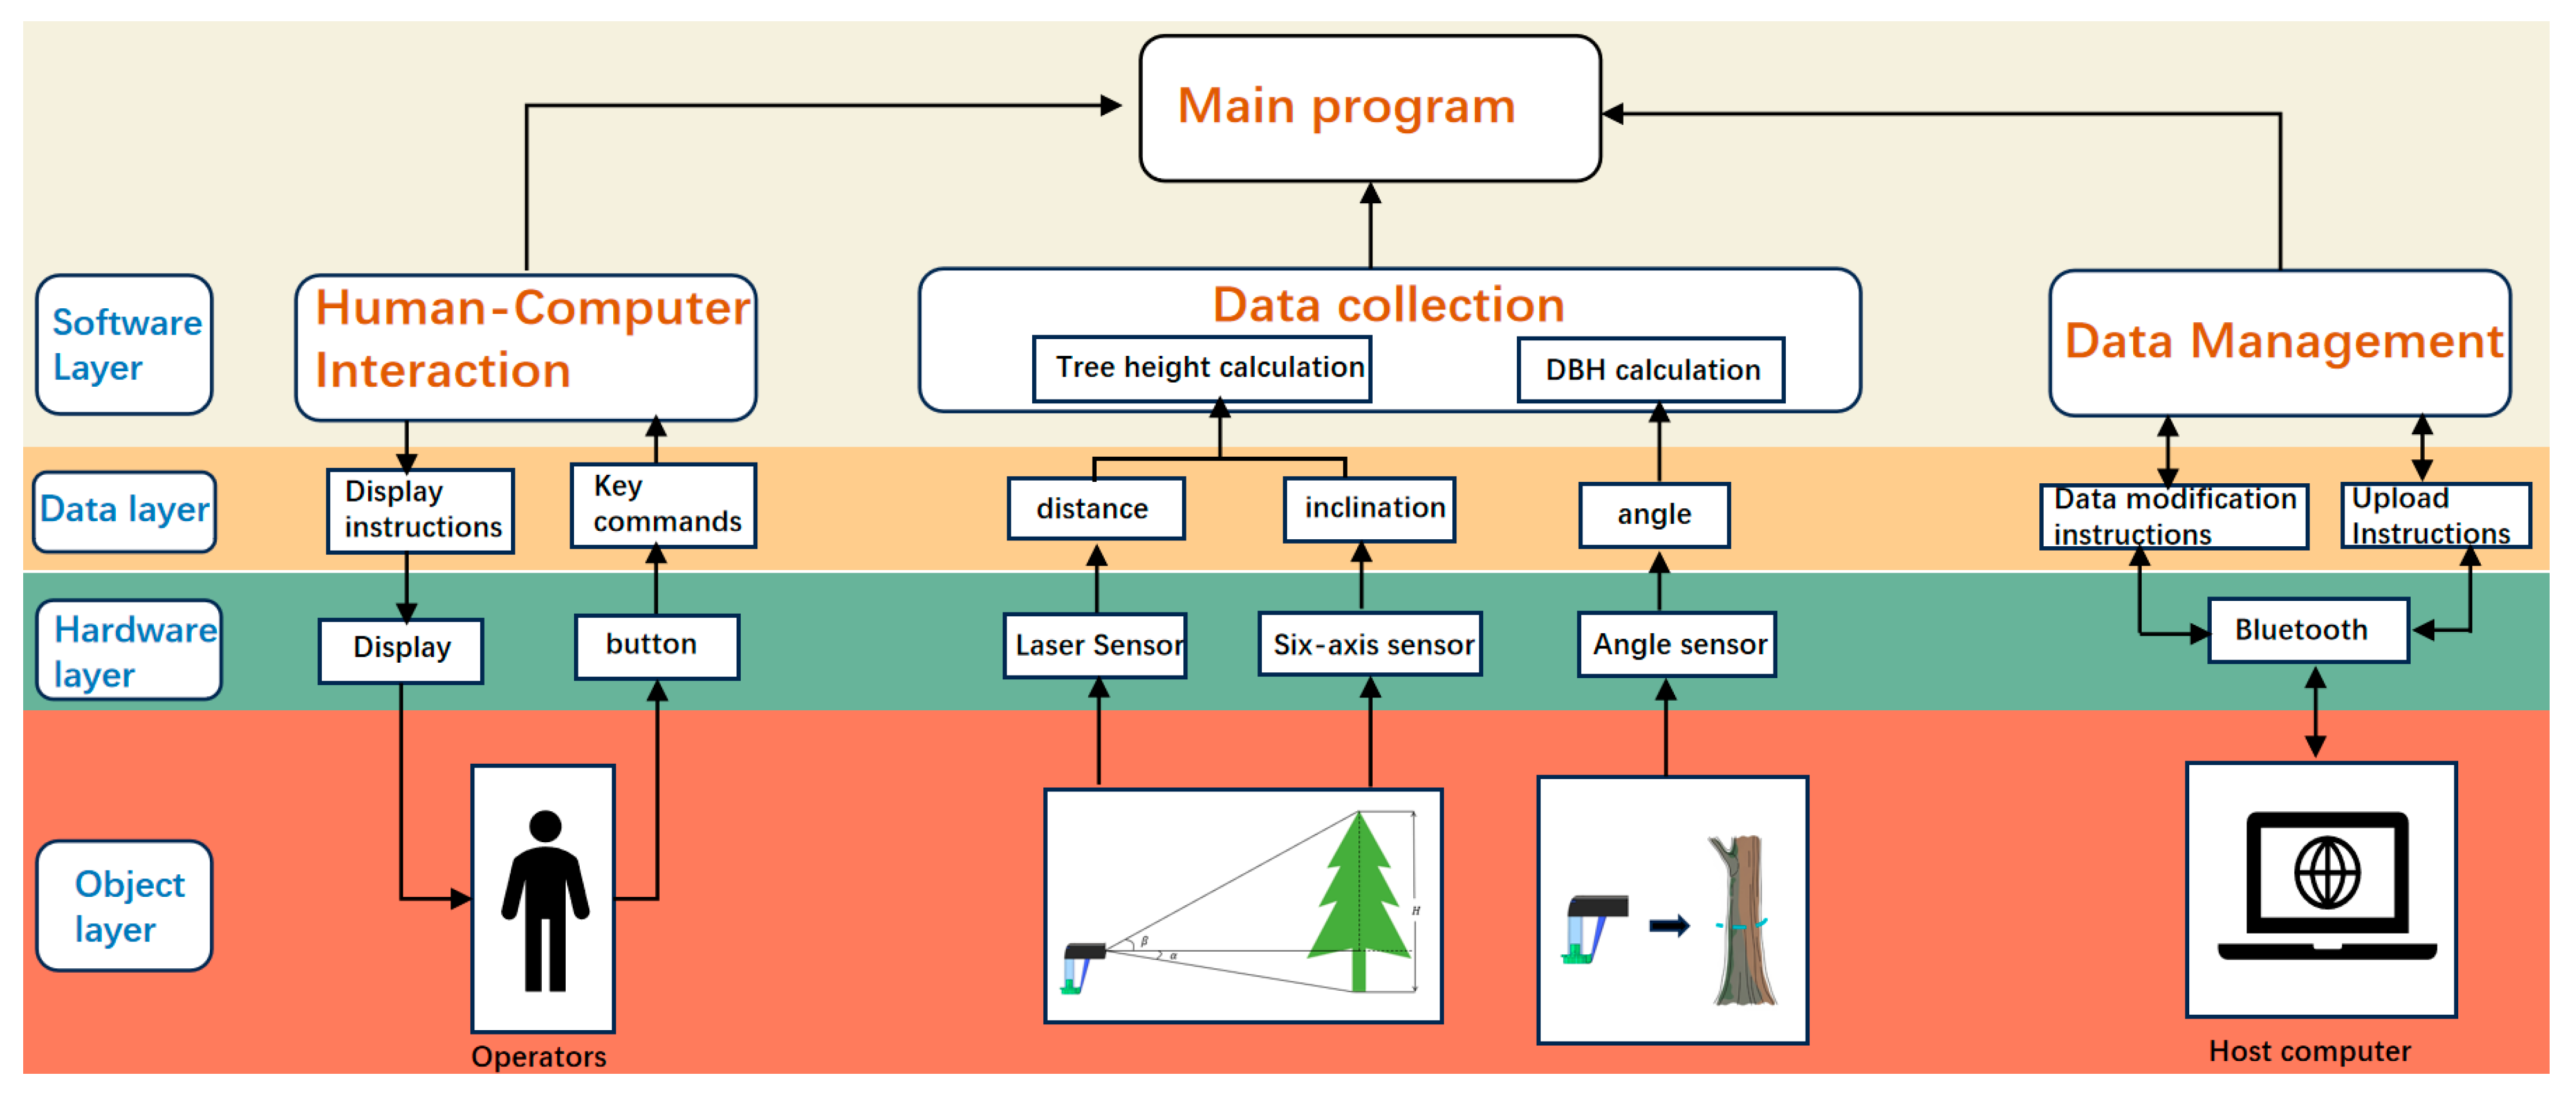
The overall circuit framework of the device designed in this study is shown in Figure 3, which mainly consists of a main control module, a data acquisition module, a human–computer interaction module, and a voltage transformation module.

2.2.1. Main Control Module

The device uses an STC15F2K60S2 microcontroller (STC Micro, Shanghai, China) from the STC15 series as its main control module. This microcontroller uses an enhanced 8051 core CPU that can execute up to 1 TB of instructions per cycle. Compared to traditional 12 KB 8051 microcontrollers, this improves instruction execution efficiency by eight to twelve times. The microcontroller’s efficient processing capabilities ensure accurate and real-time data acquisition and processing. This enables efficient operation in complex environments and better meets the needs of on-site operations.

2.2.2. Transformer Module

The device’s power management system utilizes the AMS1117-3.3 power (Advanced Monolithic Systems, Sunnyvale, CA, USA) step-down IC. The AMS1117-3.3 utilizes an LDO (low dropout) linear voltage regulator architecture, offering low voltage dropout, high precision, low noise, and high current output. The chip integrates overheat protection, current limiting, and short-circuit protection, and operates in a temperature range of −40 to 125 °C. It maintains continuous and stable power output even in complex environments, like forests, providing reliable power to all modules of the device.

2.2.3. Human–Computer Interaction Module

To ensure real-time data output and intuitive function prompts, the device is equipped with a 1.54-inch OLED display module (Hansheng, Shenzhen, China). This module has a resolution of 128 × 64, an operating temperature range of −40 to 85 °C, and offers advantages such as fast response time and low power consumption. The OLED screen’s display quality surpasses that of an LCD, significantly improving data clarity and user interface responsiveness. Combined with membrane buttons and beep prompts, it helps improve forestry survey efficiency.

2.2.4. Data Acquisition Module

The data acquisition module uses the L1-40 industrial-grade laser ranging sensor (myantenna, Shenzhen, China), MPU6050 six-axis sensor (InvenSense, San Jose, CA, USA), and JY-ME01-TTL 18-bit resolution absolute encoder (WIT Motion, Shenzhen, China) to extract tree height and breast diameter data.

2.3. Design Principles

2.3.1. Tree Height Design Principles

L1-40 Distance Sensor Principle
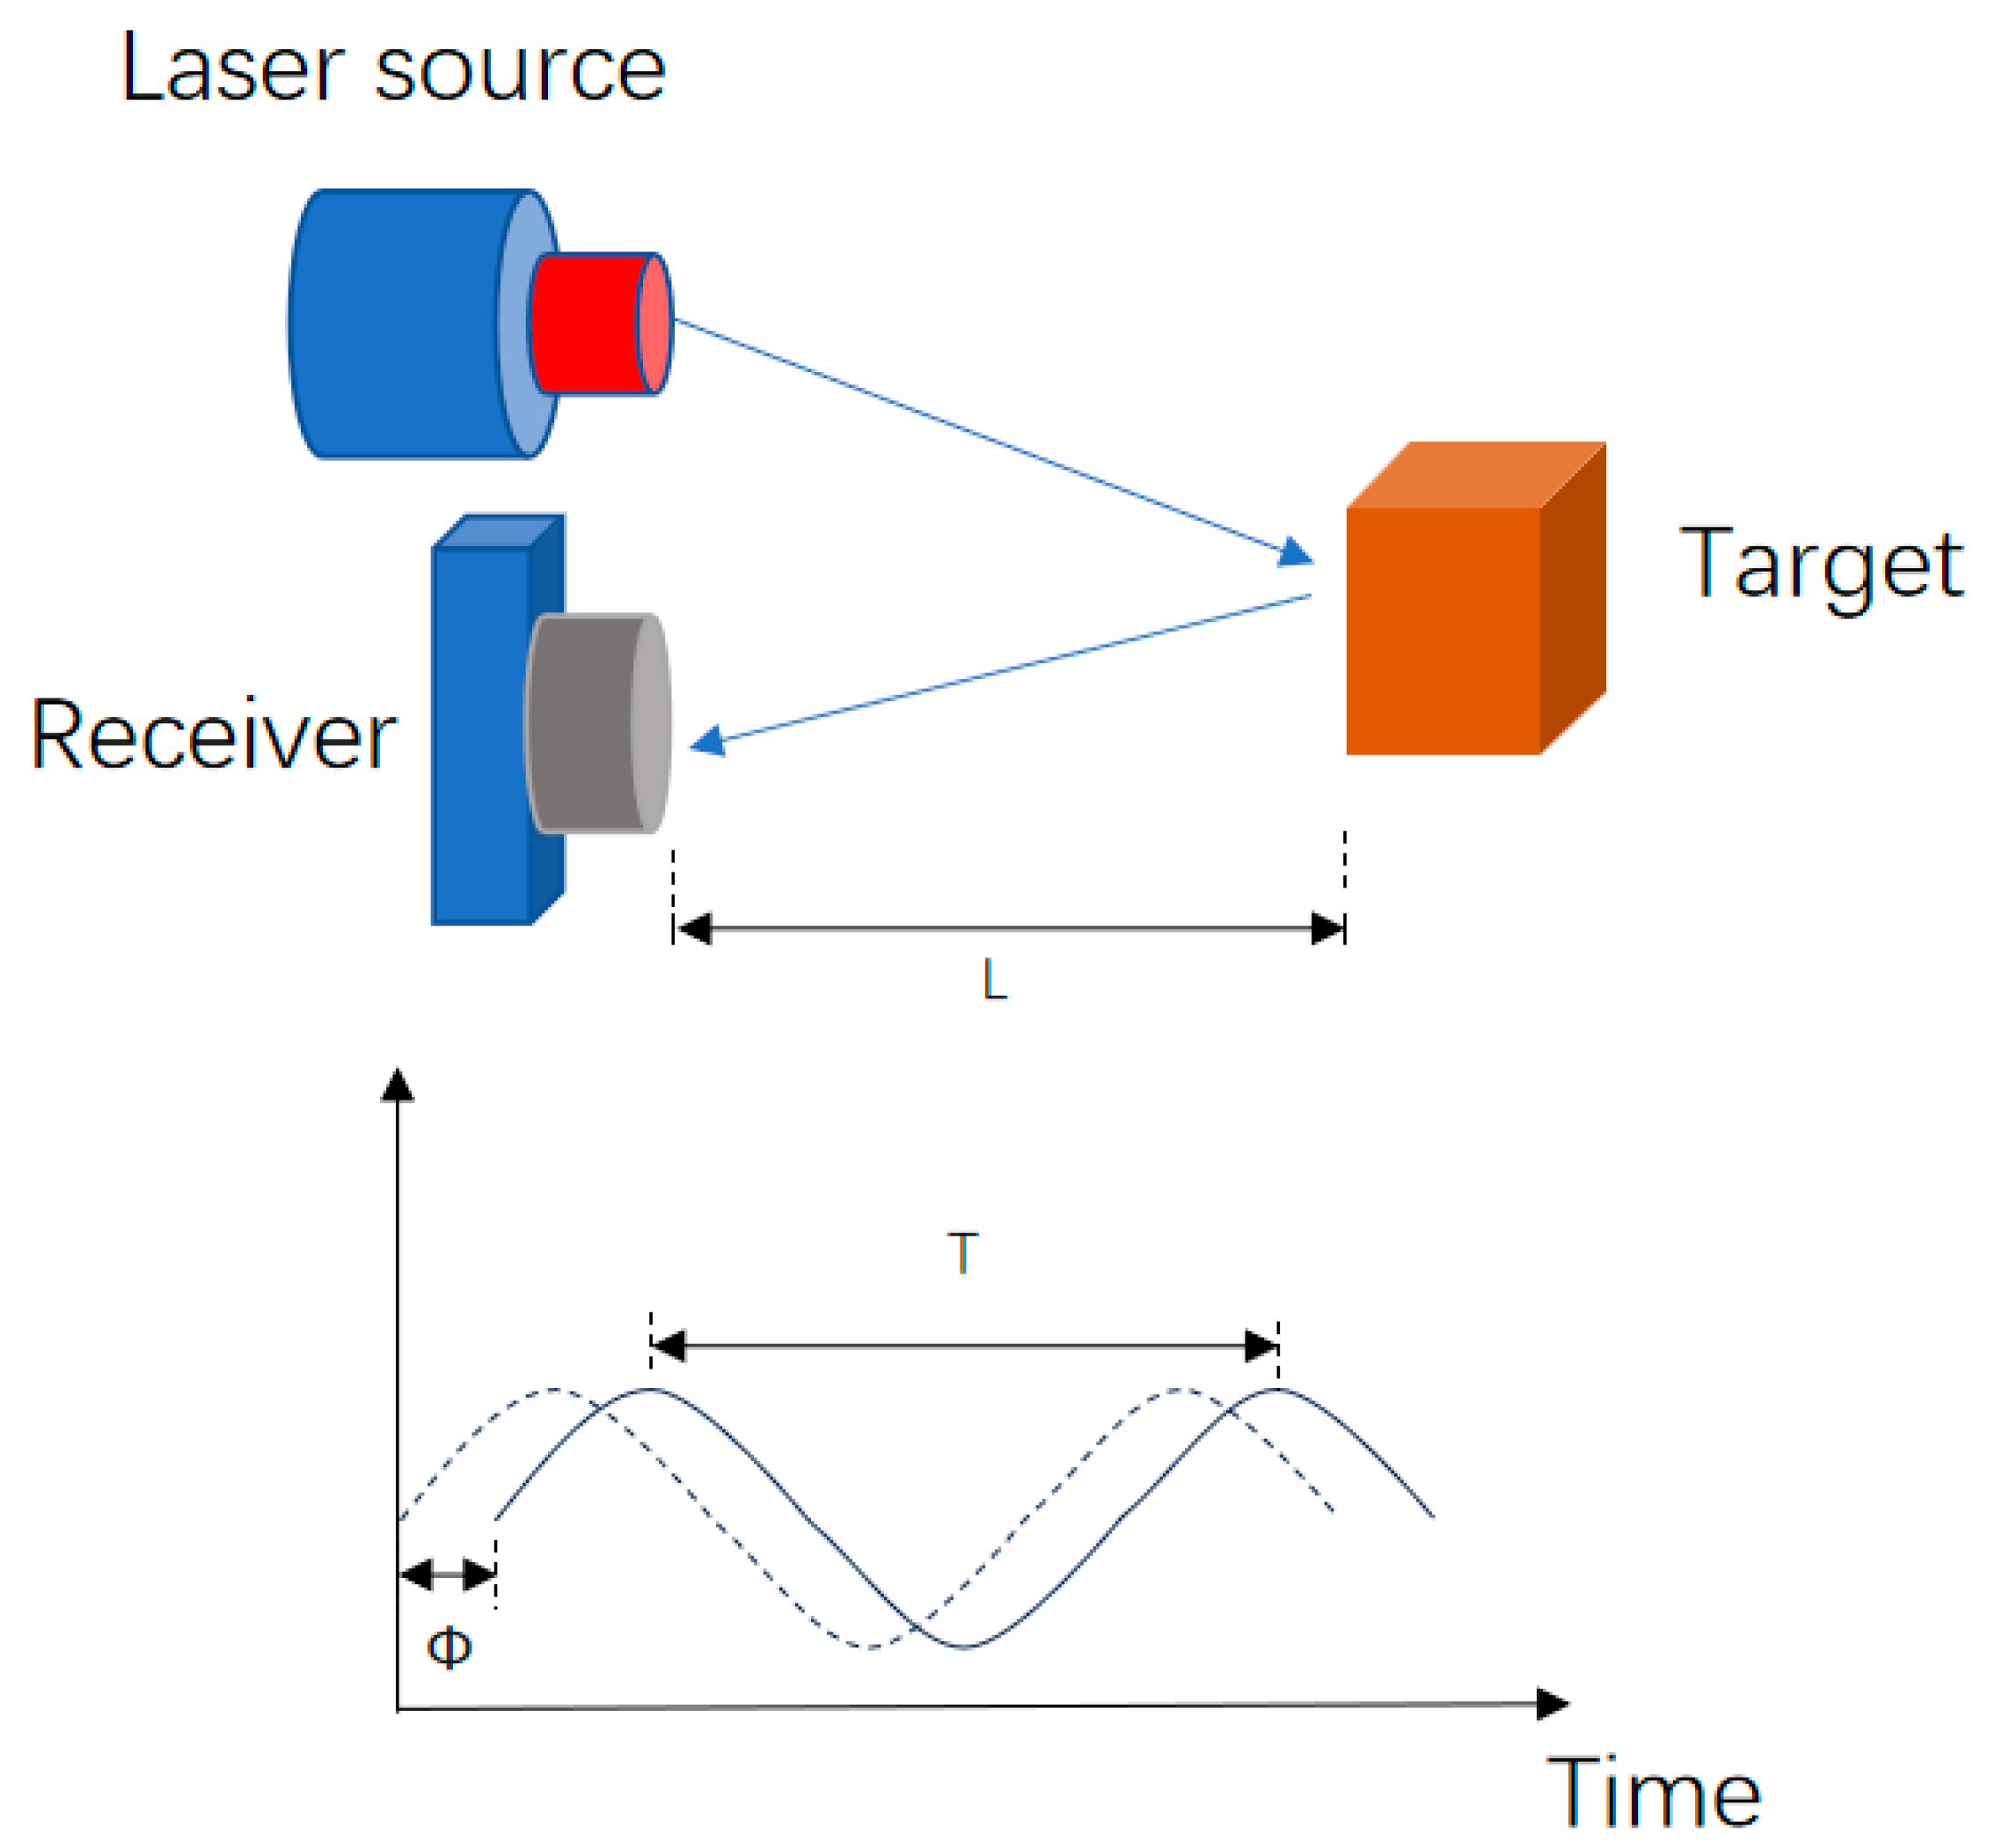
The L1-40 distance sensor is mainly based on the phase measurement method [12,13,14]. As shown in Figure 4, the laser beam is amplitude modulated and the phase delay caused by the modulated light traveling back and forth is measured. This phase delay is proportional to the distance from the sensor to the target. The distance L, represented by this phase delay, is then converted based on the wavelength of the modulated light, where c is the speed of light, Δ Φ represents the measured phase difference, f is the modulation frequency of the laser, and T represents the modulation period, which is the reciprocal of the modulation frequency ( T = 1/ f ). The formula is as follows:
  L = c   ×   Δ Φ   ×   T   4 π
MPU6050 Six-Axis Sensor Principle
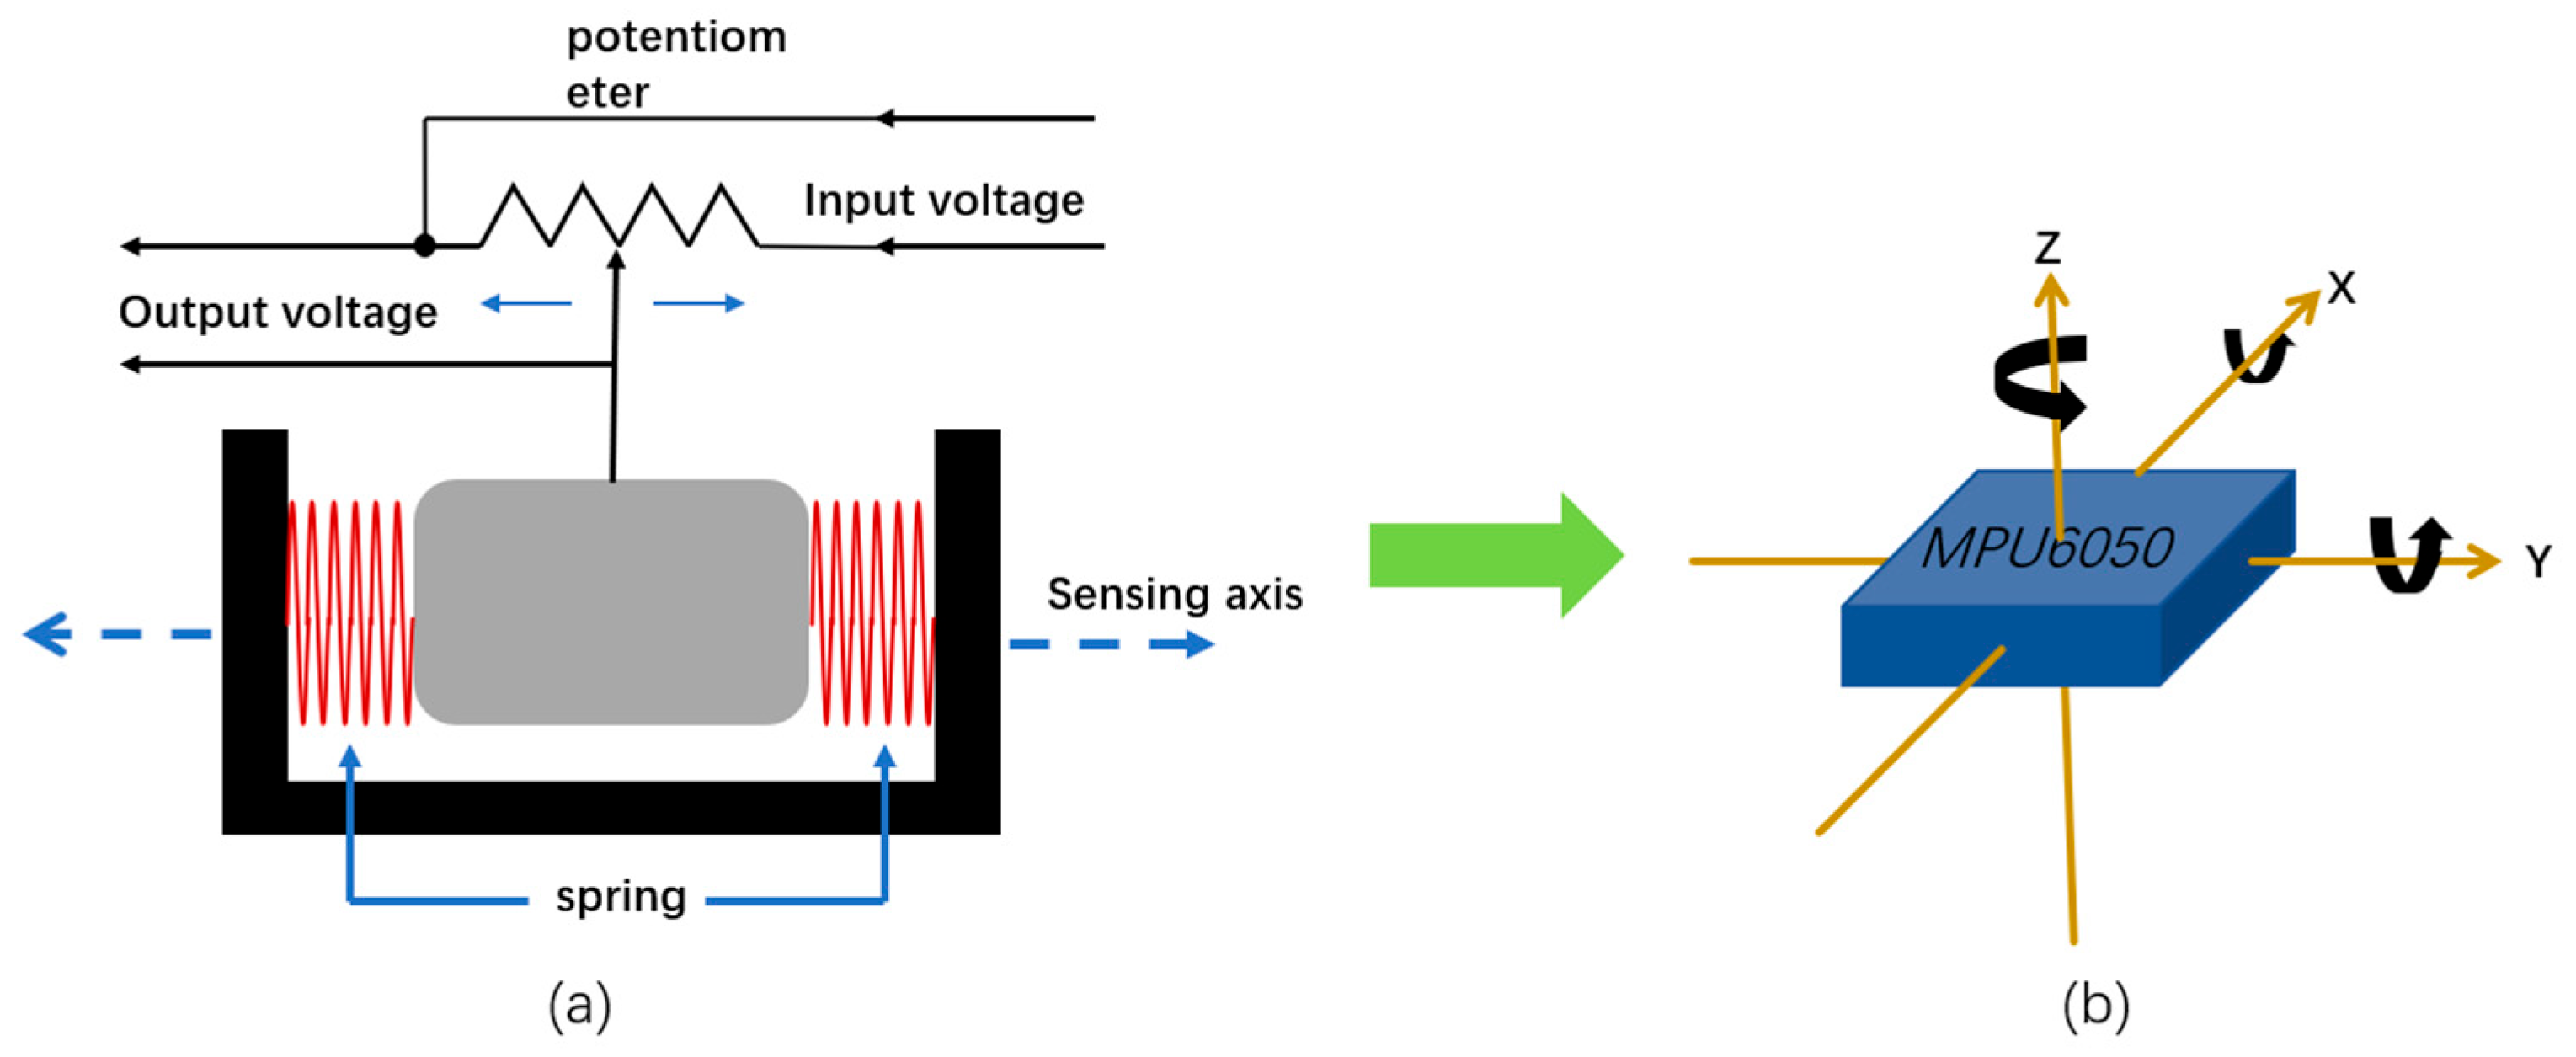
The core function of the MPU6050 six-axis attitude sensor is to accurately measure the pitch angle (Pitch), roll angle (Roll), and yaw angle (Yaw) of an object. It is widely used in attitude control and motion detection, among other fields. The pitch angle used in this study is mainly obtained by calculation through the accelerometer, as shown in Figure 5a. When the sensing element inside the accelerometer is displaced by gravity or inertia, the offset is converted into a voltage change. There is an accelerometer on each of the X, Y, and Z axes inside the sensor, as shown in Figure 5b, and the acceleration values of the X, Y, and Z axes are then measured [15,16]. This study mainly uses the acquisition of pitch angle, and the gravity acceleration is used as a vector that constantly points to the center of the earth. When the device pitches, the projection of gravity on the X, Y, and Z axes of the device will change (that is, the accelerometer readings, Ax, Ay, Az, represent the acceleration components along the x, y, and z axes, respectively). The angle can be inversely solved from these components, as shown in the following formula:
P i t c h = a t a n 2 A x , A y 2 + A z 2
The MPU6050, as an inertial measurement unit based on MEMS (Micro-Electro-Mechanical Systems), is susceptible to measurement errors, including sensor drift. Potential sources of this drift encompass temperature variations in field environments, manufacturing defects in the sensor, and the accumulation of integration errors within the gyroscope over time. To mitigate drift effects and to ensure measurement accuracy, we execute a calibration procedure before commencing each field survey. The procedure involves placing the device on a level surface and running a zero calibration function to correct static zero bias errors in the accelerometer and gyroscope readings. This function establishes a stable and accurate baseline for all subsequent angular calculations
Principles of Tree Height Measurement
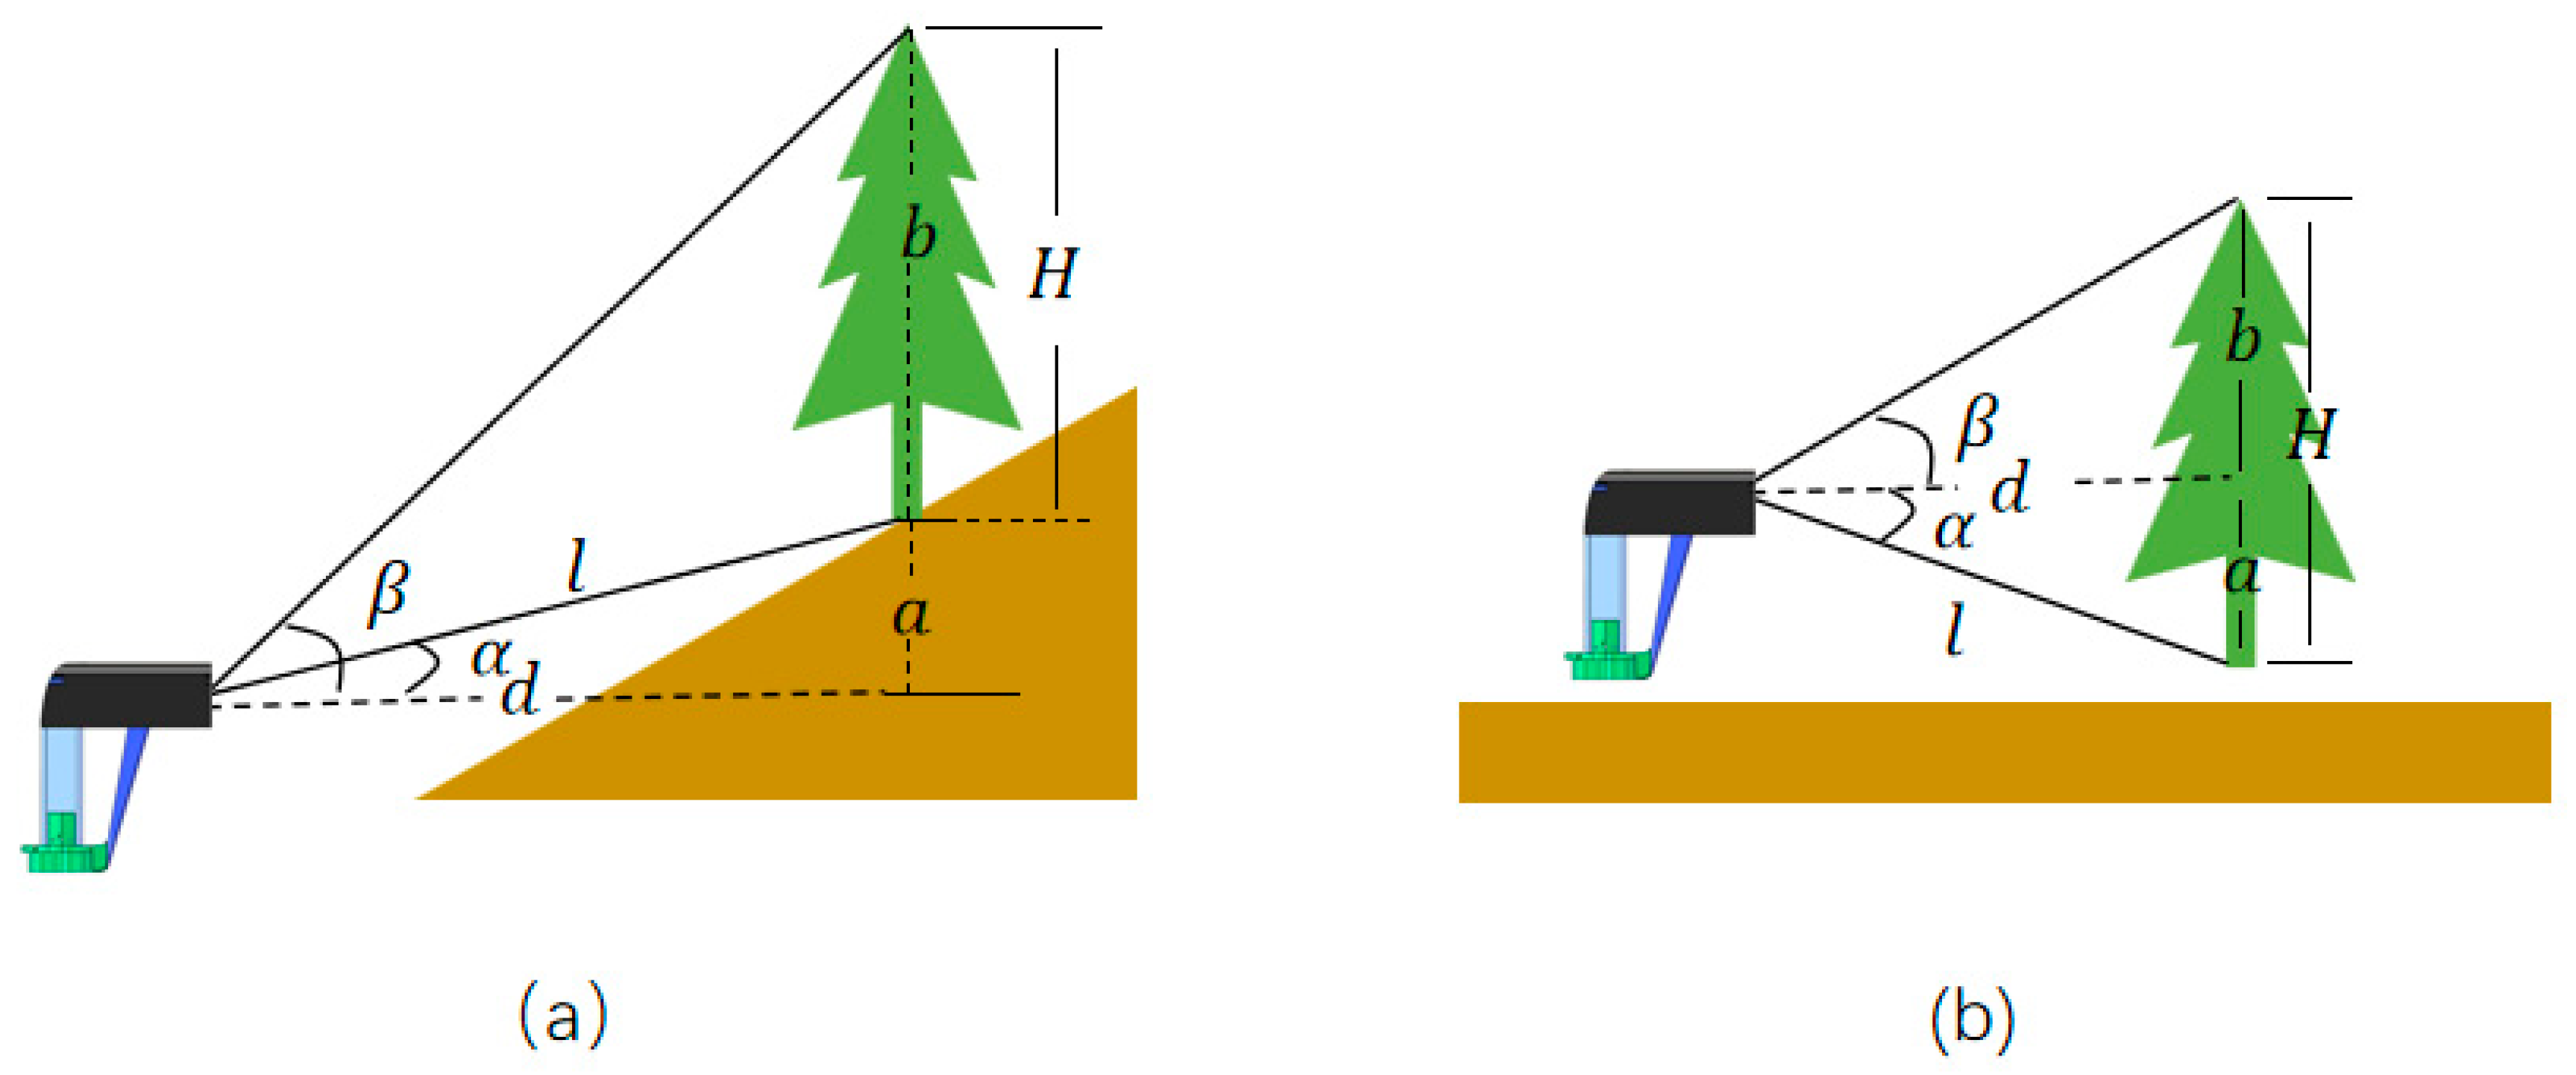
This device uses triangulation combined with sensors to obtain tree height. During the measurement process, first align the laser rangefinder sensor with the tree roots to obtain the distance l to the roots. Based on the tilt angle acquired from the six-axis sensor and using trigonometric relationships, the horizontal distance d between the measuring device and the tree, as well as the vertical height difference a between the device and the tree roots, can be calculated as follows:
d = c o s α · l
a = s i n α · l
Then, aim the device at the tree top to obtain the tilt angle β . Using trigonometric relationships, calculate the horizontal distance b from the point to the tree top as follows:
b = t a n β · d
The device is then pointed at the top of the tree to obtain the inclination angle β . The total tree height is the sum or difference of the two vertical components. Whether addition or subtraction is used depends on the observer’s position relative to the tree roots.
Scenario 1: The observer is located below the tree root (as shown in Figure 6a). The tree height calculation formula is as follows:
  H = a + b
Scenario 2: The observer is located above the tree root (as shown in Figure 6b), and the tree height is calculated as follows:
H = a b

2.3.2. Principles of the DBH Design

Principle of Tunnel Magnetoresistance Effect Angle Detection
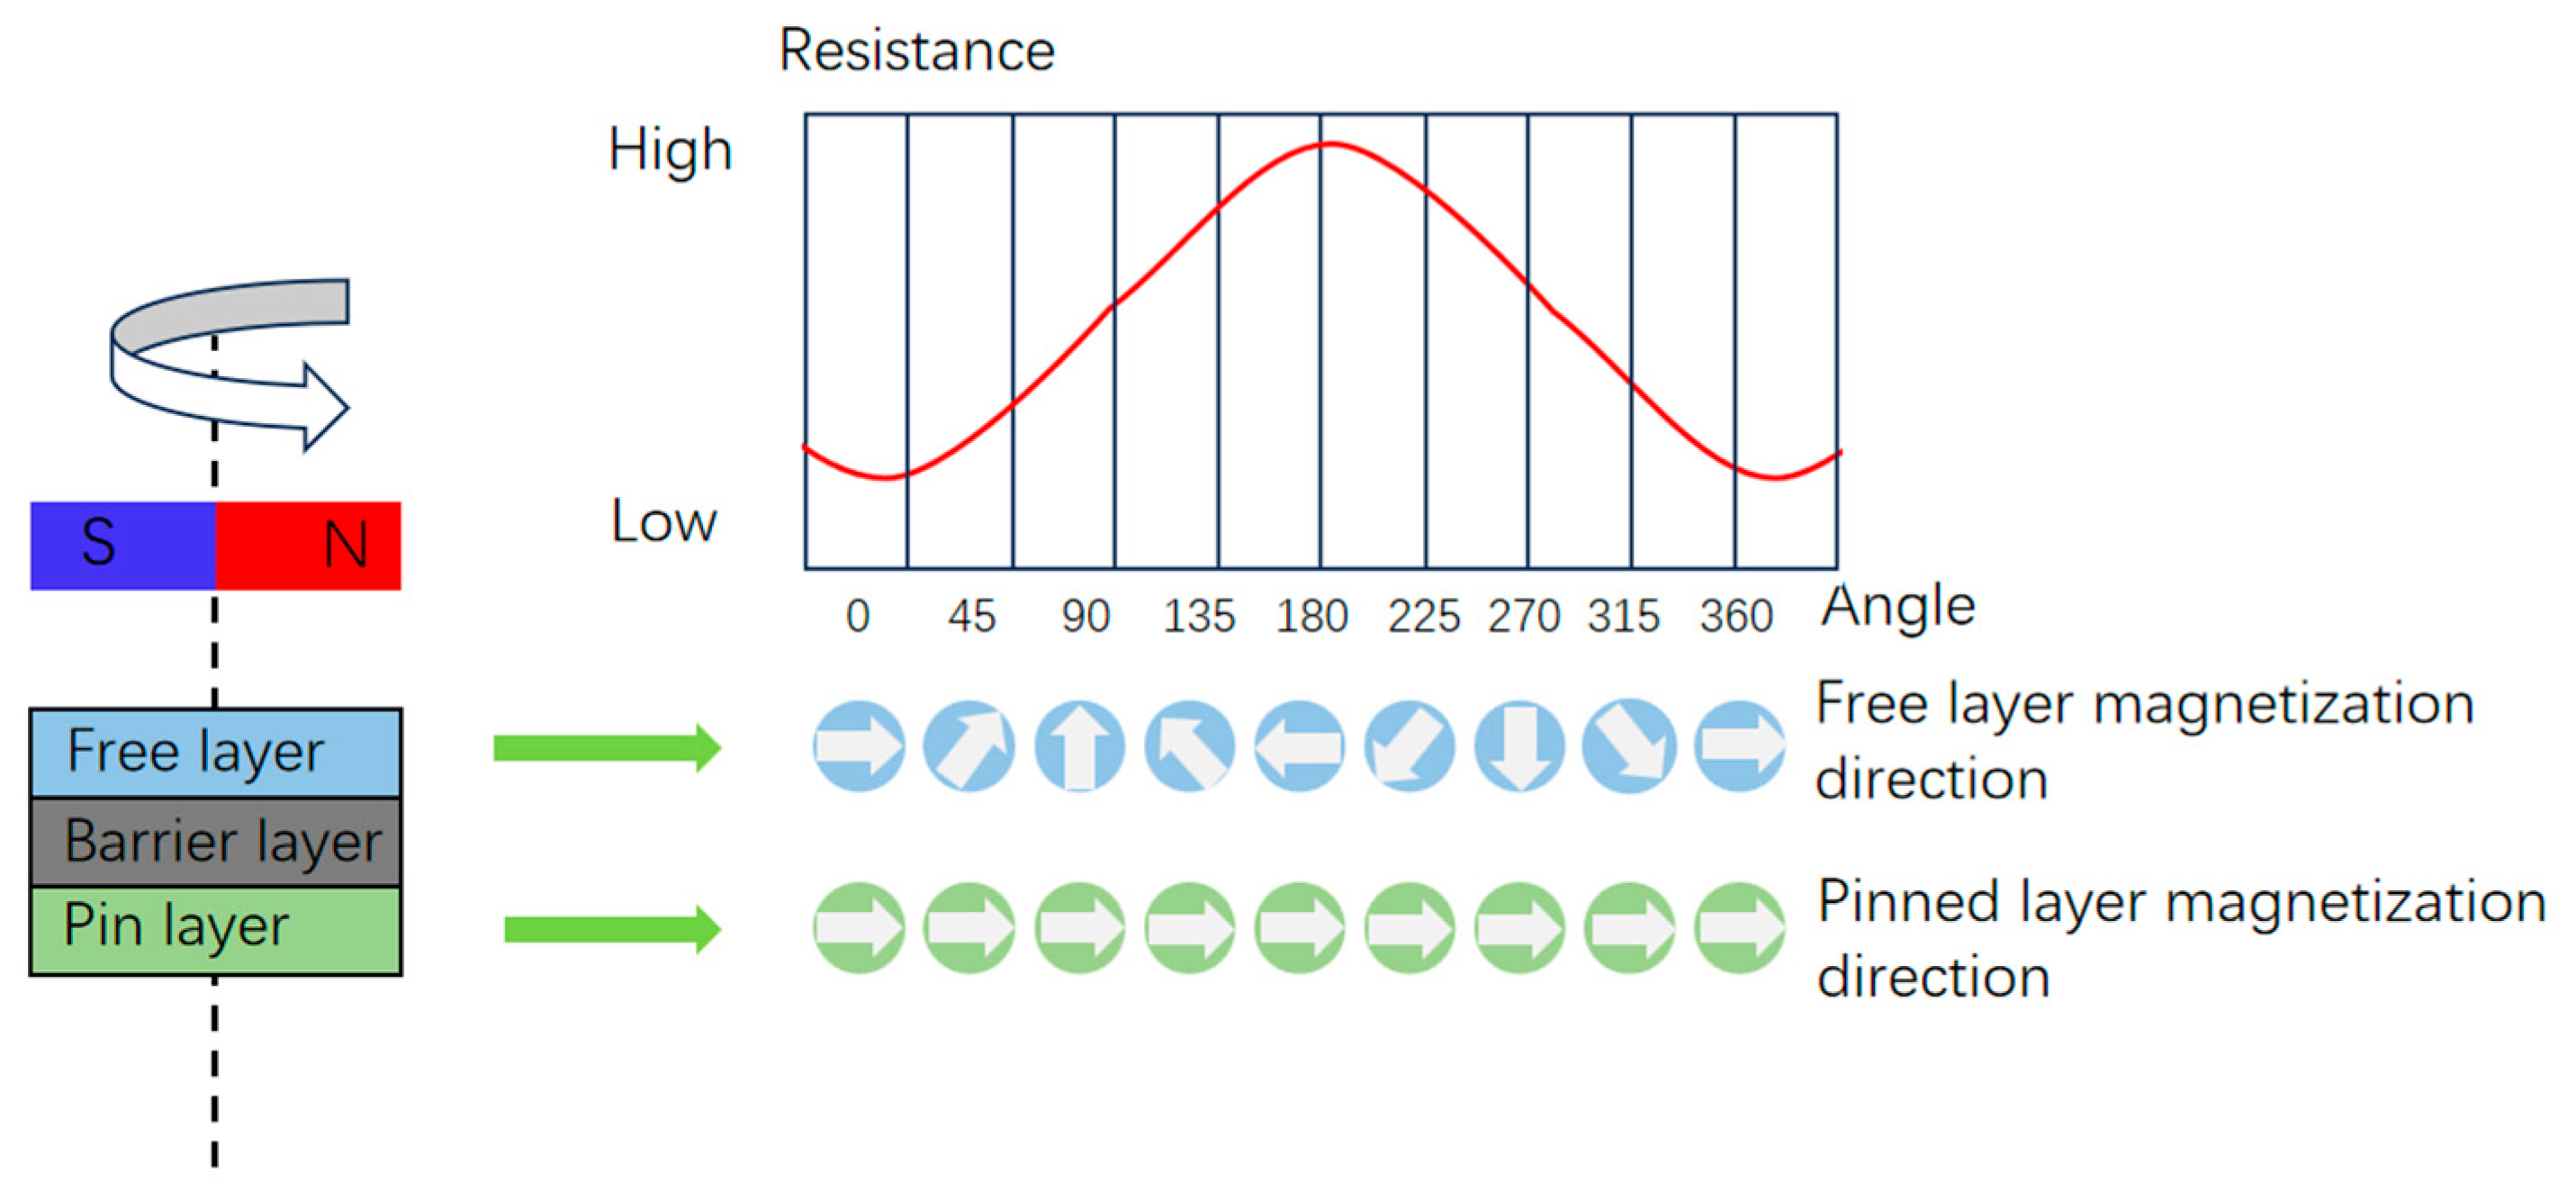
Tunneling magnetoresistance (TMR) angle sensors are based on a magnetic tunneling junction (MTJ) structure, consisting of a pinned layer with a fixed magnetization direction, an insulating layer, and a free layer that rotates with the external magnetic field. As shown in Figure 7, the bar magnet represents the external magnetic field. The free layer is a magnetic layer whose magnetization direction changes in response to the direction of the external magnetic field. The pinned layer is also magnetic, but its magnetization direction remains fixed regardless of the external field. The middle layer is the barrier layer, an insulating layer. When the external field angle is 0° or 360°, the magnetization direction of the free layer aligns parallel to the pinned layer. At these angles, electrons most easily tunnel through the barrier layer, resulting in minimum resistance. Conversely, when the field angle is 180°, the magnetization directions oppose each other, causing maximum resistance. As the device rotates, the resistance smoothly transitions between these two states, enabling the TMR element’s resistance to vary systematically with the angle [17,18,19,20]. The sensor typically uses two orthogonal TMR bridges to output sine and cosine signals, respectively. The inverse tangent calculation then yields a continuous, high-resolution rotation angle.
DBH Conversion Principle
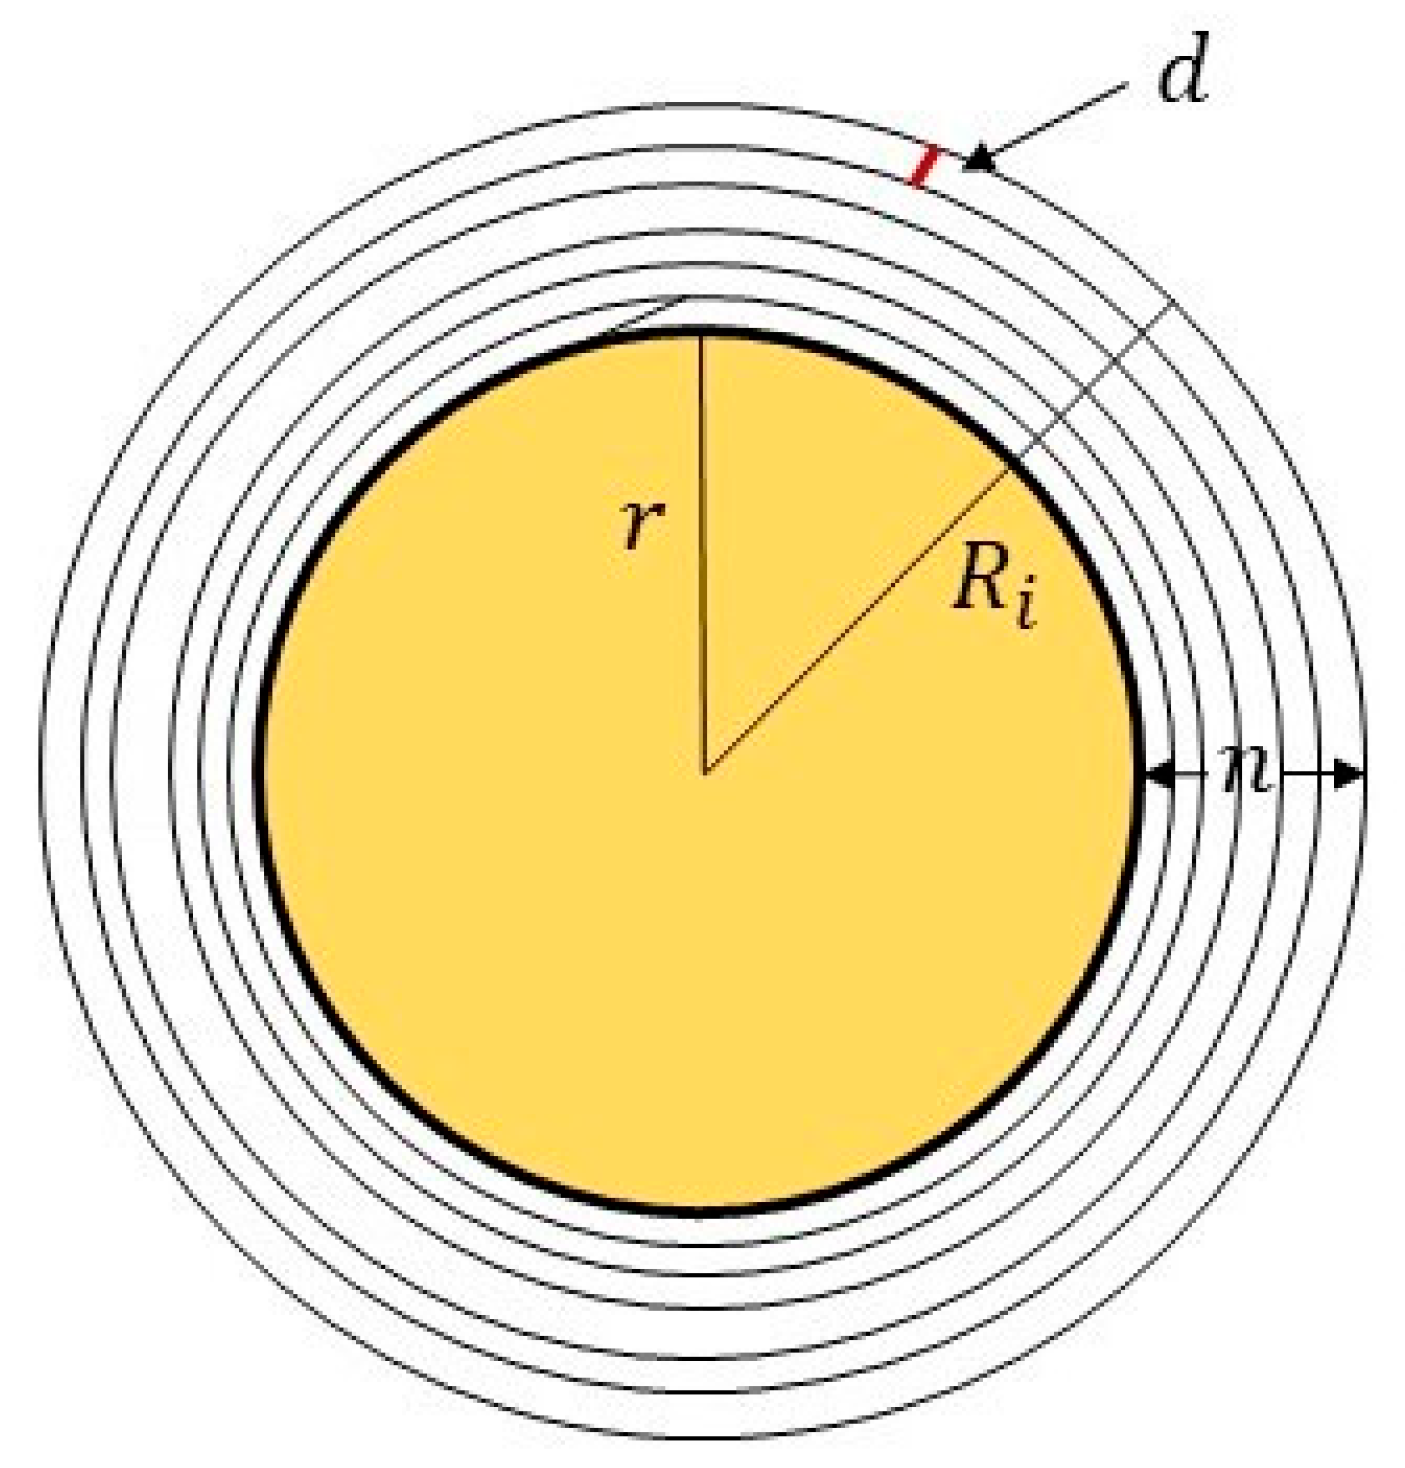
The tree’s DBH is approximated as a cylinder. This device rotates around the trunk once and indirectly calculates the trunk’s circumference and diameter by detecting the relationship between the angle change and the tape’s extension length. The tape box is centered around the angle sensor, and the tape is wrapped around the outside of the device. The measurement diagram is shown in Figure 8. The yellow area is the device structure, the measurement radius is   R i ,   n is the number of times the tape wraps around the structure’s radius, the structure’s radius is   r , and the tape’s thickness is d . Due to the thickness of the tape, as the number of wraps c increases, the equivalent measurement radius also changes. Therefore, the measurement radius is as follows:
  R i = r + d n c
Assuming the sensor’s single-turn angle change is a and the current angle value is θ , the tree’s DBH can be calculated in two parts.
The length L 1 , of the tape measure after stretching c circles is as follows:
L 1 = i = 0 c 2 π d · ( r + ( n i ) )
The length of the tape measure stretched to c + 1 turns is L 2 as follows:
L 2 = 2 π · ( r + ( n c ) · d ) · θ 360
Using Equations (9) and (10), we can calculate the tree’s DBH D, as follows:
D = L 1 + L 2 π = ( r + ( n c ) d ) θ 180 + i = 0 c 2 d · ( r + ( n i ) )
Formula (11) is a simplified mathematical model. To accurately understand the accuracy range of the model used in this study, it is crucial to clarify the key assumptions behind it. The DBH calculation model used in this study is a physical model based on a variable radius, using the following assumptions: tape thickness and tape elasticity.
  • Tape Thickness: As described in Formula (8), the physical measurement process already accounts for the cumulative effect of the tape thickness. Formulas (9)–(11) are corrected for the default thickness.
  • Tape Elasticity: We assume that the operator applies a consistent and slight pulling force during measurement. Under these conditions, the elastic deformation of the tape is minimal and can be ignored.
The error term k: This model represents some error sources that cannot be modeled, such as irregularities caused by the bark surface texture and slight errors in the operator’s failure to maintain the tape in an absolutely horizontal position.

3. Software Design

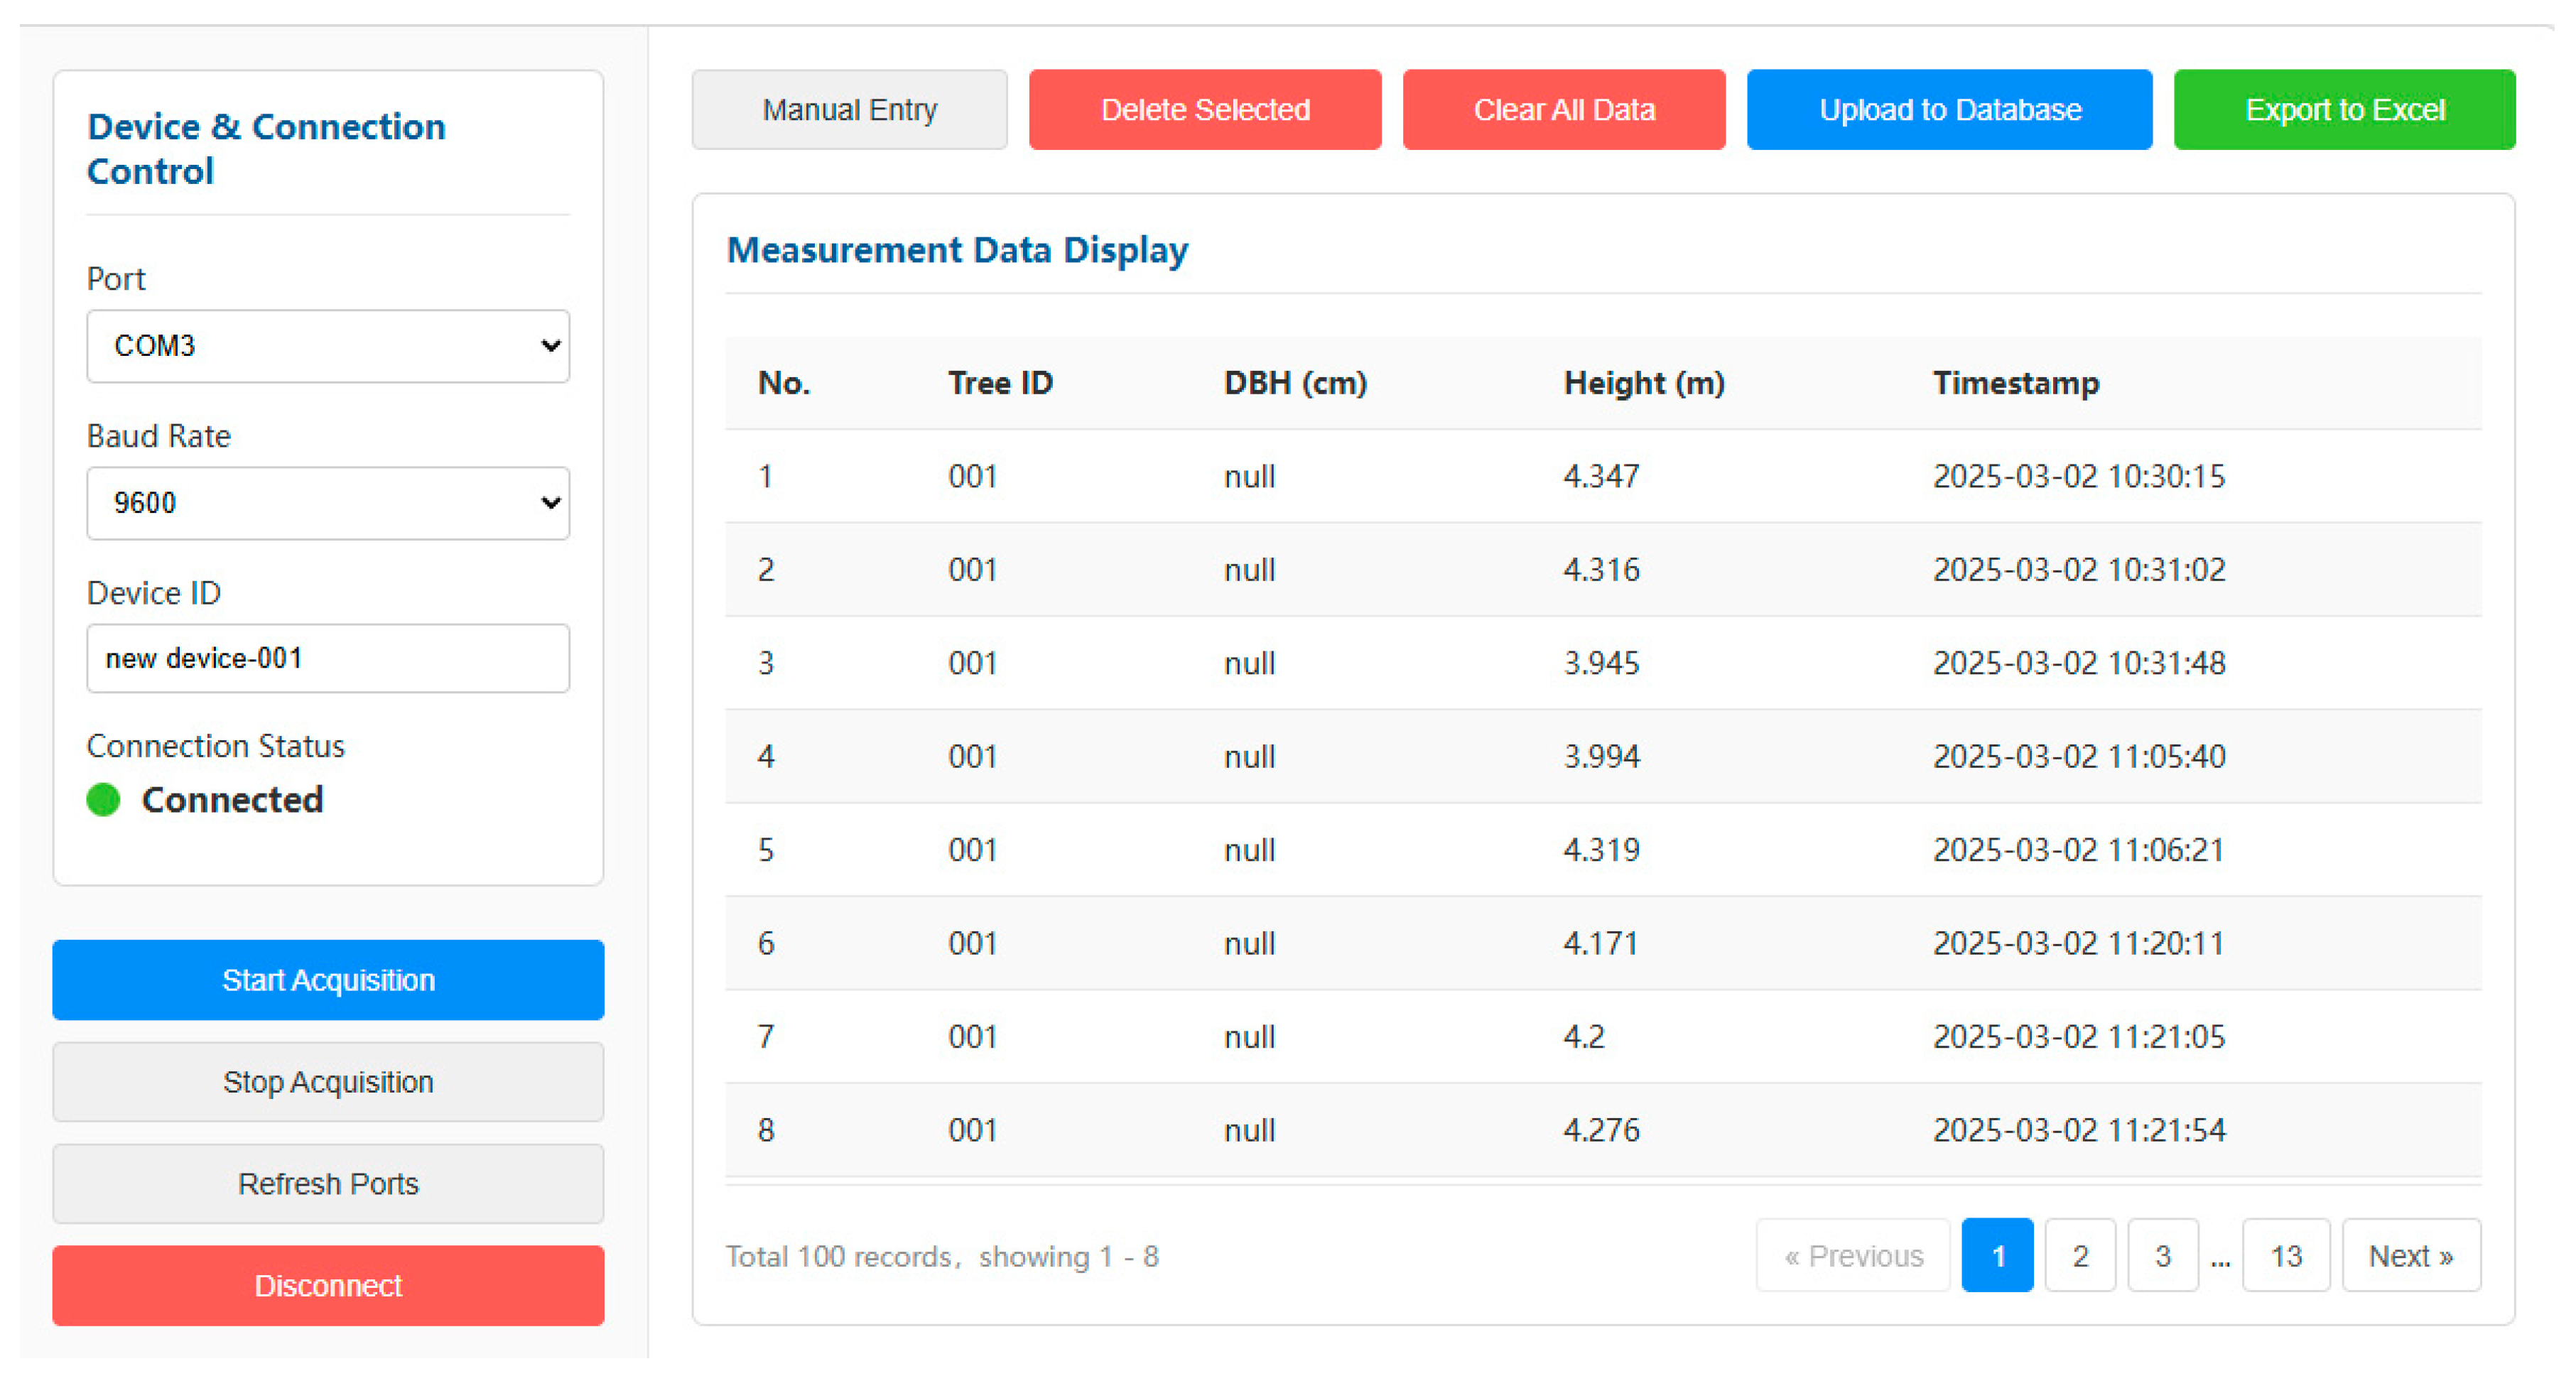
The measurement software is principally divided into the following four categories: key control, DBH calculation, tree height calculation, and data management. After the data is calculated, it is displayed on the LED screen and transmitted to the host computer via Bluetooth. As shown in Figure 9, the host computer mainly realizes the functions of data query and storage. The overall system’s flow is illustrated in Figure 10.

4. Experiments and Analysis

4.1. Experimental Location and Subjects

The experiment was conducted in the botanical garden of the East Lake Campus, Zhejiang A&F University (30°15′ N, 119°43′ E), west of Hangzhou, Zhejiang Province, a site characterized by its high diversity of tree species. To accurately assess the precision of the apparatus, this study was structured in two parts. The initial segment of this study concentrated on the measurement of tree height, employing Prunus mume (Siebold) Siebold & Zucc. and Koelreuteria paniculata Laxm. as the subjects. These measurements were executed under three distinct conditions to simulate a realistic forest understory environment. It is important to note that the experimental subjects for this study were selected from a university botanical garden, primarily representing young and middle-aged trees, with the maximum measured tree height reaching 15.8 m. Therefore, this dataset is intended to validate the device’s performance in this specific context, and its findings may not be directly generalizable to all forest ecosystems, particularly those containing taller, mature trees or a diverse composition of tree species. The second part of this study involved measuring the DBH of 80 trees, encompassing six species: The following taxa were sampled: Magnolia denudata Desr., Cinnamomum cassia (L.) J.Presl, Cinnamomum camphora (L.) J.Presl, Ginkgo biloba L., Phyllostachys edulis (Carrière) J.Houz., and Platanus × acerifolia (Aiton) Willd.

4.2. Experimental Procedure

The experiment was divided into two components: height measurement and DBH measurement. For the height measurement, the reference true value was obtained using a tower tape measure. For the DBH measurement, the reference true value was determined using a traditional caliper (Taipingyang brand). Although these standard instruments themselves exhibit minor inherent measurement errors, in this study we followed the more commonly used research methodology in forestry surveys and treated their readings as accurate ground-truth benchmarks. The height measurement employed a controlled variable method, dividing the height assessment into three experiments to systematically evaluate the device under varying height gradients, measurement distances, and slope conditions Experiment 1 divided the height into three gradients, selecting a representative tree sample from each of Height I (0–5 m), Height II (5–10 m), and Height II (10–15 m). The maximum tree height measured in this study was 15.8 m. Each sample was measured 20 times using the device and then compared with a laser altimeter and a traditional Blume-Leiss altimeter. In Experiment 2, to specifically isolate the impact of measurement distance on device performance, a single Koelreuteria paniculata tree with a reference true value of 8.74 m was selected as the measurement object. This ensured that individual differences between trees would not become a confounding factor, allowing for a more direct assessment of the impact of the distance variable. The distances in question are as follows: Distance I, 5 m; Distance II, 10 m; and Distance III, 15 m. The device was utilized to measure the tree 20 times at each location, and the measured values were documented. The selection of 5, 10, and 15 m as test distances is based on basic forestry survey methods. Generally, surveyors stand at a horizontal distance roughly equal to the tree height, which provides an optimal observation angle close to 45 degrees. The operating range of this device is not limited to these specific distances. The measurement range is primarily limited by the effective measurement range of the laser sensor. In strong light conditions, the L1-40 can measure within 20 m. In Experiment 3, three trees of similar height were selected. The device was utilized to execute 20 measurements at a single location under three distinct terrain conditions: The inclines in question are Slope I (4.73°), Slope II (19.87°), and Slope III (37.52°). For the DBH measurements, the reference true value was determined by data collected using a tape measure. In accordance with the protocols established by the national forestry survey standards, all measurements were obtained at a height of 1.3 m above the ground level. Given the DBH’s resilience to external environmental influences, a sample of 80 trees was measured and compared with the reference true value, determined using a tape measure. A detailed summary of the tree characteristics for the height and DBH validation datasets is provided in Appendix A (Table A2 and Table A3, respectively).

4.3. Tree Height Measurement Process

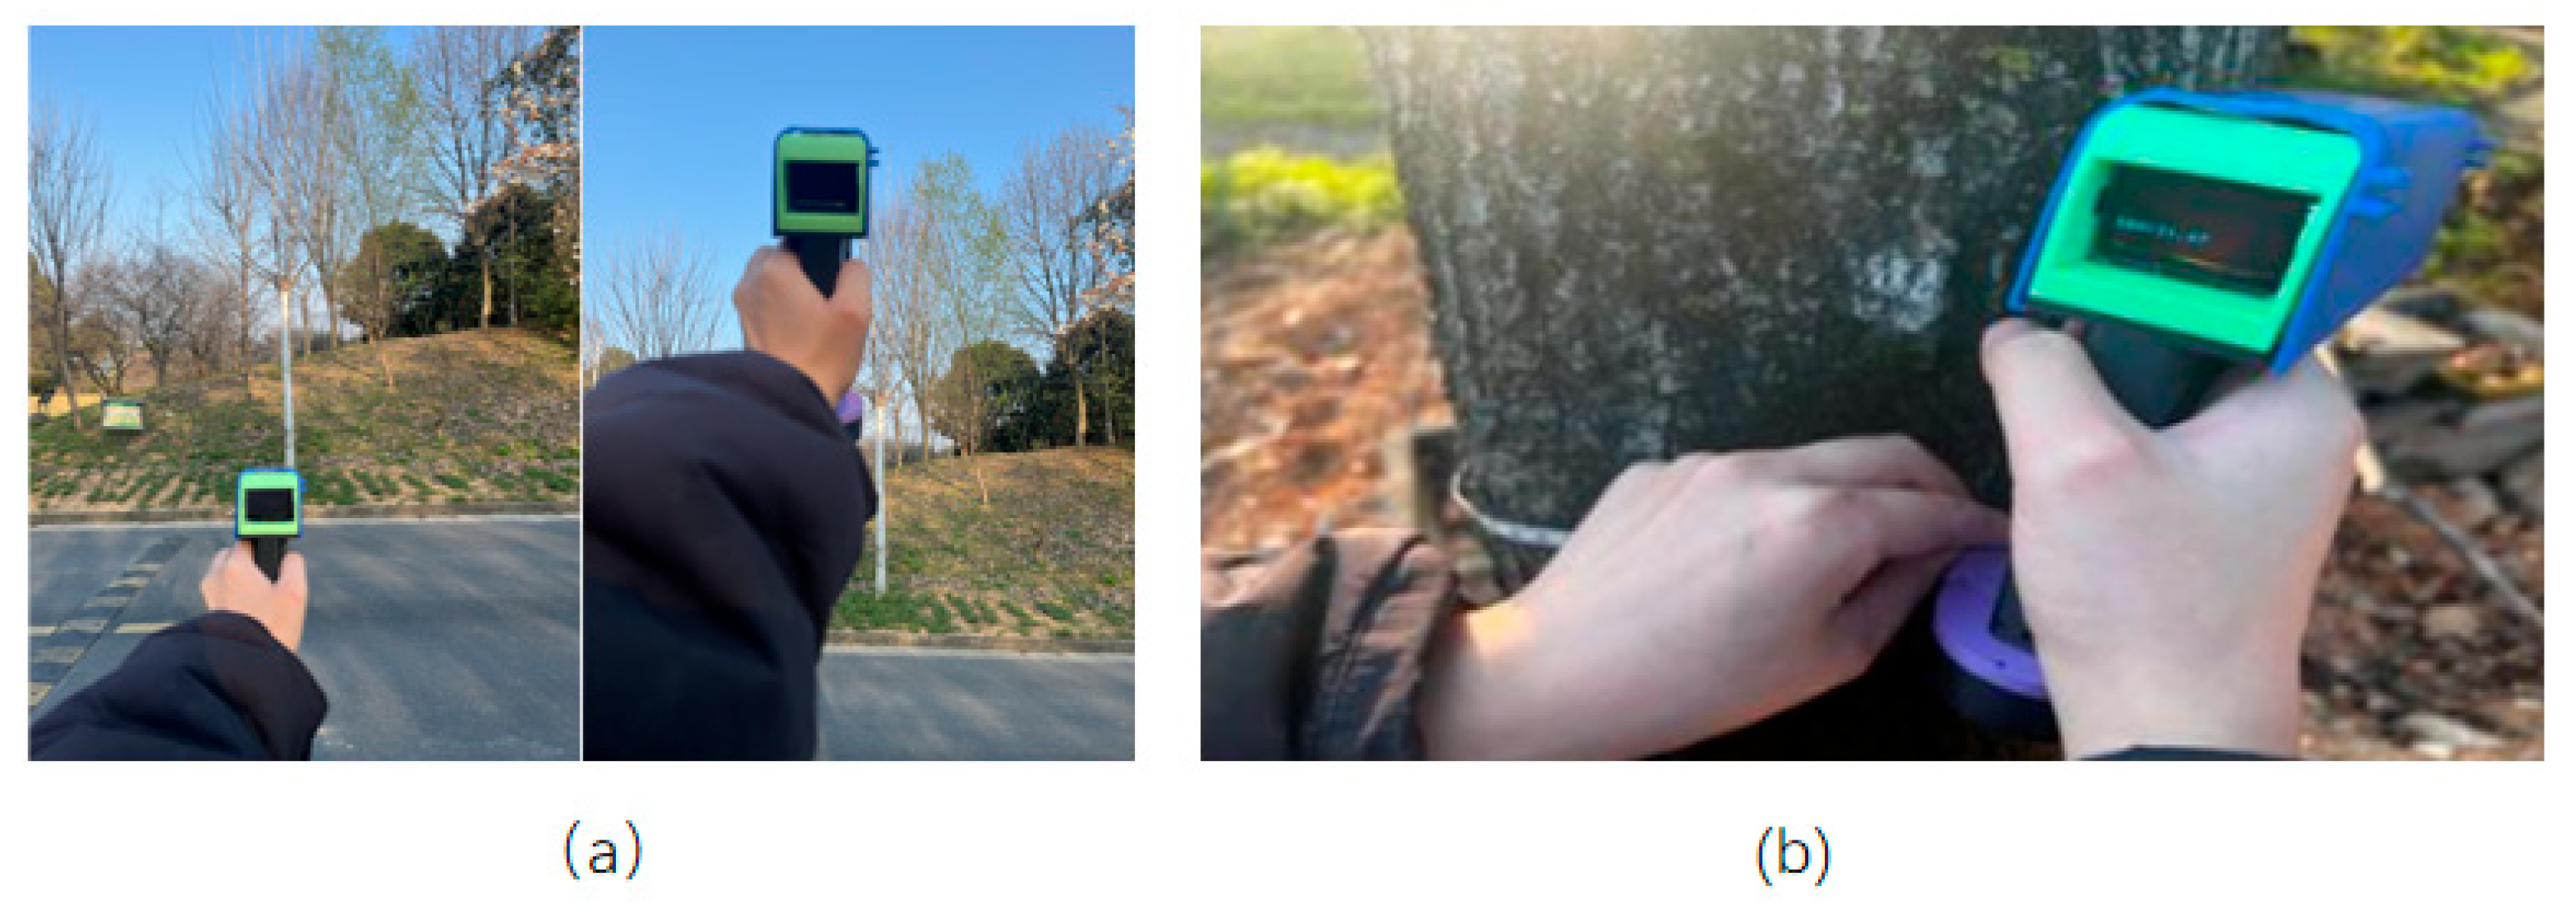
The measurement of the DBH and tree height are two independent functions of this equipment, and the operator can perform them in any order. To measure the tree height, first turn on the device and press the Tree Height Measurement function button. Aim the device at the base of the tree. The laser rangefinder will measure the tilt distance between the two points, and the attitude sensor will calculate the device’s current pitch angle. Once the reading stabilizes, press the Confirm button to lock the base point data. Next, raise the device and aim it at the treetop, then press the Confirm button again. The device will calculate the tree height based on the attitude sensor’s current pitch angle and the data obtained in the first step, and the final tree height value will be displayed on the screen. To begin a new measurement, simply press the function key again to repeat the operation (as shown in Figure 11a).

4.4. DBH Measurement Process

Power on the device and press the DBH Measurement function key. The screen will immediately display the current DBH reading. Extend the internal diameter tape and wrap it around the tree trunk at a height of 1.3 m, ensuring the end of the tape aligns with the measurement slot. As shown in Figure 11b, press the Confirm button to record the current DBH value. Pressing the function key again will repeat the measurement operation.

4.5. Measurement Accuracy and Efficiency Evaluation

(1) Assessment of measurement accuracy: This paper sought to quantitatively evaluate the tree height and DBH measurement accuracy of the developed handheld measuring device. To this end, an error comparison analysis was conducted using the reference values obtained using a tower ruler and a traditional girth ruler (Taipingyang brand). Subsequently, the obtained data underwent a rigorous statistical analysis, followed by a comparison with the existing data to assess the presence of systematic bias and to ascertain the measurement accuracy. The accuracy assessment was performed using Equations (12)–(16), where d a t a i   represents the data measured by the device and T u r e i   represents the true value of the measured data.
  B I A S = i = 1 n d a t a i T u r e i n
  r e l B I A S = i = 1 n d a t a i T u r e i 1 n × 100 %
  R M S E = i = 1 n d a t a i T u r e i 2 n
  r e l R M S E = i = 1 n d a t a i T u r e i 1 2 n × 100 %
S D = d a t a i d a t a ¯ 2 n 1  
All statistical analyses of the tree height measurements were based on 20 replicate measurements (n = 20) for each experimental condition. Before performing t-tests, we performed a Shapiro–Wilk test on the error data for each group to assess normality. The results showed no significant deviations from a normal distribution (p > 0.05), confirming the assumptions underlying the t-test.
(2) Efficiency evaluation: A plot of 24 standing trees was selected from the experimental site, with the trees spaced approximately 1 to 5 m apart. The area is approximately 370 square meters. The experiment was meticulously divided into two groups: one group comprising one individual was tasked with performing measurements using the device described in this paper, and the measurements were subsequently uploaded to a computer for storage and record. The second group utilized a conventional Blume-Leiss altimeter and a tree DBH ruler, with two individuals performing the measurements and one recording the data. Subsequent to the collection of measurements, a member of the research team entered the data from the paper record sheet into a computer and proofread it. The duration of time spent by the two groups during the operation was meticulously recorded. The mean time spent per tree, the time spent by the person performing the operation, and the time spent per person per tree were subsequently calculated for the purpose of evaluation. The calculation formula is as follows:
  T 1 = T f n t
T 2 = T 0 × p 0 + T f × p f
  T 3 = T 2 n t
In this study, T 1 denotes the average time spent on a single tree, T 2 represents the manpower time, T 3 signifies the average time spent per tree per person, T 0 is the time spent indoors, T f is the time spent outdoors, p 0 is the number of people working indoors, p f is the number of people working outdoors, and n is the total number of standing trees in the plot, n = 24.

5. Result

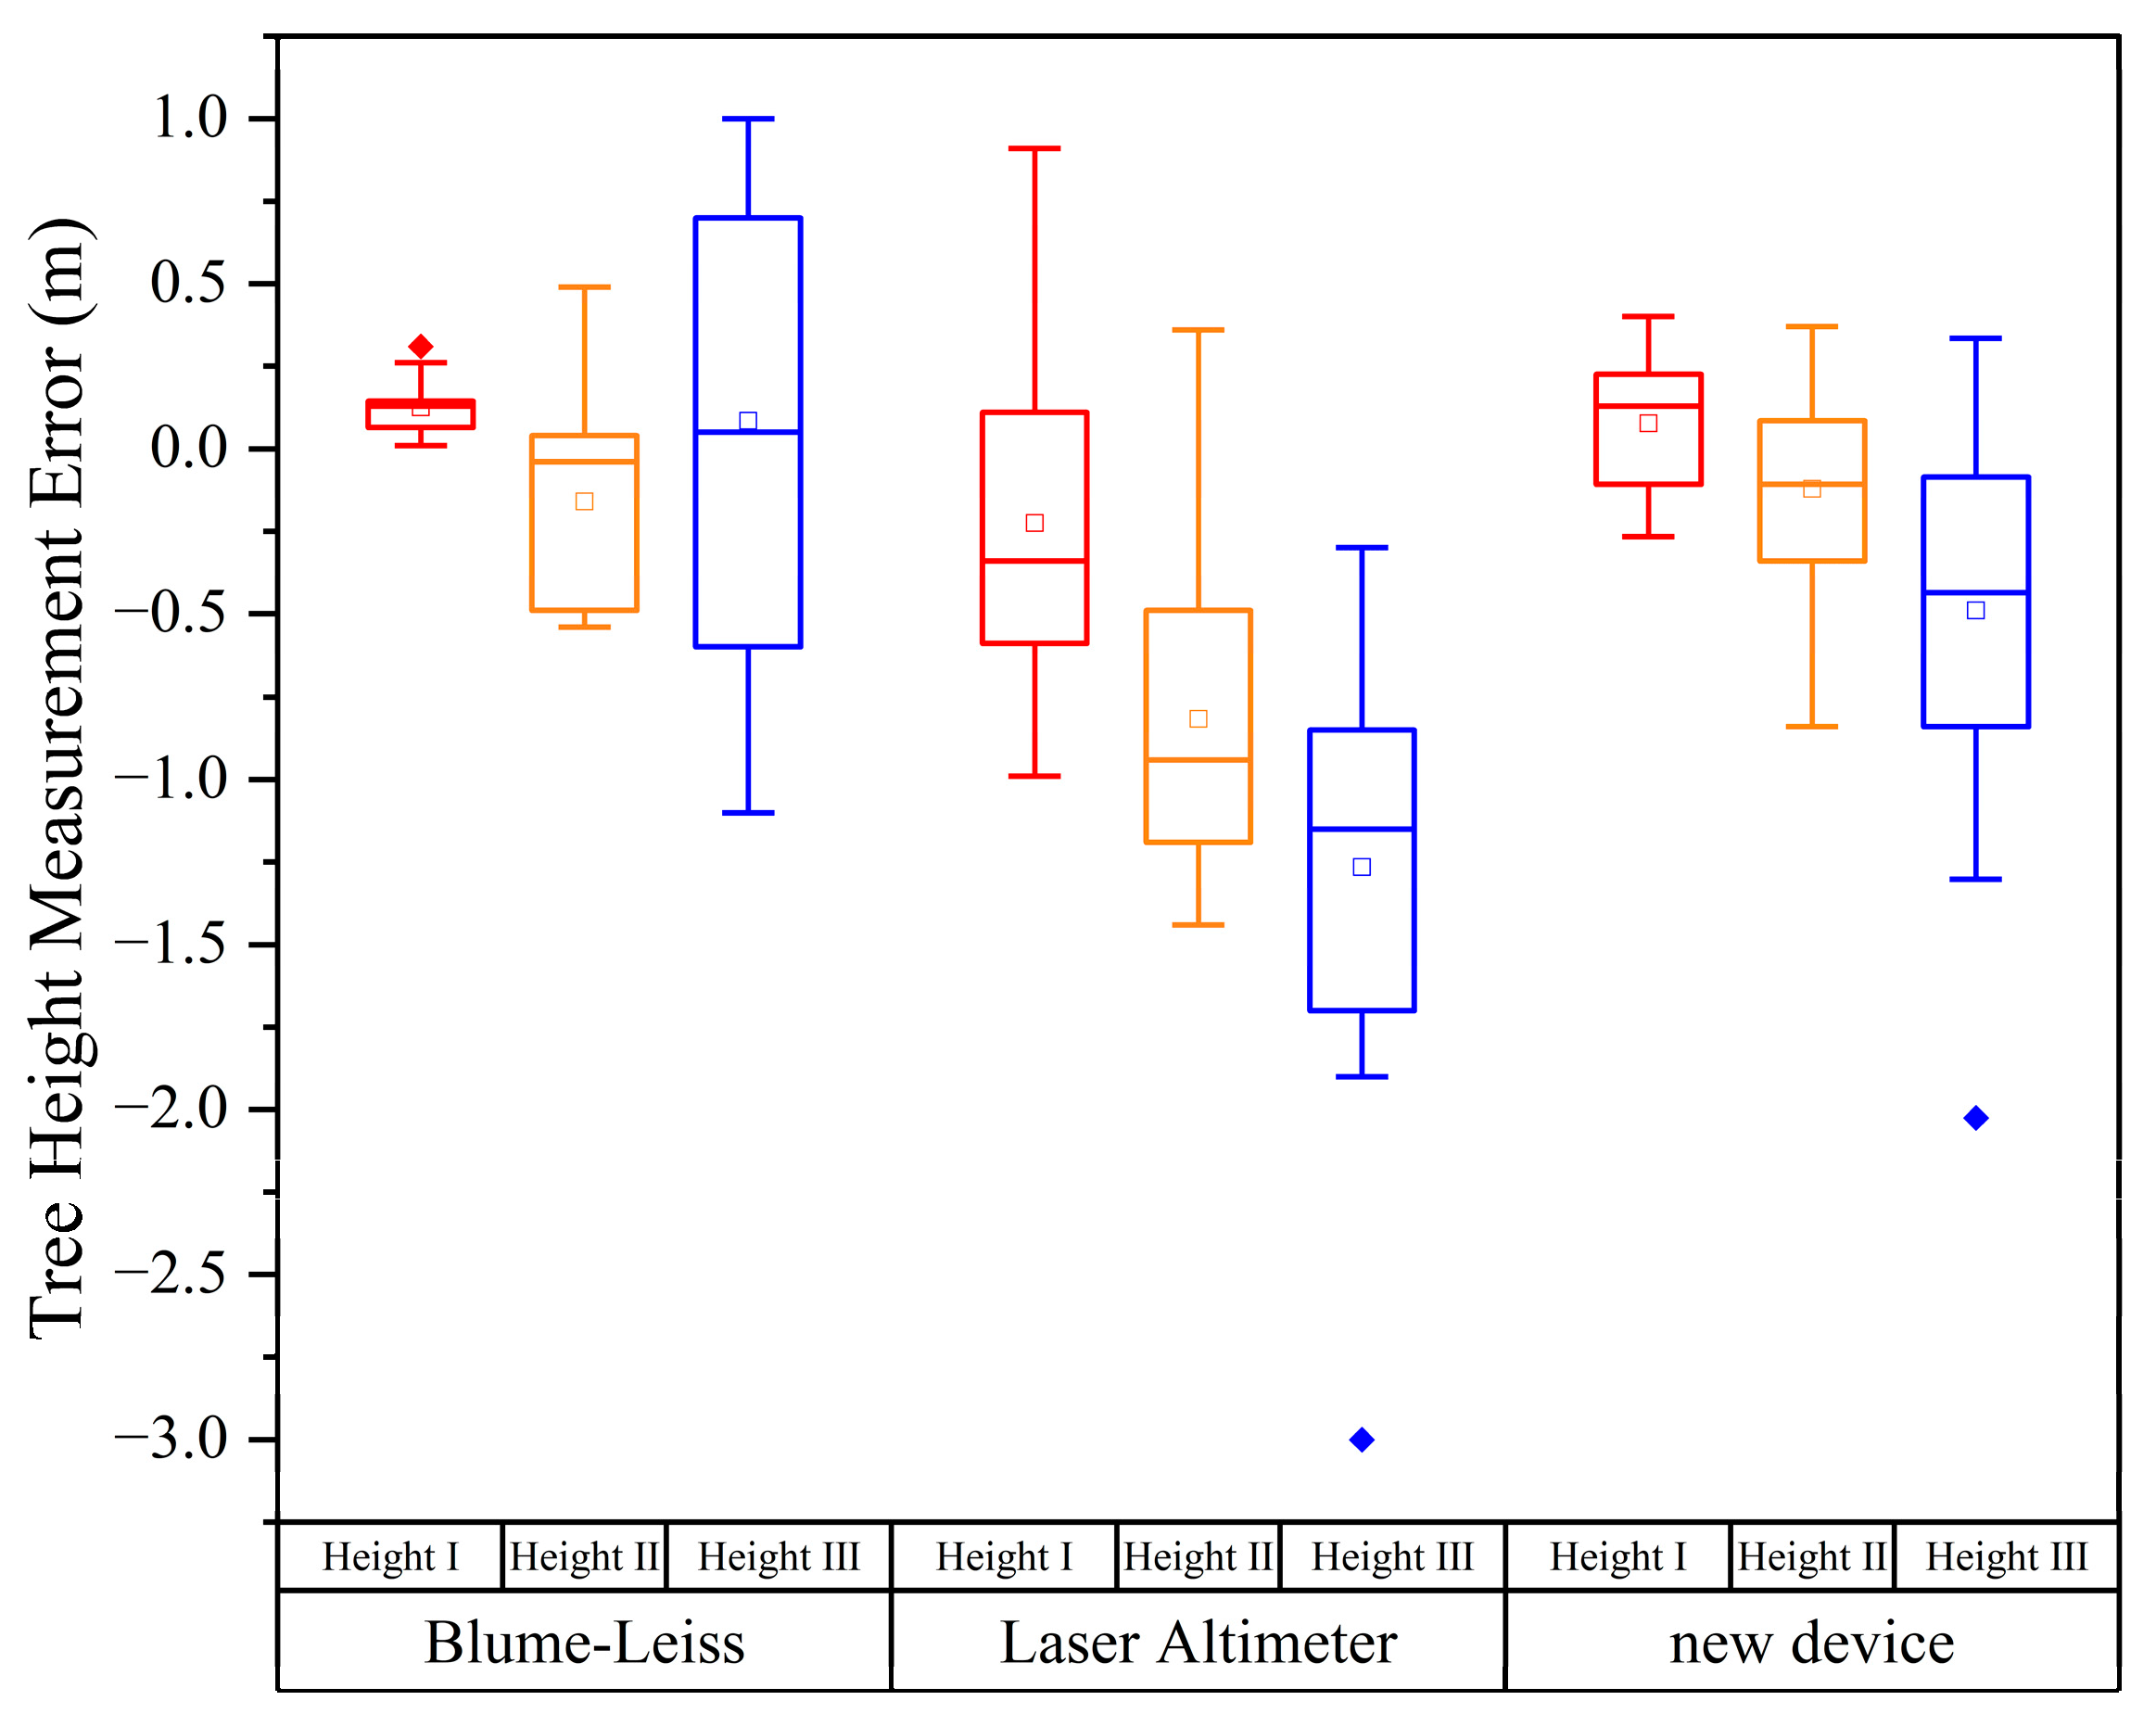
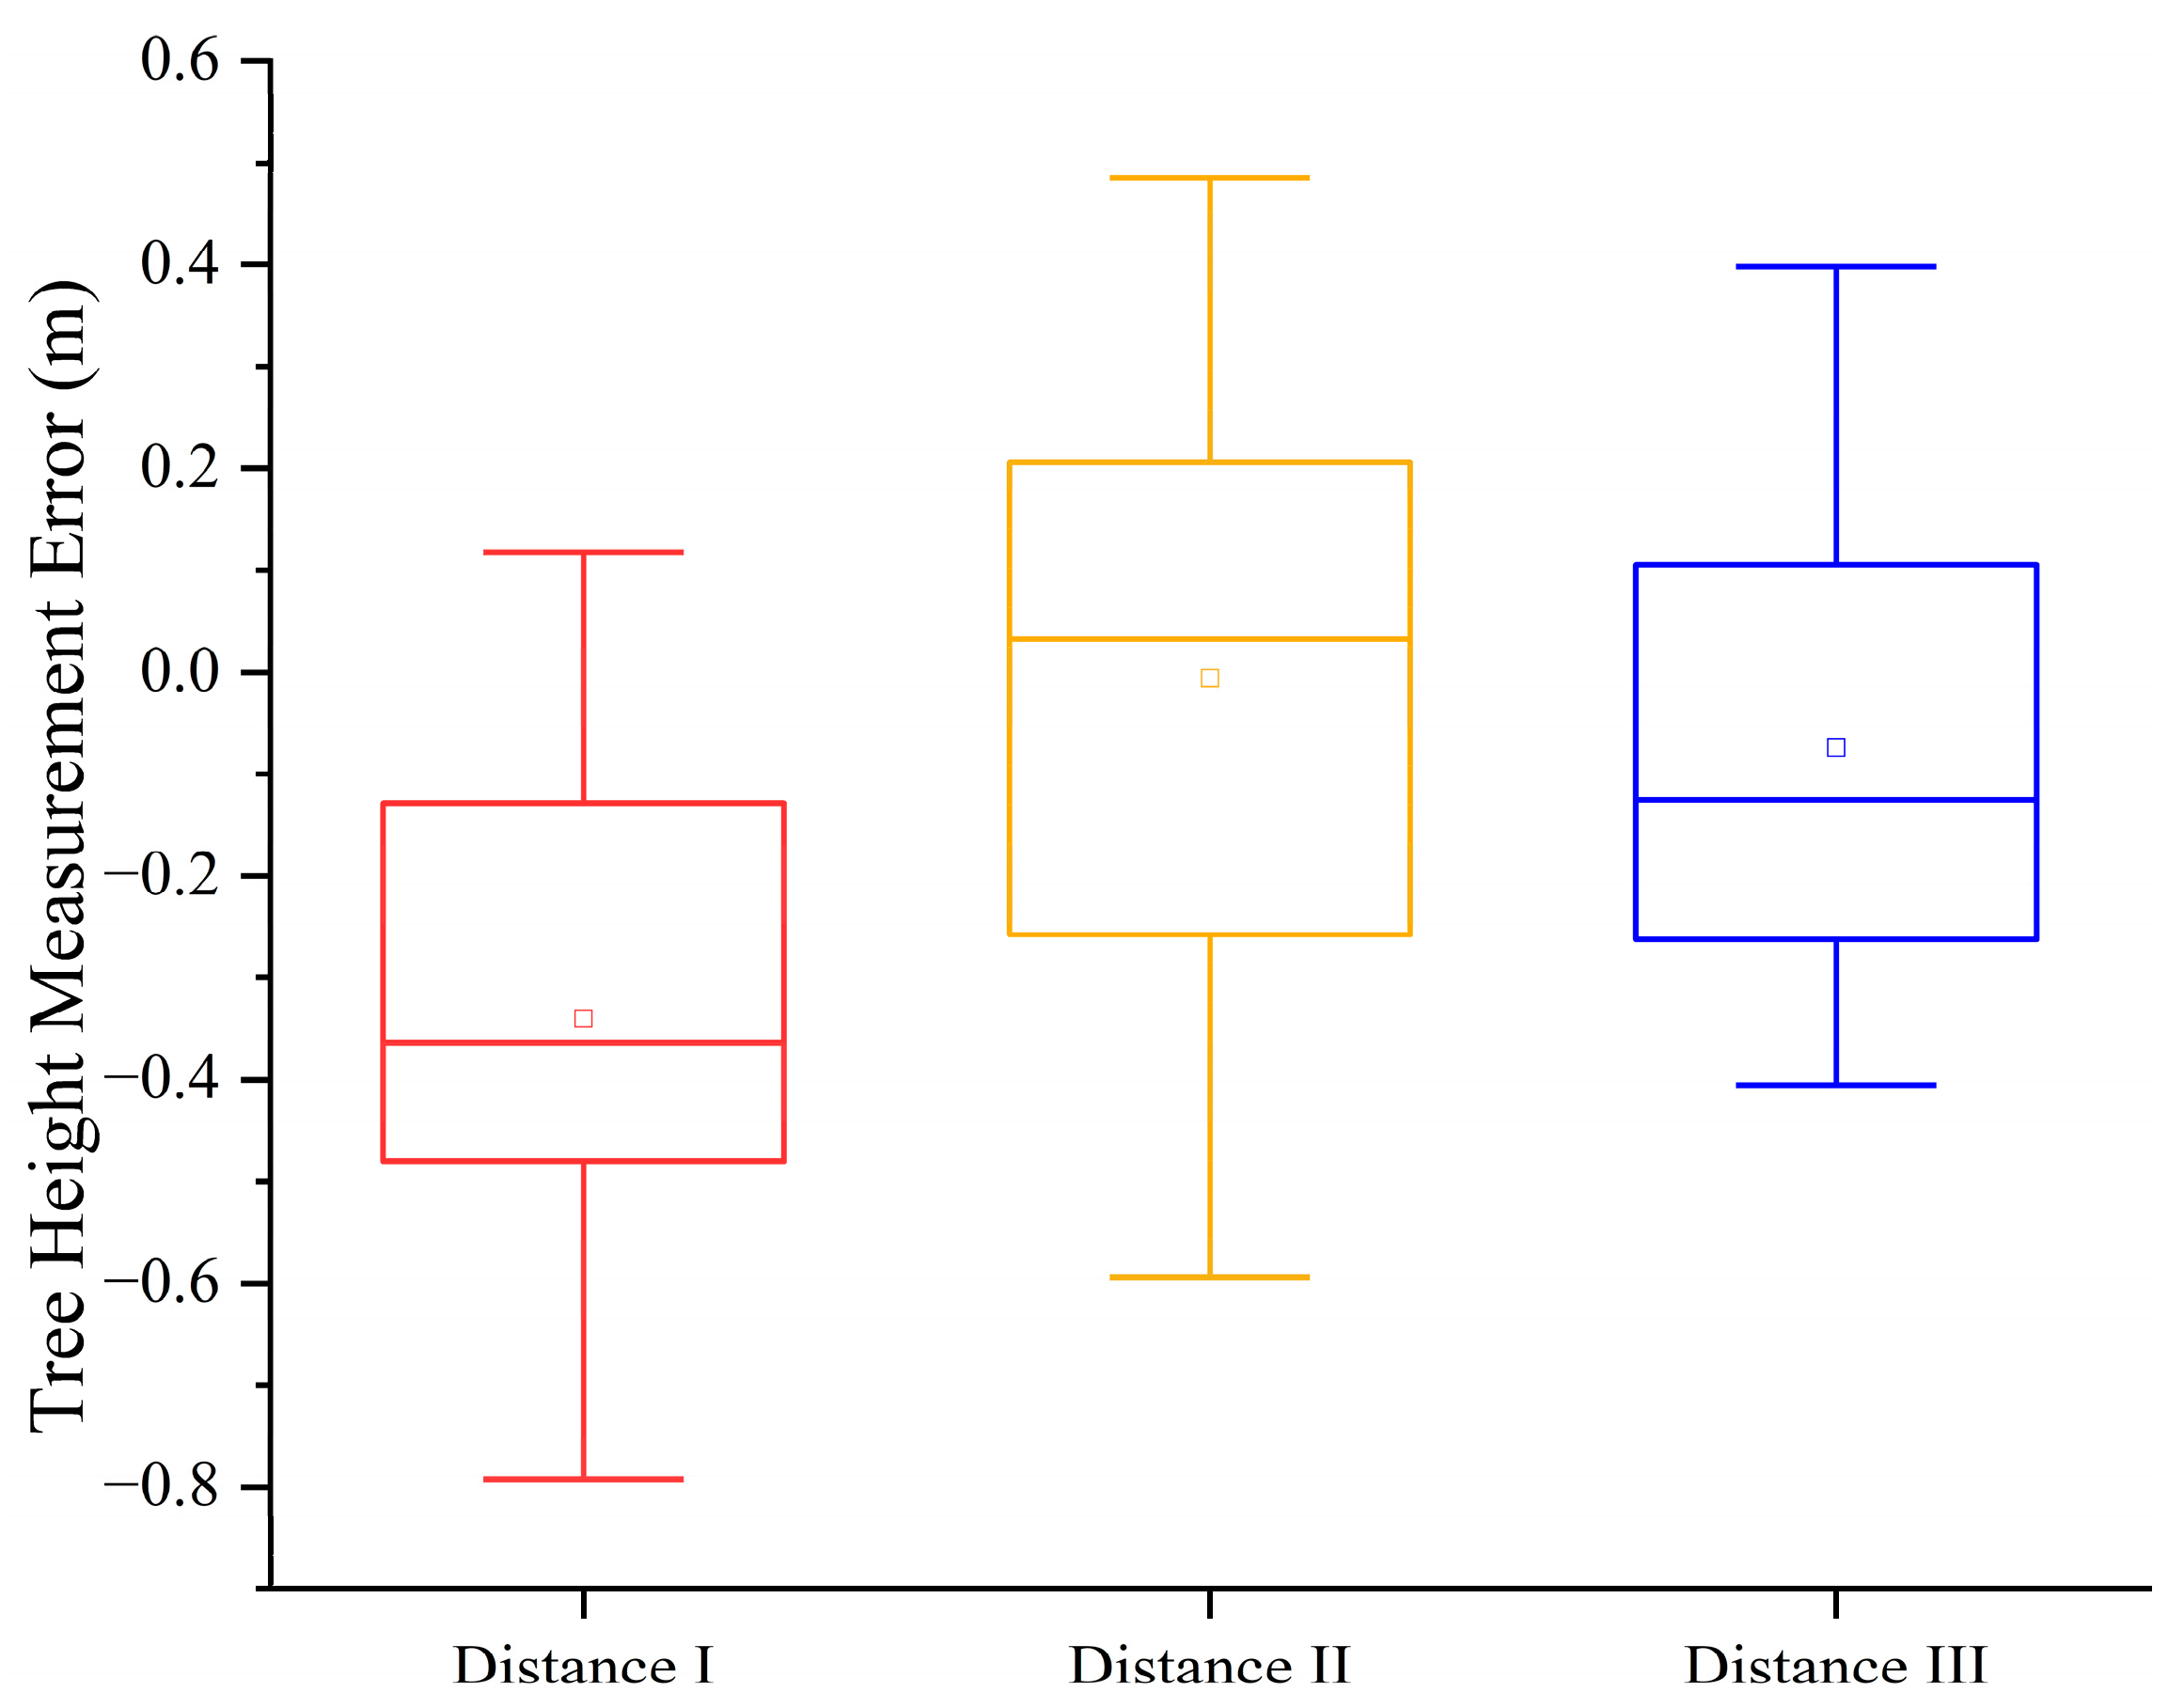
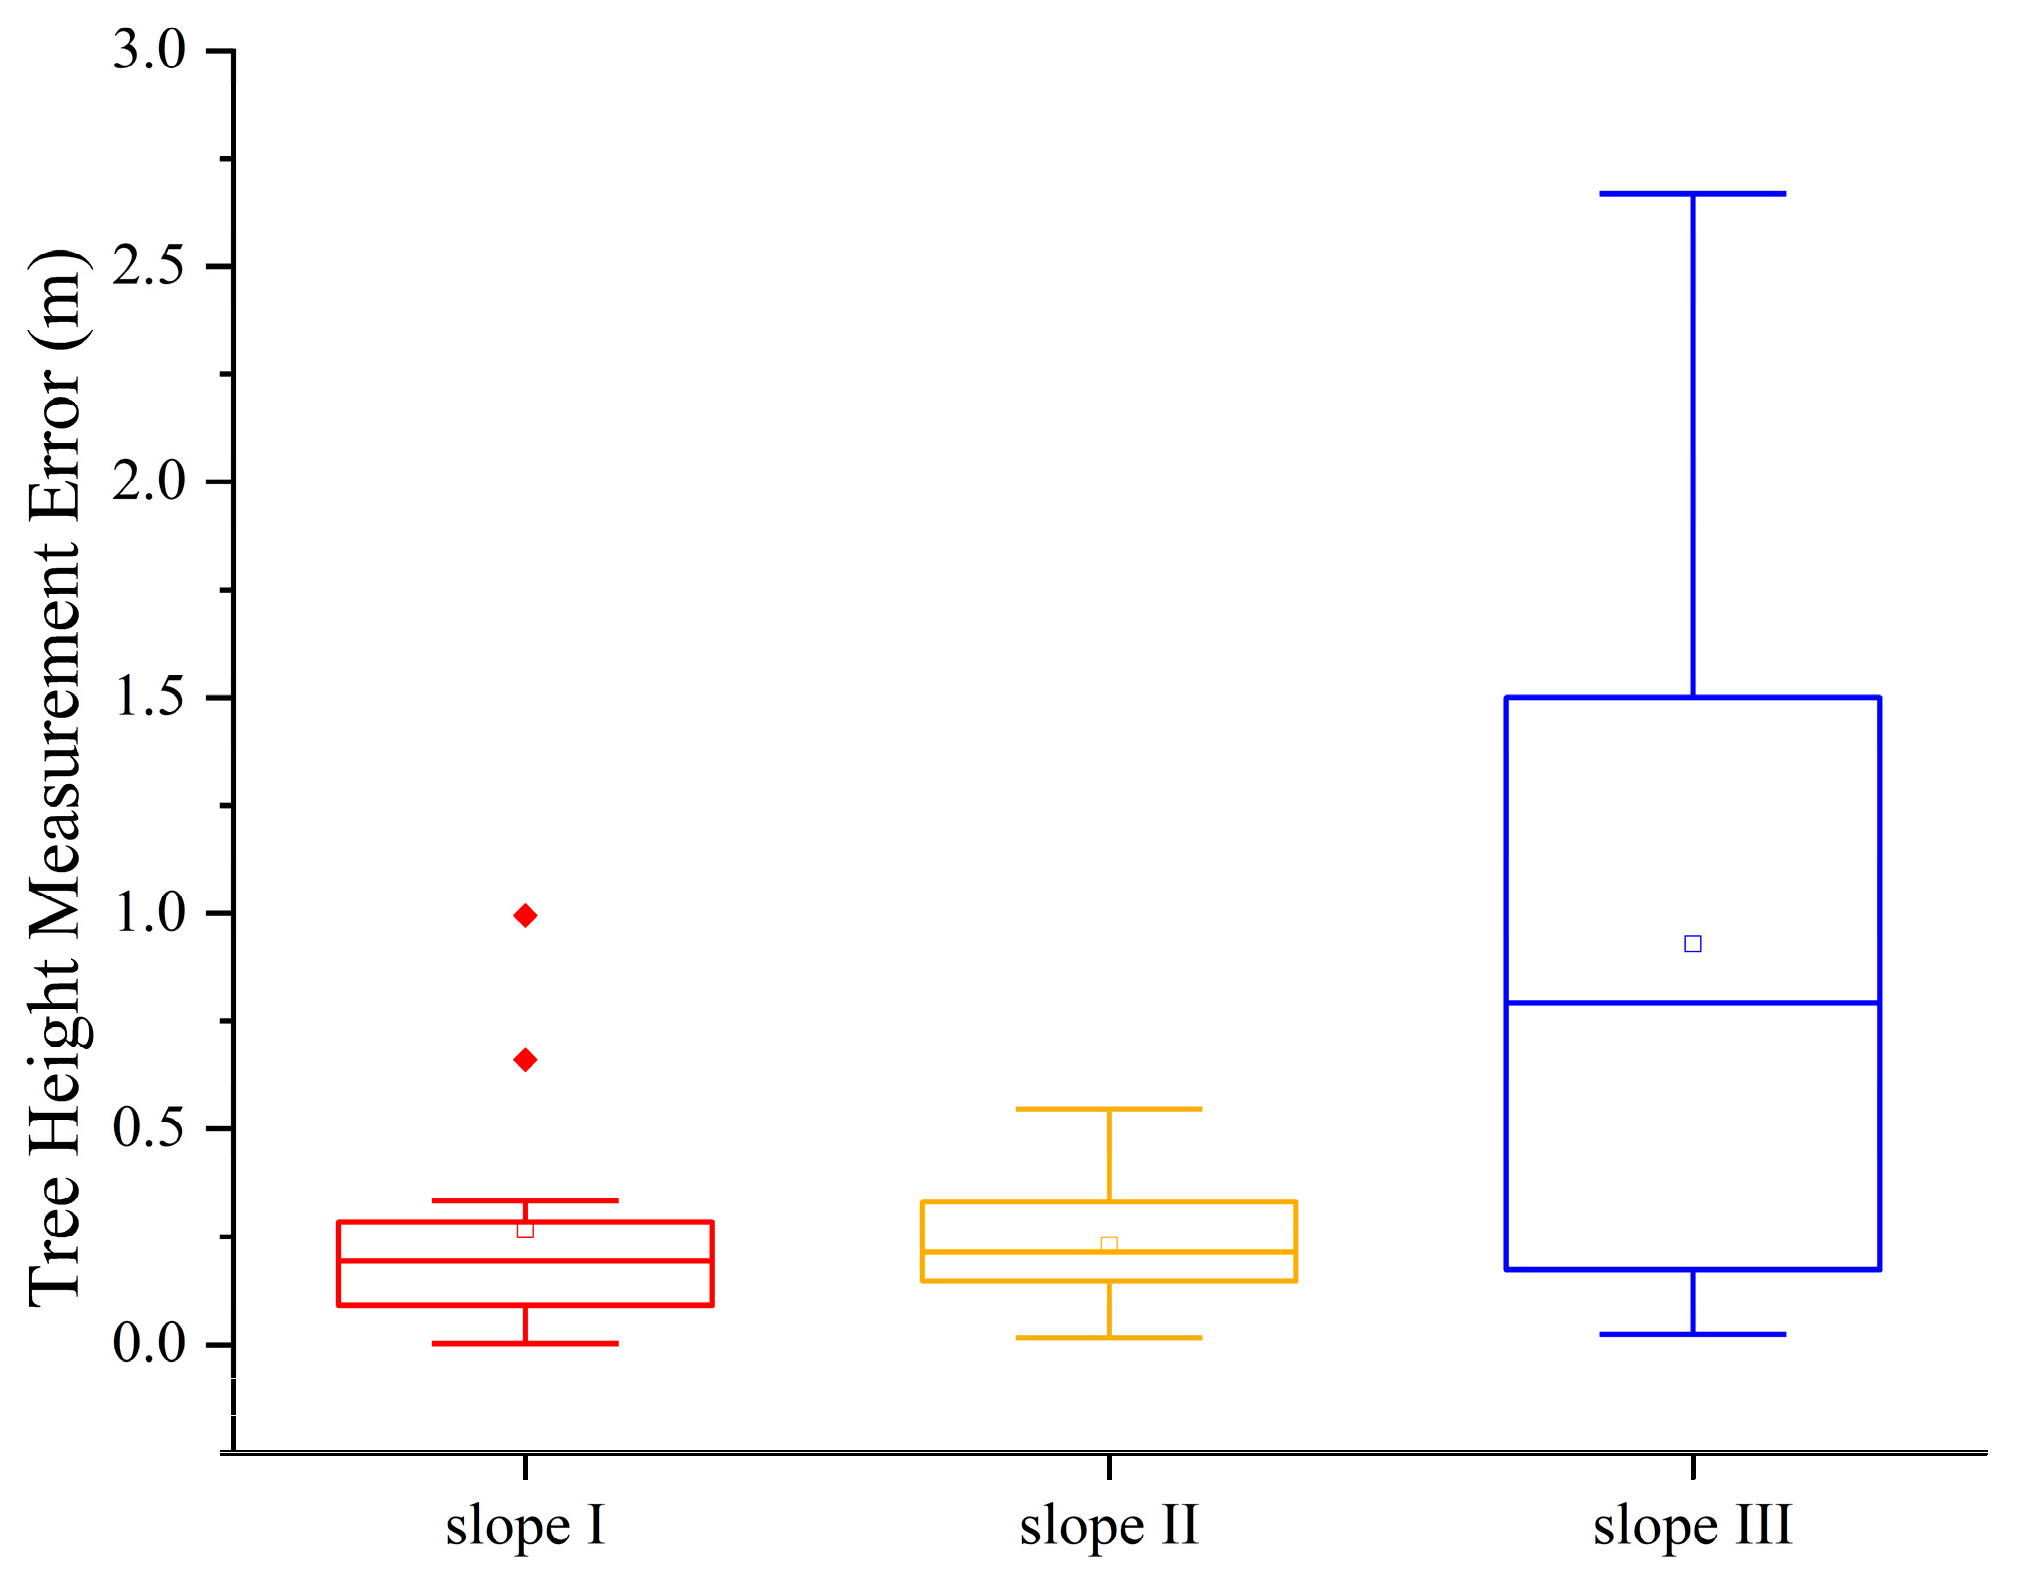
As shown in Table 1 and Table 2 and Figure 12, the average root mean square error (RMSE) of the tree height measurements using this device ranges from 31 to 55 cm, and the relative RMSE ranges from 3.55% to 10.27%. Comparative testing shows that the tree height accuracy of this device is superior to that of a laser altimeter in most cases and approaches that of a Blume-Leiss altimeter. Figure 13 shows that the device’s error varies slightly at different distances; however, as shown in Table 3 and Figure 14, the relative RMSE of the equipment increases to 17.85% as the slope increases.
As shown in Table 4, among the 80 trees measured, the device exhibited a minimal deviation of 0.15 cm, with a 95% confidence interval of [0.1, 0.19]. The overall relative root mean square error (relRMSE) was 1.28%. An analysis by tree species reveals consistent and robust performance across different species. The relRMSE for all tested species remained below 2%, indicating that the device’s performance was not significantly affected by variations in bark texture among the measured species. According to the forest inventory technical specifications for developing countries [21], its performance meets industry standards.
In terms of operational efficiency, as shown in Table 5, the average time required to measure the height and DBH of a single tree using this device is only 14.41 s, compared to the traditional method requiring three-person collaboration (43.41 s per tree), thereby reducing the number of operators from three to one and significantly lowering labor costs. Additionally, the device enables the real-time processing of field data, eliminating the need for post-processing and substantially improving efficiency.
As shown in Table 6, we conducted hypothesis testing on the performance of each instrument. The results showed that the bias of our device was not statistically significant at altitudes of 4.19 m and 8.74 m, The laser altimeter shows obvious system deviation at altitudes greater than 5 m. We then conducted paired t-tests comparing our device with two reference instruments. The results showed no statistically significant difference between our device and the traditional Blume-Leiss altimeter at altitudes of 4.19 m and 8.74 m, confirming its reliability. Furthermore, our device showed significant performance differences from the laser altimeter at all tested altitudes.

6. Discussion

A key question regarding the equipment used in this study is whether it meets forestry accuracy requirements. According to the New Zealand Institute of Forestry (NZIF) [22], the tolerance for tree height measurement error is 3% to 5%. The equipment achieved a relative root mean square error (relRMSE) between 3.55% and 6.55% at typical measurement distances and gentle slopes, which is generally in line with industry standards. In order to objectively evaluate the results of this study, its limitations must be recognized. The results presented here serve as a successful proof-of-concept and provide preliminary validation of its core functionality. While performance under test conditions is encouraging, extensive further testing under a wider range of forestry operating conditions is required before the device can be definitively recommended for widespread professional use. Specific limitations identified during this initial phase will guide our future validation efforts and are detailed below:
First, this experimental validation was conducted primarily on trees with a maximum height of approximately 15 m. This did not cover the heights of trees in mature or overmature forests. Furthermore, while the small sample size used in this tree height experiment was sufficient to verify the device’s performance and stability under controlled conditions, it was not statistically sufficient to generalize the conclusions about tree height measurement accuracy to all forest types. Therefore, future work will focus on validating the device on a wider range of tree species, as well as on more complex terrain and stand densities. In addition, the maximum slope in this slope experiment was only 37.52°, which cannot capture the complex terrain (>45°) in forests. The experimental results show that the relative root mean square error (RMS) of the tree height measurement increases sharply with the increasing slope. This phenomenon suggests that the current version of the device is primarily recommended for forestry surveys on steep to moderate slopes. Future improvements to the optimization algorithm to compensate for the effects of slope will be key to expanding the device’s practical application in mountainous areas.
From a technical perspective, the device’s triangulation principle is inherently unrestricted by tree height. When measuring taller trees, all ground-based altimeters that rely on manual aiming, including this device, face a common challenge: the practical difficulty of accurately identifying and aiming at the true highest point of the treetop in dense forests. In actual measurement environments, two clear lines of sight are required: one to ensure the laser strikes the tree base, and the other to ensure the operator can visually aim at the highest point of the tree. In dense forestry environments, branches, leaves, or nearby trees may block either line of sight, causing measurement failure. Furthermore, as laser sensors measure horizontal distance, their performance is sensitive to ambient lighting conditions. In very bright, direct sunlight, the sensor’s signal-to-noise ratio may be low, reducing its effective measurement distance. Currently, the efficiency comparison of the device is based on a single measurement task. While the results demonstrate the device’s significant potential for saving time and labor, the lack of statistical validation prevents us from testing the significance of this difference. More rigorous, replicated experiments are needed to quantify the efficiency gains. Future research should focus on validating the device’s performance across a wider range of tree heights and in more diverse forest ecosystems, such as high-density natural forests, to fully determine its capabilities and applicability in various operational scenarios.
This study successfully developed a new portable device that integrates both DBH and tree height measurement capabilities. Its most significant advantage is that it significantly improves forestry survey efficiency while maintaining high accuracy. Experiments have shown that the device meets forestry requirements for tree height measurement and exhibits high reliability (relRMSE < 2%) for the DBH measurements. Compared to existing mainstream handheld devices (such as the Haglöf Vertex series and the Laser Technology TruPulse series), as shown in Table 7, these devices offer high precision but typically retail for over USD 500 to USD 2000 [23,24,25,26,27]. By contrast, this device holds a significant advantage in hardware costs (with estimated material costs around USD 100; see Appendix A, Table A1 for a detailed breakdown). This device offers an integrated solution capable of measuring the two most critical parameters in forestry at a cost significantly lower than that of specialized equipment. By contrast, this study fills the needs of routine forestry surveys at a very low cost, providing an economically feasible, technically reliable, and efficient tool for forest resource monitoring at grassroots forestry stations, community forest farms, and in developing countries.

7. Conclusions

This paper developed a tree survey device for forestry inventory. Incorporating a novel, independently developed structure, it achieves integrated measurement of tree height and DBH. Experimental results show that the relRMSE of tree height measurement using this device on flat ground and gentle slopes ranges from 3.55% to 6.55%. In terms of the DBH measurement, its relRMSE is only 1.28%. Furthermore, system software is included to enable data storage and upload. The device has proven to be portable and low-power, significantly reducing labor intensity. However, this device still has limitations. Current research on tree height measurement only tests the device’s performance under controlled conditions, which is insufficient for generalization to all forest environments. More extensive experimental testing is needed in the future. In high-precision forest inventory, an error of less than 20 cm is generally required. The RMSE of 31 to 55 cm currently achieved still needs to be improved in future research. The accuracy of tree height measurement will drop significantly on steep slopes. As the slope increases, the relRMSE increases sharply from 6.55% to 17.85%, which clearly defines the applicability limit of the current version of the device. Future work will focus on implementing Kalman filter algorithms to compensate for slope effects or integrating GNSS modules to enable automatic coordinate recording. Specifically, the Kalman filter algorithm dynamically fuses data from the MPU6050’s internal accelerometer and gyroscope to generate a more stable and accurate real-time inclination angle, mitigating the increased sensor noise and drift observed on steep slopes. Furthermore, the use of specialized, higher-precision dual-axis incline sensors as replacements for the existing sensors could be explored. These sensors, designed for robust angle measurement in challenging conditions, offer a more direct solution for improving accuracy. These potential hardware and software improvements offer the potential to expand the device’s application range to even steeper terrain.

Author Contributions

Conceptualization, A.X.; methodology, L.F. and L.S.; formal analysis, K.Z.; investigation, K.Z.; data curation, S.Z. and L.F.; writing—original draft preparation, A.X.; writing—review and editing, L.S., L.F. and X.Z.; All authors have read and agreed to the published version of the manuscript.

Funding

This research was financially supported by the National Natural Science Foundation of China (No. 42001354), the Zhejiang provincial key science and technology project (Grant No. 2018C02013), the Zhejiang University Student Science and Technology Innovation Activity Plan (New Seedling talent Plan subsidy project, 2024R412B048).

Data Availability Statement

Dataset available upon request from the authors.

Conflicts of Interest

The authors declare no conflicts of interest.

Appendix A

The following table provides approximate breakdowns of material costs for the main components of this equipment. Prices may fluctuate with market conditions.
Table A1. Prototype Equipment Bill of Materials.
ComponentApproximate Price (USD)
MPU6050 Six-Axis Sensor5
STC15F2K60S2 Microcontroller1
L1-40 Laser Sensor50
JY-ME01-TTL Angle Sensor10
1.54-inch OLED Display10
Lithium Battery and Power Module5
3D Printed Casing and Mechanical Parts5
Other (Buttons, Wires, PCB, etc.)10
Table A2. Summary of Dataset for the Height Measurement Validation.
Tree IDSpeciesTrue Height (m)Number of Measurements
1Prunus mume4.19Used in Exp 1 (20 measurements)
2Koelreuteria paniculata8.74Used in Exp 1 (20 measurements)
3Koelreuteria paniculata15.8Used in Exp 1 (20 measurements)
4Photinia serratifolia (Desf.) Kalkmanr4.92Used in Exp 3 (20 measurements)
5Prunus mume4.12Used in Exp 3 (20 measurements)
6Pinus tabuliformis Carrière6.2Used in Exp 3 (20 measurements)
7Koelreuteria paniculata8.74Used in Exp 2 (20 × 3 = 60 measurements total)
Table A3. Summary of Dataset for the DBH Measurement Validation.
SpeciesSample Size (Number of Trees)DBH Range (cm)
Platanus × acerifolia27[11.11, 15.79]
Phyllostachys edulis15[6.27, 13.68]
Cinnamomum cassia12[19.94, 38.7]
Cinnamomum camphora10[22.7, 42.8]
Magnolia denudata9[8.25, 21.7]
Ginkgo biloba7[20.13, 32.68]
Total80[8.25, 42.8]

References

  1. Feldpausch, T.R.; Lloyd, J.; Lewis, S.L.; Brienen, R.J.W.; Gloor, M.; Mendoza, A.M.; Lopez-Gonzalez, G.; Banin, L.; Abu Salim, K.; Affum-Baffoe, K.; et al. Tree height integrated into pantropical forest biomass estimates. Biogeosciences 2012, 9, 3381–3403. [Google Scholar] [CrossRef]
  2. Zeng, W.; Tomppo, E.; Healey, S.P.; Gadow, K.V. The national forest inventory in China: History-results-international context. For. Ecosyst. 2015, 2, 23. [Google Scholar] [CrossRef]
  3. Fortin, M.; Van Couwenberghe, R.; Perez, V.; Piedallu, C. Evidence of climate effects on the height-diameter relationships of tree species. Ann. For. Sci. 2019, 76, 1. [Google Scholar] [CrossRef]
  4. Sullivan, M.J.P.; Lewis, S.L.; Hubau, W.; Qie, L.; Baker, T.R.; Banin, L.F.; Chave, J.; Cuni-Sanchez, A.; Feldpausch, T.R.; Lopez-Gonzalez, G.; et al. Field methods for sampling tree height for tropical forest biomass estimation. Methods Ecol. Evol. 2018, 9, 1179–1189. [Google Scholar] [CrossRef] [PubMed]
  5. Feng, Z.; Du, P.; Yan, H.; Zeng, W.; Liu, J.; Feng, H. Practice and exploration for establishing new generation technology system of forest resources investigation and monitoring. For. Grassl. Resour. Res. 2018, 3, 5–14. [Google Scholar] [CrossRef]
  6. Zhang, Q.; Sun, Y.; Zheng, X.; Zhang, S.; Fang, L. Development of a Real-Time Continuous Measurement System for Tree Radial Direction. Forests 2023, 14, 1876. [Google Scholar] [CrossRef]
  7. Li, S.; Fang, L.; Sun, Y.; Xia, L.; Lou, X. Development of measuring device for diameter at breast height of trees. Forests 2023, 14, 192. [Google Scholar] [CrossRef]
  8. Zhao, K.; Li, S.; Wang, J.; Sun, L.; Fang, L.; Ji, J. Development and Application of Tree Radial Measurement Device. Forests 2024, 15, 1710. [Google Scholar] [CrossRef]
  9. Iizuka, K.; Yonehara, T.; Itoh, M.; Kosugi, Y. Estimating tree height and diameter at breast height (DBH) from digital surface models and orthophotos obtained with an unmanned aerial system for a Japanese cypress (Chamaecyparis obtusa) forest. Remote Sens. 2017, 10, 13. [Google Scholar] [CrossRef]
  10. Liu, G.; Wang, J.; Dong, P.; Chen, Y.; Liu, Z. Estimating individual tree height and diameter at breast height (DBH) from terrestrial laser scanning (TLS) data at plot level. Forests 2018, 9, 398. [Google Scholar] [CrossRef]
  11. Yu, D.; Feng, Z.; Cao, Z.; Jiang, J. Error analysis of measuring diameter at breast height and tree height and volume of standing tree by total station. Trans. Chin. Soc. Agric. Eng. 2016, 32, 160–167. [Google Scholar]
  12. Amann, M.C.; Bosch, T.M.; Lescure, M.; Myllylae, R.A.; Rioux, M. Laser ranging: A critical review of unusual techniques for distance measurement. Opt. Eng. 2001, 40, 10–19. [Google Scholar]
  13. Gordon, P.; Toth, C.K. Introduction to laser ranging, profiling, and scanning. In Topographic Laser Ranging and Scanning; CRC Press: Boca Raton, FL, USA, 2018; pp. 1–28. [Google Scholar]
  14. Antoni, R. Infrared detectors: An overview. Infrared Phys. Technol. 2002, 43, 187–210. [Google Scholar] [CrossRef]
  15. Fedorov, D.S.; Ivoilov, A.Y.; Zhmud, V.A.; Trubin, V.G. Using of measuring system MPU6050 for the determination of the angular velocities and linear accelerations. Autom. Softw. Enginery 2015, 11, 75–80. [Google Scholar]
  16. Huang, J. Design of angle detection system based on MPU6050. In Proceedings of the 7th International Conference on Education, Management, Information and Computer Science (ICEMC 2017), Shenyang, China, 16–18 June 2016. [Google Scholar]
  17. Hiroyoshi, I.; Inoue, J.-I. Theory of tunnel magnetoresistance. J. Magn. Soc. Jpn. 2006, 30, 1–37. [Google Scholar] [CrossRef]
  18. Li, J.; Liu, H.; Bi, T. Tunnel magnetoresistance-based noncontact current sensing and measurement method. IEEE Trans. Instrum. Meas. 2022, 71, 9503609. [Google Scholar] [CrossRef]
  19. Zitong, Z.; Zhang, K.; Leng, Q. Tunneling magnetoresistance (TMR) materials and devices for magnetic sensors. In Spintronics: Materials, Devices and Applications; John Wiley & Sons: Hoboken, NJ, USA, 2022; pp. 51–92. [Google Scholar]
  20. Freitas, P.Á.; Ferreira, R.; Cardoso, S.; Cardoso, F. Magnetoresistive sensors. J. Phys. Condens. Matter 2007, 19, 165221. [Google Scholar] [CrossRef]
  21. Chen, S.; Lin, X.; Liang, W.; Zheng, L. Fujian sheng senlin ziyuan jiance tixi chouyang diaocha zhong xiongjing celiang jingdu fanwei de jingzhun queding [Precise Determination of the DBH Measurement Accuracy Range in the Sampling Survey of Fujian Province’s Forest Resources Monitoring System]. Linye Kancha Sheji [For. Prospect Des.] 2017, 37, 5–9. (In Chinese) [Google Scholar]
  22. Deering, M.H. Performance of Tree Height Measurement Instruments & Technology in New Zealand Forestry. Ph.D. Thesis, University of Canterbury, Christchurch, New Zealand, 2025. [Google Scholar]
  23. Sookjai, D.; Sonkaew, T.; Junthakhao, L.; Torkittikul, P. Comparative Accuracy and Precision Assessment of Survey Instruments for Teak Tree Height Measurement and Carbon Sequestration Estimation. Wittayasara Integr. Apply Eng. Ind. Technol. 2025, 18, 27–40. [Google Scholar]
  24. Lämås, T. The Haglöf PosTex ultrasound instrument for the positioning of objects on forest sample plots. In Arbetsrapport/Sveriges Lantbruksuniversitet, Institutionen för Skoglig Resurshushållning; Institutionen för Skoglig Resurshushållning, Sveriges Lantbruksuniversitet: Uppsala, Sweden, 2010; Number 296. [Google Scholar]
  25. Martin, A.J. Accuracy and precision in urban forestry tools for estimating total tree height. Arboric. Urban For. (AUF) 2022, 48, 319–332. [Google Scholar]
  26. Vasilescu, M.M. Standard Error of Tree Height Using “Vertex III”. Bull. Transilv. Univ. Brasov Ser. II For. Wood Ind. Agric. Food Eng. 2013, 6, 75–80. [Google Scholar]
  27. Gaudin, S.; Richard, J.B. Comparaison des Dendromètres Vertex III et TruPulse 200b pour la Mesure de la Hauteur Totale des Arbres. 2021. Available online: https://hal.science/hal-03447616/ (accessed on 14 September 2025).
Figure 1. Mechanical structure of the integrated DBH and tree height measuring device: 1. Shell; 2. Mainboard fixings; 3. Base; 4. Tape measuring box; 5. Support.
Forests 16 01529 g001
Figure 2. The internal structure of the tape measure box: 1. Fixed cover; 2. Angle sensor; 3. Flange shaft; 4. Spring carrier; 5. Flange connection base; 6. Fixed base.
Forests 16 01529 g002
Figure 3. Circuit framework diagram.
Forests 16 01529 g003
Figure 4. Distance sensor principle.
Forests 16 01529 g004
Figure 5. MPU6050 schematic diagram. (a) Schematic showing the working principle of a single-axis accelerometer component; (b) diagram illustrating the three-axis coordinate system of the MPU6050 sensor.
Forests 16 01529 g005
Figure 6. Diagram of the height conversion principle: (a) scenario where the observer is located below the tree base; (b) scenario where the observer is located above the tree base.
Forests 16 01529 g006
Figure 7. TMR support angle principle diagram.
Forests 16 01529 g007
Figure 8. Tape measure conversion principle.
Forests 16 01529 g008
Figure 9. Host computer interface.
Forests 16 01529 g009
Figure 10. Overall system process.
Forests 16 01529 g010
Figure 11. Field operation for tree parameter measurement: (a) measuring tree height from a distance; (b) measuring the diameter at breast height (DBH).
Forests 16 01529 g011
Figure 12. Comparison of errors of three devices.
Forests 16 01529 g012
Figure 13. Device accuracy at different distances.
Forests 16 01529 g013
Figure 14. Device accuracy at different slopes.
Forests 16 01529 g014
Table 1. Comparative test of tree installations at different heights.
HeightBlume-Leiss Laser Altimeter Test Device
BIAS/cmrelBIAS/%RMSE/cmrelRMSE/%SD/cm95% CI for BIASBIAS/cmrelBIAS/%RMSE/cmrelRMSE/%SD/cm95% CI for BIASBIAS/cmrelBIAS/%RMSE/cmrelRMSE/%SD/cm95% CI for BIAS
4.19133.01153.477.41[9.53, 16.47]−23−5.375312.5848.9[−45.89, −0.11]81.85225.2621.1[−1.875, 17.875]
8.74−16−1.82333.7829.7[−29.9, −2.1]−82−9.339410.7347.7[−104.32, −59.68]12−1.39323.7130.9[−2.5, 26.46]
15.890.54684.369.2[−23.39, 41.39]−127−8.011408.8762[−156.02, −97.98]49−3.09774.8861.1[20.4, 77.9]
Mean20.58393.85 77−7.579610.73 18−0.88444.33
Note: Measures of variability were computed as follows: BIAS represents the mean error (Measured Value − True Value); relBIAS is the relative mean error; RMSE is the root mean square error; relRMSE is the relative root mean square error; SD is the standard deviation of the 20 repeated measurements; 95% CI for BIAS is the 95% confidence interval for the mean error.
Table 2. Device accuracy at different distances.
DistanceBIAS/cmrelBIAS/%RMSE/cmrelRMSE/%SD/cmp-Value
(vs. Zero Bias) 1
95% CI for BIAS
5 m34−3.89 424.8025.6<0.001[22.02, 35.98]
10 m1−0.06 283.24290.93[−12.57, 14.57]
15 m7−0.85 232.5921.90.15[−3.25, 17.25]
Mean14−1.60 313.55
Note: Measures of variability were computed as follows: BIAS represents the mean error (Measured Value − True Value); relBIAS is the relative mean error; RMSE is the root mean square error; relRMSE is the relative root mean square error; SD is the standard deviation of the 20 repeated measurements; 95% CI for BIAS is the 95% confidence interval for the mean error. 1 The p-value tests the null hypothesis that the BIAS is equal to zero (one-sample t-test).
Table 3. Equipment accuracy at different slopes.
SlopeBIAS/cmrelBIAS/%RMSE/cmrelRMSE/%SD/cmp-Value (vs. Zero Bias) 195% CI for BIAS
4.73°142.89 326.55 29.7<0.001[0.1, 27.9]
19.87°81.94 266.41 25.8<0.001[−4.07, 20.07]
37.52°548.69 11117.85 99.2<0.001[7.57, 101.43]
Mean254.51 5510.27
Note: Measures of variability were computed as follows: BIAS represents the mean error (Measured Value − True Value); relBIAS is the relative mean error; RMSE is the root mean square error; relRMSE is the relative root mean square error; SD is the standard deviation of the 20 repeated measurements; 95% CI for BIAS is the 95% confidence interval for the mean error. 1 The p-value tests the null hypothesis that the BIAS is equal to zero (one-sample t-test).
Table 4. DBH Error Accuracy.
Tree SpeciesNumber of TreesBIASrelBIASRMSErelRMSE95% CI for BIAS
Platanus × acerifolia 270.140.930.171.17[0.09, 0.18]
Phyllostachys edulis150.111.190.131.42[0.07, 0.14
Cinnamomum cassia120.260.870.31.03[0.15, 0.37]
Cinnamomum camphora100.210.510.451.14[−0.09, 0.51]
Magnolia denudata90.020.050.221.82[−0.16, 0.2]
Ginkgo biloba70.150.60.230.87[−0.01, 0.32]
Total800.150.790.251.28[0.10, 0.19]
Note: Sample size represents the number of trees measured. BIAS represents the mean error (Measured Value − True Value); relBIAS is the relative mean error; RMSE is the root mean square error; relRMSE is the relative root mean square error; 95% CI for BIAS is the 95% confidence interval for the mean error.
Table 5. Operation efficiency comparison.
Operation MethodNumberField Time (s)Internal Work Time (s)Average Time Spent on a Single Tree (s)Manpower Time (s)Average Time per Tree (s)
Blume-Leiss and circumference ruler3317.589.416.961041.943.41
New device1345.9014.41345.914.41
Table 6. Statistical Significance Analysis of Deviations in Experiment 1 3.
Height (m)InstrumentBIASp-Value (vs. Zero Bias) 1RMSEp-Value (vs. New Device) 2
4.19New Device80.11722-
Blume-Leiss13<0.001150.29
Laser Altimeter−230.54530.03
8.74New Device120.09532-
Blume-Leiss−160.027330.71
Laser Altimeter−82<0.00194<0.001
15.8New Device490.00277-
Blume-Leiss90.589680.003
Laser Altimeter−127<0.001140<0.001
Note: Measures of variability were computed as follows: BIAS represents the mean error (Measured Value − True Value); relBIAS is the relative mean error; RMSE is the root mean square error; relRMSE is the relative root mean square error; SD is the standard deviation of the 20 repeated measurements; 95% CI for BIAS is the 95% confidence interval for the mean error. 1 The p-value tests the null hypothesis that the bias is equal to zero (one-sample t-test). 2 The p-value tests for a significant difference between the given instrument and the ‘New Device’ (paired t-test). 3 Experiment 1 refers to the comparative test of the new device, a Blume-Leiss altimeter, and a laser altimeter across three different height gradients.
Table 7. Instrument Comparison Table.
Nikon Forestry Pro II Haglöf Vertex 5New Device
LaserUltrasonicLaser, TMR, MPU6050
Core FunctionHeight, Angle, distanceHeight, Angle, distanceHeight, DBH
Height Accuracy±0.2 mResolution: =0.1 mRMSE: 0.3~0.5 m
DBH MeasurementNoNoYes
Estimated Price~USD 500 (Retail Price)~USD 2000 (Retail Price)~USD 150 (Retail Price)
Disclaimer/Publisher’s Note: The statements, opinions and data contained in all publications are solely those of the individual author(s) and contributor(s) and not of MDPI and/or the editor(s). MDPI and/or the editor(s) disclaim responsibility for any injury to people or property resulting from any ideas, methods, instructions or products referred to in the content.