Article

Tree Size Inequalities Induced by Stand Age and Functional Trait Identities Control Biomass Productivity Across Stand Types of Temperate Forests in South Korea

by
Yong-Ju Lee
1,2 and
Chang-Bae Lee
1,2,3,*
1
Department of Climate Technology Convergence (Biodiversity and Ecosystem Functioning Major), Kookmin University, 77 Jeongneungro, Seongbukgu, Seoul 02707, Republic of Korea
2
Forest Carbon Graduate School, Kookmin University, 77 Jeongneungro, Seongbukgu, Seoul 02707, Republic of Korea
3
Department of Forest Resources, Kookmin University, 77 Jeongneungro, Seongbukgu, Seoul 02707, Republic of Korea
*
Author to whom correspondence should be addressed.
Forests 2025, 16(12), 1759; https://doi.org/10.3390/f16121759
Submission received: 31 October 2025 / Revised: 20 November 2025 / Accepted: 20 November 2025 / Published: 21 November 2025
(This article belongs to the Section Forest Ecology and Management)

Abstract

Enhancing forest biodiversity and carbon sinks in the face of climate change is a high priority on the global agenda. The aim of our study was to explore the feasibility and potential of enhancing biodiversity and stand biomass productivity, which are strongly linked to forest ecosystem functioning and services in temperate forests. Based on data from the 5th to 7th National Forest Inventory of South Korea, 1760 natural forest plots (0.16 ha) were used, of which 344 plots belonged to conifer stands, 711 plots belonged to broadleaved stands, and 705 plots belonged to mixed stands. Forest succession-related factor (i.e., stand age), and abiotic (i.e., climatic and topographic conditions, and soil properties) and biotic drivers (i.e., species diversity, functional trait diversity, functional trait identity, and stand structural diversity) were jointly included as independent variables in an integrated model to explain variations in stand biomass productivity. In order to reveal the key drivers and relationships that regulate stand biomass productivity across forest stand types, we applied a multi-model averaging approach and piecewise structural equation modelling (pSEM). As a key finding, across all forest stand types, forest stand age-induced tree size inequality (i.e., DBH STD) in all forest stand types commonly increased stand biomass productivity, showing strong positive standardized effects (β > 0.5, p < 0.001). We also found that the functional trait identities controlling stand biomass productivity within each forest stand type differed according to their functional traits of dominant species, and that these mechanisms were controlled directly or indirectly by environmental conditions. Our research suggests that appropriate forest management plans should be developed in accordance with environmental gradients to simultaneously promote biodiversity and stand biomass productivity in different forest stand types.

1. Introduction

Forests represent one of the most biologically diverse systems on earth, offering habitats to the majority of terrestrial species worldwide [1]. However, forest biodiversity is under increasing pressure from human-induced factors such as the introduction of exotic species, habitat destruction, and soil and forest degradation [2,3], as well as natural threats including more severe and frequent disturbances [4]. These ongoing changes have raised serious concerns regarding the capacity of forests to maintain key ecosystem services [5], thereby increasing the need to understand how biodiversity interacts with and influences forest ecosystem functions [6,7]. In this context, examining the mechanisms through which biodiversity and forest structural properties contribute to biomass productivity is essential for understanding the functioning and resilience of temperate forest ecosystems. In terms of forest stand biomass productivity, one of the most significant ecosystem functions, it is often reported that increased tree diversity (e.g., species diversity, functional trait diversity (FTD), etc.) is associated with increased stand biomass productivity [8,9]. Two hypotheses can explain the reported enhanced growth in forests with higher species diversity relative to monocultures: the niche complementarity effect, which suggests that biodiverse forest ecosystems utilize limited resources more efficiently because of the different complementary traits of species [10], selection effect, which increases the probability that highly productive species become part of the species pool due to the expansion of that pool [10]. Moreover, recent studies have also revealed a strong relationship between stand biomass productivity and physiological attributes of dominant tree species, emphasizing the significance of a trait-based framework for interpreting variation in stand biomass productivity [9,11]. In particular, this forest biomass productivity–functional attributes relationship can be explained by the mass ratio hypothesis, where tree biomass is primarily defined by functional trait identity (FTI), quantified as a community-weighted mean (CWM) of trait values [12].
In addition to tree diversity and FTI, stand structural diversity (SSD), characterized by heterogeneity in both horizontal and vertical stand structures [13], is another major component of diversity in forest ecosystems. One of the key indicators of SSD is tree size inequality, typically measured as the standard deviation of diameter at breast height (DBH STD), which reflects both vertical and horizontal heterogeneity in forest structure. This form of structural diversity plays an important ecological role by enhancing light partitioning, reducing competitive overlap, and ultimately increasing overall stand biomass productivity [14]. SSD interacts strongly with tree diversity at different stages of forest succession and among forest stand types to drive variation in biomass productivity [15,16]. For example, forest stands in late successional stages demonstrate complex three-dimensional structures, and their high SSD has been proposed to increase carbon acquisition. Moreover, the coexistence of individuals from different species and developmental stages (e.g., saplings to adult trees, understory to canopy dominants) enables more efficient use of resources such as light, thereby promoting biomass accumulation and carbon sequestration.
It is also generally accepted that forest biodiversity–productivity relationships can be established along climatic gradients, but the relative influence of climatic conditions depends on scale [17,18]. At regional and global scales, climatic conditions are reported to be the most important drivers, as the survival and growth of species is largely related to the range of tolerance to fluctuations of mean annual precipitation and mean annual temperature [19]. In addition to climatic conditions, topographic conditions and soil properties would be expected to play a key role at the local scale, as they not only act as filters on plant community formation, but can also act as determinants of forest biomass productivity, since these factors can create gradients in resource availability (e.g., soil moisture and nutrients) [20]. Furthermore, at the regional scale, soil chemical properties such as soil total nitrogen content and soil pH, which are shaped by different topographic conditions, can also control nutrient availability, while soil texture, including clay and sand content, has also been reported to be an important driver of tree diversity and functioning by controlling moisture availability [21]. Nevertheless, negative or insignificant relationships were also found between biodiversity and stand biomass productivity, influenced by variations in climatic conditions and soil properties [17,22], forest succession stages, and spatiotemporal scales, all of which contribute to the complexity of biodiversity–productivity relationships [23,24]. In South Korea, the mechanisms linking biodiversity, stand structure, and biomass productivity have been only minimally investigated, and no study has jointly examined abiotic drivers, species diversity, structural diversity, and functional traits across different forest stand types. Filling this gap is essential for improving forest management and carbon-sequestration strategies under rapidly changing environmental conditions.
Although previous studies have shown that tree diversity and SSD are mainly correlated and have significant effects on stand biomass productivity through their interactions [15,25], it is still unclear how abiotic drivers (e.g., climatic and topographic conditions, and soil properties, etc.) control stand biomass productivity through the mediating roles of biotic drivers (e.g., tree diversity, SSD, FTD and FTI), either directly or indirectly, depending on forest stand types. Elucidating these complex interactions is crucial for the management of natural forests, as key characteristics of forest ecosystems are stand structure and species composition, which are not only controlled by environmental conditions but can also be modulated by forest management. Moreover, this is particularly important in artificial forests with simple tree species and stand structure, and the development of forest management plans based on the aforementioned relationships will be useful for forest managers to promote and stabilize forest biomass production, for example, when converting pure forest stands to mixed forest stands, or when converting a stand with even-aged forest stands to uneven-aged forest stands.
Therefore, this study concentrates on the identification of the joint influences of abiotic and biotic drivers, and the forest succession-related factor (FSF; i.e., forest stand age) on stand biomass productivity among different forest stand types. To do this, we proposed the following three hypotheses based on a concept model (Figure 1) using data from South Korea’s 5th–7th National Forest Inventory (NFI): (1) In all forest stand types, species diversity and stand structural diversity (SSD), shaped by forest succession, are positively associated with stand biomass productivity. (2) Functional traits of dominant species are the primary determinants of stand biomass productivity, and the key functional traits influencing productivity differ among forest stand types. (3) Climatic conditions and soil properties directly and indirectly influence stand biomass productivity, with their effects mediated through biotic drivers such as species diversity, SSD, FTD, and FTI. Through the exploration of these hypotheses, we intend to reveal relationships and control mechanisms of stand biomass productivity by different forest stand types (i.e., conifer, broadleaved, mixed, and total stands) within natural temperate forests, as well as to propose feasible forest management plans in order to strengthen forest biodiversity and carbon sequestration capacity.

2. Materials and Methods

2.1. Study Sites

Using the NFI data gathered every five years from 2006 to 2020 for a total of three periods, from the 5th to the 7th, this study examined the drivers influencing stand biomass productivity among different forest stand types including conifer, broadleaved, mixed, and total stands (Figure 2).
In the NFI data, sampling plots are positioned at the grid intersections that divide South Korea into 4 km × 4 km sections, covering the entire temperate forest region of South Korea (Figure S1). The general environmental characteristics of the study region, including climatic, topographic, and soil properties, are provided in Figures S2–S4 for comparison across forest stand types. Detailed definitions and quantification methods for climatic, topographic conditions, and soil properties are provided in Section 2.3.

2.2. Data Collection and Assessment of Forest Stand Biomass Productivity

Every plot comprises 4 circular subplots, each with an area of 400 m2 and has been resurveyed every five years [26]. This means that a single circular subplot has the area of 0.04 ha, while an entire plot has an area of 0.16 ha (Figure S1). During the three vegetation surveys, in subplots of all plots, individuals that had diameters at breast height (DBH) greater than 6 cm in subplots of all plots were species-level identified and their DBH were also recorded. Tree biomass was then obtained using biomass estimation equations that include stem volume, species-specific WD, biomass expansion factor, and root–shoot ratio from the National Institute of Forest Science [27] (see Table S1). To calculate stand biomass productivity for each plot, we first estimated tree biomass at each of the three inventory periods. Then, we calculated the total biomass increment over the 15–year span and divided it by the number of years to obtain the mean annual biomass productivity. Accordingly, we defined this value as stand biomass productivity. Finally, 1760 plots in natural forests were selected that had stand biomass productivities above zero and maintained forest stand types during the three 15–year survey periods. Forest stand types were defined based on the proportion of basal area contributed by tree species: conifer stands were dominated by coniferous species accounting for more than 75% of the total basal area, broadleaved stands were dominated by broadleaved species exceeding 75%, and mixed stands included plots where neither conifer nor broadleaved species exceeded this threshold [28,29]. As a result, 344 plots (20%) were conifer stands, 711 plots (40%) were broadleaved stands, and 705 plots (40%) were mixed stands.

2.3. Quantification of Biotic Drivers

To obtain a quantification of the biotic drivers for each plot over the survey period, we chose tree diversity, including species diversity (i.e., species richness (SR), Shannon H index (SD), Pielou’s species evenness (SE)) and FTD (i.e., functional richness (FRic), functional dispersion (FDis), functional evenness (FEve)), FTIs, and SSDs [30,31].
To evaluate FTDs and FTIs, we used four essential functional leaf traits—including leaf nitrogen and phosphorus content, leaf dry matter content (LDMC), and specific leaf area (SLA)—along with two main wood stem traits, wood density (WD) and tree maximum height (MH).
The data required to assess these functional traits were collected in our laboratory following standard procedures for leaf and wood stem analyses [32], supplemented with published literature and open data sources (see Table S1). If data at the species level could not be obtained, mean values at the genus level were used for the corresponding species. Using the ‘FD’ package in R version 4.2.1, three FTDs—FRic, FDis, and FEve—were computed based on the six functional leaf and stem traits, using a Gower-based trait distance matrix following the standard implementation of the package [33]. Moreover, FTIs were quantified by calculating CWM values, where species trait values were weighted according to their relative basal area to derive plot-level mean trait values [34].
Moreover, to quantify SSDs, the mean DBH (DBH Mean), standard deviation of DBHs (DBH STD), coefficient of variation of DBHs (DBH CV), skewness of DBHs (DBH Skew), Shannon H index of DBH classes with 2 cm diameter interval (DBH SD), and stand density (Stand density) were calculated within each plot.
Finally, all of the biotic drivers, such as tree diversity, FTIs, and SSDs, were averaged across the three survey periods for each plot to analyze the relationships between productivity and biotic drivers [35,36].

2.4. Quantification of Abiotic Drivers and Forest Succession-Related Factor

In order to assess the abiotic drivers influencing the stand biomass productivity of each forest stand type, three climatic conditions, four topographic conditions as well as seven soil properties were evaluated. Among them, mean annual precipitation (MAP), mean annual temperature (MAT), and climatic moisture index (CMI) were used as the three climatic conditions, which were extracted from WorldClim (https://www.worldclim.org/) and the Potential Evapotranspiration Climate Database (https://csidotinfo.wordpress.com/). Thus, for all sites, MAT ranged from 5.6 °C to 27.8 °C, MAP ranged from 90 mm to 3870 mm, and CMI ranged from –0.13 to 0.68 (Table S2). Moreover, we selected elevation, slope, topographic position index (TPI) and topographic wetness index (TWI) as the four topographic conditions, which were quantified by applying a digital elevation model to spatial analyst tools in ArcGIS Pro version 3.3.0. Finally, seven soil properties were selected for each plot: three soil chemical properties such as cation exchange capacity (CEC), soil total nitrogen content (Soil N), and pH, and four soil physical properties such as soil bulk density, clay, sand and silt content, which were extracted through SoilGrids 2.0 (https://soilgrids.org/). Finally, to measure the FSF (i.e., stand age), tree cores were extracted from five dominant trees in each plot within each forest stand type during the latest survey period (2016–2020), and annual growth rings were counted [37]. The comparative values of stand biomass productivity, abiotic and biotic drivers, and stand age across the forest stand types can be seen in Figures S2–S4.

2.5. Statistical Analysis

Dataset was processed as follows prior to statistical analysis: biotic and abiotic drivers, FSF, and stand biomass productivity were log-transformed for linearity and normalization, and all variables were standardized for consistency. In addition, as shown in Figures S5–S8, Pearson correlation analyses were used to remove variables with high correlation (|r| ≥ 0.7). The variance inflation factor (VIF) was also calculated for each of the variables to assess the effect of multicollinearity within the multiple regression analyses [38]. As a result, as all VIF values were less than 3, multicollinearity had no influence on the results.
By then, to assess the fitting of the model, we applied generalized least squares (GLS) models [39]. The GLS model used in this study followed the standard linear formulation:
Y i =   β 0 +   k = 1 p β k X i k +   ε i ,   ε i ~ N ( 0 , Σ )
where Y i is stand biomass productivity for plot i; X i k represents the k-th abiotic or biotic predictor; p is the number of predictors included in the model; β 0 and β k denote the intercept and regression coefficients; ε i is the residual error term; and Σ is the variance covariance matrix accounting for and spatial (or non-spatial) correlation among residuals.
Both non-spatial and spatial GLS models were constructed to assess whether spatial autocorrelation affected stand biomass productivity. For the spatial models, plot coordinates were incorporated into the correlation structure, whereas for the non-spatial models, these coordinates were excluded. To evaluate the influence of spatial autocorrelation, we compared the Akaike Information Criterion (AIC) values of the spatial and non-spatial models and selected the model with the lower AIC (Table S3). Because the spatial model did not yield a lower AIC, spatial coordinates were not included in subsequent analyses. Multi-model inference based on AIC was then applied to identify the most influential variables for each stand type and the total stands, and model-averaged standardized regression coefficients were used to select key abiotic and biotic drivers. In accordance with our conceptual framework (Figure 1), only the most influential variable within each abiotic and biotic category was retained for the final pSEM analyses.
To examine the multiple interactions among abiotic and biotic drivers, stand age, and stand biomass productivity, piecewise structural equation modeling (pSEM) was conducted according to the conceptual framework shown in Figure 1 [40]. For each stand type, an initial full model was constructed based on the conceptual model. Non-significant paths were subsequently removed using d-separation tests (p > 0.05) to obtain the final parsimonious structure [41]. Model fit was evaluated using AIC, Fisher’s C statistic, and associated p-values across stand types and for total stands.

3. Results

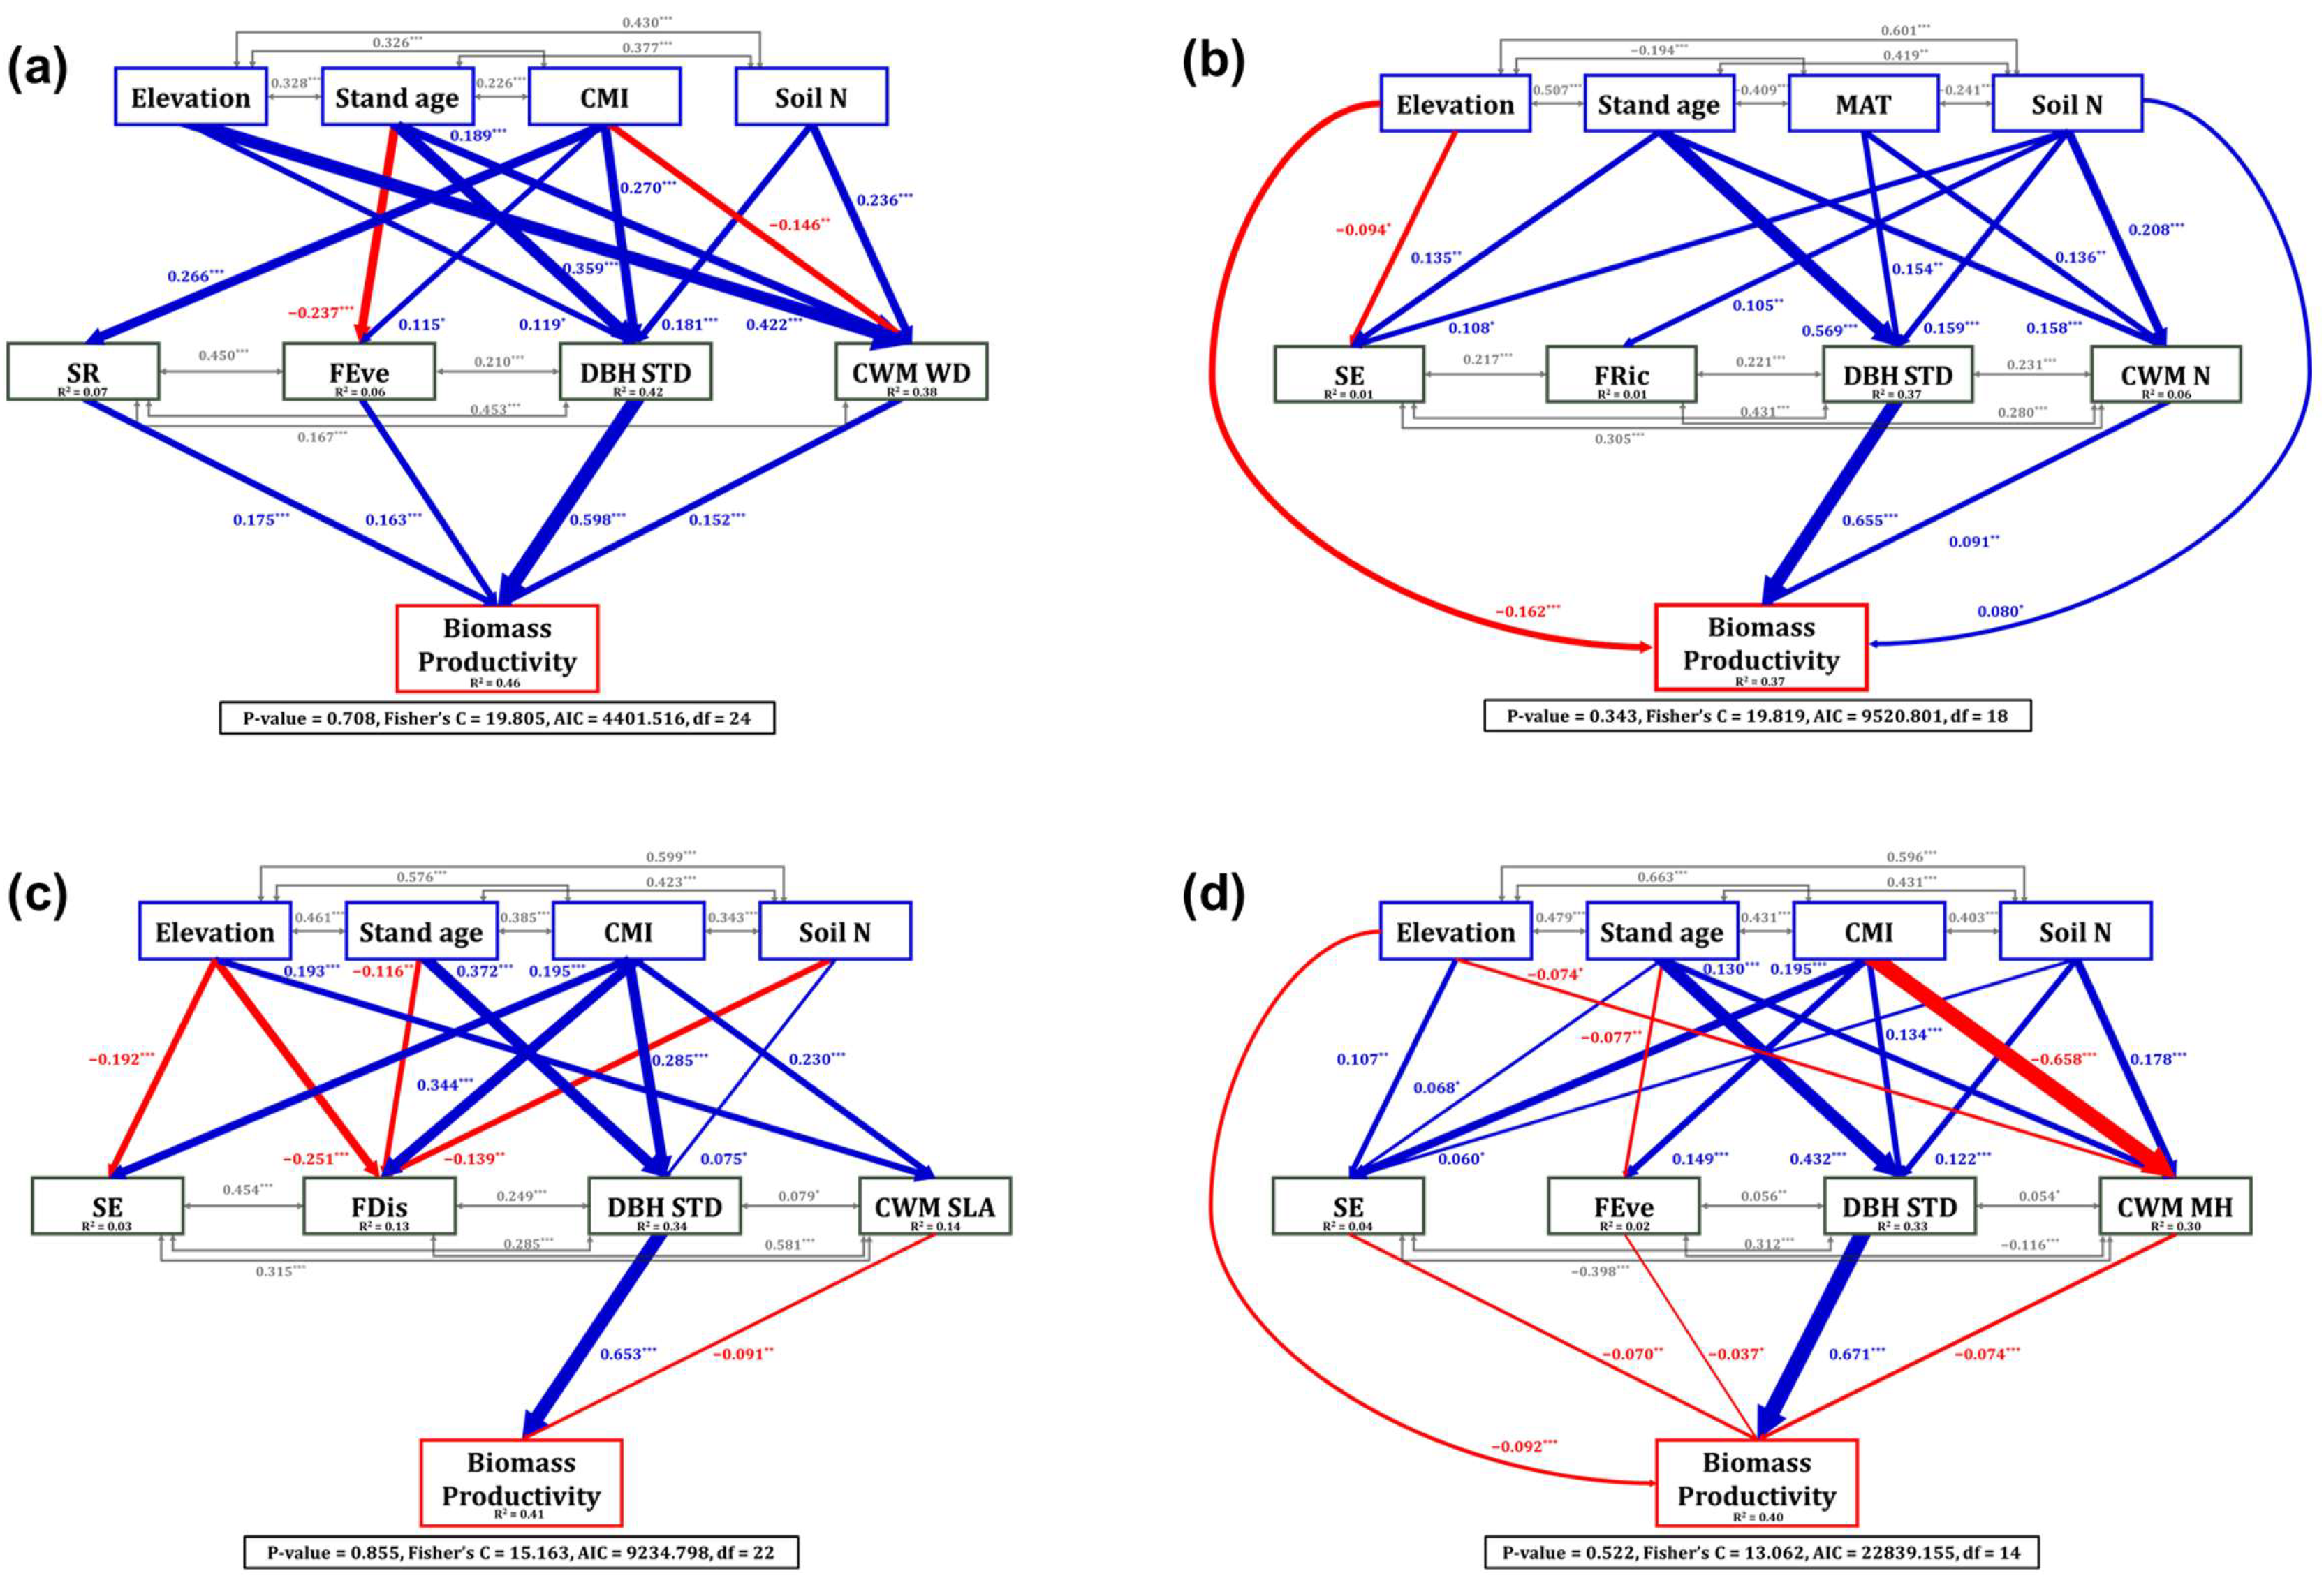
For the results of the conifer stands model, species richness (SR), functional evenness (FEve), DBH STD and community-weighted mean of wood density (CWM WD) had a positive and significant direct association with stand biomass productivity (Figure 3a). For the abiotic drivers, Elevation and soil total nitrogen content (Soil N) showed a positive indirect association with stand biomass productivity via CWM WD, while the climatic moisture index (CMI) showed a negative indirect association. In addition, stand age and environmental conditions, including Elevation, CMI, and Soil N, showed a positive indirect association with stand biomass productivity via DBH STD. Also, CMI had a positive indirect pathway to stand biomass productivity via SR, and stand age was indirectly associated with stand biomass productivity through FEve. Finally, among the abiotic and biotic drivers, DBH STD was the strongest predictor, showing a positive and significant direct association with stand biomass productivity (β = 0.598, p < 0.001).
Among the biotic factors, DBH STD and the community-weighted mean of leaf nitrogen content (CWM N) had a positive and significant direct association with stand biomass productivity in the broadleaved stands model (Figure 3b). For the abiotic drivers, Elevation and Soil N had positive and negative direct associations with stand biomass productivity, respectively. Moreover, stand age, MAT, and Soil N showed a positive indirect association with stand biomass productivity via DBH STD and CWM N. In broadleaved stands, the key factor associated with stand biomass productivity was DBH STD, which showed a positive, direct, and significant association with stand biomass productivity (β = 0.655, p < 0.001).
For the results of the mixed stands model, among the biotic drivers, DBH STD had a positive, direct, and significant association with stand biomass productivity, whereas the community-weighted mean of specific leaf area (CWM SLA) showed a negative, direct, and significant association (Figure 3c). For the abiotic drivers, stand age, CMI, and Soil N had a positive indirect association with stand biomass productivity through DBH STD, while Elevation and CMI had a negative indirect association through CWM SLA. In addition, the main factor associated with stand biomass productivity in mixed stands was DBH STD, which showed a positive and significant direct association (β = 0.653, p < 0.001).
The results of the total stands model showed that among the biotic drivers, species evenness (SE), FEve, and the community-weighted mean of tree maximum height (CWM MH) had a negative, direct, and significant association, while DBH STD had a positive, direct, and significant association with stand biomass productivity (Figure 3d). Among the abiotic drivers, Elevation showed a negative, direct, and significant association with stand biomass productivity. Moreover, stand age, CMI, and Soil N showed a positive indirect association with stand biomass productivity through DBH STD, and stand age and Soil N had a negative indirect association with stand biomass productivity via CWM MH, while Elevation and CMI had a positive indirect association. In addition, CMI showed a negative indirect pathway to stand biomass productivity through SE and FEve, and Elevation had a negative indirect association via SE. Finally, as with all models, DBH STD was found to be the key factor associated with stand biomass productivity, showing a positive and significant direct association (β = 0.671, p < 0.001).
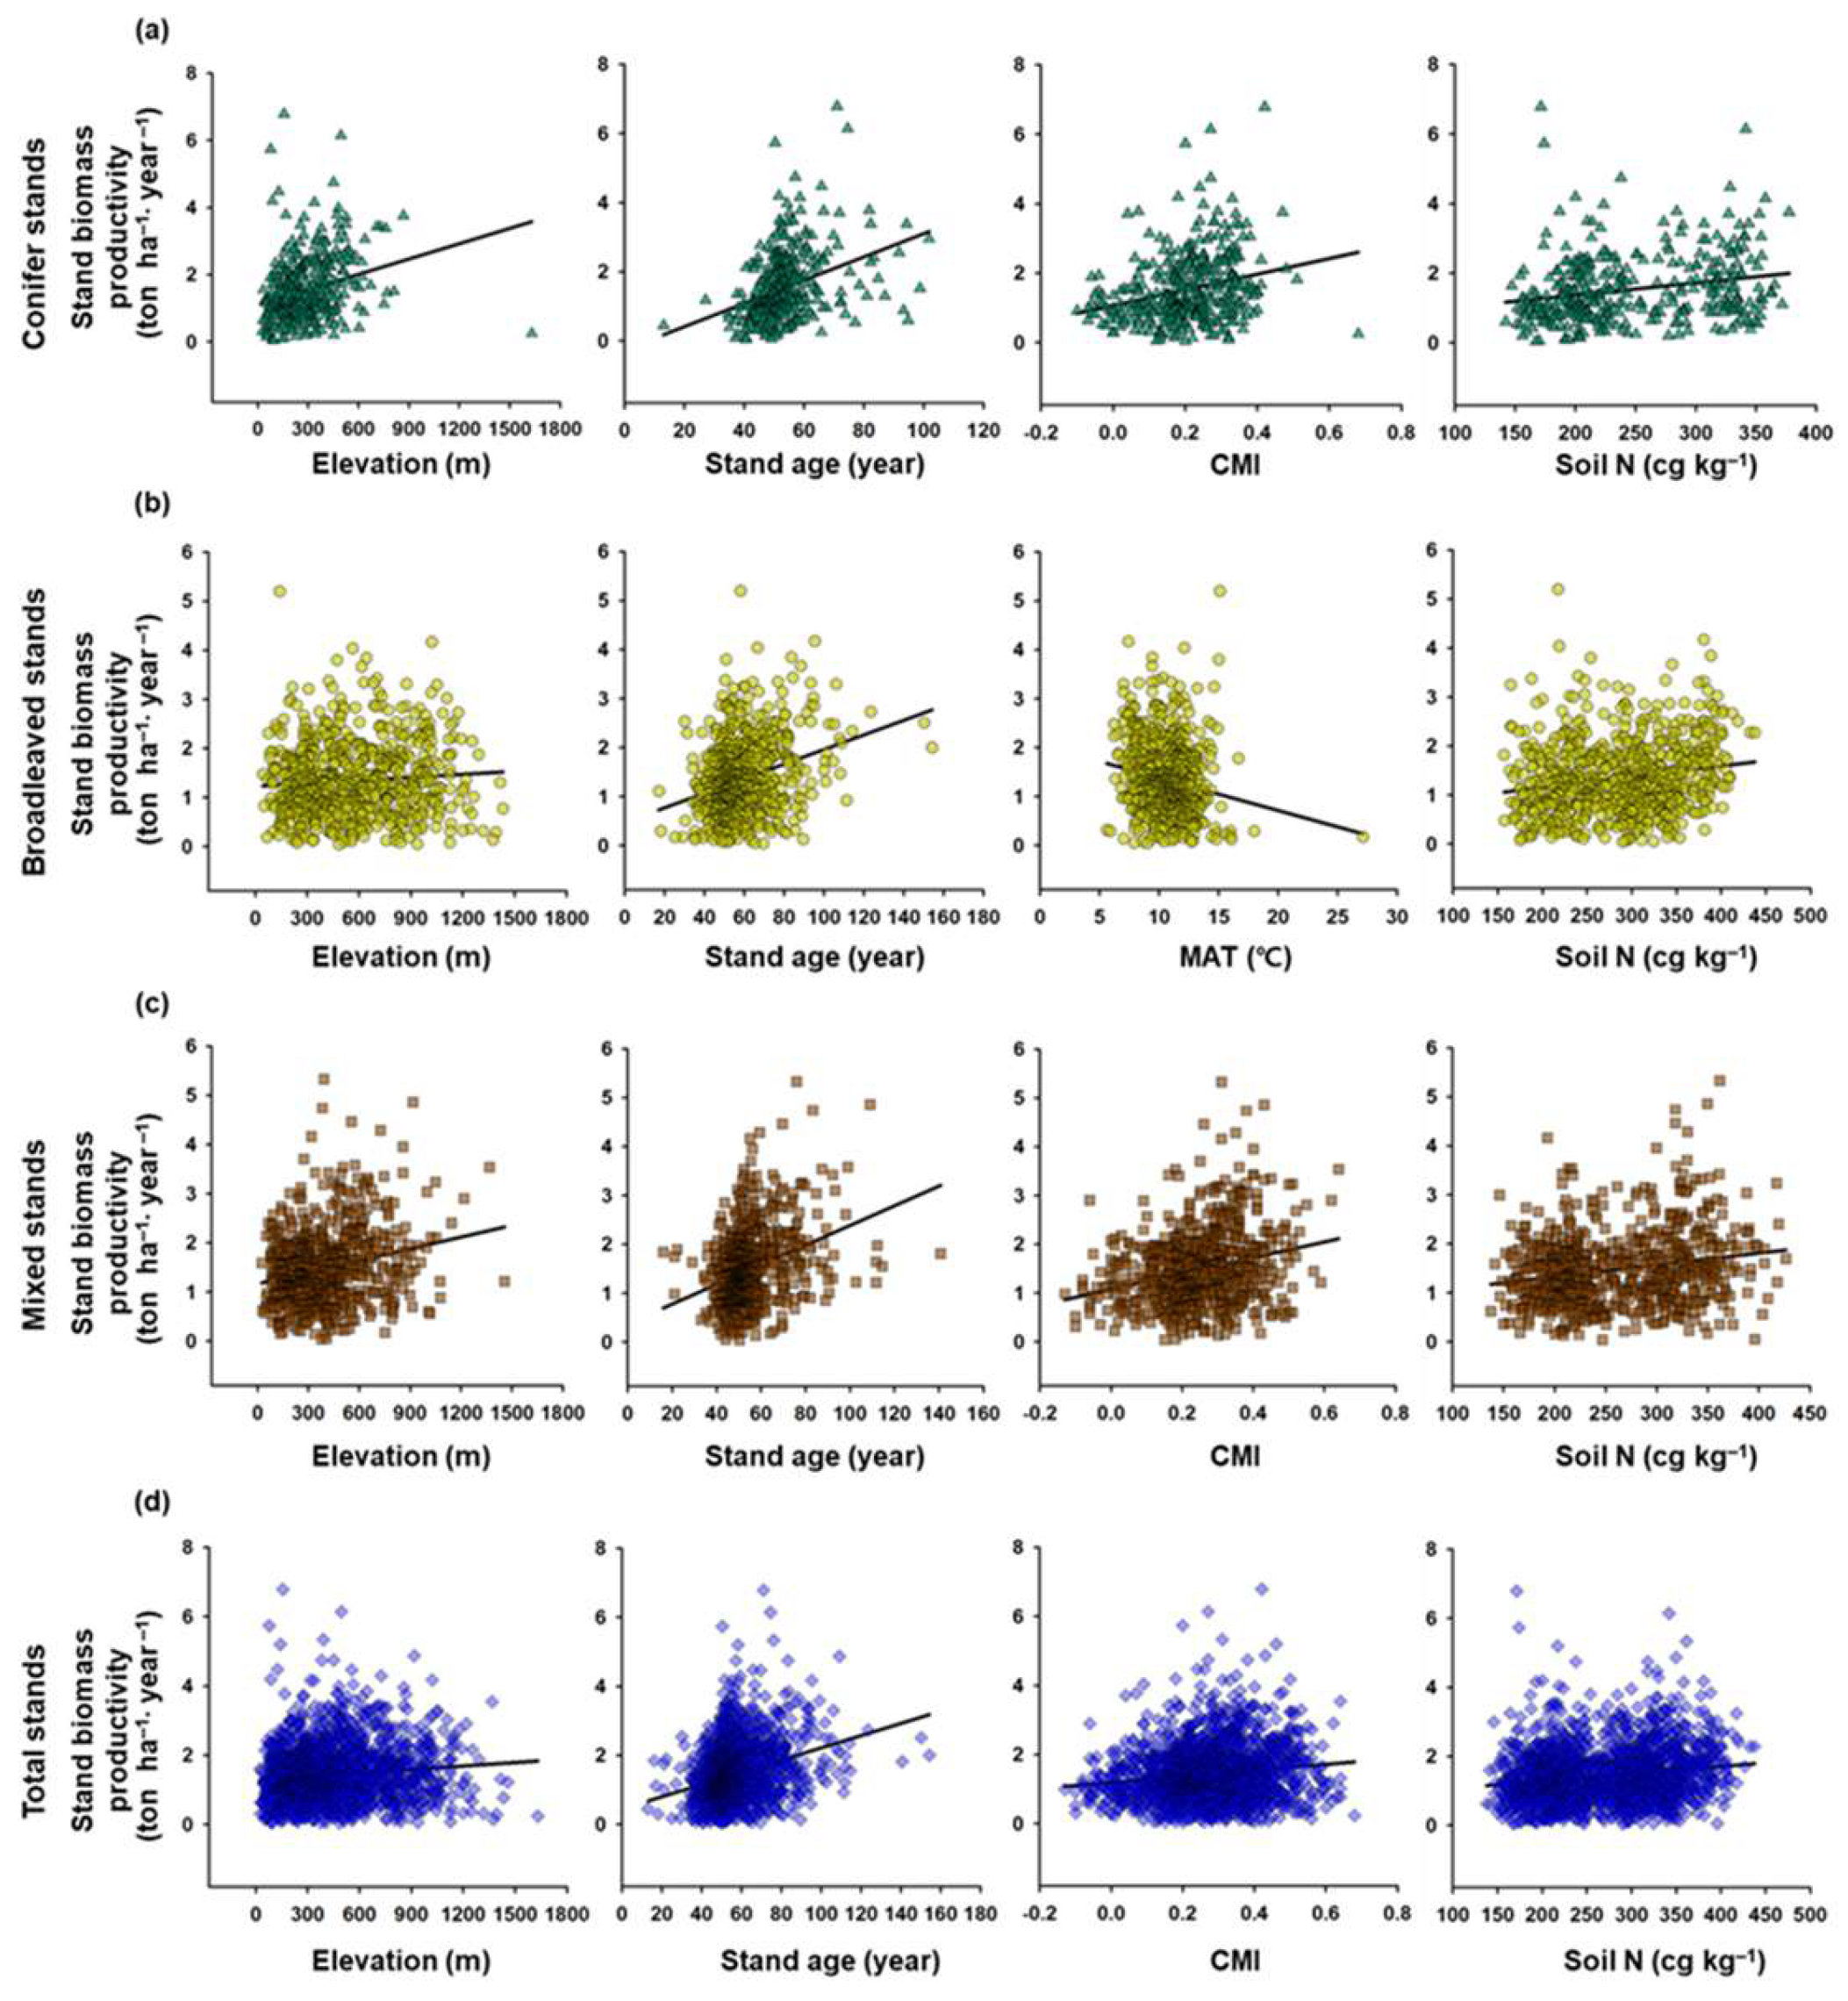
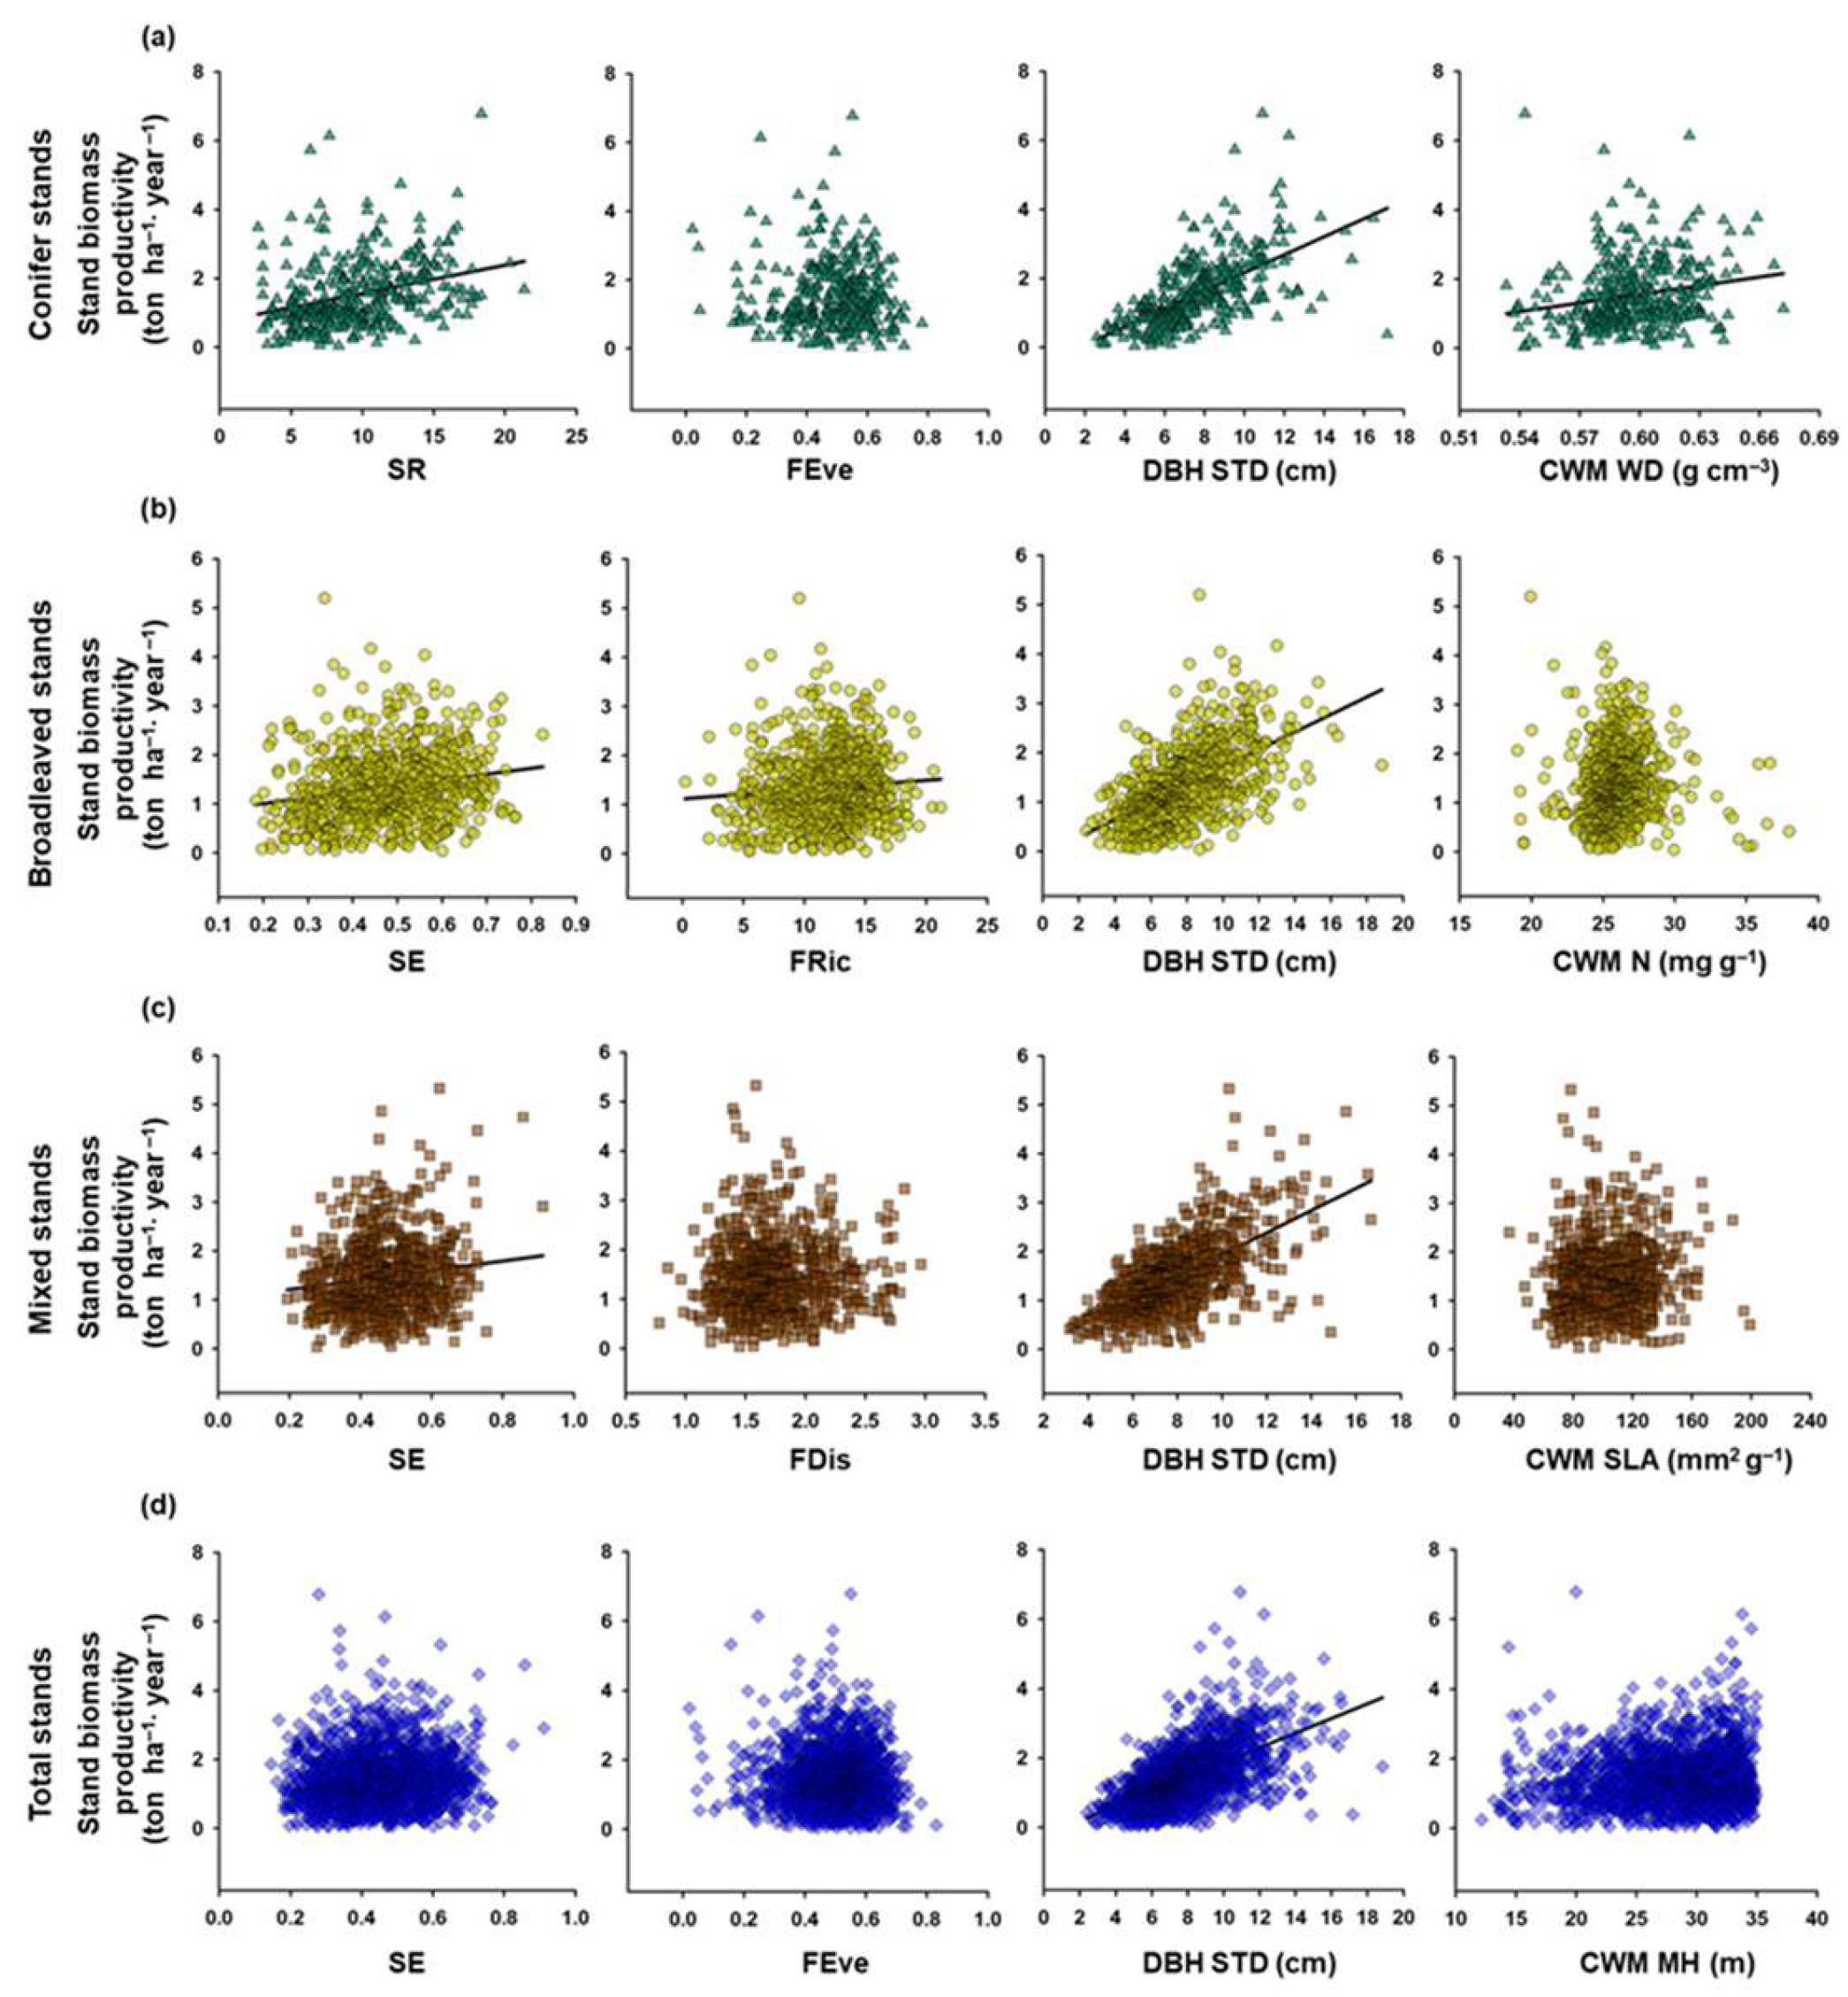
To support the pSEM results, bivariate analyses and multi-model inference tests have additionally been performed and showed similar results (Figure 4 and Figure 5 and Figure S9).

4. Discussion

The stand biomass productivity models for each forest stand type proposed in the present research provide new and additional insights into the relationships between biodiversity and productivity in temperate natural forests, and how environmental conditions are directly and indirectly associated with forest functions. Therefore, two major findings can be highlighted from this study: (1) Tree size inequality (i.e., DBH STD), derived from forest succession-related factors (i.e., stand age), climatic conditions, and soil properties, was the strongest predictor associated with stand biomass productivity across all forest stand types in natural temperate forests. (2) Among tree diversity components, species diversity (i.e., SE and SR) and functional trait diversity (i.e., FEve) were directly associated with stand biomass productivity only in certain forest stand types (i.e., conifer stands), and the FTIs that were directly associated with stand biomass productivity differed among forest stand types.

4.1. Abiotic and Biotic Factors Controlling Stand Biomass Productivity Across All Forest Types

In the three types of forest stand and the total stands in South Korea, tree size inequality, induced by environmental conditions and stand age, was found to be directly and indirectly associated with stand biomass productivity (Figure 3 and Figure S10). As forest stands in temperate natural forests typically progress through forest successional stages, tree size inequality within tree populations increases as size differences between individuals increase [28,42]. This tree size inequality leads to differential use of resources such as light, water, and nutrients by individual trees, with relatively large trees absorbing intense light in the upper canopy and smaller trees using scattered light in the understory canopy, thereby reducing competition [43]. Thus, the photosynthetic rate and net productivity of the entire community will increase, ultimately leading to an increase in stand biomass productivity. Furthermore, in the early stages of forest succession, relatively uniform tree size within a forest stand may lead to increased competition among individuals and slow growth due to decreased light utilization efficiency [44], but the greater the size variation among individuals, the more likely it is that competition among individuals will be relatively mitigated through different growth strategies based on size (e.g., niche partitioning and complementary effects), resulting in increased light and resource utilization efficiency, which will increase the annual growth rate of the overall forest stand [45,46].
Furthermore, we also found that among abiotic drivers, Soil N was consistently associated with tree size inequality across all forest stand types, which in turn was linked to higher stand biomass productivity. Consistent with previous studies, the indirect associations of CMI and MAT on stand biomass productivity via SSD within forest stands support the indirect climate hypothesis, which states that most of the variation in net primary productivity of forest stand biomass across broad ecological gradients is driven by indirect climatic influences mediated through SSD and growing season length [47]. In particular, under favorable climatic conditions, relatively high climatic water availability and MAT contribute to extended growing seasons and increased size differentiation among individuals, potentially enhancing stand biomass productivity [48].
Among soil properties, Soil N serves as an essential nutrient for photosynthesis and growth. Under Soil-N-rich conditions, dominant species with competitive functional traits may utilize nitrogen more effectively and grow rapidly, while less competitive individuals may grow more slowly, thereby contributing to greater tree size inequality [49]. This interplay between dominant species effects and SSD was evident across forest stand types in our study. Thus, tree size inequality arising from differences in growth rates under soil N-rich soil conditions may be associated with improved nutrient-use efficiency at the stand scale, which may ultimately be linked to increases in stand biomass productivity.

4.2. Abiotic and Biotic Drivers Controlling Stand Biomass Productivity in Temperate Conifer Stands

For conifer stands in temperate natural forests, climatic conditions with high CMI were found to be associated with increases in SR and FEve and with decreases in CWM WD, which were in turn associated with increased stand biomass productivity (Figure 3a). This implies that higher climatic water availability, which has important implications for species distributions, survival, and recruitment rates, may contribute to increased species diversity within conifer stands [50], while simultaneously being linked to lower wood density values within the community [51].
On the other hand, in conifer stands defined as plots where coniferous species account for more than 75 percent of total basal area, forest stand age was associated with a decrease in FEve and an increase in DBH STD and CWM WD. This pattern suggests that over time, forest succession may allow the gradual establishment of functionally diverse and high-wood-density broadleaved species in the understory which typically occupy the remaining 25 percent of basal area. These compositional changes can increase tree size inequality and ultimately enhance stand biomass productivity, as supported by previous studies [37,52]. In addition, we found that increasing Soil N in conifer stands was associated with greater DBH STD and higher CWM WD, which were linked to higher stand biomass productivity. Consistent with the aforementioned results, this suggests that increasing soil nutrients over time in conifer stands may lead to a gradual dominance of broadleaved tree species with higher photosynthetic efficiency and higher wood density, which may increase stand biomass productivity in natural temperate conifer stands [53].

4.3. Abiotic and Biotic Drivers Controlling Stand Biomass Productivity in Temperate Broadleaved Stands

In our results, we observed that in broadleaved stands, as in conifer stands, sufficient soil nutrients (i.e., Soil N) were associated with increased stand biomass productivity, primarily through their association with enhanced tree size inequality driven by dominant species effects (Figure 3b). In broadleaved forest stands with sufficient soil nutrient conditions, broadleaved tree species with high leaf nitrogen content have fast growth rates and can become increasingly dominant over time, forming a multi-layered canopy structure as they mature [54]. This multi-layered canopy structure promotes tree size inequality, increasing the efficiency of nutrient uptake and light utilization, while minimizing interspecific competition within broadleaved forest stands. We also found that, unlike in other forest stand types, higher MAT in broadleaved stands was associated with increases in DBH STD and CWM N, which were linked to higher stand biomass productivity. These effects may stem from accelerated nutrient cycling driven by fast-decomposing, high-leaf nitrogen species, which become increasingly dominant under warmer conditions, thereby increasing stand biomass productivity [55,56]. In addition, unlike other forest stand types, we observed an increase in stand biomass productivity at relatively lower elevations among the topographic conditions. Lowlands have relatively higher mean annual temperatures than highlands, which increases photosynthesis and growth efficiency, and a longer growing season, which may have increased the rate of biomass accumulation in broadleaved stands dominated by tree species with larger leaf areas [57]. In addition, the nitrogen and organic matter content of soils in lowlands tends to be higher than in highlands, which may have contributed to the increase in biomass accumulation in natural temperate broadleaved stands [58].

4.4. Abiotic and Biotic Drivers Controlling Stand Biomass Productivity in Temperate Mixed Stands

In mixed stands of temperate natural forests, we found that stand biomass productivity was positively associated with higher climatic water availability, greater soil nutrient levels, and increased tree size inequality with stand age, patterns that were common across all forest stand types. However, increased CWM SLA under higher climatic water availability and at higher elevations was associated with reduced stand biomass productivity (Figure 3c). This is consistent with the case that tree species with high SLA, such as classic broadleaved tree species, have limited productivity with increasing elevation in natural mixed stands due to increased evapotranspiration and subsequent delayed root growth redistribution [59]. As forest stands mature, increased canopy layering may limit light availability for understory high-SLA species, reducing their growth and ultimately lowering stand biomass productivity [60]. Furthermore, as forest successional development stages progress in mixed stands, broadleaved tree species with high SLA may initially dominate and exhibit high stand biomass productivity, but over time, conifer tree species with low SLA may gradually dominate and differences in productivity may occur as mutual root competition between them accelerates [61].

4.5. Abiotic and Biotic Drivers Controlling Stand Biomass Productivity in Temperate Total Stands

Consistent with earlier sections, tree size inequality, climatic water availability, and soil nutrients were key drivers associated with stand biomass productivity in total stands (Figure 3d). In addition to these common mechanisms, we found that in total stands, under environmental conditions of high elevation, higher CMI, and low Soil N, tree species with relatively low maximum height tended to dominate, and this pattern was associated with increased stand biomass productivity. This may be due to conifer species at higher elevations optimizing photosynthesis relative to transpiration [62]. In addition, conifer species that form strong associations with ectomycorrhizal fungi can take up nitrogen through microbially mediated decomposition of organic matter, which supports better individual growth under nitrogen-limited conditions. These processes may also contribute to greater soil organic carbon storage in nitrogen-limited environments, which is linked to higher stand biomass productivity [61].
We also found that high elevation and CMI were indirectly associated with lower stand biomass productivity by increasing SE and FEve, respectively, suggesting that forest stands at higher elevations may exhibit greater biomass productivity when species are less evenly distributed and when more functionally similar species are dominant. This mechanism is consistent with earlier findings showing that relatively low maximum height and functionally similar conifer species tend to exhibit higher stand biomass productivity when dominant at higher elevations and under conditions of greater climatic water availability.

5. Conclusions

Here, we explored how biotic and abiotic drivers and forest succession-related factor (i.e., stand age) control stand biomass productivity in natural temperate forests by forest stand type. In accordance with our first hypothesis, tree size inequality (i.e., DBH STD) was the most important biotic driver in all forest stand types as forest succession stages progressed. Similarly to the second hypothesis, the key functional trait values controlling stand biomass productivity differed among forest stand types. Finally, the specific climatic variables (CMI, MAT, and Elevation) and soil total nitrogen content (Soil N) identified in our analyses were the primary abiotic drivers, controlling stand biomass productivity indirectly by controlling SSD and FTI, while the mechanisms controlling the remaining biotic drivers differed among forest stand types. Based on the results, forest management plans that can simultaneously enhance biodiversity and forest stand biomass productivity in natural temperate forests are as follows: (1) In conifer stands, management of species composition and SSD should be done progressively and simultaneously to create multi-layered stand structures with broadleaved tree species exhibiting high-wood density to increase stand biomass productivity. (2) In broadleaved stands, it is not only SSD management that needs to be done to form multi-layered stand structures over time to increase stand biomass productivity due to the dominance of broadleaved tree species, but also to improve soil total nitrogen content where needed to meet proper environmental conditions. Finally, (3) in mixed stands, stand biomass productivity can be increased through intensive management of tree species that are suited to the environmental conditions and forest development stage. In conclusion, our results provide stand-type-specific evidence supporting all three hypotheses, showing that environmental conditions directly or indirectly control the annual carbon sequestration capacity of forest stand biomass through different mechanisms for each forest stand type via the aforementioned biotic drivers, requiring the development of sophisticated future forest management plans along environmental gradients. Nevertheless, as our findings are derived from static, plot-level data, they may not fully capture temporal dynamics or potential non-linear responses in forest ecosystems (e.g., tree species alteration). Future research should incorporate long-term monitoring and dynamic modeling approaches to better understand how forest productivity responds to biotic and abiotic drivers over time.

Supplementary Materials

The following supporting information can be downloaded at: https://www.mdpi.com/article/10.3390/f16121759/s1, Table S1: Wood density, biomass expansion factor, and root-shoot ratio for biomass estimation equation and the data source of functional traits by each woody species recorded in this study; Table S2: Summary of species, functional trait diversity, functional trait identity, stand structural diversity, succession-related factor, forest stand biomass productivity, and abiotic drivers across total stands (n = 1760) in temperate forests, South Korea. Abbreviations: Min, minimum; Max, maximum; SE, standard error; SR, species richness, SD, Shannon–Wiener H index; SE, species evenness; FRic, functional richness; FDis, functional dispersion; FEve, functional evenness; CWM, community weighted mean; LDMC, leaf dry matter content; SLA, specific leaf area; WD, wood density; N, nitrogen content; P, phosphorus content; MH, maximum height; DBH, diameter at breast height; CV, coefficient of variance; STD, standard deviation; Skew, skewness; SD, Shannon H index of DBH classes with 2 cm diameter interval; TPI, topographic position index; TWI, topographic wetness index; MAP, mean annual precipitation; MAT, mean annual temperature; CMI, climatic moisture index; Sand, soil sand content; Silt, soil silt content; Clay, soil clay content; N, soil total nitrogen content; CEC, cation exchange capacity; Table S3: Summary of the generalized least-squares (GLS) models to test spatial autocorrelation for abiotic and biotic drivers, and stand age with stand biomass productivity among stand types in temperate forests, South Korea; Figure S1: National Forest Inventory (NFI) survey’s permanent sample plot placement and structure design in South Korea; Figures S2–S4: Box plots for the comparison of stand biomass productivity, abiotic and biotic drivers, and stand age across the forest stand types in temperate forests, South Korea; Figures S5–S8: Pearson’s correlation coefficient between/among stand biomass productivity, abiotic and biotic drivers, and stand age across the forest stand types in temperate forests, South Korea; Figure S9: Parameter estimates with 95% confidence intervals calculated using a model averaging approach represent the effects size (circle) with standard error (bar) of each category of abiotic and biotic drivers, and forest succession-related factor, the variables associated with the highest standardized regression coefficients (β) for stand biomass productivity among (a) conifer, (b) broadleaved, (c) mixed, and (d) total stands in temperate forests; Figure S10: Bivariate relationships between tree size inequality (i.e., DBH STD) and stand age in (a) conifer, (b) broadleaved, (c) mixed and (d) total stands. Fitted regressions are significant (p < 0.05). All the abbreviations for variables are described in Table S2.

Author Contributions

Y.-J.L.: methodology, formal analysis, data curation, visualization, and writing—original draft preparation; C.-B.L.: conceptualization, funding acquisition, methodology, supervision, and writing—review and editing. All authors have read and agreed to the published version of the manuscript.

Funding

This study was supported by a National Research Foundation of Korea (NRF) grant, funded by the Ministry of Science and ICT (No. RS–2024–00358413), as well as the R&D Program for Forest Science Technology (No. RS–2024–00404816) funded by the Korea Forest Service (Korea Forestry Promotion Institute). This study was also financially supported by the Korea Forest Service Government (KFGS) as ’Graduate School specialized in Carbon Sink’ and ’Forest Pioneer Scholarship Program’ of the CHUNGINWOOK Scholarship Foundation.

Data Availability Statement

The original contributions presented in this study are included in the Supplementary Materials; further inquiries can be directed to the corresponding author, Chang-Bae Lee.

Acknowledgments

We sincerely thank the members of Biodiversity-Ecosystem Functioning Laboratory of Kookmin University for their invaluable assistance in this study. We also express our gratitude to the editor and reviewers for their helpful comments and careful revision of this manuscript.

Conflicts of Interest

The authors declare no conflicts of interest.

Abbreviations

The following abbreviations are used in this manuscript:
AICAkaike Information Criterion
CMIClimatic Moisture Index
CWMCommunity-Weighted Mean
CWM MHCommunity-Weighted Mean value of Maximum Tree Height
CWM NCommunity-Weighted Mean value of Leaf Nitrogen Content
CWM SLACommunity-Weighted Mean value of Specific Leaf Area
CWM WDCommunity-Weighted Mean value of Wood Density
DBHDiameter at Breast Height
DBH CVCoefficient of Variation of DBHs
DBH MeanMean DBH
DBH SDShannon H index of DBH classes with 2 cm diameter interval
DBH SkewSkewness of DBHs
DBH STDStandard Deviation of DBHs
FDisFunctional Dispersion
FEveFunctional Evenness
FRicFunctional Richness
FSFForest Succession stage-related Factor
FTDFunctional Trait Diversity
FTIFunctional Trait Identity
GLSGeneralized Least Squares
LDMCLeaf Dry Matter Content
MAPMean Annual Precipitation
MATMean Annual Temperature
SDShannon–Wiener H index
SESpecies Evenness
Soil NSoil total Nitrogen content
SRSpecies Richness
SSDStand Structural Diversity
TPITopographic Position Index
TWITopographic Wetness Index
VIFVariance Inflation Factor
pSEMpiecewise Structural Equation Modelling

References

  1. Brockerhoff, E.G.; Barbaro, L.; Castagneyrol, B.; Forrester, D.I.; Gardiner, B.; González-Olabarria, J.R.; Lyver, P.O.B.; Meurisse, N.; Oxbrough, A.; Taki, H.; et al. Forest biodiversity, ecosystem functioning and the provision of ecosystem services. Biodivers. Conserv. 2017, 26, 3005–3035. [Google Scholar] [CrossRef]
  2. Peres, C.A.; Gardner, T.A.; Barlow, J.; Zuanon, J.; Michalski, F.; Lees, A.C.; Vieira, I.C.G.; Moreira, F.M.S.; Feeley, K.J. Biodiversity conservation in human-modified Amazonian forest landscapes. Biol. Conserv. 2010, 143, 2314–2327. [Google Scholar] [CrossRef]
  3. Borges, P.A.; Gabriel, R.; Fattorini, S. Biodiversity erosion: Causes and consequences. In Life on Land; Springer: Cham, Switzerland, 2020; pp. 81–90. [Google Scholar]
  4. Thom, D.; Seidl, R. Natural disturbance impacts on ecosystem services and biodiversity in temperate and boreal forests. Biol. Rev. 2016, 91, 760–781. [Google Scholar] [CrossRef] [PubMed]
  5. Parrotta, J.; Yeo-Chang, Y.; Camacho, L.D. Traditional knowledge for sustainable forest management and provision of ecosystem services. Int. J. Biodivers. Sci. Ecosyst. Serv. Manag. 2016, 12, 1–4. [Google Scholar] [CrossRef]
  6. Srivastava, D.S.; Vellend, M. Biodiversity–ecosystem function research: Is it relevant to conservation? Annu. Rev. Ecol. Evol. Syst. 2005, 36, 267–294. [Google Scholar] [CrossRef]
  7. Ali, A. Biodiversity–ecosystem functioning research: Brief history, major trends and perspectives. Biol. Conserv. 2023, 285, 110210. [Google Scholar] [CrossRef]
  8. Cardinale, B.J.; Wright, J.P.; Cadotte, M.W.; Carroll, I.T.; Hector, A.; Srivastava, D.S.; Loreau, M.; Weis, J.J. Impacts of plant diversity on biomass production increase through time because of species complementarity. Proc. Natl. Acad. Sci. USA 2007, 104, 18123–18128. [Google Scholar] [CrossRef]
  9. Finegan, B.; Peña-Claros, M.; de Oliveira, A.; Ascarrunz, N.; Bret-Harte, M.S.; Carreño-Rocabado, G.; Casanoves, F.; Díaz, S.; Eguiguren Velepucha, P.; Fernandez, F.; et al. Does functional trait diversity predict above-ground biomass and productivity of tropical forests? Testing three alternative hypotheses. J. Ecol. 2015, 103, 191–201. [Google Scholar] [CrossRef]
  10. Tilman, D.; Lehman, C.L.; Thomson, K.T. Plant diversity and ecosystem productivity: Theoretical considerations. Proc. Natl. Acad. Sci. USA 1997, 94, 1857–1861. [Google Scholar] [CrossRef]
  11. Wan, Z.; Ganjurjav, H.; Gu, R.; Hu, G.; Gornish, E.S.; Chun, X.; Zhou, H.; Gao, Q. Changes in plant species dominance maintain community biomass production under warming and precipitation addition in temperate steppe in Inner Mongolia, China. Agric. For. Meteorol. 2023, 341, 109671. [Google Scholar] [CrossRef]
  12. Grime, J.P. Benefits of plant diversity to ecosystems: Immediate, filter and founder effects. J. Ecol. 1998, 86, 902–910. [Google Scholar] [CrossRef]
  13. Dănescu, A.; Albrecht, A.T.; Bauhus, J. Structural diversity promotes productivity of mixed, uneven-aged forests in southwestern Germany. Oecologia 2016, 182, 319–333. [Google Scholar] [CrossRef]
  14. Fotis, A.T.; Morin, T.H.; Fahey, R.T.; Hardiman, B.S.; Bohrer, G.; Curtis, P.S. Forest structure in space and time: Biotic and abiotic determinants of canopy complexity and their effects on net primary productivity. Agric. For. Meteorol. 2018, 250, 181–191. [Google Scholar] [CrossRef]
  15. Dieler, J.; Uhl, E.; Biber, P.; Müller, J.; Rötzer, T.; Pretzsch, H. Effect of forest stand management on species composition, structural diversity, and productivity in the temperate zone of Europe. Eur. J. For. Res. 2017, 136, 739–766. [Google Scholar] [CrossRef]
  16. Ma, Q.; Su, Y.; Hu, T.; Jiang, L.; Mi, X.; Lin, L.; Cao, M.; Wang, X.; Lin, F.; Wang, B.; et al. The coordinated impact of forest internal structural complexity and tree species diversity on forest productivity across forest biomes. Fundam. Res. 2024, 4, 1185–1195. [Google Scholar] [CrossRef] [PubMed]
  17. Fei, S.; Jo, I.; Guo, Q.; Wardle, D.A.; Fang, J.; Chen, A.; Oswalt, C.M.; Brockerhoff, E.G. Impacts of climate on the biodiversity–productivity relationship in natural forests. Nat. Commun. 2018, 9, 5436. [Google Scholar] [CrossRef]
  18. Qiao, X.; Zhang, N.; Zhang, C.; Zhang, Z.; Zhao, X.; von Gadow, K. Unravelling biodiversity–productivity relationships across a large temperate forest region. Funct. Ecol. 2021, 35, 2808–2820. [Google Scholar] [CrossRef]
  19. Jactel, H.; Gritti, E.S.; Drössler, L.; Forrester, D.I.; Mason, W.L.; Morin, X.; Pretzsch, H.; Castagneyrol, B. Positive biodiversity–productivity relationships in forests: Climate matters. Biol. Lett. 2018, 14, 20170747. [Google Scholar] [CrossRef]
  20. Zhang, W.P.; Fornara, D.; Yang, H.; Yu, R.P.; Callaway, R.M.; Li, L. Plant litter strengthens positive biodiversity–ecosystem functioning relationships over time. Trends Ecol. Evol. 2023, 38, 473–484. [Google Scholar] [CrossRef]
  21. Binkley, D.; Fisher, R.F. Ecology and Management of Forest Soils, 5th ed.; John Wiley & Sons: Hoboken, NJ, USA, 2019. [Google Scholar]
  22. Grace, J.B.; Anderson, T.M.; Seabloom, E.W.; Borer, E.T.; Adler, P.B.; Harpole, W.S.; Hautier, Y.; Hillebrand, H.; Lind, E.M.; Pärtel, M.; et al. Integrative modelling reveals mechanisms linking productivity and plant species richness. Nature 2016, 529, 390–393. [Google Scholar] [CrossRef]
  23. Ouyang, S.; Xiang, W.; Wang, X.; Zeng, Y.; Lei, P.; Deng, X.; Peng, C. Significant effects of biodiversity on forest biomass during the succession of subtropical forest in south China. For. Ecol. Manag. 2016, 372, 291–302. [Google Scholar] [CrossRef]
  24. LaManna, J.A.; Belote, R.T.; Burkle, L.A.; Catano, C.P.; Myers, J.A. Negative density dependence mediates biodiversity–productivity relationships across scales. Nat. Ecol. Evol. 2017, 1, 1107–1115. [Google Scholar] [CrossRef]
  25. Tian, D.; Yan, Y.; Zhang, Z.; Jiang, L. Driving mechanisms of biomass mean annual increment in planted and natural forests in China. For. Ecol. Manag. 2024, 569, 122191. [Google Scholar] [CrossRef]
  26. Korea Forest Service. Guide to the Seventh National Forest Resources Inventory and Field Survey of Forest Ecosystem Health and Vitality; Korea Forest Service: Daejeon, Republic of Korea, 2017. (In Korean) [Google Scholar]
  27. Son, Y.M.; Kim, R.H.; Lee, K.H.; Pyo, J.K.; Kim, S.W.; Hwang, J.S.; Park, H. Carbon Emission Factors and Biomass Allometric Equations by Species in Korea; Korea Forest Research Institute: Seoul, Republic of Korea, 2014. [Google Scholar]
  28. Lee, Y.J.; Lee, C.B.; Lee, M.K. Tree size variation induced by stand age mainly regulates aboveground biomass across three major stands of temperate forests in South Korea. Front. For. Glob. Change 2023, 6, 1229661. [Google Scholar] [CrossRef]
  29. Lee, Y.J.; Park, G.E.; Lee, H.I.; Lee, C.B. Stand age-driven tree size variation and stand type regulate aboveground biomass in alpine–subalpine forests, South Korea. Sci. Total Environ. 2024, 915, 170063. [Google Scholar] [CrossRef]
  30. Lee, Y.J.; Lee, H.I.; Lee, C.B.; Lee, K.H.; Kim, R.H.; Ali, A. Abiotic and stand age-induced changes in tree diversity and size inequality regulate aboveground biomass and soil organic carbon stock in temperate forests of South Korea. Catena 2024, 237, 107827. [Google Scholar] [CrossRef]
  31. Lee, M.K.; Lee, Y.J.; Lee, C.B. Ecosystem multifunctionality in temperate forests of South Korea is primarily controlled by structural diversity and potential moisture availability with synergy effects between ecosystem functions. J. Environ. Manag. 2025, 382, 125449. [Google Scholar] [CrossRef] [PubMed]
  32. Pérez-Harguindeguy, N.; Díaz, S.; Garnier, E.; Lavorel, S.; Poorter, H.; Jaureguiberry, P.; Bret-Harte, M.S.; Cornwell, W.K.; Craine, J.M.; Gurvich, D.E.; et al. Corrigendum to: New handbook for standardised measurement of plant functional traits worldwide. Aust. J. Bot. 2016, 64, 715–716. [Google Scholar] [CrossRef]
  33. R Development Core Team. R: A Language and Environment for Statistical Computing; R Foundation for Statistical Computing: Vienna, Austria, 2023. [Google Scholar]
  34. Lee, M.K.; Lee, Y.J.; Chun, J.H.; Kim, A.R.; Lee, C.B. Ecosystem services and multifunctionality are co-regulated by biotic and abiotic factors along with forest types in a temperate forest of South Korea. Glob. Ecol. Conserv. 2025, 61, e03683. [Google Scholar] [CrossRef]
  35. Yuan, Z.; Ali, A.; Wang, S.; Wang, X.; Lin, F.; Wang, Y.; Fang, S.; Hao, Z.; Loreau, M.; Jiang, L. Temporal stability of aboveground biomass is governed by species asynchrony in temperate forests. Ecol. Indic. 2019, 107, 105661. [Google Scholar] [CrossRef]
  36. Li, W.; Zhou, X.; Xiang, Z.; Li, J.; Wang, S.; Loreau, M.; Jiang, L. Biomass temporal stability increases at two spatial scales during secondary succession. J. Ecol. 2023, 111, 1575–1586. [Google Scholar] [CrossRef]
  37. Lee, C.B.; Ali, A.; Yuan, Z.; Lutz, J.A.; Svenning, J.C.; Lee, M.K. Large-diameter trees control forest structure and function in successional temperate forests. Biogeosci. Discuss. 2022, 2022, 1–20. [Google Scholar]
  38. Graham, M.H. Confronting multicollinearity in ecological multiple regression. Ecology 2003, 84, 2809–2815. [Google Scholar] [CrossRef]
  39. Legendre, P.; Legendre, L. Numerical Ecology, 3rd ed.; Elsevier: Amsterdam, The Netherlands, 2012. [Google Scholar]
  40. Lefcheck, J.S. piecewiseSEM: Piecewise structural equation modelling in R for ecology, evolution, and systematics. Methods Ecol. Evol. 2016, 7, 573–579. [Google Scholar] [CrossRef]
  41. Wang, L.Q.; Ali, A. Functional identity regulates aboveground biomass better than trait diversity along abiotic conditions in global forest metacommunities. Ecography 2022, 2022, e06110. [Google Scholar] [CrossRef]
  42. Matsuo, T.; Martínez-Ramos, M.; Bongers, F.; van der Sande, M.T.; Poorter, L. Forest structure drives changes in light heterogeneity during tropical secondary forest succession. J. Ecol. 2021, 109, 2871–2884. [Google Scholar] [CrossRef]
  43. Matsuo, T.; Hiura, T.; Onoda, Y. Vertical and horizontal light heterogeneity along gradients of secondary succession in cool- and warm-temperate forests. J. Veg. Sci. 2022, 33, e13135. [Google Scholar] [CrossRef]
  44. Binkley, D.; Stape, J.L.; Bauerle, W.L.; Ryan, M.G. Explaining growth of individual trees: Light interception and efficiency of light use by Eucalyptus at four sites in Brazil. For. Ecol. Manag. 2010, 259, 1704–1713. [Google Scholar] [CrossRef]
  45. Kern, C.C.; Montgomery, R.A.; Reich, P.B.; Strong, T.F. Canopy gap size influences niche partitioning of the ground-layer plant community in a northern temperate forest. J. Plant Ecol. 2013, 6, 101–112. [Google Scholar] [CrossRef]
  46. Zhang, Y.; Chen, H.Y. Individual size inequality links forest diversity and above-ground biomass. J. Ecol. 2015, 103, 1245–1252. [Google Scholar] [CrossRef]
  47. Michaletz, S.T.; Kerkhoff, A.J.; Enquist, B.J. Drivers of terrestrial plant production across broad geographical gradients. Glob. Ecol. Biogeogr. 2018, 27, 166–174. [Google Scholar] [CrossRef]
  48. Toledo, M.; Peña-Claros, M.; Bongers, F.; Alarcón, A.; Balcázar, J.; Chuviña, J.; Leaño, C.; Licona, J.C.; Poorter, L. Distribution patterns of tropical woody species in response to climatic and edaphic gradients. J. Ecol. 2012, 100, 253–263. [Google Scholar] [CrossRef]
  49. Quesada, C.A.; Phillips, O.L.; Schwarz, M.; Czimczik, C.I.; Baker, T.R.; Patiño, S.; Fyllas, N.M.; Hodnett, M.G.; Herrera, R.; Almeida, S.; et al. Basin-wide variations in Amazon forest structure and function are mediated by both soils and climate. Biogeosciences 2012, 9, 2203–2246. [Google Scholar] [CrossRef]
  50. Poorter, L.; van der Sande, M.T.; Arets, E.J.M.M.; Ascarrunz, N.; Enquist, B.J.; Finegan, B.; Licona, J.C.; Martínez-Ramos, M.; Mazzei, L.; Meave, J.A.; et al. Biodiversity and climate determine the functioning of Neotropical forests. Glob. Ecol. Biogeogr. 2017, 26, 1423–1434. [Google Scholar] [CrossRef]
  51. Hao, M.; Messier, C.; Geng, Y.; Zhang, C.; Zhao, X.; von Gadow, K. Functional traits influence biomass and productivity through multiple mechanisms in a temperate secondary forest. Eur. J. For. Res. 2020, 139, 959–968. [Google Scholar] [CrossRef]
  52. McAlpine, K.G.; Lamoureaux, S.L.; Timmins, S.M. Understory vegetation provides clues to succession in woody weed stands. N. Z. J. Ecol. 2021, 45, 1–10. [Google Scholar] [CrossRef]
  53. Wu, W.; Zhou, X.; Wen, Y.; Zhu, H.; You, Y.; Qin, Z.; Li, Y.; Huang, X.; Yan, L.; Li, H.; et al. Coniferous–broadleaf mixture increases soil microbial biomass and functions accompanied by improved stand biomass and litter production in subtropical China. Forests 2019, 10, 879. [Google Scholar] [CrossRef]
  54. Lopez, E.L.; Kerr, S.A.; Sauchyn, D.J.; Vanderwel, M.C. Variation in tree growth sensitivity to moisture across a water-limited forest landscape. Dendrochronologia 2019, 54, 87–96. [Google Scholar] [CrossRef]
  55. Schwaab, J.; Davin, E.L.; Bebi, P.; Duguay-Tetzlaff, A.; Waser, L.T.; Haeni, M.; Meier, R. Increasing the broad-leaved tree fraction in European forests mitigates hot temperature extremes. Sci. Rep. 2020, 10, 14153. [Google Scholar] [CrossRef]
  56. Billing, M.; Thonicke, K.; Sakschewski, B.; von Bloh, W.; Walz, A. Future tree survival in European forests depends on understorey tree diversity. Sci. Rep. 2022, 12, 20750. [Google Scholar] [CrossRef]
  57. Castillo-Figueroa, D.; González-Melo, A.; Posada, J.M. Wood density is related to aboveground biomass and productivity along a successional gradient in upper Andean tropical forests. Front. Plant Sci. 2023, 14, 1276424. [Google Scholar] [CrossRef] [PubMed]
  58. Song, Z.; Shi, P.; Li, P.; Li, Z.; Niu, H.; Zu, P.; Cao, M.; Jia, Y. Effects of forest type on carbon storage in the hilly region of Loess Plateau, China. Front. For. Glob. Change 2024, 7, 1349047. [Google Scholar] [CrossRef]
  59. Weemstra, M.; Zambrano, J.; Allen, D.; Umaña, M.N. Tree growth increases through opposing above-ground and below-ground resource strategies. J. Ecol. 2021, 109, 3502–3512. [Google Scholar] [CrossRef]
  60. Priesner, J.; Sakschewski, B.; Billing, M.; von Bloh, W.; Fiedler, S.; Bereswill, S.; Thonicke, K.; Tietjen, B. What if extreme droughts occur more frequently?—Mechanisms and limits of forest adaptation in pine monocultures and mixed forests in Berlin-Brandenburg, Germany. EGUsphere 2025, 25, 3309–3331. [Google Scholar] [CrossRef]
  61. Tan, J.; Wu, X.; Wang, L.; Wu, N.; Li, Z. Differential specific leaf area due to different stand structures drives alterations in soil organic carbon in artificial forests of karst areas. For. Ecol. Manag. 2024, 556, 121719. [Google Scholar] [CrossRef]
  62. Singh Ramesh, A.; Cheesman, A.W.; Flores-Moreno, H.; Preece, N.D.; Crayn, D.M.; Cernusak, L.A. Temperature, nutrient availability, and species traits interact to shape elevation responses of Australian tropical trees. Front. For. Glob. Change 2023, 6, 1089167. [Google Scholar] [CrossRef]
Figure 1. Conceptual model to test the hypothesized mechanisms of abiotic, biotic drivers and forest succession-related factor on forest stand biomass productivity among forest stand types in temperate forests of South Korea.
Forests 16 01759 g001
Figure 2. The location of 1760 study plots including (a) 344 plots of conifer (20%), (b) 711 plots of broadleaved stands (40%), (c) 705 plots of mixed stands (40%) and (d) total stands in temperate forests, South Korea.
Forests 16 01759 g002
Figure 3. pSEM models to test the multiple pathways of abiotic and biotic drivers and FSF on forest stand biomass productivity for (a) conifer, (b) broadleaved, (c) mixed, and (d) total stands in temperate forests of South Korea. Gray arrows indicate estimated covariance. Solid arrows indicate significance (p < 0.05). Red arrows indicate positive associations, whereas blue arrows indicate negative associations. Standardized coefficients are shown for each arrow and covariance. Abbreviations: CMI, climatic moisture index; MAT, mean annual temperature; Soil N, soil total nitrogen content; SR, species richness; SE, species evenness; FEve, functional evenness; FRic, functional richness; FDis; functional dispersion; DBH STD, standard deviation of diameter at breast height (DBH); CWM, community-weighted mean; WD, wood density; N, leaf nitrogen content; SLA, specific leaf area; MH, tree maximum height. Significance levels are * p < 0.05, ** p < 0.01, and *** p < 0.001.
Forests 16 01759 g003
Figure 4. Bivariate relationships between abiotic drivers, stand age and stand biomass productivity in (a) conifer, (b) broadleaved, (c) mixed and (d) total stands. Fitted regressions are significant (p < 0.05). All the abbreviations for variables are described in Figure 3.
Forests 16 01759 g004
Figure 5. Bivariate relationships between forest stand biomass productivity and biotic drivers in (a) conifer, (b) broadleaved, (c) mixed and (d) total stands. Fitted regressions are significant (p < 0.05). All the abbreviations for variables are described in Figure 3.
Forests 16 01759 g005
Disclaimer/Publisher’s Note: The statements, opinions and data contained in all publications are solely those of the individual author(s) and contributor(s) and not of MDPI and/or the editor(s). MDPI and/or the editor(s) disclaim responsibility for any injury to people or property resulting from any ideas, methods, instructions or products referred to in the content.