1. Introduction
Wood refers to the natural organic material derived from trees after felling and preliminary processing, used for construction, furniture, decoration, and various other purposes [
1,
2]. It is an extremely important renewable resource. Major global timber sources include coniferous species such as
Pinus massoniana Lamb. from the Pinaceae family,
Picea abies L.H.Karst and
Abies alba Mill. from the Pinaceae family, as well as broadleaf species like
Eucalyptus globulus Labill. from the Myrtaceae family and
Betula pendula Roth. from the Betulaceae family. These plants are widely used in plantation forestry and timber production due to their excellent material properties and strong adaptability. However, China faces relatively scarce forest resources. According to the findings of the Ninth National Forest Resources Inventory, China’s total forest area stands at 220 million hectares, with a forest stock volume of 17.56 billion cubic meters. The national forest coverage rate is 22.96%, below the global average of 30.7%. Per capita forest area is less than one-third of the world average, and per capita forest stock volume is only one-sixth of the global average. With China’s continuous economic development, demand for timber across all industries continues to grow. In 2022, national timber production reached 110 million cubic meters, while apparent consumption totaled 150 million cubic meters. In developed countries like Sweden, Germany, and Finland—which rank among the world’s top sawmill exporters—advanced forest management and wood processing technologies enable comprehensive wood utilization rates as high as 90%. In stark contrast, China’s wood processing industry achieves less than 60% comprehensive utilization due to various inherent defects in the timber itself. Manual visual inspection suffers from high rates of missed and misidentified defects and cannot detect minute flaws. This results in 22% waste, reducing the total output of wood products from 63.5% to 47.4% [
3]. Evidently, developing high-precision, high-efficiency automated wood defect detection technology has become an urgent bottleneck requiring breakthroughs.
Based on their origins, wood defects can be primarily categorized into three types: growth defects, pathological defects, and processing defects [
4,
5]. Growth defects are mainly caused by physiological factors during the natural growth of trees, including live knots, dead knots, cracks, and resin [
6,
7,
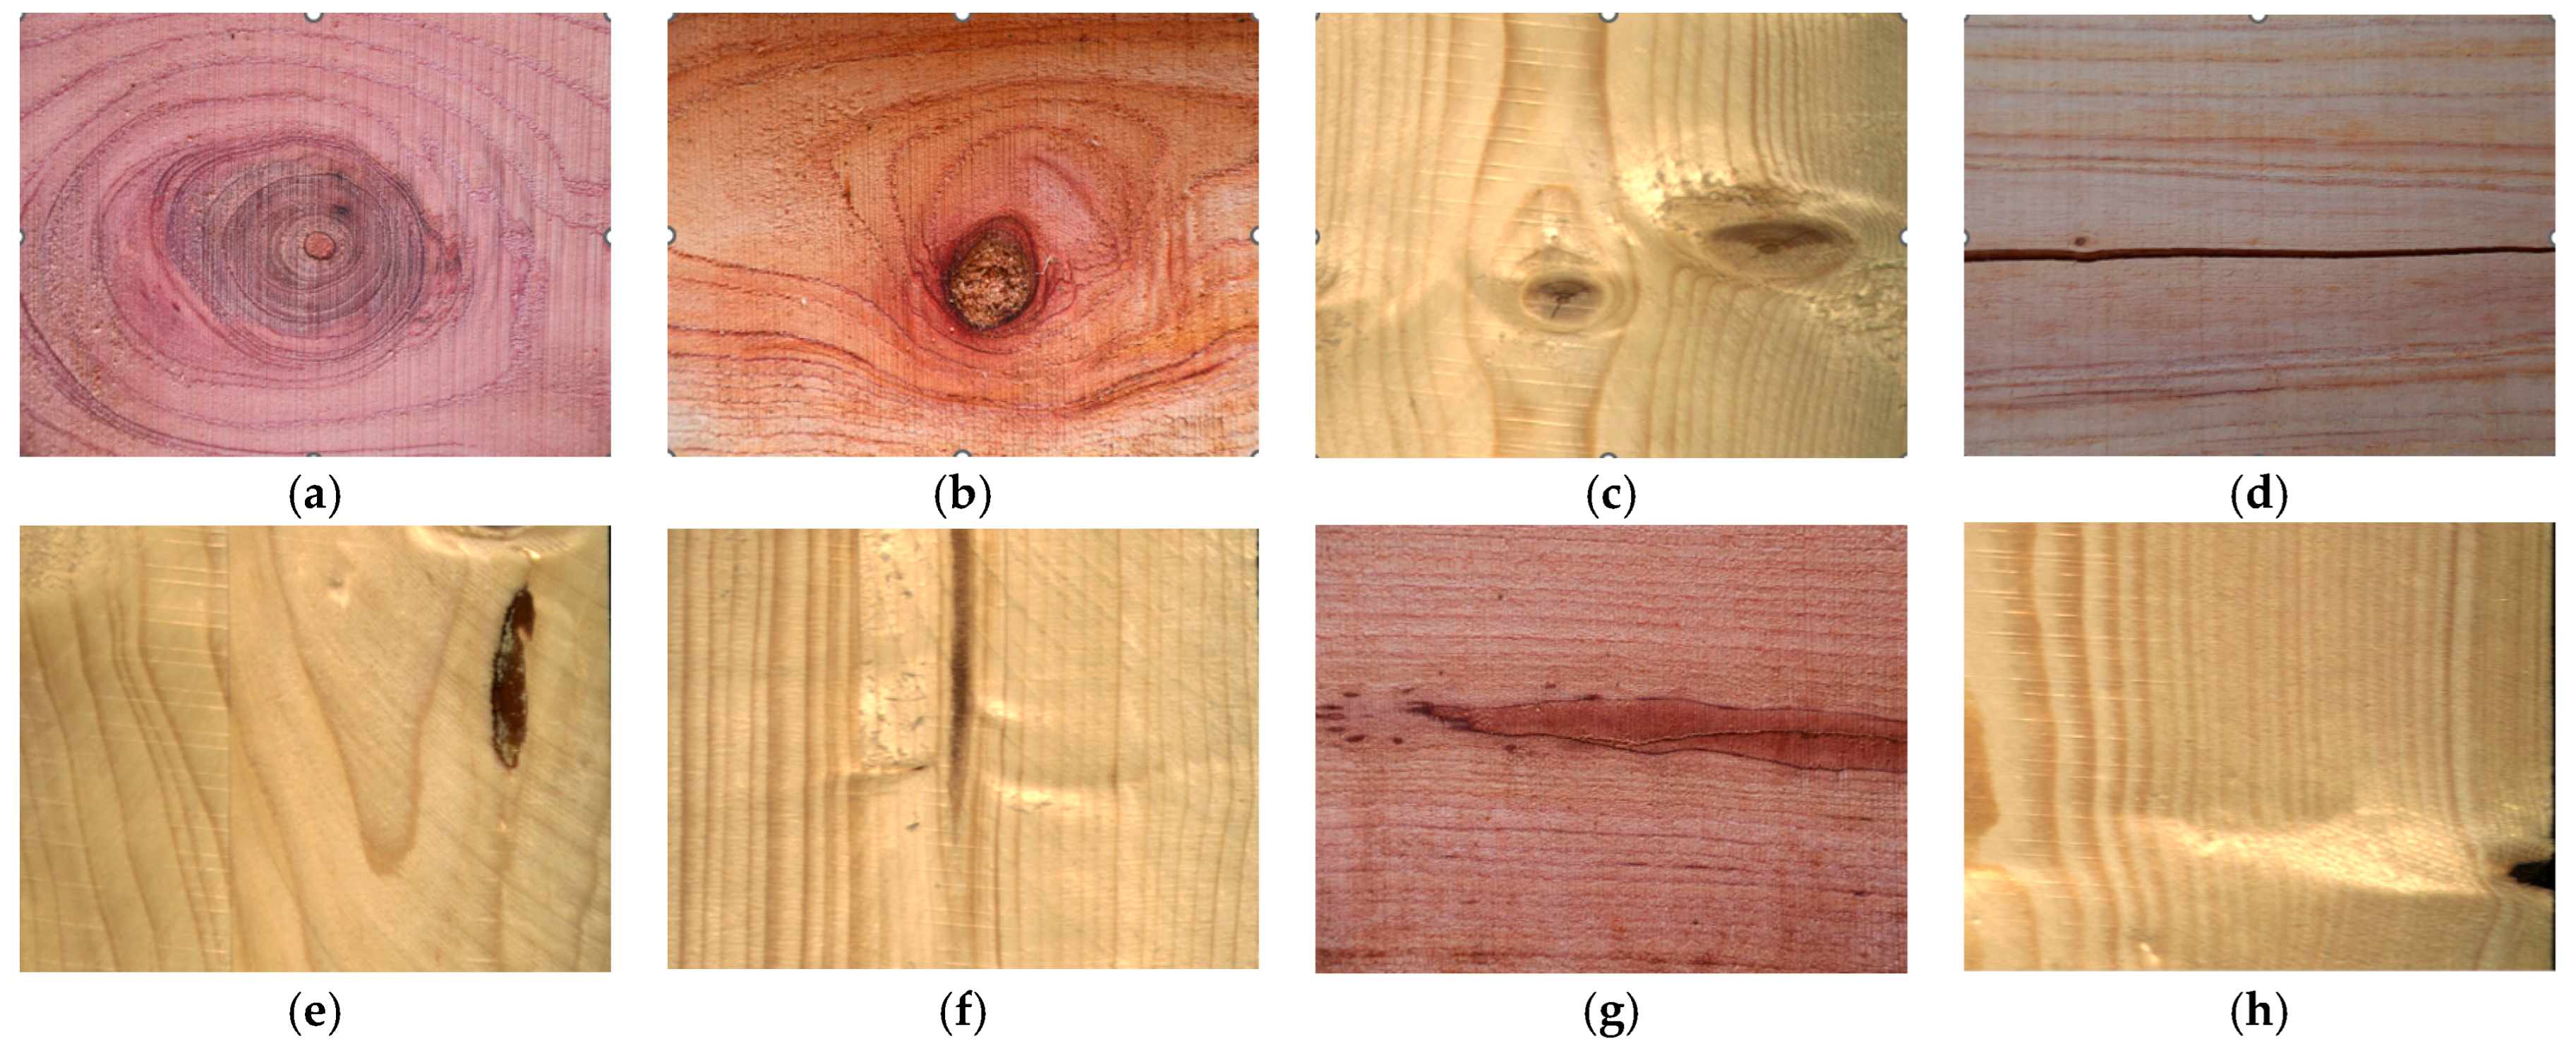
8]. Live knots and dead knots are common types of growth defects, as shown in
Figure 1, and their presence significantly impacts the strength and durability of wood. Pathological defects primarily stem from pests and diseases, including discoloration, decay, and insect infestation. Discoloration is categorized into chemical discoloration and fungal discoloration [
9], which typically do not significantly impair the physical and mechanical properties of wood but compromise its appearance, particularly in decorative timber. Processing defects arise from improper human operations during wood processing, such as sawing and drying [
10]. These include blunt edges, sharp edges, wavy saw marks, ripples, burrs, and skewed saw cuts, which severely compromise the quality of wood products. Therefore, accurate identification and systematic classification of wood defects are essential prerequisites for achieving efficient sorting, optimizing processing workflows, and enhancing product value. Traditional manual inspection methods suffer from low efficiency and high misdetection rates, failing to meet modern industry demands for high quality and efficiency. There is an urgent need to introduce intelligent, automated detection methods.
Currently prevalent wood defect detection technologies primarily include ultrasonic, X-ray, and machine vision methods. Ultrasonic detection identifies defects by measuring propagation time differences in ultrasonic waves within wood [
11,
12,
13]. However, its application on production lines is constrained by detection speed limitations and reliance on operator expertise. X-ray detection methods utilize radiation attenuation characteristics for imaging to identify internal tree defects [
14,
15,
16]. Although capable of high-precision visualization of both internal and external structural features of logs, such equipment is bulky and expensive, creating high barriers to entry that hinder widespread adoption in the timber industry. Machine vision inspection technology [
17,
18,
19,
20], benefiting from advances in digital image processing and pattern recognition, has become the mainstream method for surface defect detection. This technology utilizes optical components to acquire images and perform automated analysis. It is characterized by high cost-effectiveness, high precision, and high speed. Significantly, optical components have found extensive applications in other non-destructive testing (NDT) methods as well. In particular, they are widely used in systems that integrate optical and ultrasonic technologies. For example, Ustabaş Kaya and Saraç proposed an optical acoustic wave recorder based on digital holography for crack detection. In this method, when acoustic waves pass through materials, they are recorded as holograms, which are then analyzed to image cracks [
21]. This approach can achieve non—contact detection of both internal and surface defects. Nevertheless, it necessitates complex optical setups and substantial computational costs for hologram reconstruction. Likewise, Achamfuo-Yeboah et al. [
22] developed a custom CMOS sensor for the optical detection of ultrasonic waves on rough surfaces. They addressed the issue of speckle noise through an adaptive knife-edge detector array. Although this system can achieve high-speed adaptation and reliable detection, its sensitivity and bandwidth are constrained by sensor design and environmental factors. In a comprehensive review, Xie et al. [
23] summarized various optical methods in laser ultrasonic testing (LUT), including interferometric and non-interferometric techniques, and emphasized their advantages in high-temperature and harsh environments. However, these optical-ultrasonic methods generally require costly equipment and specialized expertise, limiting widespread industrial adoption. As summarized in
Table 1, these hybrid approaches excel in specific scenarios but face trade-offs in complexity, cost, and speed compared to pure machine vision methods. While optical-ultrasonic technology offers distinct advantages for internal defect detection, the machine vision approach employed in this study relies solely on surface image acquisition and deep-learning-based analysis, eliminating ultrasonic generation and complex instrument configurations. This substantially reduced system cost and operational complexity, rendering it more suitable for high-speed online inspection in the wood processing industry.
Nevertheless, these hybrid approaches excel in specific scenarios but face trade-offs in complexity, cost, and speed compared to pure machine vision methods. While optical-ultrasonic technology offers distinct advantages for internal defect detection, the machine vision approach employed in this study relies solely on surface image acquisition and deep-learning-based analysis, eliminating ultrasonic generation and complex instrument configurations. This substantially reduces system cost and operational complexity, rendering it more suitable for high-speed online inspection in the wood processing industry. However, quality defect detection in current industrial practice faces multiple challenges regarding accuracy, efficiency, and practicality. First, defective samples are extremely scarce in actual production lines, with scrap-to-good ratios often exceeding 20:1, causing models to be biased toward majority classes due to class imbalance, while expert annotation is time-consuming and labor-intensive, severely constraining the effectiveness of deep learning applications [
24]. Second, dynamic changes in production environments (such as raw material replacement or process parameter adjustments) introduce unforeseen visual artifacts that render pre-trained models ineffective and require costly retraining. Third, production line inspection cycles are typically within 1–2 s per piece, requiring inference speeds of no less than 30 FPS while maintaining high accuracy with mAP > 90%, imposing stringent demands on model lightweight design and real-time performance [
25]. Finally, traditional handcrafted feature methods are highly sensitive to threshold selection with poor robustness, while complex models struggle to meet computational constraints of edge devices, necessitating solutions that balance both accuracy and efficiency [
26].
In the fields of machine vision and deep learning, object detection models can be broadly categorized into two types based on their processing methods: single-stage and two-stage. Two-stage models such as R-CNN [
27] and Faster R-CNN [
28] achieve high detection accuracy by generating candidate boxes and filtering and classifying detected objects. However, they consume higher computational resources due to their complex computations and high learning costs. The RCNN framework [
29,
30] demonstrates excellent performance in detecting knots and holes. However, improvements in detection accuracy come at the cost of reduced detection speed. Single-stage models, on the other hand, directly predict boxes and categories densely on feature maps, eliminating the candidate box generation step. This results in simpler structures and faster processing speeds. SSD (Single Shot Multibox Detector), a representative single-stage model, simultaneously predicts different-sized templates using multi-scale feature maps, achieving high accuracy while maintaining real-time performance [
31]. However, its effectiveness is limited for dense small objects. The YOLO series [
32,
33,
34], building upon the single-stage approach’s “one-pass, end-to-end” advantage, continuously optimizes network architecture, positive/negative sample allocation, and loss functions. It achieves high recall with moderate localization accuracy, features compact model weights, and offers deployment-friendly characteristics, making it advantageous for real-time detection. Truong et al. [
35] utilized the YOLOv5 model to detect defects in small hardwood flooring on production lines through techniques like background removal, boundary approximation, and defect detection. Reference [
36] optimized the YOLOX model by integrating ECA and ASFF mechanisms with the Focal-EIoU loss function, enhancing detection accuracy for rubber sheet surface defects while achieving model lightweighting via deep separable convolutions. Xu et al. [
37] improved both YOLOv5n and YOLOv5m models. The modified YOLOv5n-C3Ghost and YOLOv5m-C3Ghost models achieved mAP50-95 improvements of 1.5% and 1.6%, with parameter reductions of 51% and 63%, respectively. Inference time and floating-point operations were also decreased. To enhance detection accuracy for small-scale defects, Tian et al. [
38] proposed an improved YOLOv5-TSPP network. This approach first generates scale-adaptive anchor boxes using the K-Means++ algorithm, then embeds a Coordinate Attention module within the backbone network to enhance feature extraction capabilities. It also introduces a reconstructed SPP structure to expand the receptive field and capture key features of small objects. Experimental results show that YOLOv5-TSPP achieves an mAP of 80.3%, representing a 9.2% improvement over the original YOLOv5. Specifically, detection accuracies for black knots, back cracks, and mineral streak defects reach 98.6%, 92.1%, and 92.3%, respectively. The bilinear fine-grained convolutional neural network (BLNN) proposed by Gao et al. achieved an mAP of 99.2% in experiments [
39]. However, its dataset contained only one type of wood defect. This singularity limited its evaluation on other defect types, hindering practical application. The more advanced YOLOv8 model has now been introduced [
40]. Wang et al. [
41] conducted experiments on seven wood defect types using YOLOv8, achieving a broader defect coverage with an mAP of 77.7%. However, this model’s enhancements resulted in increased model size and parameters, losing the relatively lightweight advantage of the original YOLO model. Therefore, there is an urgent need to develop a wood defect detection model tailored for industrial production lines, offering further optimization in defect recognition precision, accuracy, lightweight design, and generalization capabilities compared to existing methods.
Based on the above analysis, this paper adopts YOLOv8n as the base model. To further enhance the recall, accuracy, and efficiency of the wood defect recognition model, this paper proposes an improved model, EFCW-YOLO. First, data augmentation is applied to the dataset. Subsequently, the following components are introduced: ECA (Efficient Channel Attention), FocalNets (Focal Modulation Networks) modules, C2fCIB module (Convolutional-to-Feature Concatenation with Inverted Bottleneck), and the Wise-IoU v3 loss function. The key innovations introduced in this study are as follows:
Data augmentation enhances dataset quantity and quality while balancing learning weights for various defects, yielding a rich and mature wood defect dataset;
In the backbone architecture, the original SPPF layer (Spatial Pyramid Pooling Fast) is replaced with the Focal Modulation Networks module;
The neck structure incorporates the Efficient Channel Attention (ECA) mechanism;
The head structure employs the C2fCIB module to optimize feature extraction, replacing part of the C2f modules with compact inverted blocks (CIB);
The original CIoU loss function is replaced with the Wise-IoU v3 loss function.
The improved model EFCW-YOLO demonstrates superior detection accuracy in this research domain while largely preserving the original model’s lightweight and high-efficiency characteristics. It also exhibits strong generalization and transfer capabilities.
2. Materials and Methods
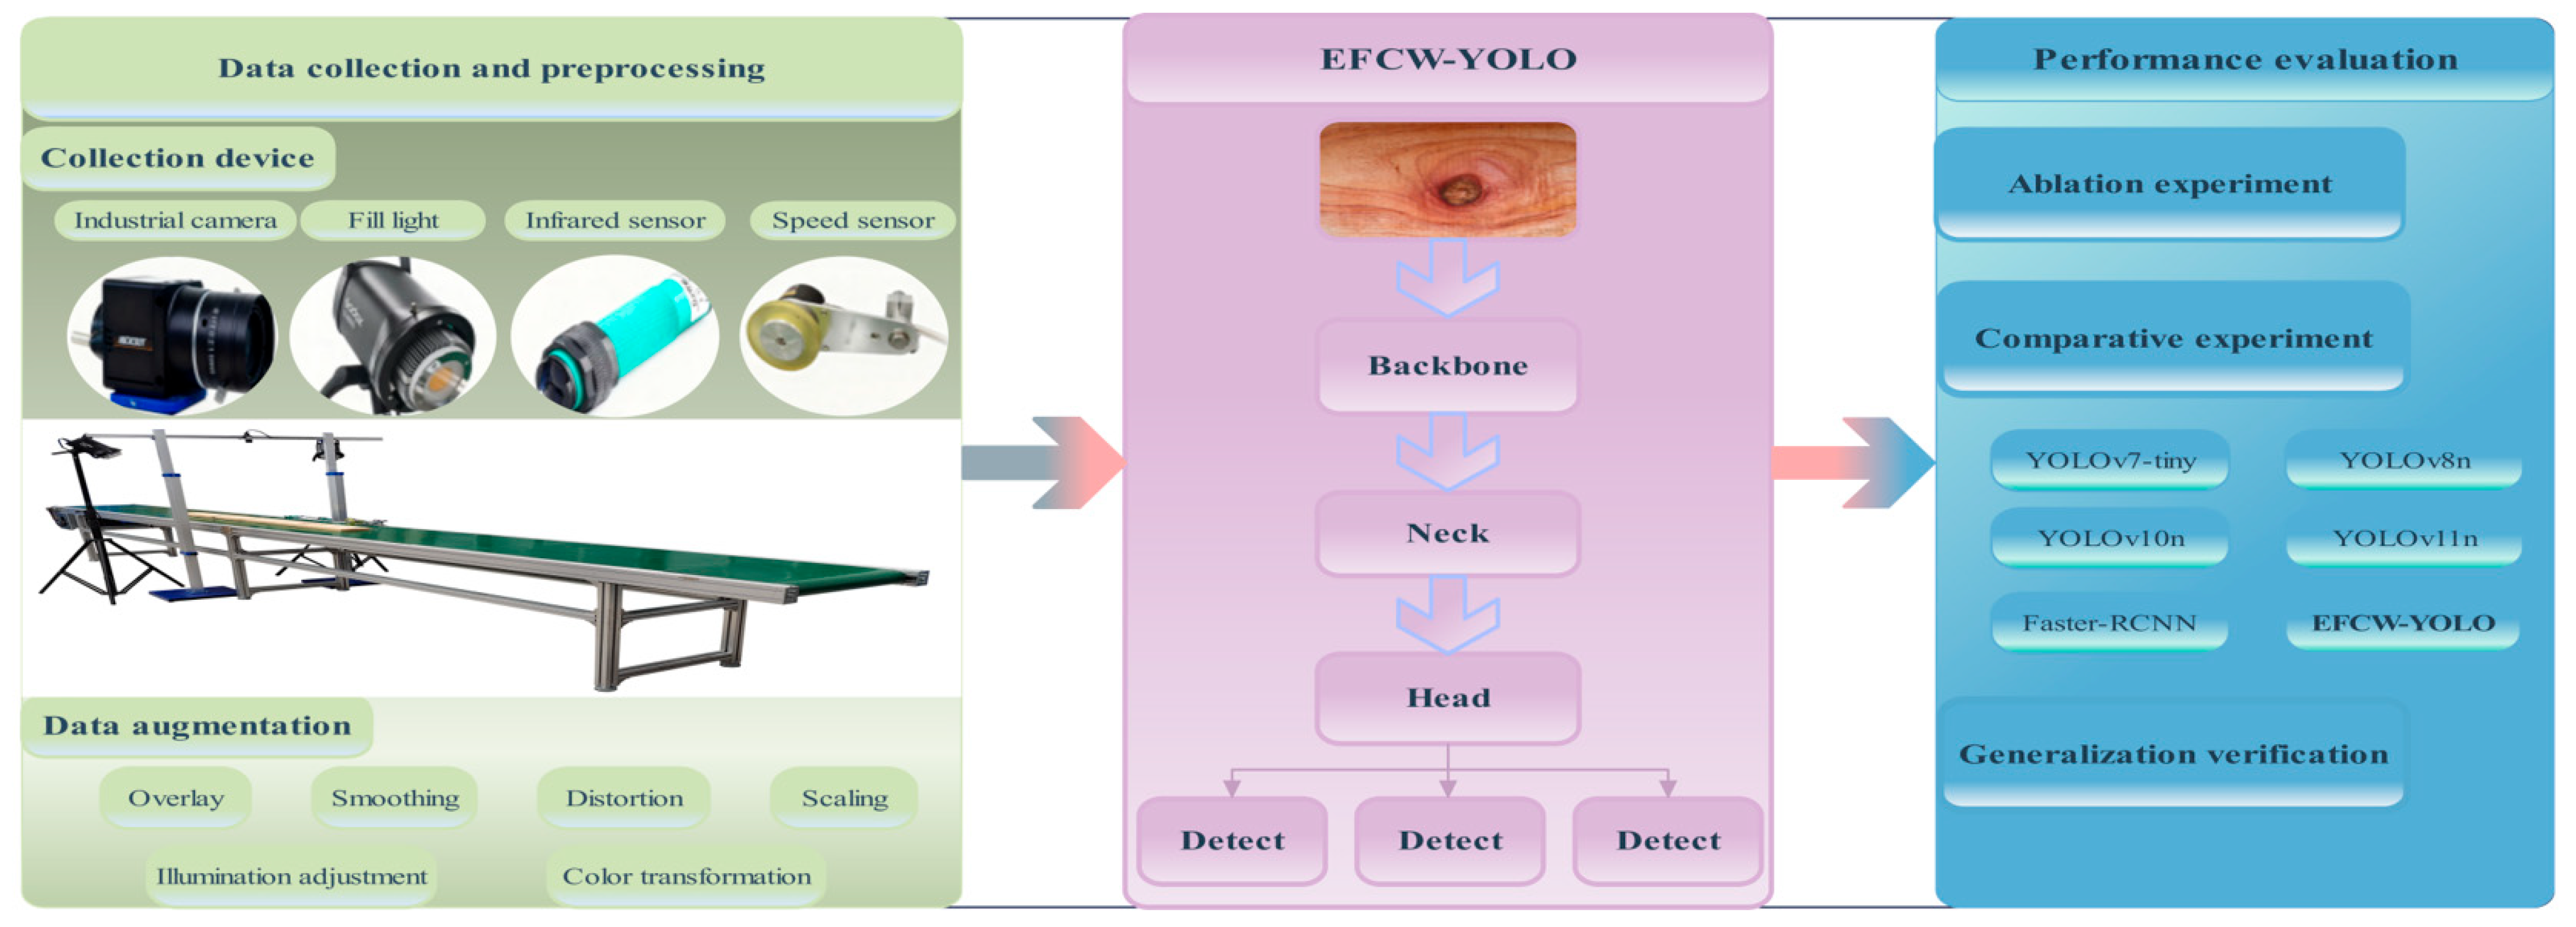
Figure 2 illustrates the comprehensive technical roadmap of this study, which encompasses the entire workflow from data collection to model deployment. The roadmap begins with data collection and preprocessing, where wood surface images are acquired using our custom-built imaging system. Subsequently, data augmentation techniques are applied to enhance dataset diversity and address class imbalance issues. The core of our approach is the EFCW-YOLO model, which integrates four key improvements over the baseline YOLOv8n architecture. The model’s performance is rigorously evaluated through ablation studies and comparative experiments with state-of-the-art detectors. Finally, generalization verification ensures the model’s robustness across different domains, as demonstrated through cross-domain testing on crop pest datasets.
2.1. Wood Surface Defect Image Acquisition Device
To achieve real-time online detection of wood surface defects, this study designed and constructed a machine vision-based hardware system for image acquisition, as shown in
Figure 3. The system primarily consists of a conveyor device, an image acquisition unit, a control unit, and an industrial computer, enabling efficient and stable image acquisition in actual production environments.
The image acquisition unit includes a high-resolution industrial camera (Hikvision Digital Technology Co., Ltd., Hangzhou, China) equipped with a C-mount lens (12 mm focal length), capable of capturing grayscale images with a resolution of 2048 × 1080 pixels. An infrared sensor detects the wood position and triggers image acquisition. The system uses an STM32 series microcontroller as the control core, processing sensor signals and calculating the optimal shooting timing based on conveyor belt speed feedback from an encoder, thereby controlling the camera for image capture.
Due to the large size of the wood planks, a single shot cannot cover the entire surface. The system adopts a “single camera multiple shots + image stitching” strategy. Through precise control of the shooting sequence, multiple sub-images with overlapping areas are acquired. The acquired sub-images first undergo distortion correction and illumination homogenization to eliminate barrel distortion caused by the wide-angle lens and uneven illumination. Subsequently, image stitching technology based on SURF (Speeded Up Robust Features) feature detection [
42] and FLANN (Fast Library for Approximate Nearest Neighbors) matching algorithm [
43] is used to synthesize multiple sub-images into a complete high-resolution wood image. The stitched image is primarily used to calculate the precise position of defects on the wood using a global coordinate system after defect detection, thus providing support for subsequent defect localization and repair.
The lighting system employs two linear LED fill lights and is equipped with a photosensitive sensor to monitor ambient light intensity in real-time. The STM32 microcontroller automatically controls the turning on and off of the fill lights based on feedback from the photosensitive sensor, ensuring uniformly illuminated wood surface images under different ambient light conditions and effectively avoiding issues like glare and shadows.
The industrial computer is equipped with an Intel i7 processor, 32 GB RAM, and an NVIDIA RTX 4090 graphics card, responsible for image stitching, defect detection, and data management. The system enables real-time image processing, meeting the detection efficiency requirements of industrial production lines. The system control flow is as follows: After startup, the camera is in a ready state. When the wood triggers the starting infrared sensor, the microcontroller precisely measures the running speed of the wood through two photogates installed at its front end. Based on the preset requirement of 20% image overlap, the microcontroller dynamically calculates the optimal shooting time interval. Subsequently, the microcontroller sends commands to the industrial computer via serial communication to trigger the first shot. Throughout the process of the wood continuously passing under the camera, the system continuously and automatically captures images at fixed time intervals and stores them on the local hard drive. This process ensures that for wood planks of any length, their surfaces are completely covered by a series of images with fixed overlap, laying the foundation for subsequent image stitching and defect detection.
2.2. Multi-Species Timber Defect Dataset
To thoroughly understand the practical conditions of wood pre-processing in timber enterprises, this study collected wood surface defect images from locations including Linyi (Shandong), Nanning (Guangxi), Kunming and Dehong (Yunnan). The collection encompassed various species such as
Pine radiata D. Don,
Eucalyptus globulus Labill.,
Toona sinensis M. Roem.,
Betula alnoides Buch-Ham. Ex D. Don, and
Cedar deodara G. Don, totaling 5520 images. With reference to the national standards “Solid Wood Flooring” (GB/T 15306-2018) and “Sawn Timber Inspection” (GB/T 4822-2023), eight defect types were selected as detection targets: Live Knot, Dead Knot, Knot with Crack, Crack, Resin, Marrow, Mineral Streak, and Knot Missing. The defect dataset annotation was completed, and research on defect classification and localization was conducted. Based on this, the PlankDef-9K multi-species wood surface defect dataset containing 9820 images was constructed, suitable for training and evaluating subsequent defect detection algorithms. The various wood defects are shown in
Figure 4.
To ensure the robustness and generalization capability of the wood defect detection model, the dataset was carefully partitioned. Considering the significant imbalance in the quantities of different wood defect categories within the dataset—for instance, the common defect “Live Knot” appears in over 70% of the dataset, while “Resin” appears in only about 10%—this could adversely affect the model’s learning, potentially causing an “under-learning” phenomenon and leading to poor recognition performance for minority classes. Therefore, this study employed image enhancement techniques to process the dataset, including various transformations such as illumination adjustment, color transformation, distortion, scaling, overlay, and smoothing. This processing not only effectively mitigated the “under-learning problem” caused by significant class quantity imbalances but also enabled the model to adequately learn defect features under various conditions, thereby improving its detection capability and generalization in real factory environments.
To balance training sufficiency and evaluation reliability, the PlankDef-9K dataset was divided into training, validation, and test sets in a 7:1:2 ratio. This ratio is commonly adopted for tasks with sample sizes below ten thousand, striking a balance between model learning and generalization assessment. Given the highly imbalanced original distribution of the 8 defect categories (Live Knot constitutes 70%, Resin less than 10%), a stratified sampling script was developed to ensure that the sample proportion of each defect category in each subset also closely follows the 7:1:2 ratio, thereby suppressing bias induced by class imbalance. The specific sample sizes after the aforementioned partitioning and augmentation are shown in
Table 2. Unless otherwise specified, subsequent experiments were conducted on the enhanced complete dataset.
2.3. EFCW-YOLO Network
YOLOv8 introduces the C2f module incorporating the ELAN concept based on YOLOv5, adopts an Anchor-Free decoupled head, and improves both localization and classification accuracy through dynamic label assignment and refined loss functions. It offers five model scales (n/s/m/l/x) to meet different computational requirements. This study selected the smallest and fastest YOLOv8n as the baseline and embedded subsequent improvements into its backbone-neck-head structure to achieve lightweight and efficient wood detection.
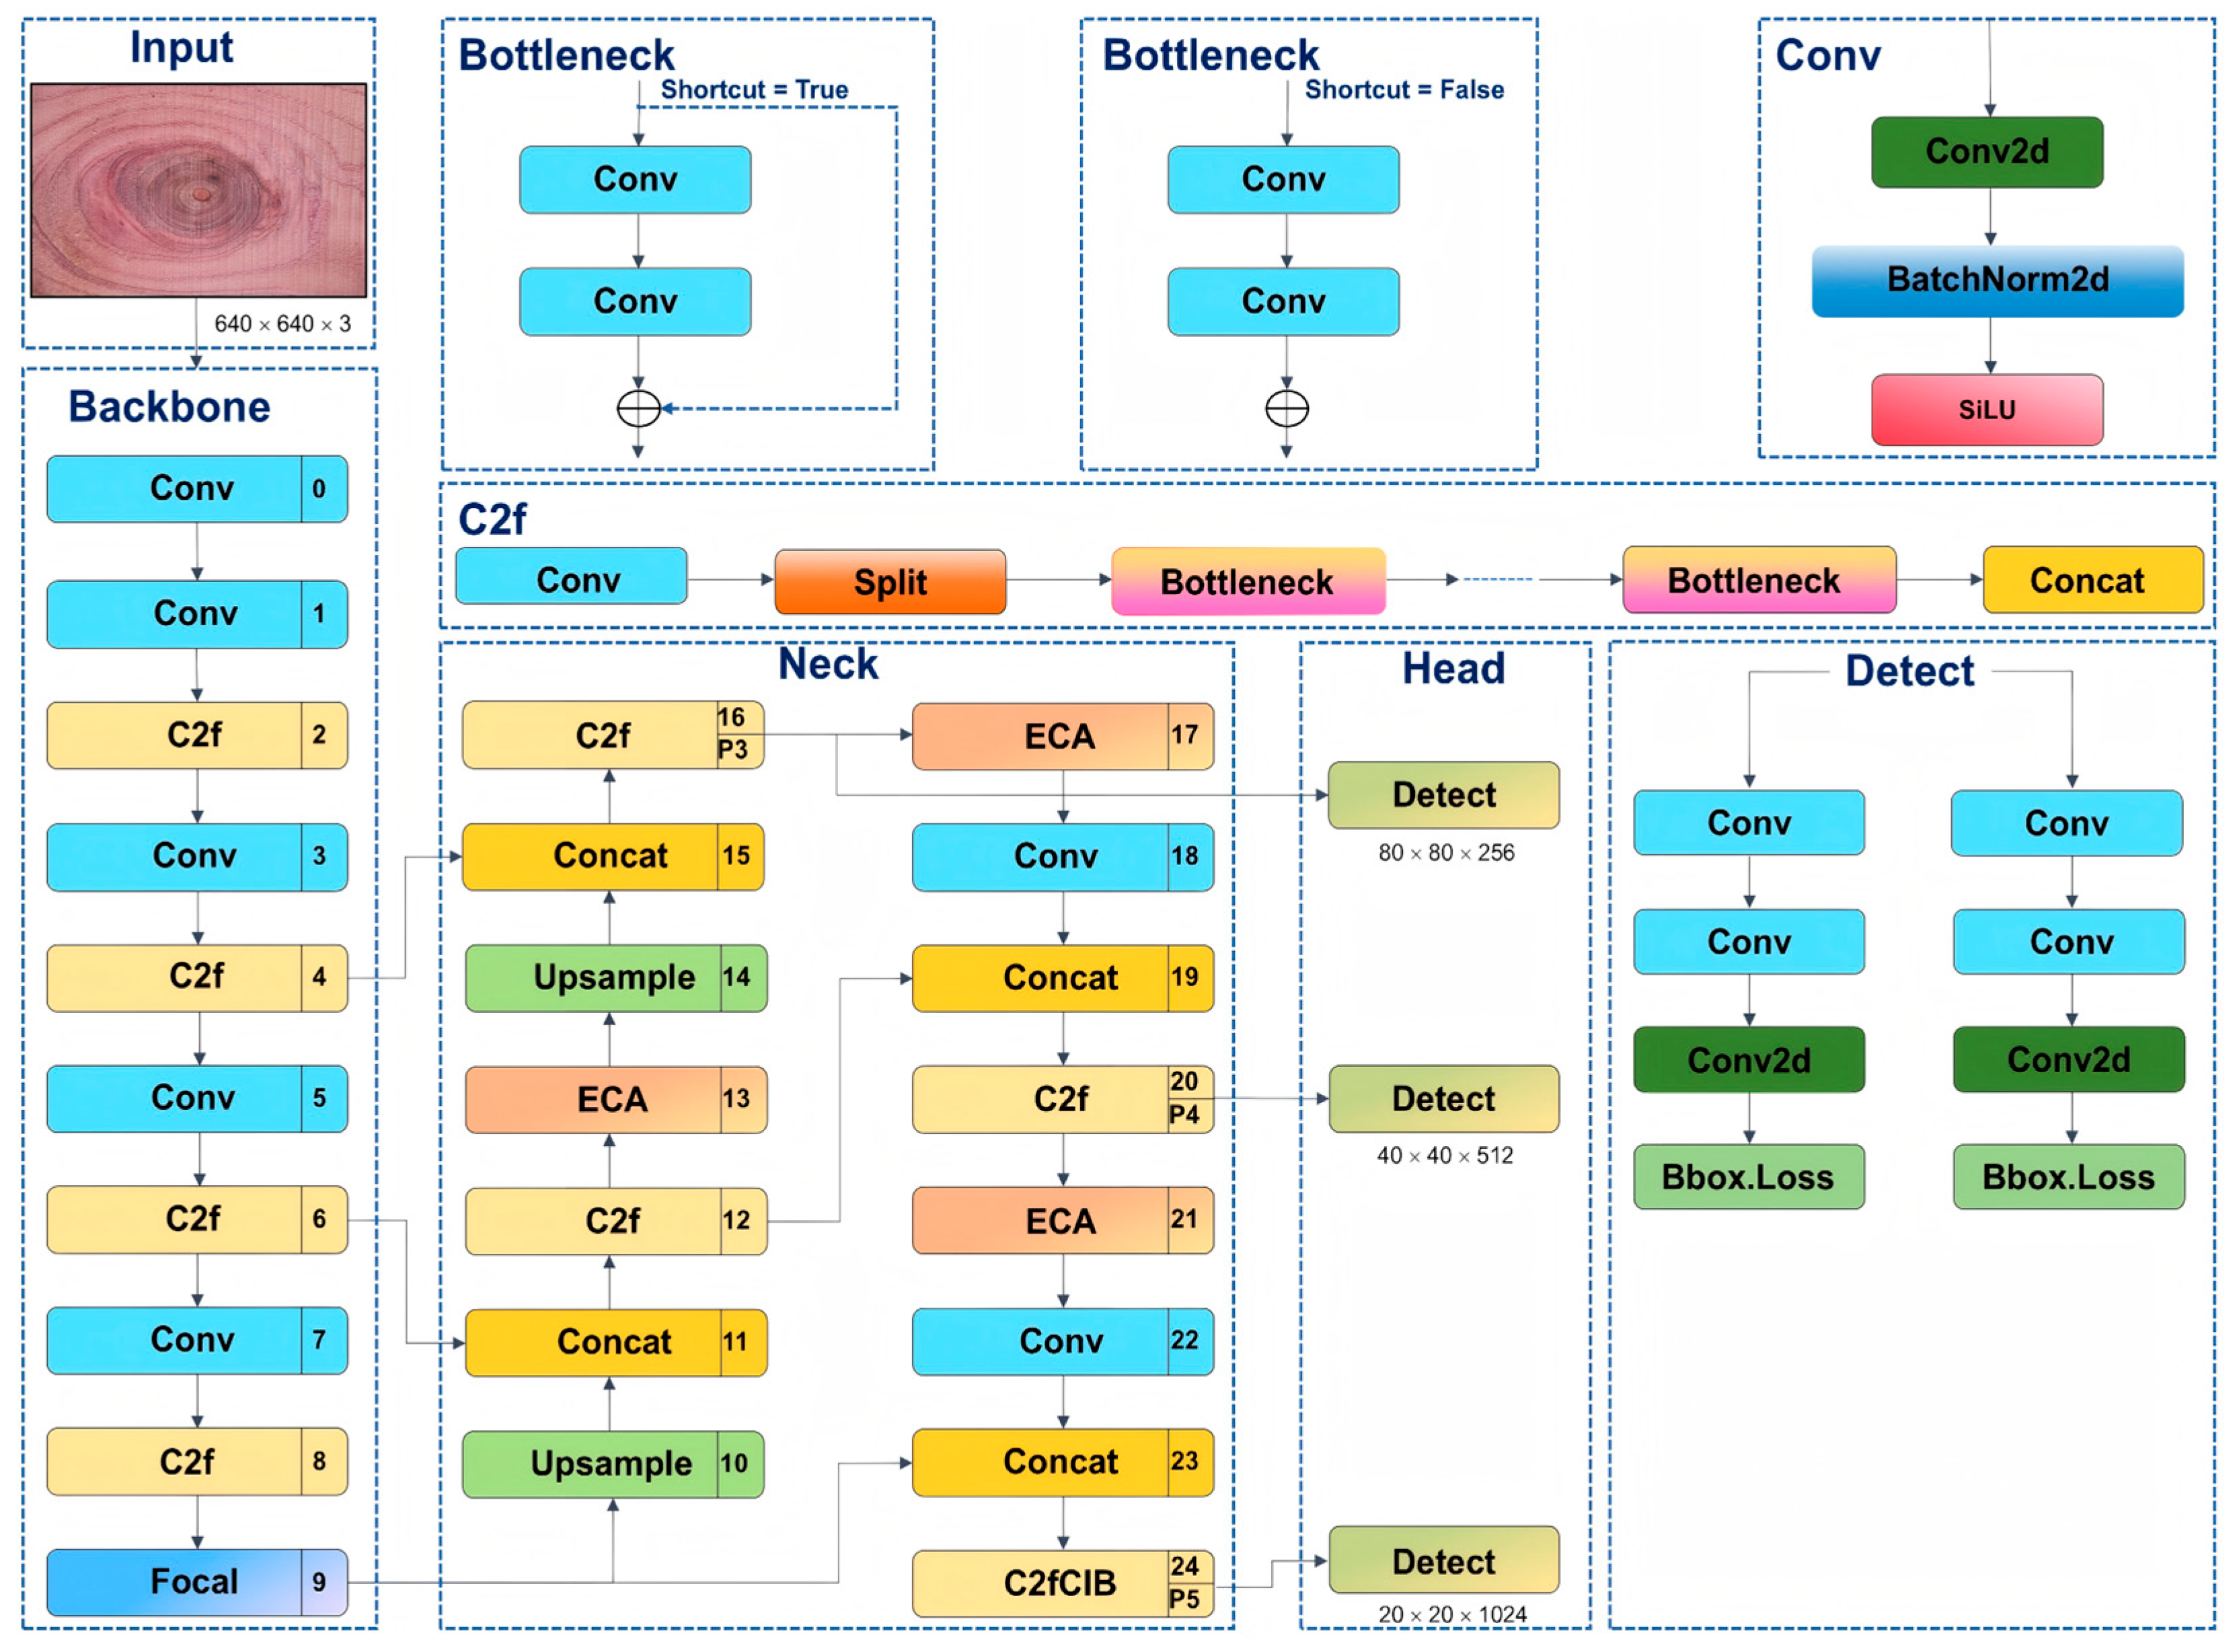
Aiming to address issues such as low accuracy and efficiency in existing wood defect detection, large parameter sizes of general algorithms, and insufficient generalization ability, this study proposes the EFCW-YOLO model based on YOLOv8n. First, the Focal Modulation Networks module is introduced into the backbone structure, replacing the original SPPF module. This improvement aims to enhance feature representation capability through focal modulation while reducing computational complexity. Next, the ECA attention mechanism is introduced into the model’s neck structure, significantly boosting network model performance with a minimal increase in parameters. Then, in the head structure, part of the original C2f modules is replaced with the C2fCIB module. This module improves feature representation capability and model detection efficiency through feature concatenation and an inverted bottleneck structure, while reducing computational load. Finally, Wise-IoU v3 is used to replace the original CIoU loss function, addressing issues caused by low-quality samples in wood defect detection and further enhancing the network’s overall performance and generalization ability. The network structure of the EFCW-YOLO model is shown in
Figure 5.
2.3.1. Focal Modulation for Enhanced Context Modeling
Spatial Pyramid Pooling (SPP) is a network layer designed to process images into fixed-size outputs, addressing the fixed-input-size constraint in Convolutional Neural Networks (CNNs). The Spatial Pyramid Pooling Fast (SPPF) module used in YOLOv8 is an accelerated version of SPP, developed to enhance processing speed and efficiency.
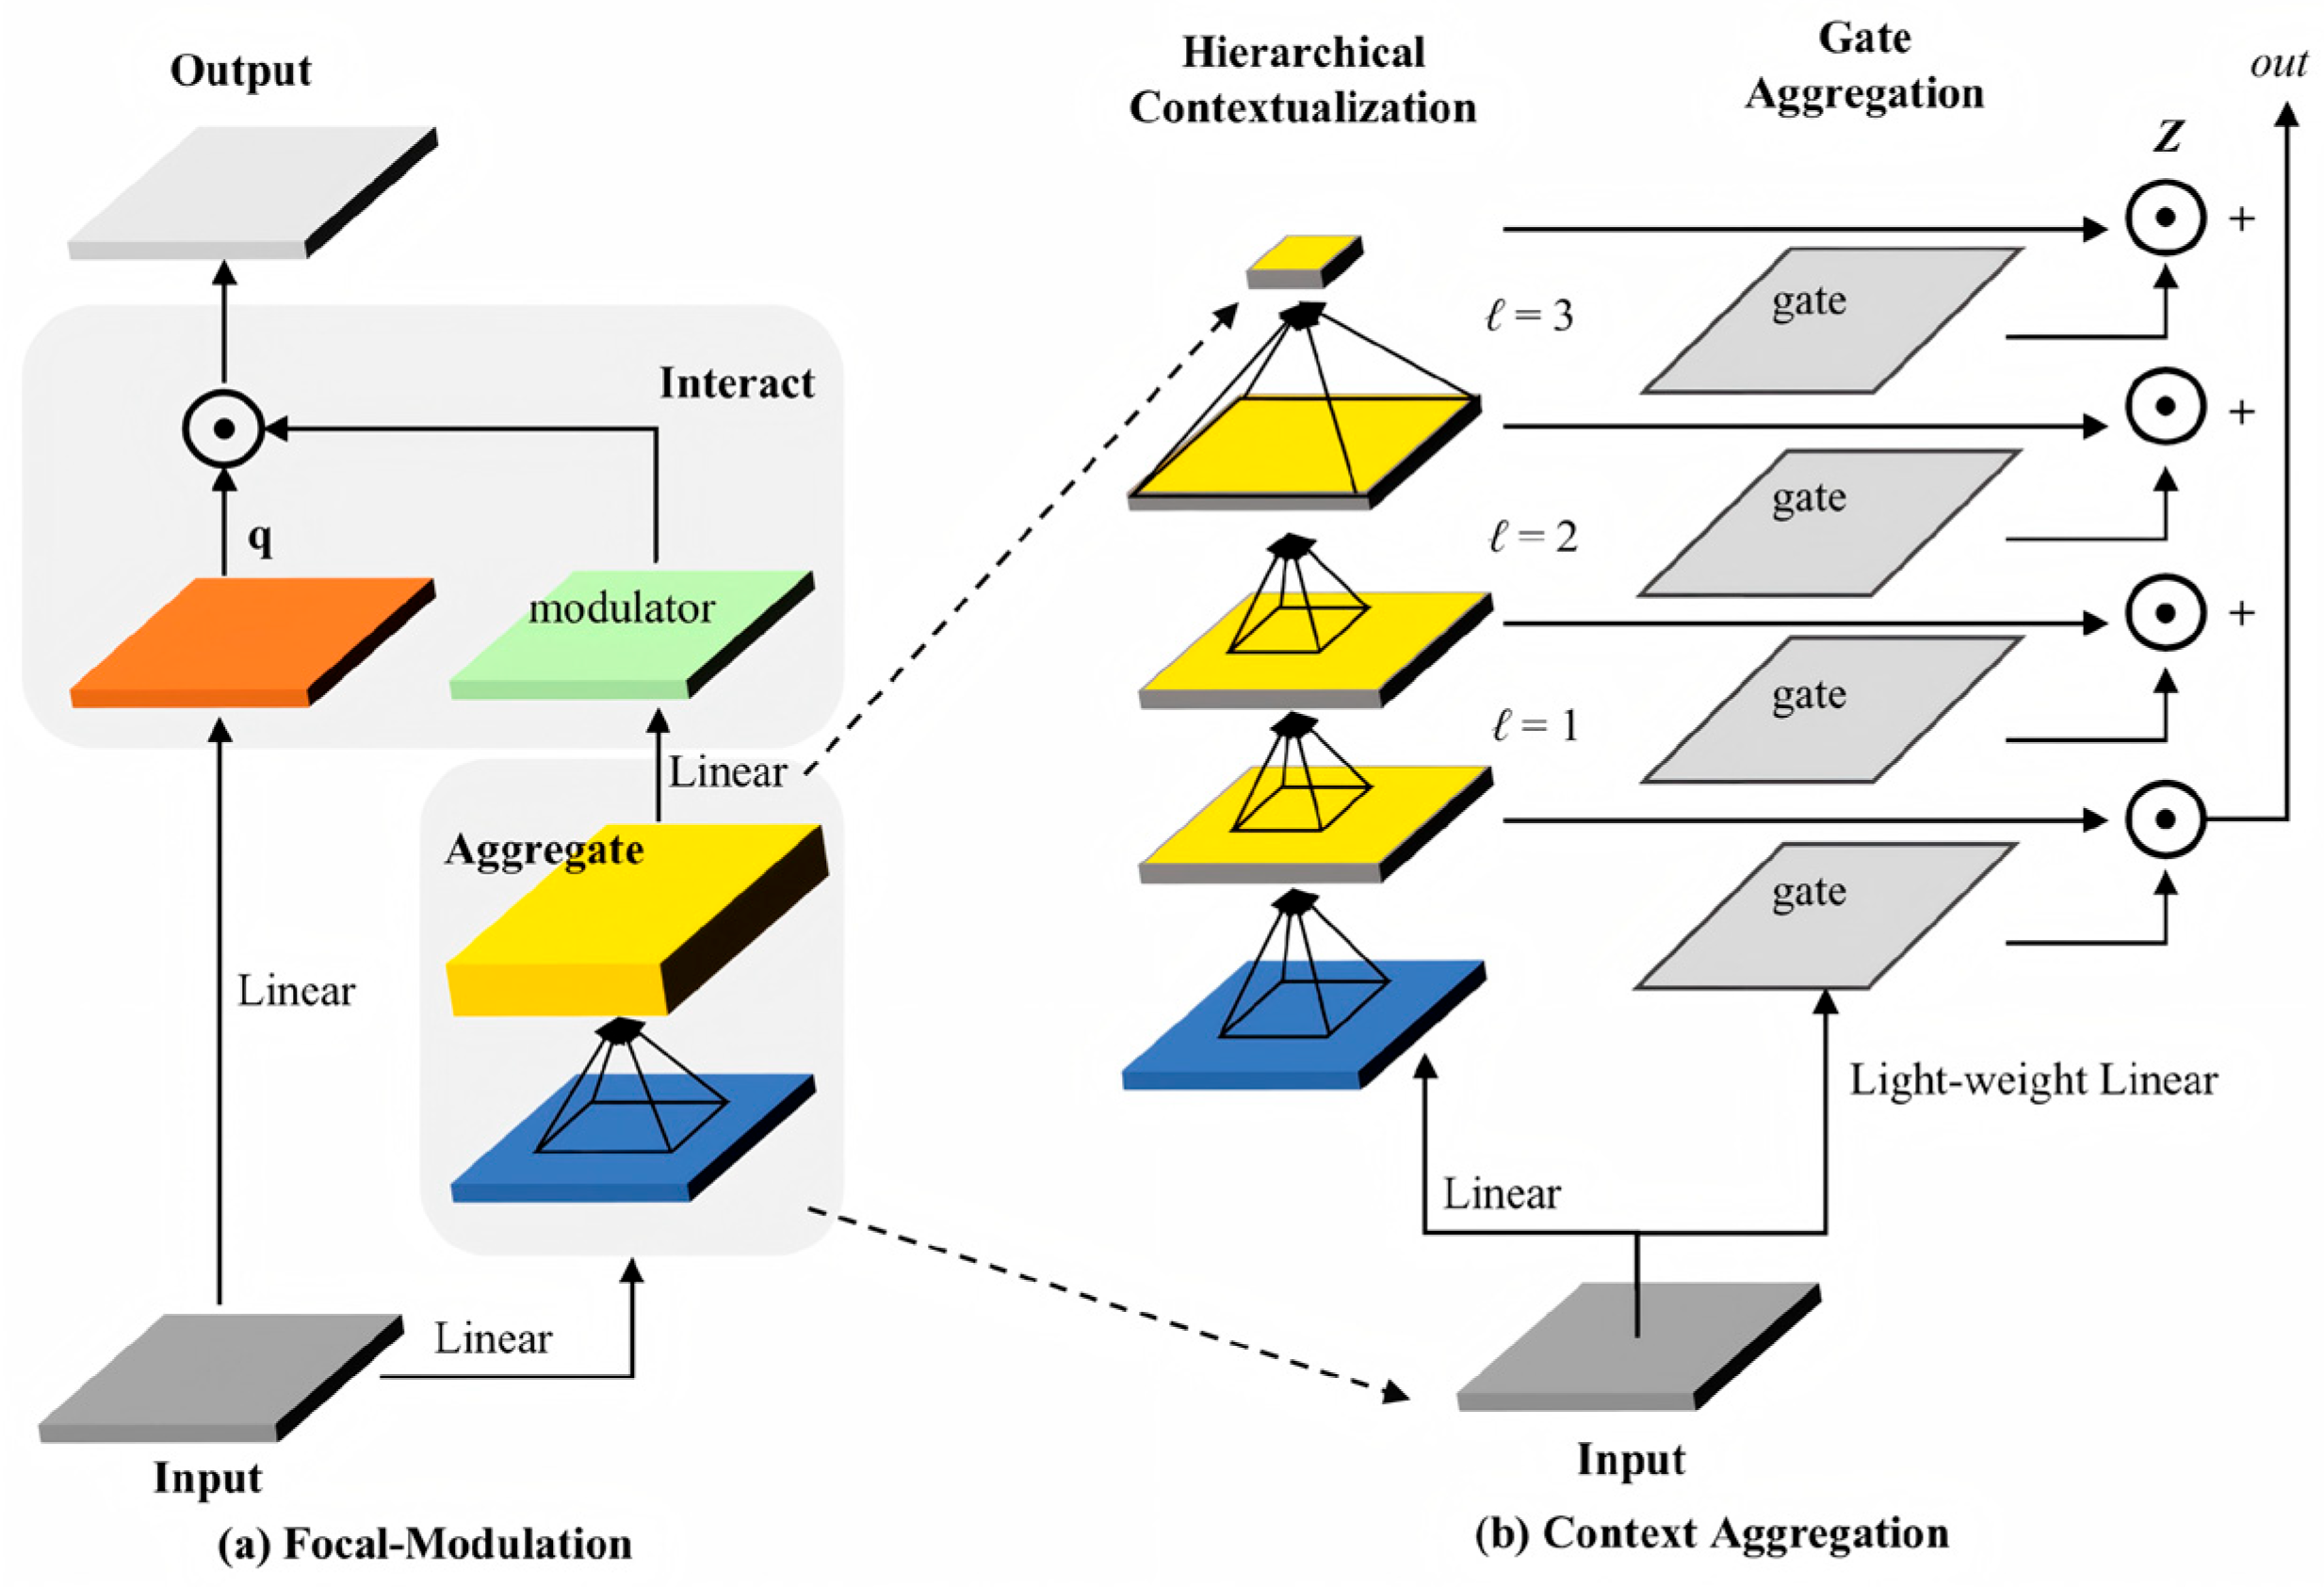
In wood defect identification, the natural wood textures and complex backgrounds often make it challenging to distinguish defect features from their surroundings. While SPPF expands the receptive field through multi-scale pooling, it lacks sufficient discriminative power for minute defects. To address this limitation, this study replaces the SPPF module in the backbone with the Focal Modulation Networks module (hereinafter referred to as FocalModulation). Structurally distinct from SPPF, the FocalModulation module not only adapts to input images of varying resolutions but also selectively aggregates contextual features through its unique gated aggregation and element-wise affine transformation components. It is particularly suited for detecting small objects or objects in complex backgrounds, with this enhancement adding minimal computational burden or parameter count.
The FocalModulation module comprises the following components: a 1 × 1 convolutional layer for processing input features; a GELU activation function; a linear layer that maps input features to a higher-dimensional space; a list of focal layers, each consisting of a convolutional layer and GELU activation function; a gating mechanism and element-wise affine transformation for aggregating, adjusting, and fusing multi-scale contextual information; another linear layer that projects features back to the original dimension to match the input requirements of subsequent network layers; and finally, a Dropout layer for regularization to reduce overfitting risk and enhance model generalization capability. The network structure of the Focal Modulation module is shown in
Figure 6 below.
2.3.2. Lightweight Channel Attention with ECA
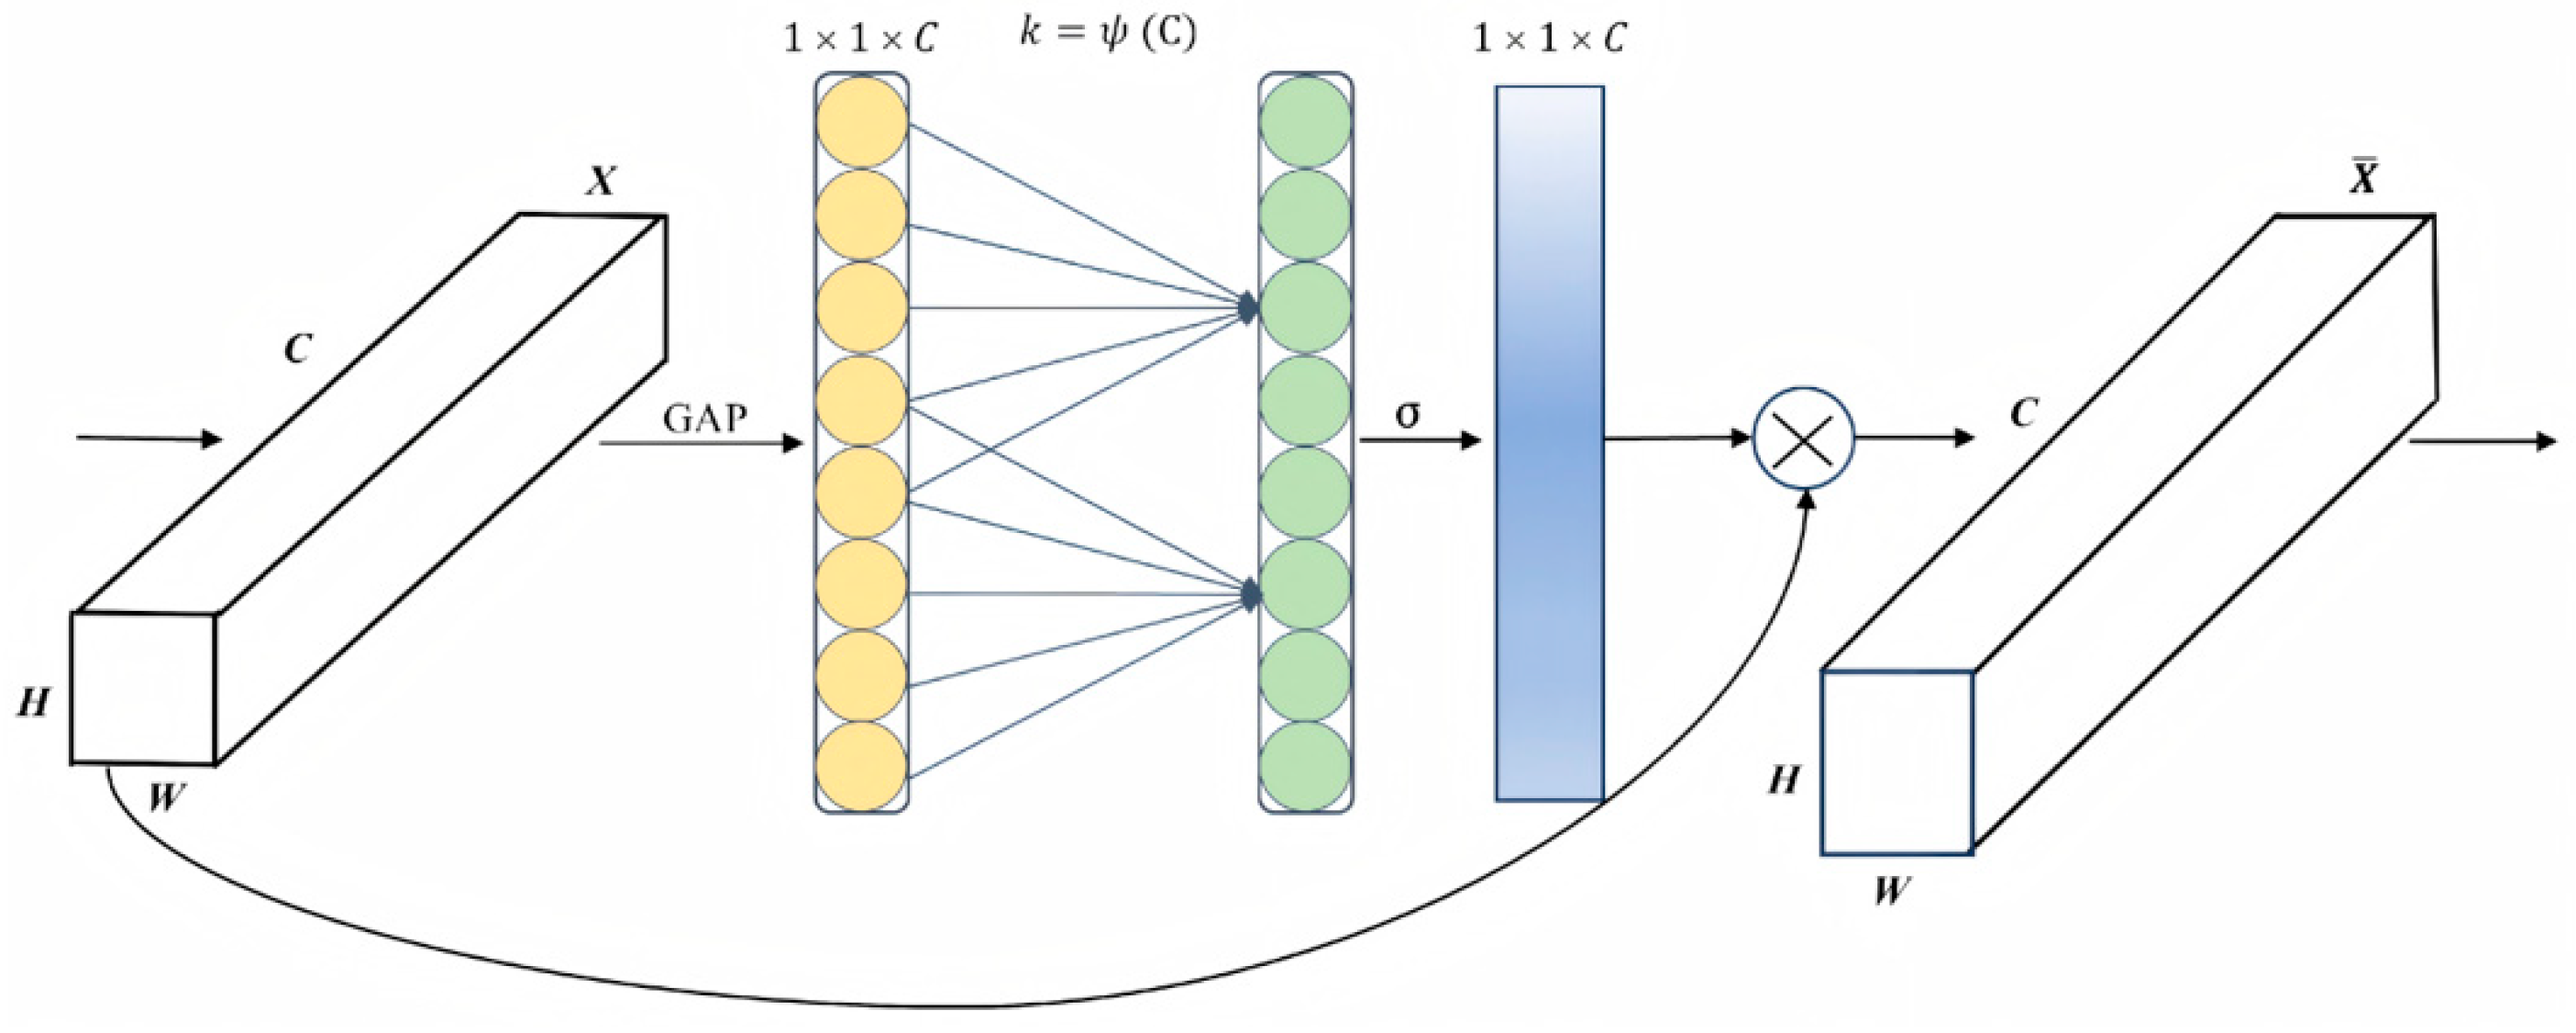
The Efficient Channel Attention (ECA) module, proposed by Wang et al. [
44], is a lightweight channel attention mechanism improved upon SENet. It significantly enhances network performance with almost no increase in parameters through local cross-channel interaction. This approach avoids the adverse effects of channel compression and dimensionality reduction in SENet while introducing methods for local cross-channel interaction and adaptive selection of 1D convolution kernel size. The structure of the ECA module is shown in
Figure 7, where
C represents the number of channels, and
H,
W represent the height and width of the data, respectively.
The principle is implemented through the following steps: First, Global Average Pooling (GAP) is applied to the input feature map, compressing it to 1 × 1 ×
C. Then, cross-channel information interaction is achieved via 1D fast convolution. The convolution kernel size
k is adaptively determined through a function, with the adaptive function defined as:
where γ and
b are adjustment parameters.
Finally, after determining the kernel size
k, the ECA module applies 1D convolution to the input features, transforming input ‘in’ to output ‘out’, thereby learning the importance of each channel relative to others. This process can be expressed by the following formula:
In the EFCW-YOLO model, three ECA attention modules are added and combined with the three C2f modules connected to the Detect head in the neck. The C2f modules are responsible for feature fusion and transmission. Adding ECA modules after these three modules enables the model to focus more on important feature channels, thereby enhancing the quality of feature representation.
2.3.3. Efficient Detection Head with C2fCIB
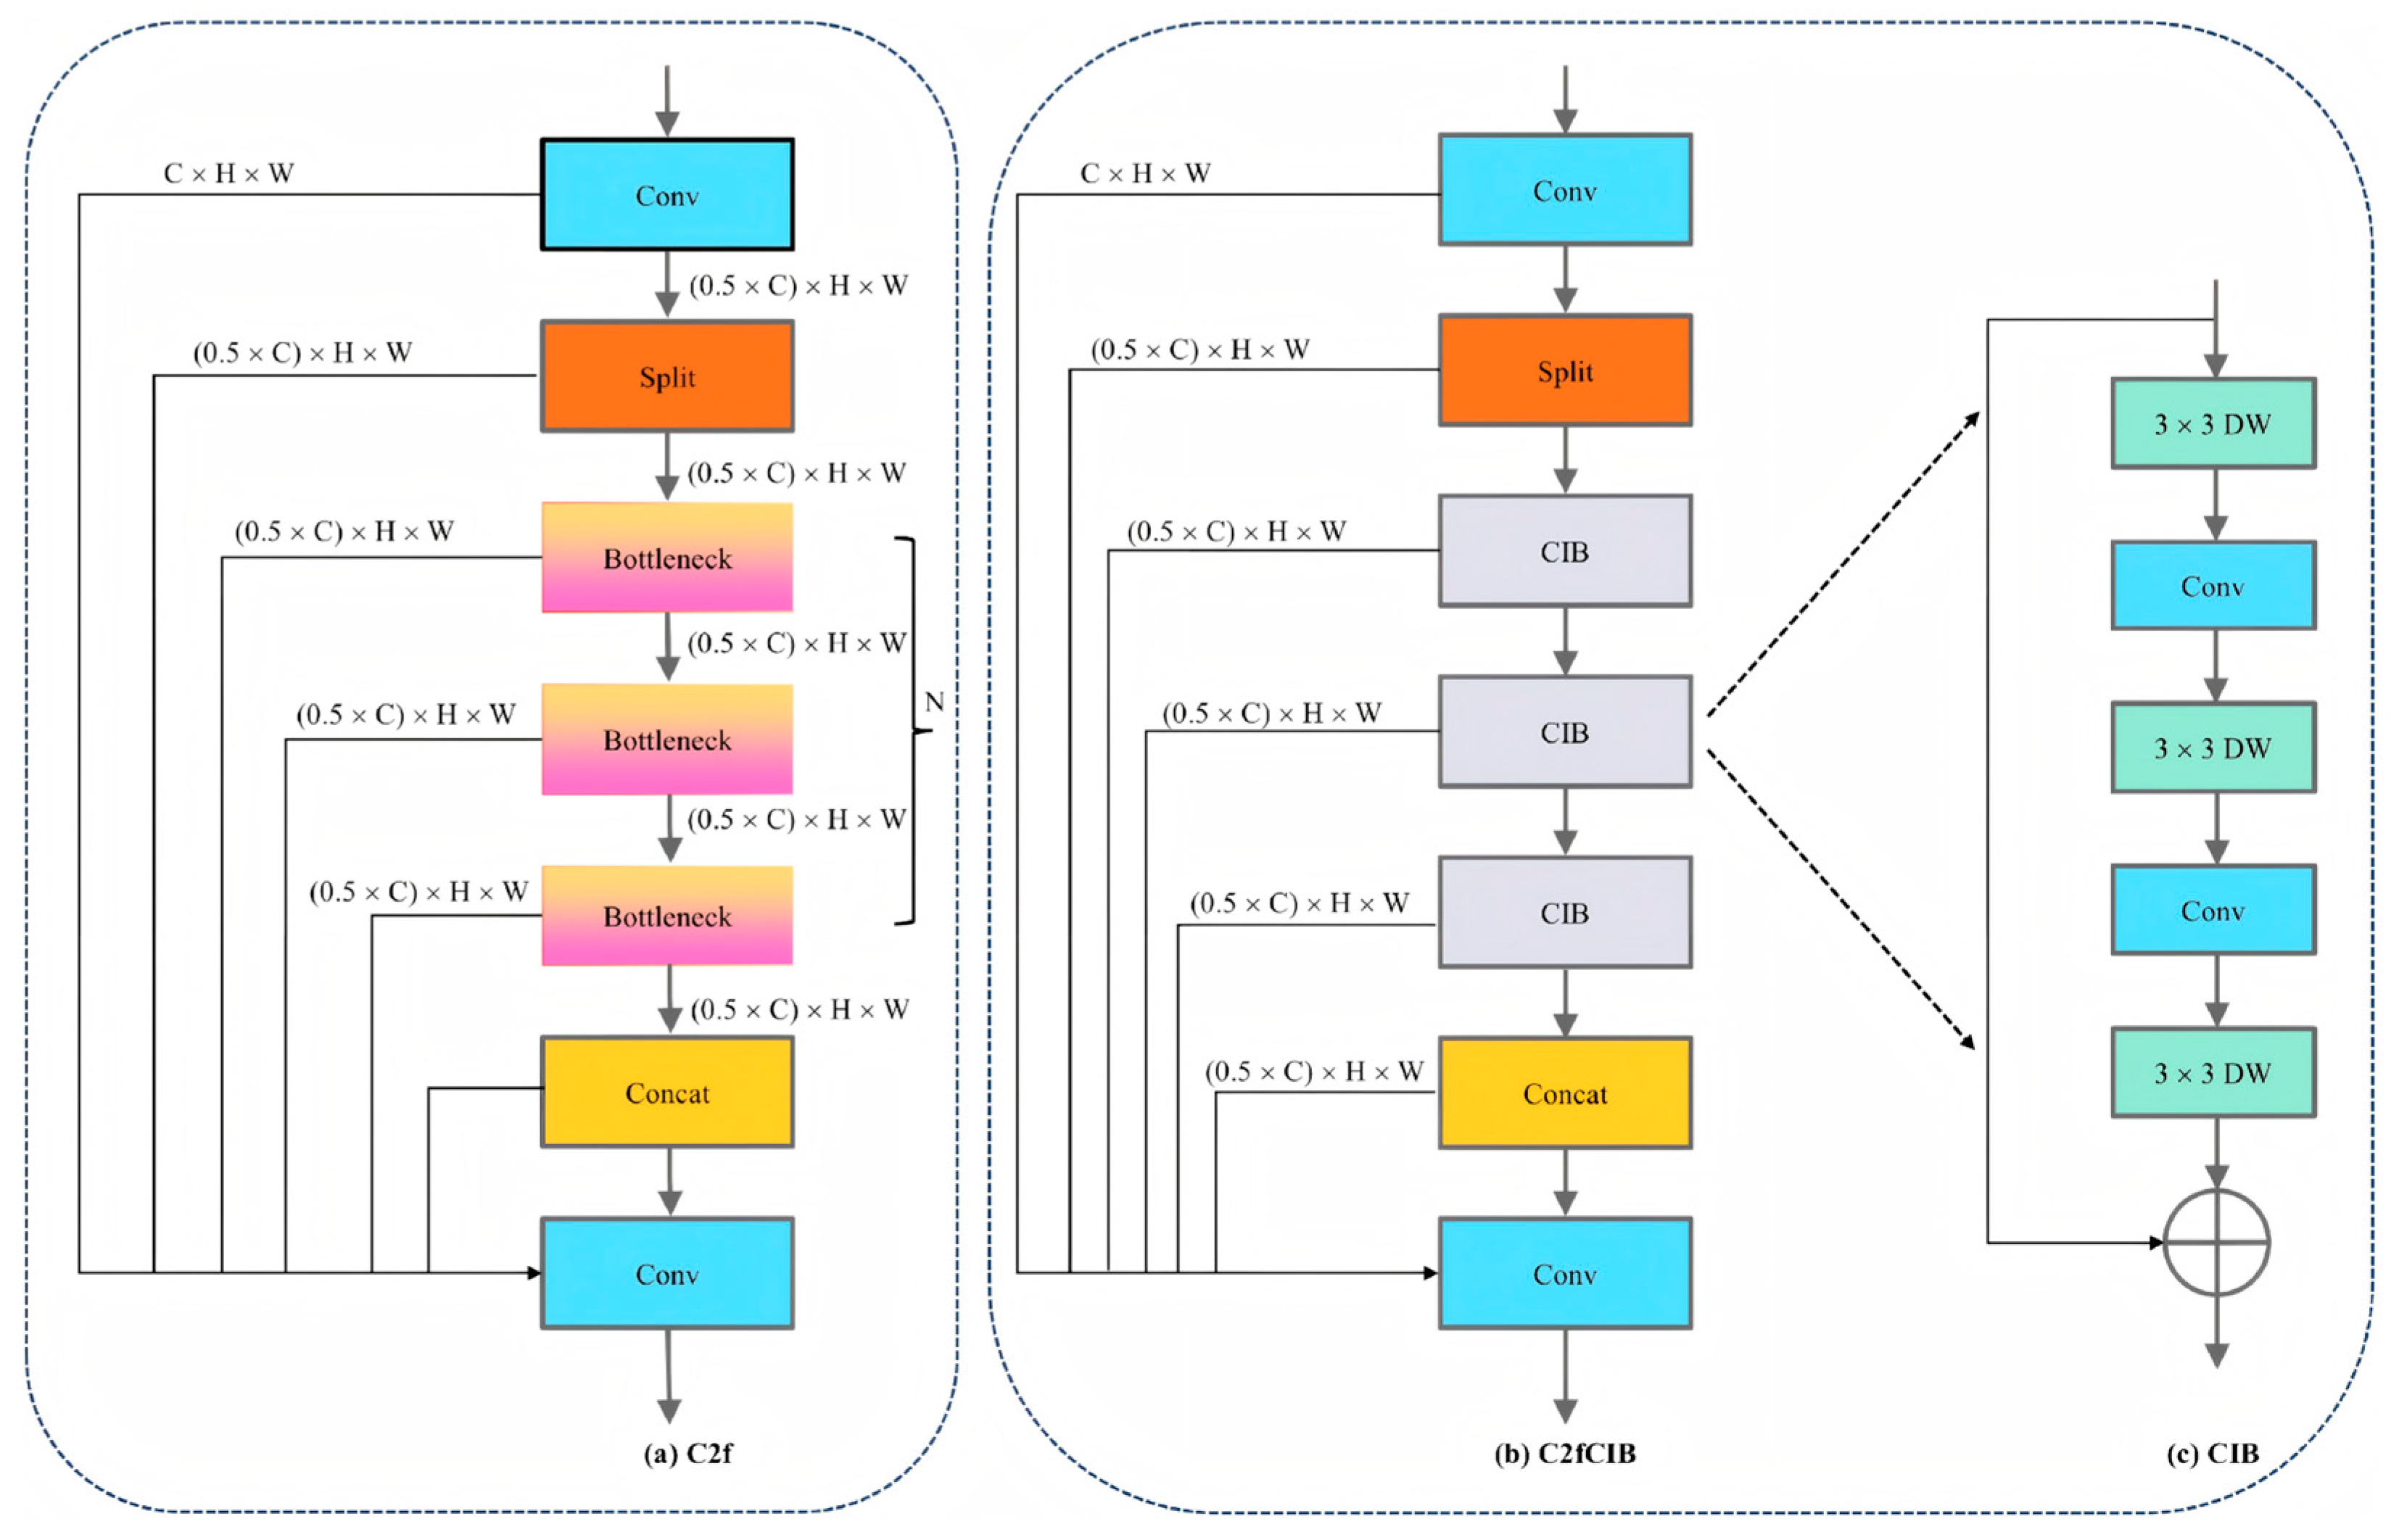
This model replaces one C2f (CSP Bottleneck with 2 Convolutions) in the head section with C2fCIB. The C2fCIB module combines the advantages of C2f and CIB, using the CIB module to replace the Bottleneck in C2f. CIB employs depthwise separable convolution and pointwise convolution instead of standard convolution, reducing computational load while maintaining feature representation capability. Thus, C2fCIB, incorporating the CIB module, preserves feature extraction and fusion capabilities while reducing computational load and model redundancy through structural optimization, improving model efficiency and feature expression. The network architecture comparison between the C2fCIB module and the C2f module is shown in
Figure 8.
2.3.4. Robust Localization via Wise-IoU v3
As a crucial component of the object detection loss function, the bounding box regression loss effectively evaluates model quality by assessing anchor box performance. Wise-IoU [
45] is an improved bounding box loss function that reduces computational cost by avoiding aspect ratio calculations compared to the CIoU loss function used in YOLOv8.
Wise-IoU has three versions: v1, v2, and v3. Wise-IoU v1 minimizes intervention when anchor and target boxes align well and constructs a two-layer attention mechanism for bounding box loss through a distance attention mechanism combined with aspect ratio similarity. The formula for Wise-IoU v1 is as follows, where parameter
β measures the prediction box’s deviation degree, while
α and
δ are hyperparameters. Coordinates
represent the prediction box’s position, and
represent the ground truth box’s position. Additionally,
H and
W denote the prediction box’s height and width, while
and
denote the ground truth box’s height and width, respectively:
Wise-IoU v2 introduces a monotonic focusing mechanism on the basis of v1. This mechanism causes the gradient gain to increase monotonically with the loss value, similar to the design of Focal loss. The formula for Wise-IoU v2 is as follows, where
is the average of the bounding box loss function, and
is the normalization factor:
In contrast, the optimized loss function used in this model, Wise-IoU v3, adopts a dynamic non-monotonic focusing mechanism compared to v2. Mislabeled samples in the dataset manifest as outliers. In the dynamic non-monotonic focusing mechanism, the “outlier degree” describes anchor box quality—a smaller outlier degree indicates higher anchor box quality, assigning smaller gradient gain; conversely, anchor boxes with large outlier degrees are assigned larger gradient gains. Thus, the gradient gain changes non-monotonically with increasing loss value, allowing the model to more flexibly adjust attention to different samples and improve robustness. The formula is as follows, where
β is the dynamic non-monotonic focusing coefficient, representing the prediction box’s anomaly degree, and
δ is a hyperparameter.
3. Results
3.1. Experimental Environment
To ensure stability and reproducibility throughout model training and testing, experiments were conducted on a unified hardware and software platform. The experimental environment configuration is detailed in
Table 3.
The experimental hyperparameters and their configurations are listed in
Table 4.
3.2. Performance Evaluation
To comprehensively assess the performance of the proposed EFCW-YOLO model in timber surface defect detection, three core evaluation metrics commonly used in object defect detection were selected: Precision (
P), Recall (
R), F1 Score (
F1), Accuracy (
Acc) and Mean Average Precision (
mAP). The specific definitions and calculation formulas for these metrics are as follows:
In the above formula,
TP (True Positive) denotes the number of correctly detected defects,
FP (False Positive) denotes the number of incorrectly detected defects, and
FN (False Negative) denotes the number of undetected defects.
In the accuracy formula,
TN (True Negative) represents the number of correctly identified negative samples, i.e., the non-defect regions that are accurately recognized as background. Accuracy provides a comprehensive measure of the model’s overall classification performance by considering both correct positive and negative detections.
The F1 Score is a core metric for evaluating the performance of binary classification models in machine learning. Its significance mainly lies in balancing precision and recall rate, providing a comprehensive and robust performance measurement for the model. Accuracy serves as an intuitive overall performance indicator, reflecting the proportion of all correct predictions (both positive and negative) among the total samples. mAP serves as a metric for evaluating a model’s performance across multiple categories, representing the most representative evaluation metric in object detection tasks. Specifically, mAP50 denotes the mean average precision at an IoU threshold of 50, while mAP50-95 represents the mean average precision across the IoU range from 50 to 95 (with increments of 5), reflecting the model’s robustness under varying positioning accuracy requirements. In the aforementioned formula, N denotes the total number of classes; APi represents the average precision for the i-th class; Pi(k) indicates the precision of the i-th class at the k-th threshold; signifies the change in recall for the i-th class at the k-th threshold. All metrics are computed on the test set to ensure objective and valid evaluation results.
3.3. Comparative Experiment of Different Attention Mechanisms
To investigate the specific impact of various attention mechanism modules on timber defect recognition and identify suitable mechanisms for integration into the improved model, this study incorporates four frequently used attention mechanisms—EMA (Exponential Moving Average Attention), SEA (Squeeze-and-Excitation Attention), CA (Channel Attention), and ECA (Efficient Channel Attention)—at identical structural positions within the YOLOv8n baseline model. Under identical training parameters and datasets, the training and testing results for different attention mechanisms are presented in
Table 5.
Comparative analysis under identical training parameters and datasets yielded the following results: Regarding precision, all four attention mechanisms demonstrated improvements over the baseline model, with gains ranging from 12.14% to 17.74%. Among these, CA, ECA, and EMA outperformed SEA. Regarding recall, while all mechanisms demonstrated improvements, performance varied significantly between them. ECA and CA exhibited outstanding recall gains of 11.78% and 11.69%, respectively, whereas SEA and EMA showed merely moderate improvements. For the mAP50 metric, ECA and CA demonstrated the best performance. Regarding the stricter mAP50-95 metric, ECA achieved the highest value, while CA and EMA attained identical and competitive results. They demonstrated robust performance across varying IoU thresholds, enhancing the model’s robustness. In terms of Parameters, GFLOPs, and Model Size, SEA exhibited the most significant increase, indicating that its computational burden has grown, which is not conducive to further improvement while ensuring the lightweight of YOLOv8.
Comprehensive evaluation reveals that ECA and CA deliver notably effective optimizations within this research domain. They enhance model performance while preserving low parameter counts and computational demands, demonstrating favorable performance-to-resource-consumption ratios. Comparing ECA and CA characteristics reveals that the CA mechanism simultaneously considers attention across both channel and spatial dimensions. This functionally overlaps with another improvement—the integration of channel and spatial features in C2fCIB. Furthermore, CA increases computational load, which conflicts with the subsequent Wise-IoU optimization objective of ‘reducing unnecessary computations’ given the extensive structural modifications involved in this study. ECA, by design, prioritizes computational efficiency and offers advantages in information retention, adaptability, and synergistic integration with other enhancement modules. To further validate this,
Table 6 presents results from training CA and ECA separately with other enhancements (namely Focal Modulation, C2fCIB, and Wise-IoU):
The results align with the preceding analysis, confirming that ECA performs better when paired with other enhancements. Consequently, following a series of comparative experiments, this study adopts ECA as the attention mechanism module.
3.4. Ablation Experiments
This study used YOLOv8n as the baseline model and designed the EFCW-YOLO model by implementing improvements across four aspects. To validate the effectiveness of each improvement, ten ablation experiments were conducted on the data-augmented dataset. Here, E represents ECA; F represents Focal Modulation; C represents C2fCIB; W represents Wise-IoU v3. The experimental results are shown in
Table 7, where the bold row indicates the final EFCW-YOLO model.
In the ablation experiments, each module was first added individually to assess its impact on model performance. After integrating the ECA module, the parameter count increased by only 12, while detection accuracy improved significantly: precision increased from 70.16% to 87.90%, recall from 71.62% to 83.40%, mAP50 from 73.63% to 89.30%, and mAP50-95 from 62.48% to 80.50%. Introducing the Focal Modulation Networks module increased precision to 88.11%, recall to 82.60%, mAP50 to 89.54%, and mAP50-95 to 80.80%. The C2fCIB module enhanced model performance while reducing parameters, achieving a precision of 84.10%, recall of 79.10%, mAP50 of 85.80%, and mAP50-95 of 76.40%. The Wise-IoU module further improved precision to 88.92%, recall to 84.80%, mAP50 to 89.93%, and mAP50-95 to 81.15%. Individual integration of ECA, Focal, C2fCIB, and Wise-IoU modules all substantially enhanced YOLOv8n performance, with ECA and Focal showing the most notable improvements, indicating their crucial role in feature representation and capture capabilities.
Next, two modules were added simultaneously. With ECA integrated in the neck structure, adding Focal Modulation Networks yielded precision of 88.21%, recall of 83.47%, mAP50 of 89.63%, and mAP50-95 of 81.32%. Adding C2fCIB achieved precision of 89.40%, recall of 82.80%, mAP50 of 89.60%, and mAP50-95 of 79.90%. Adding Wise-IoU resulted in a precision of 89.15%, recall of 84.14%, mAP50 of 89.80%, and mAP50-95 of 80.03%. These experiments demonstrate that combining Focal, C2fCIB, or Wise-IoU with ECA further improves performance, showing synergistic effects particularly in enhancing detection accuracy and reducing computation.
Three modules were then added concurrently. Integrating ECA, Focal Modulation Networks, and C2fCIB achieved precision of 88.10%, recall of 83.40%, mAP50 of 89.40%, and mAP50-95 of 81.00%. Combining ECA, Focal Modulation Networks, and Wise-IoU reached a precision of 91.20%, recall of 80.81%, mAP50 of 89.4%, and mAP50-95 of 79.82%. These combinations consistently enhanced model performance, demonstrating strong synergies in detection accuracy.
The optimal EFCW-YOLO model was obtained by integrating all four modules into YOLOv8n. It achieved a precision of 89.24%, recall of 84.90%, mAP50 of 90.26%, and mAP50-95 of 81.50%, with a model size of 6.12 MB, 3,070,781 parameters, and 8.2 GFLOPs. This indicates high performance with good computational efficiency and complexity control. The ablation results validate the model’s balanced design across accuracy, speed, and lightweight structure.
3.5. Comparative Experiments of Different Models
To validate the superiority of the proposed algorithm, comparative experiments were conducted under identical configurations, parameters, and dataset conditions (using the data-augmented dataset) between the proposed model and five other models: YOLOv7-tiny, YOLOv8n, YOLOv10n, YOLOv11n, and Faster-RCNN. The experimental results are presented in
Table 8.
The results in
Table 8 demonstrate, the proposed EFCW-YOLO model demonstrates outstanding performance in detecting eight types of wood defects. The model achieves precision, recall, F1 score, accuracy, mAP50, and mAP50-95 values of 89.24%, 84.90%, 87.01%, 88.85%, 90.26%, and 81.50%, respectively. Compared to other models in the YOLO series (v7-tiny, v8n, v10n, v11n), the precision is improved by 2.34%, 3.14%, 1.64%, and 1.54%, respectively. Recall rates are improved by 4.85%, 4.50%, 3.50%, and 3.50%, respectively. The F1 score surpasses these models by 3.65% (YOLOv7-tiny), 3.85% (YOLOv8n), 2.61% (YOLOv10n), and 2.56% (YOLOv11n), confirming its superior overall detection effectiveness. In terms of accuracy, EFCW-YOLO achieves 88.85%, representing improvements of 4.43%, 4.55%, 3.50%, and 3.44% over YOLOv7-tiny, YOLOv8n, YOLOv10n, and YOLOv11n, respectively. The mAP50 values show increases of 5.53%, 2.86%, 2.56%, and 1.46%, respectively. Meanwhile, mAP50-95 values are enhanced by 8.71%, 4.20%, 1.00%, and 1.90%, respectively. Compared to the two-stage object detection algorithm Faster-RCNN, the P, R, F1 score, mAP50, and mAP50-95 metrics are improved by 33.68%, 3.32%, 20.94%, 20.55%, and 19.00%, respectively, with the accuracy improvement being particularly notable at 37.09%.
Regarding GFLOPs and model size, EFCW-YOLO’s GFLOPs are essentially equivalent to YOLOv8n and YOLOv11n, represent a 38.6% reduction compared to YOLOv7-tiny, and a 30.2% increase compared to YOLOv11n. In terms of model size, EFCW-YOLO is 14.0% larger than YOLOv8n, 11.1% larger than YOLOv10n, and 11.3% larger than YOLOv11n. Despite these increases, EFCW-YOLO maintains high accuracy while significantly reducing computational complexity and model size compared to several counterparts, demonstrating strong potential for industrial deployment.
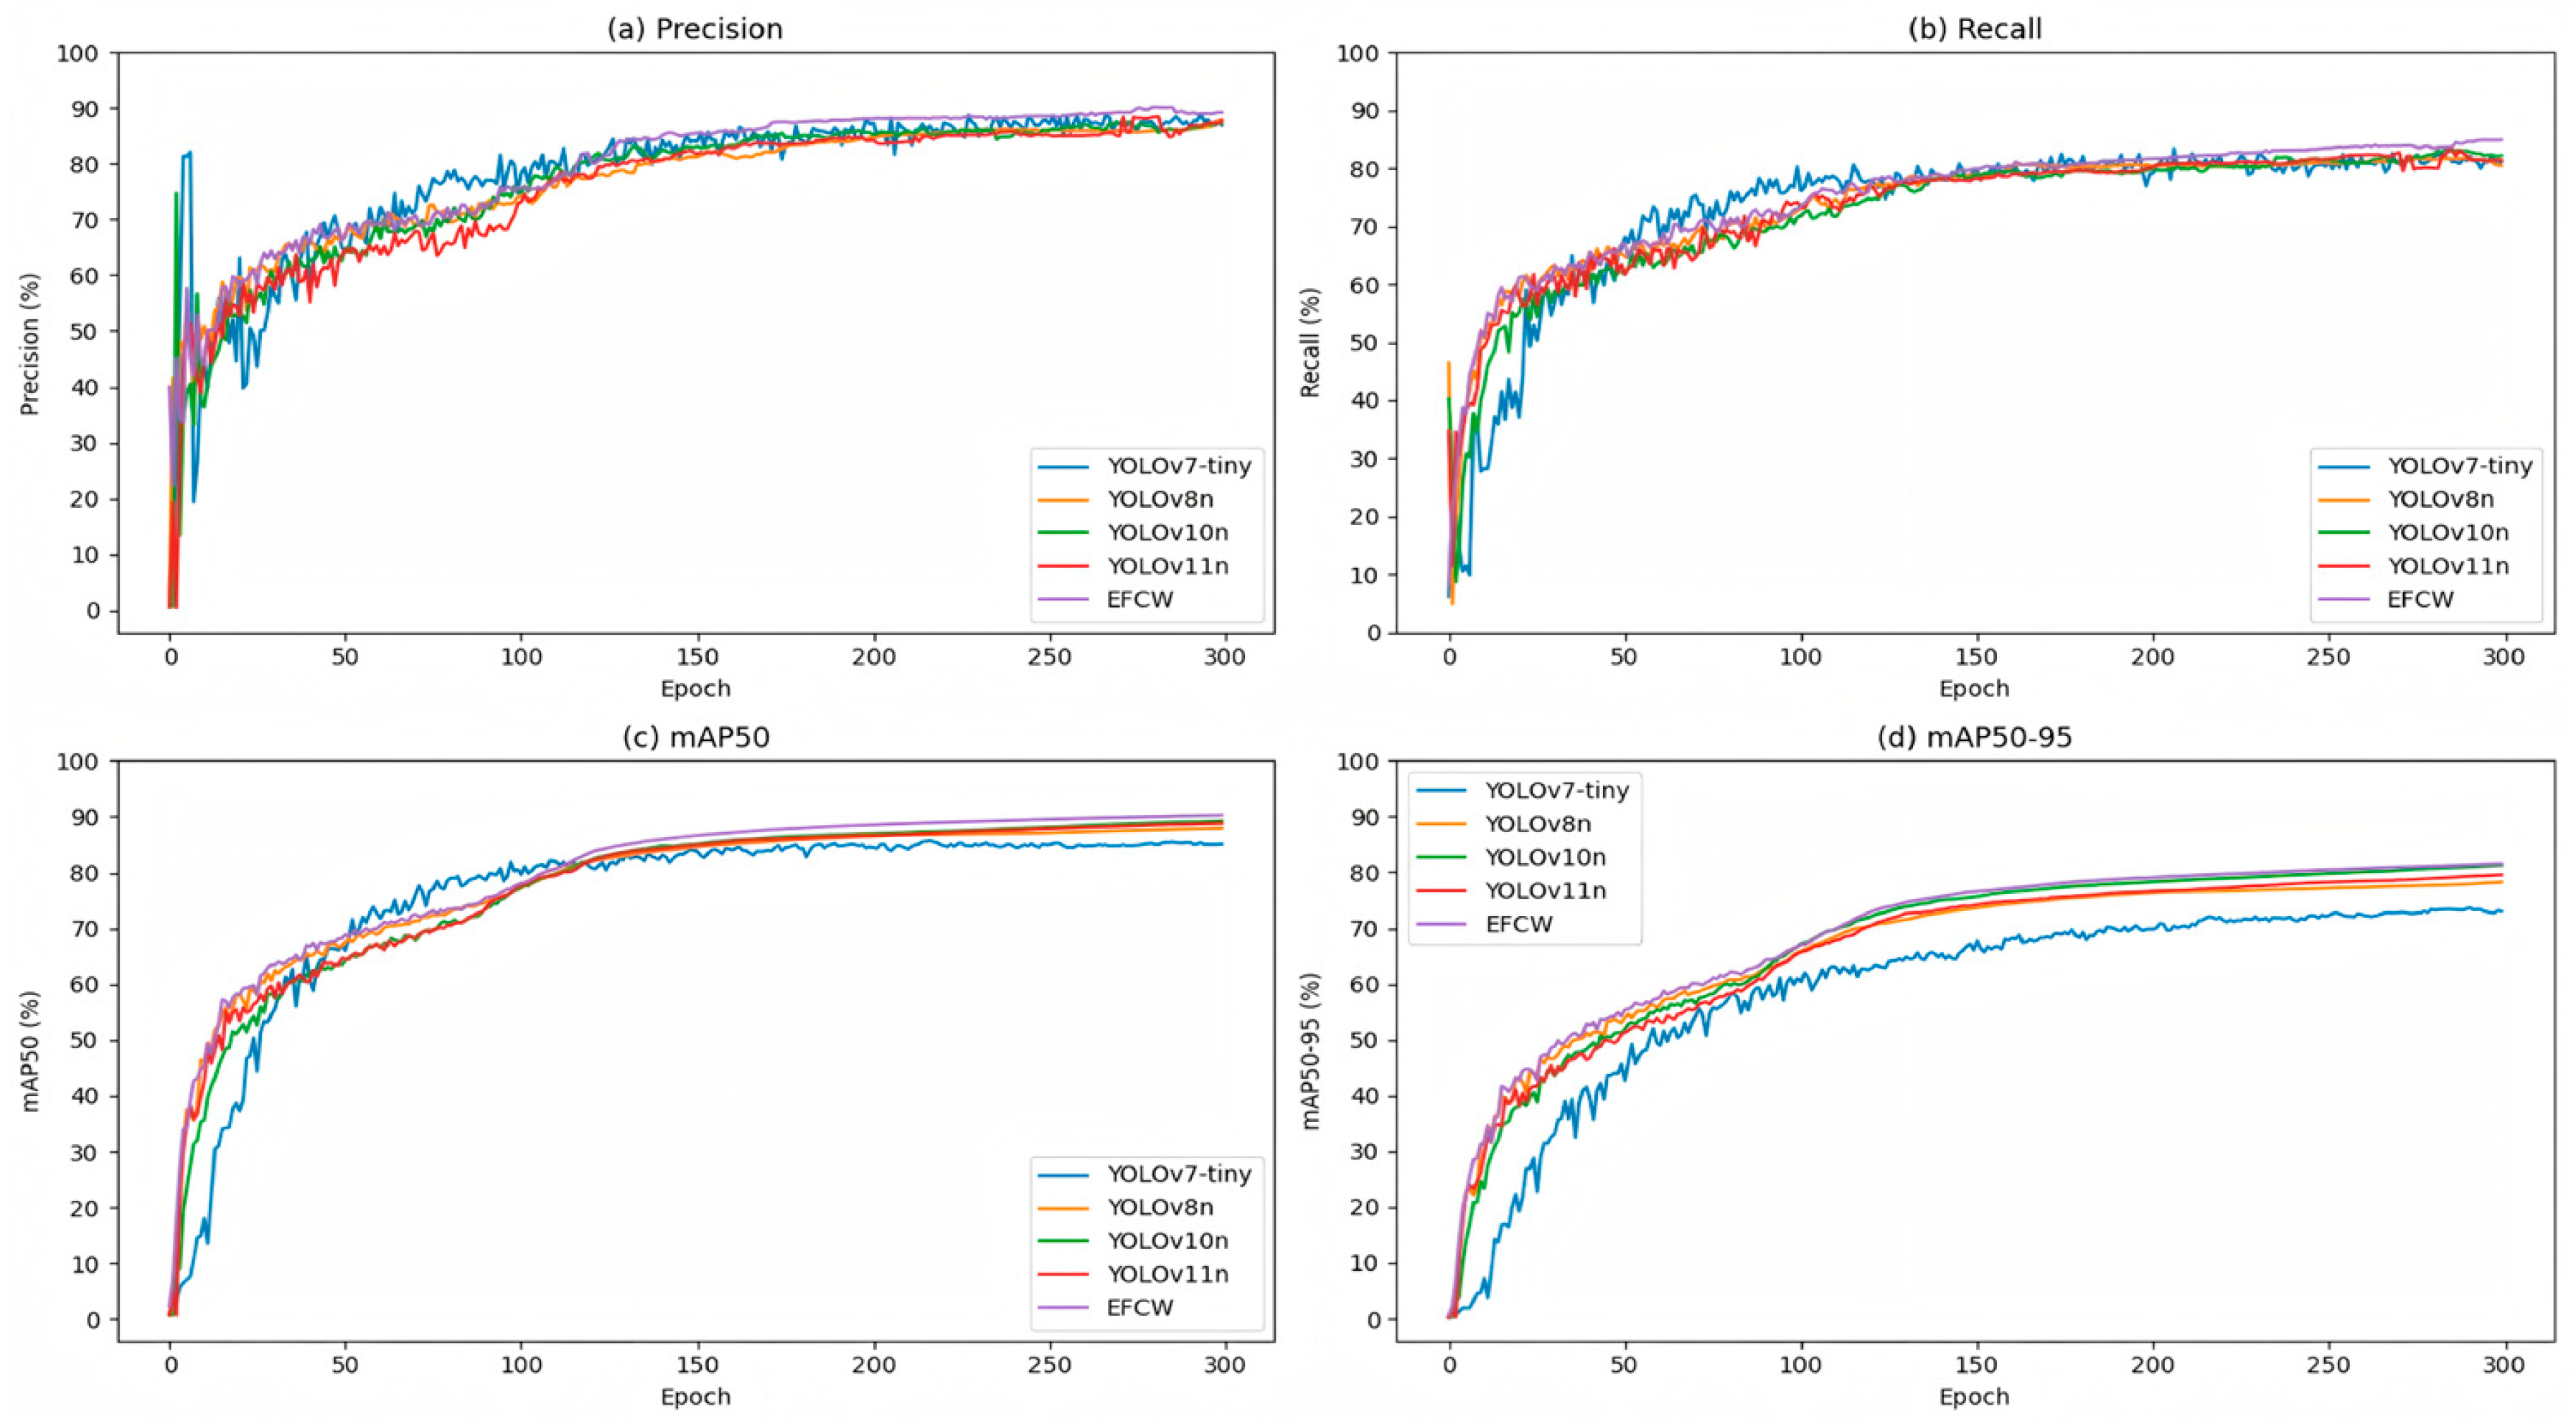
To provide a more intuitive comparison of the performance differences in wood defect detection between the proposed algorithm and the classical models, the trends of the four metrics (P, R, mAP50, mAP50-95) are visualized in
Figure 10.
Visualizing the trends of the key performance metrics (precision, recall, mAP50, and mAP50-95) across training epochs provides an intuitive understanding of the models’ learning dynamics and final performance comparison.
Figure 10a shows the precision changes during training for different models. It can be observed that the EFCW-YOLO model exhibited higher precision early in training. Its precision continued to improve and eventually stabilized above 89.0%. In contrast, the precision of the YOLOv8n, YOLOv10n, and YOLOv11n models improved more slowly, ultimately stabilizing around 87.0%.
Figure 10b displays the recall changes during training. The EFCW-YOLO model’s recall value was significantly higher than other models from the early stages and continued to increase, finally stabilizing above 84.0%. The recall values of the other models eventually stabilized around 81.0%, notably lower than EFCW-YOLO.
Figure 10c illustrates the mAP50 changes during training. The trend of mAP50 versus epochs was roughly similar for the four models other than YOLOv7-tiny. Among them, the EFCW-YOLO model stabilized above 88.0%, performing the best. Conversely, the mAP50 values for YOLOv8n and YOLOv10n increased more gradually, stabilizing around 87.0%. The YOLOv11n model’s mAP50 value increased faster, eventually stabilizing around 88.0%.
Figure 10d presents the mAP50-95 changes during training. The mAP50-95 values for YOLOv8n, YOLOv10n, and YOLOv11n ultimately stabilized around 77.00%. YOLOv7-tiny remained significantly lower than the other models throughout the entire training process. The EFCW-YOLO model’s mAP50-95 value was markedly higher than others from the beginning of training, continued to rise, and finally stabilized above 81.0%.
3.5.1. Detailed Comparison of Detection Performance for Various Defect Types
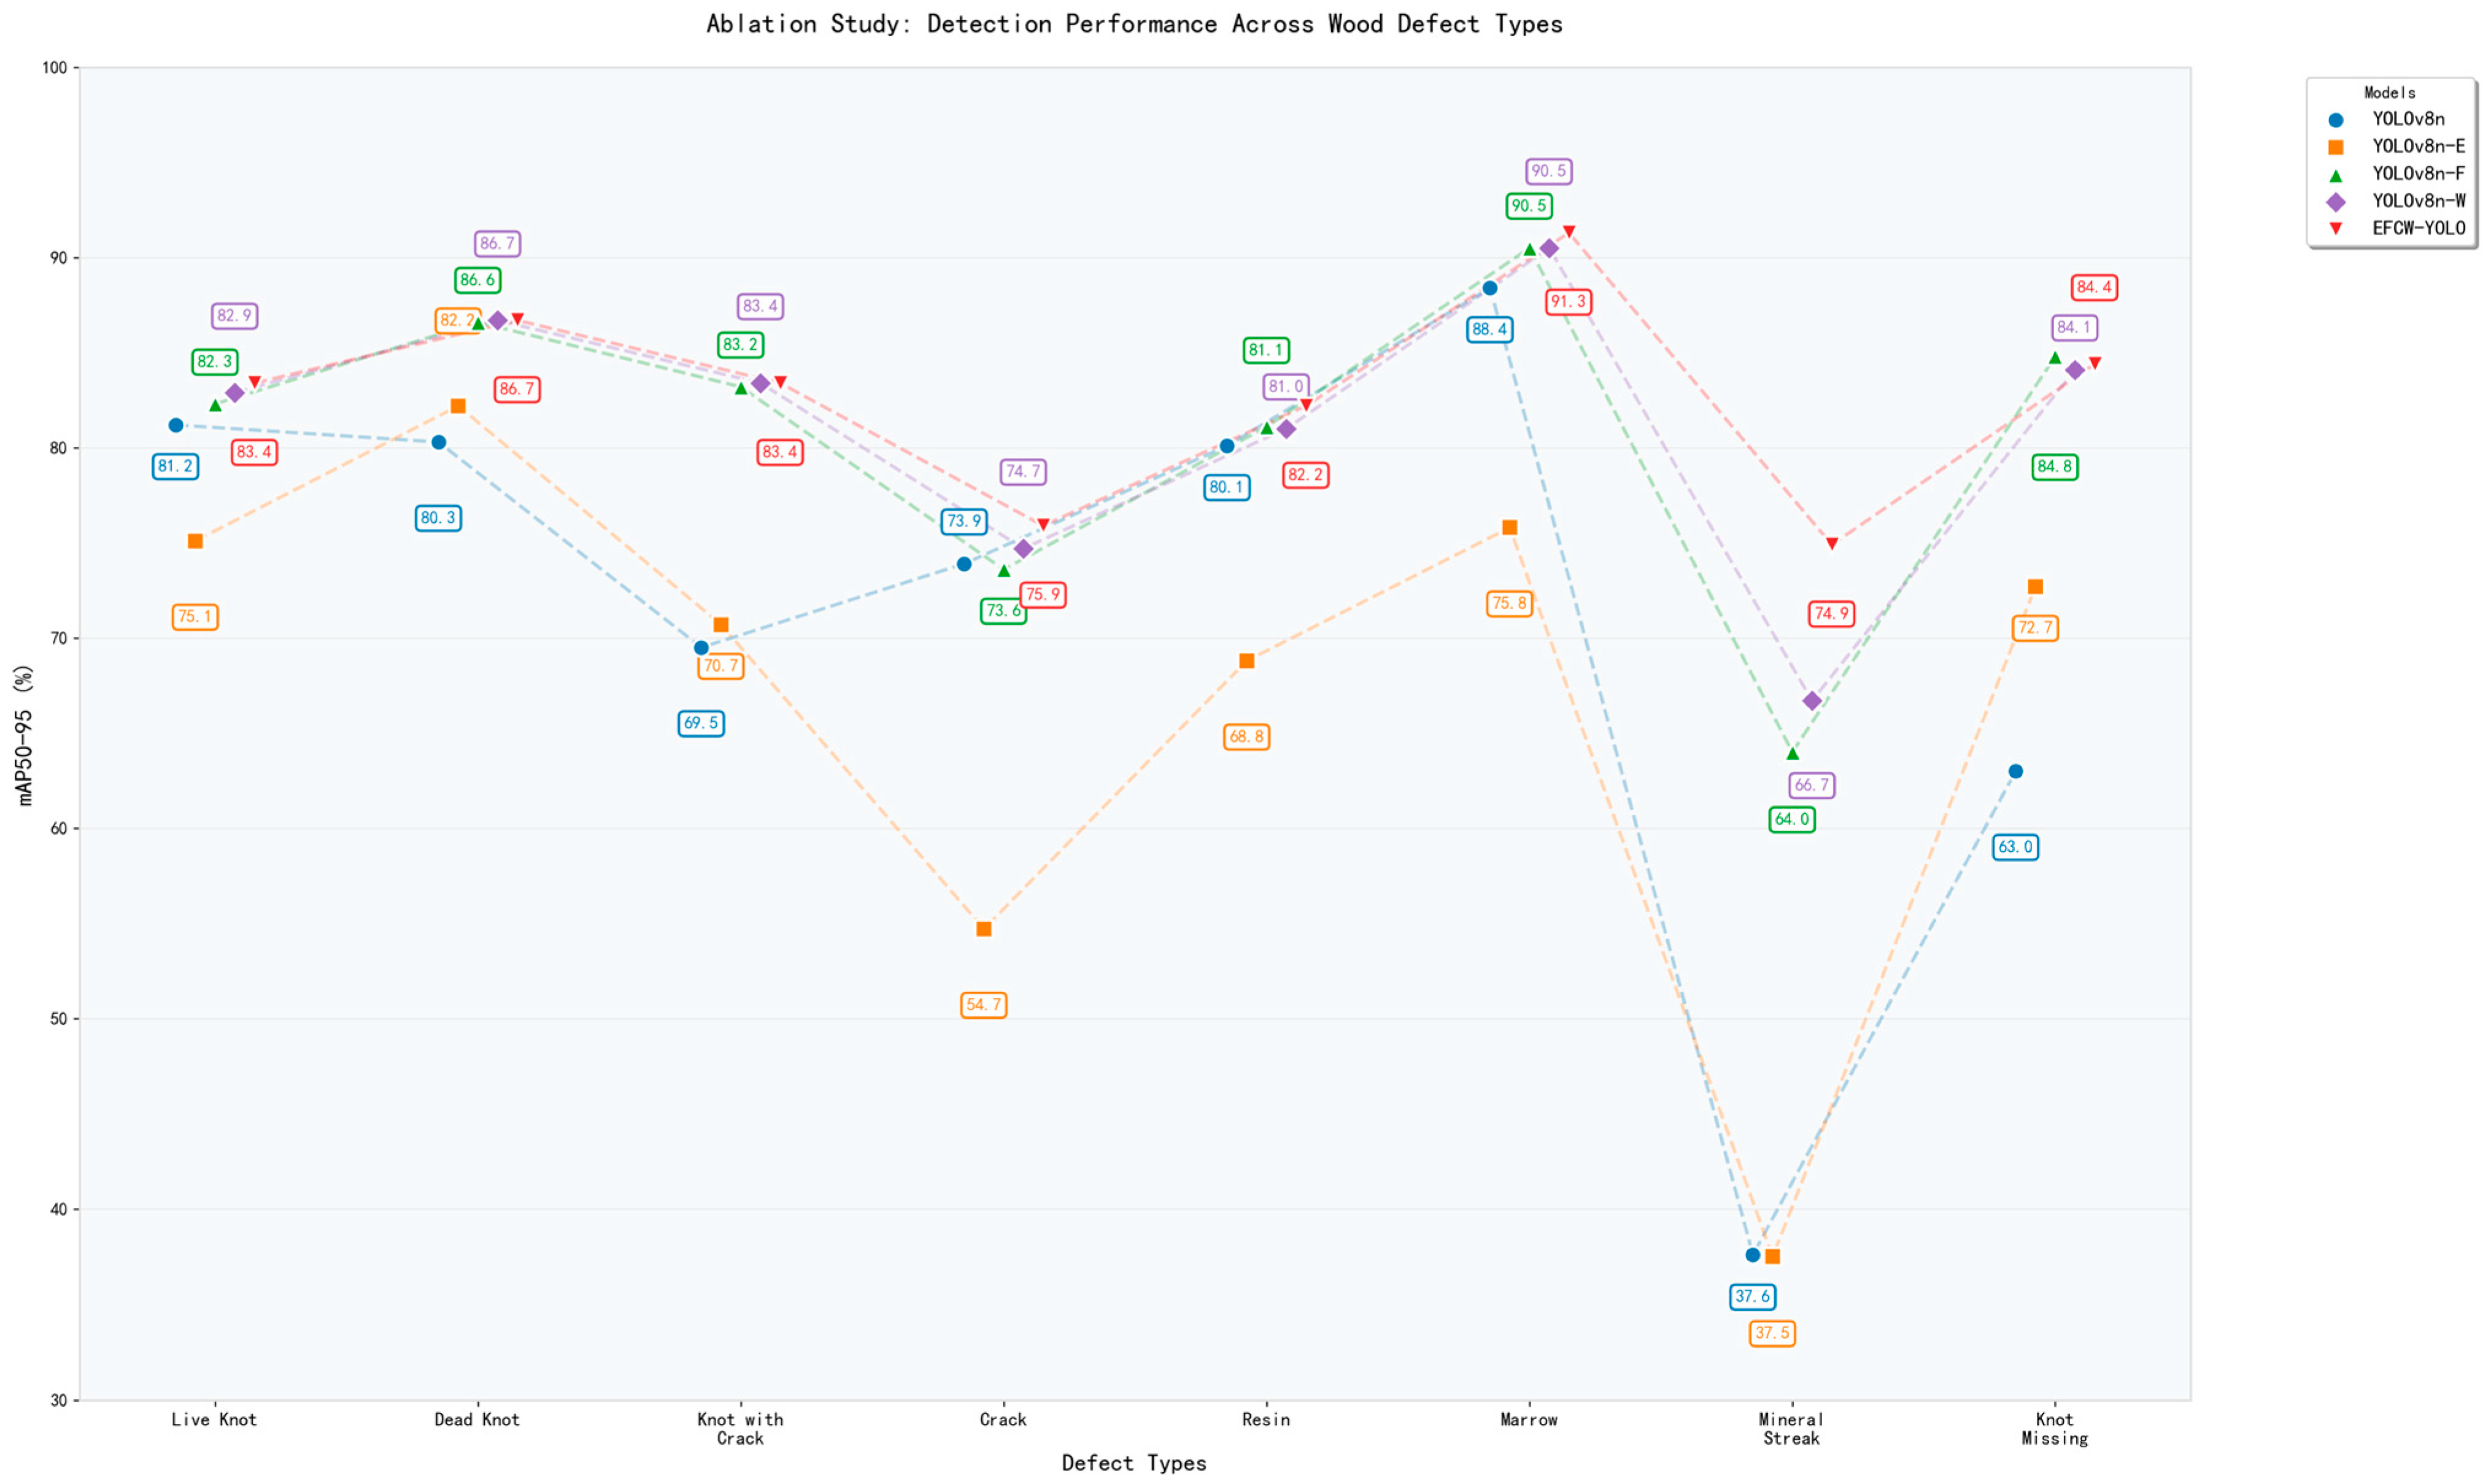
To further validate the comprehensive advantages of the EFCW-YOLO model across different defect types,
Figure 11 provides a detailed comparison of its mAP50-95 data with mainstream detectors for various defect categories.
Analysis of the performance comparison across different categories yields the following key conclusions: (1) EFCW-YOLO maintained high mAP50-95 values (all exceeding 83.0%) for common defects such as Live Knot, Dead Knot, and Marrow. (2) The model’s advantages are particularly prominent when detecting challenging categories. Compared to the latest models like YOLOv10n and YOLOv11n, EFCW-YOLO’s mAP50-95 for Mineral Streak is significantly higher by approximately 19.1% and 11.2%, respectively. For Knot Missing, the mAP50-95 values are higher by about 9.7% and 1.2%, respectively.
Through these detailed analyses and comparisons, we can conclude that the EFCW-YOLO model performs excellently across multiple wood defect detection tasks, with its performance advantages being particularly evident for difficult-to-detect defect types.
3.5.2. Processing Time Analysis for Industrial Application
To assess the practical deployment potential of the proposed EFCW-YOLO model in manufacturing environments, we conducted comprehensive testing under identical hardware conditions (NVIDIA GeForce RTX 4090). The evaluation encompassed both computational efficiency and detection accuracy on a hybrid dataset combining public benchmarks with our proprietary production-line images collected at various resolutions (1920 × 1280, 1240 × 1024, and 4400 × 2340 pixels). For standardized benchmark comparison, all test images were resized to 640 × 640 resolution. Under this condition, the EFCW-YOLO model achieves an average inference time of 31.0 ms per image, corresponding to approximately 32.3 frames per second (FPS). Comparative results for other detectors under identical preprocessing are summarized in
Table 9.
The results show that EFCW-YOLO achieves a good balance between detection accuracy and processing speed. Its inference time comfortably meets the 30 FPS real-time requirement for industrial production lines. Compared with other models, YOLOv11n has the fastest inference speed (42.0 FPS), but its accuracy has decreased, especially when dealing with challenging defects such as Mineral Streak. In contrast, YOLOv7-tiny and Faster-RCNN are less suitable for real-time applications because their inference times are longer (50.3 ms and 981.0 ms, respectively). It should be noted that these inference times are based on processing a single image. In practical applications, batch processing can be adopted to increase processing speed, thereby further enhancing its applicability in the industrial field. However, batch processing may introduce additional delays and requires careful system design.
In order to directly address performance degradation on production-line data, we evaluated all the models on a mixed dataset composed of collected wood defect data and open-source data, which included 8 common defects. According to the performance comparison results shown in
Figure 12, the detection performance of EFCW-YOLO is significantly higher.
In summary, EFCW-YOLO provides an optimal solution for real-time wood surface defect detection, combining high accuracy and efficient computing performance. Manufacturers can use this model for automated quality control without affecting production speed.
3.6. Generalization Validation Experiment
To verify whether the EFCW-YOLO model possesses good generalization capability, this experiment used a public crop pest dataset to validate the algorithm’s generalization performance. The dataset is sourced from IP102, comprising 2853 selected images covering 12 pest types [
46], as shown in
Figure 13.
In this experiment, the dataset was similarly divided into training, validation, and test sets. The evaluation metrics and experimental parameter settings remained consistent with those described earlier. Comparing the training results of YOLOv8n and EFCW-YOLO, where bold values indicate the best performance, the results are shown in
Table 10 below:
From the experimental results, the EFCW-YOLO model algorithm achieved an mAP50 value of 97% on the crop pest dataset, representing a 1.78% improvement over the baseline model. The recall value reached 93.4%, which is a 3.00% improvement compared to the baseline model. Additionally, the F1 score and accuracy metrics showed significant enhancements, with F1 Score improving by 2.42% (from 91.48% to 93.90%) and Accuracy increasing by 2.33% (from 90.52% to 92.85%). The generalization experiment results indicate that the proposed algorithm can maintain stable performance when confronted with unknown data, confirming its generalization capability. Future research will further explore the algorithm’s generalization ability in broader application scenarios and continue to optimize the model structure to enhance its generalization performance.
4. Discussion
This study developed the EFCW-YOLO model by integrating Focal Modulation, ECA, C2fCIB, and Wise-IoU v3 into the YOLOv8n framework, demonstrating exceptional performance in multi-species wood defect detection. This chapter provides an in-depth explanation of the mechanisms behind these findings, compares them with existing research, and offers a candid analysis of the limitations of this work.
4.1. Interpretation of Key Findings
The significant performance improvement of the EFCW-YOLO model primarily stems from the synergistic effects of the introduced modules. The Focal Modulation module, replacing the SPPF module, achieves selective focusing on image contextual information through its gated aggregation and element-wise affine transformation. This mechanism significantly enhances the ability to discern micro-defects and low-contrast defects (such as Mineral Streak) against complex wood texture backgrounds, which is directly validated by the substantial 37.3% improvement in Mineral Streak detection performance in the ablation study (
Figure 9).
The introduction of the ECA attention mechanism achieves channel feature recalibration at a very low parameter cost. Our comparative experiments (
Table 5 and
Table 6) confirmed that, compared to other mechanisms like CA, ECA achieves a better balance between performance improvement and computational cost control, aligning well with the goal of building a lightweight and efficient detector in this study.
The C2fCIB module optimizes the feature extraction process through its inverted bottleneck and depthwise separable convolutions, effectively reducing model redundancy and computational load. This module is key to the model maintaining a compact size of only 6.12 MB while still achieving steady improvement in recall for defects like Dead Knot and Knot with Crack.
Furthermore, the adopted Wise-IoU v3 loss function, with its dynamic non-monotonic focusing mechanism, adaptively adjusts the gradient gain based on the anchor box’s “outlier degree,” effectively mitigating the interference of low-quality samples and labeling anomalies during training. This significantly optimizes the bounding box regression accuracy for defects requiring precise localization, such as Crack and Resin.
The synergistic optimization of these four modules distinguishes EFCW-YOLO from emerging optical-acoustic hybrid systems. As summarized in
Table 1, recent advances in laser ultrasonic testing (LUT) have demonstrated remarkable capabilities in harsh environments and internal defect detection [
23]. However, such systems require high-energy lasers, interferometers, and complex signal demodulation, resulting in high equipment costs and operational complexity that hinder deployment in cost-sensitive wood processing lines. Similarly, CMOS sensor-based ultrasonic detection [
22] and digital holography acoustic imaging [
21] achieve impressive sensitivity on rough surfaces but suffer from limited frame rates or computational overhead. In contrast, our pure machine vision approach eliminates the need for ultrasonic excitation units altogether, relying solely on commercial cameras and efficient deep learning inference. This design choice achieves real-time detection (>30 FPS) with 6.12 MB model size, offering superior cost-effectiveness and deployment flexibility for surface defect inspection in high-speed production environments.
4.2. Comparative Analysis and Research Gaps
This study advances existing work in multiple dimensions. Truong et al. [
35] achieved high accuracy based on YOLOv5 for hardwood floor defect detection, but their coverage of defect types was relatively narrow. In contrast, the PlankDef-9K dataset constructed in this study covers 8 defect types across 5 tree species, enhancing the model’s practicality. Compared to the improved YOLOv8 model by Wang et al. [
41] (mAP50 of 77.7%), EFCW-YOLO achieves higher accuracy (mAP50 of 90.26%) while strictly constraining model complexity, highlighting the superiority of multi-component collaborative optimization over single structural improvements.
The proposed model also demonstrates competitiveness compared to the latest models like YOLOv10n and YOLOv11n. Its advantages, particularly on difficult-to-detect defects, indicate that the modules we introduced endow the model with capabilities more suitable for wood defect detection tasks.
Despite achieving positive results, this study still has several limitations.
Data Domain Gap: The experimental data primarily originated from a controlled laboratory environment. Complex conditions encountered on real production lines, such as drastic illumination changes, motion blur, and wood surface reflections, may affect the model’s robustness. Future work requires data collection and model fine-tuning in fully authentic industrial scenarios.
Defect Coverage: Although the eight covered defect types are common, they are far from exhaustive of all wood defect types. Expanding the dataset to include more diverse defects and tree species is the primary choice for developing a universal detector.
Technical Deepening Directions: The current model does not utilize 3D information and cannot inspect internal defects. Exploring the integration of 3D vision technology is an important future direction; fusion with laser ultrasonic testing (LUT) presents a promising alternative for internal defect detection [
23]. Specifically, a hybrid framework could be developed where EFCW-YOLO performs rapid full-surface screening using optical images, and LUT is selectively triggered for suspicious regions to confirm internal cracks or decay. This would leverage the self-adaptive speckle detection capabilities demonstrated in CMOS sensor research [
22] while maintaining the speed and cost advantages of our vision-based approach. Simultaneously, although the model is already lightweight, further compression through techniques like pruning and quantization to adapt to more stringent edge computing devices still holds research value.
4.3. Industrial Deployment Considerations
The processing time analysis confirms EFCW-YOLO’s suitability for real-time industrial deployment. Experimental results demonstrate that the model achieves 32.3 FPS inference speed with 90.26% mAP50 accuracy, providing both high detection reliability and practical processing capacity. For manufacturers, this performance translates to direct economic benefits: assuming industry-standard wood processing lines operating at 20–30 planks per minute, EFCW-YOLO provides sufficient computational headroom for comprehensive defect detection while maintaining real-time operation.
Furthermore, the model’s compact size (6.12 MB) facilitates deployment on cost-effective edge computing devices, significantly reducing the hardware investment required for system implementation. Batch processing optimization tests showed that throughput can be increased to 112 FPS without accuracy degradation, making the model adaptable to various production line speeds. This combination of accuracy (89.24% precision, 84.90% recall), speed (32.3 FPS), and deployability positions EFCW-YOLO as a practical solution for small-to-medium-sized enterprises seeking to adopt automated quality control systems.

