Article

Tree-Ring Reconstruction of Minimum Temperature Changes in the Northern Greater Khingan Mountains

1
College of Geographical Sciences, Harbin Normal University, Harbin 150025, China
2
Heilongjiang Wuyiling Wetland Ecosystem National Observation and Research Station, Yichun 153000, China
*
Author to whom correspondence should be addressed.
Forests 2025, 16(11), 1753; https://doi.org/10.3390/f16111753 (registering DOI)
Submission received: 4 November 2025 / Revised: 18 November 2025 / Accepted: 19 November 2025 / Published: 20 November 2025
(This article belongs to the Special Issue Tree-Ring Analysis: Response and Adaptation to Climate Change)

Abstract

We established a standardized tree-ring width chronology using 46 Mongolian pine (Pinus sylvestris var. mongolica) tree-ring cores from the Tuqiang Forestry Bureau in the northern Greater Khingan Mountains (GKM). The average minimum temperature from May to July was significantly positively correlated with tree-ring width, indicating that it is the main climatic factor affecting tree growth in the study area. Based on this, the average minimum temperature sequence from May to July for the past 164 years in this region was reconstructed, and its reliability and stability were verified using the leave-one-out method. The reconstruction results revealed four warm periods and two cold periods in the northern GKM over the past 164 years. The four warm periods were from 1891 to 1897, 1902 to 1909, 1923 to 1931, and 2003 to 2023, and the two cold periods were from 1864 to 1880 and 1953 to 1992. The results of multi-window spectrum analysis and wavelet analysis showed that the reconstructed sequence had periodicities of 2.2–5.3 years, 11 years, 39 years, and 52 years, suggesting that the minimum temperature changes may be influenced by El Niño-Southern Oscillation (ENSO), Pacific Decadal Oscillation (PDO), and solar sunspot activities.

1. Introduction

In 2024, global warming crossed the key 1.5 °C threshold for the first time; this threshold was originally set in the Paris Agreement. Global warming is a major climate problem that requires urgent attention [1,2,3]. Clarifying patterns of historical climate change is critically important for understanding the causes and potential impacts of current climate change, coping with global warming, and predicting future climate change [4].
Given that meteorological stations in China were only established recently and the distribution varies among regions, acquiring long-term continuous climate data can be a major challenge; this impedes research on historical climate change and necessitates historical climate reconstructions [5]. Tree rings are indicators of climate change and are commonly used for historical climate reconstructions due to their various advantages, including the ease with which they can be acquired, their ability to yield accurate year information, and their high continuity and temporal resolution; the information provided by tree rings cannot be easily replaced by other types of climate research data. Reconstructing historical climate sequences can clarify past climate variability, which holds significant reference value for addressing global warming. For instance, it helps humans understand the uniqueness and urgency of current global warming, provides a reference for formulating emission reduction strategies, and offers a scientific basis for the development of subsequent climate policies [6]. Studies of tree rings in China began in the 1930s, and such studies became particularly more common in the 1990s [7]. Climate reconstruction studies have been conducted in the Tianshan Mountains [8], Altai Mountains [9], Qinling Mountains [10], Qilian Mountains [11], Hengduan Mountains [12], and various other regions. The accuracy of the results of these studies is widely recognized in various fields.
The GKM are located in the high-latitude region of the northern hemisphere, which is significantly affected by global warming [13]. Characterizing historical changes in the climate in the GKM is critically important for clarifying general patterns of climate change in East Asia and regional responses to global climate change [14]. In contrast to Xinjiang, Tibet, and other regions in China, dendrochronological studies have not been conducted in the Greater Khinganling region until recently [15,16]. Current studies have mainly focused on examining the response relationships between tree radial growth and climate factors [17,18]; few studies have reconstructed historical climates in the GKM. Most previous studies have reconstructed historical patterns of mean temperature, maximum temperature, and precipitation. For example, Jiang et al. used the tree rings of Larix gmelinii to reconstruct changes in average temperature from 1880 to 2014 in the GKM to reveal patterns of climate change and their possible effects in the region [19]. Wei et al. used the tree rings of Picea koraiensis to reconstruct patterns of runoff from 1845 to 2016 in the Gongar River Basin in the southern part of the GKM and revealed several historical dry and wet periods in this region [20]. Previous studies have shown that changes in minimum temperature have a significant effect on physiological processes such as plant respiration and nutrient absorption [21]. However, few studies have reconstructed patterns of minimum temperature change in the northern part of the GKM. As the northern part of the GKM is vast and features a complex terrain, broad patterns of climate cannot be inferred based on tree-ring information from a single region. To obtain more accurate and reliable historical climate information, reconstructions of minimum temperature should be based on tree-ring data collected from several locations in the northern part of the GKM.
Mongolian pine is widely distributed in the GKM. It has been widely used in dendrochronological research [22,23]. In this paper, standardized tree-ring width chronologies were established using tree-ring samples collected from Mongolian pine in the northern part of the GKM. The response relationships between the radial growth of Mongolian pine and climatic factors were analyzed to identify the climatic factors most strongly correlated with radial growth. Changes in the average minimum temperature from May to July in this area over the past 164 years were reconstructed, and historical variation in minimum temperature was analyzed. The aim of this study is to reconstruct the historical climate sequence of the research area using the relationship between tree ring width and climate, clarify historical climate changes, analyze the variation characteristics of the reconstructed sequence, and supplement and improve the large-scale basic climate data of the GKM region.

2. Materials and Methods

2.1. Study Area

The study area is located in Tuqiang Forestry Bureau (52°15′35″–53°33′42″ N, 122°18′28″–123°28′10″ E) in the northern part of the GKM. The Forestry Bureau is located in Tuqiang Town, Mohe City, Heilongjiang Province, China. The total area of this region is 505,500 hectares. The elevation is high in the south and low in the north; the Emuerhe River cuts across this region twice and provides abundant water resources. The Tuqiang Forestry Bureau experiences a cold temperate continental climate zone, which is characterized by long, cold winters and short, hot summers. The average annual precipitation during the study period (1960–2023) was 459 mm, and the average annual temperature was −4.1 °C. Plant resources are rich in this region, and the forest coverage rate is 92%. The main tree species include Mongolian pine, Larix gmelinii, Picea asperata, and Betula platyphylla, which makes it an ideal site for performing tree-ring research (Figure 1).

2.2. Collection and Processing of Tree-Ring Samples

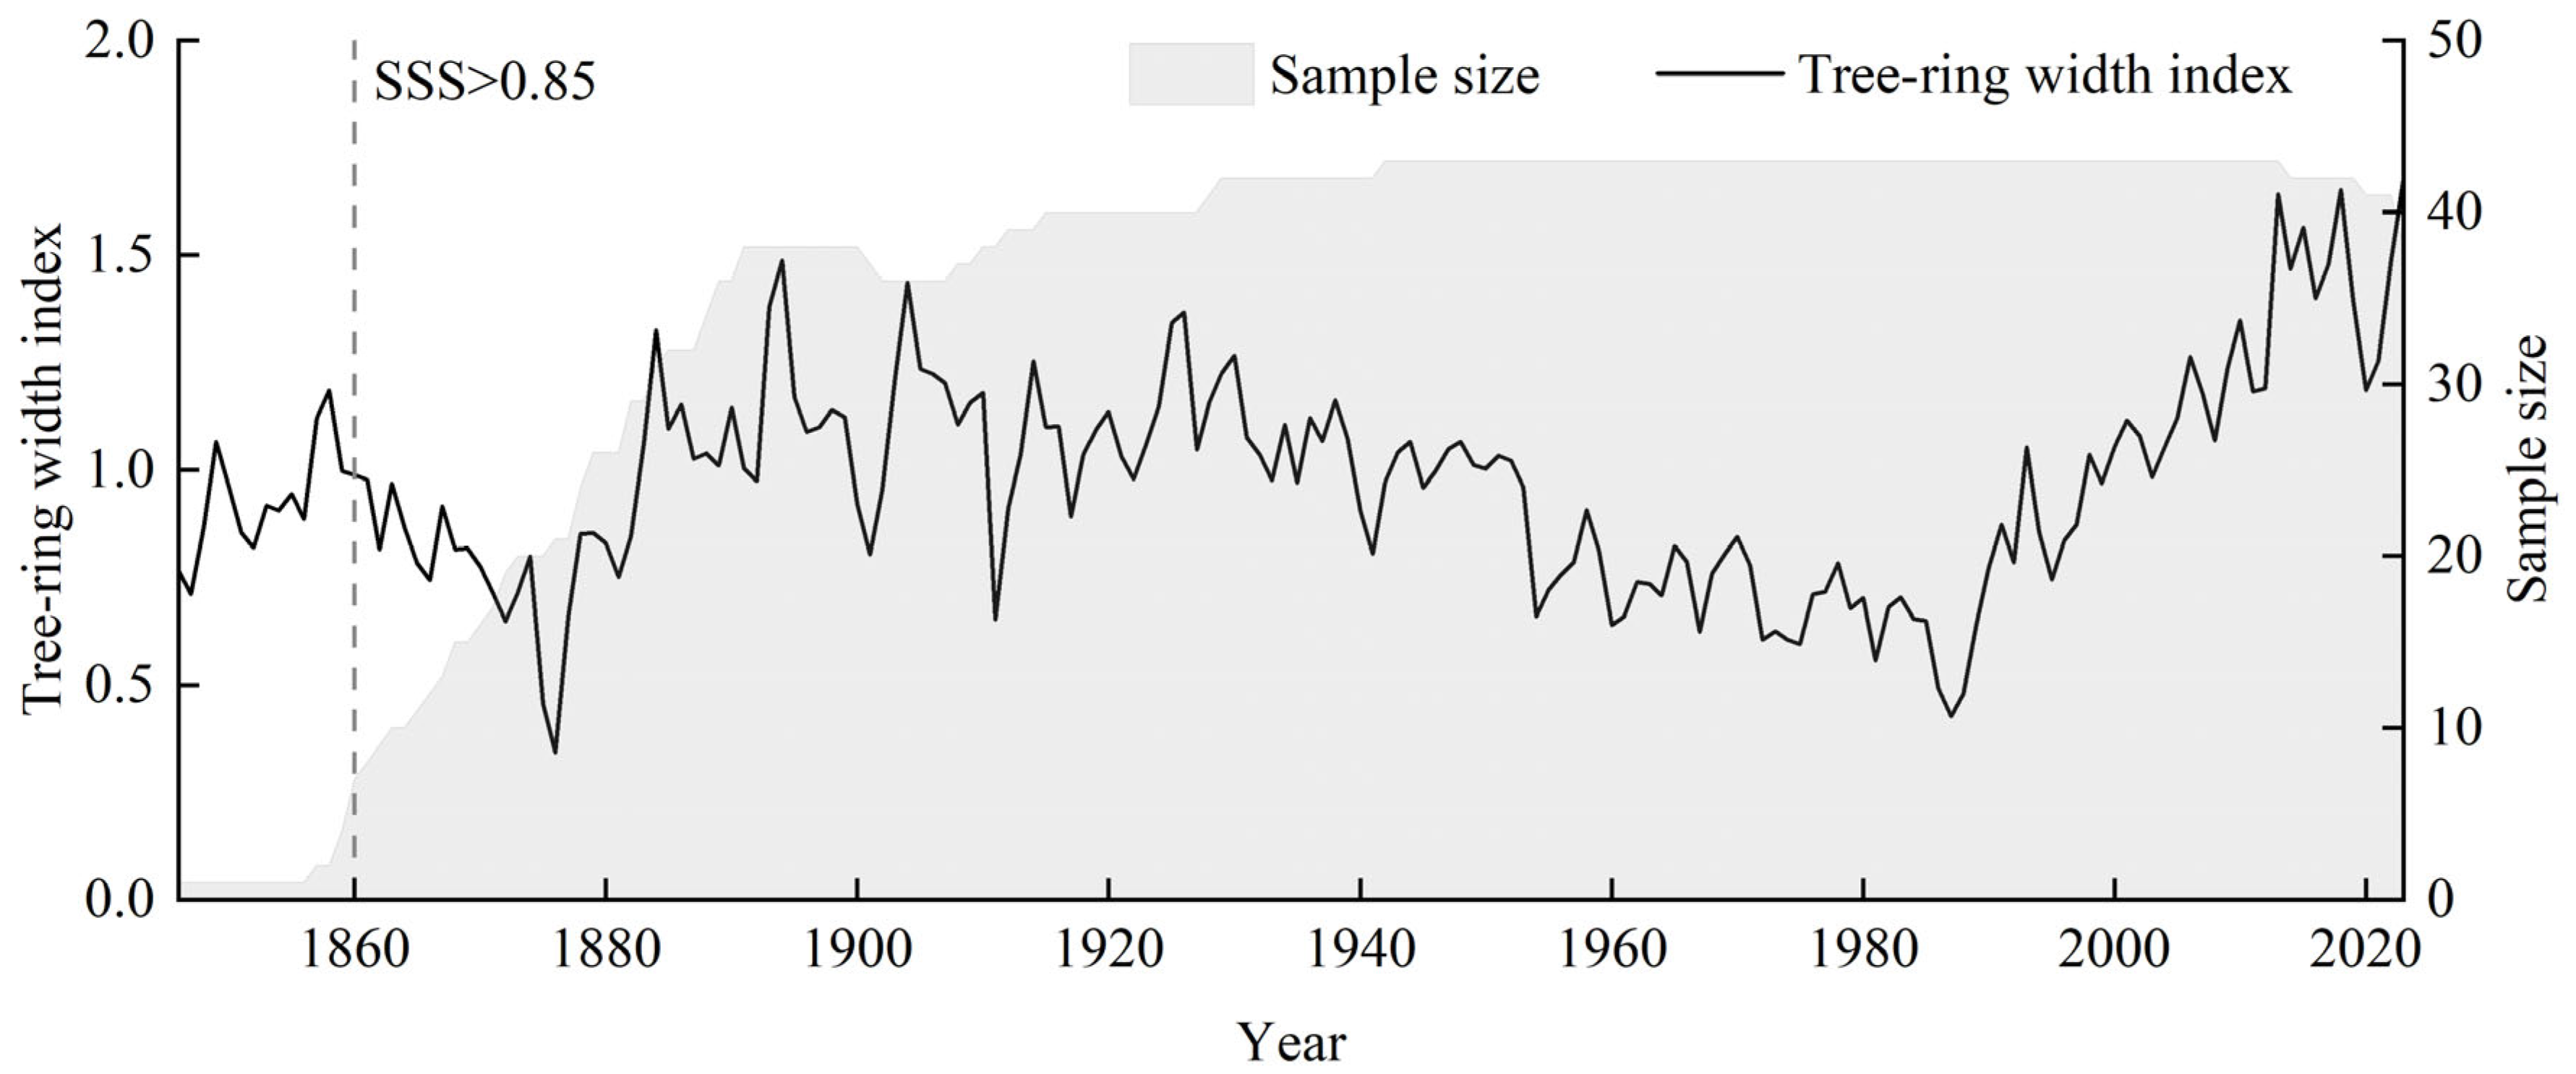
Following the sampling procedure described in the International Tree Ring Database [24], 47 tree-ring cores were collected from 22 trees located in the area of Mongolian pine (53°24′20″ N, 123°16′49″ E, average altitude 404 m, average slope 3° to the southwest, and crown cover of 70%) in Tuqiang Forestry Bureau in August 2024. Samples were taken in areas of forest that were located as far as possible from human settlements to minimize the effect of disturbance by human activities. Old Mongolian pine trees with robust growth and free of diseases and pests were sampled. Drill the sample cores using a 5 mm diameter increment borer at the breast height (1.3 m above the ground) of the tree. The sample cores were dried naturally in the laboratory, fixed in a wooden trough, and sanded with sandpaper until all the tree rings were clearly visible. A LINTAB6.0 ring width meter (Rinntrch, Heidelberg, Germany) [25] was used to measure the width of the tree ring core, which has a measurement accuracy of 0.001 mm [26,27]. In PAST5 software (1995–2016 by SCIEM, All Rights Reserved. Version 5.0.600) [17], tree-ring cores with width measurements were cross-dated. Cross-dating involves comparing annual ring sequences across different trees to identify “signal segments” with consistent width variations. By linking these signal segments across sequences, growth anomalies in individual trees are mitigated, enabling the precise year of each annual ring to be established. The COFECHA program [28] was used to assess the quality of the width measurements and cross-dating results, and 46 tree cores with high correlations with the main sequence were obtained by eliminating poor-quality samples. The negative exponential function detrending method in the ARSTAN program [29] was used to eliminate the growth trends of trees over time. The standardized chronology of tree-ring width of Mongolian pine in this area was established based on this information (Figure 2).

2.3. Climate Data

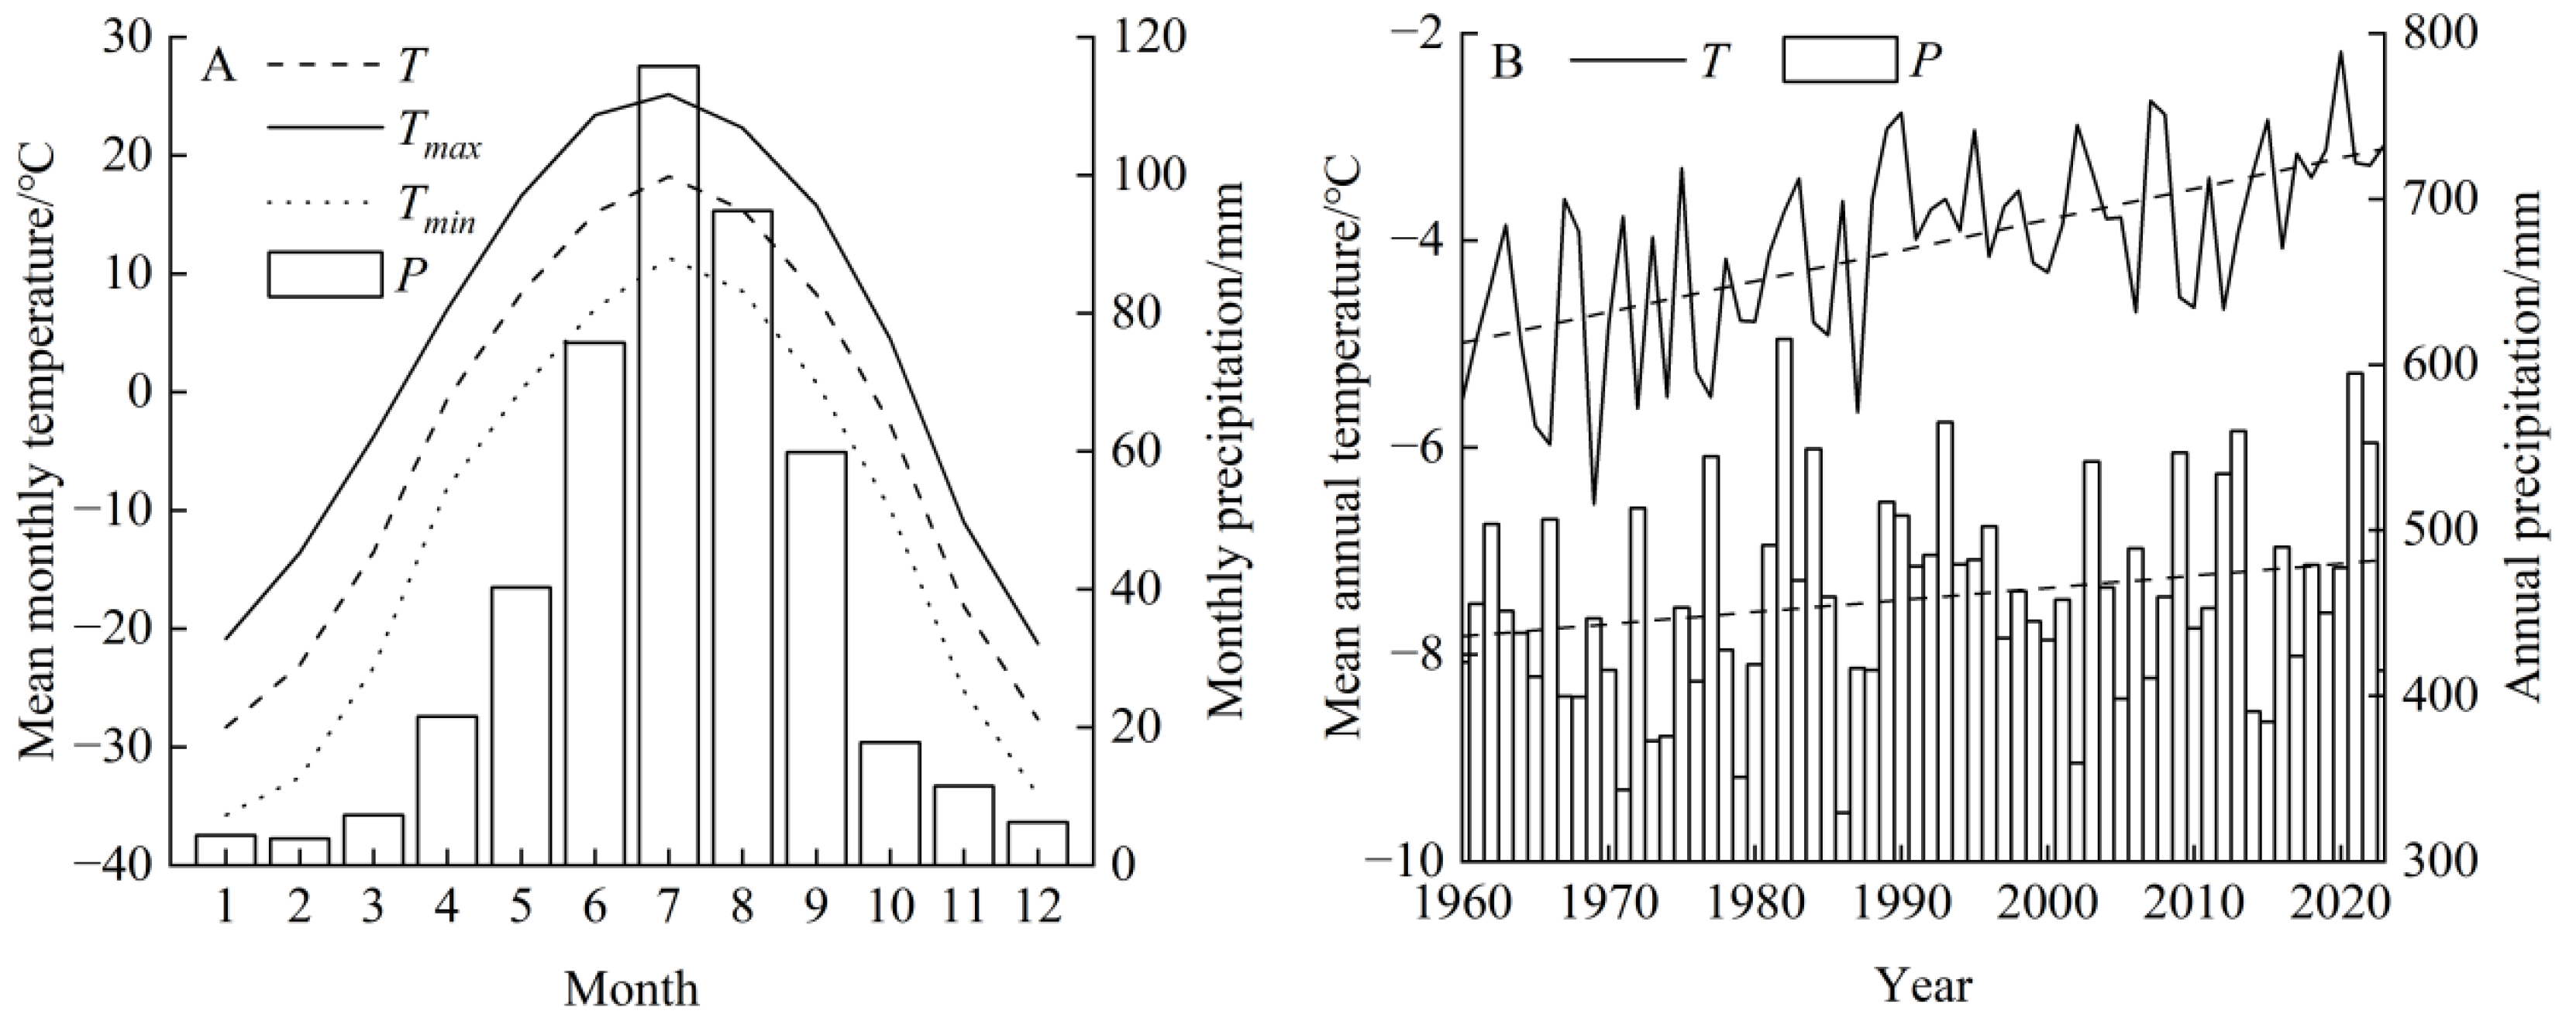
Given that the distance between the sampling point and the nearest meteorological station (Arctic Village Meteorological Station) exceeds 100 km, meteorological station data do not accurately reflect the climate information of the sampling point; thus, grid data from CRU TS 4.08 at a 0.5° × 0.5° resolution (http://climexp.knmi.nl) were used in subsequent research. To validate the accuracy of the CRU grid data, we performed a correlation analysis between CRU grid data and observational data from the meteorological station. The results revealed a highly significant positive correlation (p < 0.01) between all CRU grid data and meteorological station data. Consequently, the CRU grid data for this study region can be considered reliable. Monthly climate grid data from 1960 to 2023 for 53.00–53.50° N and 123.00–123.50° E, including average temperature (T), maximum temperature (Tmax), minimum temperature (Tmin), and precipitation (P), were used in analyses. The changes in temperature and precipitation are shown in Figure 3. There are marked dry and wet seasons in the study area; July is the warmest and wettest month. Since 1960, the annual average temperature has significantly increased, and annual total precipitation has also increased.

2.4. Research Methods

The Pearson correlation method in SPSS Statistics 26.0 software was used to analyze correlations between tree-ring width and various climate factors [30,31]. The linear regression method was used to develop the reconstruction equation, and the leave-one-out method was used to test the reliability of the reconstruction results [32]. Periodic changes in the reconstructed climate sequence were determined based on multi-window spectrum analysis and wavelet analysis [33]. KNMI Climate Explorer (http://climexp.knmi.nl) was used to perform spatial correlation analysis between the reconstructed sequence and the contemporaneous CRU grid climate data [34]; it is also used for spatial correlation analysis between the reconstructed sequences and sea surface temperature data.
Abrupt climatic changes were manifested as a sharp change in climate from one stable value to another, and identifying the timing of abrupt climate changes is significant for clarifying regional climate change [35]. The sliding t-test method and Mann–Kendall method in MATLAB 2020b were used to carry out mutation tests on the reconstructed climate sequence [36]. The sliding t-test method determines whether abrupt change occurs by comparing the significance of differences between the mean values of different periods; the abrupt change points determined by this method are affected by the mean period length (M). To prevent contingency from affecting the test results, we conducted abrupt change tests using four time periods, M = 5, 10, 15, and 20 years, and the year with the most frequent occurrence in the test results was used as the abrupt change year [37].

3. Results

3.1. Chronological Characteristics

Due to the low sample size in the early part of the chronology, only years with subsample signal strength (SSS) greater than 0.85 were considered reliable and retained to enhance the reliability of the chronology; the optimal first year of the chronology was determined to be 1860, and the optimal length of the chronology was 164 years. Statistical characteristics of the standardized chronology of tree-ring width of Mongolian pine at the sampling points are shown in Table 1. The mean sensitivity and signal-to-noise ratio indicated that the chronology contained abundant climate information and accounted for a relatively high proportion of all the information. The first-order autocorrelation coefficient indicated that tree growth was greatly affected by climate factors of the previous year. The standard deviation and between-tree correlations indicated that the year-to-year width changes of different tree-ring samples were consistent. The expressed population signal of the chronology exceeded the threshold of 0.85, indicating that the tree-ring samples provide an accurate representation of the overall characteristics of the tree-ring widths of Mongolian pine in the study area [38]. All the above parameters indicated that the chronology was suitable for subsequent dendrochronological analysis.

3.2. Response Analysis of Tree-Ring Chronology to Climate Factors

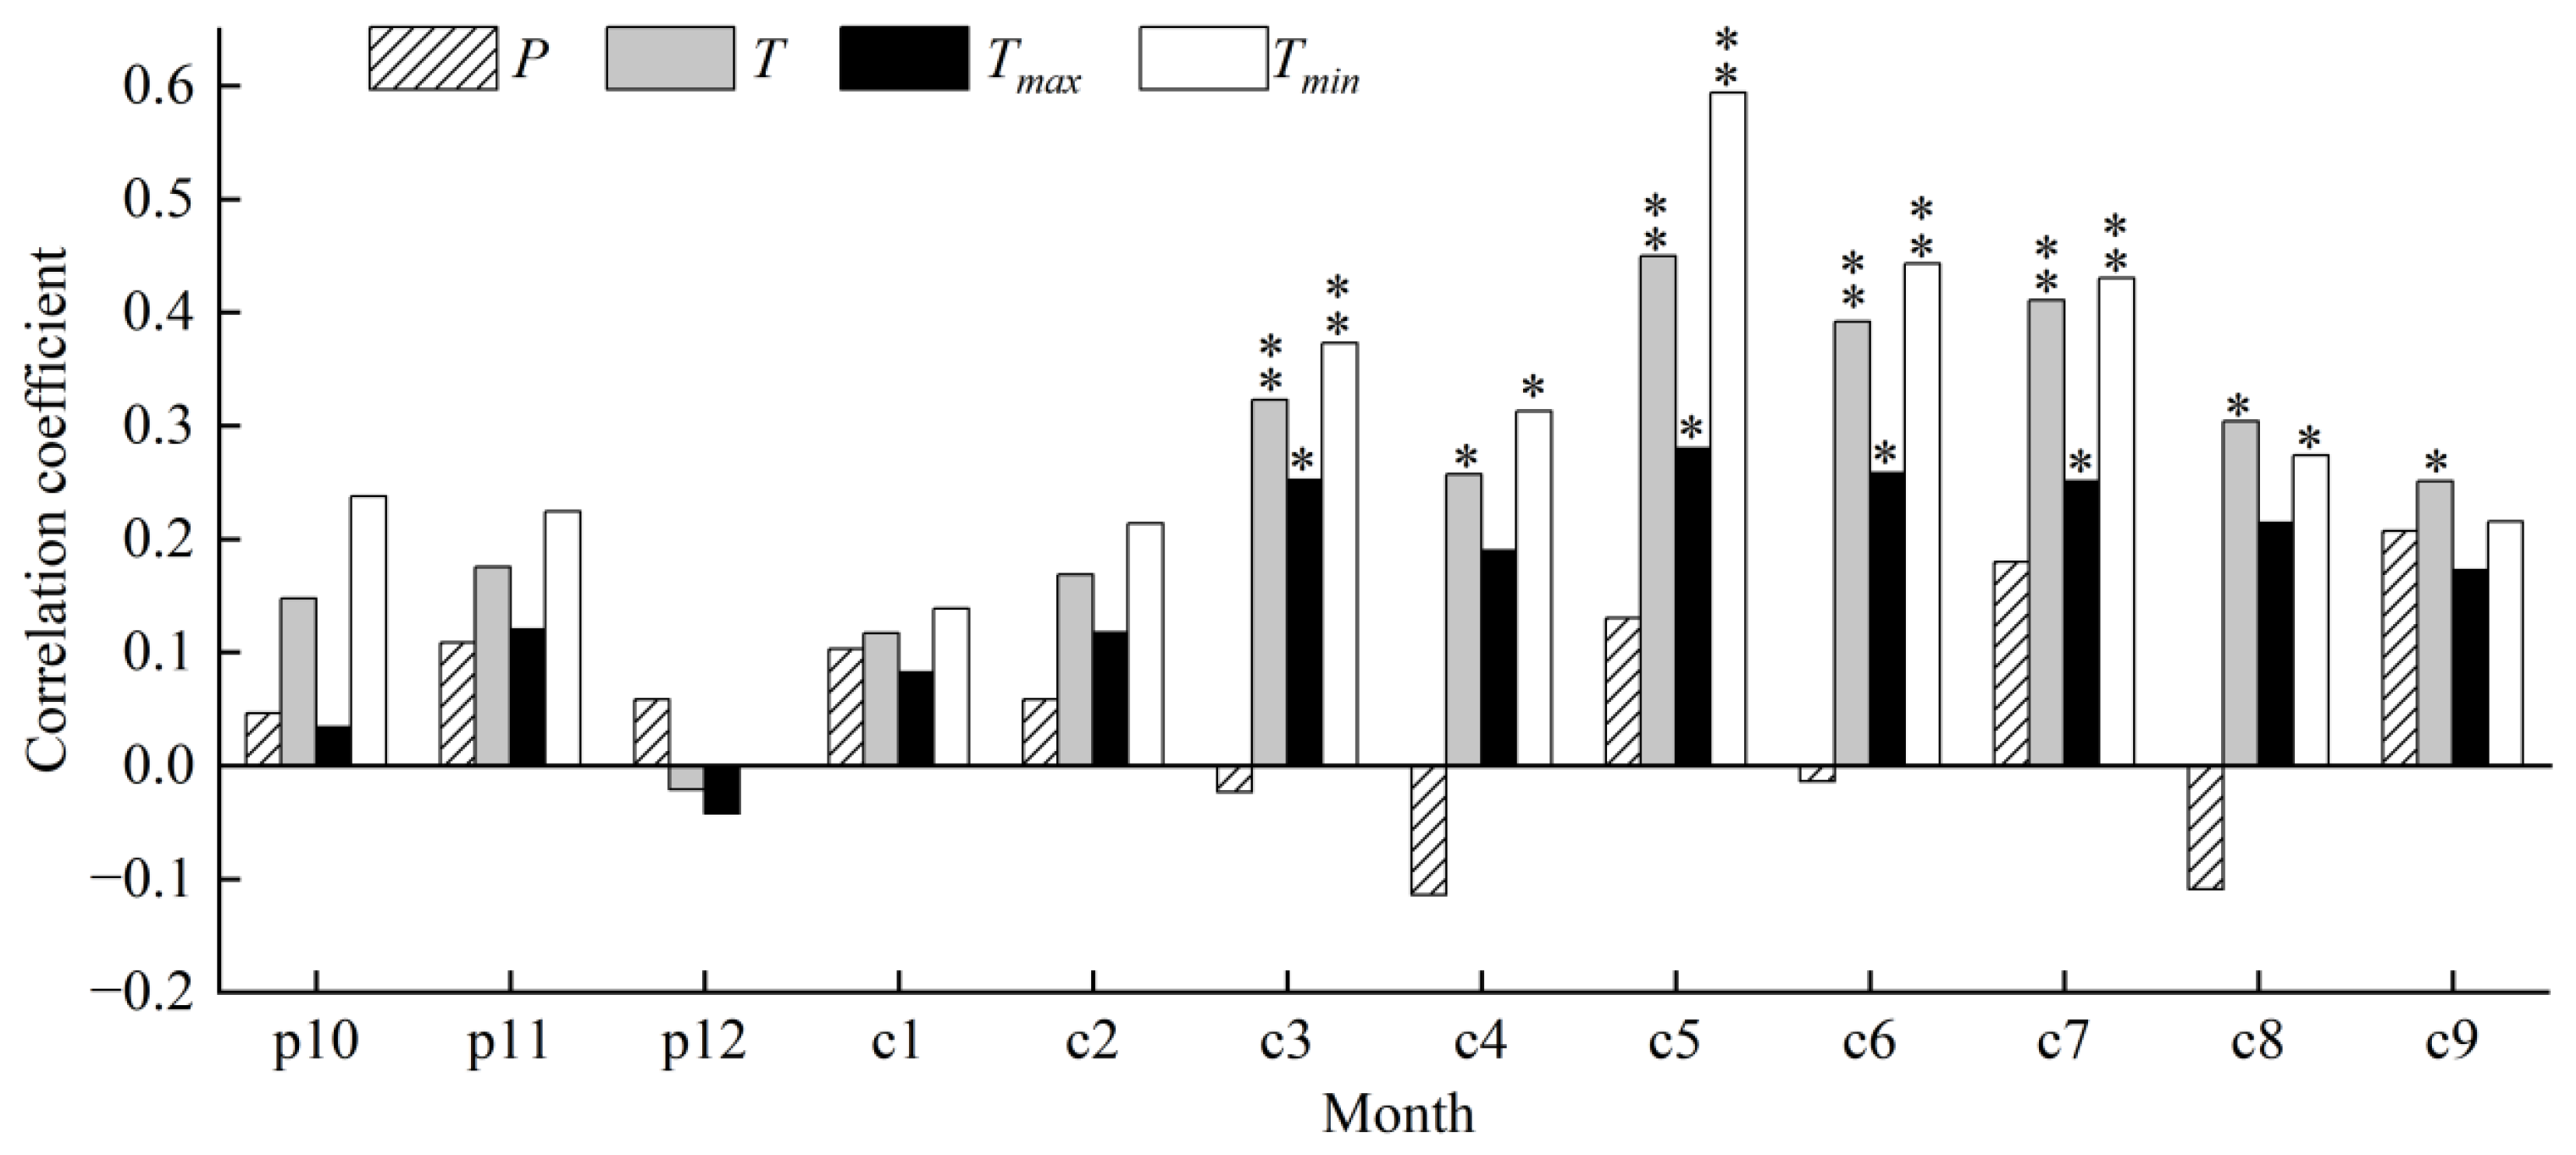
Given that the response of tree growth to climate has a “lag effect” [39], four climate factors from October of the previous year to September of the current year were selected for correlation analysis with the chronology (Figure 4). The effects of different meteorological factors on the radial growth of Mongolian pine in the study area significantly differed. The radial growth of Mongolian pine was strongly correlated with spring and summer climate but weakly correlated with the climate of other periods. Eight meteorological factors were significantly positively correlated with tree-ring width (p < 0.01), which were the average and minimum temperature in March, May, June, and July of the current year. Nine meteorological factors were positively correlated with tree-ring width (p < 0.05), the maximum temperature in March and May–July, the average temperature in April and August–September, and the minimum temperature in April and August. The minimum temperatures in May, June, and July were the three climate factors most strongly correlated with tree-ring width. There was no significant correlation between precipitation and tree-ring width, indicating that precipitation is not the main climatic factor affecting tree radial growth. The average minimum temperature from May to July is thus the main climate factor affecting the radial growth of Mongolian pine and the most suitable for climate reconstruction.

3.3. Reconstruction and Verification of the Minimum Temperature Sequence

Based on the correlation analysis of tree-ring width chronology and climate factors, the average minimum temperature from May to July of the current year was used for climate reconstruction. Using the standardized chronology as the independent variable and the minimum temperature from 1960 to 2023 as the dependent variable, we established the following linear regression equation:
Tmin5–7 = 1.680 × STD + 4.617
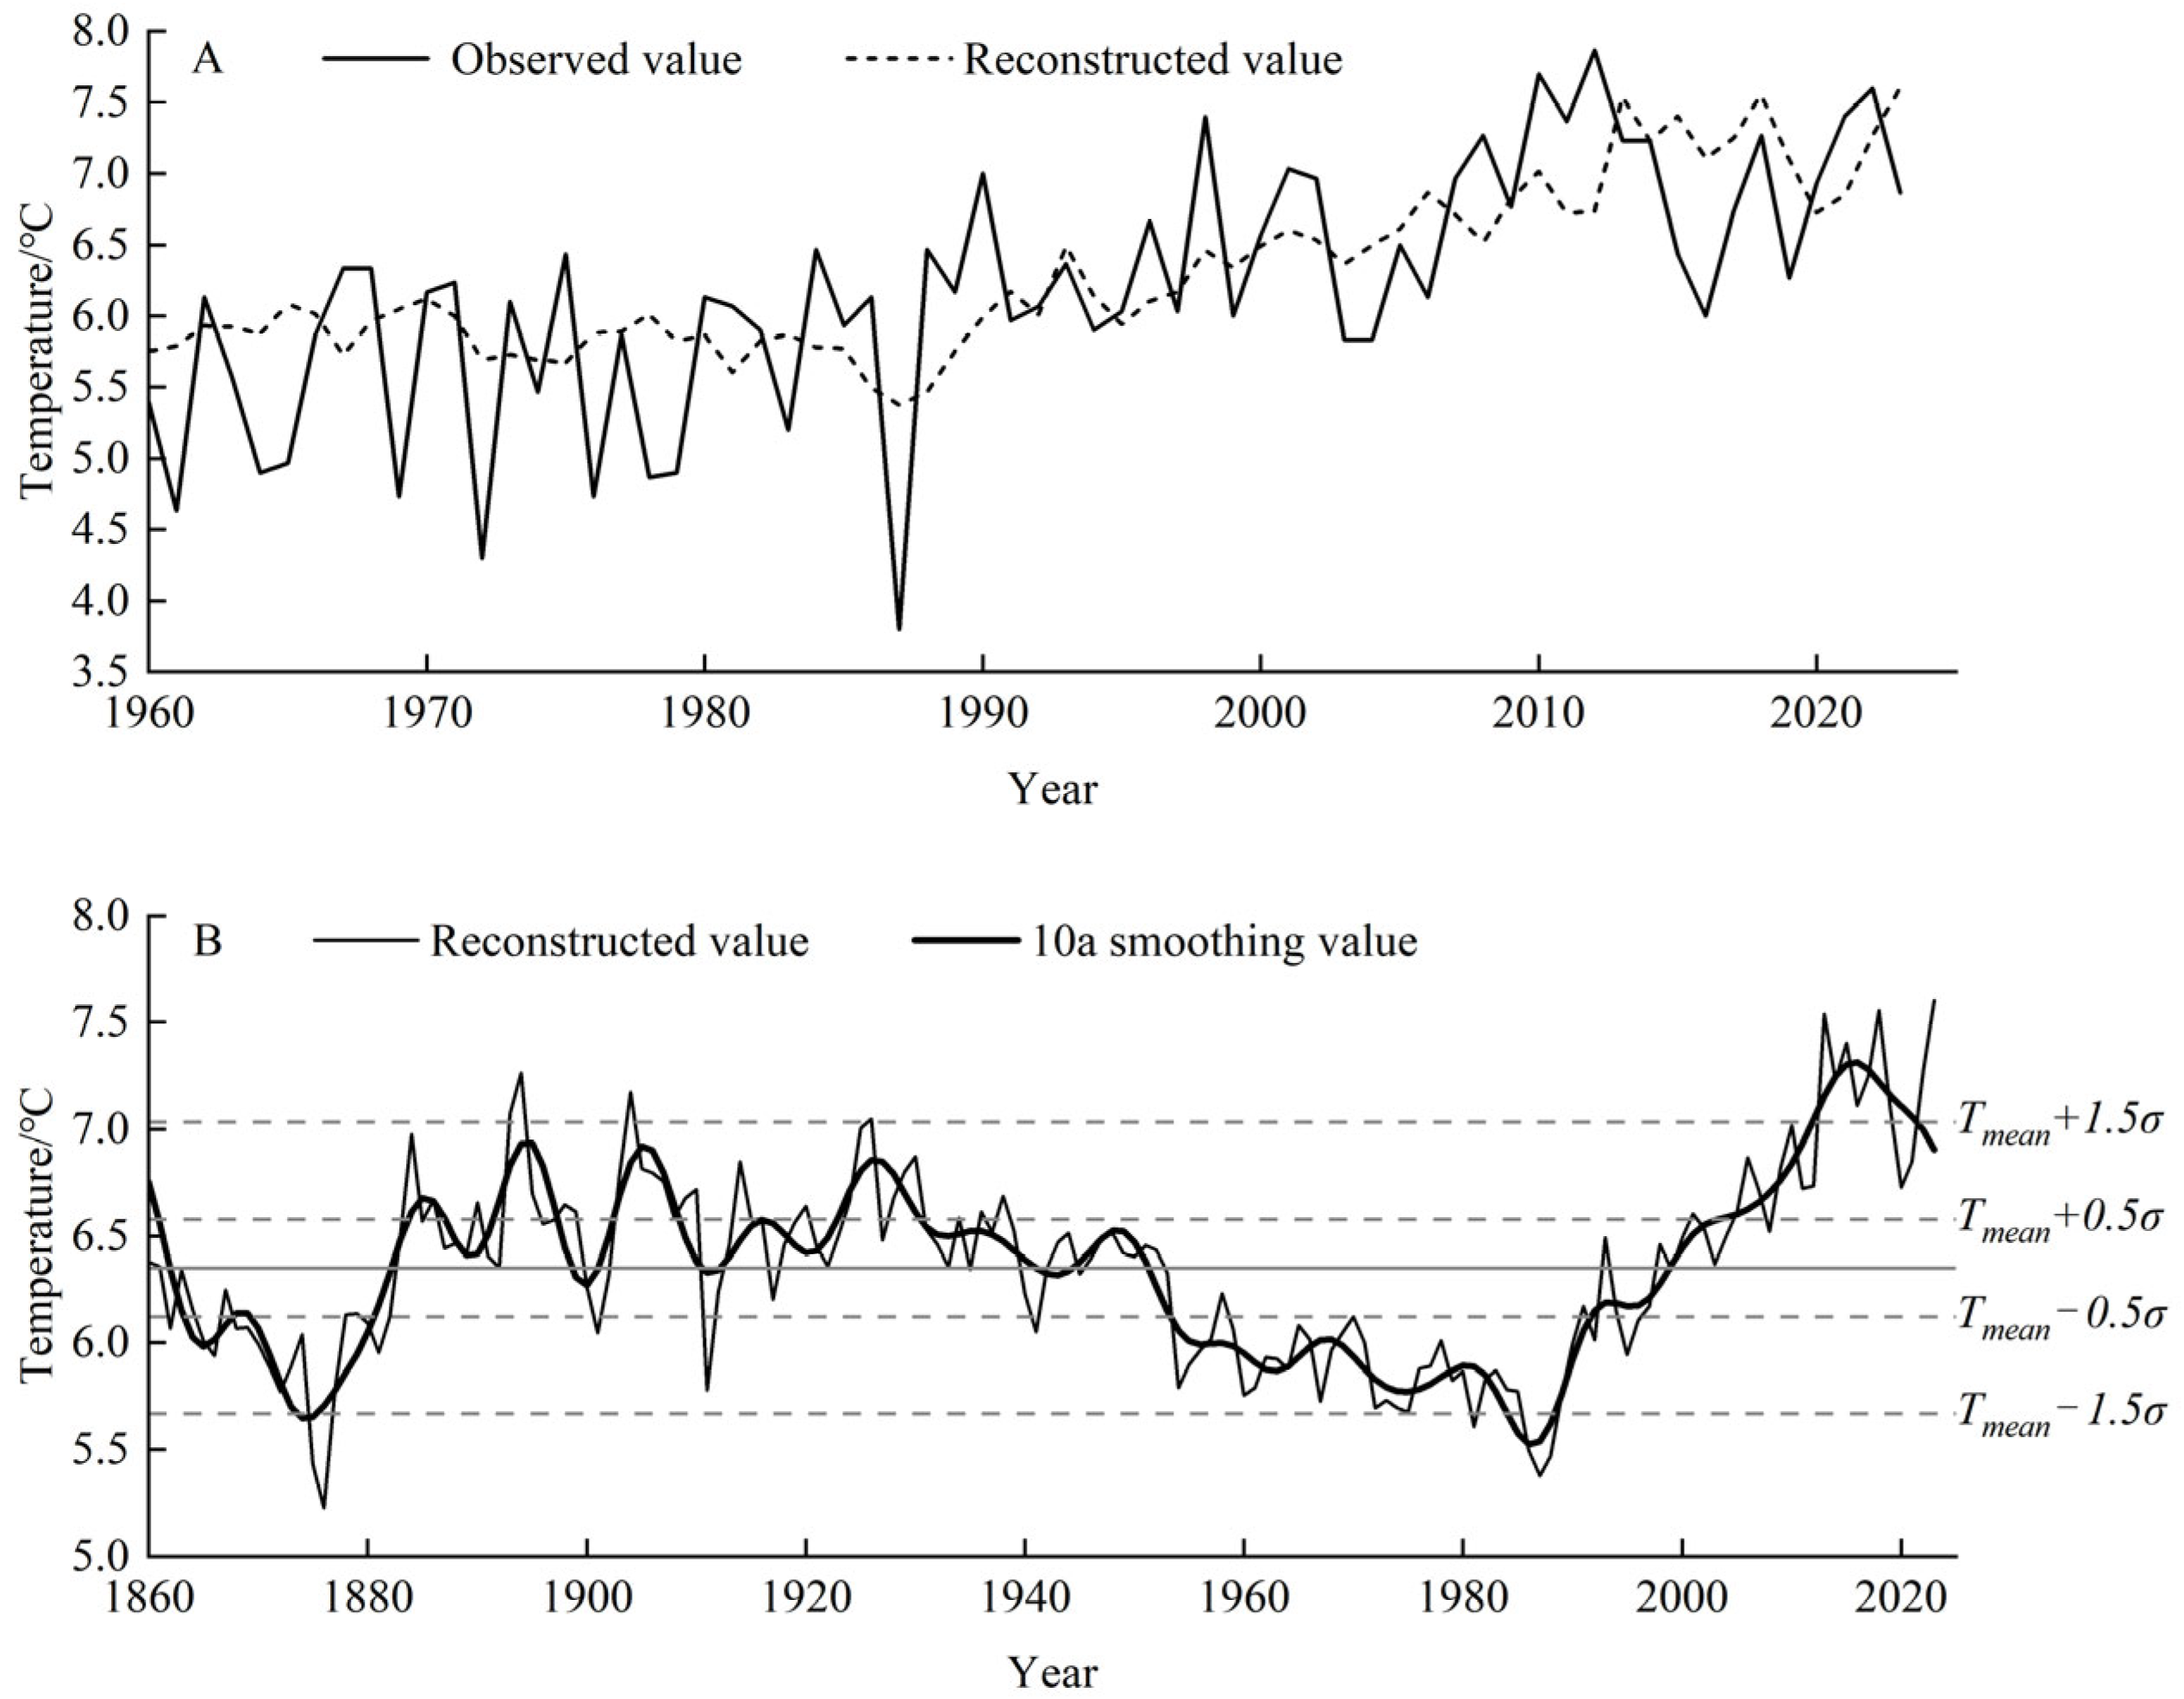
where Tmin5–7 represents the reconstructed average minimum temperature from May to July, and STD is the standardized chronology of tree-ring width. The correlation coefficient of the equation was 0.631, and the equation explained 39.8% of the minimum temperature in the study area from 1960 to 2023 (38.9% after adjusting the degrees of freedom); the F-test value was 41.058 at a significance level of 0.01. The leave-one-out method commonly used in dendrochronology research was used to test the reconstructed sequence, and the test results shown in Table 2 were obtained. The RE in the test results was greater than 0, which indicates that the reconstruction equation was robust; the sign test results showed that the reconstructed sequence was highly consistent with the original minimum temperature sequence; the results of the t-test and F-test both showed that the reconstructed sequence was of high quality and could be used to represent changes in historical minimum temperature in the study area [40]. Figure 5A shows the comparison between the reconstructed sequence and the observed minimum temperature sequence from May to July from 1960 to 2023. Temporal changes in the two sequences were highly consistent. The reconstructed sequence for the May–July mean minimum temperature in the northern GKM from 1860 to 2023 obtained by the reconstruction equation is shown in Figure 5B.

3.4. Abrupt Climatic Changes in the Reconstructed Sequence

The sliding t-test method was used to test the reconstructed sequence for abrupt climate change. The test results are shown in Table 3. Over the past 164 years, the minimum temperature in the study area has undergone five abrupt changes in 1882, 1932, 1953, 1971, and 1997; abrupt changes from low temperature to high temperature were observed in 1882 and 1997, and abrupt changes from high temperature to low temperature were observed in 1932, 1953, and 1971.
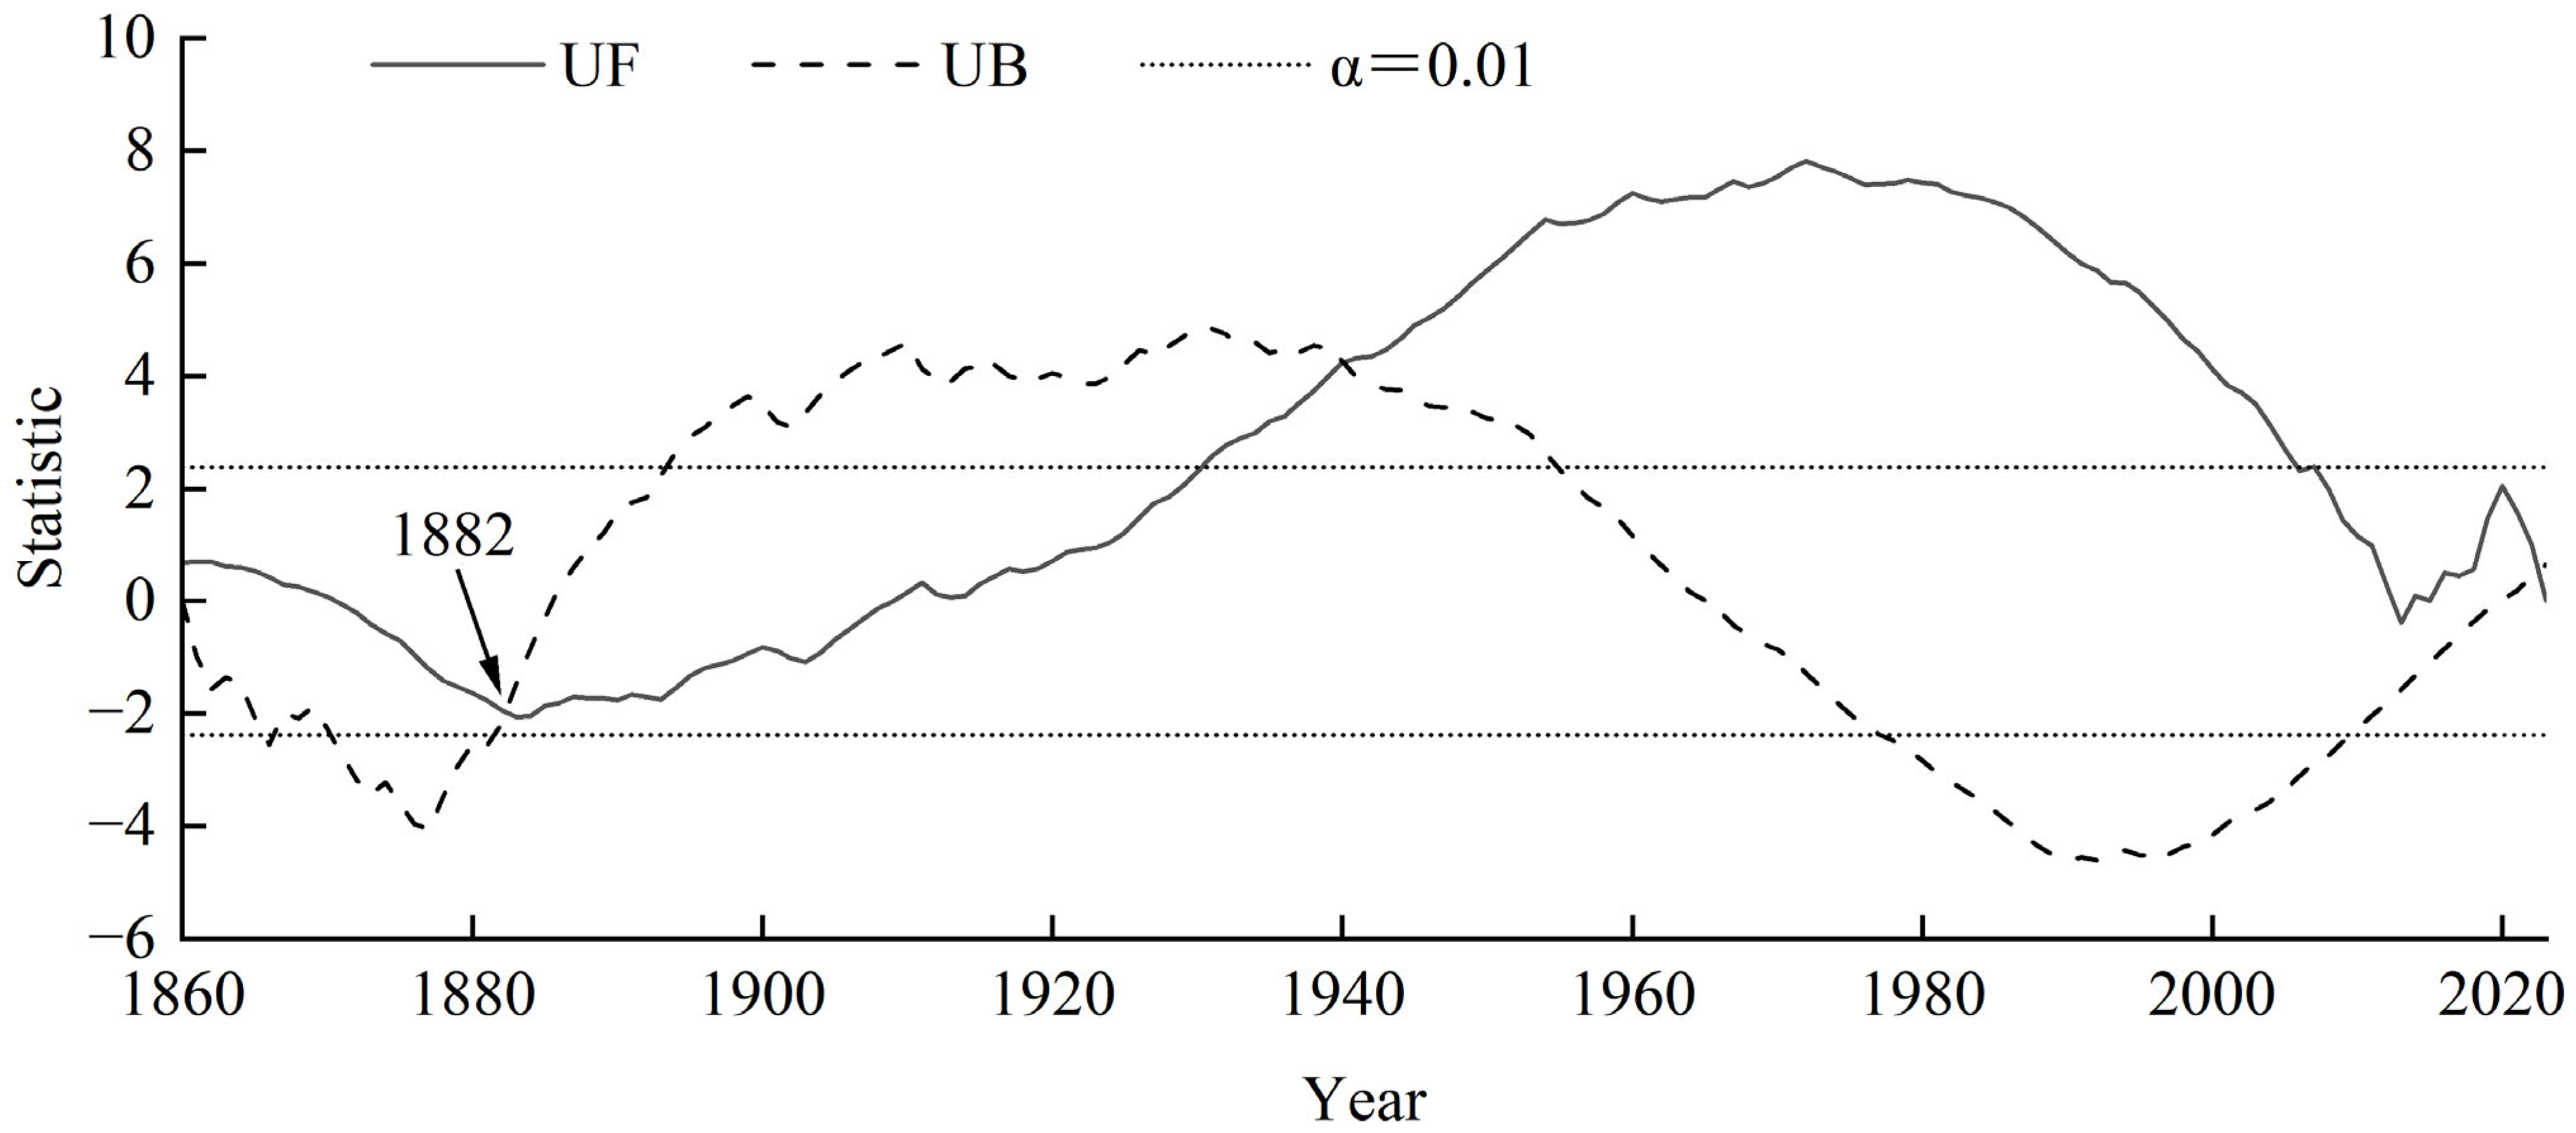
In addition, the Mann–Kendall method was used to test for abrupt changes in the reconstructed sequence. As can be seen from the test results in Figure 6, an abrupt change in the minimum temperature was observed in 1882. The average reconstructed minimum temperature before the abrupt change was 6.00 °C; after the abrupt change, it was 6.41 °C. The minimum temperature increased significantly after the abrupt change. The year of this abrupt change point was consistent with that obtained according to the sliding t-test method, which indicates that the abrupt change in climate that occurred in 1882 was significant.

3.5. Characteristics of the Reconstructed Sequence

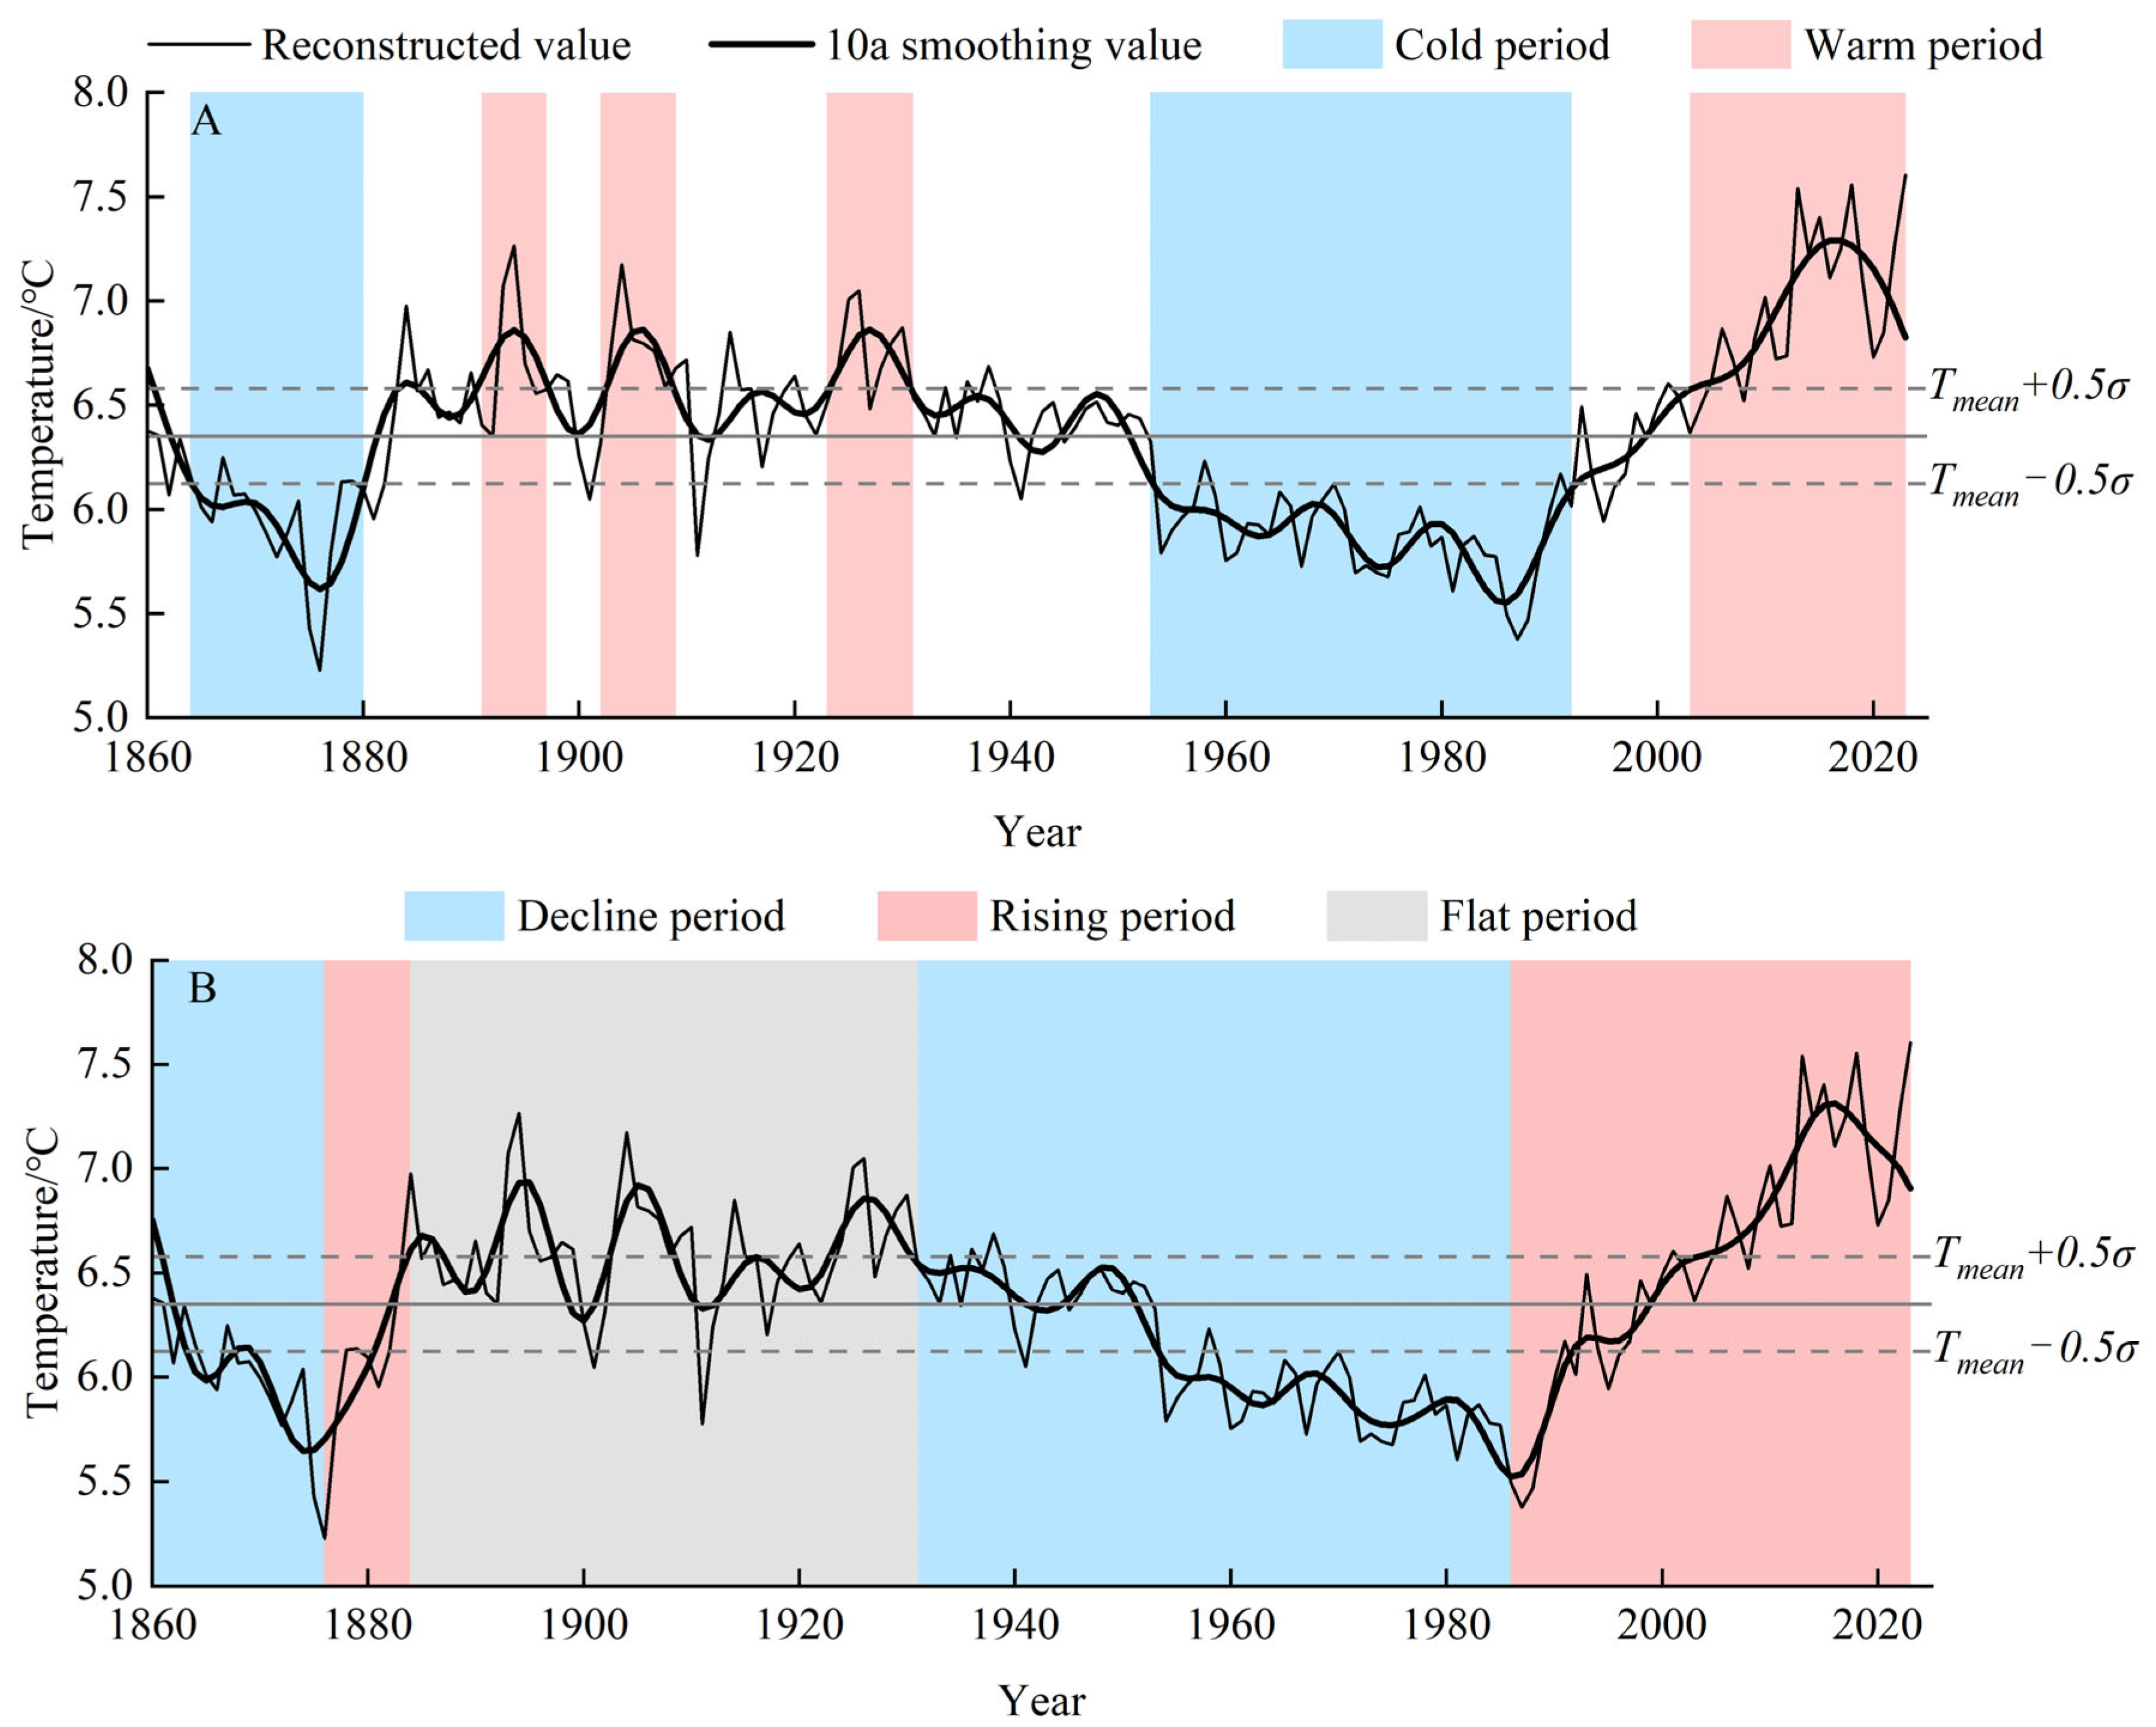
The mean value (Tmean) and standard deviation (σ) of the May–July temperature in the study area during 1860–2023 were 6.29 °C and 0.46 °C, respectively. The highest and lowest values were 7.60 °C in 2023 and 5.23 °C in 1876, respectively. To characterize variation in minimum temperature in the study area over the past 164 years, years with minimum temperature greater than Tmean + 0.5σ (6.58 °C) were defined as high-temperature years, years with minimum temperature less than Tmean − 0.5σ (6.12 °C) were defined as low-temperature years, years with minimum temperature greater than Tmean + 1.5σ (7.03 °C) were defined as extreme warm years, years with minimum temperature less than Tmean −1.5σ (5.67 °C) were defined as extreme cold years, and other years were defined as normal years. Over the past 164 years, 46 years were high-temperature years, and 58 years were low-temperature years, which accounted for 28.0% and 35.4% of the total reconstructed years, respectively. There were 13 extreme warm years and 6 extreme cold years. The specific years of extreme temperatures and their reconstructed minimum temperature values are shown in Table 4.
According to the processed results, the reconstructed sequence can be divided into four warm periods and two cold periods. The four warm periods are 1891–1897, 1902–1909, 1923–1931, and 2003–2023, and the two cold periods are 1864–1880 and 1953–1992. The distribution of warm and cold periods in the reconstructed sequence is shown in Figure 7A.
According to observed changes in the reconstructed sequence, the minimum temperature changes from 1860 to 2023 can be divided into five stages (Figure 7B). The first stage was from 1860 to 1876, during which the minimum temperature continuously and rapidly decreased; the lowest value of minimum temperature was observed in 1876. The second stage was 1877–1884; the minimum temperature changed rapidly from cold to warm, the intensity of the change peaked during this period, and the abrupt change in temperature occurred in 1882. The third stage was from 1885 to 1931, during which the minimum temperature basically stayed near the boundary of the temperatures observed during the warm period and only fluctuated slightly. The fourth stage was from 1932 to 1986; during this period, the minimum temperature slowly decreased for 55 years after an abrupt change in 1932. This was also the longest period, accounting for 33.5% of the total sequence. The fifth stage was 1987–2023, when the minimum temperature gradually increased under global warming; the extremely high-temperature years began to become more frequent and reached their maximum value in 2023.

3.6. Periodicity of the Reconstructed Sequence

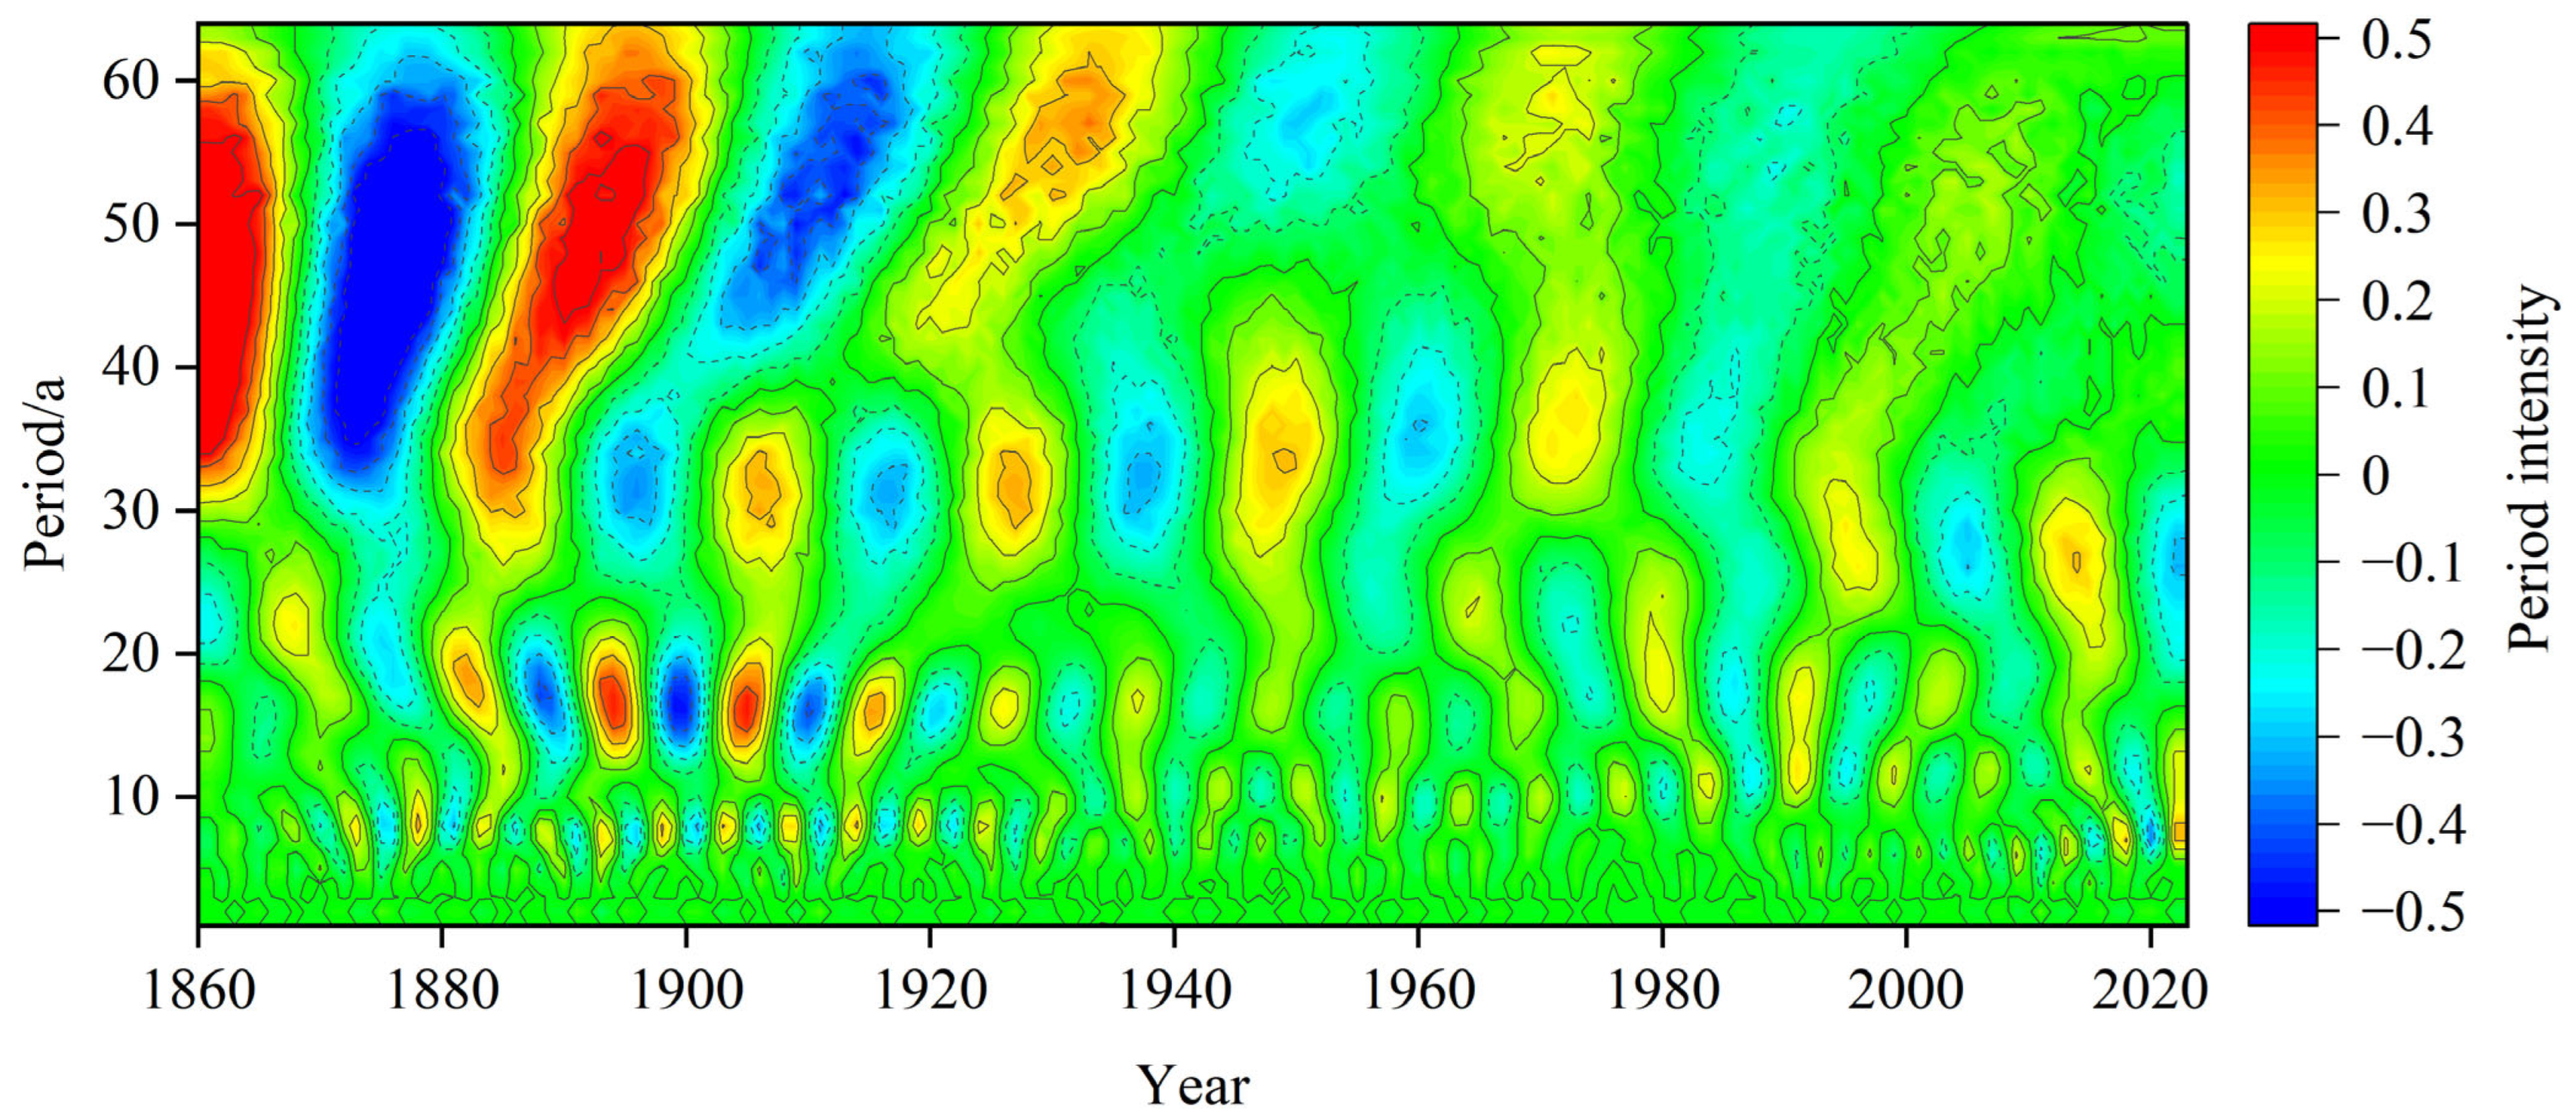
Multi-window spectrum analysis and wavelet analysis were carried out to investigate periodic changes in the reconstructed minimum temperature sequence. The results of the multi-window spectrum analysis are shown in Figure 8. The reconstructed sequence has significant quasi-periodic changes of 2.2a, 2.7a, 3.2–3.3a, 4.0–4.1a, 4.7–5.3a, 11a, and 39a (p < 0.05), and the periodic changes of 3.2–3.3a and 4.7–5.3a were the most significant (p < 0.01). The results of the wavelet analysis are shown in Figure 9. In Figure 9, the solid line indicates temperature increases, and the dashed line indicates temperature decreases; if the color remains darker over a certain period, it indicates that the signal component of the corresponding frequency is dominant during that period, meaning the sequence exhibits the corresponding periodic characteristics. The reconstructed sequence shows 8a, 16–18a, 33–35a, and 52a periodicities over the past 164 years, and the periodic fluctuations of 8a and 33–35a covered the entire period of the reconstructed sequence. The intensity of the 8a cycles was weak from 1960 to 2000, and the intensity of the 33–35a cycle gradually decreased with the years in the sequence. Cycles 16–18a and 52a were both strong in the first half of the sequence and began to weaken around 1920. Alternating positive and negative oscillation centers were observed at different scales of the reconstructed minimum temperature sequence, with significant interdecadal fluctuations. Both sets of analysis results indicate that the reconstructed sequence exhibits obvious periodic characteristics.

3.7. Spatial Correlations of the Reconstructed Sequence

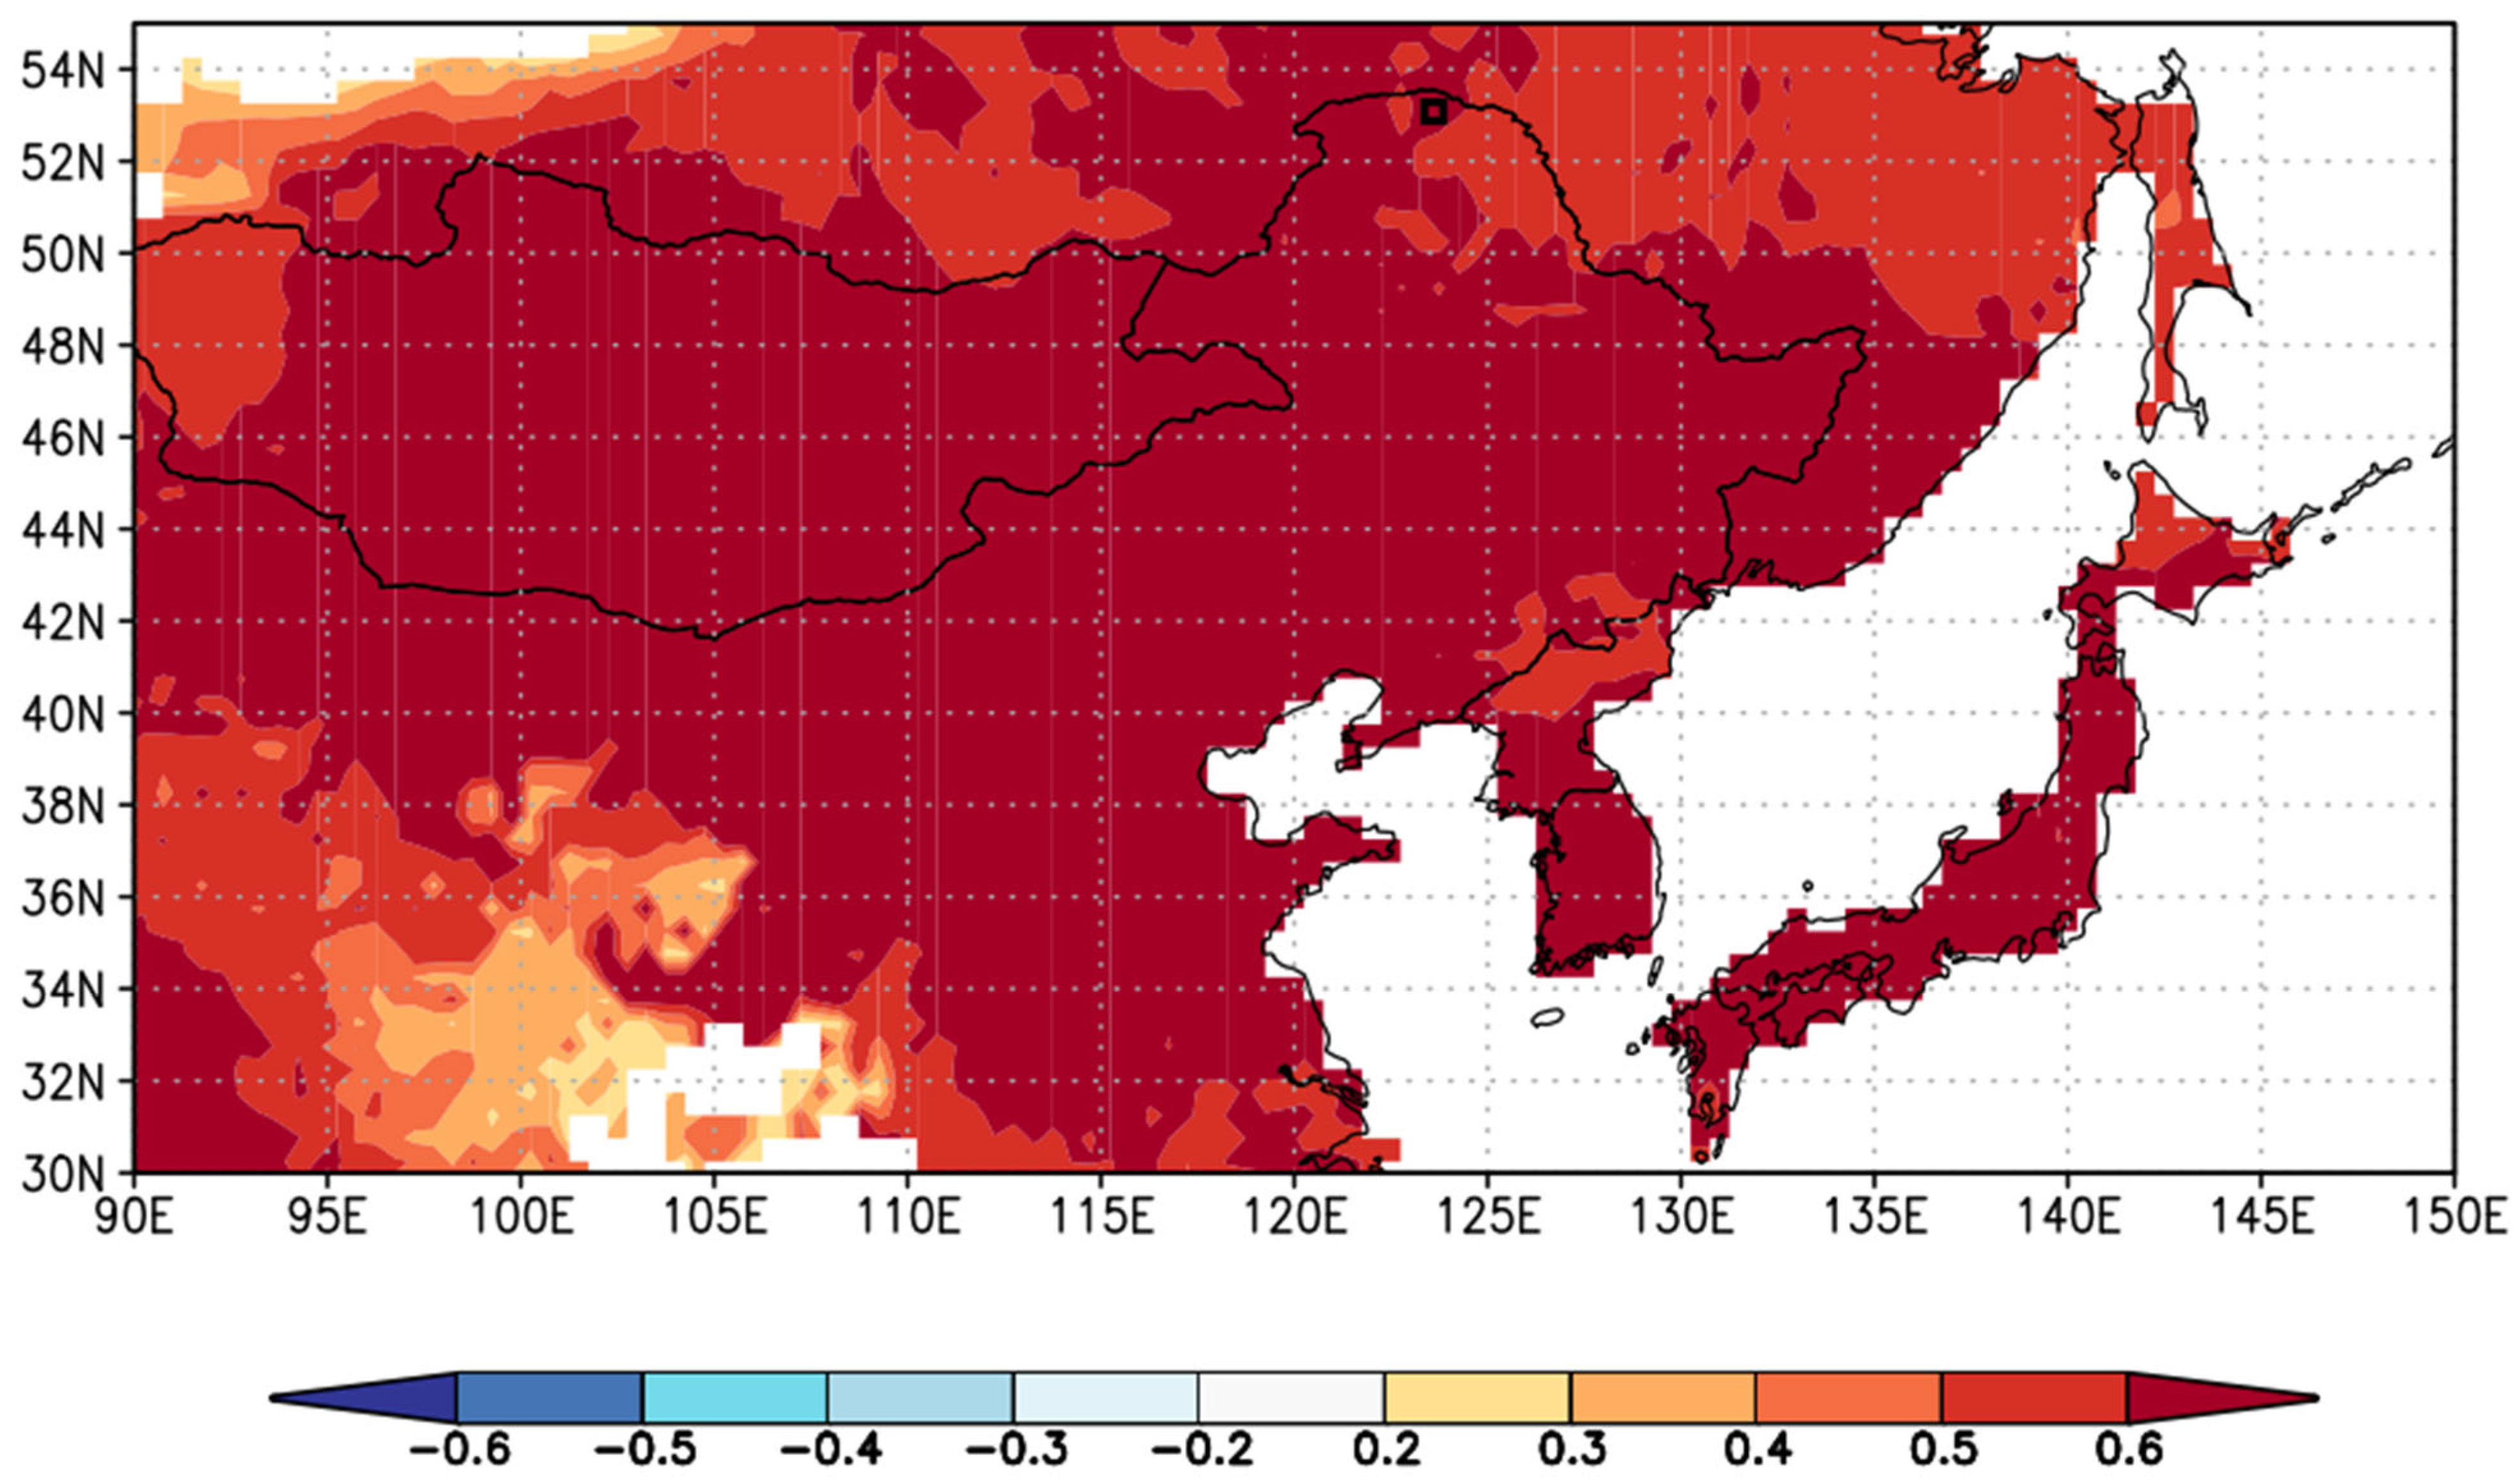
To determine whether the reconstructed sequence represents a wide range of minimum temperature changes, a spatial correlation analysis between the reconstructed minimum temperature results and the minimum temperature data of the CRU TS 4.08 at a 0.5° × 0.5° resolution in the same period was conducted; the results are shown in Figure 10. The reconstructed sequence was correlated with the grid minimum temperature data over a large range, and the correlations between these two datasets were significant in northeastern China, the southern part of the Russian Far East, Mongolia, and most parts of Japan, indicating that the reconstructed sequence can accurately reflect minimum temperature variation over a large range of regions around the study area.

4. Discussion

4.1. Response of Tree Radial Growth to Climatic Factors

Previous studies have shown that temperature is the main climate factor affecting the radial growth of Mongolian pine [21,41,42]. The radial growth of Mongolian pine was significantly positively correlated with the average and minimum temperature from May to July of the current year. May coincides with the early growth stage of Mongolian pine, high temperatures melt snow rapidly, increase the soil temperature and water content, and accelerate the growth of wood cells [43]. June to July coincides with the peak period of tree growth. During this period, high temperatures are conducive to the physiological activities of trees, such as photosynthesis, respiration, cell division, and nutrient absorption, which accelerates tree growth. These patterns are especially pronounced in May–July when tree growth is rapid [44]. In the study regions from May to July, low nighttime temperatures often occur. These can inhibit tree roots’ ability to absorb water and nutrients, reduce photosynthetic efficiency, and decrease the activity of related enzymes. A higher minimum temperature alleviates this inhibition, enabling roots to function normally and enzyme activity to recover—thus providing basic conditions for radial growth. Meanwhile, it reduces trees’ energy consumption for cold resistance, allowing more carbohydrates to be allocated to the trunk cambium and accelerating the accumulation of substances necessary for radial growth. Additionally, a higher minimum temperature extends the effective growth period of trees, preventing low temperatures from prematurely terminating cambial activity, prolonging the tree’s growth window, and ultimately enhancing radial growth [45,46]. Low temperatures can inhibit the activity of photosynthetic enzymes, reduce CO2 fixation efficiency, and even damage chloroplast structure or induce stomatal closure—thus limiting photosynthesis. The division and differentiation of cambial cells rely on a specific temperature threshold. Low temperatures directly inhibit cell division, delay cambial cell proliferation, and result in slow or even stagnant tree growth. Soil thawing requires an ambient temperature above 0 °C. At low temperatures, delayed soil thawing can lead to insufficient water uptake by tree roots, exacerbating water stress during photosynthesis, and the inadequate supply of photosynthetic products limits the energy and materials required for cambial activity [47,48].
In addition, the radial growth of Mongolian pine was significantly positively correlated with the average and minimum temperature in March; higher temperatures in March end dormancy and initiate physiological activities in the cambium of Mongolian pine, which allows more nutrients to be preserved in the body of trees. This is conducive to the growth of trees in the subsequent growing period (April to September) and helps extend the growing period [49]. High temperatures have been shown to promote the radial growth of trees during the growing period in tree-ring studies in other areas such as the Altai Mountains [50], Tianshan Mountains [51], and Lesser Khingan Mountains [52]. The correlation results also showed that the radial growth of Mongolian pine was more strongly correlated with climate factors in the growing period than in the non-growing period; during the non-growing period, trees become dormant, and the efficiency of various physiological activities decreases. This results in the near cessation of growth, and excessively low temperatures lead to decreases in the sensitivity of trees to climate, which makes it difficult for them to respond to relatively subtle climate changes [48,53]. In our study, the responses of the radial growth of Mongolian pine to climate factors were consistent with our understanding of tree physiology. The results of the analysis also help clarify the mechanism by which climate change affects the radial growth of Mongolian pine.

4.2. Comparison with Other Reconstructed Results and Historical Events

To further verify this conclusion, a comparative analysis of the reconstructed sequence of minimum temperature from 1812 to 2020 was analyzed in the Mangui area near the study area [54]. Figure 11 shows the degree of fit between the reconstructed sequence in the Mangui area and the warm and cold periods in this study. The reconstructed results in the Mangui area were consistent with the reconstructed results in this study, which further indicates that the reconstructed minimum temperature sequence in this study can be used to characterize historical changes in minimum temperature in nearby areas.
Comparison of the reconstructed results and “China Meteorological Disasters Encyclopedia—Heilongjiang Volume” revealed that multiple years in the two cold periods of the reconstructed sequence were consistent with the timing of low-temperature frosts. For example, Meergen (now Nenjiang City) experienced frost disasters in 1875 and 1878, which resulted in serious grain reductions. In June 1965, seven counties in the Heihe area had different degrees of cold damage, and the affected area reached approximately 16,000 hectares. At the end of May 1974, there was a large-scale frost disaster in the Heilongjiang province, and more than 600,000 hectares of soybeans and corn were frozen. Most of the low-temperature disasters recorded in the major meteorological disasters occurred in the cold period of the reconstructed sequence, which indicates that the climate information of the reconstructed sequence was consistent with the climate information recorded in the historical data. This indicates that it could be used to represent changes in minimum temperature in the larger surrounding area.

4.3. Drivers of Climate Change

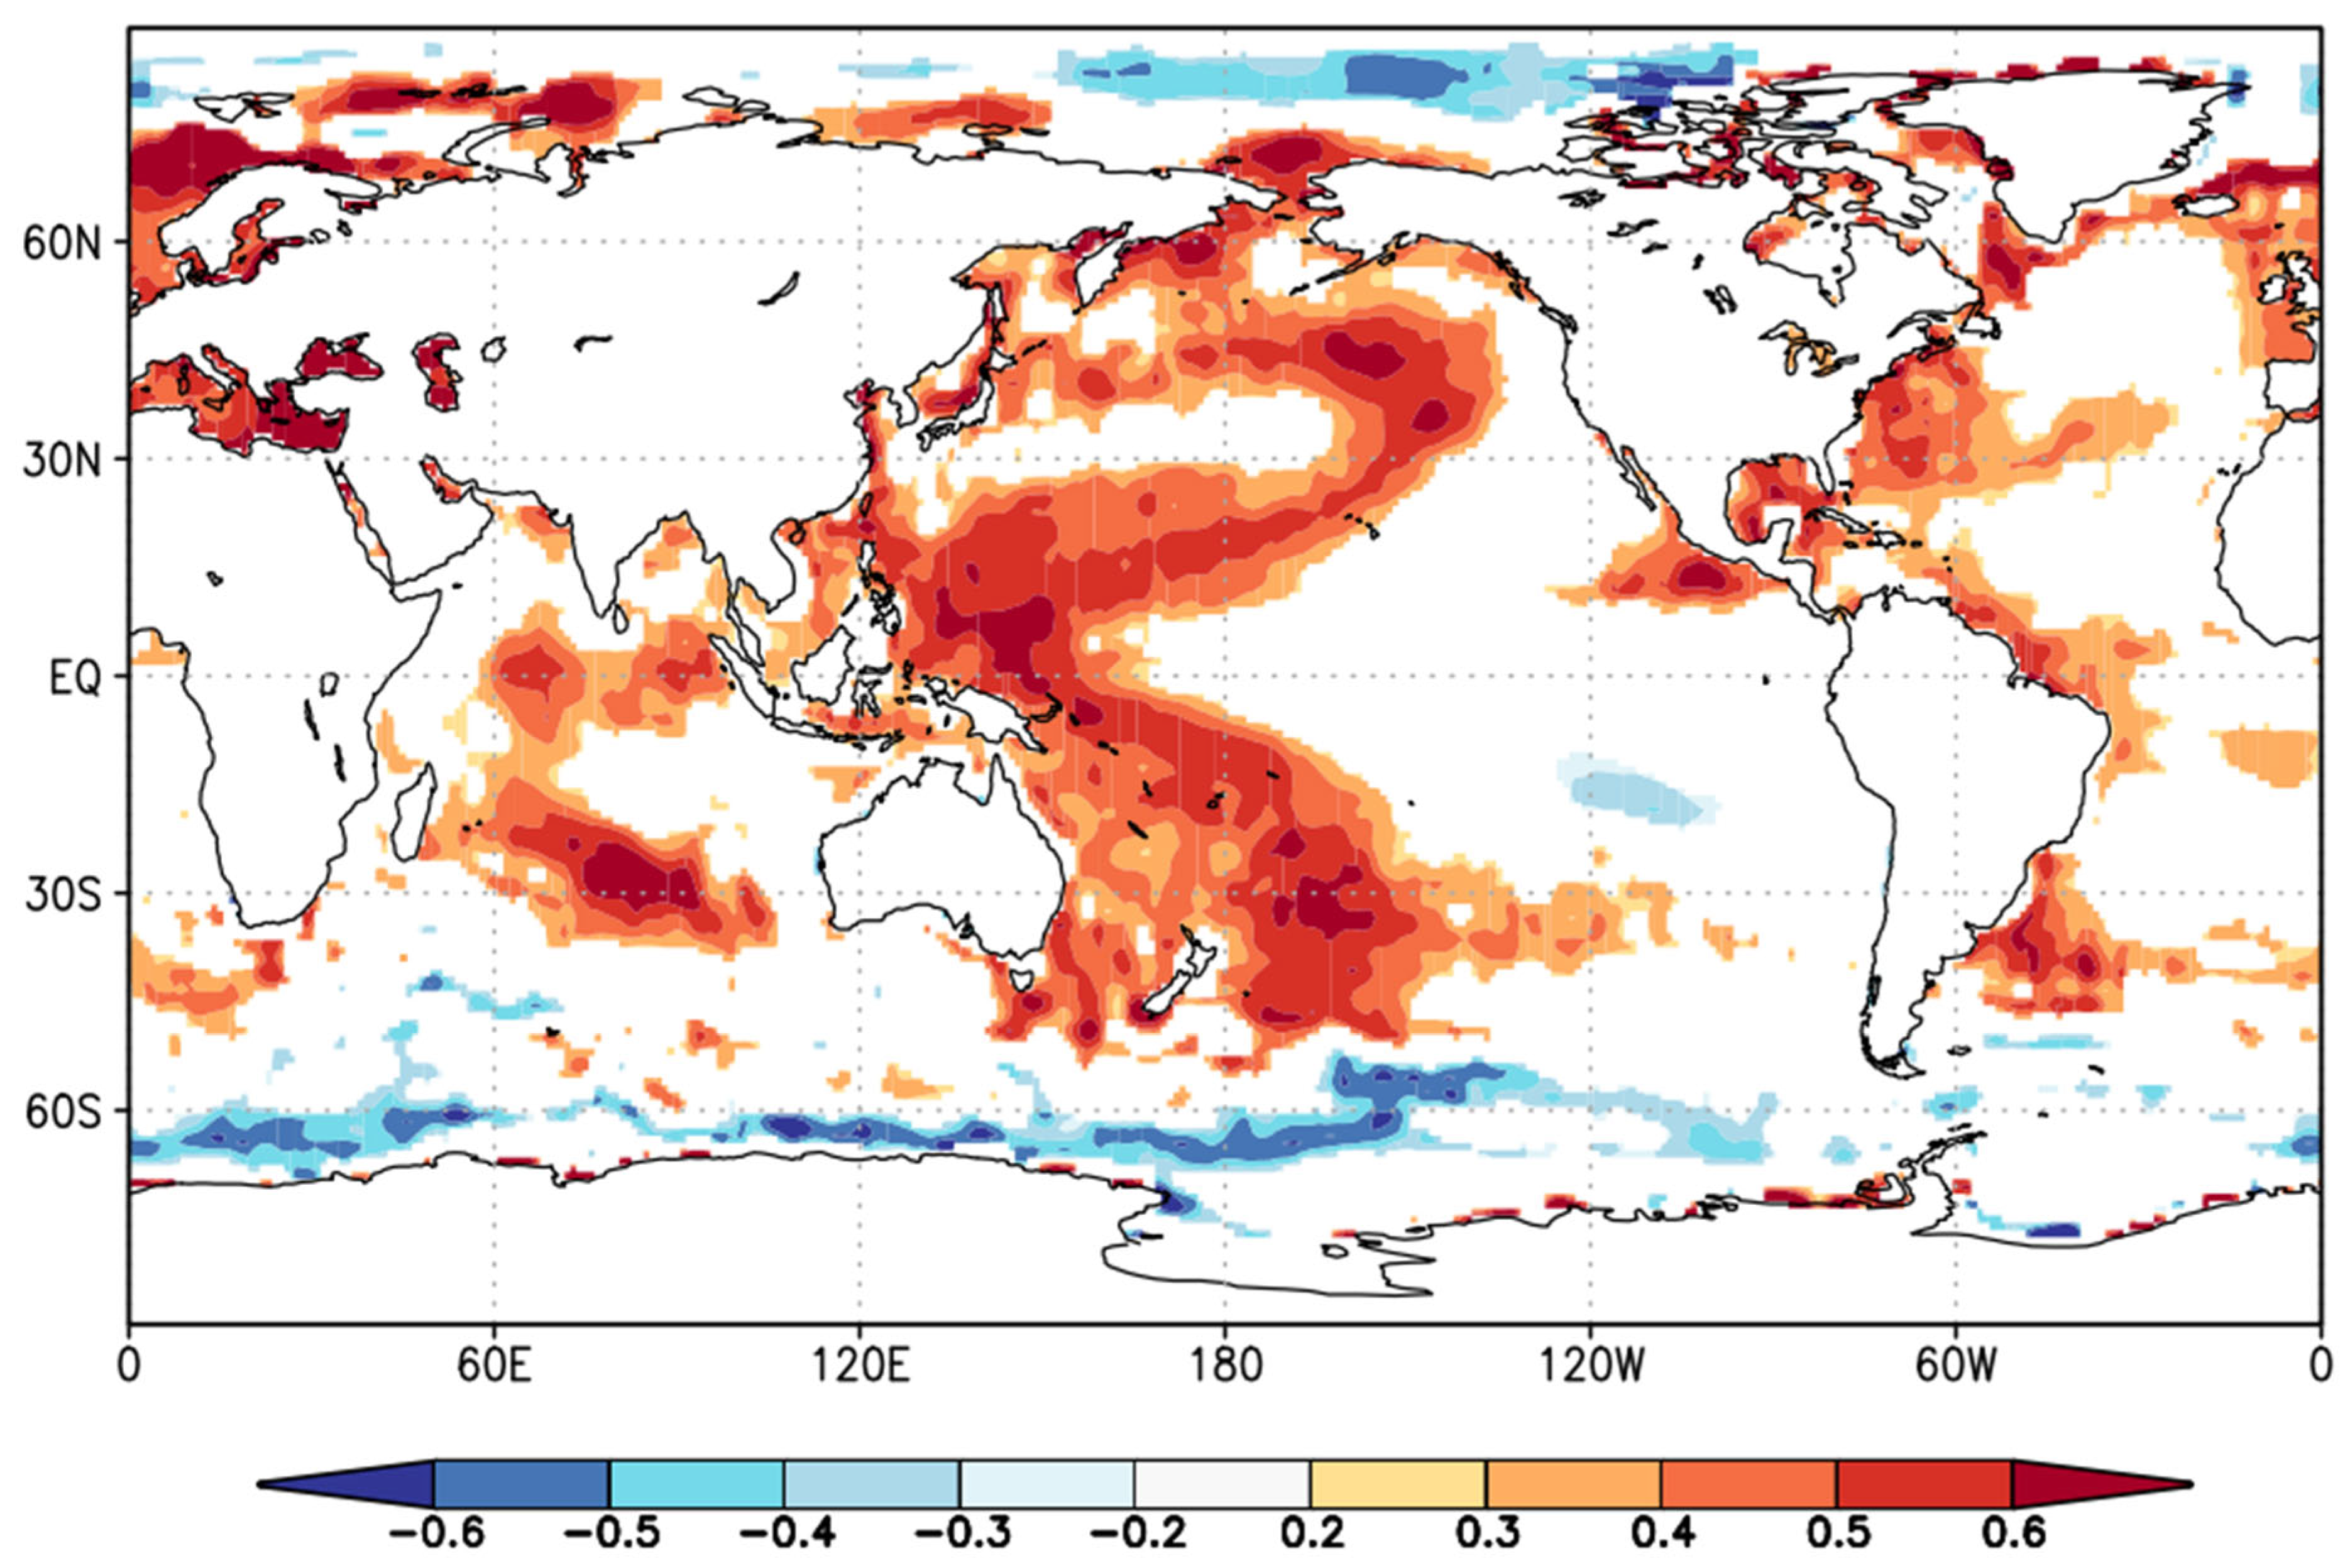
Multi-window spectrum analysis results showed that the reconstructed minimum temperature sequence exhibited significant periodicity, the 2.2–5.3a period was within the range of the ENSO 2–7a period [19], and the 11a period was consistent with the known periodicity in sunspot activity [55]. This indicates that the variation in the minimum temperature might be regulated by ENSO and sunspot activity. The 52a period in the wavelet analysis results may be related to the PDO and the Atlantic Multidecadal Oscillation (AMO) [56]. To clarify the relationship between the minimum temperature change and ocean-atmospheric climate change, spatial correlation analysis was performed between the reconstructed sequences and sea surface temperature (SST) between 1960 and 2023 using KNMI Climate Explorer. The results are shown in Figure 12. During 1960–2023, changes in minimum temperature in the study area were closely related to changes in marine air temperature in the western Pacific Ocean (p < 0.05). When the marine air temperature in the western Pacific Ocean rises, the minimum temperature in the study area also increases, which indicates that PDO is a key factor affecting changes in minimum temperature in the northern GKM. Previous studies have shown that periodic signals of ENSO and PDO are widespread in tree rings in the GKM [57,58], and the two have affected the climate in the GKM by regulating the Asian summer monsoon [59]. However, due to the complexity of atmospheric circulation, additional studies are needed to distinguish the specific role of the two in influencing climate.

4.4. Limitations and Prospects

This study employed the negative exponential function method to detrend the tree-ring width chronology. This approach fits the growth trend of each sequence via the ratio method, bringing the sequence closer to the actual ring width growth curve. However, it may introduce a limitation in trend fitting: it cannot effectively distinguish between biological and climate signals, potentially leading to the incorrect fitting of climate signals. Nevertheless, compared with other detrending methods, the negative exponential function method exhibits higher sensitivity to climate responses and is more suitable for dendrochronological studies [60].
This study has certain limitations. First, due to various factors, the altitude, slope, aspect, tree age, and other conditions of different sampling points cannot be fully consistent, which may introduce certain errors into the research results due to the interference of confounding factors. Second, in the research on the correlation between tree growth and climate factors, only tree ring width was selected as the research indicator, resulting in a lack of multi-dimensional analysis. In subsequent research, efforts should be made to improve the consistency of other relevant factors influencing tree growth. Meanwhile, parameters such as tree ring earlywood width, latewood width, density, and grayscale can be measured and analyzed to provide a more comprehensive interpretation of the relationship between tree radial growth and climate factors, thereby reconstructing more reliable historical climate data. In addition, this study employed linear regression equations for reconstruction, assuming a linear correlation between the independent and dependent variables. However, the relationship between tree growth and temperature is generally not a standard linear relationship; the extreme climate data can significantly bias the regression line, thereby reducing the accuracy and stability of the reconstruction. Linear regression requires independence among independent variables. If the dependent variable is influenced by multiple factors, this may result in unstable estimation of regression coefficients, making it challenging to identify the true impact of individual variables. Additionally, linear regression may overlook interactions between variables—for instance, temperature and precipitation jointly affecting tree growth—by assuming that independent variables act independently and thus failing to capture composite effects [61]. In future research, nonlinear regression models may be employed to reconstruct climate series, thereby enhancing the reliability of the reconstruction results.

5. Conclusions

In this study, the standardized chronology of tree-ring width of Mongolian pine was used to reconstruct the mean minimum temperature change from May to July in the northern GKM since 1860. Over the past 164 years, there were four warm periods and two cold periods in the study area. The warm periods were 1891–1897, 1902–1909, 1923–1931, and 2003–2023, and the cold periods were 1864–1880 and 1953–1992. Changes in minimum temperature could be divided into five stages: “declining, rising, flattening, declining, and rising.” The minimum temperature change in the reconstructed sequence was consistent with historical events and reconstructed results in nearby areas. There were 2.2–5.3a, 11a, and 52a cycles in the reconstructed minimum temperature sequence, which were related to sunspot activity as well as ocean temperature fluctuations including ENSO and PDO. Overall, we determined the characteristics of historical climate change in the northern GKM since 1860. Our findings enhance the understanding of patterns of regional climate change and will aid subsequent studies.

Author Contributions

Conceptualization, J.X. and D.Z.; methodology, J.X. and Z.W.; software, J.X., X.L. and X.W.; validation, Z.W. and D.Z.; formal analysis, J.X.; investigation, J.X.; resources, D.Z.; data curation, B.D., K.S., Y.X. and Z.L.; writing—original draft preparation, J.X.; writing—review and editing, J.X., Z.W. and D.Z.; project administration, J.X. and D.Z. All authors have read and agreed to the published version of the manuscript.

Funding

This research was funded by the General Program of the National Natural Science Foundation of China (Project No. 42571137) and the Natural Science Foundation of Heilongjiang Province of China (No. TD2023D005).

Data Availability Statement

The data supporting this study are not publicly available. If necessary, please contact the corresponding author.

Acknowledgments

We would like to thank all who have provided help and support for this article.

Conflicts of Interest

The authors declare no conflicts of interest, financial or otherwise.

References

  1. Doran, R.; Ogunbode, C.A.; Böhm, G.; Gregersen, T. Exposure to and learning from the IPCC special report on 1.5 °C global warming, and public support for climate protests and mitigation policies. Npj Clim. Action. 2023, 2, 11. [Google Scholar] [CrossRef]
  2. Paris Agreement. Int. Leg. Mater. 2016, 55, 743. [CrossRef]
  3. Ripple, W.J.; Wolf, C.; Gregg, J.W.; Rockström, J.; Mann, M.E.; Oreskes, N.; Lenton, T.M.; Rahmstorf, S.; Newsome, T.M.; Xu, C.; et al. The 2024 state of the climate report: Perilous times on planet Earth. BioScience 2024, 74, 812–824. [Google Scholar] [CrossRef]
  4. Lu, X.; Jiang, Y. Advancements in studying the effects of climate change on forest ecosystems (No. 4). Resour. Econ. Res. Board 2023, 3, 151–177. [Google Scholar] [CrossRef]
  5. Zhao, Y. Vegetation and climate reconstructions on different time scales in China: A review of Chinese palynological research. Veg. Hist. Archaeobotany 2018, 27, 381–392. [Google Scholar] [CrossRef]
  6. Caetano-Andrade, V.L.; Clement, C.R.; Weigel, D.; Trumbore, S.; Boivin, N.; Schöngart, J.; Roberts, P. Tropical Trees as Time Capsules of Anthropogenic Activity. Trends Plant Sci. 2020, 25, 369–380. [Google Scholar] [CrossRef]
  7. Wang, Y.; Li, M. Research progress of dry-wet climate reconstruction by tree ring in China. Prog. Geogr. 2016, 35, 1397–1410. [Google Scholar] [CrossRef]
  8. Ren, M.; Liu, Y.; Cai, Q.; Li, Q.; Song, H.; Sun, C. Climate warming is significantly influenced by rising summer maximum temperatures: Insights from tree-ring evidence of the Western Tianshan Mountains, China. J. For. Res. 2024, 35, 63. [Google Scholar] [CrossRef]
  9. Jiang, S.; Liang, H.; Zhou, P.; Wang, Z.; Zhu, H.; Kang, J.; Huang, J.-G. Spatial and temporal differences in the response of Larix sibirica to climate change in the central Altai Mountains. Dendrochronologia 2021, 67, 125827. [Google Scholar] [CrossRef]
  10. Chen, F.; Gagen, M.H.; Zhang, H.; Chen, Y.; Fan, Z.; Chen, F. Warm season temperature in the Qinling Mountains (north-central China) since 1740 CE recorded by tree-ring maximum latewood density of Shensi fir. Clim. Dyn. 2021, 57, 2653–2667. [Google Scholar] [CrossRef]
  11. Wu, X.; Jiao, L.; Du, D.; Xue, R.; Wei, M.; Zhang, P. Elevation response of above-ground net primary productivity for Picea crassifolia to climate change in Qilian Mountains of Northwest China based on tree rings. J. Geogr. Sci. 2024, 34, 146–164. [Google Scholar] [CrossRef]
  12. Sun, L.; Cai, Y.; Zhou, Y.; Shi, S.; Zhao, Y.; Gunnarson, B.E.; Jaramillo, F. Radial Growth Responses to Climate of Pinus yunnanensis at Low Elevations of the Hengduan Mountains, China. Forests 2020, 11, 1066. [Google Scholar] [CrossRef]
  13. Shi, L.; Liu, H.; Wang, L.; Peng, R.; He, H.; Liang, B.; Cao, J. Transitional responses of tree growth to climate warming at the southernmost margin of high latitudinal permafrost distribution. Sci. Total Environ. 2023, 908, 168503. [Google Scholar] [CrossRef] [PubMed]
  14. Du, B.; Wang, Z.; Li, X.; Zhang, X.; Wang, X.; Zhang, D. Adaptation of Tree Species in the Greater Khingan Range under Climate Change: Ecological Strategy Differences between Larix gmelinii and Quercus mongolica. Forests 2024, 15, 283. [Google Scholar] [CrossRef]
  15. Shah, S.K.; Bhattacharyya, A.; Chaudhary, V. Streamflow reconstruction of Eastern Himalaya River, Lachen ‘Chhu’, North Sikkim, based on tree-ring data of Larix griffithiana from Zemu Glacier basin. Dendrochronologia 2014, 32, 97–106. [Google Scholar] [CrossRef]
  16. Yuan, Y. Variations of the spring precipitation day numbers reconstructed from tree rings in the Urumqi River drainage, Tianshan Mts. Over the last 370 years. Chin. Sci. Bull. 2003, 48, 1507. [Google Scholar] [CrossRef]
  17. Wang, Z.; Zhang, D.; Zhang, T.; Li, X.; Wang, X.; Luo, T.; Zhong, S.; Song, K. Reconstructing the Temperature and Precipitation Changes in the Northern Part of the Greater Khingan Mountains over the Past 210 Years Using Tree Ring Width Data. Forests 2024, 15, 1450. [Google Scholar] [CrossRef]
  18. Yun, R.; Jin, Y.; Li, J.; Chen, Z.; Lyu, Z.; Zhao, Y.; Cui, D. The annual rhythmic differentiation of Populus davidiana growth–climate response under a warming climate in The Greater Hinggan Mountains. Glob. Ecol. Conserv. 2021, 27, e01549. [Google Scholar] [CrossRef]
  19. Jiang, Y.; Wang, Y.; Zhang, J.; Han, S.; Coombs, C.E.O.; Escobedo, M.; Wang, J.; Wang, X.; Hao, L.; Li, G.; et al. Tree-ring reconstruction of June-July mean temperatures in the northern Daxing’an Mountains, China. Geochronometria 2020, 47, 13–22. [Google Scholar] [CrossRef]
  20. Wei, Y.; Ma, Y.; Sun, B.; Zhang, J. Reconstruction of historical runoff in the southern foothills of the Da Hinggan Ling Mountains based on Picea koraiensis. Arid Land Geogr. 2023, 46, 1269–1278. [Google Scholar]
  21. Palombo, C.; Battipaglia, G.; Cherubini, P.; Chirici, G.; Garfì, V.; Lasserre, B.; Lombardi, F.; Marchetti, M.; Tognetti, R. Warming-related growth responses at the southern limit distribution of mountain pine (Pinus mugo Turra subsp. Mugo). J. Veg. Sci. 2014, 25, 571–583. [Google Scholar] [CrossRef]
  22. Nagavciuc, V.; Roibu, C.-C.; Ionita, M.; Mursa, A.; Cotos, M.-G.; Popa, I. Different climate response of three tree ring proxies of Pinus sylvestris from the Eastern Carpathians, Romania. Dendrochronologia 2019, 54, 56–63. [Google Scholar] [CrossRef]
  23. Pritzkow, C.; Heinrich, I.; Grudd, H.; Helle, G. Relationship between wood anatomy, tree-ring widths and wood density of Pinus sylvestris L. and climate at high latitudes in northern Sweden. Dendrochronologia 2014, 32, 295–302. [Google Scholar] [CrossRef]
  24. Stokes, M.A. An Introduction to Tree-Ring Dating; University of Arizona Press: Tucson, AZ, USA, 1996. [Google Scholar]
  25. Holmes, R.L. Computer-Assisted Quality Control in Tree-Ring Dating and Measurement. Tree Ring Bull. 1983, 43, 51–57. [Google Scholar]
  26. Copenheaver, C.A.; Zink-Sharp, A. Fundamentals of Tree-Ring Research. Tree-Ring Res. 2014, 70, 161–162. [Google Scholar] [CrossRef]
  27. Warren, W.G.; LeBlanc, D.C. Dynamic standardization of tree-ring series. Can. J. For. Res. 1990, 20, 1422–1431. [Google Scholar] [CrossRef]
  28. Tayyab, M.; Muhammad, S.; Nawaz, H.; Ali, A.; Malik, S.M.; Waheed, M.; Rasool, K.; Khan, M.J.T.; Khan, Z.; Zahid, M. Climatically induced anomalies in tree-ring structure of Abies pindrow (Royal ex D. Don) and Taxus baccata (L.) growing in Hindu-Kush mountainous region of Pakistan. Environ. Res. Commun. 2023, 5, 065002. [Google Scholar] [CrossRef]
  29. Cook, E.R.; Krusic, P.J. Program ARSTAN: A Tree-Ring Standardization Program Based on Detrending and Autoregressive Time Series Modeling, with Interactive Graphics; Lamont-Doherty Earth Observatory, Columbia University: Palisades, NY, USA, 2005. [Google Scholar]
  30. Keyimu, M.; Li, Z.; Zhang, G.; Fan, Z.; Wang, X.; Fu, B. Tree ring–based minimum temperature reconstruction in the central Hengduan Mountains, China. Theor. Appl. Climatol. 2020, 141, 359–370. [Google Scholar] [CrossRef]
  31. Qiao, J.J.; Wang, Y.F.; Sun, Y.J.; Qiu, S.Y.; Xie, Y.H. Tree-ring based June mean temperature reconstruction over the past 140 years in the southern Lesser Khingan Mountains, northeastern China. Acta Ecol. Sin. 2023, 43, 8769–8779. [Google Scholar] [CrossRef]
  32. Jiachuan, W.; Shuheng, L.; Yili, G.; Yijie, H.; Zhonglei, M. Variation of mean maximum temperature from March to April since 1923 in the northern section of Lvliang Mountain recorded by tree rings. Arid Zone Res. 2023, 40, 337–348. [Google Scholar] [CrossRef]
  33. Martínez-Sifuentes, A.R.; Villanueva-Díaz, J.; Trucíos-Caciano, R.; López-Hernández, N.A.; Estrada-Ávalos, J.; Rodríguez-Moreno, V.M. A Reconstruction of May–June Mean Temperature since 1775 for Conchos River Basin, Chihuahua, Mexico, Using Tree-Ring Width. Atmosphere 2024, 15, 808. [Google Scholar] [CrossRef]
  34. Jing, Z.; Long, M.; Tingxi, L.; Bolin, S.; Zixu, Q. Reconstruction of the minimum temperature over the past 202 years based on tree rings of Picea crassifolia in the Helan Mountains. Arid Land Geogr. 2024, 47, 909–921. [Google Scholar]
  35. Wei, F.; Cao, H. Detection of Abrupt Changes and Trend Prediction of the Air Temperature in China, the Northern Hemisphere and the Globe. Chin. J. Atmos. Sci. 1995, 19, 140–148. [Google Scholar]
  36. Zhaopeng, W.; Tongwen, Z.; Yujiang, Y.; Ruibo, Y.; Shulong, Y.; Rui, L.; Shirenna, J.; Dong, G.; Yonghui, W. Comparative analysis of growth characteristics and climate responses in four coniferous tree species of southern Luoxiao Mountains. Chin. J. Plant Ecol. 2021, 45, 1303–1313. [Google Scholar]
  37. Yuan, Q.X.; Yu, S.L.; Jiang, S.X.; Qin, N.S.; Zhang, T.W. Tree-ring reconstruction of March-August drought variability over the past 567 years in the Yajiang region of West Sichuan Plateau, China. Chin. J. Appl. Ecol. 2021, 32, 3627–3635. [Google Scholar] [CrossRef]
  38. Dapao, Y.; Li, Z.; Limin, D.; Qingli, W.; Mingguo, L. Application of dendrochronology in global change research. Chin. J. Ecol. 2023, 6, 91–96. [Google Scholar]
  39. Vaz Monteiro, M.; Levanič, T.; Doick, K.J. Growth rates of common urban trees in five cities in Great Britain: A dendrochronological evaluation with an emphasis on the impact of climate. Urban For. Urban Green. 2017, 22, 11–23. [Google Scholar] [CrossRef]
  40. Junqiang, N.; Yujiang, Y.; Tongwen, Z.; Feng, F.; Ruibo, Z.; Huaming, S.; Shengxia, J. Reconstruction of early summer temperature during 1572—2014 from tree-rings in the Altay Prefecture. Arid Land Geogr. 2021, 44, 27–35. [Google Scholar]
  41. Henttonen, H.M.; Mäkinen, H.; Heiskanen, J.; Peltoniemi, M.; Laurén, A.; Hordo, M. Response of radial increment variation of Scots pine to temperature, precipitation and soil water content along a latitudinal gradient across Finland and Estonia. Agric. For. Meteorol. 2014, 198–199, 294–308. [Google Scholar] [CrossRef]
  42. Liu, Y.L.; Xin, Z.B.; Li, Z.S.; Maierdang Keyimu Yan, T.F. Response of radial growth of Pinus sylvestris var. mongolica to climate factors in Bashang area of Hebei Province. Acta Ecol. Sin. 2022, 42, 1830–1840. [Google Scholar]
  43. Shao, X. Reconstruction of precipitation variation from tree rings in recent 1000 years in Delingha, Qinghai. Sci. China Ser. D 2005, 48, 939. [Google Scholar] [CrossRef]
  44. Zhang, X.; Yang, L.; Liu, X.; Zhang, Q.; WANG, W.; Wang, X.; Wu, G. Study of the difference in climate response of Dahurian Larch and Pinus sylvestris growth in the north Great Higgnan Mountains of permafrost regions, Northeast China. J. Glaciol. Geocryol. 2017, 39, 165–174. [Google Scholar]
  45. Li, P.; Song, H.; Liu, Y.; Zhang, Q.; Fang, C.; Li, Q.; Cai, Q.; Zeng, X.; Ma, Y. Maximum July–August temperatures for the middle of the southern Tien Shan inferred from tree-ring latewood maximum densities. Int. J. Biometeorol. 2023, 67, 321–335. [Google Scholar] [CrossRef]
  46. Li, W.; Jiang, Y.; Dong, M.; Du, E.; Wu, F.; Zhao, S.; Xu, H. Species-specific growth-climate responses of Dahurian larch (Larix gmelinii) and Mongolian pine (Pinus sylvestris var. Mongolica) in the Greater Khingan Range, northeast China. Dendrochronologia 2021, 65, 125803. [Google Scholar] [CrossRef]
  47. Adriana, P.; Ernst, M.; Marieke, M.T.; Thomas, S.; Martin, W.; Juergen, K. Low resistance but high resilience in growth of a major deciduous forest tree (Fagus sylvatica L.) in response to late spring frost in southern Germany. Trees 2017, 31, 743–751. [Google Scholar] [CrossRef]
  48. Susanne, S.; Helena, M.H.; Pekka, N.; Samuli, H.; Tapani, R.; Mauri, T.; Harri, M. Connecting potential frost damage events identified from meteorological records to radial growth variation in Norway spruce and Scots pine. Trees 2017, 31, 2023–2034. [Google Scholar] [CrossRef]
  49. Shang, J.; Shi, Z.; Gao, J.; Xu, L.; Lü, S.; Feng, C.; Wang, L. Response of tree-ring width of Pinus sylvestris var. Mongolica to climate change in Hulunbuir sand land, China. Acta Ecol. Sin. 2012, 32, 1077–1084. [Google Scholar] [CrossRef]
  50. Chen, F.; Yuan, Y.; Wei, W.; Fan, Z.; Zhang, T.; Shang, H.; Zhang, R.; Yu, S.; Ji, C.; Qin, L. Climatic response of ring width and maximum latewood density of Larix sibirica in the Altay Mountains, reveals recent warming trends. Ann. For. Sci. 2012, 69, 723–733. [Google Scholar] [CrossRef]
  51. Fan, Y.; Shang, H.; Wu, Y.; Li, Q. Tree-Ring Width and Carbon Isotope Chronologies Track Temperature, Humidity, and Baseflow in the Tianshan Mountains, Central Asia. Forests 2020, 11, 1308. [Google Scholar] [CrossRef]
  52. Yu, J.; Zhou, G.; Liu, Q. Tree-ring based summer temperature regime reconstruction in XiaoXing Anling Mountains, northeastern China since 1772 CE. Palaeogeogr. Palaeoclimatol. Palaeoecol. 2018, 495, 13–23. [Google Scholar] [CrossRef]
  53. Duan, J.; Zhang, Q.-B.; Lv, L.; Zhang, C. Regional-scale winter-spring temperature variability and chilling damage dynamics over the past two centuries in southeastern China. Clim. Dyn. 2012, 39, 919–928. [Google Scholar] [CrossRef]
  54. Wang, Z.; Zhang, T.; Zhang, D.; Luo, T.; Wang, X.; Li, X.; Mao, H. Responses of Pinus sylvestris var. Mongolica tree ring width to climate factors at different elevations in the northern Greater Khingan Mountains. Dendrochronologia 2024, 83, 126166. [Google Scholar] [CrossRef]
  55. Shi, J.; Jin, Z.; Liu, Q.; Fan, T.; Gao, Z. Sunspot cycles recorded in Eocene lacustrine fine-grained sedimentary rocks in the Bohai Bay Basin, eastern China. Glob. Planet. Change 2021, 205, 103614. [Google Scholar] [CrossRef]
  56. Tei, S.; Yonenobu, H.; Suzuki, S.; Ohyama, M.; Gotanda, K.; Nakagawa, T.; Sugimoto, A. Reconstructed July temperatures since AD 1800, based on a tree-ring chronology network in the Northwest Pacific region, and implied large-scale atmospheric–oceanic interaction. Palaeogeogr. Palaeoclimatol. Palaeoecol. 2015, 435, 203–209. [Google Scholar] [CrossRef]
  57. Jiang, Y.; Liu, C.; Zhang, J.; Han, S.; Coombs, C.E.O.; Wang, X.; Wang, J.; Hao, L.; Dong, S. Tree ring width--based January–March mean minimum temperature reconstruction from Larix gmelinii in the Greater Khingan Mountains, China since AD 1765. Int. J. Climatol. 2021, 41, E842–E854. [Google Scholar] [CrossRef]
  58. Payomrat, P.; Liu, Y.; Pumijumnong, N.; Li, Q.; Song, H. Tree-ring stable carbon isotope-based June–September maximum temperature reconstruction since AD 1788, north-west Thailand. Tellus B Chem. Phys. Meteorol. 2018, 70, 1443655. [Google Scholar] [CrossRef]
  59. Wang, N.; Dee, S.; Hu, J.; Steiger, N.; Thirumalai, K. PDO and AMO Modulation of the ENSO–Asian Summer Monsoon Teleconnection During the Last Millennium. J. Geophys. Res. Atmos. 2024, 129, e2023JD039638. [Google Scholar] [CrossRef]
  60. Peng, Z.; Li, X.; Zhang, R.; Qin, L.; Zhang, H.; Chen, Y.; Liu, R. The response of tree-ring chronologies of Schrenk spruce (Picea schrenkiana Fisch. et Mey.) to climate change at high-and low-elevations of the eastern Tianshan Mountains, Xinjiang, using different detrending methods. Acta Ecol. Sin. 2019, 39, 1595–1604. [Google Scholar] [CrossRef]
  61. Sahar, H.M.; Mahmoud, B.; Pete, B.; Mansour, G. Uncertainty analysis of linear and non-linear regression models in the modeling of water quality in the Caspian Sea basin: Application of Monte-Carlo method. Ecol. Indic. 2025, 170, 112979. [Google Scholar] [CrossRef]
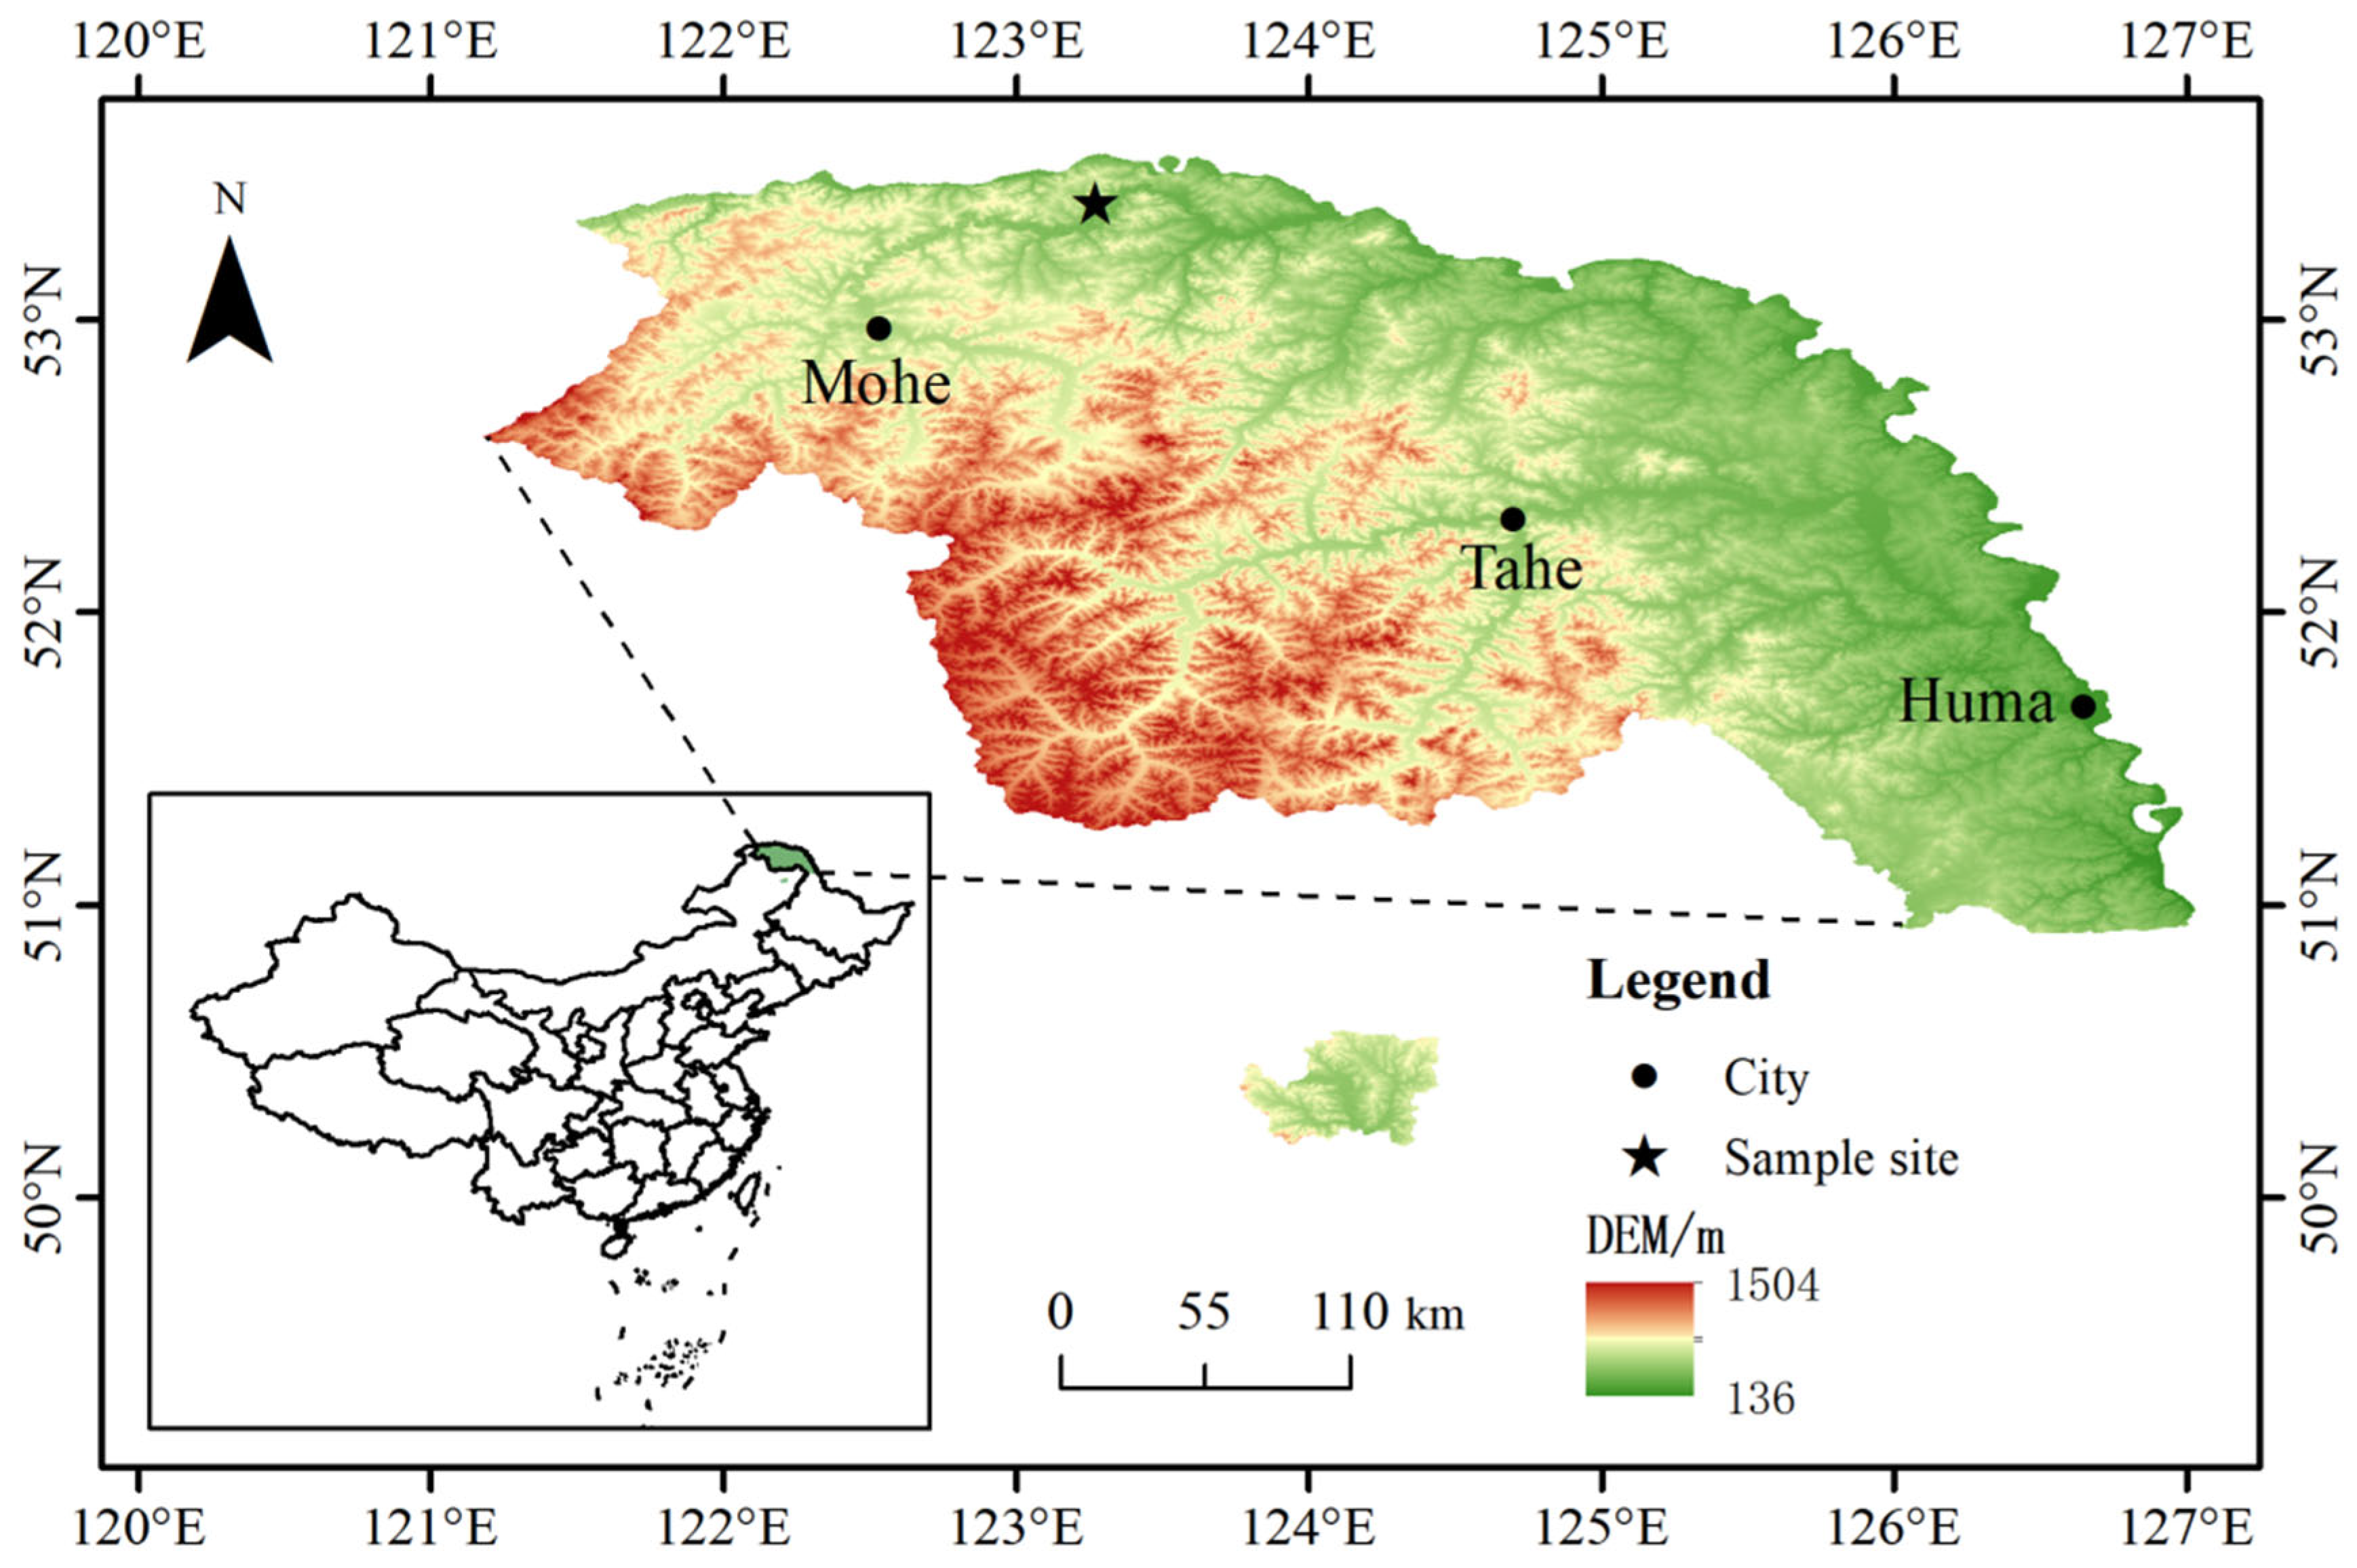
Figure 1. Overview of the northern part of the GKM. The small, independent area in the lower part of the figure is an enclave.
Forests 16 01753 g001
Figure 2. The standard chronology of tree-ring width of Mongolian pine. Tree-ring width index: standardized index obtained by eliminating the growth trend of tree ring width. SSS: subsample signal strength.
Forests 16 01753 g002
Figure 3. Climate characteristics of the study area from 1960 to 2023. (A) The mean monthly temperature and monthly precipitation; (B) The mean annual temperature and total precipitation, the dashed line in (B) represents the trend line. T: mean temperature; Tmax: mean maximum temperature; Tmin: mean minimum temperature; P: precipitation.
Forests 16 01753 g003
Figure 4. Pearson correlations between the standardized chronology and climatic factors. Correlation coefficient: A value closer to 1 indicates a stronger positive correlation between the two variables, while a value closer to −1 denotes a stronger negative correlation. p: Previous year; c: Current year; * p < 0.05; ** p < 0.01. T: mean temperature; Tmax: mean maximum temperature; Tmin: mean minimum temperature; P: precipitation.
Forests 16 01753 g004
Figure 5. Reconstructed minimum temperature sequence. (A) Comparison between the reconstructed and measured minimum temperature sequence during 1960–2023. (B) Reconstructed minimum temperature sequence and 10-year smoothing (FFT filter) during 1860–2023. Tmean: mean temperature.
Forests 16 01753 g005
Figure 6. Results of Mann–Kendall tests for the reconstructed sequence. UF: forward statistic; UB: backward statistic; α: significance level.
Forests 16 01753 g006
Figure 7. Distribution of cold and warm periods (A) and changes in minimum temperature in the reconstructed sequence (B) Tmean: mean temperature.
Forests 16 01753 g007
Figure 8. Multi-window spectral analysis of the reconstructed minimum temperature sequence. The dashed line denotes the confidence interval for periodicity.
Forests 16 01753 g008
Figure 9. Wavelet analysis of the reconstructed minimum temperature sequence. Solid line: Temperature increases; Dashed line: Temperature decreases.
Forests 16 01753 g009
Figure 10. Spatial correlation between the reconstructed minimum temperature sequence and the grid data. The box in the figure represents the study area.
Forests 16 01753 g010
Figure 11. Regional comparisons of the reconstructed minimum temperature sequence. (A) Reconstructed sequence in this study; (B) reconstructed sequence in the Mangui area. Discontinuous line: The average temperature value.
Forests 16 01753 g011
Figure 12. Spatial correlations between the reconstructed sequence and sea surface temperatures.
Forests 16 01753 g012
Table 1. Statistical analysis of the main characteristic values in the standardized chronology.
Chronology CharacteristicStatisticsChronology CharacteristicStatistics
Number of trees/cores22/46First-order autocorrelation0.814
Mean sensitivity0.118Between-tree correlation0.466
Standard deviation0.207Signal-to-noise ratio29.653
First year of subsample signal strength > 0.851860Expressed population signal0.967
Table 2. The leave-one-out test results of the minimum temperature reconstruction equation.
PeriodrR2R2adjFRESTt
1960–20230.599 **35.9%34.8%34.6940.59513/51 **5.890
R: correlation coefficient; R2: explained variance; R2adj: adjusted variance explained; F: significance of the regression mode; RE: reduction in error; ST: sign test; t: product mean test; **: p < 0.01.
Table 3. Years during which abrupt changes occurred in the reconstructed minimum temperature sequence.
Sequence Number Average Period Length/aAbrupt Change Year
5101520
118821881–1882188218821882
219301932193219321932
319531953195319531953
419711971197119701971
519971999199719971997
Table 4. Statistical characteristics of the reconstructed minimum temperature sequence.
Extreme Warm YearExtreme Cold Year
YearReconstruction Value/°CYearReconstruction Value/°CYearReconstruction Value/°C
18937.0720167.1118755.43
18947.2620177.2518765.23
19047.1720187.5619815.61
19267.0520197.1019865.49
20137.5420227.2719875.38
20147.2320237.6019885.47
20157.40
Disclaimer/Publisher’s Note: The statements, opinions and data contained in all publications are solely those of the individual author(s) and contributor(s) and not of MDPI and/or the editor(s). MDPI and/or the editor(s) disclaim responsibility for any injury to people or property resulting from any ideas, methods, instructions or products referred to in the content.